the effect of ultrasound on nafion® polymer in proton...
TRANSCRIPT

1
The Effect of Ultrasound on Nafion®
Polymer in Proton Exchange Membrane Fuel cells (PEMFCs)
Haroon Momand
A Thesis submitted to The University of Birmingham for the degree of
Master of Research (MRes)
The Centre for Hydrogen and Fuel Cell Research PEM Fuel Cell Research group
School of Chemical Engineering College of Engineering & Physical Sciences
The University of Birmingham

University of Birmingham Research Archive
e-theses repository This unpublished thesis/dissertation is copyright of the author and/or third parties. The intellectual property rights of the author or third parties in respect of this work are as defined by The Copyright Designs and Patents Act 1988 or as modified by any successor legislation. Any use made of information contained in this thesis/dissertation must be in accordance with that legislation and must be properly acknowledged. Further distribution or reproduction in any format is prohibited without the permission of the copyright holder.

2
Abstract
The global energy demands are increasing year on year whilst at the same time the proven
energy resources are dwindling. Fears over climate change and the rising fuel prices are
pushing the industries to look for alternative fuels. Energy from alternative sources is
increasingly being promoted as clean, reliable and potentially cheaper source of energy.
The need to understand degradation mechanisms in fuel cells has motivated many efforts to
develop and apply advanced high-resolution techniques to characterize multi-scale transport
and morphology, and to quantify the state of various chemical species and components
before, during and after fuel cell operation. The aim of this study is to investigate whether
there is a limiting parameter (time, frequency, power) in ultrasonic treatment that ensures
Nafion®’s functionality in the PEMFC, the motivation for this work has arisen due to the
wide scale use of Ultrasound in the fabrication of Catalysts inks and other fuel cells materials.
The results and findings are listed and discussed in this thesis.
According to the results of this study it was found that ultrasound degrades the Nafion®
polymer. The most extensive degradation was observed at the lowest frequency when the
input power was above the cavitation threshold of 0.32 W. It was observed that above
11.28W, there was an increase in the number of bubbles produced this can be attributed to the
decrease in the degradation rate. A possible explanation could be that it led to a decrease in
ultrasonic efficiency through the solution thereby reducing the cavitation effect.
Sonication of Nafion® solutions over various periods of times revealed a steady decrease in
viscosity however, at a minimum irradiation time and a fixed ultrasonic frequency an increase
in the viscosity of Nafion® polymer was observed. This was attributed to the fact that
scission of polymer bonds caused by ultrasound (i.e depolymerisation) supplies new chain
carriers for polymerisation. Under carefully chosen conditions, it was possible to initiate
polymerization reactions using ultrasound. 30 minutes ultrasound at 1.86 W using ultrasonic
probe.
Various analytical methods were used such as Rheology to measure viscosity, Differential
Scanning Calorimetry (DSC) and Spectroscopic methods (NMR and GC MS) to elucidate
any changes in Nafion® structure, chemical and physical properties following ultrasound
irradiation.

3
From DSC measurements it was found that sonicating Nafion® at various time periods at a
specific ultrasound frequency resulted in an increase in the glass transition temperature (Tg)
by 8oC. For example after 30 minutes sonication using ultrasound probe at 1.86 W. DSC
analysis also revealed that there were no changes in Tg of Nafion® below, 10 minutes
sonication using ultrasound probe at power of 3.84 W. For example the Tg was 148oC
analogous to the literature Tg for Nafion®. It was established that the samples which showed
sudden increase in viscosity also showed an increase in glass transition temperature due to
improved morphology in the Nafion® structure. Therefore it was concluded that there is a
link between ultrasound irradiation frequency at specific time intervals and the glass
transition temperature.
The effect of high shear mixing showed very little degradation of Nafion® compared to
ultrasound, and DSC results of high shear mixing showed no changes in Tg values.
In addition GC/MS was used to characterize any possible degradation mechanisms and to
observe any changes in the structure of Nafion® before and after sonication, however the
results were inconclusive.

4
Acknowledgements
I would like to begin by thanking Professor Bruno Pollet for encouraging me throughout the
course. I am extremely grateful for having Bruno as my advisor. The amount of lab space
which I was permitted to use is also gratefully acknowledged.
Bruno functioned as my main advisor and it was under his guidance that I carried out my
research. Bruno was an absolutely outstanding advisor. He very kindly gave of his time
during important meetings and was very tolerant in explaining concepts that were new to me.
I am grateful for the freedom Bruno allowed me as I spent month long stretches doing
experiments and, giving him updates. Furthermore, Bruno was quick in responding to my
emails and proof-reading my work. Next, I would like to acknowledge and thank all the
members of the Fuel cell group who welcomed my presence in the lab, and patiently
explained various aspects. Fuel cell members during my tenure here include Dr Shangfeng
Du, Oliver Curnick, Dr Aman Dhir, Jonathan Goh, Cheng Peng and James Courtney.
Jonathan has been a great labmate—being excellent at coming out with good ideas,
insightful, fun, and offering significant advice when needed. Cheng Peng worked on related
project and he was very generous about sharing ideas, time, supplies, journal, articles, etc.
and was useful to work with. I am also extremely thankful to Professor Robert Steinberg and
Dr Bushra-Al-Duri for their help.
Thanks to James Bowen of the chemical Engineering lab for teaching me how to use
Rhemoeter. Thanks to Dr Shangfeng Du for teaching me how to operate DSC.
I am forever grateful of the support and love of my family. And most importantly I am
extremely grateful to God for everything.

5
LIST OF FIGURES
Figure 1 Showing crude oil production and demand (BP 2011) ----------------------------------------------- 14
Figure 2 showing annual mean CO2 concentration from the Mauna Lao Observatory ------------------- 15
Figure 3 Schematic Representation of PEM FUEL CELL (Leblanc 2010) ---------------------------------- 16
Figure 4 The various loses and resulting polarisation curves.(Barbir) ---------------------------------------- 19
Figure 5 Cavitation bubble formation at various stages during alternating compression and rarefaction cycles of the ultrasonic wave and asymmetric bubble collapse on a surface leading to (i) high energy with temperature up to 5000 K and pressure of up to 200 atms and (ii) the sonolysis of water caused by the high energy where OH. are hydroxyl radicals, HO2
. are perhydroxyl radicals and H2O2 is hydrogen peroxide. ------------------------------------------------------------------------------------------------------- 25
Figure 6 Reaction mechanism of ultrasound-induced radical polymerization, assuming intrinsic polymerization and avoiding thermal initiation. ------------------------------------------------------------------- 27
Figure 7 The molecular formula of Nafion® ----------------------------------------------------------------------- 29
Figure 8 Chemical structures and solid-state 19FNMRspectra of Nafion® 117. Asterisks indicate spinning side bands. The given spectra are normalized to thedominant peak of the backbone CF2 groups. ----------------------------------------------------------------------------------------------------------------------- 35
Figure 9 Solid-state 19FNMRspectra of Nafion® 117 samples after treatment with 0.1M Fe2+ in 30 v/v% H2O2. The line widths, _½, of the peak at −121 ppm, referring to the backbone CF2 groups, are shown. Exposure times are given to the left of the figure. ------------------------------------------------------- 36
Figure 10 Solid-state 19F NMR spectra of Nafion® 117 samples after 3 h of with different Fe2+ concentrations, as indicated, in 30 v/v% H2O2 solutions. The line widths, _½, of the peak due to the backbone CF2 groups are shown. ------------------------------------------------------------------------------------- 37
Figure 11 . Solid-state 19F NMR spectra of Nafion® 117 samples after Fenton tests with 0.0002M Fe2+ in 30 v/v% H2O2. Exposure times are given to the left of the figure. --------------------------------- 39
Figure 12 ATR-IR spectra of Nafion® 117 samples after Fenton tests with 0.0002M Fe2+ in 30 v/v% H2O2. ---------------------------------------------------------------------------------------------------------------- 39
Figure 13 Total ion chromatograms obtained with SPME/GC–MS of (a) the reaction mixture at time zero containing 40 µgl-1 of each phthalate (i.e. initial overall phthalates concentration of 240 µgl-1) where (1) -------------------------------------------------------------------------------------------------------------------- 42
Figure 14 Chromatograms of Mowilith® 50 obtained by Py–GC/MS analysis: (a) 300 ◦C;(b) 400 ◦C; (c) 500 ◦C; (d) 600 ◦C; (e) 700 ◦C; mixture: CO, CO2 and H2O; CPT, 1-3- cyclopendadiene. (Wei 2012) ------------------------------------------------------------------------------------------------------------------------- 43
Figure 15 Sonochemical [(a) Sonics 20KHz ultrasonic probe system; (b)Sonomatic 40KHz ultrasonic bath system used for Sonication studies on Nafion® . (Pollet 2010)------------------------------------------ 46
Figure 16 Showing complete setup of AR 2000 Rhemoeter ---------------------------------------------------- 50
Figure 17 Complete Perkin Elmer Pyris 1 Differential Scanning Calorimeter Setup --------------------- 52
Figure 18 Schematic representation of High Shear Mixer ------------------------------------------------------- 54
Figure 19 showing jacketed reactor ----------------------------------------------------------------------------------- 55
Figure 20 Graph showing viscosities () of different concentration Nafion® solutions at no ultrasound and constant temperature of 25oC ------------------------------------------------------------------------------------- 57
Figure 21 Graph showing Tg of Nafion® of control experiment with no ultrasound and no high shear mixer. ------------------------------------------------------------------------------------------------------------------------ 58
Figure 22 Showing The Effect of Temperature On 2.5% Nafion® at 60 Minutes at Various Temperature ---------------------------------------------------------------------------------------------------------------- 60
Figure 23 Graph Showing change in Viscosity for 5% Nafion® At Shear Rates of 5000 rpm --------- 62

6
Figure 24 Graph Showing change in Viscosity () for 5% Nafion® At Shear Rates of 10,000 rpm -- 63
Figure 25 Graph showing No change of Tg for Nafion® 10% In THF 5 Minutes High Shear Mixer (HSM) 5000 rpm ---------------------------------------------------------------------------------------------------------- 64
Figure 26 Graph showing No change of Tg for Nafion® 10% In THF 30 Minutes High Shear Mixer (HSM) 5000 rpm ---------------------------------------------------------------------------------------------------------- 64
Figure 27 Graph showing Decrease in Tg for Nafion® 10% In THF 10 Minutes High Shear Mixer (HSM) 10,000 rpm ------------------------------------------------------------------------------------------------------- 65
Figure 28 Graph Showing Decrease inTg for Nafion® 10% In THF 5 Minutes High Shear Mixer (HSM) 10,000 rpm ------------------------------------------------------------------------------------------------------- 65
Figure 29 Showing effect of ultrasound on Different Nafion® Concentrations at 30 minutes using ultrasound Probe %20amp at 25oC ------------------------------------------------------------------------------------ 67
Figure 30 Showing Change in Viscosity of 5% Nafion® solution Using Ultrasonic bath and Probe Over 120 minutes at 25oC ----------------------------------------------------------------------------------------------- 70
Figure 31 Showing Change in Viscosity () of 2.5% Nafion® Solution Using Ultrasonic Probe at 20%, 40 %, 60% and 80 % AMP Over 120 minutes at 25oC --------------------------------------------------- 71
Figure 32 Showing Change in Viscosity () of 5% Nafion® Solution Using Ultrasonic Probe at 20%, 40 %, 60% and 80 % AMP Over 120 minutes at 25oC ----------------------------------------------------------- 75
Figure 33 Showing Change in Viscosity () of 7.5% Nafion® Solution Using Ultrasonic Probe at 20%, 40 %, 60% and 80 % AMP Over 120 minutes at 25oC --------------------------------------------------- 78
Figure 34 Showing Comparison between Changes in Viscosity () of 10% Nafion® Using Ultrasonic Probe vs Ultrasound Bath Over 120 minutes at 25oC ------------------------------------------------------------- 82
Figure 35 Showing Change in Viscosity () of 10% Nafion® Solution Using Ultrasonic Probe at 20%, 40 %, 60% and 80 % AMP Over 120 minutes at 25oC ----------------------------------------------------------- 83
Figure 36 Graph showing comparison between change in viscosity () for different concentration Nafion® solutions sonicated with 20%AMP ultrasound probe over 120 minutes at 25oC --------------- 85
Figure 37 Showing Difference in Viscosity () of 5% Nafion® Using Ultrasonic Bath Over 120 minutes vs Overnight Sample at 25oC -------------------------------------------------------------------------------- 87
Figure 38 Bar Chart showing comparison between fresh and overnight Nafion® Solution in water and THF -------------------------------------------------------------------------------------------------------------------------- 87
Figure 39 -------------------------------------------------------------------------------------------------------------------- 90
Figure 40 Graph Showing Increase in Tg for 5wt% Nafion® Sonicated for 30min with US Probe 20AMP% Fast Scan ------------------------------------------------------------------------------------------------------ 90
Figure 41 Graph Showing Increase in Tg of Nafion® 5% wt Sonicated for 30min with US Probe 20% Fast Scan 2nd sample ----------------------------------------------------------------------------------------------------- 91
Figure 42 Graph Showing Increase in Tg for Nafion® 5% wt Sonicated for 30min with US Probe 20%AMP Fast Scan 3rd sample ---------------------------------------------------------------------------------------- 91
Figure 43 Graph Showing Increase in Tg for Nafion® 5% wt sonicated for 60min using US Probe 40 AMP% Fast Scan sample 1 --------------------------------------------------------------------------------------------- 92
Figure 44 Graph showing Increase in Tg for Nafion® 5% wt Sonicated for 60min using US Probe 40%AMP Slow Scan sample 2 ---------------------------------------------------------------------------------------- 92
Figure 45 Graph Showing Increase in Tg for Nafion® 5% wt Sonicated for 60min using US Probe 40%AMP Slow Scan sample 3 ---------------------------------------------------------------------------------------- 93
Figure 46 Graph Showing no change in Tg for Nafion® 10% in THF Sonicated for 20 Min with Us Probe 40%AMP ----------------------------------------------------------------------------------------------------------- 93
Figure 47 Graph showing no change in Tg for Nafion® 10% in THF Sonicated for 20 Min with Us Probe 40%AMP 20hr Dry ---------------------------------------------------------------------------------------------- 94

7
Figure 48 Graph Showing No change in Tg for Nafion® 10% in THF Sonicated for 10 Min Using US Bath 18hr Dry -------------------------------------------------------------------------------------------------------------- 94
Figure 49 Graph Showing No change in Tg for Nafion® 10% in THF Sonicated for 10 Min Using Us Probe 40%AMP ----------------------------------------------------------------------------------------------------------- 95
Figure 50 Graph Showing Decrease in Tg for 10% Nafion® in THF Sonicated for 120 Min Using Us Probe 20% AMP ---------------------------------------------------------------------------------------------------------- 95
Figure 51 Graph Showing Decrease in Tg for 10% Nafion® in THF Sonicated for 60 Min Using Us Probe 20% AMP ---------------------------------------------------------------------------------------------------------- 96
Figure 52 graph of ln A vs Sonication time For 2.5% Nafion® Solution ---------------------------------- 106
Figure 53 Graph showing the relationship between the calculated Rate constant and Reverse Concentration ------------------------------------------------------------------------------------------------------------ 107
LIST OF TABLES:
Table 1 Showing the parameters and variables used during the experiments ...................................... 48
Table 2 Showing the viscosity of different Nafion® solution’s under controlled conditions .............. 57
Table 3 Showing The Effect of Temperature On 2.5% Nafion® at 60 Minutes at various temperatures ............................................................................................................................................................ 60
Table 4 The effect of high shear mixer on 5% Nafion® At Shear Rates of 5000 rpm ........................ 61
Table 5 The effect of high shear mixer on 5% Nafion® At Shear Rates of 10,000 rpm ..................... 62
Table 6 Showing effect of ultrasound on Different Nafion® Concentrations at 30 minutes using ultrasound Probe %20AMP at 25oC .................................................................................................... 67
Table 7 Showing change in viscosity for 5% Nafion® solution using ultrasonic bath and Probe over 120 minutes at 25oC ............................................................................................................................ 69
Table 8 Showing Change in Viscosity () of 2.5% Nafion® Solution Using Ultrasonic Probe at 20%, 40 %, 60% and 80 % AMP Over 120 minutes at 25oC ....................................................................... 71
Table 9 Showing Change in Viscosity () of 5% Nafion® Solution Using Ultrasonic Probe at 20%, 40 %, 60% and 80 % AMP Over 120 minutes at 25oC ............................................................................ 75
Table 10 Showing Change in Viscosity () of 7.5% Nafion® Solution Using Ultrasonic Probe at 20%, 40 %, 60% and 80 % AMP Over 120 minutes at 25oC ....................................................................... 78
Table 11 Showing Comparison between Changes in Viscosity () of 10% Nafion® Using Ultrasonic Probe vs Ultrasound Bath Over 120 minutes at 25oC .......................................................................... 82
Table 12 Showing Change in Viscosity () of 10% Nafion® Solution Using Ultrasonic Probe at 20%, 40 %, 60% and 80 % AMP Over 120 minutes at 25oC ....................................................................... 83
Table 13 Showing variations in Viscosity () of 5% Nafion® Using Ultrasonic Bath Over 120 minutes vs Overnight Sample at 25oC ................................................................................................. 86
Table 14 Table showing increase and decrease in Tg for different Nafion® samples at different experimental condition ....................................................................................................................... 97
Table 15 showing the calculated rate constants for Nafion® at various concentrations .................... 106
Table 16 Showing reverse concentratin vs K values ......................................................................... 106

8
Table of Contents 1. CHAPTER 1 ............................................................................................................................... 12
1.1. Motivation for this work ..................................................................................................... 12
1.2. Introduction ......................................................................................................................... 13
1.3. Theory ................................................................................................................................. 17
1.4. Membrane Electrode Assembly (MEA) .............................................................................. 20
1.5. Function Of The Nafion® Membrane In MEA ................................................................... 20
2. CHAPTER 2 ULTRASOUND AND SONOCHEMISTRY ........................................................ 22
2.1. What Is Ultrasound ............................................................................................................. 22
2.2. Sonochemistry and Applications ......................................................................................... 22
Applications .................................................................................................................................... 23
2.3. Effect of Sonication on Polymers ........................................................................................ 24
2.4. Sonochemical Degradation of Nafion® .............................................................................. 24
2.5. Polymerization Due To Ultrasound Induced Cavitation ...................................................... 26
2.6. Degradation Mechanism of Nafion® .................................................................................. 28
2.7. Sonochemical Degradation of Polymers Quantified by GC/MS ......................................... 41
2.8. Degardation of Polymers Quantified by GC/MS ................................................................. 43
3. CHAPTER 3 EXPERIMENTAL METHODS AND MATERIALS ........................................... 45
3.1. Experimental Plan ............................................................................................................... 45
3.2. Experimental Setup ............................................................................................................. 46
3.3. Experimental Procedures..................................................................................................... 46
3.3.1. Ultrasound bath 40kHz ................................................................................................ 46
3.3.2. Ultrasound probe 20kHz ............................................................................................. 47
3.4. Experimental Apparatus ...................................................................................................... 47
3.5. Materials List ...................................................................................................................... 47
3.6. Nafion® Sample Preparation .............................................................................................. 48
3.7. Experimental Parameters and Variables .............................................................................. 48
3.8. Power Measurements .......................................................................................................... 48
3.9. Depth of the Horn ............................................................................................................... 49
3.10. Equipment setup ............................................................................................................. 49
A. Ultrasonic bath .................................................................................................................... 49
B. Ultrasonic Probe.................................................................................................................. 49
C. Rheometer .............................................................................................................................. 50
D. Sample Preparation for DSC Analysis ................................................................................ 51

9
E. Differential Scanning Calorimetry Apparatus ..................................................................... 51
F. GC/MS Analysis ................................................................................................................. 53
Gas chromatography (GC) .............................................................................................................. 53
Mass Spectrometer (MS) ................................................................................................................ 53
Computer ........................................................................................................................................ 54
G. High shear mixer ................................................................................................................. 54
3.11. Temperature Control ....................................................................................................... 55
3.12. Volume Used .................................................................................................................. 55
4. CHAPTER 4 RESULTS AND DISCUSSION ........................................................................... 56
4.1. Silent Conditions ................................................................................................................. 56
4.1.1. The Effect of Ultrasound on Nafion® At Various temperatures ..................................... 56
4.1.2. Effect of Nafion® Concentration .................................................................................... 57
4.1.3. The Effect of Temperature on Nafion®............................................................................ 58
4.1.4. Effect of High Shear Mixing on Nafion® in the Absence of Ultrasound ........................... 61
4.1.5. DSC measurement Of High Shear mixed Nafion samples .............................................. 63
4.2. Ultrasonic Conditions .......................................................................................................... 66
4.2.1. Effect of Nafion® Concentration...................................................................................... 66
4.2.2. 5% Nafion® Solutions Sonicated at 0.32 W (Bath) ........................................................ 68
4.2.3. 2.5 Nafion® Solution Sonicated at Different Powers With US (Probe) .......................... 71
4.2.4. 5% Nafion® Solution Sonicated at Different Powers With US (Probe) .......................... 75
4.2.5. 7.5% Nafion® Solution Sonicated at Different Powers With US (Probe) ....................... 78
4.2.6. 10% Nafion® Solutions Comparison between Bath and Probe ........................................ 81
4.2.7. 10% Nafion® Solution Sonicated at Different Powers With US (Probe) ........................ 83
4.2.8. Viscosity Variations between Overnight and Fresh samples ........................................... 85
4.2.9. DSC ANALYSIS .................................................................................................................. 88
Differential Scanning Calorimetry (fig 39 to fig 45 shows increase in Tg) ..................................... 90
Nafion® 10% in THF 20 Min Us Probe 40% (Fig 46 to Fig 49 no change in Tg) .......................... 93
Nafion® 10% in THF 60 And 120 Min Us Probe 20% (Fig 50 to Fig 51 Decrease in Tg) ............. 95
4.2.10. Summary of the 4 different Nafion® concentrations at 4 different powers ..................... 96
4.2.11. Advantage of Increase in Tg of Nafion® .......................................................................... 98
4.2.12. GC/MS Analysis of Sonicated Samples ............................................................................ 99
5. CHAPTER 5 KINETICS .......................................................................................................... 101
5.1. Kinetics of Degradation .................................................................................................... 101
5.2. Calculation of Rate Constants for Different Ultrasound Powers ....................................... 102

10
5.3. Viscosity and Molecular Weight Relationship ................................................................... 104
5.4. Sample Calculation of Rate Constant ................................................................................ 105
6. CHAPTER 6 FURTHER WORK ..................................................................................................... 108
6.1. MEA Preparation for Ultrasound Effects ........................................................................... 108
6.2. Testing Of MEA with Nafion® Incorporated Membrane .................................................. 109
6.3. Structural Changes following Ultrasonic Treatment of Nafion® ........................................ 109
6.4. Determination of Mechanical properties After Sonication ................................................ 110
6.5. Additional Work ................................................................................................................ 110
7. CHAPTER 7 CONCLUSION ................................................................................................... 111
7.1. Conclusions ....................................................................................................................... 111
References ........................................................................................................................................ 113

11
Nomenclature and Abbreviations
MEA – Membrane Electrode Assembly
GDE – Gas Diffusion Electrode
ORR – Oxygen Reduction Reaction
PAFC – Phosphoric Acid Fuel Cell
PEM – Proton Exchange Membrane PEMFC – Proton Exchange Membrane Fuel Cell SOFC – Solid Oxide Fuel cell
PA – Acoustic Pressure (kPa)
PM – Amplitude (Pa)
– Frequency kHz
P – Pressure (Pa)
VR – wall velocity (ms-1)
Rm – maximum bubble radius (μm)
Ph – External Pressure (kpa)
R – Instantaneous radius (μm)
M – Total Molar Concentration (mol/m3)
k – Rate constant (min -1)
M0 – initial total molar concentration (mol/m3)
Mn – number average molecular weight (g/mol)
Mv – average viscometric molecular weight (g/mol)
η – Intrinsic viscosity (pa.s)
Mt – average molecular weight at irradiation time (g/mol)
E – Electrode potential (V)
E rev – Reversible Potential (V)
b – Tafael slope (V dec.-1)
i – Current density (A.m-2)
io – exchange current density (A.m-2)
n – Number of electrons transferred in the redox reaction

12
1. CHAPTER 1
1.1. Motivation for this work
The motivation for this work has arisen due to the wide scale use of Ultrasound in the
fabrication of Catalysts inks and other fuel cells materials. It is shown that the sonochemical
production of carbon supported mono- and bi-metallic catalysts gives excellent
electrochemical activity due to surface functionalization of the support and better dispersion
induced by ultrasound. These observations are mainly due to enhanced mass-transfer caused
by asymmetrical collapse of cavitation bubbles at the surface support leading to the formation
of high velocity jets of liquid being directed toward its surface. This jetting, together with
acoustic streaming, is thought to lead to random punctuation and disruption of the mass
transfer at the surface. The search for new polymers with better properties is of great research
interest, the polymer industry requires constant advances in existing materials. Due to this
large efforts are carried out for modifying existing polymers. i.e, the interaction of an object
with its environment is significantly determined by its surface properties. The capability to
alter the surface properties of a low-cost commodity polymer is therefore of great importance
for economical aspect. Similarly, improvement in the properties of a bulk polymer by
incorporating little amounts of other compounds is an economical way of producing
extremely functional materials. Additionally, the material properties shown by a particular
polymer depend seriously on its molecular weight and chain structure so these must be
accurately controlled. Sonochemistry has a part to play in each of these areas. The effect of
ultrasound on other polymers has shown some interesting results such as increase in the glass
transition temperature which will increases the durability of the Nafion polymer. Ultrasound
has been used as method to control the polymerization rate and hence the properties of the
resulting polymer. Consequently the effect of ultrasound was investigated to see if there is a
limiting parameter in ultrasonic treatment (time, frequency, power) that ensures Nafion®
functionality in the PEMFC.(Pollet 2010)

13
1.2. Introduction
There is no doubt that the world economies are inextricably linked to energy usage. Since the
1980’s; for every 1% growth in GDP in any region, there has been 0.3% increase in primary
oil demand. Most of the Western economies have already developed and have reached a
stable phase, whereas economically poorer countries such as China and India for example,
are now growing at an alarming rate. The problem they are faced with is resource scarcity.
China and India have two of the largest populations on the planet and as the number of
middle class people in those countries increase, they will require more luxury and hence their
energy usage will increase. This problem is not unique to developing countries as populations
in the Western world also demand an increase in living standards which, in the current
paradigm, come with increasing energy usage.(BP 2011)
Transportation is the lifeblood of the world economy. Each day, millions of goods are
delivered from one place to another whether by road, air or sea – consuming vast amounts of
energy in the process. This energy mainly comes from crude oil derivatives such as
petroleum, diesel and kerosene. Whilst crude oil is abundant, the world economy can
continue to expand as more and more transactions are able to be performed but once crude oil
gets scarce, the prices rise, leading to a price increase in derivatives and straining the global
transportation system. Evidence is now emerging that shows that conventional crude oil is
beginning to plateau, whilst the demand continues to rise.

14
Figure 1 Showing crude oil production and demand (BP 2011)
According to the BP statistical review 2011, the gap between supply and demand is being
offset by biofuels, coal to liquids, Liquefied Natural Gas and unconventional sources such as
oil from tar sands and ‘tight oil’ from shale fields. BP also claims that the world has 46.2
years of crude oil supply left assuming that the current consumption rates remain as they are
and no new oil fields are found. (BP 2011)
Apart from crude oil depletion, another major concern is climate change. The continuous
burning of fossil fuels has released vast amounts of greenhouse gases such as CO2 into the
atmosphere and these gases absorb infrared radiation, which would normally radiate out into
space. The heat energy thus remains on Earth thus heating up the planet. The concentration of
CO2 has steadily increased since records first began in 1959 as shown by Figure 2. The
concentration has increased from 315.97 to 391.57 ppm in 2011, making it the highest
concentration of CO2 in the atmosphere in the last 420’000 years.(J. R. Petit 1999)
70
75
80
85
90
1990 2000 2010 2020
Mill
ion
bar
rels
/day
Year
Crude Oil Production and Consumption Data
Production Consumption

15
Figure 2 showing annual mean CO2 concentration from the Mauna Lao Observatory
The biggest challenge, by far, is how to adapt to a ‘post oil’ world. A post oil world would
consist of a world that is not fuelled by fossil fuels but rather by technologies that can be
sustained for a long period of time and ones which would cause minimal damage to the
environment. Hydrogen is one such alternative as it meets all the criteria – it is abundant so
there is no problem of scarcity and it produces water via the reaction below meaning that no
polluting substances are formed. To use Hydrogen for transportation purposes, the most
efficient method is via a fuel cell – in particular, a Proton Exchange Membrane Fuel Cell or
PEMFC.
H2 + ½ O2 H2O -286 kJ/mol (1)
300
310
320
330
340
350
360
370
380
390
400
1950 1960 1970 1980 1990 2000 2010 2020
CO
2 C
on
cen
trat
ion
(p
pm
)
Year
Annual Mean CO2 Concentration
16
Currently PEM fuel cells show a lot of promise but they have issues such as durability and
the costs are high which present barriers to the commercialization. Although the on-going
research in fabrication methods have shown promising future for the commercialization of
PEM fuel cells.
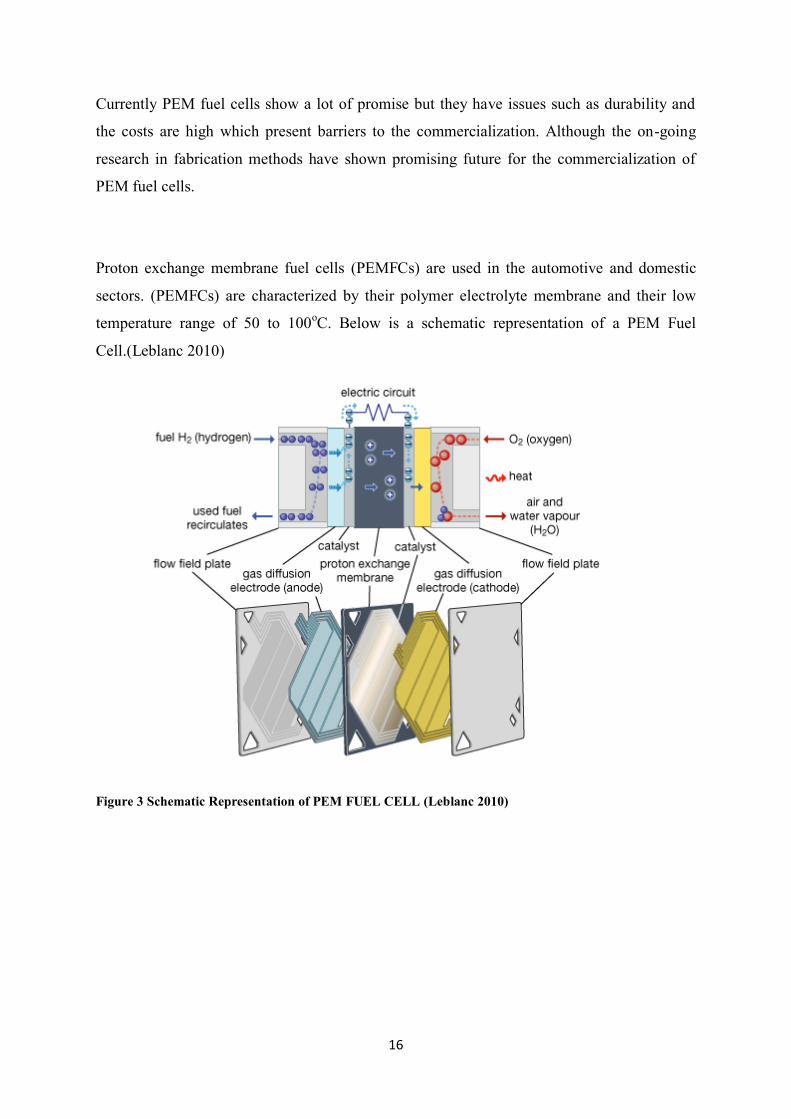
Proton exchange membrane fuel cells (PEMFCs) are used in the automotive and domestic
sectors. (PEMFCs) are characterized by their polymer electrolyte membrane and their low
temperature range of 50 to 100oC. Below is a schematic representation of a PEM Fuel
Cell.(Leblanc 2010)
Figure 3 Schematic Representation of PEM FUEL CELL (Leblanc 2010)

17
1.3. Theory
Hydrogen is oxidized at the anode side of the electrode to give 2 protons and 2 electrons as
shown by the reaction below:
(2)
The electrolyte is specially designed to allow the passage of ions but not electrons and
therefore the free electrons from the reaction have to flow through a wire producing the
electrical current, while the ions formed travel through the electrolyte. At the cathode the two
free species react with oxygen to produce water and that is why this is considered as a clean
energy. The following reaction shows what happens:
(3)
Thus the overall reaction is as follows:
(4) [10]
Using the Gibbs free energy equation (Eq 5), the theoretical efficiency for the conversion of
chemical energy into electrical energy can be found.
∆G = ∆H - T∆S ...(5)
where:
G = Gibbs Function in kJ/mol
∆H = Free Energy of Formation W/m2K
T = Absolute Temperature K

18
∆S = Entropy kJ/K
Gibbs Function = 237.340 kJ/mol
The theoretical potential of a fuel cell can then be calculated:
(6)
Where: n = number of electrons involved in the reaction
F = Faraday’s constant, 96485 C/mol
= 1.23 V
At 25oC and 1atm, the theoretical potential of a PEM FC is 1.23V
The maximum theoretical efficiency of the fuel cell can be calculated using the following
equation:
(7)
∆H = Higher Heating Value of Hydrogen = 286.02 kJ/mol 1
At 25oC and atmospheric pressure of 101.325 Kpa.

19
The actual potential from a fuel cell is always smaller than the theoretical one due to the
irreversible loses that occur. The main causes for the loss of potential are listed below and
their effect can be seen in Figure 4.
Activation loses
Internal electrical and ionic resistance
Mass transportation limitations
Internal (stray) currents
Crossover of reactants
Figure 4 The various loses and resulting polarisation curves.(Barbir)
PEM fuel cells require a complex management system in order to work properly. For this
reason, other components are added to the basic components in order to make sure the fuel
cell operates continuously. A complete PEM Fuel Cell contains the following components
outlined below in detail:

20
1.4. Membrane Electrode Assembly (MEA)
The membrane electrode assembly (MEA) is a multiple layer structure composed of 5 layers
as shown in Figure 1. The inner structure consists of a membrane with both the sides covered
by a catalyst layer and this layer is known as a catalyst-coated membrane, the membrane is
Nafion® perfluorosulfonic acid, and the membrane thickness ranges from 25 to 50
micrometers. The catalyst-coated membrane (CCM) is essentially a thin film sandwich that
requires thin film manufacturing treating such as roll-to-roll processing and deposition such
as ink jet printing. The catalyst layers next to each face of the membrane are platinum braced
on carbon (~50 wt %) with loading equaling to or less than 0.4 mg Pt/cm-2, the thickness of
the catalyst layer can be as high as 25 micrometers but is typically thinner. The outer two
layers of 5-layered assembly are known as the gas diffusion layers (GDLs), both are next to
the catalyst layer. The GDLs are significantly thicker porous carbon layers with thickness of
around 300 micrometers per layer. Woven carbon/graphite cloths and carbon felts are the
technologies used for manufacturing GDLs. The carbon felts are made using paper
processing. For many fuel cells according to their needs, the GDL is chemically treated in
order to control its hydrophobic/hydrophilic properties. Thin film processes like vapor and
physical deposition are used to apply the hydrophobic/hydrophilic properties. (Leblanc 2010)
1.5. Function Of The Nafion® Membrane In MEA
Nafion® was developed in the 1960s by DuPont. To this day Nafion® is one of the most
extensively studied and commercially available proton conducting material. The Nafion®
membrane is an expensive component of the PEMFC; the proton exchange membrane is the
heart of the PEM system. It conducts protons but not electrons and separates reactants; the
Nafion® membrane is an ionically conductive polymer. Due to their high electrochemical
stability, low permeability to reactant species, high ionic conductivity and ability to provide
electronic insulation Nafion® finds many uses in the industry. Many attempts have been
made in order to replace Nafion® due to the cost issues however it is still the most preferred
polymer electrolyte for fuel cell operation. Nafion® membrane consists of
polytetrafluoroethylene (PTFE) backbone and side chains with acidic functionality. The
synthesis of Nafion® is based on the copolymerization of tetrafluoroethylene (TFE) and a

21
functional fluorinated monomer (vinyl ether). The sulphonic acid group functionality is
introduced through the functional sulphonyl fluoride groups (SO2F). The length of the side
chain, the composition of the polymer backbone and the processing of a film determine the
final properties of the polymer electrolyte membrane. The perfluorinated backbone provides
chemical and mechanical stability, the ether groups provides flexibility, while the sulphonic
acid groups yields high ionic conductivity. The acid groups are fixed to the polymer and
cannot leach out, while the counterions (H+) are free to migrate and can be readily exchanged
with other ions. (Leblanc 2010)
22
2. CHAPTER 2 ULTRASOUND AND SONOCHEMISTRY
2.1. What Is Ultrasound
Ultrasound is defined as a sound wave with a frequency above 16 kHz with the upper limit
usually taken to be 5 MHz for gases and 500 MHz for liquids and solids. The application of
ultrasound in physical and biological sciences can be divided into two main groups: (i) low
frequency or power ultrasound (20-100 kHz) and (ii) high frequency or diagnostic ultrasound
(2-10 MHz).
2.2. Sonochemistry and Applications
The past few years has seen an increase in the use of power ultrasound, Ultrasound has found
widespread applications in the chemical and processing industries where it is used to enhance
both synthetic and catalytic processes and to generate new products. This area of research has
been named sonochemistry, which mainly concerns reactions involving a liquid leading to an
increase in reaction rates, product yields and erosion of surfaces. These effects are due to
phenomenon known as cavitation. Cavitation is the formation of little bubbles when a very
low pressure is applied to a solution. When a liquid is sonicated the distance between
rarefaction area which is region of low pressure and low amplitude can surpass the critical
molecular distance and produce the breakdown of the liquid and formation of tiny bubbles.
These bubbles continue to grow until they reach a stable size during each cycle. The bubbles
finally collapse violently and generate energy for chemical and mechanical effects. The
cavitation bubbles are considered to be high energy micro reactors. During collapsing,
temperatures can reach upto 5000oC and 200 atm.
Bubble formation is a three-step process consisting of nucleation; bubble growth and collapse
of gas vapour filled bubbles in a liquid phase. Cavitation phenomenon is known to cause
erosion, emulsification, molecular degradation, sonoluminescence and sonochemical
enhancements of reactivity solely attributed to the collapse of cavitation bubbles. (Pollet
2010)
23
Applications
Ultrasound is used in sonography- looking at human babies in the mother’s womb.
Ultrasound is used to work out the baby’s age, determine its location, find the location
of the placenta, determine the sex of the baby, check for heartbeat, and look for any
abnormalities.
In industry, ultrasound is used to determine the thickness of objects such as metals
and plastic.
Ultrasonic waves are used to weld plastics together. The waves make heat energy
between the objects that are joined.
Power ultrasound is regarded as the effect of the sound wave on the medium and has been
used in ultrasonic cleaning, drilling, soldering, chemical processes and emulsification.
The past few years has seen power ultrasound find widespread applications in the chemical
and processing industries. For the last 20 years, there have been reports on the use of
ultrasound for fabricating noble metals and catalysts, preparing fuel cell materials or
enhancing mass transport of electro active species from the bulk solution to the fuel cell
electrode surface. This review highlights the main uses of ultrasound in Fuel Cell
technologies.
In addition one of the beneficial applications of ultrasound is for the polymer degradation.
Sonochemical degradation of polymers has proved to be an attractive process because there
are no changes in the chemical nature of the polymer and the reduction in molecular weight
(also the intrinsic viscosity) is simply by splitting the most susceptible chemical bonds.
Application of ultrasonic energy for polymer degradation dates back to the 1930s when
natural polymers were subjected to sonication, which resulted in a reduction in viscosity.
Ultrasound has been used for degradation of a range of polymers. The ultrasonic degradation
of polymers is of great interest and is also the focus of this thesis. The degradation can be
used in polymer processing and therefore it is desired. Its main use is as an alternative
method for controlling the rate of polymerization and thus determines the properties of the
resulting polymer. It can also be used in reducing the high molecular weight of the polymer.

24
2.3. Effect of Sonication on Polymers
Ultrasound has been regarded as a very advantageous method for depolymerising
macromolecules because it reduces their molecular weight simply by splitting the most
vulnerable chemical bonds without causing any changes in the chemical nature of the
polymer. The effects involved in controlling molecular weight are mainly attributed to the
large shear gradients and shock waves generated around collapsing cavitation bubbles (see
later). Shear forces generated by the rapid motion of the solvent following cavitational
collapse result in the breakage of the chemical bonds within the polymer. Long-time exposure
of solutions of macromolecules to high-energy ultrasonic waves produces a permanent
reduction in viscosity. Even when the irradiated polymers are isolated and re-dissolved their
viscosity remains low in comparison with that of non-irradiated solutions. Majority of the
effects in Sonochemistry arise from cavitation (see later), the effects involved in controlling
molecular weight can be attributed to the large shear gradients and shock waves generated
around collapsing cavitation bubbles discussed earlier. Degradation is caused by:
The hydrodynamic forces of cavitation, i.e the shock wave energy released on bubble
implosion.
The shear stresses at the interface of the pulsating bubbles;
The associated thermal and pressure increase within the bubbles themselves.
(Grönroos 2001)
2.4. Sonochemical Degradation of Nafion®
The use of ultrasound in the preparation of fuel cell material is a new emerging field and has
shown potential of promising results in the near futures, sonochemsitry itself is not a new
field itself and has been used for several decades. Sonochemistry is the application of
ultrasound to chemical reactions and processes.(Leblanc 2010)

25
Compression Compression Compression Compression
Ultrasonic wave
Rarefaction Rarefaction Rarefaction Rarefaction
Bubble formation Bubble grows in successive cycles Unstable Bubble Violent Bubble collapse leading
High energy and Sonolysis
H20 H. + OH.
H. + O2 HO2.
HO2. + HO2. H2O2 + O2
OH. + OH. H2O2
Figure 5 Cavitation bubble formation at various stages during alternating compression and rarefaction cycles of the ultrasonic wave and asymmetric bubble collapse on a surface leading to (i) high energy with temperature up to 5000 K and pressure of up to 200 atms and (ii) the sonolysis of water caused by the high energy where OH. are hydroxyl radicals, HO2
. are perhydroxyl radicals and H2O2 is hydrogen peroxide.
Cavitation is a phenomenon where micro bubbles are formed which tend to implode and
collapse violently in the liquid leading to the formation of high velocity jets of liquid.
Cavitation phenomenon is known to cause erosion, emulsification, molecular degradation,

26
sonoluminescence and sonochemical enhancements of reactivity purely attributed to the
collapse of cavitation bubbles, cavitation bubble collapse leads to near adiabatic heating of
the vapour that is inside the bubble, creating the so-called “hot-spot” in the fluid, where High
temperatures (ca. 5000 K) and high pressures (ca. 200 atms) are generated with cooling rates
of 109-10 K s_1 during the collapsing of cavitation bubbles are observed. Water vapour is
‘pyrolyzed’ into hydrogen radicals (H.) and hydroxyl radicals (OH.), known as water
sonolysis. Temperature is lower in the interior of the bubbles than the exterior but high
enough for thermal decomposition of the solutes and greater local hydroxyl radical
concentrations in this region. The reactions of solute molecules with hydrogen atoms and
hydroxyl radicals occur in the bulk solution at ambient temperature. (Pollet 2010)
2.5. Polymerization Due To Ultrasound Induced Cavitation
Generally, free-radical polymerization consists of four elementary steps; initiation,
propagation, chain-transfer and termination.
When ultrasound is used to initiate
polymerization, radicals can be formed both from monomer and from polymer molecules.
This implies that due to radical formation by polymer scission, an additional elementary step
is introduced in ultrasound-induced polymerization as indicated in the mechanism show
below in fig 6:
Initiation M + Cavitation 2 R• (8) Propagation Mn• + M Mn+1 (9)
Chain Transfer
To monomer
Mn• + M Mn + M• (10)

27
To polymer
Mn• + Mm Mn + Mm• (11) Termination By combination Mn• + Mm• Mn+m (12)
By disproportionation Mn• + Mm• Mn + Mm (13)
Polymer Scission Mn + Cavitation Mm• + Mn-m• (14)
Figure 6 Reaction mechanism of ultrasound-induced radical polymerization, assuming intrinsic polymerization and avoiding thermal initiation.

28
2.6. Degradation Mechanism of Nafion®
PEMFC’s degradation mechanisms have been the focus of many experimental and theoretical
studies. Thermal, mechanical, and chemical degradation have all been recognised as
contributors to membrane damage. The degree to which each pays a part in membrane failure
depends on cell operating conditions and membrane composition. Degradation processes are
polymer dependent. Fuel cell membranes have been made of polymers with different
chemical compositions. Nafion® is important among these because of its durability and high
power density. Secondly, it has been studied to a greater extent than other membranes and is
therefore an excellent system to study and simulate membrane degradation. From Research
on the degradation mechanisms of PEMFC’s shows that the main damage to the polymers is
the result of attack by the reactive oxygen species of free radicals such as hydroxyl radicals.
These reactive oxygen species are generated by reduction of H2O2 with iron ions (Fe2+), as
part of the Fenton reaction, H202 is formed on the anode side catalyst by reaction of hydrogen
with oxygen from either cathode side or leaked through the gasket (which is a teflon sealant
that seals the system and it stops the leaks). The hydrogen peroxide decomposes into a
hydroxyl radical in the presence of trace metal contaminants such as iron. The Fe2+ released
from the steel electrode or other metal ion contaminants also react with by products of H2O2
at the anode.
H202 + Fe2+ .OH + Fe3+ + OH (15)
The hydroxyl radical produced attacks the membrane fluorinated end groups according to the following equation:(Fernandes and Ticianelli 2009)
(CF2 – CF2) –COOH + 2(.OH) CO2 + 2HF + CF2 COOH (16)
This unzipping slowly dissociates the proton conducting sulfuric acid side chains of the
polymer, resulting in reduced conductivity and mechanical stability. Hydrogen fluoride is
given off in this reaction and the fluoride emission rate (FER) is one way of measuring
chemical deterioration. The hydroxyl radical mechanism of membrane deterioration has been

29
confirmed in the literature. But, a model that simulates the useful lifetime of a fuel cell
membrane based on hydrogen peroxide and contaminant iron concentrations has not yet been
developed. A basic model could provide important and informative insight into the features
of membrane degradation and allow for the contrast of alternative methods to improve
membrane durability. It has been stated that membrane failure occurs after 10% of the
sulfonic acid cation exchange sites have been lost. From this, the useful lifetime of the
membrane can be predicted. The useful life estimate together with industry standards of life
expectancy were used to conclude the upper limit for the hydrogen peroxide concentration at
a fixed iron concentration.(King 2009)
A review of the available literature on PEMFC’s degradation can be found in literature.
Nafion® perfluorosulfonic acid (PFSA) membrane is a copolymer of Tetraflouroethylene
(TFE) and Vinyl Ether. The molecular formula can be written (C20F39O5S) with a structure
given in Figure 7 below.
[(CF2 – CF2) x (CF2 – CF2) y –
[O –CF2 –CF] m O CF2 –CF2 –SO3H (17)
CF3 (Anna Carlsson 2011) Figure 7 The molecular formula of Nafion®
Hydrogen cation exchange occurs via the pendent sulfonyl groups. The mode of chemical
degradation in the PEMFC’s occurs due to peroxyl and hydroperoxyl free-radical attack. In
fuel cells, H2O2 forms at the platinum catalyst on the anode side via the following
mechanism. (King 2009). (Wu 2008)
02 + 2H+ + 2e H2O2 (18)
The presence of oxygen results from cross-over from the cathode, air bleed on the
Anode side, or cell reversal caused by fuel starvation. The concentration and subsequent
transport of hydrogen peroxide within the membrane is a function of hydration. Dry operation
leads to more H2O2 in the membrane pore space. It has been noted that the presence of H2O2

30
in an working fuel cell using cyclic voltometry and were additionally able to characterize the
H2O2 concentration gradient from high to low at the anode. It was also noted that peroxide
concentration is a function of the membrane thickness. It was seen that a concentration of 23
ppm in a membrane with a thickness of 50 µm (Nafion® -112) after an undisclosed period of
operation. Additional studies report that degradation is proportional to the logarithm of
hydrogen peroxide concentration with approximately 0.3% needed to initiate fluoride ion
release. The H2O decomposes to form radicals in the presence of trace metal impurities.
(King 2009)
H202 + Fe2+ .OH + Fe3+ + OH (19)
These metal ion contaminants come from the surfaces of materials such as: humidifiers,
diffusion media, flow field substrates and water recovery/humidification systems. The
presence of Fe2+ in as-received Nafion® -112 was reported to be 1 ppm using electron probe
microanalysis. Immobilization of Fe2+ ions on Nafion® has also been investigated for use as
a preliminary step in biological wastewater treatment and the photo-Fenton method.
It has been believed that cumulative deterioration of the membrane is caused by trace radicals
attacking the ionomer chain. The generation of hydrogen radical, hydroxyl radical and
degradation products by scission of the ionomer chain is summarized as follows: (Kurniawan
2013)
H2 2H. ) (via Pt catalyst) (20)
H. + O2 (diffused through PEM) HO2.
(21)
HO2. + H. H202 (diffused in PEM) (22)
H202 + M2+ (Metal contaminant) M3+ .OH + OH (23)

31
Hydroxy or peroxy radicals resulting from the decomposition of hydrogen peroxide in the
fuel cell attack the polymer at the end group sites and initiate decomposition.
The reactive end groups can be formed during the polymer manufacturing process and may
be present in the polymer in small quantities. An example of attack on an end group such as
CF2X, where X = COOH, is shown below:
Rf CF2COOH + HO. Rf –CF2. + CO2 + H2O (24)
Rf CF2. + HO. Rf –CF2OH Rf –COF + HF (25)
Rf –COF + H2O Rf COOH + HF (26)
Several proposed mechanisms include the following sequential reactions: abstraction of
hydrogen from an acid end group to give a perfluorocarbon radical, carbon dioxide and water
(step 1). The perfluorocarbon radical can react with hydroxy radical to form an intermediate
that rearranges to an acid fluoride and one equivalent of hydrogen fluoride (step 2).
Hydrolysis of the acid fluoride generates a second equivalent of HF and another acid end
group (step 3). The presence of the degradation product of the above mechanism, with a
structure of , has been observed by mass spectrometry
and F19 NMR spectroscopy. From the degradation mechanism reported, it can be seen that
HF emission from the membrane exhaust water is proportional to membrane deterioration. It
was seen that by re treating the membrane elemental fluoride the concentration of weak end
groups were reduced by 61% with a reduction in fluoride ion generation of 56%. The rate
constants were proposed for two possible mechanisms of Nafion® degradation. The first is
based on an ‘unzipping’ of the backbone polymer chain described by peroxyl radical attack of
the carboxylic acid end groups as shown in the following reaction steps. Once the carboxylic
acid end groups are formed, the degradation proceeds via an unzipping reaction that involves
a series of steps demonstrated below. The attacking species may also involve other radical
species besides the hydroxyl radical. For ease of demonstration, however, we use the
32
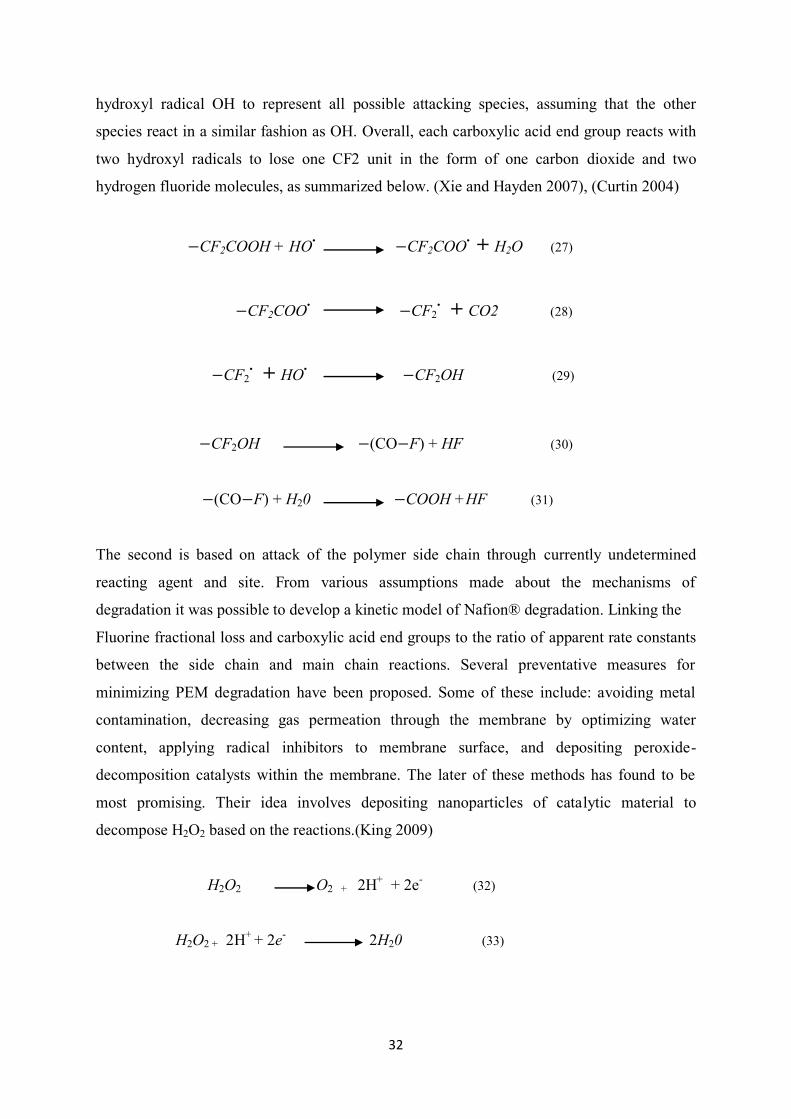
hydroxyl radical OH to represent all possible attacking species, assuming that the other
species react in a similar fashion as OH. Overall, each carboxylic acid end group reacts with
two hydroxyl radicals to lose one CF2 unit in the form of one carbon dioxide and two
hydrogen fluoride molecules, as summarized below. (Xie and Hayden 2007), (Curtin 2004)
CF2COOH + HO. CF2COO. + H2O (27)
CF2COO. CF2. + CO2 (28)
CF2. + HO. CF2OH
(29)
CF2OH (CO F) + HF (30)
(CO F) + H20 COOH +HF (31)
The second is based on attack of the polymer side chain through currently undetermined
reacting agent and site. From various assumptions made about the mechanisms of
degradation it was possible to develop a kinetic model of Nafion® degradation. Linking the
Fluorine fractional loss and carboxylic acid end groups to the ratio of apparent rate constants
between the side chain and main chain reactions. Several preventative measures for
minimizing PEM degradation have been proposed. Some of these include: avoiding metal
contamination, decreasing gas permeation through the membrane by optimizing water
content, applying radical inhibitors to membrane surface, and depositing peroxide-
decomposition catalysts within the membrane. The later of these methods has found to be
most promising. Their idea involves depositing nanoparticles of catalytic material to
decompose H2O2 based on the reactions.(King 2009)
H2O2 O2 + 2H+ + 2e- (32)
H2O2 + 2H+ + 2e- 2H20 (33)

33
Because the reaction occurs as the sum of both reduction and oxidation, therefore it can occur
in acidic media. Moreover, if sufficient particles could be optimally spread through the
membrane, the net reaction would be the decomposition of H2O2 to oxygen and water. The
measured FER for a variety of membranes that where ion-exchanged with Pt and/or Fe2+. It
was seen that there was a significant reduction in FER for the as-received H+ membrane over
the Fe2+ membrane and also a major reduction for the Pt exchange membrane over the H+
membrane. Detected bubbling at the surface of the catalyst is attributed to oxygen production
via hydrogen peroxide decomposition. The proposed five step decomposition mechanism for
Nafion® is as follows. In the first step H2 reacts with O2 crossed over from the cathode on the
platinum catalyst surface between the membranes and catalyst layers where H2O2 is formed
as a bi-product. Some of the H2O2 is evaporated while the rest is diffused into the membrane
and catalyst layers. This is where OH. Radicals form in the presence of Fe2+ and degrade the
polymer, releasing F-. It is further hypothesized that some H2O2 is scavenged by Pt particles
distributed in membrane or catalyst.(King 2009)
The above mechanism of degradation has been confirmed by using Fenton’s test and then
further backed by solid state and solution NMR spectroscopy and FTIR spectroscopy and will
be discussed below. Inside the fuel cell, radicals can originate from electrochemical and
chemical reactions on both the anode and the cathode side. Two sources for radical formation
are discussed for fuel cells. One is the presence of transition metal cations or heat which can
split hydrogen peroxide produced from a two electron oxygen reduction. The second is the
direct reaction of H2 or O2 on the surface of the Pt catalyst. Oxygen crossover from the
cathode (at low currents) or hydrogen crossover from the anode (at high currents) may
provide the basis for such reactions. (Ghassemzadeh 2011)
In ex situ degradation tests, the Fenton’s solution is the most common method for radical
formation, and the Fenton reaction is commonly used for evaluation of the chemical stability
of polymer electrolyte membranes. In 1894, Fenton reported that the combination of H2O2
and a ferrous salt, “Fenton’s reagent”, is an effective oxidant for a wide variety of organic
substrates. The produced HO• and HOO• radicals in the Fenton reaction can be therefore used
for attacking different sites in PFSA ionomer.(Ghassemzadeh 2011)
Fe2+ + H2O2→ Fe3+ +HO• + OH− (34)
HO• + H2O2→ H2O + HOO• (35)

34
Although the situation in a Fenton test does not simulate neither the cathode nor the anode
side of the fuel cell, the stability of the polymers against the Fenton’s reagent is nonetheless
taken as one of the basic tests to assess the durability of such electrolyte membranes. The
presence of a metallic catalyst and a high concentration of hydrogen peroxide provide very
harsh conditions. Which differ from an operating fuel cell, and the membranes becomes very
rigid in a short time at much higher degradation rate. Therefore, the Fenton test is considered
as a fast and easy evaluation test that is applicable to any kind of membrane. It provides
radicals that can attack the polymer in a similar way as expected in an operating fuel cell. As
a primary test prior to real fuel cell tests, the Fenton ex situ test is very useful, and the
membranes that can survive the Fenton test with less degradation, usually also shows better
strength during in situ fuel cell tests. However, it should be stressed that the results from the
ex situ Fenton test not necessarily reflect the behaviour of a fuel cell membrane under
operation conditions. For example, hydrocarbon membranes with narrow water channels
exhibit reduced gas cross-over in a fuel cell test, and therefore less degradation is expected
which, however, is opposite to the experimental observation. Current spectroscopic studies
have showed new insights into the structural changes during various degradation tests. These
studies addressed both in situ degradation and a newly designed ex situ setup which can
avoid the use of the traditional Fenton test in order to simulate a situation that is closer to the
operating fuel cell condition. In depth information was gained by solid-state NMR
spectroscopy which gave a clear picture about the structural features and dynamic behaviour
prior and after degradation. In this context, high resolution19F MAS NMR spectroscopy is a
site-selective technique and is able to differentiate between the segments in the polymer main
and side chains. These studies mainly addressed the polymer side chain segments which
exhibited substantial degradation during the various tests. The derived results were in
qualitative agreement with independent electron spin resonance (ESR) spectroscopic and
mass spectrometric (MS) studies. (Ghassemzadeh 2011)

35
Figure 8 Chemical structures and solid-state 19 FNMR spectra of Nafion® 117. Asterisks indicate spinning side bands. The given spectra are normalized to the dominant peak of the backbone CF2 groups.
19F MAS NMR spectra of Nafion® is shown in fig 8. The given 19F signal assignment is
based on former solution and solid-state NMR investigations. The 19F NMR spectra show
separate signals for the side and the main chain segments of the Nafion® Ion membranes.
The CF2 groups of the backbone give rise to a peak at −121ppm similar to a signal of 19F
NMR in Teflon, while the 19F peak at −138ppm represents the backbone CF group at which
the side chain is attached. The signal of the CF group in the side chain appears at−144ppm.
The 19F peak at −117ppm reflects the SCF2 groups, while two peaks referring to the two
OCF2 groups and the CF3 group of the side chain appear at about−80 ppm. (Ghassemzadeh
2011)

36
Figure 9 Solid-state 19FNMRspectra of Nafion® 117 samples after treatment with 0.1M Fe2+ in 30 v/v%
H2O2. The line widths, _½, of the peak at −121 ppm, referring to the backbone CF2 groups, are shown.
Exposure times are given to the left of the figure.
.

37
Figure 10 Solid-state 19F NMR spectra of Nafion® 117 samples after 3 h of with different Fe2+ concentrations, as indicated, in 30 v/v% H2O2 solutions. The line widths, _½, of the peak due to the backbone CF2 groups are shown.

38
To examine the degradation of the present membranes during the Fenton test, in a first
attempt Nafion® 117 was treated with a 0.1M Fe2+ solution, as also done in the above-
mentioned ex situ Fenton study . Fig. 9 shows the respective solid-state 19F NMR spectra of
these samples after exposure to the Fenton test reagent for the periods given in the figure. A
general line broadening was seen for all samples after treatment with the Fenton’s solution. In
agreement with the former work, the spectra of the treated samples are virtually identical, and
show a substantial line broadening by nearly a factor of two as compared to the untreated
sample (see top spectrum). Therefore, it is very likely that the line broadening obscures all
other spectral alterations which might occur during the ex situ test.
In order to further clarify these findings, the test was repeated with different concentrations of
the Fenton’s reagent. Fig. 10 displays 19F NMR spectra of Nafion® 117 samples which were
exposed for 3 hour to the Fenton’s reagent with different Fe2+ concentrations. As given in the
figure. It is observed that the line widths strongly vary with the actual concentration. As an
example, the line widths, _½, of the main chain CF2 group are reported in the figure. The
difference in spectral line width for the samples treated with 0.0002M and 0.1MFe2+ solution
is almost 500 Hz. Therefore, for Fe2+ concentrations >0.0005M the SCF2 group signal only
appears as a shoulder next to the dominant CF2 peak, and at the highest concentrations it is
completely disguised. A similar line broadening effect is seen for all other peaks.
Nonetheless, independent of the spectral broadening, a decrease of the relative intensity for
the side chain SCF2 group can be identified for the solutions with lower Fe2+ concentration.
In order to follow the time evolution of the spectra during the ex situ Fenton test, a Fe2+
concentration of 0.0002M has been chosen. The respective 19F NMR spectra are given in
Fig. 11. It is seen that line width of the main chain CF2 peak, as denoted in the figure,
marginally increases by about 50 Hz, if the non-treated membrane is compared to the
membrane being in the Fenton’s solution for 2 days. At the same time, in comparison to
situation shown in Fig. 9, a Continuous decrease (with exposure time) of the SCF2 group
intensity can be noticeably identified. These changes in the relative signal intensities will be
quantified by spectral deconvolution, and will be further defined below. (Ghassemzadeh
2011)

39
Figure 12 ATR-IR spectra of Nafion® 117 samples after Fenton tests with 0.0002M Fe2+ in 30 v/v% H2O2.
Figure 11 . Solid-state 19F NMR spectra of Nafion® 117 samples after Fenton tests with 0.0002M
Fe2+ in 30 v/v% H2O2. Exposure times are given to the left of the figure.

40
The structural evolution of the Nafion® 117 sample during the Fenton test was also studied
by ATR-FTIR spectroscopy. The respective IR spectra of the same Nafion® samples are
shown in Fig. 12. The major peaks in these ATR-FTIR spectra and their assignment are also
listed. The comparison of the spectra before and after the Fenton degradation test displays a
decrease in intensity of the C–O–C (at 960 and 980cm−1), S–C (805cm−1) and S–O
(1056cm−1) stretching modes. At the same time, an intensity decrease is detected for the
peaks at 1132 and 1196cm−1 which are related to the stretching modes of the CF2 groups.
Furthermore there is also the appearance of two new peaks at around 2850 and 2920cm−1
which are due to symmetric and asymmetric CH stretching modes, and their intensities
slowly increase with longer exposure times. It should be noted that solid-state 1H NMR
measurements were done as well. However, no 1HNMR signals of aliphatic protons were
detected and unequivocal and independent proof for the presence of such CH groups could
not be given, most likely due to their low concentration. From these results it is concluded
that despite the major of degradation studies which emphasised the presence of main chain
degradation, these solid-state NMR studies noticeably proved substantial degradation in the
polymer side chains. The results from the present ex situ Fenton test studies confirm these
former results. They show that structural changes and bond cleavages also take place in the
polymer side chains, and therefore represent an important contribution for chemical
degradation of such ionomer membranes. In the present work it is found that the membranes,
after treatment with Fenton’s solution at Fe2+ concentrations larger than 0.0005 M, show
substantial line broadening in the solid-state 19F NMR spectra. The spectral broadening is
visible for all 19F NMR signals, but is slightly more pronounced for the signals of the side
chain region. A similar line broadening effect was also seen after soaking the membrane in a
FeCl2/water solution which suggests that the spectral changes are not related to membrane
degradation, but due to existence of the paramagnetic iron ions. Iron ions not only affect the
solid-state NMR data, but are also observable during other experimental studies. Therefore,
they can easily exchange with the acidic proton in the membrane, and—without any chemical
degradation—decrease the ion exchange capacity and electric conductivity of the polymer.
These changes are reversible after treating the membrane with an acidic solution. Performing
the Fenton test with the lowest manageable concentration of FeCl2 (0.0002M=10ppm) gives
experimental 19F NMR spectra with good resolution. Their analysis shows constant
degradation in the side chain region upon increasing reaction time. This is also confirmed by
the ATR-FTIR spectra which—together with the detection of the strong F- peak in the liquid

41
NMRspectra—also point to main chain degradation, not directly observable in the solid-state
19FNMRspectra. Based on these results and in agreement with other works, the sites for
radical attack in PFSA membranes are clearly both the main and the side chain regions.
Therefore in general, the polymer side chains can be attacked via the C–S bond or via the
tertiary carbons in the side and main chains. The comparison of the CF peak integral for the
side chain and main chain in Nafion® after the degradation shows that the changes for the
main chain CF group is very slight, while for the side chain CF group signal a much bigger
reduction can be found. Consequently, for Nafion® the intensity decrease of the peak at
−80ppm (referring to the OCF2 and CF3 groups) is predominantly caused by the OCF2 peak
closer to the end of the side chain and to the CF3 group, and not by the OCF2 group next to
the polymer main chain.(Ghassemzadeh 2011)
2.7. Sonochemical Degradation of Polymers Quantified by GC/MS
The sonochemical degradation of aqueous solutions containing low concentrations of six
phthalate esters at an ultrasonic frequency of 80 kHz was investigated. Ultrasonic treatment
was found capable of removing the four higher molecular mass phthalates (di-n-butyl
phthalate, butylbenzyl phthalate, di-(2-ethylhexyl) phthalate and di-noctyl phthalate) within
30–60 min of irradiation. The rest (dimethyl phthalate and diethyl phthalate) were more
recalcitrant and nearly complete removal could be achieved only after prolonged irradiation
times. GC–MS proved to be a powerful analytical tool to monitor the sonochemical
degradation of phthalate esters at low concentration levels.
An aqueous solution containing 40 µgl-1 of each phthalate (i.e. an initial overall concentration
of 240 µgl-1) was subject to continuous ultrasonic irradiation for 240 min at a constant
electric power output of 150 W and a constant water bath temperature 21 oC. Direct
comparison between the total ion chromatograms (Fig.13) obtained by means of GC–MS at
the beginning (time zero) and at the end (after 240 min of sonication) of the experiment,
reveals that all peaks corresponding to the six phthalates are essentially gone by the end of
the experiment.(Psillakis 2004)

42
Figure 13 Total ion chromatograms obtained with SPME/GC–MS of (a) the reaction mixture at time zero containing 40 µgl-1 of each phthalate (i.e. initial overall phthalates concentration of 240 µgl-1) where (1) DMP, (2) DEP, (3) DBP, (4) BBP, (5) DEHP and (6) DOP; and (b) after 240 min of sonication. The two extra peaks assigned as SPME contaminants originate from the partial loss of the SPME coating due to increased usage.The extra eluting peak assigned as phthalic acid is the only degradation product which could be detected with a certain degree of confidence. Other experimental conditions: 80 kHz of ultrasound frequency, 150 W of electric power output, 21 oC water bath temperature. (Psillakis 2004)
It appears that the more hydrophobic DBP, BBP, DEHP and DOP are all readily susceptible
to sonochemical degradation and nearly complete removal is achieved within 30–60 min of
irradiation at the conditions under consideration. Conversely, the less hydrophobic DMP and
DEP are more recalcitrant and complete degradation can be achieved only after prolonged
ultrasonic irradiation. (Psillakis 2004)

43
2.8. Degardation of Polymers Quantified by GC/MS
From literature the degradation mechanisms or degradation products for various polymers
have been elucidated using GC/MS. For example photochemical degradation of commercial
polyvinyl acetate (PVAc) homopolymer and PVAc paints mixed with burnt umber, cobalt
blue, cadmium red dark, nickel azo yellow and titanium white commonly used for artworks
were studied using GC/MS. The GC/MS analysis was used to study the differences in the
specimens before and after UV ageing, including the changes of detectable amounts of
deacetylation product – acetic acid and plasticizers such as diethyl phthalate (DEP).
Thermal degradation of unaged PVAc was studied at different pyrolysis temperatures by Py–
GC/MS. The pyrograms obtained are depicted in Fig 14. (Wei 2012)
Figure 14 Chromatograms of Mowilith® 50 obtained by Py–GC/MS analysis: (a) 300 ◦C;(b) 400 ◦C; (c) 500 ◦C; (d) 600 ◦C; (e) 700 ◦C; mixture: CO, CO2 and H2O; CPT, 1-3- cyclopendadiene. (Wei 2012) From the comparison between the chromatograms obtained at different temperatures by
GC/MS, it can be seen that at 300◦C, only water at retention time (RT) 2.0 min was detected,
which was probably absorbed by the sample from the environment. No acetic acid was
detected, which means that deacetylation reaction did not occur at this temperature. In

44
contrast to that result, in the pyrogram obtained at 400◦C the most dominant peak is that of
acetic acid at RT of 3.2 min (m/z = 60), with a smaller amount of water at RT 2.0 min (m/z =
18) and benzene at RT 3.5 min (m/z = 78), indicating deacetylation reaction occurs at 400 ◦C.
At temperatures above 500◦C, the main pyrolysis products are carbon dioxide, carbon
monoxide and water at RT 2.0 min based on the ions (m/z = 18, 28, 42, 44), acetone at RT
2.2 min (m/z = 15, 43, 58), 1-3-cyclopendadiene at RT 2.4 min (m/z = 39, 66), acetic
acid,benzene and toluene at RT 5.3 min (m/z = 91). It can be seen the pyrolyses at
temperature above 500◦C allowed the formation of more products such as 1-3-
cyclopentadiene, benzene and toluene, showing the decomposition of PVAc during
deacetylation reaction into a highly regular unsaturated material or polyene. The results are in
agreement with the thermal degradation mechanism of PVAc by non-isothermal and dynamic
thermalgravimetry including the formation of acetone, and solid-state NMR,
thermogravimetry coupled with mass spectrometry and differential thermal analysis. In the
literature, it was reported the first and most intense degradation step-deacetylation occurs
between 300◦C and 400◦C with temperature rate at 20◦C/min. The chain scission reaction
occurs at the end of the polymer main chain during deacetylation. (Wei 2012)
This technique is a useful way of elucidating the degradation products and it will be applied
to our results to find out the sonochemical degradation mechanism of Nafion.

45
3. CHAPTER 3 EXPERIMENTAL METHODS AND MATERIALS
3.1. Experimental Plan
The aim of the thesis was to find out the effect of ultrasound on Nafion® therefore in order to
see these effects control experiments on Nafion® were performed without ultrasound. The
effect of temperature on Nafion® in the abscence of ultrasound was investigated. High shear
mixing experiments were performed on Nafion® at different shearing rates of 5000 rpm and
10000 rpm without ultrasound to see the change in viscosity and glass transition temperature
(Tg) using high shear mixing. This was done in order to see what effect this has on the
Nafion® properties in terms of (Tg) and viscosity. These control experiments were than
compared to Nafion® subjected to different ultrasonic conditions. 4 different concentrations
of Nafion® were used in the experiments, 2.5, 5, 7.5 and 10% and the different
concentrations were than subjected to ultrasound using ultrasonic probe and ultrasonic bath at
various powers, amplitudes and time ranges of 0 to 120 minutes.
The ultrasound probe experiments were performed with 20 kHz ultrasonic probe system and
the ultrasound bath experiments were carried out using sonomatic 40 kHz ultrasound bath.
The power ranges used for ultrasonic ultrasonic probe runs were 1.86, 3.84, 6.42 and 11.28
W at 20%, 40%, 60% and 80% amplitude. The power used for ultrasound bath was 0.32 W.
The different ultrasound treated samples at various ultrasound intensities and times were then
used to measure the viscosity using Rheometer and the Tg was obtained using Differential
Scanning Calorimetry. These results were than compared to silent conditions in order to see
the ultrasound induced effects on Nafion®.

46
3.2. Experimental Setup (a) (b)
Figure 15 Sonochemical [(a) Sonics 20KHz ultrasonic probe system; (b)Sonomatic 40KHz ultrasonic bath
system used for Sonication studies on Nafion® . (Pollet 2010)
3.3. Experimental Procedures
3.3.1. Ultrasound bath 40kHz
1. Samples consisting of 2.5% Nafion® solution in water were treated in an ultrasonic bath (40kHz)
for 120 minutes.
2. Immediately upon completion, the samples were separated into 2 parts.
3. The first part was tested on the rheometer. (see above for specific procedure)
4. The 2nd part was vacuum dried until crystals were formed before being tested with the DSC
apparatus. (See above for specific procedure). 2 to 3 drops of Isopropyl Alcohol was used as
solvent.
5. A fresh sample of 2.5% Nafion® solution was next used for each time increment of 60, 40, 30,
15, 10 and 5 minutes.
6. Steps (1) to (5) were repeated for the remaining 3 concentrations of Nafion® solution.

47
3.3.2. Ultrasound probe 20kHz
1. One sample of 2.5% Nafion® solution was treated with an ultrasound probe (20kHz) at power
level P1 for 5 minutes.
2. Immediately upon completion the sample was separated into 2 parts.
3. The first part was tested on the rheometer.
4. The 2nd part was vacuum dried until crystals were formed before being tested with the DSC
apparatus. (See above for specific procedure). 2 to 3 drops of Isopropyl Alcohol was used as
solvent.
5. Steps (1) to (4) were repeated for power levels P2 and P3.
6. Steps (1) to (5) were repeated with fresh samples of 2.5% Nafion® solution for each time
increment of 60, 40, 30, 15, 10 and 5 minutes.
7. Steps (1) to (6) were repeated for the remaining 3 concentrations of Nafion® solution.
3.4. Experimental Apparatus
1. Standard lab apparatus (beakers, pipettes, weighing machine etc.) 2. Ultrasound bath (40kHz) 3. Ultrasound probes (20kHz) 4. Storage bottles (30ml) 5. Stopwatch 6. Rheometer 7. High Shear Mixer (5krpm and 10krpm) 8. Differential scanning calorimetry (DSC) apparatus 9. GC/MS
3.5. Materials List
1. Deionised (DI) water 2. Nafion® solution 10% wt. 3. IPA

48
3.6. Nafion® Sample Preparation
The available Nafion® solution of 10% wt. is diluted with IPA and DI water to form
concentrations of 2.5%, 5%, 7.5%. The ratio of IPA to DI water is based on literature values
of 19ml DI water and 6ml IPA for every 100µl of 5% Nafion® solution (Takahashi and
Kocha 2010). It is reproduced in the interest of bench-marking.
3.7. Experimental Parameters and Variables
Parameters/Variables
Table 1 Showing the parameters and variables used during the experiments
Fixed Temperature
Pressure
25oC
1atm
Manipulated
Ultrasound frequency
Power
Nafion® concentration
Exposure time to ultrasound
20, 40kHz
P1, P2, P3 (20kHz) and P4 (40kHz)
2.5, 5.0, 7.5, 10.0%
1,2.5, 5, 10, 15, 30, 40, 60, 120min
Measured RMM (GPC, DSC)
Viscosity (Rheometer)
-
-
3.8. Power Measurements
Two ultrasonic equipment were used in this study for the effect of ultrasound on Nafion®.
Ultrasonic probe was sonomatic 20 KHz and ultrasound bath was sonomatic 40 KHz. Before
sonicating the different Nafion® samples, the power measurements were worked out by
performing experiments. The energy input was controlled by varying the amplitude of the
sonicator probe (sonotrode) that transmits the ultrasound into the samples. The sonotrode was
immersed into the samples

49
at a depth of approximately 2cm within a sample vial. The volume of the sample used was
0.02 litres. The ultrasonic sample temperature was taken from 0 to 60 minutes and plotted
against time. Ultrasonic power is considered to be mechanical energy and it is partly lost in
the form of heat when ultrasound travels through the medium. Heat is produced by the
ultrasonic irradiation of a liquid; therefore acoustic power can be estimated by recording the
temperature as a function of time using the following equation.
P = mCp
(36)
where dT/dt is the change in temperature along with the whole time range (oCs-1) and
determined by polynomial curve fitting, Cp. (Karaman 2012)
3.9. Depth of the Horn
The depth of ultrasonic horn was always kept at the same level because it could affect the
extent of degradation therefore the ultrasonic probe was immersed at the same level. This was
done by making marking on the clamp and boss that held the ultrasound probe. This meant
each time a sample was sonicated the ultrasound probe was immersed at the same level.
3.10. Equipment setup
A. Ultrasonic bath
1. The water level is checked. 2. The fixtures are checked to ensure the sample bottle remains stationary during ultrasound
treatment.
B. Ultrasonic Probe
1. The Ultrasonic probe is fixed at the same level for each run using clamps and bosses. 2. The fixtures are checked to ensure the sample bottle remains stationary during ultrasound
treatment.

50
C. Rheometer
A Rheometer is a laboratory equipment used to measure the way in which a liquid,
suspension or slurry flows when a force is applied. It is used for particular fluids which
cannot be defined by a single value of viscosity and thus need more parameters to be set and
measured than in the case for a viscometer. Rheometer measures the rheology of the fluid.
Parallel plates with a diameter of 25 mm were chosen. Temperature control was attained by
electrically heated plates, which had an accuracy of ±0.1 C. All measurements were done
under Argon atmosphere to prevent any degradation and take-up of moisture. The following
small amplitude oscillatory shear measurements were carried out for each blend at a fixed
composition: (1) dynamic time sweeps (DTS) at a given temperature and frequency (from 0.1
to 1 rad/s), in order to gain steady state and therefore ensure that measurements were
performed under ‘‘dynamic equilibrium’’ conditions; (2) dynamic stress sweeps (DSS) at
specified temperature and frequency (0.1 100 rad/s), to determine the limits of linear
viscoelasticity; (3) dynamic frequency sweeps (DFS) from 0.1 to 150 rad/s at a given stress,
in order to determine the behaviour of the storage (G0) and loss (G00) moduli in the
homogeneous, transitional, and two-phase regions. The measurement accuracy of dynamic
shear rheology measurement was±0.001 Pa. The complete AR 2000 Rheometer setup is given
in figure 16.
Figure 16 Showing complete setup of AR 2000 Rhemoeter.

51
D. Sample Preparation for DSC Analysis
The different samples of Nafion® were prepared for (DSC) analysis using a suitable solvent in
order to ensure that the solvent did not have any effect on the results obtained and thus only
the sonication was the result of any change observed. The suitable solvent chosen from the
literature was THF (Tetrahydrofuran). The sonicated samples at various times and ultrasound
power were transferred to sample vial and dried in a oven overnight at 40o C for 24 hours.
After the sonicated Nafion® sample was dried than a small amount of the sample was
dissolved into THF and stirred until the sample dissolved into the solvent. The sample was
then dried in a vacuum oven at 0.25 atm and 55°C because THF has a boiling point of 66°C
for 20 hours to remove the residual solvent. 5mg of the sample was then taken for DSC
analysis. All the other samples were prepared in the same way. The unsonicated Nafion®
sample was also prepared in the same way so it could be compared to the sonicated Nafion®
samples. The samples were then put into Differential Scanning Calorimetry in order to
measure the heating effects of the samples. The procedure for using (DSC) is given below.
E. Differential Scanning Calorimetry Apparatus
A Perkin Elmer Pyris 1 Differential scanning calorimeter (DSC) was used to see the heating
effects of Nafion® after sonication, and to do this we had to use special equipment called
Differential scanning Calorimtery. Before beginning the measurements, the calorimeter was
calibrated for temperature and sensitivity using the melting curves of pure In, Zn, Al, Ag, and
Au. To avoid sample oxidation, the experiments were done under a He flow (30 mL/min)
after evacuating the working chamber three times to a vacuum level of 10-2 bar. The purity
of the He used was higher than 99.999 pct. There are two pans used. In one pan, the sample
pan, you put your polymer sample. The other pan is the reference pan. You leave it empty.
The samples used for analyzing were 3μg to 8 μg. DSC was furnished with an ethylene glycol
cooling system maintained at 5◦C. The measurements on cooling were done at different rates
from 10 to 2 K/min. All experiments were performed under Argon atmosphere.

52
The fast cooling runs at 10 K/min were performed from 185◦C to 60◦C to ensure that the
instrumental cooling rate was well controlled at Tg. The standard deviation of calorimetric Tg
values was ±0.3◦C based on two or three measurements performed at each cooling rate. The
complete DSC setup is shown below in Figure 17.
Figure 17 Complete Perkin Elmer Pyris 1 Differential Scanning Calorimeter Setup
53
F. GC/MS Analysis
The GCMS instrument is made up of two parts. The gas chromatography (GC) portion
separates the chemical mixture into pulses of pure chemicals and the mass spectrometer (MS)
identifies and quantifies the chemicals. For the analysis of the samples we used Fissions MD-
800 chromatograph/ Mass Spectrometer.
The different Nafion® samples were analyzed with GC/MS by following the procedure given below.
Gas chromatography (GC)
One microliter (1 µl, or 0.000001 L) of solvent containing the mixture of molecules is
injected into the injection port of the GC. The sample is carried by inert (non-reactive) gas
through the instrument, usually helium. The inject port is heated to 300°C to cause the
chemicals to become gases. The outer part of the GC is a very specialized oven. The column
is heated to move the molecules through the column. Typical oven temperatures range from
40°C to 320°C. Inside the oven is the column which is a 30 meter thin tube with a special
polymer coating on the inside. Chemical mixtures are separated based on their volatility and
are carried through the column by helium. Chemicals with high volatility travel through the
column more quickly than chemicals with low volatility.
Mass Spectrometer (MS)
After passing through the GC, the chemical pulses continue to the MS. The molecules are
blasted with electrons, which cause them to break into pieces and turn into positively charged
particles called ions. This is important because the particles must be charged to pass through
the filter. As the ions continue through the MS, they travel through an electromagnetic field
that filters the ions based on mass. Adjustment was made to allow appropriate range of
masses through the filter. The filter continuously scans through the range of masses as the
stream of ions come from the ion source. A detector counts the number of ions with a specific
mass. This information is sent to a computer and a mass spectrum is created. The mass

54
spectrum is a graph of the number of ions with different masses that travelled through the
filter.
Computer
The data from the mass spectometer is sent to a computer and plotted on a graph called
a mass spectrum. The computer on the GC-MS has a library of spectra that can be used to
identify an unknown chemical in the sample mixture. The library compares the mass
spectrum from a sample component and compares it to mass spectra in the library. It reports a
list of likely identifications along with the statistical probability of the match.
The same procedure was followed for the other samples to be analysed with GC/MS and the
results are given in the results section.
G. High shear mixer
Figure 18 Schematic representation of High Shear Mixer

55
1. One sample of 2.5% Nafion® solution was subjected to high shear mixing (speed of 5krpm and
10krpm) for 5 minutes.
2. Immediately upon completion, the sample was separated into 2 parts.
3. The first part was tested on the rheometer.
4. The 2nd part was vacuum dried until crystals were formed before being tested with the DSC
apparatus. (See above for specific procedure). 2 to 3 drops of THF (tetrahydrofuran) was used as
solvent.
5. A fresh sample of 2.5% Nafion® solution was next used for each time of 60, 40, 30, 15, 10 and 5
minutes.
6. Steps (1) to (5) were repeated for the remaining 3 concentrations of Nafion® solution.
3.11. Temperature Control
The temperature of the Nafion® samples was montitored because it was important to control
all the parameters that could degrade Nafion®. Because our main objective was to see
ultrasound effect on Nafion® .The temperature of the polymer solution was maintained
constant within ±2 oC by circulating cold water through the jacketed reactor.
Figure 19 showing jacketed reactor
3.12. Volume Used
The volume used to prepare the samples was always kept constant because this can
manipulate the ultrasound effect on Nafion®.

56
4. CHAPTER 4 RESULTS AND DISCUSSION
4.1. Silent Conditions
The experiments focused on the effect of temperature and high shear mixing (i.e under silent
conditions) on Nafion® in order to separate the thermal, cavitation and high agitation induced
by ultrasound under silent conditions. The samples for control experiments were made by
keeping a constant volume; the procedures for making the samples are given in the
experimental procedure. The samples were then analysed using Rheometer and a Differential
Scanning Calorimtery to measure changes in viscosity and glass transition temperatures, and
then were compared with samples subjected to ultrasonic treatments at various ultrasonic
powers and high shear mixing at different rotation speeds. The control experiments are given
below. The temperature was also kept at 298 k for all the experiments performed.
The choice of comparing ultrasound experiments to temperature and shear-mixer experiments
was to see if shear- mixer and temperature gives the same results. As explained earlier the
motivation for this thesis was the result of ultrasonic applications being used more frequently
in fabrication of fuel cell materials. Because ultrasound and high Shear mixing are both
mechanical processes in origin comparing the two is a good way of distinguishing which
technique could be better suitable for fabrication of Nafion® for fuel cell use.
4.1.1. The Effect of Ultrasound on Nafion® At Various temperatures
Sonication of Nafion® at various temperatures has an effect on the degree of degradation
therefore all the experiments were performed at the same temperature of 298 k. Most of the
chemical processes are accelerated by increase in temperature however the opposite effect is
noticed in mechanical processing such as ultrasound. This negative temperature coefficient
therefore suggests that the process is mechanical in origin. Sonochemical processes show
faster rates at lower temperature than higher temperatures. Furthermore the primary
sonochemical step is more efficient at low temperatures. At higher temperatures, the solvent
vapour pressure is more therefore the vapour enters the cavitation bubble. This effectively
cushions the collapse and thus the movement of solvent molecules is slowed down and
therefore the shock waves are reduced. Therefore the experiments were carefully performed

57
at the same temperature using jacketed reactor in order to separate the ultrasound effect on
Nafion® from temperature driven effects.(Price and Smith 1993, Vijayalakshmi and Madras
2004).
4.1.2. Effect of Nafion® Concentration
Preliminary studies focused on the effect of Nafion® concentration on viscosity at fixed temperature and in the absence of ultrasound. The results are given in table 2.
Table 2 Showing the viscosity of different Nafion® solution’s under controlled conditions
Concentration (wt %) Viscosity() pa.s (x10-3) Temperature (oC) Sonication Time (MIN)
2.5 1.709 25 0
5.0 2.762 25 0
7.5 6.252 25 0
10 11.390 25 0
Figure 20 Graph showing viscosities () of different concentration Nafion® solutions at no ultrasound
and constant temperature of 25oC
0
2
4
6
8
10
12
0 2 4 6 8 10 12
Vis
co
sit
y (
x1
0-3
)
Concentration (wt %)

58
Figure 21 Graph showing Tg of Nafion® of control experiment with no ultrasound and no high shear mixer.
From the preliminary experiments the initial viscosity and Glass transition temperature of
Nafion® were deduced prior to ultrasound and high shear mixing treatment. The purpose of
these preliminary experiments was to establish what effect ultrasound and high shear mixing
has on Nafion® degradation. The glass transition temperature of Nafion® from the
preliminary experiments is 148oC which agrees with the literature value of 148oC. The
following results and discussion show our findings.
4.1.3. The Effect of Temperature on Nafion®
Increasing the operating temperature of fuel cells is desirable because it reduces CO
poisoning of the catalyst. CO and H2 compete to absorb on the platinum based catalyst.
Below 100°C, if the concentration of CO is higher than 1-10 ppm, CO will win this
competition, which results in a drop in performance. As the temperature of the fuel cell
increases, more and more CO can be tolerated. Higher operating temperatures also make the
rejection of waste heat easier. Conversely, common fuel cell membranes including Nafion®
perform poorly at higher temperature and degrade more quickly. (Satterfield 2007)
0
50
100
150
200
250
0 20 40 60 80 100 120 140 160 180
Hea
t F
low
(m
W)
Temperature (oC)

59
The mechanical properties of Nafion® are strongly dependent on temperature; this is
because as the temperature increases the bonding strength between the polymer chains
reduces. As temperature increases, the thermal energy of Nafion®’s molecules eventually
becomes greater than that of the polymer’s secondary bonds, and chains are able to move past
one another freely when force is applied. Secondary bonds in Nafion® contain hydrogen
bond cross-linking between the sulfonic acid groups and Van der Waals interactions between
main chains. Numerous studies have addressed the issue of thermal stability and thermal
degradation of PFSA membranes. The polytetrafluoroethylene (PTFE)-like molecular
backbone gives Nafion® membranes their relative stability until beyond 150◦C due to the
strength of the C–F bond and the shielding effect of the electronegative fluorine atoms. At
higher temperatures, Nafion begins to decompose via its side sulfonate acid groups. PFSA
membranes are subject to critical breakdown at high temperatures due to the glass transition
temperatures of PFSA polymers. (Majsztrik 2008)
Thermal degradation of polymers is molecular deterioration as a result of overheating. At
high temperatures the functional groups of the long chain backbone of the polymer can begin
to separate (molecular scission) and react with one another to change the properties of the
polymer. Thermal degradation usually involves changes to the molecular weight (and
molecular weight distribution) of the polymer and characteristic changes include reduction in
ductility, embrittlement, chalking, colour changes, cracking, overall reduction in most other
desirable physical properties.(Alwai 2009)
The 2.5% Nafion® solutions were made by keeping a constant volume and then the different
solutions were tested to see the effect of temperature increase on the polymer, the
temperature range used was from 20 to 80oC and 4 samples were tested at 25, 40, 60 and
80oC for 1 hour. The results are given in table 6 and fig 16. The degradation was measured in
the same way by measuring the change from initial viscosity. The initial viscosity of 2.5%
Nafion® solution at room temperature was 1.709 x 10⁻³ pa.s. From the results it can be
concluded that there is no significant change in viscosity from the initial viscosity at room
temperature. At 80 oC reduced to only 1.69 10-3 pa.s although there is a slight decrease in
viscosity, it is not significant enough to conclude that polymer has fully degraded. This can
be the result of thermal energy of Nafion® being sufficient enough to cause the breakage of
secondary bonds within the polymer, and thus the chains are able to move past one another
easily hence the slight reduction in viscosity. It can be concluded that there are no breakages

60
of the primary covalent and ionic bonds within the polymer at 80oC because there is no
significant reduction in viscosity. Secondly the primary bonding within Nafion® is
considerably strong and gives Nafion® stability until beyond 150◦C due to the strength of the
C–F bond and the shielding effect of the electronegative fluorine atoms as explained earlier.
Table 3 Showing The Effect of Temperature On 2.5% Nafion® at 60 Minutes at various temperatures
Nafion® Concentration (% wt)
Temperature exposing Time (mins)
Temperature (oC) Viscosity (x10-3 pa.s)
2.5 60 25 1.709 2.5 60 20 1.709 2.5 60 40 1.709 2.5 60 60 1.706 2.5 60 80 1.690
Figure 22 Showing The Effect of Temperature On 2.5% Nafion® at 60 Minutes at Various Temperature
1.685
1.69
1.695
1.7
1.705
1.71
0 10 20 30 40 50 60 70 80 90
Vis
co
sit
y (
x 1
0-3
pa
.s)
Temperature (oC)

61
4.1.4. Effect of High Shear Mixing on Nafion® in the Absence of Ultrasound
The effect of high shear mixer on Nafion® was also investigated. The samples for the
experiment were made in the same way by keeping a constant volume the experimental
procedure is given in chapter 3. The different 5% concentration samples were mixed for time
periods of 1, 5, 10, 20, 30, 60, and 120 minutes at rates of 5krpm and 10krpm.
From the results in fig 23 and 24 and table 4 and 5 it can be concluded that there is a steady
decrease in the viscosity of the Nafion® solution from 1 minute shear mixing to 120 minutes.
The initial viscosity of the 5% solution is 2.762 x 10⁻³ pa.s and after 120 minutes it decreased
to 2.53 x 10⁻³ pa.s for the 5krpm rate and 2.33 x 10⁻³ pa.s for the 10krpm however it is
important to point out that the decrease in viscosity is not as significant when compared to
sonication where the viscosity reduced to 1.798 x 10⁻³ pa.s. This proves that although high
shear mixer degrades the polymer it does not degrade it as much as ultrasound does and this
can be attributed to the fact that mechanical degradation breaks the bonds within the polymer
near the end of the molecule whereas the ultrasound irradiation causes breakage at the centre
of the molecule each time therefore resulting in more severe degradation. There is also no
sudden increases in viscosity of the polymer therefore we can assume that the shear mixer
does not contribute to polymerization as was noticed for the ultrasound irradiated
samples.(C), (Redl 2003)
Table 4 The effect of high shear mixer on 5% Nafion® At Shear Rates of 5000 rpm
Shear Mixer Rate : 5000 rpm
Nafion® Concentration: 5%
Shear Mixing Time (Mins) Change in Viscosity (x10-3 pa.s)
0 2.762 1 2.76 2.5 2.75 5 2.75 10 2.69 30 2.62 60 2.59 120 2.53
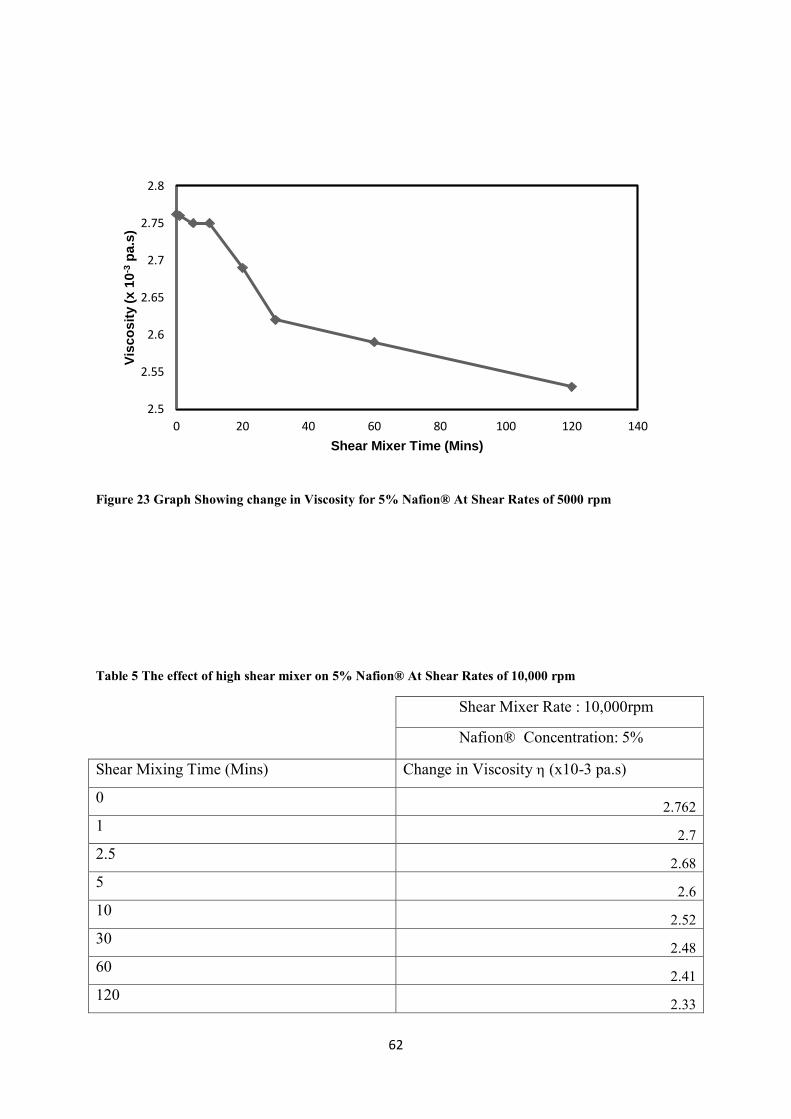
62
Figure 23 Graph Showing change in Viscosity for 5% Nafion® At Shear Rates of 5000 rpm
Table 5 The effect of high shear mixer on 5% Nafion® At Shear Rates of 10,000 rpm
Shear Mixer Rate : 10,000rpm
Nafion® Concentration: 5%
Shear Mixing Time (Mins) Change in Viscosity (x10-3 pa.s)
0 2.762 1 2.7 2.5 2.68 5 2.6 10 2.52 30 2.48 60 2.41 120 2.33
2.5
2.55
2.6
2.65
2.7
2.75
2.8
0 20 40 60 80 100 120 140
Vis
co
sit
y (
x 1
0-3
pa
.s)
Shear Mixer Time (Mins)

63
Figure 24 Graph Showing change in Viscosity () for 5% Nafion® At Shear Rates of 10,000 rpm
4.1.5. DSC measurement Of High Shear mixed Nafion samples
Different samples of Nafion® were analysed by Differential Scanning Calorimetry in order to
see the effect of high Shear mixing on the physical properties of the polymer in question. The
results are given in (fig 25 to fig 28). The DSC analysis of high shear mixer experiments
show that there is no increase in the Tg for the shear mixing done at 5krpm for time periods
of 5 and 30 minutes fig 25 and fig 26, however for the high shear mixing done at 10krpm for
time periods of 10 minutes and 5 minutes (fig 27 and fig 28) there is a decrease in the Tg. this
can be attributed to the damage by generation of heat, at high shear mixing rate of 10krpm,
There may be separate particles but generation of heat may cause scission of chains thereby
reducing Tg. (Nguyen 1995)
2.3
2.35
2.4
2.45
2.5
2.55
2.6
2.65
2.7
2.75
2.8
0 20 40 60 80 100 120 140
Vis
co
sit
y (
x 1
0-3
pa
.s)
Shear Mixer Time (Mins)

64
DSC Analysis of High Shear Mixer
Nafion® 10% In THF 5 Minutes High Shear Mixer (HSM) 5000 rpm
Figure 25 Graph showing No change of Tg for Nafion® 10% In THF 5 Minutes High Shear Mixer (HSM) 5000 rpm
Nafion® 10% In THF 30 Minutes High Shear Mixer (HSM) 5000 rpm
Figure 26 Graph showing No change of Tg for Nafion® 10% In THF 30 Minutes High Shear Mixer (HSM) 5000 rpm
0
50
100
150
200
250
0 20 40 60 80 100 120 140 160 180
Hea
t F
low
(m
W)
Temperaturre (oC)
0
50
100
150
200
250
300
0 20 40 60 80 100 120 140 160 180
Hea
t F
low
(m
W)
Temperature (oC)

65
Nafion® 10% In THF 10 Minutes High Shear Mixer (HSM) 10,000 rpm
Figure 27 Graph showing Decrease in Tg for Nafion® 10% In THF 10 Minutes High Shear Mixer (HSM) 10,000 rpm
Nafion® 10% In THF 5 Minutes High Shear Mixer (HSM) 10,000 rpm
Figure 28 Graph Showing Decrease inTg for Nafion® 10% In THF 5 Minutes High Shear Mixer (HSM) 10,000 rpm
-50
0
50
100
150
200
250
0 20 40 60 80 100 120 140 160
Hea
t F
low
(m
W)
Temperature (oC)
0
50
100
150
200
250
0 20 40 60 80 100 120 140 160
Hea
t F
low
(m
W)
Temperature (oC)

66
4.2. Ultrasonic Conditions
4.2.1. Effect of Nafion® Concentration
The effect of Nafion® concentration at constant volume and same ultrasound power was
investigated. The results from table 6 and fig 29 shows that higher concentration of Nafion®
shows the extent of viscosity reduction decreases with an increase in the solution
concentration at the same supplied ultrasonic power. In other words the degradation is lower
at higher concentration of Nafion® solution compared to lower concentration of Nafion®
where the degradation is higher. The increase of polymer concentration increases the
viscosity of the polymer solution and intensity of cavitation falls down with an increase in the
viscosity of the medium. As the formation of cavitation in the liquid requires that the negative
pressure in the rarefaction region of wave function must overcome the natural cohesive forces
acting within the liquid. Cavitation is more difficult to produce in viscous liquids, where the
cohesive forces are stronger. It should be noted here that independent bubble dynamics
studies have clearly indicated that an increase in the viscosity results in a decrease in the
collapse pressure generated due to cavitation. So an increase in viscosity with concentration
results in the molecules to become less mobile in solution and the velocity gradients around
the collapsing bubbles to therefore become smaller, resulting in lower extents of viscosity
reduction in the case of polymer systems. Therefore in terms of the degradation of Nafion®
the extent of degradation is therefore expected to be lower at higher concentration of the
Nafion® solution.
This coincides well with similar results published by Desai et al who studied the ultrasonic
degradation at different concentrations. For example from the results it is clearly seen that
after 30 minutes of sonication the higher viscosity is seen for the 10 percent Nafion®
solution 15.320 x 10⁻³ Pa.s compared to Nafion® concentration of 2.5% after 30 minutes of
sonication where the viscosity reduced to as little as 1.709 x 10⁻³ Pa.s, and since in polymer
chemistry degradation is quantified by either molecular weight distribution or by change in
intrinsic viscosity therefore we can safely assume that the greater degradation will occur at
lower concentration of the Nafion® solution. Another explanation for this phenomenon is
because at high Concentrations, entanglements influence the energy transfer processes
between solvent and polymer and appears to reduce the probability of degradation. Also at

67
higher concentrations the intensity of cavitation phenomenon is depressed and therefore the
extent of polymer chain breaking decreases.(Mohod 2011). The results indicate that the
percentage degradation reduced with increasing concentration which affects the cavitational
intensity in the system. (Desai 2008)
Table 6 Showing effect of ultrasound on Different Nafion® Concentrations at 30 minutes using ultrasound Probe %20AMP at 25oC
Power : 1.86 W
Ultrasound Probe Nafion® Concentration (% wt) Sonication Time (Mins) Viscosity (x10-3 pa.s) 2.5 30 1.709 5 30 2.762 7.5 30 6.252 10 30 15.320
Figure 29 Showing effect of ultrasound on Different Nafion® Concentrations at 30 minutes using ultrasound Probe %20amp at 25oC
0
2
4
6
8
10
12
14
16
18
0 2 4 6 8 10 12
Vis
cosi
ty (
x10
-3 p
a.s)
Nafion Concentration (wt %)
Sonication Time : 30 Min

68
4.2.2. 5% Nafion® Solutions Sonicated at 0.32 W (Bath)
The experiments were conducted by making different solutions of Nafion® (the experimental
procedure is given in Chapter 3) were made by diluting it with ultrapure water, the solutions
made were of the concentration of 2.5%, 5%, 7.5% and 10% respectively, these solutions
were then subjected to ultrasound using ultrasound probes and ultrasound bath for time
periods of 1, 2.5,5, 10, 30, 60 and 120 minutes. The power measurements for the ultrasound
probe and the ultrasound bath were worked out and the results along with power
measurements are given in the Appendix 1A. (Mohod 2011)
The results show that the most extensive degradation of the Nafion® polymer occurred at the
lowest ultrasonic frequency when the input ultrasonic power was above the cavitation
threshold indicating that the shear forces generated by the rapid motion of the solvent were
responsible for the breakage of chemical bonds within the polymer. For the ultrasonic bath
experiments it was observed that in the range of sonication period of 0 minute to 120 minutes
the Nafion® solution viscosity decreased from 2.762 x 10⁻³ to 1.845 x 10⁻³ Pa.s at an
ultrasonic power of 0.48W. The ultrasonic probe experiments showed the viscosity of
Nafion® reduced from 2.762 x 10⁻³ Pa.s at 0 mins down to 1.949 x 10⁻³ Pa.s at 120 minutes at
a power of 1.86W;-this obvious decrease in viscosity could be attributed to the fact that
covalent bonds within the Nafion® polymers broke when the input ultrasonic power
exceeded the cavitation threshold. Furthermore from the results it can be seen that after 120
minutes of sonication the degradation reached a point where the Nafion® viscosity reduced
permanently. Because from the ultrasonic bath results it can be seen that after 120 minutes of
sonication the viscosity obtained from the rheometer was 1.845 x 10⁻³ Pa.s compared to the
viscosity of 120 minute ultrasonic bath sonicated samples left overnight, for which the
measured viscosity was 1.820 x 10⁻³ Pa.s. This proves that there is a very small difference
between the viscosities of the fresh sample compared to viscosity of overnight samples. This
further backs the argument that at 120 minutes there is permanent reduction in viscosity of
the Nafion®, the results show that depolymerised Nafion® does not repolymerise. This
observed trend in our results is in good agreement with similar work performed on the
ultrasonic depolymerisation of aqueous polyvinyl alcohol.(Grönroos 2001). However before
we can be certain that permanent reduction in viscosity is reached at 120 minutes of
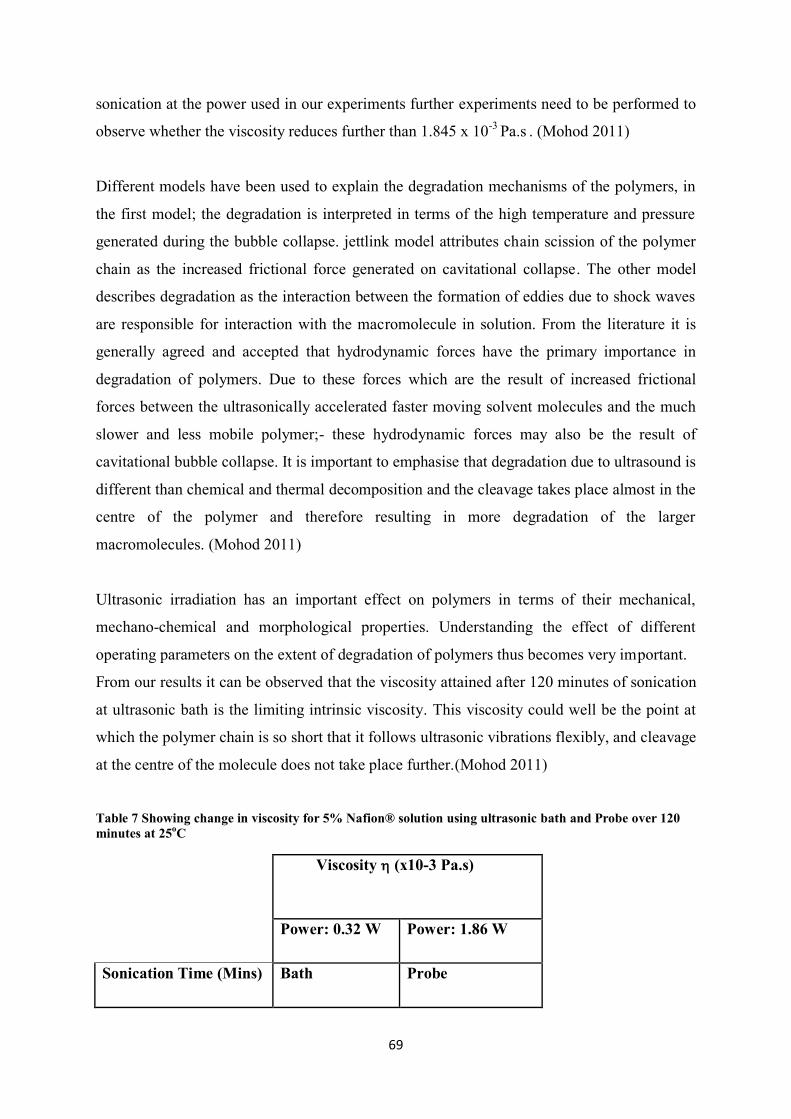
69
sonication at the power used in our experiments further experiments need to be performed to
observe whether the viscosity reduces further than 1.845 x 10⁻³ Pa.s . (Mohod 2011)
Different models have been used to explain the degradation mechanisms of the polymers, in
the first model; the degradation is interpreted in terms of the high temperature and pressure
generated during the bubble collapse. jettlink model attributes chain scission of the polymer
chain as the increased frictional force generated on cavitational collapse. The other model
describes degradation as the interaction between the formation of eddies due to shock waves
are responsible for interaction with the macromolecule in solution. From the literature it is
generally agreed and accepted that hydrodynamic forces have the primary importance in
degradation of polymers. Due to these forces which are the result of increased frictional
forces between the ultrasonically accelerated faster moving solvent molecules and the much
slower and less mobile polymer;- these hydrodynamic forces may also be the result of
cavitational bubble collapse. It is important to emphasise that degradation due to ultrasound is
different than chemical and thermal decomposition and the cleavage takes place almost in the
centre of the polymer and therefore resulting in more degradation of the larger
macromolecules. (Mohod 2011)
Ultrasonic irradiation has an important effect on polymers in terms of their mechanical,
mechano-chemical and morphological properties. Understanding the effect of different
operating parameters on the extent of degradation of polymers thus becomes very important.
From our results it can be observed that the viscosity attained after 120 minutes of sonication
at ultrasonic bath is the limiting intrinsic viscosity. This viscosity could well be the point at
which the polymer chain is so short that it follows ultrasonic vibrations flexibly, and cleavage
at the centre of the molecule does not take place further.(Mohod 2011)
Table 7 Showing change in viscosity for 5% Nafion® solution using ultrasonic bath and Probe over 120 minutes at 25oC
Viscosity (x10-3 Pa.s)
Power: 0.32 W Power: 1.86 W
Sonication Time (Mins) Bath Probe

70
0 2.762 2.762 1 2.71 2.74 2.5 2.69 2.71 5 2.62 2.66 10 2.54 2.6 30 2.7 2.72 60 2.58 2.35 120 1.845 1.949
Figure 30 Showing Change in Viscosity of 5% Nafion® solution Using Ultrasonic bath and Probe Over 120 minutes at 25oC
0
0.5
1
1.5
2
2.5
3
0 20 40 60 80 100 120 140
Vis
cosi
ty (
X10
-3 p
a.s)
Sonication Time (Mins)
Ultrasonic Bath
ultrasonic Probe
Ultrasonic Probe Power : 1.86 W Ultrasonic Bath Power : 0.32

71
4.2.3. 2.5 Nafion® Solution Sonicated at Different Powers With US (Probe)
Table 8 Showing Change in Viscosity () of 2.5% Nafion® Solution Using Ultrasonic Probe at 20%, 40 %, 60% and 80 % AMP Over 120 minutes at 25oC
Power : 1.86 W Power : 3.84 W Power : 6.42 W Power : 11.28 W
Ultrasound probe Ultrasound probe Ultrasound probe Ultrasound probe
Sonication Time (Mins)
Change in Viscosity (x10-3 Pa.s)
Change in Viscosity (x10-3 Pa.s)
Chang in Viscosity (x10-3 Pa.s)
Change in Viscosity (x10-3 Pa.s)
0 1.709 1.709 1.709 1.709 1 1.663 1.671 1.68 1.67 2.5 1.624 1.643 1.656 1.665 5 1.617 1.62 1.643 1.661 10 1.58 1.593 1.633 1.594 30 1.69 1.588 1.606 1.588 60 1.61 1.684 1.589 1.576 120 1.57 1.55 1.688 1.564
Figure 31 Showing Change in Viscosity () of 2.5% Nafion® Solution Using Ultrasonic Probe at 20%, 40 %, 60% and 80 % AMP Over 120 minutes at 25oC
1.54
1.56
1.58
1.6
1.62
1.64
1.66
1.68
1.7
1.72
0 20 40 60 80 100 120 140
Vis
cosi
ty (
X10
-3 p
a.s)
Sonication Time (Mins)
1.86 W
3.84 W
6.42 W
11.28 W
2.5 % Nafion Ultrasonic Probe

72
The 2.5% Nafion® samples were sonicated using ultrasonic probes and bath for irradiation
time periods of 1, 2.5,5, 10, 30, 60 and 120 minutes, the power measurements were
determined for both the ultrasound probe and the ultrasound bath from experiments and are
given in appendix 1a. From the results in figure 31 and table 8 it is apparent that there is a
gradual decrease in the viscosity of Nafion® for all the samples sonicated at different
ultrasound power. For example the viscosity for the ultrasound probe runs show at 0 minute
the starting viscosity was 1.709 x 10⁻³ Pa.s and reduced to 1.570 x 10⁻³ Pa.s after 120 minutes.
The reasoning for this observed trend is the same as discussed above for the 5% Nafion®
solution. When the input power exceeds the cavitation threshold, it results in the increase of
shear forces generated by the rapid motion of the solvent. These shear forces are responsible
for the breakage of chemical bonds within the polymer. However the viscosity measured after
30 minutes of sonication at ultrasound power of 1.86 W shows an increase from viscosity at
10 minutes of sonication, the viscosity measured at 30 minutes ultrasound probe run is 1.69 x
10-3 Pa.s compared with 10 minute sonication of 1.58 x 10⁻³ Pa.s. The reason for this is that
several polymerization studies using ultrasound have been carried out starting with a solution
of polymer. The scission of polymer bonds due to ultrasound (depolymerisation) supplies
new chain carriers for polymerization. Under carefully chosen conditions, it is possible to
initiate polymerization reactions using ultrasound. The products obtained vary depending on
the functional groups present or absent. After 10 minute sonication the percentage
degradation was 7.5% for 2.5% Nafion® sample and because 30 minutes sonication showed
an increase in viscosity we can therefore conclude 7.5% degradation is required to produce
sufficient chain carriers for polymerisation as stated above. Further study is needed to see
how the nature of the product and the polymerization rate changes with conditions, for
example temperature, adducts, impurities, solvents, gases, pulsing of ultrasound, intensity,
frequency, etc. It is, however, possible that ultrasonically-initiated polymerization will prove
to be advantageous for some applications.
Some surprising experimental results show that for low molecular weight polyamide PA6
(LPA6), the viscosity-average molecular weight of LPA6 increases in the presence of
ultrasonic oscillations due to extension reaction of end groups (-COOH and -NH2 The rupture
of molecular chains of HPA6 occurs due to the initial molecular weight being higher than the
critical molecular weight Mn): The degradation of HPA6 melt was divided into three stages,
The viscosity-average molecular weight Mn deceases greatly with irradiation time before 60
s. It increases slowly with irradiation time between 60 and 120 s, and tends to a limiting

73
molecular weight (4.6 x 10⁴) after 120 s. The ultrasonic degradation rate of HPA6 melt is
higher than that of polymer solution, and the degradation kinetics obey the following
equations: (Li 2004)
(37)
(38)
(Li 2004)
The ultrasonic rupture of C-N bond of HPA6 melt causes the formation of new end groups (-
COOH and-NH2). Between 60 and 120 s, the rate of chain extension via end group coupling
is higher than the rupture rate, resulting in an increase of Mn: these results are analogous to
our result for 60 minutes of sonication where the viscosity is increased.(Li 2004), (Berlin
1962)
For the Nafion® solution sonicated at 40% amplitude at a power of 3.84 W there is the same
general trend of a steady decrease in the viscosity of 2.5% Nafion® solution. The sonication
was carried out using the same time periods as given in fig. However the rise in viscosity
occurs at 60 Min instead of 30 mintute sonication. Furthermore the extent of viscosity
reduction and hence the extent of degradation is lower than the 2.5% samples sonicated at
20%AMP and this is because above a certain intensity the increase number of bubbles means
that the ultrasound field does not pass through the solution as efficiently reducing cavitation.
There is also insufficient time between consecutive rarefaction cycles for complete bubble
collapse to take place. Therefore the efficiency of the process falls at high intensity. The
percentage degradation after 30 minute ultrasound exposure was 7.1% and the viscosity
increase was seen at 60 percent due to the same reasons mentioned above. This behaviour
was similar to the 2.5% solution sonicated at 20% amplitude and 1.86W.

74
The 2.5% Nafion® solution sonicated at 60% amplitude at power of 6.42 W shows a steady
decrease in viscosity. The viscosity reduction is apparent from 1 minute sonication upto 60
minute sonication. However at 120 minutes there is a rise in viscosity which means that at
120 minutes there is sufficient scisson of the bonds which provides enough chain carriers for
polymerization and thus the viscosity is seen to increase. It is important to note that in this
case the sudden jump in viscosity occurred at 120 minutes compared to 60 minutes for the 2.5
% sample at 40% Amplitude. This further backs the argument that above certain intensity
ultrasound efficiency is hindered in the medium for reasons discussed above. Most effects
in sonochemistry arise from cavitation. After 60 minute ultrasound the percentage
degradation is 7.02% and the rise in viscosity was therefore seen after 120 minutes of
ultrasound exposure because in order for polymerization to occur in the presence of
ultrasound sufficient chain carriers need to be present for polymerization to occur. From this
we can conclude that for the 2.5% Nafion® solution subjected to ultrasound when
degradation reaches certain percentage at certain ultrasound frequency only can than
polymerization occur and is evident by viscosity rise.
While some consequences of this, such as radical production, are used in making
polymers, the exact origin of the effects, whether from thermal ' hot spots ' or
electrical or corona discharges is relatively unimportant to the polymer chemist .
Most of the effects involved in controlling molecular weight can be attributed to
the large shear gradients and shock waves generated around collapsing cavitation
bubbles. (Price 1994)
The 2.5% Nafion® solution sonicated at 80% amplitude at power of 11.28 W also shows
viscosity reduction however the extent of viscosity reduction and hence degradation is the
lowest for sonication at 80AMP and power of 11.28 W. Secondly there is no sudden rise in
viscosity even after 120 minutes of sonication which means that there are insufficient chain
carriers present for polymerization and therefore sonication needs to be carried out for a
longer period of time to see polymerization effect. This proves two things. Firstly that above
certain intensity ultrasound is ineffective for degradation of Nafion® and secondly the extent
of degradation reduces as the ultrasound power increases.

75
4.2.4. 5% Nafion® Solution Sonicated at Different Powers With US (Probe)
Table 9 Showing Change in Viscosity () of 5% Nafion® Solution Using Ultrasonic Probe at 20%, 40 %, 60% and 80 % AMP Over 120 minutes at 25oC
Power : 1.86 W Power : 3.84 W Power : 6.42 W Power : 11.28 W Ultrasound probe Ultrasound probe Ultrasound probe Ultrasound probe
Sonication Time (Mins)
Change in Viscosity (x10-3 Pa.s)
Change in Viscosity (x10-3 Pa.s)
Chang in Viscosity (x10-3 Pa.s)
Change in Viscosity (x10-3 Pa.s)
0 2.762 2.762 2.762 2.762
1 2.692 2.512 2.53 2.613
2.5 2.106 2.399 2.405 2.568
5 1.943 2.31 2.345 2.456
10 1.765 1.989 2.011 2.12
30 2.543 1.965 1.98 2.132
60 1.696 2.561 1.873 1.983
120 1.687 1.893 2.671 1.887
Figure 32 Showing Change in Viscosity () of 5% Nafion® Solution Using Ultrasonic Probe at 20%, 40 %, 60% and 80 % AMP Over 120 minutes at 25oC
0
0.5
1
1.5
2
2.5
3
0 20 40 60 80 100 120 140
Vis
cosi
ty(X
10-3
pa.
s)
Sonication Time (Mins)
1.86 W
3.84 W
6.42 W
11.28 W
5 % Nafion Ultrasonic

76
From Table 9 and Fig 32 it can be seen that there is a steady decrease in the viscosity of 5%
Nafion® solution sonicated at 20% AMP at power of 1.86 W with ultrasound probe. The
sonication was carried out using the same time periods. The initial viscosity of the 5%
solution without sonication is 2.762 x 10⁻³ Pa.s and it gradually reduces with increase in
sonication length at the above given frequency. From the results it can be seen that after 30
minutes of sonication there is a rise in the viscosity and this is the result of sufficient
scissions of the bonds to produce enough chain carriers for polymerisation and hence the rise
in viscosity. When the molecules are exposed to alternating compression and rarefaction
cycles it results in rapid strike to the molecules resulting in friction which causes bond
rupture in the macromolecules and it believed that this results in the production of
copolymers and these copolymers acts to stabilize the morphological structure. Later on in
the thesis the DSC analysis further backs this fact because the Tg for 5% Nafion® solution at
30 minute sonication at 1.86W showed an increase in Tg which means that the morphology
was improved due to ultrasound. (Chen 2005). After 10 minutes of ultrasound exposure the
percentage degradation is 36% and from 10 minutes onwards sonication time the
polymerization occurs which can be seen due to the rise in viscosity. Therefore the viscosity
of the 30 minute ultrasound sample was higher.
At 120 minutes of sonication the limiting intrinsic viscosity is reached and there is no further
reduction in viscosity. Below the limiting viscosity, the polymer chain was so short that it
followed ultrasonic vibrations flexibly and cleavage at the centre of the molecule did not take
place anymore.
The 5% samples sonicated using ultrasound probe at 40% amplitude show that the initial
viscosity of the 5% sample without sonication is 2.267 x 10⁻³ Pa.s and there is a steady
decrease in the viscosity of the polymer due to degradation following hydrodynamic forces
following cavitational collapse as mentioned earlier. However at 60 minutes sonication there
is an unexpected rise in the viscosity of the Nafion® solution and this can be attributed to the
same reasons discussed above. The percentage degradation after 30 minutes ultrasound
exposure is 28.9% and thus from this point onwards polymerization starts to occur which is
why the rise in viscosity is seen at 60 minutes ultrasound exposure and not 30 minutes. Many
such studies are concerned with production of block copolymer. Because Nafion® is a
copolymer these effects of increase in viscosity due to polymerization under the influence of

77
ultrasound are often seen. Furthermore the Tg for the 5% Nafion® sample showed that there
was an increase in Tg for Nafion® sonicated at 3.84W at 40% amplitude which suggests that
there is a link between the increase in viscosity attained at specific time and ultrasound power
and improvement in polymer morphology backed by DSC results. (Chen 2005)
The 5% Nafion® solution sonicated at 60% AMP at power of 6.42 W with ultrasound probe
was carried out using the same time periods. The extent of viscosity reduction is lower
compared to samples sonicated at 1.86 W and 3.84 W. There is insufficient time between
consecutive rarefaction cycles for complete bubble collapse to take place. Therefore the
efficiency of the process falls at very high intensity. The sudden jump in viscosity occurs
only at 120 minutes and therefore we can conclude that ultrasonic efficiency is hindered due
to the reasons discussed above. The percentage degradation at 60 minutes ultrasound
exposure is 32.2% and therefore the rise is viscosity was only seen at 120 minutes. The 5%
Nafion® solutions followed similar trend to the 2.5% Nafion® solutions and proves that
viscosity increase can only occur after certain level of degradation is achieved to provide
enough chain carriers in order to initiate polymerization. The intrinsic viscosity has not
reached at 120 minutes. Ultrasonic irradiation could be used as a source of free radicals
generation. Acoustic cavitation generates small cavities which grow and collapse in
microsecond. This collapse is an adiabatic process and generates very high local temperatures
(>10,000 K) and pressures (>1000 atm). Because of this extreme environment,
decomposition of water, surfactant, monomers and oligomers take place causing radical
generation which helps in initiating and propagating polymerization.
The 5% Nafion® solution sonicated at 80% amplitude at power of 11.28 W shows that the
extent of viscosity reduction and hence degradation is the lowest for sonication at 80AMP
and power of 11.28 W compared to the other 3 powers. Furthermore there is no jump in
viscosity even after 120 minutes of sonication which suggests that ultrasonic efficiency has
decreased for reasons mentioned before. This trend in change in viscosity is also seen for
2.5% samples sonicated at the same frequency. Therefore the arguments given for the
behaviour of viscosity change seems reliable and it is further backed by similar work done in
the literature.

78
4.2.5. 7.5% Nafion® Solution Sonicated at Different Powers With US (Probe)
Table 10 Showing Change in Viscosity () of 7.5% Nafion® Solution Using Ultrasonic Probe at 20%, 40 %, 60% and 80 % AMP Over 120 minutes at 25oC
Power : 1.86 W Power : 3.84 W Power : 6.42 W Power : 11.28 W Ultrasound probe Ultrasound probe Ultrasound probe Ultrasound probe
Sonication Time (Mins)
Change in Viscosity (x10-3 Pa.s)
Change in Viscosity (x10-3 Pa.s)
Chang in Viscosity (x10-3 Pa.s)
Change in Viscosity (x10-3 Pa.s)
0 6.252 6.252 6.252 6.252 1 6.105 6.108 6.15 6.222 2.5 5.94 6.102 6.139 6.212 5 5.81 5.962 6.124 6.198 10 5.69 5.763 6.052 6.189 30 6.22 5.61 5.986 6.11 60 5.576 6.19 5.892 6.05 120 5.489 5.49 5.451 5.98
Figure 33 Showing Change in Viscosity () of 7.5% Nafion® Solution Using Ultrasonic Probe at 20%, 40 %, 60% and 80 % AMP Over 120 minutes at 25oC
5.4
5.5
5.6
5.7
5.8
5.9
6
6.1
6.2
6.3
0 20 40 60 80 100 120 140
Vis
cosi
ty(x
10
-3p
a.s)
Sonication Time (Mins)
1.86 W
3.84 W
6.42 W
11.28 W

79
The 7.5% solution was made in the same way by keeping a constant volume, the different
samples were sonicated with ultrasound probe and the power measurement for which is given
in appendix 1a.The experimental procedure for mixing the required Nafion® concentration is
given in chapter 3. From the results in table 10 and fig 33 there is a steady decrease in
Viscosity but at 30 minutes there is a sudden rise in viscosity which can be attributed to the
fact that scission of polymer bonds due to ultrasound (depolymerisation) supplies new chain
carriers for polymerization. This effect is seen for other Nafion® concentrations where
unexpected jump in viscosity is seen and therefore we can conclude that polymerization due
to new chain carries results in increase in viscosity of the Nafion® solution.
The 7.5% Nafion® solution sonicated at 40% amplitude and 3.84 W shows a steady decrease
in the viscosity of Nafion®. This is the result of degradation of the polymer which arises
because the growth and explosive collapse of microscopic bubbles. The sound wave
propagates through the fluid result in extreme conditions of temperature (>2000 K) and
pressure (>500 bar) on a microsecond timescale leading to the formation of reactive
intermediates such as radicals. The motion of fluid around the bubbles is rapid resulting in
very efficient mixing and the formation of liquid jets. The rapid motion can result in effective
shear degradation of polymer chains in the vicinity of cavitation bubbles. The initial viscosity
of the 7.5% Nafion® solution is 6.252 x 10⁻³ Pa.s and reduced to 5.490 x 10⁻³ Pa.s. The extent
of degradation is lower compared to Nafion® sonicated for same time intervals at 1.86 W.
The sample sonicated for 60 minutes shows a sudden rise in viscosity and this is attributed to
, the fact that it has convincingly been shown that the use of high intensity ultrasound can
significantly enhance reactivity in these polymerisations. A number of factors associated with
sonication of polymer systems could account for these results. Sonication can promote very
efficient mass transfer and mixing. In other polymerizations, it has been demonstrated that
this can lead to good distribution of catalysts through reactants leading to efficient initiation
Of polymerisation.(Gareth J 2003). There is similarity between the trend in viscosity
reduction and thus degradation for 7.5% and 5% Nafion® solution, for example both
concentrations follow the same trend for 1.86W and 3.84W. The sonicated sample at 1.86W
shows rise in viscosity at 30 minutes ultrasound exposure and the sample sonicated at 3.84
shows increase in viscosity after 60 minutes exposure similar to the 5% trend. This suggests
that desirable morphological changes do take place due to ultrasound initiating formation of

80
copolymers for stable morphology. It is expected that DSC analysis would therefore show an
increase in Tg similar to the 5% solution.
The 7.5% Nafion® solution sonicated at 60% amplitude at power of 6.42 W again showed a
similar trend of viscosity reduction, the reasons for viscosity reduction and hence degradation
is the same as discussed previously. The extent of viscosity reduction and hence degradation
is lower compared to sonicating at 1.86 and 3.84 W. there are no sudden viscosity increase
firstly because ultrasonic efficiency decreases at higher intensity, and secondly the solution
concentration has increased which means the strength of the solution is strong.
The 7.5% solution sonicated at 80% amplitude and 11.28 W it shows a steady decrease in the
viscosity. The extent of viscosity reduction and hence degradation is the lowest for sonication
at 80AMP and power of 11.28 W compared to sonication at 20, 40 and 60% AMP.
Furthermore there is only reduction in viscosity and no sudden increases in viscosity for
reasons mentioned before. In general, it has been found that polymer chains cleave
preferentially near their centres. Higher molecular weight fractions degrade faster than
ones of lower molecular weight, and a lower molecular weight limit exists below which
no further degradation occurs. no depolymerisation occurred at intensities below the
threshold of cavitation and in solutions that had been degassed to prevent cavitation.
However, in some cases frictional forces between polymers and solvent molecules may be
sufficient for chain scission, and both mechanisms may occur simultaneously. Shear stresses
during stable cavitation arise from the movement of solvent molecules around resonating
bubbles. Transient cavitation generates intense shock waves during bubble collapse. The
flow of solvent in the vicinity of resonating bubbles places the polymer chains under
stress, and the shock waves due to bubble collapse lead to polymer breakage.(Riesz and
Kondo 1992). Lastly the 7.5% Nafion® solutions showed similar trend to the 2.5% and 5%
Nafion® solutions subjected to ultrasound and it was shown again that after the percentage
degradation reaches a certain value only can than viscosity increase due to polymerization be
seen.

81
4.2.6. 10% Nafion® Solutions Comparison between Bath and Probe
The 10% solution was made in the same way by keeping a constant volume, the different
samples were sonicated with ultrasound probe and bath and the power measurement for
which is given in appendix 1a. From the results in table 11 and fig 34 it can be seen that the
viscosity of the 10% Nafion® solution is higher than 2.5%, 5 % and 7.5% as expected
because the increase of polymer concentration increases the viscosity of the polymer solution.
It can also be seen that the extent of degradation is reduced because increase of polymer
concentration increases the viscosity of the polymer solution. The intensity of cavitation falls
down with an increase in the viscosity of the medium. As the formation of cavitation in the
liquid requires that the negative pressure in the rarefaction region of wave function must
overcome the natural cohesive forces acting within the liquid. Cavitation is more difficult to
produce in viscous liquids, where the cohesive forces are stronger. The initial viscosity for
10% solution without sonication is 11.390 x 10⁻³ Pa.s and reduces to 3.308 x 10⁻³ Pa.s after 2
hour of sonication and if this is compared to the 2.5% solution the viscosity reduces to 1.538
x 10-3 pa.s therefore it confirms the above explanation. Another thing to point out is that in
the 10% Nafion® solution there is no sudden increases in viscosity, like it was seen for the
2.5% Nafion® solution, where the viscosity measured after 60 minutes of sonication showed
an increase from viscosity at 30 minutes of sonication. The viscosity measured at 60 minutes
ultrasound probe run is 1.909 x 10⁻³ Pa.s compared with 30 minute sonication of 1.709 x 10⁻³.
Under carefully chosen conditions, it is possible to initiate polymerization reactions using
ultrasound. The reason why we do not get increases in viscosity is because at high
concentrations, entanglements influence the energy transfer processes between solvent and
polymer and appears to reduce the probability of degradation and therefore the extent of
degradation reduces which is why there are not significant amount of new chain carriers for
polymerization. Therefore the viscosity only reduces but does not increase in the 10%
Nafion® solution. From the results it can be seen that ultrasound probe degrades the polymer
more compared to ultrasound bath because the ultrasound bath power is considerably less.

82
Table 11 Showing Comparison between Changes in Viscosity () of 10% Nafion® Using Ultrasonic Probe vs Ultrasound Bath Over 120 minutes at 25oC
Viscosity (x10-3 Pa.s)
Power: 0.32 W Power: 1.86 W
Sonication Time Bath Probe 0 11.390 11.39 1 4.203 11.01 2.5 4.206 10.43 5 3.814 9.87 10 3.623 7.65 30 4.333 4.57 60 4.078 4.03 120 3.374 3.308
Figure 34 Showing Comparison between Changes in Viscosity () of 10% Nafion® Using Ultrasonic Probe vs Ultrasound Bath Over 120 minutes at 25oC
0
2
4
6
8
10
12
0 20 40 60 80 100 120 140
Vis
co
sit
y (
x 1
0-3
pa
.s)
Sonication Time (Mins)
Bath Probe
Ultrasonic Probe Power : 1.86 W Ultrasonic Bath Power: 0.32 W
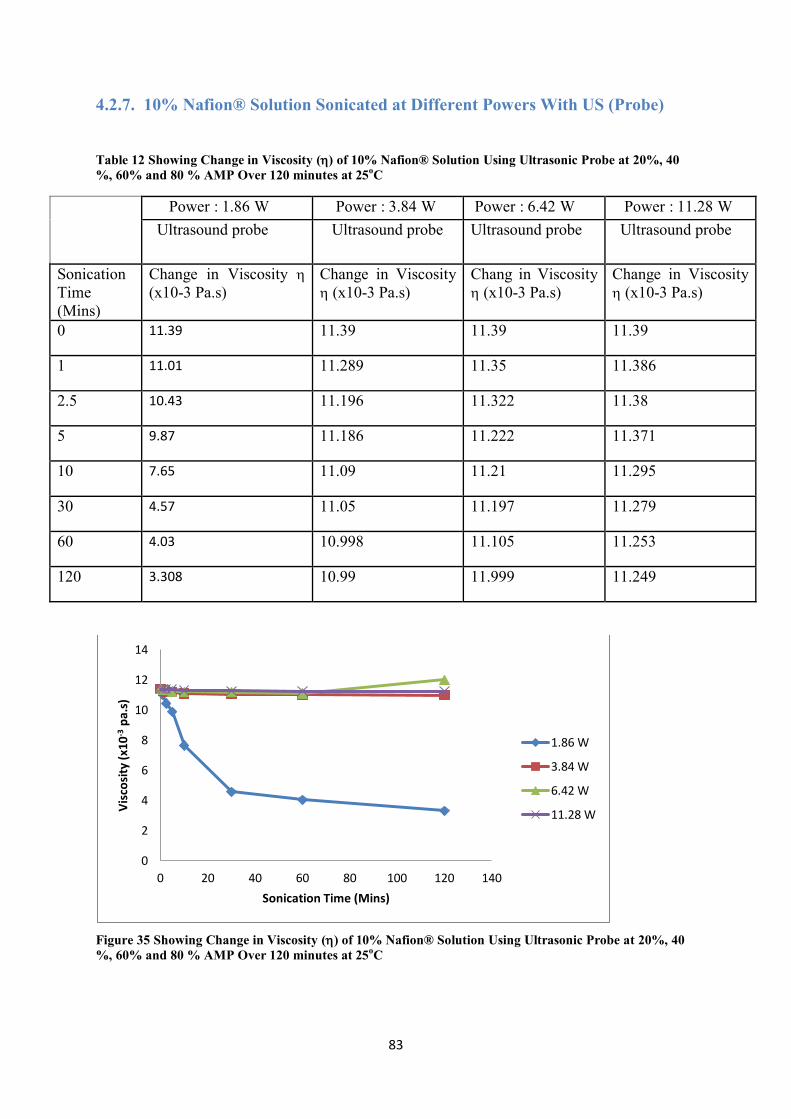
83
4.2.7. 10% Nafion® Solution Sonicated at Different Powers With US (Probe)
Table 12 Showing Change in Viscosity () of 10% Nafion® Solution Using Ultrasonic Probe at 20%, 40 %, 60% and 80 % AMP Over 120 minutes at 25oC
Power : 1.86 W Power : 3.84 W Power : 6.42 W Power : 11.28 W Ultrasound probe Ultrasound probe Ultrasound probe Ultrasound probe
Sonication Time (Mins)
Change in Viscosity (x10-3 Pa.s)
Change in Viscosity (x10-3 Pa.s)
Chang in Viscosity (x10-3 Pa.s)
Change in Viscosity (x10-3 Pa.s)
0 11.39 11.39 11.39 11.39
1 11.01 11.289 11.35 11.386
2.5 10.43 11.196 11.322 11.38
5 9.87 11.186 11.222 11.371
10 7.65 11.09 11.21 11.295
30 4.57 11.05 11.197 11.279
60 4.03 10.998 11.105 11.253
120 3.308 10.99 11.999 11.249
Figure 35 Showing Change in Viscosity () of 10% Nafion® Solution Using Ultrasonic Probe at 20%, 40 %, 60% and 80 % AMP Over 120 minutes at 25oC
0
2
4
6
8
10
12
14
0 20 40 60 80 100 120 140
Vis
cosi
ty (
x10
-3 p
a.s)
Sonication Time (Mins)
1.86 W
3.84 W
6.42 W
11.28 W

84
From the results in table 12 and fig 35 it can be seen that the viscosity of the 10% Nafion®
solution is higher than 2.5%, 5 % and 7.5% as expected because the increase of polymer
concentration increases the viscosity of the polymer solution. It can also be seen that the
extent of degradation for 10% solution sonicated at 1.86W at 20% amplitude is reduced
because the increase of polymer concentration. The initial viscosity for 10% solution without
sonication is 11.390 x 10⁻³ Pa.s and reduces to 3.308 x 10⁻³ Pa.s after 2 hour of sonication.
The reason why there is sudden increases in viscosity is because at high concentrations,
entanglements influence the energy transfer processes between solvent and polymer and
appears to reduce the probability of degradation and therefore the extent of degradation
reduces which is why there are not significant amount of new chain carriers for
polymerization. Therefore the viscosity only reduces but does not increase in the 10%
Nafion® solution. The ultrasonic power of 1.86 W at 20% amplitude was the most effective
in reducing the polymer viscosity because higher intensities of ultrasound are not always
effective due to reasons mentioned earlier. Furthermore the 10% Nafion® solution sonicated
at 1.86 W at 20% Amplitude showed that the Tg was reduced from 148oC to 141oC at 120
minute sonication time and from 148oC to 144oC at 60 minutes sonication time. This further
backs the fact that there is a link between the degradation and Tg. As the 10% Nafion®
solution at 20% Amplitude and 1.86W only showed degradation due to reduction in viscosity
therefore the glass transition temperature was also reduced. If there were any sudden
increases in viscosity during different sonication times than most likely this would also have
shown an increase in Tg as seen for the 2.5% Nafion® solution. The DSC graphs later on in
the thesis shows this decrease in Tg and are given in figure 50 and figure 51.
The viscosity of the other 10% Nafion® solutions sonicated at powers of 3.84 W, 6.42W and
11.42W at amplitudes of 40, 60 and 80% showed the general trend of steady viscosity
reduction due to degradation and there were no sudden jumps in viscosity.
The extent of viscosity reduction for these 10% solutions was not as high as the 10%
Nafion® solution sonicated at 20% amplitude at power of 1.86 W due to ultrasound field
being ineffective due to increased bubble formation. The Tg of the 10% Nafion® solutions at
all the different ultrasound powers and time ranges did not show any change in the Tg.
Because from the viscosity experiments using Rheometer the trend was only a decrease in
viscosity attributed to degradation and because there was no increase in viscosity it can be

85
concluded that there were no copolymers formed in the 10% solution at other ultrasonic
powers used in the experiments.
Figure 36 Graph showing comparison between change in viscosity () for different concentration Nafion® solutions sonicated with 20%AMP ultrasound probe over 120 minutes at 25oC
4.2.8. Viscosity Variations between Overnight and Fresh samples
The 5% ultrasound bath samples were analysed to see repolymerisation of the Nafion®
polymer. The fresh sonicated samples were compared to the ones left overnight to see
repolymerization by measuring the change in viscosity of the different samples. From the
results in table 13 and fig 37 it can be seen that after 2 hours of sonication the viscosity
measured was 1.845x 10⁻³ Pa.s for the fresh sample and the viscosity of 2 hour sonicated
sample which was left overnight is 1.820 x 10⁻³ Pa.s and therefore we can conclude that the
Nafion® polymer if left overnight does not repolymerise. This is because the difference in
viscosity is not significant. The same trend is seen for different time intervals of fresh and
overnight samples where the difference in viscosity is not very significant and the
explanation for this can be that prolonged exposure of solutions of macromolecules to high-
energy ultrasonic waves produces a permanent reduction in viscosity. Even when the
0
2
4
6
8
10
12
0 50 100 150
Vis
co
sit
y (
x 1
0-3
pa
.s)
Sonication Time (Mins)
10% Nafion Solution
7.5% Nafion Solution
5% Nafion Solution
2.5% Nafion Solution
Ultrasonic Probe Power: 1.86 W

86
irradiated polymers are isolated and redissolved their viscosity remains low in comparison
with that of non-irradiated solutions. This effect is seen in these results because the polymer
viscosity remains low in comparison to the fresh sonicated samples and the original Nafion®
viscosity. Another thing to point out is that during the ultrasound exposure the polymer
degrades initially however at specific intensity and time frame of exposure the rise in
viscosity is seen due to repolymerisation, but this can only occur during sonication where
ultrasound causes the breakage of macromolecules that results in the formation of copolymers
which can be seen as a rise in viscosity. However in the absence of ultrasound this cannot be
achieved. This is backed by work done by Chen et al.(Chen 2005)
5% US bath 0.32 W
Table 13 Showing variations in Viscosity () of 5% Nafion® Using Ultrasonic Bath Over 120 minutes vs Overnight Sample at 25oC
Time (min) Viscosity (x10-3 Pa.s) Overnight
0 2.267
1 2.170 1.878
2.5 1.943
5 1.808 1.943
10 1.967
30 1.949 1.809
60 1.847
120 1.845 1.820

87
Figure 37 Showing Difference in Viscosity () of 5% Nafion® Using Ultrasonic Bath Over 120 minutes vs
Overnight Sample at 25oC
Figure 38 Bar Chart showing comparison between fresh and overnight Nafion® Solution in water and
THF
1.80
1.90
2.00
2.10
2.20
2.30
0 20 40 60 80 100 120
Vis
co
sit
y (x
10
-3 p
a.s
)
Sonication Time (Mins)
Overnight Fresh
Ultrasonic Bath Power : 0.32 W
0 0.5 1 1.5 2 2.5 3 3.5 4 4.5 5 5.5 6 6.5 7
Nafion in H2O (fresh)
Nafion in H2O (ON)
Nafion in THF (fresh)
Nafion in THF (ON)
Viscosity (x10-3 Pa.s)
Solu
tio
ns
Comparison between fresh and overnight Nafion solutions in water and THF

88
4.2.9. DSC ANALYSIS
The physical properties of polymer materials depend highly on their glass transition
temperature (Tg). When the temperature is lower than Tg, the polymer is in its glassy state
and when the temperature is higher than Tg, it is in its rubber or viscous liquid state. A
sudden change of the physical properties takes place in the glass transition region.
(Balakrishnan and Guria 2007), Tg, of polymers is determined by measuring the heat
capacity (differential scanning calorimetric analysis) or the thermal expansion
(thermomechanical analysis). More techniques have also been proposed, such as
thermodielectric or thermogravimetric analysis. The glass transition phenomena happens in a
fairly large temperature range and the different characterization methods do not all give the
same values of Tg. Some allow determination of the beginning of the transition; others detect
the middle or the final temperature.(Balakrishnan 2007).(Weir 2004)
An understanding of the degree of crystallinity for a polymer is vital because crystallinity
affects physical properties such as storage modulus, permeability, density and melting
temperature. Whereas most of these manifestations of crystallinity can be determined, a direct
measure of degree of crystallinity provides a fundamental property from which these other
physical properties can be predicted.(Price 1994). (Weir 2004)
In the experiments several different sample of Nafion® were analysed by differential
scanning calorimetry in order to investigate the effect of ultrasonic irradiation on the physical
properties of the polymer in question. The results in fig 39 to fig 49 shows that upon
sonicating the Nafion® polymer there is a shift in the glass transition temperature by 8oC for
some of the polymer samples. While for some samples there is no change in the Tg. The
different samples were prepared in the same way and the only difference between the
different samples were ultrasonic irradiation time and power. This study therefore confirms
that ultrasound can shift the glass transition temperature of polymers and this is backed by
similar work on other polymers in the literature. For example the glass transition temperature
of the Nafion® polymer in the literature is around 148oC and from the results the sample
analysed without sonication agrees with this result. The highest change in the glass transition
occurs for the 5% Nafion® sample sonicated for 30 minutes US probe 20% amplitude where
the glass transition temperature changed from the literature value of 148oC to 156oC figure
41, and the explanation for this could possibly be that mechanochemical methods such as

89
ultrasound can modify homopolymers by production of blocks and grafts by using
mechanochemical decomposition.
Ultrasound can significantly improve the toughness of polymer blends, and this effect is due
to structural changes of the Nafion® chains. Ultrasound makes the molecular chains of
Nafion® disentangled and orientated; Ultrasound increases the degree of order in the melt,
and thus increases the crystallinity of the two phases when the blend cools down. This
increase in the Tg is seen for some other sonicated samples where the ultrasound irradiation
causes a shift in Tg in exactly the same manner. These results mean that ultrasound improves
the durability of Nafion® upto certain extent. Because unsonicated Nafion® has a glass
transition temperature of 148oC which means at this temperature it phase changes and the
increase from 148 to 155 means that the phase change occurs at 155 rather than 148oC .The
fact that high temperatures are desirable for a better efficiency and CO tolerance ultrasound
can thus prove to be advantageous in fuel cells. In general the higher the Tg of a material the
longer its thermal stability.(Chen 2005) , (Berlin 1962).
From the results explained above where ultrasound treatment of Nafon has increased the
glass transition temperature for some samples at specific irradiation power and time, however
the opposite is seen for some other different sample where ultrasonic power and time change
results in decrease in the glass transition temperature. For example the most significant
decrease in the glass transition temperature is seen for 10% Nafion® solution at 60%
amplitude where the Tg is changed from 148 of the original Nafion® Tg to 143oC after
sonication and this can be attributed to the damage by generation of heat, at 60% amplitude
there may be separate particles but generation of heat may cause scission of chains thereby
reducing Tg. This coincides well with literature where at 70% amplitude there was a decrease
in Tg observed. From these results we can confirm that under certain conditions of irradiation
and time Tg will increase and by changing the irradiation power the Tg will decrease for
reasons mentioned above. However as we know increase in Tg results in better thermal
stability, therefore the irradiation power and time of interest to us is where the glass transition
temperature increases.(Goyat 2011).From fig 46 to fig 49 we can see that there is no shift in
the glass transition temperature from the literature value of 148oC. Fig 50 and fig 51 shows
the decrease in glass transition temperature from 148oC to 141oC for 10% Nafion® sonicated
at 1.86W at 20% Amplitude at 120 minutes, and from 148oC literature value to 144oC at
1.86W at 20% Amplitude sonicated for 60 minutes Us probe.
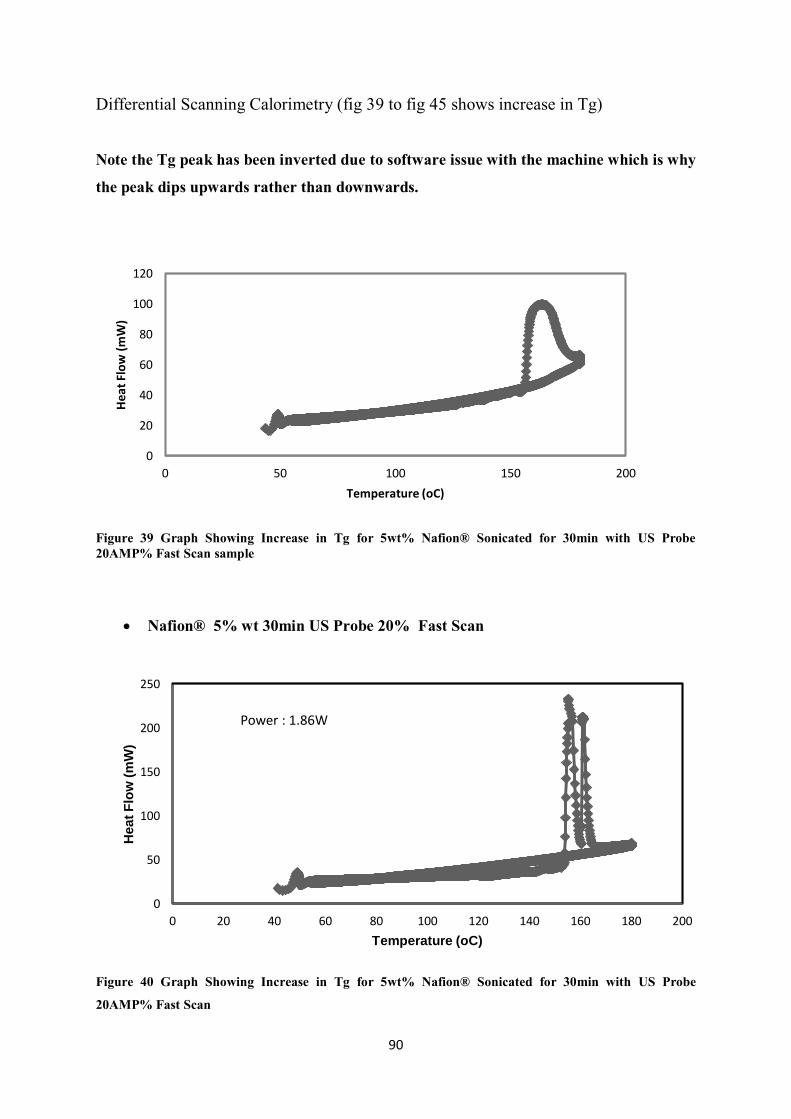
90
Differential Scanning Calorimetry (fig 39 to fig 45 shows increase in Tg)
Note the Tg peak has been inverted due to software issue with the machine which is why
the peak dips upwards rather than downwards.
Figure 39 Graph Showing Increase in Tg for 5wt% Nafion® Sonicated for 30min with US Probe 20AMP% Fast Scan sample
Nafion® 5% wt 30min US Probe 20% Fast Scan
Figure 40 Graph Showing Increase in Tg for 5wt% Nafion® Sonicated for 30min with US Probe
20AMP% Fast Scan
0
20
40
60
80
100
120
0 50 100 150 200
Hea
t Fl
ow
(m
W)
Temperature (oC)
0
50
100
150
200
250
0 20 40 60 80 100 120 140 160 180 200
Hea
t F
low
(m
W)
Temperature (oC)
Power : 1.86W

91
Nafion® 5%wt 30min US Probe 20% Fast Scan 2nd sample
Figure 41 Graph Showing Increase in Tg of Nafion® 5% wt Sonicated for 30min with US Probe 20%
Fast Scan 2nd sample
Nafion® 5% wt 30min US Probe 20% Fast Scan 3rd sample
Figure 42 Graph Showing Increase in Tg for Nafion® 5% wt Sonicated for 30min with US Probe 20%AMP Fast Scan 3rd sample
0
20
40
60
80
100
120
0 50 100 150 200
Hea
t F
low
(m
W)
Temperature (oC)
Power : 1.86W
0
20
40
60
80
100
120
0 50 100 150 200
Hea
t F
low
(m
W)
Temperature (oC)
Power : 1.86 W

92
Nafion® 5% wt 60min US Probe 40% Fast Scan sample 1
Figure 43 Graph Showing Increase in Tg for Nafion® 5% wt sonicated for 60min using US Probe 40
AMP% Fast Scan sample 1
Nafion® 5% wt 60min US Probe 40% Slow Scan sample 2
Figure 44 Graph showing Increase in Tg for Nafion® 5% wt Sonicated for 60min using US Probe
40%AMP Slow Scan sample 2
0
20
40
60
80
100
120
140
0 50 100 150 200
Hea
t F
low
(m
W)
Temperature (oC)
Power : 3.84W
0
20
40
60
80
100
120
140
0 20 40 60 80 100 120 140 160 180 200
He
at
Flo
w (
mW
)
Temperature (oC)
Power : 3.84 W

93
Nafion® 5% wt 60min US Probe 40% Slow Scan sample 3
Figure 45 Graph Showing Increase in Tg for Nafion® 5% wt Sonicated for 60min using US Probe
40%AMP Slow Scan sample 3
Nafion® 10% in THF 20 Min Us Probe 40% (Fig 46 to Fig 49 no change in Tg)
Figure 46 Graph Showing no change in Tg for Nafion® 10% in THF Sonicated for 20 Min with Us Probe
40%AMP
0
50
100
150
200
250
0 50 100 150 200
Hea
t F
low
(m
W)
Temperature (oC)
Power : 3.84 W
0
50
100
150
200
250
300
0 50 100 150 200
Hea
t F
low
(m
W)
Temperature (oC)
Power : 3.84 W
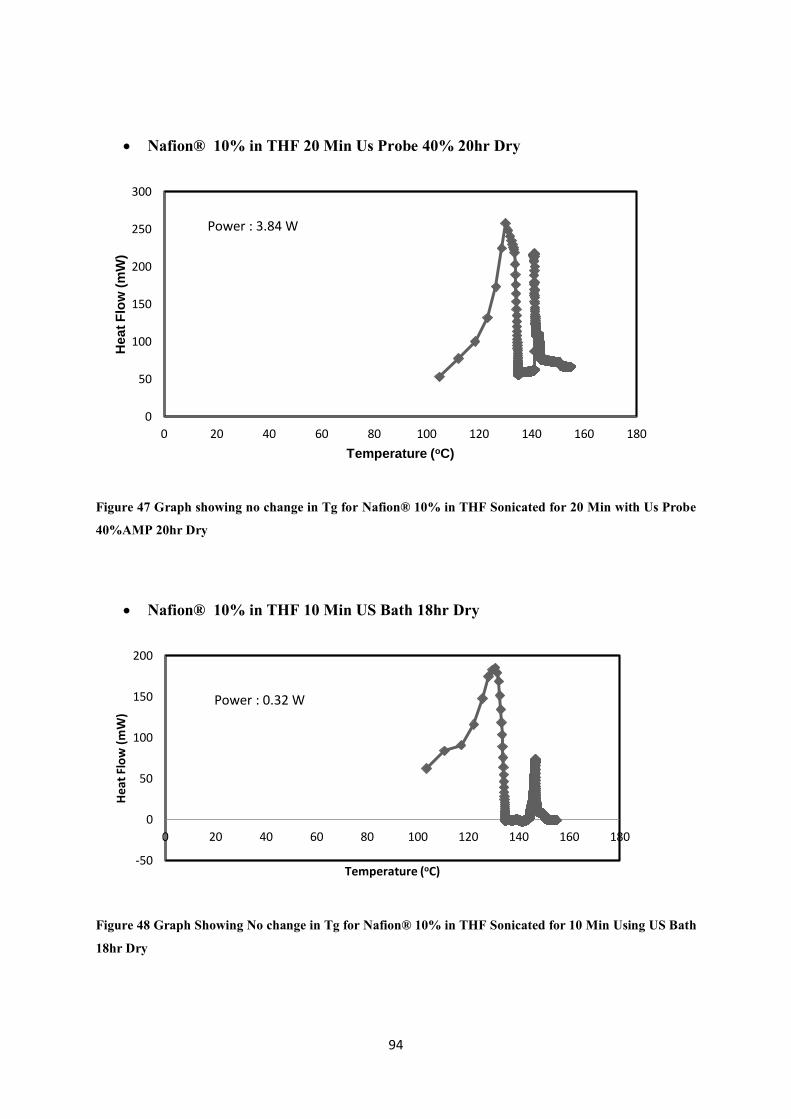
94
Nafion® 10% in THF 20 Min Us Probe 40% 20hr Dry
Figure 47 Graph showing no change in Tg for Nafion® 10% in THF Sonicated for 20 Min with Us Probe
40%AMP 20hr Dry
Nafion® 10% in THF 10 Min US Bath 18hr Dry
Figure 48 Graph Showing No change in Tg for Nafion® 10% in THF Sonicated for 10 Min Using US Bath
18hr Dry
0
50
100
150
200
250
300
0 20 40 60 80 100 120 140 160 180
Hea
t F
low
(m
W)
Temperature (oC)
Power : 3.84 W
-50
0
50
100
150
200
0 20 40 60 80 100 120 140 160 180
Hea
t Fl
ow
(m
W)
Temperature (oC)
Power : 0.32 W

95
Nafion® 10% in THF 10 Min Us Probe 40%
Figure 49 Graph Showing No change in Tg for Nafion® 10% in THF Sonicated for 10 Min Using Us
Probe 40%AMP
Nafion® 10% in THF 60 And 120 Min Us Probe 20% (Fig 50 to Fig 51 Decrease in Tg)
Figure 50 Graph Showing Decrease in Tg for 10% Nafion® in THF Sonicated for 120 Min Using Us Probe 20% AMP
0
20
40
60
80
100
120
140
160
180
200
0 50 100 150 200
Hea
t F
low
(m
W)
Temperature (oC)
Power : 3.84 W
0
50
100
150
200
250
300
350
0 20 40 60 80 100 120 140 160
Hea
t Fl
ow
(m
W)
Temperature oC
Power: 1.86 W

96
Figure 51 Graph Showing Decrease in Tg for 10% Nafion® in THF Sonicated for 60 Min Using Us Probe 20% AMP
4.2.10. Summary of the 4 different Nafion® concentrations at 4 different powers
Extensive range of experiments were performed on different Nafion® concentrations at
various ultrasonic powers and time ranges in order to see Nafion® functionality in PEMFC’s
using ultrasound, and to see if ultrasound could have a beneficial effect in fuel cell
operations.
From the discussion above it was seen that in all the 4 different Nafion® concentration
sonicated the general trend was initial decreases in viscosity due to degradation of the
polymer. However at certain ultrasound frequency the viscosity showed an increase due to
the reasons explained above. Thermal and rheological studies show that the morphology of
the Nafion® polymer is strongly dependent on the sonication time and frequency. As we
have found in this study that at certain time and frequency of ultrasound irradiation the
viscosity and glass transition temperature were shown to increase, the possible explanation
for this is that Upon irradiation of ultrasound, molecules are exposed to alternate compression
and expansion modes, by which bubbles are formed and eventually collapsed. On the
molecular level, this implies a rapid strike to the molecules impeded by surrounding
molecules cannot adjust. Thus, friction is generated which causes strain and eventually bond
0
50
100
150
200
250
300
0 20 40 60 80 100 120 140 160
Hea
t Fl
ow
(m
W)
Temperature (oC)
Power : 1.86 W

97
rupture in the macromolecules. Therefore, it is supposed that in situ copolymers are formed
from Nafion® macroradicals that occur with ultrasonic irradiation in this study. The
copolymers act as a compatibilizer to improve and stabilize the morphological structure. This
study enabled us to see what conditions are required to get desirable use out of ultrasound for
future fabrication of Nafion®. It is noted that there is a trend between viscosity increase due
to sonication at certain frequency and time and stabilisation of the polymer. In other words
sonication at certain frequency and time period shows better stability of the polymer as
shown by increase in Tg.
Table 14 Table showing increase and decrease in Tg for different Nafion® samples at different experimental condition
Nafion® Solution
(conc %)
Ultrasound
Power (W)
Irradiation Time
(Mins)
Original Tg (oC) Tg(oC) after sonication
5 1.86 30 148 156
5 1.86 60 148 155
10 3.84 20 148 148
10 0.32 10 148 148
10 3.84 10 148 148
10 1.86 120 148 141
10 1.86 60 148 144
From table 14 above it can be seen that the most desirable frequency and irradiation time of
ultrasound is 1.86 W at 30 minutes for the 5% Nafion® solution followed by 60 minutes
irradiation time. Each of the result given above was repeated 3 times in order to ensure the
results were reliable. From this we can establish for the fabrication of Nafion® polymer for
fuel cell use would require Nafion® to be sonicated for 30 or 60 minutes at irradiation power
of 1.86 W. The increase in Tg can be explained due to the fact that When ultrasound is
applied, its powerful vibration, shatter and cavitations disperse Nafion® matrix and help the
molecules near the interface penetrate and entangle with each other. This ultrasonic-induced
structure is beneficial to stress transfer and energy dissipation in the whole system, which
may lead to improved mechanical properties. The use of ultrasound vibration showed the
crystallinity of Nafion® phase was larger than that of the non sonicated sample. Ultrasound
makes the molecular chains of Nafion® disentangled and orientated; it increases the degree

98
of order in the melt, and so increases the crystallinity of the different phases when the blend
cools down. Ultrasonic vibration, is a mechanochemical method, it has found a widespread
use in polymer processing. Ultrasound is evident for effects on accelerating chemical
reaction, increasing productivity, and improving properties of polymer materials.
Studies have already showed that extrusion of rubber using ultrasound has showed better
stability, productivity and good surface quality.(Chen 2005)
Additionally at higher ultrasound Power and amplitude the opposite effect was seen where
the Tg showed a decrease in the literature value of 148oC to 141oC. The intensity of
sonication is proportional to the amplitude of vibration of the ultrasonic source and, as such,
an increment in the amplitude of vibration will lead to an increase in the intensity of vibration
and to an increase in the sonochemical effects. To achieve the cavitation threshold a
minimum intensity is required. This means that higher amplitudes are not always necessary to
obtain the desired results. In addition, high amplitudes of sonication can lead to rapid
deterioration of the ultrasonic transducer, resulting in liquid agitation instead of cavitation
and in poor transmission of the ultrasound through the liquid media. Equilibrium should be
attained between the intended effects and sonication amplitude since, as explained above,
high amplitudes lead to high sonication intensities and high sonication intensities can
promote some undesired effects such as degradation of polymer. (Hugo Miguel Santos 2009)
4.2.11. Advantage of Increase in Tg of Nafion®
As mentioned earlier common fuel cells contain Nafion® membrane which degrades at
higher temperatures this means that the PEM fuel cells can only be operated at certain
temperatures. Although higher temperatures are desirable for fuel cell operation because it
reduces CO poisoning of the catalyst, therefore the use of ultrasound for the fabrication of
membranes that show better thermal stability would be extremely important. As our results
show increase of the Tg for certain samples following ultrasound irradiation therefore
suggests that ultrasound can be of extreme importance in fabrication of Nafion® membranes.
An increase in Tg means better thermal stability because the Nafion® phase change occurs at
a higher temperature than the usual of 148oC.

99
4.2.12. GC/MS Analysis of Sonicated Samples
The sonicated samples were analysed with GC/MS in order to understand the ultrasound
induced degradation of Nafion® polymer. Gas Chromatography (GC) is used to separate
volatile components of a mixture. A small amount of the sample to be analyzed is drawn up
into a syringe. The syringe needle is placed into a hot injector port of the gas chromatograph,
and the sample is injected. The injector is set to a temperature higher than the components’
boiling points. This is so that components of the mixture evaporate into the gas phase inside
the injector. A carrier gas, such as helium, flows through the injector and pushes the gaseous
components of the sample onto the GC column. The separation of the components takes
place within the column. Molecules partition between the carrier gas (the mobile phase) and
the high boiling liquid (the stationary phase) within the GC column. (Hao 2007, Watanabe
2009).The Nafion® samples were prepared in the same manner and then sonicated for
various time periods, including a control sample which was not sonicated to be used as
reference.(Anna Carlsson 2011). The analysed samples with the GC/MS spectrums are given
in appendix 1b:-
From the GC spectrums for all the 4 samples there is only one peak evident at retention time
of 21.01 which corresponds to a compound known as Butylated Hydroxytoluene. This
conclusion was reached by searching for the most likely compound at the specified retention
time from ‘The Compound Library’. This is further backed by the spectrum of MS which
corresponds to the same compound. (Shertzer 1991)
The Butylated Hydroxytoluene is used as an antioxidant in the membrane and is therefore
evident in all the spectrums. However from the results there are no other conclusive peaks
present that show the degradation segments following ultrasound irradiation and therefore we
were unable to recognize any degradation products following ultrasound treatment, there
could be a number of reasons for the inconclusive information from GC/MS.
The solvent amount used might have been used in excess which results in the sample being
too diluted and therefore no sample peaks can be seen. The syringe used for injecting the
sample into the GC probably had air bubbles in the syringe which results in the peaks to be
really small on the chart recorder. Another reason for no peaks could be that the polymer
fragments might have been too big for GC/MS to detect. Because the sample to be tested
needs to dissolve well in the solvent for the GC/MS analysis to show any peaks, but if it does

100
not dissolve than it can not show any peaks. Due to the reasons discussed and inconclusive
results from the GC/MS about the degradation mechanism of Nafion® following ultrasonic
irradiation, it was decided to use Solid State NMR spectroscopy for identifying the
sonochemical degradation mechanism. Thermal, mechanical and chemical degradation modes
have been successfully identified with Solid State NMR spectroscopy. Therefore it is
considered as the best way of finding sonochemical degradation, however because the Solid
State NMR facility was not available at the University of Birmingham and the duration of the
course was only a year it was not possible to carry out this analysis.

101
5. CHAPTER 5 KINETICS
5.1. Kinetics of Degradation
In the experiments, the effect of different solution concentration at various times on the rate
of degradation was investigated. Kinetics of degradation was studied by viscometry method.
The calculated rate constants indicate that degradation rate of Nafion® solutions decreases
with increasing of solution concentration. With increasing solution concentration, viscosity
increases and it causes a reduction in the cavitation efficiency thus, the rate of degradation
decreases. It was also noted that there is a steady decrease in viscosity with increase in time
of sonication but at certain time and sonicating power the viscosity increased for reasons
explained above.(Taghizadeh 2003)
There is no evidence that there is any interaction between the sound waves and the polymer
chains. The degradation arises as a result of the effect of the ultrasound on the solvent. The
passage of the longitudinal sound wave through a liquid can be described in terms
of the acoustic pressure in the liquid, PA, represented by:(Taghizadeh 2003)
πvt) (39)
Where PM and are amplitude and frequency of the sound wave, respectively. When PM is
sufficient to overcome the intermolecular forces in the solution, alternate rarefaction and
compression phases by sound wave that pass through a liquid cause cavitation. Formation,
growth and rapid collapse of microscopic bubbles generate high temperatures and pressures
during bubble collapse. Considering the collapse as an adiabatic process leads to the
following for maximum temperature, Tmax, and pressure, Pmax, generated during cavitation:
(40)
(41)

102
Where T is the ambient temperature, P the pressure in the bubble before collapse and c the
polytropic ratio (the ratio of the specific heat capacities at constant pressure and volume) of
the solvent vapour. These equations predict the values in the region of several thousand
Kelvin and several hundred atmospheres, depending on the system. These extreme conditions
are primarily responsible for sonochemical reaction. In a dilute solution, the role of the
generated heat is probably of minor importance for polymer degradation. Accordingly since
the hot regions are highly localized and should be quenched in less than l s, the polymer
molecules do not have time to diffuse and to reach these spots in such a short interval. Above
a threshold sound intensity, bubbles are created and increased in size until a critical diameter
of order 250 m reached. The bubble becomes unstable above that size and collapses
violently in a time-scale of 20 s. Several mathematical treatments have been derived to
describe bubble wall motion during the implosive collapse. An approximate equation
describing the wall velocity, VR, is given by:(Taghizadeh 2003)
(
(
- 1) (42)
Where is the solvent density, Ph is the external pressure, Rm is the maximum radius of the
bubble and R is the instantaneous radius of the imploding cavity. However, R reaches a
minimum radius of the order 0.5 m during the final collapse. The motion of the wall of
imploding bubble causes the movement of the solvent molecules around the bubbles. These
movements set up large shear fields that are primarily responsible for the degradation of
polymer.(Taghizadeh 2003)
5.2. Calculation of Rate Constants for Different Ultrasound Powers
Kinetics of polymer degradation under stress could be expressed as Eq.(43) according to Li
et al, which is used in this work to describe the kinetics of ultrasonic degradation:(Li 2005)
(43)
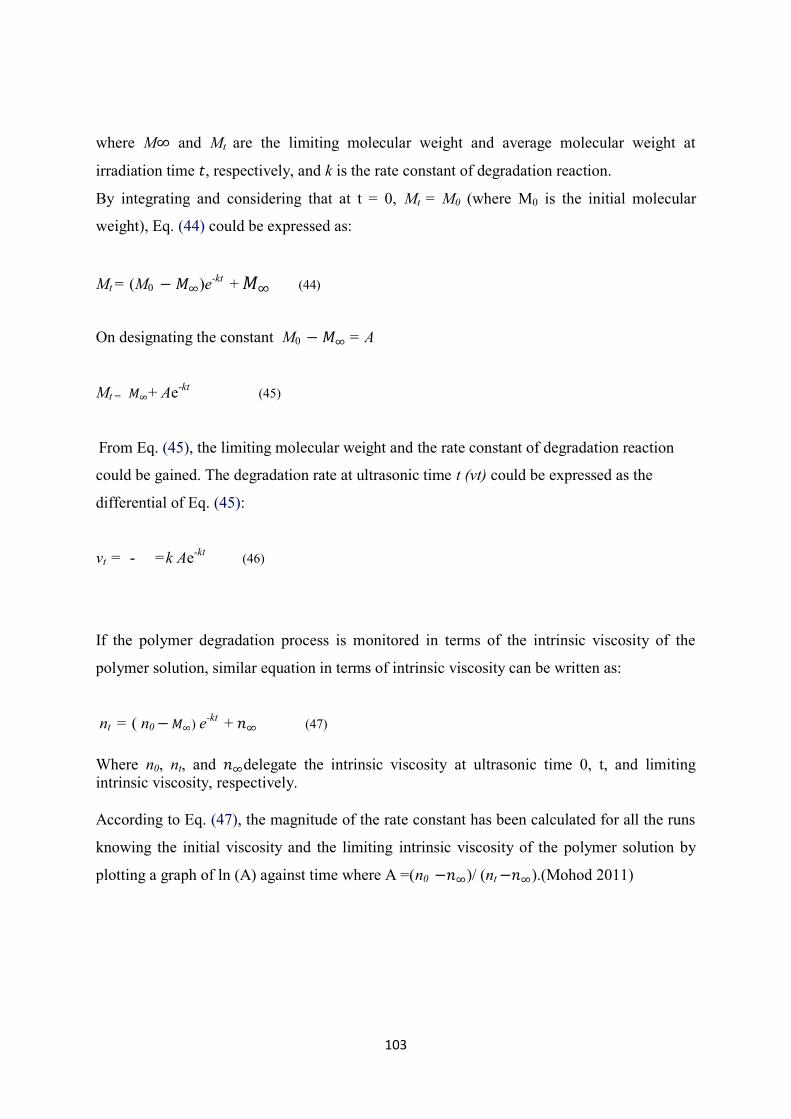
103
where M and Mt are the limiting molecular weight and average molecular weight at
irradiation time , respectively, and k is the rate constant of degradation reaction.
By integrating and considering that at t = 0, Mt = M0 (where M0 is the initial molecular
weight), Eq. (44) could be expressed as:
Mt = (M0 )e-kt + (44)
On designating the constant M0 = A
Mt = + Ae-kt (45)
From Eq. (45), the limiting molecular weight and the rate constant of degradation reaction
could be gained. The degradation rate at ultrasonic time t (vt) could be expressed as the
differential of Eq. (45):
vt = - =k Ae-kt (46)
If the polymer degradation process is monitored in terms of the intrinsic viscosity of the
polymer solution, similar equation in terms of intrinsic viscosity can be written as:
nt = ( n0 ) e-kt + (47)
Where n0, nt, and delegate the intrinsic viscosity at ultrasonic time 0, t, and limiting intrinsic viscosity, respectively. According to Eq. (47), the magnitude of the rate constant has been calculated for all the runs
knowing the initial viscosity and the limiting intrinsic viscosity of the polymer solution by
plotting a graph of ln (A) against time where A =(n0 )/ (nt ).(Mohod 2011)

104
5.3. Viscosity and Molecular Weight Relationship
The intrinsic viscosity number η of a solution is defined as:
[ η] = η – η 0 (48)
η 0c
In terms of the solvent viscosity η 0, the solution viscosity η and the solute concentration c.
The quantity [η] of a polymer solution is a measure of the capacity of a polymer molecule to
enhance the viscosity, which depends on the size and the shape of the polymer molecule.
Within a given series of polymer homologs, [η] increases with the molecular weight M ;
hence it is a measure of M.(J.Brandrup 1999)
The limiting viscosity number [η] and molecular weight relationships for polymers in various
solvents and at various temperatures are available in the literature. For example the data from
literature contains the constants of the equation:(J.Brandrup 1999)
[η] = KM a (49)
This equation is known as the Mark-Houwink-Sakurada equation. It is now a well known fact
that for linear, flexible polymers, under special conditions of temperature or solvent termed
as the Flory ‘theta’ temperature or solvent, the above equation becomes: (J.Brandrup 1999)
[η]Ɵ = KƟM 0.50 (50)
From the data in the literature where the Ɵ is used in the parenthesis suggests that the
viscosity constants were obtained under the theta conditions. Therefore equation 50 is
approximately valid over the whole molecular weight range, KƟ and a = 0.50 can be used
without modification, outside of the molecular weight range in which they were deduced. It
should be noted that [η] is sensitive to temperature in the vicinity of Ɵ importantly when M is

105
higher than 5 x 10⁵. In usual solvents, the constants K and a obtained are valid only within a
rather limited range of M. Therefore the literature relationships will be in error outside the
indicated range of M. As for the effect of temperature, however, both K and a mostly become
insensitive to the temperature when a exceeds about 0.70, and they may be used in a 10-
degree range on either side of temperature at which the constants were
determined.(J.Brandrup 1999)
5.4. Sample Calculation of Rate Constant
Using the above equation the rate constant was worked out for the 2.5% ultrasound probe Nafion® solution at 20% amplitude.
A = (2.769-1.538)/ (5.466-1.538) = 0.313
lnA 0.313= -1.162.
A = (2.769-1.538)/ (5.415 – 1.538) = 0.3175
ln A 0.3175 = -1.147
A = (2.769-1.538)/ (5.394-1.538) = 0.3192
ln A 0.3192 = -1.142
A = (2.769-1.538)/ (5.318-1.538) = 0.32566
ln A 0.32566 = -1.122
A = (2.769-1.538)/ (1.909 – 1.538) = 7.1988
ln A 7.1988 = 1.9739
The plot of lnA against sonication time gives the rate constant from the graph below.

106
Figure 52 graph of ln A vs Sonication time For 2.5% Nafion® Solution
The same calculations were carried out for different Nafion® concentrations of 5, 7.5 and 10% at
different ultrasound powers and then the plot of lnA against sonication time deduced the rate constant.
The different rate constants are presented in the table below.
Table 15 showing the calculated rate constants for Nafion® at various concentrations
Rate Constant K (Min-1) Nafion® concentration (wt %)
0.0544 2.5
0.0773 5
0.1021 7.5
0.1067 10
Table 16 Showing reverse concentratin vs K values
Calculated K Values k (Min -1) Reverse Concentration (wt %)
0.0544 2.5
0.0773 5.0
0.1021 7.5
0.1067 10
y = 0.0544x - 1.4065 R² = 0.9801
-2
-1.5
-1
-0.5
0
0.5
1
1.5
2
2.5
0 10 20 30 40 50 60 70
lnA
Sonication Time (Min)
Rate Constant

107
Figure 53 Graph showing the relationship between the calculated Rate constant and Reverse Concentration
The calculated rate constants, k, are correlated in terms of reverse solution concentration and
the data indicates that, the rate constant of ultrasonic degradation decreases with increasing
solution concentration. The analysis of these observations is that there is less overlap between
polymer chains at low concentration. Therefore, they are more susceptible to the
hydrodynamic forces generated around cavitation bubbles. This is found to be similar to work
carried out in the literature by Mohammed Taghi and Abbas Mehrdad. (Taghizadeh 2003).
0
0.02
0.04
0.06
0.08
0.1
0.12
0 2 4 6 8 10 12
k (M
in-1
)
Reverse Concentration 1/c (wt % )

108
6. CHAPTER 6 FURTHER WORK
It has been shown that ultrasound causes the degradation of Nafion® polymer at certain
power and irradiation time. However, under carefully chosen conditions, it is possible to
initiate polymerization reactions using ultrasound, the products obtained vary depending on
the functional groups present or absent. Further study is needed to see how the nature of the
product and the polymerization rate changes with conditions, for example; temperature,
adducts, impurities, solvents, gases, pulsing of ultrasound, intensity, frequency, etc.
6.1. MEA Preparation for Ultrasound Effects
To see the Nafion® polymer behaviour in the fuel cells we would need to build an MEA to
see if ultrasound really does enhance the thermal stability and hence improves the general
durability of the membrane. Catalyst ink will be prepared by mixing 40 wt% Pt/C (E-tek,
Inc.) With isopropyl alcohol (Baker Analyzed HPLC Reagent) and then it will be sonicated
for 1 h. (5 wt% Nafion® solution (Du Pont, Inc.) will be added to the catalyst ink, which will
be sonicated again for 1 h. MEAs will be fabricated by a conventional method. For the
conventional MEA, the prepared catalyst ink is sprayed on a wet-proofed carbon paper
(Sigracet®, SGL Carbon Inc.) to make an electrode. Then, the electrodes will be placed on
both sides of a pre-treated Nafion®112 membrane and hot pressed. , the active electrode area
will be 25 cm2 with catalyst loading of 0.3 and 0.4 mg Pt cm−2 for anode and cathode,
respectively, and hot pressing will be conducted at 140◦C with a compaction pressure of 200
kgcm−2for 90 s. Single cells will be assembled with a prepared MEA, Teflon gaskets, and 5
channel semi-serpentine graphite blocks. H2 and O2 or air will be fed to the anode and
cathode, respectively. The stoichiometry of H2 and O2 or air will be 1.5 and 3 with relative
humidity of 100 and 55%, respectively. The cell temperature will be 80◦C. The same
fabrication procedure will be followed for the making an MEA that incorporates ultrasound
treated Nafion® and instead of placing the electrodes in conventional Nafion® they will be
treated with sonicated Nafion® and hot pressed.(Prasanna 2008).(Chen and Fuller 2009)

109
6.2. Testing Of MEA with Nafion® Incorporated Membrane
Chemical and physical characteristics of the MEAs will be investigated by mercury
porosimetry, X-ray diffraction (XRD), scanning electron microscopy (SEM) combined with
electron probe micro analysis (EPMA), and Fourier transformation infrared spectroscopy
(FTIR). Before and after long-term operation to see how the MEA made from ultrasound
treated Nafion® behaves in terms of performance and stability. (Prasanna 2008)
6.3. Structural Changes following Ultrasonic Treatment of Nafion®
As we know that ultrasound increases the Tg of Nafion® at various ultrasonic power and
time therefore the next step would be to observe the structural changes in Nafion® following
ultrasonic treatment of the polymer. This would give us an idea of how the structure is
modified that results in an increase in the glass transition temperature of Nafion®. As we
know an increase in Tg results in better mechanical stability therefore this can be of an
extreme importance in fuel cell operation. Currently one of the issues associated with PEM
fuel cells is the durability of the Nafion® in the fuel cell operation but as the results of
ultrasound treatment of Nafion® shows promising results of increase in Tg therefore means
ultrasound as a promising method of fabricating Nafion® membranes for fuel cell use.
The advantage of observing the structural changes for the samples that show increase in Tg
will mean that the results can easily be reproduced and confirmed, also the toughness
depends on morphology. A common method used for determining morphology is by using
Scanning Electron Microscopy (SEM).

110
6.4. Determination of Mechanical properties After Sonication
The mechanical properties of Nafion® should be tested after sonication to see if sonication
improves mechanical properties. This is of extreme important because currently the
degradation of Nafion® membrane is a big problem due to the fact that Nafion® although a
perfect polymer for use in fuel cells is not durable. The mechanical properties following
ultrasound irradiation needs to be investigated to see if it can enhance the durability of the
Nafion® membrane in fuel cells. The tensile stress to break and young modulus versus
sonication needs to be plotted by using LR5KPlus 5 kN and an impact tester (Ceast Model
6545). The LR5KPlus 5 kN is used for routine quality control testing or complex multi-stage
tests and can perform Tensile experiments. The Young Modulus, E is a material property that
describes its stiffness and is therefore one of the most important properties in engineering
design. Therefore an enhancement in the Young Modulus can result in improved durability.
From the literature it has been reported by Youngjoo Lee et al that specific ultrasound power
and time can improve tensile stress to break and Young Modulus at short irradiation time of
ultrasound but soon reached a peak and decreased. Therefore finding the right irradiation
power and time seems like an interesting concept for improving the mechanical properties of
Nafion® in fuel cell operation. As we already know some of the ultrasound frequencies of
interest this would be an easy next task.
6.5. Additional Work
It is also suggested that future work needs to be carried out on the effect of stabilisers on
Nafion®. Stabilizers for polymers are used directly or by combinations to prevent the various
effects such as oxidation, chain scission and uncontrolled recombination’s and cross-
linking reactions that are caused by photo-oxidation of polymers. Polymers are considered to
get weathered due to the direct or indirect impact of heat and ultraviolet light. The stabilizers
can have desirable effects for fuel cell use but the effect of other parameters after
incorporation needs to be examined such as permeability across the Nafion® membrane.

111
7. CHAPTER 7 CONCLUSION
7.1. Conclusions
According to the results of this study it was found that ultrasound degrades the Nafion®
polymer. The most extensive degradation was observed at the lowest frequency when the
input power was above the cavitation threshold. There was also sudden increase in Nafion®
viscosity. This was attributed to scission of polymer bonds due to ultrasound
(depolymerisation) supplies new chain carriers for polymerization. Under carefully chosen
conditions, it was possible to initiate polymerization reactions using ultrasound. The
manufacturing of MEA using ultrasound would therefore require specific conditions to get
the desired effect such as improving the mechanical toughness of the Nafion®. Normally
during the production process catalysts or initiators are used to start the polymerization
reaction, which also contaminate the final product. These chemicals are not required using
ultrasound, as it can produce radicals in situ from the reactants, this had a desired effect in
our results because at certain frequency and irradiation time where the Tg was shown to
increase from the Dsc studies was also the same frequency at which polymerization was
shown to occur thereby proving that ultrasound increases the Tg which is desirable in fuel
cells. Therefore for the fabrication of MEA using ultrasound the required ultrasonic
frequency and time would be 30 minutes ultrasound at 1.86 W using ultrasonic probe for the
5% Nafion®. At this frequency of ultrasound the Nafion® glass transition increases and
therefore means the durability of the Nafion® membrane is enhanced. This has another
benefit because high temperatures are desirable for a better efficiency and CO tolerance,
ultrasound prepared MEA using the specific frequency and irradiation time will advance the
PEM Fuel cells.
It was shown by Differential Scanning Calorimetry that at specific time and frequency of
ultrasound irradiation there was an increase in the glass transition temperature of Nafion®
from its original value in the literature. The fact that an increase in glass transition
temperature results in better thermal stability and toughness of the polymer, it is then
concluded that Ultrasound can prove to be a very advantageous method for fabrication of
Nafion® as it has been for fabrication of other fuel cell materials. These results were also
confirmed by some other work on different polymers.

112
The effect of high shear mixer on Nafion® at various speeds analogous to the use of
ultrasound at different powers was also investigated to compare its effect on the polymer.
However, it was found that high shear mixer resulted in a gradual decrease in viscosity of the
polymer due to degradation and there were no sudden increases in viscosity. Thus it was
concluded that high shear mixing only degrades the polymer and does not initiate
polymerization. Furthermore the glass transition temperature from Differential Scanning
Calorimetry either showed no change in Tg or decrease in Tg from its original value in the
literature.
The GC/MS spectrums for various ultrasound treated Nafion® samples did not show the
mode of degradation and therefore we could not conclude anything about the Sonochemical
degradation of Nafion®. It is suggested to use Solid State NMR for future identification of
degradation modes due to Solid State NMR being more suitable technique.

113
References
Alwai, K. B. M. (2009). Thermal degradation and morphology of polymer blends comprisin poly(ε-caprolactone) and epoxidized natural rubber with addition of phenol as catalyst. Chemistry, Mara, Universiti Teknologi. Bachelor Of Science (Hons): 1-24.
Carlsson, A.H. Jorissen, L. Tillmetz, W. (2011). Degradation of PFSA Membrane in Fuel Cell. Germany, Baden-Württemberg (ZSW).
Balakrishnan, R. K. Guria, C. (2007). "Thermal degradation of polystyrene in the presence of hydrogen by catalyst in solution." Polymer Degradation and Stability 92(8): 1583-1591.
Barbir, F.(2001). PEM Fuel Cells. 27 - 51
Berlin, A. A, Dubinskaya, A. M. (1962). "Studies in the mechanochemistry of polymers—X. Initiation of polymerization by radicals formed during the ultrasonic degradation of macromolecules." Polymer Science U.S.S.R. 3(2): 345-351.
BP (2011). "BP Statistical Review of World Energy June 2011." Retrieved 06/2011.
Booth, C. (1963)."The mechanical degradation of polymers'' Polymer 4: 471-478.
Chen, C. and Fuller. T.F (2009). "The effect of humidity on the degradation of Nafion® membrane." Polymer Degradation and Stability 94(9): 1436-1447.
Chen, Y. Li, H. (2005). "Phase morphology evolution and compatibility improvement of PP/EPDM by ultrasound irradiation." Polymer 46(18): 7707-7714.

114
Curtin, D. E. Lousenberg, R.D. Henry, T.J, Tangeman, P.C. Tisack, M.E. (2004). "Advanced materials for improved PEMFC performance and life." Journal of Power Sources 131(1–2): 41-48.
Desai, V. Mohan, A.S. Gogate, P.R. (2008). "Degradation of polypropylene using ultrasound-induced acoustic cavitation." Chemical Engineering Journal 140(1–3): 483-487.
Fernandes, A. C. and Ticianelli, E.S. (2009). "A performance and degradation study of Nafion 212 membrane for proton exchange membrane fuel cells." Journal of Power Sources 193(2): 547-554.
Gareth, J.P. (2003). "Recent developments in sonochemical polymerisation." Ultrasonics Sonochemistry 10(4-5): 277-283.
Ghassemzadeh, L . Kreuer,K.D. Maier, J. Müller, K. (2011). "Evaluating chemical degradation of proton conducting perfluorosulfonic acid ionomers in a Fenton test by solid-state 19F NMR spectroscopy." Journal of Power Sources 196(5): 2490-2497.
Goyat, M. Ray, S. Ghosh, P. K. (2011). "Innovative application of ultrasonic mixing to produce homogeneously mixed nanoparticulate-epoxy composite of improved physical properties." Composites Part A: Applied Science and Manufacturing 42(10): 1421-1431.
Grönroos, A. Pirkonen, P. Heikkinen, J. Ihalainen, J. Mursunen, H. Sekki, H. (2001). "Ultrasonic depolymerization of aqueous polyvinyl alcohol." Ultrasonics Sonochemistry 8(3): 259-264.
Hao, C. Xiaoming, Z. Yang, Paul. (2007). "GC-MS and HPLC-MS analysis of bioactive pharmaceuticals and personal-care products in environmental matrices." TrAC Trends in Analytical Chemistry 26(6): 569-580.
Santos,H.M. Lodeiro,C. Capelo-MartRnez,J.L. (2009). The Power of Ultrasound. Ultrasound in Chemistry: Analytical Applications. J.-L. Capelo-Martínez: 1-16.

115
Petit, J.R. Jouzel, J. Raynaud, D. Barkov, N.I. Barnola, J.M. Basile, I. Bender, M. Chappellaz, J. Davis, M. Delaygue, G. Delmotte, M. Kotlyakov, V.M. Legrand, M. Lipenkov, V.Y. Lorius, C. Pe´ pin, L. Ritz, C. Saltzman, E. Stievenard, M. (1999). "Climate and atmospheric history of the past 420,000 years from the Vostok ice core, Antarctica. Nature." Nature 399.
Brandrup,J. Immergut, E.H. Grulke,E.A. (1999). Polymer Handbook, A John Wiley & Sons.
Karaman, S. Yilmaz, M.T. Ertugay, M.F. Baslar, M. Kayacier, A. (2012). "Effect of ultrasound treatment on steady and dynamic shear properties of glucomannan based salep dispersions: Optimization of amplitude level, sonication time and temperature using response surface methodology." Ultrasonics Sonochemistry 19(4): 928-938.
King, C. J. (2009). A MODEL OF DEGRADATION IN A POLYMER ELECTROLYTE MEMBRANE. Environmental Resources Engineering. HUMBOLDT, HUMBOLDT STATE UNIVERSITY. Masters of Science: 1-44.
Kurniawan, D. Arai, H. Morita, S. Kitagawa, K. (2013). "Chemical degradation of Nafion ionomer at a catalyst interface of polymer electrolyte fuel cell by hydrogen and oxygen feeding in the anode." Microchemical Journal 106(0): 384-388.
Leblanc, R. (2010). The Effect of Ultrasound on a Catalyst Ink and on Water Electrolysis. Chemical Engineering. Birmingham, University of Birmingham.
Li, J. Guo, S. Li, X. (2005). "Degradation kinetics of polystyrene and EPDM melts under ultrasonic irradiation." Polymer Degradation and Stability 89(1): 6-14.
Li, J. Liang, M. Guo, S. Ying, L. (2004). "Studies on chain scission and extension of polyamide 6 melt in the presence of ultrasonic irradiation." Polymer Degradation and Stability 86(2): 323-329.
Mohod, A. V. Gogate, P.R. (2011). "Ultrasonic degradation of polymers: Effect of operating parameters and intensification using additives for

116
carboxymethyl cellulose (CMC) and polyvinyl alcohol (PVA)." Ultrasonics Sonochemistry 18(3): 727-734.
Nguyen, N. T. Lethiecq, M. Gerard, J.F. (1995). "Glass transition characterization of homogeneous and heterogeneous polymers by an ultrasonic method." Ultrasonics 33(4): 323-329.
Pollet, B. G. (2010). "The use of ultrasound for the fabrication of fuel cell materials." International Journal of Hydrogen Energy 35(21): 11986-12004.
Prasanna, M. Cho, E. A. Lim, T.H. Oh, I.H. (2008). "Effects of MEA fabrication method on durability of polymer electrolyte membrane fuel cells." Electrochimica Acta 53(16): 5434-5441.
Price, G. J. and P. F. Smith (1993). "Ultrasonic degradation of polymer solutions: 2. The effect of temperature, ultrasound intensity and dissolved gases on polystyrene in toluene." Polymer 34(19): 4111-4117.
Price, G. J. West, P. J. Smith, P.F. (1994). "Control of polymer structure using power ultrasound." Ultrasonics Sonochemistry 1(1): S51-S57.
Psillakis, E. Mantzavinos, D. Kalogerakis, N. (2004). "Monitoring the sonochemical degradation of phthalate esters in water using solid-phase microextraction." Chemosphere 54(7): 849-857.
Redl, A. Guilbert, S. Morel, M.H. (2003). "Heat and shear mediated polymerisation of plasticized wheat gluten protein upon mixing." Journal of Cereal Science 38(1): 105-114.
Riesz, P. and Takashi, K. (1992). "Free radical formation induced by ultrasound and its biological implications." Free Radical Biology and Medicine 13(3): 247-270.
Satterfield, M. B. (2007). Mechanical and water sorption properties of nafion and composite nafion/titanium dioxide membranes for polymer

117
electrolyte membrane fuel cells. . Chemical Engineering, Princeton University. Doctor of Philosphy: 1-224.
Shertzer, H. G. Bannenberg, G.L. Rundgren, M. Moldéus, P. (1991). "Relationship of membrane fluidity, chemoprotection, and the intrinsic toxicity of butylated hydroxytoluene." Biochemical Pharmacology 42(8): 1587-1593.
Taghizadeh, M. T. Mehrdad, A. (2003). "Calculation of the rate constant for the ultrasonic degradation of aqueous solutions of polyvinyl alcohol by viscometry." Ultrasonics Sonochemistry 10(6): 309-313.
Vijayalakshmi, S. P. and G. Madras (2004). "Effect of temperature on the ultrasonic degradation of polyacrylamide and poly(ethylene oxide)." Polymer Degradation and Stability 84(2): 341-344.
Watanabe, C. Tsuge, S. Ohtani, H. (2009). "Development of new pyrolysis–GC/MS system incorporated with on-line micro-ultraviolet irradiation for rapid evaluation of photo, thermal, and oxidative degradation of polymers." Polymer Degradation and Stability 94(9): 1467-1472.
Wei, S. Valentina, P. Schreiner, M. (2012). "Photochemical degradation study of polyvinyl acetate paints used in artworks by Py–GC/MS." Journal of Analytical and Applied Pyrolysis 97(0): 158-163.
Weir, N.A. Buchanan,F.J. Orr,J.F. Farrar,D.F. Boyd, A. (2004). "Processing, annealing and sterilisation of poly-l-lactide." Biomaterials 25(18): 3939-3949.
Wu,J. Yuan,X.Z. Martin,J.J. Wang,H. Zhang,J. Shen, J. Wu,S. Merida,W. (2008). "A review of PEM fuel cell durability: Degradation mechanisms and mitigation strategies." Journal of Power Sources 184(1): 104-119.

118
Xie, T. and Hayden,C.A. (2007). "A kinetic model for the chemical degradation of perfluorinated sulfonic acid ionomers: Weak end groups versus side chain cleavage." Polymer 48(19): 5497-5506.