the effect of vitamin d supplementation on markers of ...s final phd electronic copy.pdf · plays a...
TRANSCRIPT
The effect of vitamin D3 supplementation on
markers of glycaemia, lipidaemia and oxidative
stress in Saudi women with poorly controlled
type 2 diabetes mellitus
Alaa Hatim Qadhi
PhD 2016
i
The effect of vitamin D3 supplementation on
markers of glycaemia, lipidaemia and oxidative
stress in Saudi women with poorly controlled
type 2 diabetes mellitus
Alaa Hatim Qadhi
A thesis submitted in partial fulfilment of the
requirements of the Manchester Metropolitan
University for the degree of Doctor of
Philosophy
Department of School of Healthcare Science
the Manchester Metropolitan University
2016

ii
Abstract
Saudi Arabia has amongst the highest incidence of type 2 diabetes in the world, with
nearly 20 percent of the adult population suffering from the condition. The prevalence
of vitamin D deficiency in type 2 diabetics has been shown to be twice that of non-
diabetic individuals. Recent studies have shown, over 95 percent of the Saudi
adolescent population are vitamin D deficient. Pancreatic beta-cells express vitamin D
receptors, as well as the vitamin-D3–activating enzyme 1-alpha-hydroxylase. Vitamin D
plays a key role in both insulin production and glucose homeostasis. Supplementation
with vitamin D could help tackle morbidity in diabetes by decreasing insulin resistance
and reducing levels of advanced glycation endproducts (AGEs) which contribute to the
onset and progression of diabetic complications. Despite vitamin D deficiency and
diabetes being highly prevalent amongst the female Saudi population, the effect of
vitamin D3 supplementation on improving diabetic outcomes is an area that is currently
understudied.
This was a double-blind randomized control study of 156 overweight Saudi females
with poorly controlled type 2 diabetes mellitus recruited from Al-Noor Hospital in
Saudi Arabia. Each subject was randomly allocated to either a placebo, 2000 IU/day or
4000 IU/day vitamin D3 intervention group for 16 weeks. Serum measurements were
analysed using routine laboratory procedures. Oxidative stress biomarkers, including
total antioxidant levels, were measured using a colorimetric method. AGEs were
measured using an AGE reader at baseline and 16 weeks.
Significant improvements in vitamin D status, HbA1c, LDL and total cholesterol were
demonstrated after 16 weeks of supplementation (p < 0.001), (p = 0.001), (p = 0.028)
and (p = 0.049) respectively. There were no statistically significant changes in HOMA-
IR, AGE concentrations, fasting insulin, fasting glucose, HDL-cholesterol and
triglyceride levels.
This study suggests vitamin D may have a role in improving outcomes for type 2
diabetics and slowing the natural progression of the disease. Further research however is
needed to determine the optimum dose, duration and form of delivery of
supplementation in order to achieve these effects.

iii
Declaration
I declare that this thesis is all my own work and has not been copied from any other
sources, or accepted for any other degree in any University. To the best of my
knowledge this thesis contains no material written or distributed previously by any other
parties, apart from where I have otherwise stated.
Signature: Alaa Qadhi Date: 14/07/2016

iv
Acknowledgements
In the Name of Allah, the most gracious and the most merciful, I would like to express
my gratitude and thankfulness to Allah who has given me the opportunity, strength and
blessing to complete this research, and my ‘selawat’ and ‘salam’ to His righteous
Prophet Mohammad. Peace be upon Him.
I would like to express my sincere appreciation to the Director of Studies, Dr Nessar
Ahmed, for his ongoing support, supervision, encouragement, guidance and
suggestions, which were essential for the completion of this research. I am also truly
thankful to my second supervisor, Dr Emma Derbyshire, for her quick feedback and
helpful comments which were truly inspiring. I am also deeply grateful to Dr Khaled
Taybe, the Head of the Diabetes Centre at Al Noor Specialist Hospital, for his
generous support and encouragement during this research.
Words cannot express how grateful I am to my wonderful husband, Mohammad
Mesawa, and my two lovely children, Ramah and Talal, for their patience and support
during all the hard times that I faced. My deep and sincere gratitude to my excellent
parents, Hatim Kadi and Wafaa Shafei, and kind parents-in-law, Talal Mesawa and
Nawal Sunbul, for their constant encouragement and moral support. A special thanks
goes to my brothers, Ahmed and Hassan, and my three marvellous sisters, Marzy,
Kholod and Dina.
I am sincerely thankful to his Excellency Professor Abdulfattah Mashat, the President
of the University of Jeddah, and Dr Adel Abuznadah, the Vice President of King Fahd
Medical Research Centre at King Abdulaziz University, for their generous assistance
and support in making this work a success.
I am very grateful to all the staff at the Diabetes and Endocrine Centre at Al Noor
Specialist Hospital. I would like to give special thanks to the head nurse, Mrs Susan
Mueen, and all her staff, especially Mrs Duaa Brinjee and Mr Maher Alsaedi, for their
help and assistance throughout. My deepest appreciation to everyone at the Al Noor
Specialist Hospital Laboratory, including Dr Hani Faidah, Director of the Laboratory,
Mr Emran Alwakeel, Chief of Lab Technologist, Miss Mashael Aladwani, Senior
Supervisor of the Biochemistry Lab, and her staff and the Hormone Lab staff for their
great support and technical assistance.

v
I also wish to express my gratitude to everyone from Umm Al Qura University for
their involvement in this thesis. Finally, a special thanks to Dr Mohammed Basalamh,
Vice Dean for Graduate Studies and Research, for his help and support.

vi
Conference presentations
Alaa Qadhi, Khaled Tayeb, Emma Derbyshire, Nessar Ahmed (2016) Effect of
Vitamin D supplementation on markers of glycaemia in Saudi Women with poorly-
controlled Type 2 Diabetes Mellitus. The 9th Saudi Student Conference at The ICC,
Birmingham (13-14 February 2016).
Alaa Qadhi, Khaled Tayeb, Emma Derbyshire, Nessar Ahmed (2016) Effect of
Vitamin D supplementation on markers of dyslipidaemia in Saudi Women with
poorly-controlled Type 2 Diabetes Mellitus. The 19th vitamin D workshop, Boston,
MA (29-31 March 2016).
vii
List of abbreviations
µU/mL Microunits/millilitre
AGEs Advanced glycation endproducts
Apo-A1 Apolipoprotein A-1
ApoB Apolipoprotein B
AR Aldose reductase
BCG Bromcresol green
BHT Butylated hydroxytoulene
BMI Body mass index
BSA Bovine serum albumin
Calciferol Vitamin D
Calcitriol 1,25-dihydroxycholecalciferol
CAT Catalase
CETP Cholesteryl ester transfer protein
Cholecalciferol Vitamin D3
DAG Diacylglycerol
Ergocalciferol Vitamin D2
FBS Fasting blood sugar
FGIR Fasting glucose/insulin ratio
GLM General Linear Model
GPx Glutathione peroxidase
GRed Glutathione reductase
GSH Glutathione
GSH-Px Glutathione peroxidase
HbA1c Glycated haemoglobin
HDL High density lipoprotein
HOMA-B Homeostasis model assessment of β-cell
function

viii
HOMA-IR Homeostasis model assessment for insulin
resistance
HSL Hormone-sensitive lipase
IM injection Intramuscular injection
IR Insulin resistance
IU International unit
LDL Low density lipoprotein
MDA Malondialdehyde
mg/dl Milligram/decilitre
mM Millimolar
MPO Myeloperoxidase
NF-κB Nuclear factor -kappaB
ng/ml Nanogram/millilitre
NIDDM Non-insulin-dependent diabetes
NM-BAPTA 5-nitro-5’methyl-BAPTA
NPDR Non-proliferative diabetic retinopathy
Ox-LDL Oxidised LDL
PCO Pro-oxidants protein carbonyl
PDR Proliferative diabetic retinopathy
PKC Protein kinase C
PTH Parathyroid hormone
QUICKI Quantitative insulin-sensitivity check index
RAGE Receptors for advanced glycation endproducts
RCT Randomized control trial
ROS Reactive oxygen species
sdLDL Small dense low density lipoprotein
SOD Superoxide dismutase
T2DM Type 2 Diabetes Mellitus
TAC Total antioxidant capacity
ix
TC Total cholesterol
TG Triglycerides
TINIA Turbidimetric inhibition immunoassay
UKPDS UK Prospective Diabetes Study
UV Ultraviolet
VDBP Vitamin D binding protein
VDR Vitamin D receptor
VDRE Vitamin D response element
VLDL Very-low density lipoprotein
WHO World Health Organisation
IL-6 Interleukin-6
IL-1α Interleukin-1 α
1,25(OH)2D3 1,25-dihydroxycholecalciferol
x
List of figures
Figure 1.1: Diagram representing the long-term complications of Type 2 Diabetes ...... 3
Figure 1.2: Pathogenesis of diabetic retinopathy ............................................................ 5
Figure 1.3: Differences between the healthy and diabetic glomerulus ........................... 6
Figure 1.4: Biological pathways resulting in diabetic complications ............................. 7
Figure 1.5: Glycation and formation of AGEs .............................................................. 11
Figure 1.6: Autoxidative glycation in the presence of transition metals, leading to the
production of free radicals and AGEs ........................................................................... 12
Figure 1.7: The role of insulin resistance in diabetic dyslipidaemia............................. 16
Figure 1.8: The chemical structure of vitamin D2 and D3 ............................................. 19
Figure 1.9: The conversion of inactive vitamin D to its biologically active form ........ 21
Figure 1.10: The proposed direct effect of vitamin D on insulin secretion in a
pancreatic beta cell ........................................................................................................ 25
Figure 1.11: Direct and indirect effects of vitamin D on antioxidant/ pro-oxidant
balance in diabetes ........................................................................................................ 28
Figure 2.1: Study design and progression flow chart. ................................................... 49
Figure 4.1: Mean Vitamin D status (ng/ml) across the three groups over time (pre-test
and post-test) ................................................................................................................. 79
Figure 4.2: Vitamin D status of participants at baseline (%) ........................................ 81
Figure 4.3: Vitamin D status of participants at 16 weeks (%) ...................................... 81
Figure 4.4: Mean corrected calcium (mg/dl) across the three groups over time (pre-test
and post-test) ................................................................................................................. 82
Figure 4.5: Mean BMI (kg/m2) across the three groups over time (pre-test and post-
test) ................................................................................................................................ 83
Figure 5.1: Mean fasting blood glucose (mg/dl) across the three groups over time (pre-
test and post-test)........................................................................................................... 89
Figure 5.2: Mean fasting insulin (μU/mL) across the three groups over time (pre-test
and post-test) ................................................................................................................. 90
Figure 5.3: Mean HOMA-IR (%) across the three groups over time (pre-test and post-
test) ................................................................................................................................ 91
Figure 5.4: Mean HOMA-B (%) across the three groups over time (pre-test and post-
test) ................................................................................................................................ 93

xi
Figure 5.5: Mean HbA1c (%) across the three groups over time (pre-test and post-test)
....................................................................................................................................... 96
Figure 6.1: Mean HDL cholesterol (mg/dl) across the three groups over time (pre-test
and post-test) ............................................................................................................... 106
Figure 6.2: Mean LDL cholesterol (mg/dl) across the three groups over time (pre-test
and post-test) ............................................................................................................... 108
Figure 6.3: Mean triglyceride levels (mg/dl) across the three groups over time (pre-test
and post-test) ............................................................................................................... 110
Figure 6.4: Mean total cholesterol levels (mg/dl) across the three groups over time
(pre-test and post-test) ................................................................................................. 111
Figure 7.1: Mean total antioxidant capacity (mM) across the three groups over time
(pre-test and post-test) ................................................................................................. 120
Figure 7.2: Mean skin AGEs (arbitrary units) across the three groups over time (pre-
test and post-test)......................................................................................................... 121

xii
List of tables
Table 1.1: Prevalence of low vitamin D status amongst the Saudi population ............. 22
Table 1.2: Vitamin D intervention studies in diabetic and obese patients. ................... 30
Table 2.1: Study Inclusion and exclusion criteria. ........................................................ 52
Table 2.2: Classification of vitamin D deficiency according to The Endocrine Society,
using blood serum concentration of vitamin D. ............................................................ 58
Table 2.3: Defining the cut offs for lipid measurements. ............................................. 61
Table 3.1: Reasons for attrition ..................................................................................... 69
Table 3.2: Demographic characteristics of participants at baseline (N = 128) ............. 70
Table 3.3: Health-related characteristics of participants at baseline (N = 128) ............ 71
Table 4.1: Post-hoc comparison of vitamin D status (ng/ml) between baseline (pre-test)
and after 16 weeks (post-test) ....................................................................................... 79
Table 4.2: Post-hoc test comparisons of vitamin D status (ng/ml) between the three
groups for post-test ........................................................................................................ 80
Table 4.3: Post-hoc comparisons of corrected calcium (mg/dl) between baseline (pre-
test) and after 16 weeks (post-test)................................................................................ 81
Table 4.4: Post-hoc comparisons of BMI (kg/m2) between baseline (pre-test) and after
16 weeks (post-test)....................................................................................................... 83
Table 5.1: Post-hoc test comparisons of fasting blood glucose (mg/dl) between
baseline (pre-test) and after 16 weeks (post-test) .......................................................... 88
Table 5.2: Post-hoc test comparisons of fasting insulin (μU/mL) between baseline (pre-
test) and after 16 weeks (post-test)................................................................................ 90
Table 5.3: Post-hoc test comparisons of HOMA-IR (%) between baseline (pre-test) and
after 16 weeks (post-test) .............................................................................................. 91
Table 5.4: Post-hoc test comparisons of HOMA-B (%) between baseline (pre-test) and
after 16 weeks (post-test) .............................................................................................. 92
Table 5.5: Changes in HOMA-IR at different serum vitamin D concentrations across
the three groups (n = group size) .................................................................................. 94
Table 5.6: Changes in HOMA-B at different serum vitamin D concentrations across
the three groups (n = group size) .................................................................................. 95
Table 5.7: Post-hoc test comparisons of HbA1c (%) between baseline (pre-test) and
after 16 weeks (post-test) .............................................................................................. 96

xiii
Table 5.8: Post-hoc test comparisons of HbA1 (%) between the three groups for post-
test ................................................................................................................................. 97
Table 6.1: Post-hoc test comparisons of HDL cholesterol (mg/dl) between baseline
(pre-test) and after 16 weeks (post-test) ...................................................................... 106
Table 6.2: : Post-hoc comparisons of LDL cholesterol (mg/dl) between baseline (pre-
test) and after 16 weeks (post-test).............................................................................. 107
Table 6.3: Post-hoc test comparisons of LDL cholesterol (mg/dl) between the three
groups for post-test ...................................................................................................... 109
Table 6.4: Post-hoc comparisons of triglycerides levels (mg/dl) between baseline (pre-
test) and after 16 weeks (post-test).............................................................................. 109
Table 6.5: Post-hoc comparisons of total cholesterol levels (mg/dl) between baseline
(pre-test) and after 16 weeks (post-test) ...................................................................... 111
Table 6.6: Post- hoc test comparisons of total cholesterol levels (mg/dl) between the
three groups for post-test ............................................................................................. 112
Table 7.1: Post-hoc comparisons of total antioxidant capacity (mM) between baseline
(pre-test) and after 16 weeks (post-test) ...................................................................... 119
Table 7.2: Post-hoc comparisons of skin AGEs (arbitrary units) between baseline (pre-
test) and after 16 weeks (post-test).............................................................................. 121

xiv
Contents
Abstract ii
Declaration iii
Acknowledgements ...................................................................................................... iv
Conference presentations ........................................................................................... vi
List of abbreviations .................................................................................................. vii
List of figures x
List of tables xii
Contents xiv
Chapter 1. Introduction .................................................................................... 1
1.1 General Introduction ................................................................................................. 2
1.2 Type 2 Diabetes Mellitus .......................................................................................... 2
1.3 Pathophysiology of Type 2 Diabetes ........................................................................ 2
1.4 Complications of Diabetes ........................................................................................ 3
1.4.1 Retinopathy ......................................................................................................................... 3
1.4.2 Nephropathy ....................................................................................................................... 5
1.4.3 Neuropathy ......................................................................................................................... 6
1.4.4 Macrovascular complications ............................................................................................. 6
1.5 Pathogenesis of Diabetic Complications ................................................................... 6
1.5.1 Oxidative stress ................................................................................................................... 8
1.5.2 Polyol pathway .................................................................................................................... 9
1.5.3 Activation of protein kinase C ............................................................................................. 9
1.5.4 AGE formation pathways .................................................................................................. 10
1.5.4.1 Glycation ............................................................................................................................. 10
1.5.4.2 Autoxidative glycation ........................................................................................................ 11
1.5.4.3 AGE receptors ..................................................................................................................... 12
1.5.4.4 Role of AGEs in pathogenesis of diabetic complications .................................................... 13
1.5.5 Dyslipidaemia .................................................................................................................... 14
1.5.5.1 Pathogenesis of diabetic dyslipidaemia .............................................................................. 15
1.5.5.2 Complications of diabetic dyslipidaemia ............................................................................ 16
1.6 Prevention of Diabetic Complications .................................................................... 17
1.6.1 Exogenous antioxidants .................................................................................................... 17
1.7 Vitamin D ................................................................................................................ 18
1.7.1 Structure and function ...................................................................................................... 18
1.7.2 Factors affecting vitamin D status..................................................................................... 21

xv
1.7.3 Vitamin D and diabetes ..................................................................................................... 23
1.7.3.1 Vitamin D and glycaemia .................................................................................................... 24
1.7.3.2 Vitamin D and dyslipidaemia .............................................................................................. 26
1.7.3.3 Vitamin D and oxidative stress ........................................................................................... 26
1.7.4 Previous related research ................................................................................................. 28
1.8 Aims and objectives ................................................................................................ 43
Chapter 2. Materials & Methods ................................................................... 44
2.1 Materials, equipment and software ......................................................................... 45
2.1.1 Materials ........................................................................................................................... 45
2.1.2 Equipment ......................................................................................................................... 46
2.1.3 Software ............................................................................................................................ 47
2.2 Ethical approval ...................................................................................................... 47
2.3 Study overview ....................................................................................................... 47
2.4 Interventions ............................................................................................................ 50
2.5 Safety margins ......................................................................................................... 50
2.6 Recruitment and sittings .......................................................................................... 51
2.7 Inclusion and exclusion criteria .............................................................................. 51
2.8 Sample size calculation ........................................................................................... 53
2.9 Informed consent form ............................................................................................ 53
2.10 Pre-study screening questionnaire ........................................................................ 54
2.11 Anthropometric measurements ............................................................................. 55
2.12 Blood collection .................................................................................................... 55
2.13 Supplement compliance ........................................................................................ 56
2.14 Debriefing Questionnaire ...................................................................................... 56
2.15 Blood analysis ....................................................................................................... 57
2.15.1 Measurement of the concentration of vitamin D ........................................................... 57
2.15.2 Measurement of insulin .................................................................................................. 58
2.15.3 Measurement of the concentration of glycated haemoglobin ....................................... 58
2.15.4 Measurement of the concentration of lipids .................................................................. 59
2.15.5 Measurement of the concentration of fasting Glucose .................................................. 61
2.15.6 Measurement of the concentration of corrected calcium .............................................. 61
2.15.7 Measurement of Oxidative Stress (Total Antioxidant Capacity) ..................................... 62
2.16 Homeostasis Model Assessment ........................................................................... 63
2.17 Advanced Glycation Endproducts (AGE) measurement ...................................... 63
2.18 Data protection ...................................................................................................... 64
xvi
2.19 Data handling and cleaning ................................................................................... 64
2.20 Statistical analyses ................................................................................................ 64
Chapter 3. Patient Demographics .................................................................. 66
3.1 Introduction ............................................................................................................. 67
3.2 Materials & methods ............................................................................................... 68
3.3 Results ..................................................................................................................... 68
3.4 Discussion ............................................................................................................... 72
3.4.1 Age and duration of diabetes............................................................................................ 72
3.4.2 Education level .................................................................................................................. 73
3.4.3 Smoking ............................................................................................................................. 73
3.4.4 Obesity .............................................................................................................................. 74
3.4.5 Family history .................................................................................................................... 74
4.4.6 Summary ........................................................................................................................... 75
Chapter 4. Vitamin D3 Status ......................................................................... 76
4.1 Introduction ............................................................................................................. 77
4.2 Methodology ........................................................................................................... 78
4.3 Results ..................................................................................................................... 78
4.3.1 Vitamin D Status ............................................................................................................... 78
4.3.2 Corrected calcium (mg/dl) ................................................................................................ 81
4.3.3 BMI .................................................................................................................................... 82
4.4 Discussion ............................................................................................................... 84
4.4.1 Vitamin D status ................................................................................................................ 84
4.4.2 Corrected calcium ............................................................................................................. 85
4.4.3 BMI .................................................................................................................................... 85
4.4.4 Summary ........................................................................................................................... 85
Chapter 5. Vitamin D3 and Markers of Glycaemia ...................................... 86
5.1 Introduction ............................................................................................................. 87
5.2 Methodology ........................................................................................................... 87
5.3 Results ..................................................................................................................... 88
5.3.1 Fasting blood glucose ........................................................................................................ 88
5.3.2 Fasting blood insulin ......................................................................................................... 89
5.3.3 Insulin resistance (HOMA-IR) ............................................................................................ 91
5.3.4 Beta cell function (HOMA-B) ............................................................................................. 92
5.3.5 Comparing the changes in HOMA-IR and HOMA-B with final vitamin D concentration ... 93
5.3.6 Glycated haemoglobin (HbA1c) ........................................................................................ 95
5.4 Discussion ............................................................................................................... 97

xvii
5.4.1 Fasting blood glucose level ............................................................................................... 97
5.4.2 Fasting insulin level, insulin resistance (HOMA-IR) and beta cell function (HOMA-B) ..... 99
5.4.3 Glycated haemoglobin .................................................................................................... 101
5.4.4 Summary ......................................................................................................................... 103
Chapter 6. Vitamin D3 and Lipidaemia ...................................................... 104
6.1 Introduction ........................................................................................................... 105
6.2 Methodology ......................................................................................................... 105
6.3 Results ................................................................................................................... 106
6.3.1 High density lipoprotein (HDL) ........................................................................................ 106
6.3.2 Low density lipoprotein (LDL) ......................................................................................... 107
6.3.3 Triglycerides .................................................................................................................... 109
6.3.4 Total cholesterol ............................................................................................................. 110
6.4. Discussion ............................................................................................................ 112
6.4.1 HDL cholesterol ............................................................................................................... 112
6.4.2 LDL cholesterol ................................................................................................................ 113
6.4.3 Triglycerides .................................................................................................................... 114
6.4.4 Total cholesterol ............................................................................................................. 115
6.4.5 Summary ......................................................................................................................... 116
Chapter 7. Vitamin D3 and Oxidative Stress .............................................. 117
7.1 Introduction ........................................................................................................... 118
7.2 Methodology ......................................................................................................... 119
7.3 Results ................................................................................................................... 119
7.3.1 Total antioxidant capacity ............................................................................................... 119
7.3.2 Skin Advanced glycation endproducts (AGEs) ................................................................ 120
7.4 Discussion ............................................................................................................. 122
7.4.1 Total Antioxidant Capacity .............................................................................................. 122
7.4.2 Skin Advanced Glycation Endproducts ........................................................................... 123
7.4.3 Summary ......................................................................................................................... 124
Chapter 8. Discussion .................................................................................... 125
8.1 General Discussion................................................................................................ 126
8.2 Limitations ............................................................................................................ 130
8.3 Scope for future work............................................................................................ 131
8.4 Overall conclusion ................................................................................................ 131
References 132
Appendix 173

1
Chapter 1. Introduction

2
1.1 General Introduction
Diabetes Mellitus is a group of metabolic disorders characterised by defects in insulin
secretion and insulin sensitivity resulting in chronic hyperglycaemia (WHO 2016).
According to World Health Organisation (2016) statistics, there are over 422 million
people suffering from diabetes mellitus worldwide. It is the sixth leading cause of
death globally and the mortality rates amongst diabetic patients are almost double that
of healthy individuals of the same age (WHO 2014). Furthermore, the long-term health
complications of diabetes are numerous and include neuropathy, retinopathy and
nephropathy, as well as atherosclerosis and cardiovascular disease (Alberti and
Zimmet 1998; Rother 2007).
1.2 Type 2 Diabetes Mellitus
Type 2 Diabetes Mellitus (T2DM), also known as non-insulin-dependent diabetes
(NIDDM), accounts for approximately 90–95% of all diabetic cases (American
Diabetes Association 2010). Modern sedentary lifestyles containing high calorie diets
have contributed to a global epidemic of the disease, with global prevalence nearly
doubling since 1980 (WHO 2016). Saudi Arabia has the fourth highest incidence of
type 2 diabetes in the Middle East and the seventh highest in the world, with
approximately 19% of adults aged between 20 and 79 suffering from the condition
(International Diabetes Federation 2012). Mirroring the global trend, type 2 diabetes in
Saudi Arabia is also on the rise and the prevalence amongst the population is predicted
to increase by 39.5% by 2022 (Al-Quwaidhi et al., 2014).
1.3 Pathophysiology of Type 2 Diabetes
Type 2 diabetes results from a combination of insulin resistance and inadequate
secretion (Cersosimo et al., 2014). The pathophysiology is complex, involving an
interplay between genetic and environmental risk factors that contribute to beta-cell
failure and the development of insulin resistance (DeFronzo 2009). The results are
decreased peripheral glucose uptake, utilisation and storage, leading to a state of
chronic hyperglycaemia (Kahn et al., 1993; Leahy 2005). The length of exposure to
hyperglycaemia and its severity has been shown to be directly proportional to the
development of vascular wall impairment and subsequent diabetic complications in
patients with type 2 diabetes (Fuller et al., 1979; Balkau et al., 1998; UKPDS 1998).

3
Hyperglycaemia disturbs endothelial cell homeostasis, prompting modifications to the
macro- and microvasculature, including increased generation of reactive oxygen
species (ROS), enhanced oxidative stress and increased cell membrane permeability
(Popov 2010).
1.4 Complications of Diabetes
The complications associated with diabetes are grouped in to two subsets:
microvascular disease (damage to small blood vessels) and macrovascular disease
(damage to larger arteries) and are shown in Figure 1.1. Microvascular complications
include nephropathy, retinopathy and neuropathy. Macrovascular complications
include cardiovascular disease, resulting in strokes and myocardial infarction (Fuller et
al., 1979; Balkau et al., 1998; UKPDS 1998).
1.4.1 Retinopathy
Diabetic retinopathy occurs in 90% of diabetic patients after approximately 20 to 30
years from onset of the condition. The most advanced form of the disease affects 60%
of diabetic individuals (Fong et al., 2003) and it is the leading cause of new diagnoses
of adult blindness worldwide (Aiello et al., 1998; Frank 2004). One study has found
an incidence of 36.1% of diabetic retinopathy in Saudi Arabian patients with a mean
Figure 1.1: Diagram representing the long-term complications of Type 2 Diabetes

4
duration of diabetes of 13 years (El-Bab et al., 2012). Diabetic retinopathy is a result
of microvascular damage to the retina and can be classified in two stages: non-
proliferative diabetic retinopathy (NPDR) and proliferative diabetic retinopathy (PDR)
(Miura et al., 2004). NPDR is characterised by thickening of the basement membrane
of the retina. Eventually this leads to a reduction in pericytes in the retinal blood
vessels, resulting in haemorrhages and microaneurysms, as shown in Figure 1.2 (Al-
Mesallamy et al., 2011). Pericytes are contractile mesenchymal cells that wrap around
the endothelial cells of capillaries. They regulate retinal blood flow by controlling
vascular tone and the lumen size of retinal capillaries (Beltramo and Porta 2013; Wu et
al., 2003; Kelley et al., 1987). A key histopathological change in diabetic retinopathy
is the selective loss of pericytes. The exact mechanism by which this occurs is not fully
understood, however it is thought that basement membrane thickening, systemic and
local hypertension and the formation of advance glycation end-products contribute to
pericyte apoptosis and the breaking of the tight structural connections between
pericytes and endothelial cells (Beltramo and Porta 2013). It has been shown that in
proliferative diabetic retinopathy, microaneurysms development following pericyte
loss (Hirschi et al., 1998; Antonelli-Orlidge et al., 1989).
PDR is characterised by neovascularisation as blood vessels with reduced pericytes
become more vulnerable to angiogenic factors (Motiejunaite and Kazlauskas 2008). It
has been shown that a longer duration and increased degree of hyperglycaemia is
associated with PDR (Park et al., 2008).

5
(Adapted from Latter 2014)
1.4.2 Nephropathy
Diabetes is the most common cause of end-stage renal disease in the developed world
and 40 to 50% of diabetics will develop nephropathy (Mauer and Chavers 1985).
Diabetic nephropathy is characterised by glomerular hyper-filtration which leads to
basement membrane thickening in the renal glomerulus and tubule. Initially, this is
evidenced by microalbuminuria which advances to proteinuria, a reduced glomerular
filtration rate and end-stage renal failure as the disease progresses, as shown in Figure
1.3 (Hong and Chia 1998; Wolf et al., 2003; Coughlan et al., 2005).
Figure 1.2: Pathogenesis of diabetic retinopathy

6
(Wright 2015)
1.4.3 Neuropathy
Diabetic neuropathy is classified as damage to the nervous system and is a common
complication of diabetes. More than one third of diabetics report experiencing
neuropathic problems including diabetic ulcers, impotence, pain and incontinence
(Young et al., 1993). A study of 375 Saudi Arabian diabetic patients with diabetes for
nine years or more found symptoms of nerve dysfunction in 38% of the study
population (Nielsen 1998b).
1.4.4 Macrovascular complications
Damage caused to the larger arteries in diabetes results in an increased risk of
cardiovascular disease, peripheral vascular disease and cerebrovascular disease
(Johansen and Birkeland 2003). The risk of developing cardiovascular disease is
increased two- to four fold in diabetic patients (Poornima et al., 2006) and is the
leading cause of diabetic morbidity and mortality (Bucala et al., 1994). Macrovascular
disease is characterised by endothelial dysfunction and accelerated atherosclerosis
which develops due to a multitude of factors, including hyperglycaemia,
hyperlipidaemia, oxidative stress and insulin resistance (Laakso and Lehto 1998;
Donnelly and Davis 2000; Candido et al., 2003).
1.5 Pathogenesis of Diabetic Complications
Several studies have demonstrated chronic hyperglycaemia to be the principal factor in
the onset and progression of diabetic complications (Stratton et al., 2000; Reusch
Figure 1.3: Differences between the healthy and diabetic glomerulus

7
2003; Wong et al., 2004). Several biological pathways are initiated by the presence of
elevated glucose levels and have been implicated in the development of macrovascular
and microvascular diabetic complications (see Figure 1.4). These include:
• Polyol pathway
• Activation of protein kinase C (PKC)
• AGE formation pathway
• Oxidative stress
(Adapted from Hadi and Suwaidi 2007)
Decreased antioxidant
activity
Figure 1.4: Biological pathways resulting in diabetic complications

8
1.5.1 Oxidative stress
Biological processes in the body create reactive oxygen species (ROS) that are
damaging to cells and tissues (Skrha 2003). The production of ROS is limited by
antioxidant defences comprising both endogenous and exogenous elements. Oxidative
stress is defined as the imbalance between the formation of these reactive oxygen
species and antioxidant defences (Betteridge 2000). In healthy individuals both the
generation and inhibition of ROS are balanced, however oxidative stress may arise if
either the formation of ROS increases or the body’s defensive mechanisms are not
fully effective (West 2000). Both of these may exist in diabetes where higher ROS
formation is accompanied by insufficient antioxidant defences (West 2000).
It has been suggested that diabetes contributes to the production of reactive oxygen
species through different pathways, which will be discussed in greater detail in this
chapter. High concentrations of intracellular glucose in endothelial cells have been
shown to activate ROS production in mitochondria, accelerating glycation and cellular
damage (Lorenzi 2007). A major target of oxidative stress is the vascular endothelium,
which plays a vital role in the pathophysiology of diabetic complications (Hadi and
Suwaidi 2007). Specifically, oxidative stress increases vascular endothelial
permeability and promotes leucocyte adhesion, initiating the early stages of diabetic
microangiopathy (Lum and Roebuck 2001).
ROS production in healthy individuals is usually balanced by a system of endogenous
and exogenous scavenger enzymes and antioxidants. Exogenous sources of antioxidant
scavengers, such as vitamins A, C and E, lipoic acid and carotenoids, can be derived
from a healthy diet (Jakus 2000). Several potent endogenous antioxidants, including
superoxide dismutase (SOD), catalase (CAT), glutathione peroxidase (GPx) and
glutathione reductase (GRed) have been studied both in vivo and in vitro in acute and
chronic hyperglycaemic conditions (Skrha 2003). These enzymes have been shown to
work either directly or indirectly to catalyse the removal of ROS, preventing further
oxidative stress (Maritim et al., 2003). Numerous studies have demonstrated
significantly reduced antioxidant activity in patients with type 2 diabetes (Illing et al.,
1951; Sundaram et al., 1996; Maxwell et al., 1997; Opara et al., 1999). Furthermore,
research has shown that in those patients with severely reduced antioxidant levels, the
incidence of diabetic complications was far greater (Reunanen et al., 1998; Opara et
al., 1999).
9
1.5.2 Polyol pathway
The polyol (or sorbitol) pathway explains how glucose is metabolised when
intracellular levels are elevated (Gabbay et al., 1973; Oates 2002). In states of
hyperglycaemia, glucose is reduced to sorbitol via aldose reductase (AR) and NADPH
and then further metabolised to fructose by sorbitol dehydrogenase (Lorenzi 2007).
This has many implications for diabetic patients. Firstly, the fructose produced can be
phosphorylated to fructose-3-phosphate which is broken down to 3-deoxyglucosone,
both of which are powerful glycating agents involved in the formation of advanced
glycation endproducts (AGEs) (Gonzalez et al., 1988; Szwergold et al., 1990).
Secondly, the use of NADPH by AR results in less co-enzyme availability for
glutathione reductase. This enzyme is vital for the maintenance of the intracellular pool
of reduced glutathione (GSH), a potent antioxidant, lessening the cells capability to
balance ROS (Barnett et al., 1986). Chronic hyperglycaemia therefore exposes cells to
oxidative stress, lessens antioxidant defences and increases AGE formation, resulting
in amplified rates of cellular damage and advancing diabetic vascular complications.
1.5.3 Activation of protein kinase C
Many studies have shown activation of the DAG-PKC pathway to be linked to the
development of diabetic complications (Koya and King 1998). The DAG-PKC
pathway is one of the most studied of the cellular signalling pathways initiated in
diabetes. Hyperglycaemia promotes diacylglycerol (DAG) accumulation within cells
due to an increase in glycolytic intermediate dihydroxyacetone phosphate. This is
reduced to glycerol-3-phosphate which subsequently increases synthesis of DAG. In
diabetics, increased levels of DAG have been demonstrated in vascular tissues
including the retina, aorta, heart and renal glomeruli (Craven et al., 1990; Shiba et al.,
1993).
DAG is a physiological activator of protein kinase C (PKC), a family of enzymes
responsible for regulating the function of other intracellular proteins (Inoguchi et al.,
1992; Xia et al., 1994). PKC has been associated with vascular dysfunction, including
increased permeability and contractility, synthesis of extracellular matrix, cell growth
and apoptosis, angiogenesis, leucocyte adhesion and superoxide production (Geraldes
and King 2010).

10
1.5.4 AGE formation pathways
The formation of advanced glycation endproducts (AGEs) is a major biochemical
abnormality dominant in diabetes mellitus (Hadi and Suwaidi 2007). In healthy
individuals, AGEs form at a continuous rate, beginning in early embryonic
development. In diabetics, however, the increased availability of glucose means AGEs
form and accumulate at an accelerated rate (Peppa et al., 2003). AGEs have been
strongly linked to a number of diabetic complications due to their ability to form
covalent crosslinks between proteins, such as the cellular matrix, basement membranes
and vascular endothelium, altering their structure and function (Peppa et al., 2003).
Examination of post mortem aorta samples have, for example, demonstrated aortic
stiffness to directly correlate with AGE accumulation in the tissue (Sims et al., 1996).
Other pathogenic features of AGEs involve their interaction with a variety of cell-
surface binding receptors for advanced glycation endproducts (RAGE), initiating cell
degradation or activation and pro-oxidant, pro-inflammatory actions (Peppa et al.,
2003).
1.5.4.1 Glycation
AGEs form through a succession of chemical reactions first described by Maillard
(Litchfield et al., 1999) in which reducing sugars covalently bind to the free amino
groups of proteins (Ahmed 2005). The Maillard reaction, as shown in Figure 1.5,
begins with the nucleophilic addition of the carbonyl group of a reducing sugar to the
amino group of a protein, producing a glycosylamine, known as the Schiff base. The
Schiff base is a highly labile compound and therefore undergoes rearrangement to
form the more stable Amadori product (a ketoamine), of which glycated haemoglobin
(HbA1c) is the best known (Monnier et al., 1981; Watkins et al., 1985; Yaylayan and
Huyghues-Despointes 1994; Boel et al., 1995). These initial reactions are
concentration-dependent and in the presence of low glucose levels, the sugars will
become detached from the amino groups. Conversely, in chronic hyperglycaemic
states, the opposite is true and these glycated proteins will undergo further
fragmentation, creating dicarbonyl intermediates, which eventually give rise to AGEs
(Monnier 2003; Peppa et al., 2003; Ahmed 2005).

11
(Adapted from Ahmed, 2005)
1.5.4.2 Autoxidative glycation
In addition to glycation, autoxidation of glucose also contributes to the production of
AGEs, as well as free radicals (Wolff et al., 1989). In the presence of transition metals,
glucose undergoes autoxidation to form an enediol radical (Ahmed 2005). This enediol
radical then reduces oxygen to form a superoxide radical which itself becomes
oxidised to a dicarbonyl ketoaldehyde (see Figure 1.6). In turn, the dicarbonyl
ketoaldehyde can react with protein amino groups to form a ketoimine (a compound
involved in AGE production), similar to an Amadori product but far more reactive
(Wolff and Dean 1988). Superoxide radicals combine in a reaction catalysed by
superoxide dismutase (SOD) to form hydrogen peroxide. When in contact with
Figure 1.5: Glycation and formation of AGEs

12
transition metals, hydrogen peroxide produces the extremely toxic hydroxyl radical,
inducing further oxidative damage (Baynes 1991). Whilst glucose autoxidation directly
increases the formation of ROS, the generation of AGEs by autoxidative glycation is
also accelerated by the presence of ROS (Stehouwer and Schaper 1996).
(Adapted from Ahmed, 2005)
1.5.4.3 AGE receptors
Whilst there are many proven AGE receptors, the best characterised and most studied
of the AGE receptors is the RAGE receptor (see Figure 1.7) (Mackic et al., 1998;
Schmidt et al., 1999). In diabetes mellitus, the expression of RAGE is increased and
the interaction between AGEs and their receptor is now considered fundamental in the
pathogenesis of AGE-induced diabetic complications (Hudson et al., 2002; Ahmed
2005). These pathological consequences are driven through cellular activation and
subsequent induction of oxidative stress and other broad signalling mechanisms when
AGEs bind with RAGE. AGE-RAGE interaction in macrophages has been shown to
induce the generation of intracellular free radicals and oxidative stress and subsequent
Ketoimine
Protein
H2O2 OH•
Ketoaldehyde
Enediol radical
anion
Glucose Enediol
AGEs
O2• +
O2•
Figure 1.6: Autoxidative glycation in the presence of transition metals, leading to the
production of free radicals and AGEs

13
activation of the transcription factor NF-κB (Schmidt et al., 1994; Yan et al., 1994;
Lander et al., 1997). NF- κB controls the gene transcription of endothelin-1, tissue
factor and thrombomodulin and the generation of pro-inflammatory cytokines such as
interleukin-1 α (IL-1α), interleukin-6 (IL-6) and tumour necrosis factor-α (TNF-α)
(Neumann et al., 1999). In addition, there is the enhanced expression of adhesion
molecules, which lead to increased vascular permeability amongst other effects (Singh
et al., 2014). AGE interaction with RAGE also triggers the activation of NADPH
oxidase leading to generation of reactive oxygen species (ROS) and further oxidative
stress (Wautier et al., 2001). There is also evidence to show that RAGE may be
directly involved in mediating inflammatory cell recruitment (Chavakis et al., 2003).
Together, the effects of RAGE activation in endothelial cells, macrophages and smooth
muscle cells contribute to the pathogenesis of diabetic macrovascular and
microvascular complications (Ramasamy et al., 2011).
1.5.4.4 Role of AGEs in pathogenesis of diabetic complications
A growing body of evidence has demonstrated that AGEs are significant pathogenic
mediators of nearly all micro- and macro-vascular diabetic complications (Peppa et al.,
2003). The ability of AGEs to alter the structure and function of key proteins in the
cellular matrix, basement membrane and vascular endothelium is key to their role in
the pathogenesis of diabetic microangiopathies (Peppa et al., 2003). Furthermore, their
interaction with RAGE receptors alters intracellular signalling, gene expression,
release of pro-inflammatory molecules and free radicals that all contribute to the
pathology of diabetic complications (Ahmed 2005). For example, AGEs have been
found in the retinal blood vessel walls of diabetic patients and are believed to
contribute to increased permeability of retinal endothelial cells and vascular occlusion,
resulting in vascular leakage (Stitt 2003). Furthermore, the severity of retinopathy has
been shown to directly correlate with serum AGE levels (Peppa et al., 2003).
In diabetic patients, levels of AGEs were also found to be increased in the axons and
Schwann cells of peripheral neurones (Sugimoto et al., 1997). In vitro, Schwann cells
and neuronal cells undergo apoptosis when incubated with AGEs (Takeuchi et al.,
2000; Sekido et al., 2004). This may be due to AGE-induced hypoxia as a result of
vasoconstriction. Whilst AGEs promote nitric oxide synthase expression leading to an
increase in available nitric oxide, they have also been shown to directly react with and
quench nitric oxide. As a result, vasoconstriction occurs and there is consequently

14
reduced blood flow to peripheral nerves (Amore et al., 1997; Bucala et al., 1991;
Chakravarthy et al., 1995; Amore et al., 1997). AGEs also modify neurofilaments and
tubulin, which are structures involved in nerve signalling along axons. This causes a
disturbance in axonal transport, which contributes to the development of atrophy and
degeneration of neurone fibres typical of diabetic neuropathies (Wada and Yagihashi
2005; Vlassara et al., 1981).
Several studies have demonstrated AGE levels in the kidney to be higher in diabetic
patients compared to healthy subjects (Miyata et al., 1997; Monnier et al., 1999; Weiss
et al., 2000; Miura et al., 2003; Monnier et al., 2005; Yoshida et al., 2005). The
characteristic structural changes of diabetic nephropathy, including thickening of the
glomerular basement membrane and mesangial expansion, can all be attributed to the
action of AGEs in the nephron (Peppa et al., 2003). AGEs accumulate on collagen in
the basement membrane, trapping plasma proteins and contributing to basement
membrane thickening. This leads to altered filtration and ultimately loss of glomerular
function (Monnier et al., 1992). Mesangial cells, which modulate glomerular filtration,
express RAGE on their cell surface. In vitro, AGE-RAGE interaction can stimulate
mesangial cells to produce matrix proteins (Dworkin et al., 1983; Schlondorff 1987;
Skolnik et al., 1991). This results in expansion of the mesangial matrix and is thought
to be one of the main factors in diabetic renal impairment due to the effect on
glomerular filtration (Steffes et al., 1989).
AGEs have been identified in atheromatous plaques in the coronary arteries of diabetic
subjects, implicating a role for AGEs in the formation of atherosclerosis and
cardiovascular disease (Obayashi et al., 1996). Endothelial cells, smooth muscle cells
and monocytes have been shown to express RAGE receptors. The interaction of AGE
with RAGE receptors within these cells induce inflammatory response pathways,
atherogenesis and vasoconstriction. Eventually, this leads to atherosclerosis,
thrombosis and coronary dysfunction as demonstrated in the macrovascular
complications of diabetes (Hartog et al., 2007).
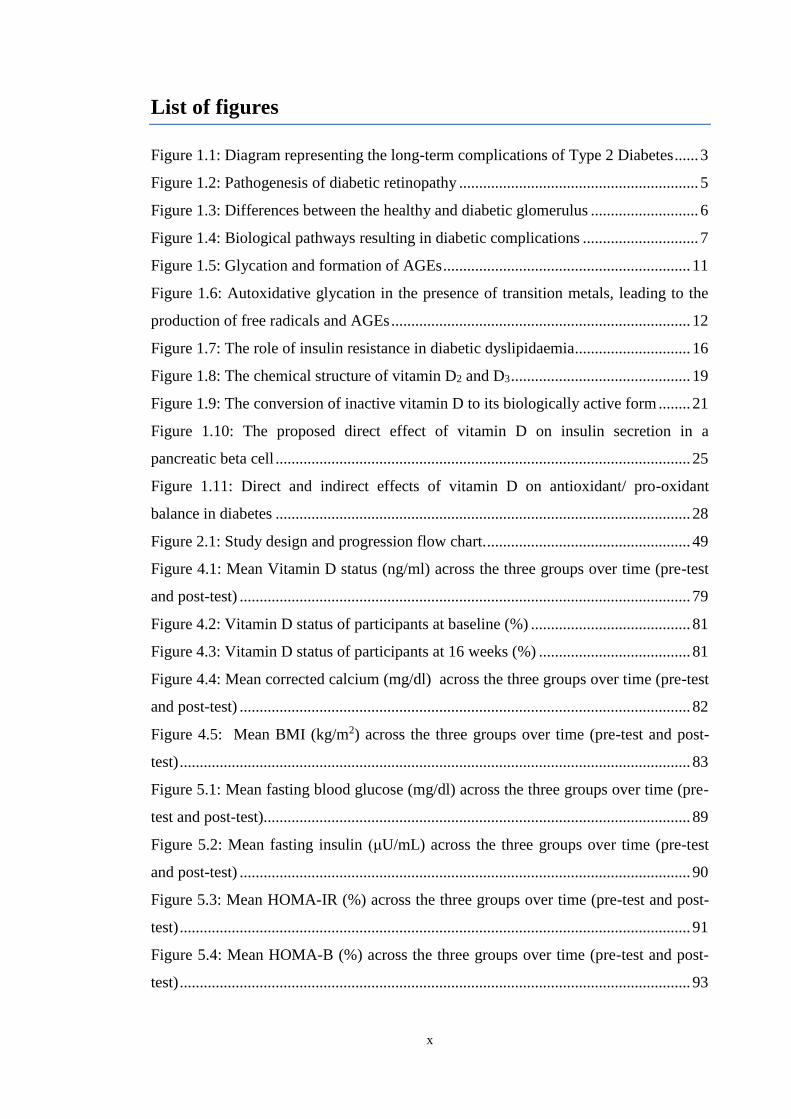
1.5.5 Dyslipidaemia
Dyslipidaemia is one of the major causes of cardiovascular disease in diabetes mellitus
(Mooradian 2009). Type 2 diabetes is associated with characteristically high plasma
triglyceride concentrations, low high density lipoprotein (HDL) concentrations, and

15
increased small dense low density lipoprotein concentrations (sdLDL) (American
Diabetes Association 2003). The exact mechanisms of diabetic dyslipidaemia are still
poorly understood, however growing evidence suggests that insulin resistance has a
crucial role in the pathogenesis of the condition (Mooradian 2009).
1.5.5.1 Pathogenesis of diabetic dyslipidaemia
The fundamental features of diabetic dyslipidaemia can be explained by increased free
fatty-acid release from insulin-resistant adipose tissues (Taskinen 2003; Krauss and
Siri 2004; Del Pilar Solano and Goldberg 2005; Chahil and Ginsberg 2006). In a
healthy individual, when insulin binds to the insulin receptors on adipocytes, the
activity of hormone-sensitive lipase (HSL) within the cell is suppressed (Frayn and
Coppack 1992; Kershaw et al., 2006). In the presence of insulin resistance, HSL is not
suppressed, leading to the hydrolysis of triglycerides to free fatty acids and glycerol
(Frayn and Coppack 1992). Free fatty acids are released into the circulation and travel
to the liver. In the state of insulin resistance, the increased flux of free fatty acids into
the liver stimulates triglyceride production, which in turn promotes the secretion of
apolipoprotein B (ApoB). Apolipoprotein B is a large protein which is the major
component of very-low density lipoprotein (VLDL) cholesterol (Mooradian 2009).
When the ability of insulin to inhibit free fatty-acid release is impaired, VLDL
cholesterol production increases, leading to enhanced hepatic fat accumulation (Frayn
2001; Adiels et al., 2007).
The increased numbers of VLDL cholesterol particles and increased plasma
triglyceride levels decrease the level of HDL cholesterol and increase the concentration
of small dense LDL-cholesterol particles via several processes (see Figure 1.8). Firstly,
cholesteryl ester transfer protein (CETP) acts on VLDL-transported triglyceride,
substituting it for HDL-transported cholesteryl ester. This results in increased amounts
of both atherogenic cholesterol-rich VLDL remnant particles and triglyceride-rich,
cholesterol-depleted HDL particles. The triglyceride-enriched HDL is subsequently
hydrolyzed by hepatic lipase in the liver and readily absorbed by hepatocytes, lowering
circulating concentrations of HDL cholesterol in the blood (Mooradian et al., 2004;
Mooradian et al., 2008).
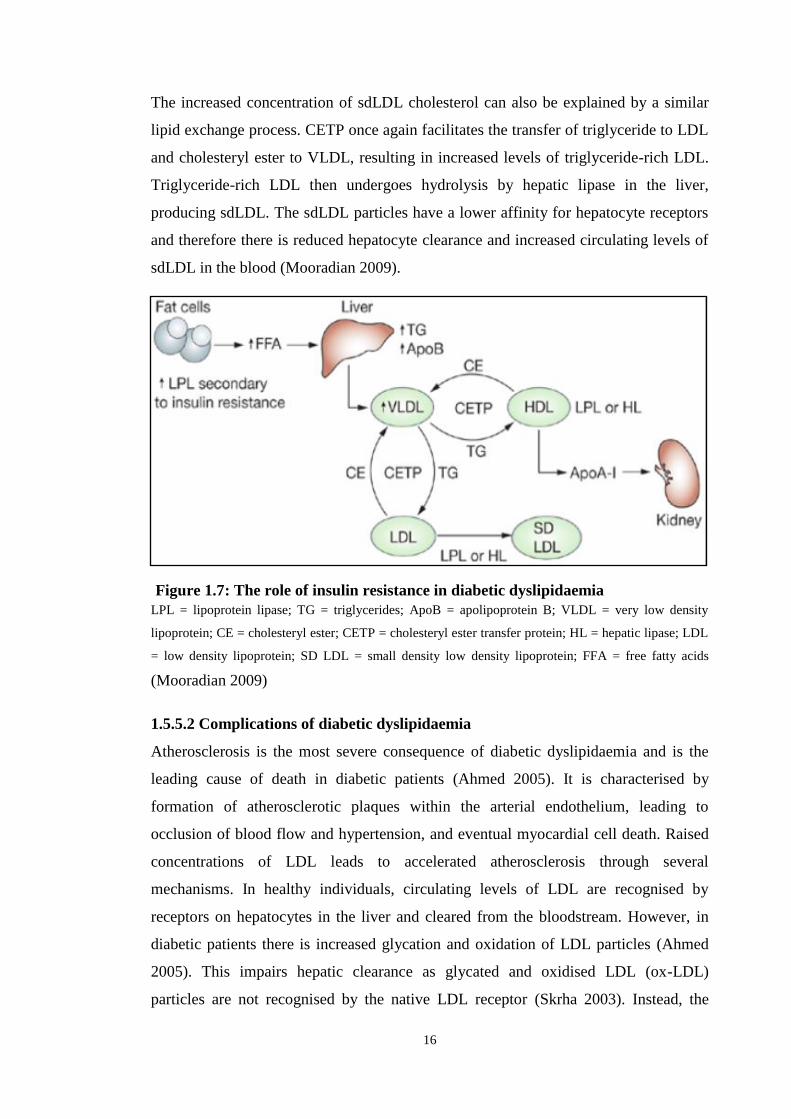
16
The increased concentration of sdLDL cholesterol can also be explained by a similar
lipid exchange process. CETP once again facilitates the transfer of triglyceride to LDL
and cholesteryl ester to VLDL, resulting in increased levels of triglyceride-rich LDL.
Triglyceride-rich LDL then undergoes hydrolysis by hepatic lipase in the liver,
producing sdLDL. The sdLDL particles have a lower affinity for hepatocyte receptors
and therefore there is reduced hepatocyte clearance and increased circulating levels of
sdLDL in the blood (Mooradian 2009).
LPL = lipoprotein lipase; TG = triglycerides; ApoB = apolipoprotein B; VLDL = very low density
lipoprotein; CE = cholesteryl ester; CETP = cholesteryl ester transfer protein; HL = hepatic lipase; LDL
= low density lipoprotein; SD LDL = small density low density lipoprotein; FFA = free fatty acids
(Mooradian 2009)
1.5.5.2 Complications of diabetic dyslipidaemia
Atherosclerosis is the most severe consequence of diabetic dyslipidaemia and is the
leading cause of death in diabetic patients (Ahmed 2005). It is characterised by
formation of atherosclerotic plaques within the arterial endothelium, leading to
occlusion of blood flow and hypertension, and eventual myocardial cell death. Raised
concentrations of LDL leads to accelerated atherosclerosis through several
mechanisms. In healthy individuals, circulating levels of LDL are recognised by
receptors on hepatocytes in the liver and cleared from the bloodstream. However, in
diabetic patients there is increased glycation and oxidation of LDL particles (Ahmed
2005). This impairs hepatic clearance as glycated and oxidised LDL (ox-LDL)
particles are not recognised by the native LDL receptor (Skrha 2003). Instead, the
Figure 1.7: The role of insulin resistance in diabetic dyslipidaemia

17
modified LDL molecules are bound by scavenger receptors on macrophages and their
subsequent transformation into foam cells is accelerated (Skrha 2003). The deposition
of these foam cells within the arterial endothelium provides the basis for the formation
of atherosclerotic plaques and the initial manifestations of cardiovascular disease
(Ahmed 2005).
1.6 Prevention of Diabetic Complications
Complications of diabetes are a significant public health burden leading to increased
morbidity and a decrease in life expectancy (Gu et al., 1998). Diabetic patients with
low fasting plasma glucose (FPG) have been found to have a significantly decreased
risk of both microvascular and macrovascular complications when compared with
those with a higher FPG (Colagiuri et al., 2002). In order to diagnose diabetes a FPG
of 126 mg/dl or a 2-hour postprandial plasma glucose level of 200 mg/dl is required
(WHO, 2006). In type 2 diabetes there is an increase in glycaemic levels as the disease
progresses and studies have shown that patients who present with a lower HbA1c at
diagnosis experience fewer diabetic complications (Colagiuri et al., 2002).
Consequently, intensive glycaemic control is vital in the prevention and delayed
progression of diabetic retinopathy, neuropathy and nephropathy, as well as
cardiovascular disease (Keen 1994; Molyneaux et al., 1998; Stratton et al., 2000).
Whilst maintaining adequate glycaemic control will remain the mainstay of diabetic
treatment, research has begun to consider developing alternative therapies for halting
the progression of diabetic complications (Bonnefont-Rousselot 2001). One such
therapy is the use of certain dietary antioxidants aimed at inhibiting AGE formation
alongside reducing oxidative stress and dyslipidaemia (Golbidi et al., 2011).
1.6.1 Exogenous antioxidants
Many studies have established that oxidative stress, facilitated by hyerglycaemia-
induced free radical production, worsens the progression of diabetes and its related
complications. It has therefore been suggested that diabetic patients may benefit from
supplementation with exogenous antioxidants to ameliorate free radical oxidation and
the subsequent development of micro- and macrovascular complications (Aruoma
1998). Antioxidant supplementation has also been shown to improve hyperglycaemia
and insulin efficiency, as well as limiting the oxidation of low-density lipoproteins
vital to the atherogenesis process (Bonnefont-Rousselot 2001). Furthermore, some
18
antioxidants are able to fight against the harmful effects of AGEs either by preventing
their cellular action or by inhibiting AGE formation altogether (Ahmed 2005). These
findings have prompted several clinical trials using antioxidant supplements in diabetic
patients to limit the long-term complications of the disease. To date the antioxidant
properties of vitamins E and C, and more recently vitamin D, have been studied with
thus far inconclusive results (Golbidi et al., 2011).
1.7 Vitamin D
Whilst the regulation of calcium homeostasis and bone metabolism are the most
widely recognised functions of vitamin D, there is an increasing appreciation for its
non-calcaemic properties; one of the least studied of which is its use as an antioxidant
(Halicka et al., 2012). Numerous cross-sectional studies have demonstrated low serum
concentrations of vitamin D to be associated with higher fasting blood glucose levels,
increased insulin resistance and a greater risk of developing type 2 diabetes
(Saedisomeolia et al., 2013). Initial interventional studies investigating the effect of
vitamin D supplementation on diabetic outcomes have to date provided inconsistent
results (Raghuramulu et al., 1992; Orwoll et al., 1994; Taylor and Wise 1998; De Boer
et al., 2008; Bonakdaran and Afkhami Zadeh 2011; Nikooyeh et al., 2011; Al-Daghri
et al., 2012; Tayebinejad et al., 2012; Nikooyeh et al., 2014; Tabesh et al., 2014;
Mohamad et al., 2015).
1.7.1 Structure and function
Vitamin D (calciferol) is a group of steroids which are fat-soluble and regulate many
biological functions including calcium homeostasis, cell proliferation and
differentiation and immune function (Holick 2007; Tsiaras and Weinstock 2011). The
two most important compounds of vitamin D are vitamin D2 (ergocalciferol) and
vitamin D3 (cholecalciferol). The structure of these two compounds is very similar as
demonstrated in Figure 1.9. Studies have shown vitamin D2 to be less biologically
active than vitamin D3 (Lehmann et al., 2013).

19
(Holick 2007)
There are two main sources of vitamin D: diet and sunlight. However, very few
naturally occurring foods contain either vitamin D2 or vitamin D3 and therefore in
many countries foods such as cereals, milk and butter are often fortified with an
artificial form of the vitamin (Holick 2004; Holick 2007). The majority of vitamin D
comes from ultraviolet B radiation from sunlight (Holick 1994).
Cholecalciferol (D3) is synthesised in the skin layers from 7-dehydrocholesterol when
exposed to ultraviolet (UV) light in the wavelength range 280-320nm (Neyestani
2013). This form of vitamin D is biologically inactive and cannot be utilised by cells
until converted to 1,25-dihydroxycholecalciferol (1,25(OH)2D3) (see Figure 1.10)
(Jones et al., 1998; Holick 2007; Holick 2009). This process of vitamin D metabolism
occurs through two hydroxylation reactions in the liver and kidneys to produce
25(OH)D3 and 1,25(OH)2D respectively. Cytochrome P450 mixed-function oxidases
(CYPs) are responsible for these reactions. CYP2R1, found in the endoplasmic
reticulum of hepatocytes, is the key enzyme for 25-hydroxylation and produces
25(OH)D3. 25(OH)D3 is then transported to the proximal tubules of the kidneys where
CYP27B1, the sole enzyme for 1α-hydroxylation, found in the mitochondria converts
it to 1,25(OH)2D. Another important CYP is CYP24A1, which is responsible for
catabolizing both 25(OH)D3 and 1,25(OH)2D (Bikle 2013).
Active vitamin D is an unstable molecule and will rapidly degrade unless bound to the
vitamin D binding protein (VDBP) in the bloodstream. It is the high affinity of active
vitamin D for this binding protein that gives it many of its biological properties
(Andress 2005). Once the active vitamin D-VDBP complex reaches a target cell, it
must be released from the binding protein. Most tissues of the body have a vitamin D
receptor (VDR) (located on chromosome 12q13.11) which uptakes the active vitamin
Figure 1.8: The chemical structure of vitamin D2 and D3

20
D once released in the target cell (Institute of Medicine Committee to Review Dietary
Reference Intakes for Vitamin 2011; Lee et al., 2011). Once bound to the VDR, active
vitamin D can interact with other transcriptional factors within the target cell nucleus,
affecting gene transcription. One such factor is the retinoid X receptor which allows
recognition of, and binding to, vitamin D responsive elements in the regulatory
sequences of genes under the control of vitamin D (Haussler et al., 2013). This in turn
alters gene expression and cellular activities within the target cell, including protein
synthesis and secretion (Neyestani 2013).

21
Figure 1.9: The conversion of inactive vitamin D to its biologically active form
(Holick 2007)
1.7.2 Factors affecting vitamin D status
In 2008 it was estimated one billion people were diagnosed with vitamin D deficiency
(James 2008). One recent study concluded that serum vitamin D concentrations were
below satisfactory (30 ng/ml) in every region of the world, however severe deficiency
(concentration below 10 ng/ml) was found to be most prevalent in South Asia and the
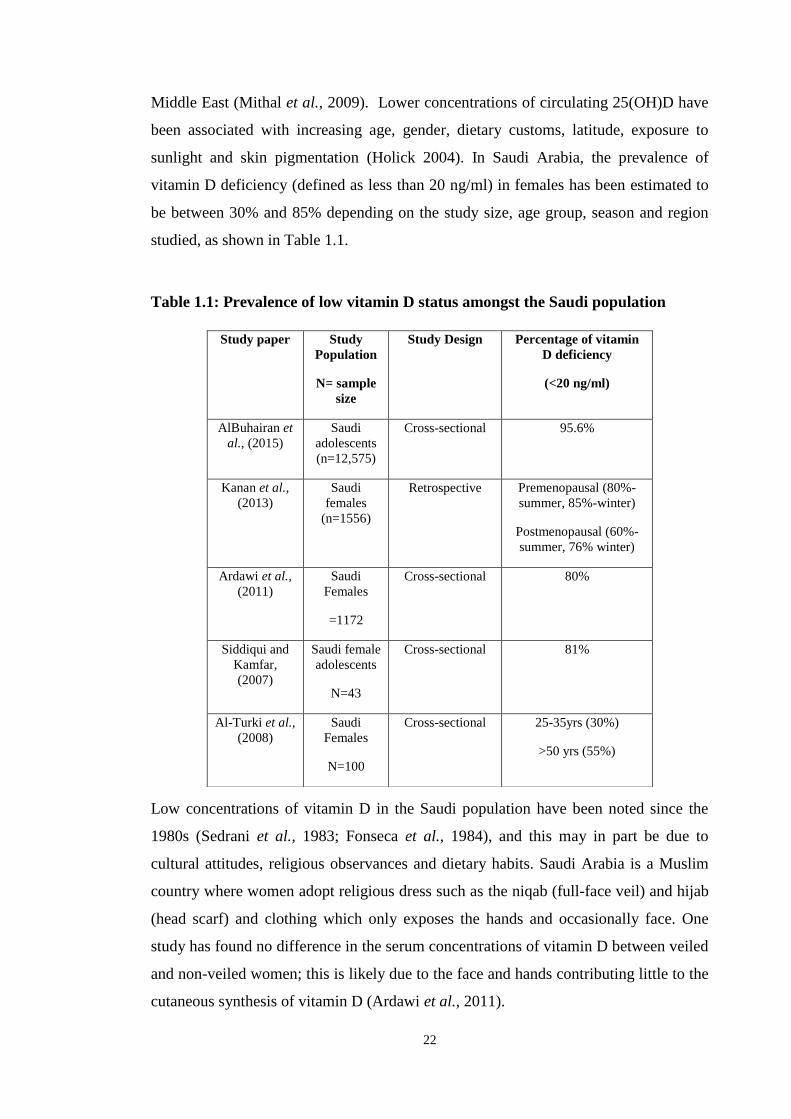
22
Middle East (Mithal et al., 2009). Lower concentrations of circulating 25(OH)D have
been associated with increasing age, gender, dietary customs, latitude, exposure to
sunlight and skin pigmentation (Holick 2004). In Saudi Arabia, the prevalence of
vitamin D deficiency (defined as less than 20 ng/ml) in females has been estimated to
be between 30% and 85% depending on the study size, age group, season and region
studied, as shown in Table 1.1.
Table 1.1: Prevalence of low vitamin D status amongst the Saudi population
Low concentrations of vitamin D in the Saudi population have been noted since the
1980s (Sedrani et al., 1983; Fonseca et al., 1984), and this may in part be due to
cultural attitudes, religious observances and dietary habits. Saudi Arabia is a Muslim
country where women adopt religious dress such as the niqab (full-face veil) and hijab
(head scarf) and clothing which only exposes the hands and occasionally face. One
study has found no difference in the serum concentrations of vitamin D between veiled
and non-veiled women; this is likely due to the face and hands contributing little to the
cutaneous synthesis of vitamin D (Ardawi et al., 2011).
Study paper Study
Population
N= sample
size
Study Design
Percentage of vitamin
D deficiency
(<20 ng/ml)
AlBuhairan et
al., (2015)
Saudi
adolescents
(n=12,575)
Cross-sectional 95.6%
Kanan et al.,
(2013)
Saudi
females
(n=1556)
Retrospective Premenopausal (80%-
summer, 85%-winter)
Postmenopausal (60%-
summer, 76% winter)
Ardawi et al.,
(2011)
Saudi
Females
=1172
Cross-sectional 80%
Siddiqui and
Kamfar,
(2007)
Saudi female
adolescents
N=43
Cross-sectional 81%
Al-Turki et al.,
(2008)
Saudi
Females
N=100
Cross-sectional 25-35yrs (30%)
>50 yrs (55%)

23
Sun exposure in Saudi Arabia may be avoided in part due to the cultural attitude to
favour pale skin colour, along with increased urbanisation (Kanan et al., 2013). In
addition to this, melanin in the skin reduces vitamin D synthesis and therefore the
darker the skin pigmentation, the lower the production of vitamin D for the equivalent
sun exposure (Menon et al., 2013). Dietary intake of vitamin D is dictated by two main
factors: dietary preference and concentration of vitamin D fortification in processed
foods. One study comparing the levels of vitamin D fortification in certain foods such
as cereals or orange juice in America and Saudi Arabia concluded that many of the
Saudi Arabian versions were not fortified at all, and even those that were contained
less fortified vitamin D than the recommended levels in the USA (Sadat-Ali et al.,
2013).
1.7.3 Vitamin D and diabetes
The prevalence of vitamin D deficiency in type 2 diabetics has been found to be almost
double that in non-diabetic subjects (Scragg et al., 1995; Isaia et al., 2001; Scragg et
al., 2004; Al-Zahrani 2013). The risk factors for vitamin D deficiency and type 2
diabetes are often shared and include greater BMI, increasing age, and lack of physical
activity (Brancati et al., 2000; Saintonge et al., 2009). Seasonal fluctuations in glucose
and insulin concentrations have also been demonstrated (Desouza and Meier 1987).
This may, at least in part, be due to variations in 25(OH)D concentrations resulting
from shorter durations of sun exposure in cold seasons (Pittas et al., 2007b).
Furthermore, research has demonstrated that when accompanied by vitamin D
deficiency, type 2 diabetes is associated with a greater risk of cardiovascular mortality
(Cigolini et al., 2006; Joergensen et al., 2010).
These observations have led to a need for randomised clinical trials to investigate the
actual effects of vitamin D intake on the glycaemic status of type 2 diabetics. From
such studies, several theories for the mechanisms of action of vitamin D in diabetes
have been established. Firstly, vitamin D has been shown to improve markers of
glycaemia via increased insulin secretion and reduced peripheral insulin resistance (Al-
Daghri et al., 2012; Soric et al., 2012; Talaei et al., 2013; Labban 2014; Nasri et al.,
2014; Tabesh et al., 2014; Yousefi Rad et al., 2014; Mohamad et al., 2015). Secondly,
an improvement in the lipid profiles of type 2 diabetics has been demonstrated when
supplemented with dietary vitamin D (Raghuramulu et al., 1992; Bonakdaran and
Afkhami Zadeh 2011; Al-Daghri et al., 2012; Tabesh et al., 2014; Mohamad et al.,

24
2015). Finally, vitamin D has been shown to upregulate endogenous antioxidants and
therefore may have the potential to attenuate oxidative stress in diabetic individuals
(Bao et al., 2008).
1.7.3.1 Vitamin D and glycaemia
Several mechanisms have been proposed to explain how vitamin D may improve
markers of glycaemia in diabetic patients. The discovery of the vitamin D receptor on
pancreatic beta cells, as well as the presence of a vitamin D response element (VDRE)
within the promoter region of the insulin gene, have provided robust evidence for a
causal relationship between the vitamin and insulin production (Johnson et al., 1994;
Bland et al., 2004). Furthermore, 1,25(OH)2D has been shown to directly activate
transcription and regulate the expression of the insulin receptor, suggesting vitamin D
has a role in insulin resistance as well as production (Maestro et al., 2000; Maestro et
al., 2002).
Pancreatic beta cells are known to express the vitamin D receptor (VDR). One
hypothesis is that circulating 1,25(OH)2D binds to the VDR on pancreatic beta cells,
initiating a direct cellular response from the vitamin D response element in the
promoter region of the insulin gene. This in turn increases the transcription of the
insulin gene, and therefore the secretion of insulin from the cell (Maestro et al., 2003),
as shown in Figure 1.11 (Pittas et al., 2007b). Pancreatic beta cells have also been
found to express the 25-hydroxyvitamin D-1α-hydroxylase enzyme which converts
25(OH)D to active 1,25(OH)2D within the pancreatic beta cells (Bland et al., 2004).

25
(Adapted from Chiang et al., 2011)
The indirect role of vitamin D in type 2 diabetes is proposed to be through its role in
calcium homeostasis. Vitamin D is known to regulate the concentration of extracellular
calcium and its influx through pancreatic beta cell membranes (Pittas et al., 2007b).
Insulin secretion is a calcium-dependant process and therefore any alteration in
calcium concentrations within pancreatic beta cells caused by low circulating vitamin
D concentrations may negatively influence insulin secretion (Milner and Hales 1967;
Pittas et al., 2007b).
1,25(OH)2D is known to directly activate transcription of the insulin receptor gene
within target cells, increasing the number of peripheral insulin receptors (Maestro et
al., 2002). In turn, this increases cellular insulin responsiveness and decreases overall
insulin resistance (Maestro et al., 2000). The indirect role of vitamin D is likely once
again to be mediated via calcium homeostasis. As previously mentioned, calcium is
essential in certain tissues in order to effectively execute insulin-mediated cellular
processes (Williams et al., 1990; Ojuka 2004) The optimum range of intracellular
calcium that allows for these insulin-mediated cellular functions to work is very
narrow. Therefore any small changes in the intracellular concentration of calcium may
lead to peripheral insulin resistance (Draznin et al., 1987; Draznin et al., 1989).
Studies have however indicated that the effect of vitamin D on insulin resistance is
likely to be less than its effect on pancreatic beta cell function (Orwoll et al., 1994;
Pittas et al., 2007a; Mitri et al., 2011).
Figure 1.10: The proposed direct effect of vitamin D on insulin secretion in a
pancreatic beta cell
26
1.7.3.2 Vitamin D and dyslipidaemia
Whilst vitamin D has been demonstrated to improve the lipid profile in diabetic
patients, the exact mechanisms by which this occurs remain uncertain (Raghuramulu et
al., 1992; Bonakdaran and Afkhami Zadeh 2011; Al-Daghri et al., 2012; Tabesh et al.,
2014; Mohamad et al., 2015). Several hypotheses have however been proposed.
Firstly, it has been suggested that vitamin D increases absorption of intestinal calcium
which in turn reduces the amount of fat absorbed by the gut. Calcium binds to fatty
acids and bile acids, forming calcium-fatty acid soaps which are excreted in the faeces,
decreasing the absorption of fat from the gut (Boon et al., 2007). As a result serum
total and LDL-cholesterol, as well as triglyceride concentrations are reduced (Saunders
et al., 1988; Grundy and Denke 1990; Van der meer et al., 1990; Vaskonen et al.,
2002; Vaskonen 2003; Cho et al., 2005; Zittermann et al., 2009). A second hypothesis
is through the action of vitamin D on serum parathyroid hormone (PTH)
concentrations. PTH has been shown to reduce lipolysis in vitro. As vitamin D
suppresses PTH secretion in the body it may reduce serum lipids via increased
peripheral removal (Zemel et al., 2000).
HDL cholesterol is comprised of 70% apolipoprotein A-1 (Apo-A1) and an increase in
serum concentrations of this protein is known to lead to a direct increase in HDL
particle formation and increased reverse cholesterol transport (Vacek et al., 2012;
Teixeira et al., 2014). Apolipoprotein A1 has been demonstrated to persistently
correlate with vitamin D concentrations (Satin 2000; Gagnon et al., 2012; Salum et al.,
2012; Vacek et al., 2012). Furthermore, the expression of the apolipoprotein gene in
hepatocytes (HepG2) and intestinal (CaCo-2) cells, responsible for production of the
apolipoproteins A-1 and B, is known to be regulated by vitamin D receptor modulators
(Wehmeier et al., 2008).
1.7.3.3 Vitamin D and oxidative stress
It is only in recent years that a possible relationship between vitamin D and oxidative
stress has gained attention. Current animal studies have shown vitamin D deficiency to
promote oxidative stress, whilst supplementation with the vitamin has been shown to
upregulate the antioxidant enzymes superoxide dismutase (SOD), catalase and
glutathione peroxidase (GSH-Px) by up to 200% in diabetic rats (Kallay et al., 2002;
Hamden et al., 2009; Argacha et al., 2011). However, the antioxidant properties of
vitamin D in improving markers of diabetes are only recently coming to light and data

27
remains scarce (Nikooyeh et al., 2011; Tayebinejad et al., 2012; Nikooyeh et al.,
2014). As previously demonstrated, chronic hyperglycaemia can induce oxidative
stress via several mechanisms. In one recent cross sectional study on diabetic subjects
a significant inverse relationship was demonstrated between vitamin D and markers of
oxidative stress, including LDL susceptibility to oxidation and AGEs (Gradinaru et al.,
2012).
There are multiple possible mechanisms by which vitamin D may influence oxidative
stress levels. In vitro studies have shown calcitriol to have an inhibitory effect on
RAGE expression and protein glycation, indicating that vitamin D may protect against
AGE formation (Yamagishi et al., 2008). In vitamin D deficient subjects, PTH levels
are known to be raised, leading to activation of 1a-hydroxylation of 25(OH)D in the
kidneys to produce 1,25(OH)2D. This in turn increases intracellular calcium and the
promotion of reactive oxygen species (Vidal et al., 2006; Sun and Zemel 2007).
Furthermore, some experimental findings have demonstrated vitamin D to upregulate
endogenous antioxidants, most notably glutathione (Neyestani 2013). However, other
studies have found 25(OH)D to have no beneficial effect on antioxidant defenses
(Noyan et al., 2005; Eftekhari et al., 2013; Yiu et al., 2013). The mechanisms by
which vitamin D may play a role in limiting the progression of diabetic complications
are summarised in Figure 1.12.

28
(Neyestani 2013)
1.7.4 Previous related research
The exact mechanism by which vitamin D plays a role in the development and
progression of type 2 diabetes remains controversial. The earliest studies appear to
demonstrate no improvement in glycaemic control following supplementation with
vitamin D (Orwoll et al., 1994). More recently however, many trials have found a
positive association between vitamin D supplementation and improved markers of
glycaemic control (Al-Daghri et al., 2012; Soric et al., 2012; Talaei et al., 2013;
Labban 2014; Nasri et al., 2014; Tabesh et al., 2014; Yousefi Rad et al., 2014;
Mohamad et al., 2015). Similarly, the existing literature has yielded inconsistent
results on the role of vitamin D in improving the lipid profile in type 2 diabetics. The
majority of studies have demonstrated no improvement in dyslipidaemia when vitamin
D supplements are given (Jorde and Figenschau 2009; Patel et al., 2010; Witham et al.,
2010; Breslavsky et al., 2013; Eftekhari et al., 2013; Talaei et al., 2013; Yiu et al.,
2013; Al-Zahrani et al., 2014; Kampmann et al., 2014; Yousefi Rad et al., 2014; Al-
Figure 1.11: Direct and indirect effects of vitamin D on antioxidant/ pro-oxidant
balance in diabetes
Antioxidants
↓ Insulin resistance
↑Insulin secretion
↑ Insulin function
↓ Adipogenesis
↓ Inflammation
Vitamin D
;D supplementation
Immunomodulation
Development of complications of diabetes ↓
Proxidants
Antioxidant/ Proxidant balance

29
Shahwan et al., 2015; Al-Sofiani et al., 2015; Sadiya et al., 2015). However several
studies exist which contradict this and have displayed significant improvements in the
lipid profile following supplementation (Raghuramulu et al., 1992; Bonakdaran and
Afkhami Zadeh 2011; Al-Daghri et al., 2012; Tabesh et al., 2014; Mohamad et al.,
2015).
Few studies exist which have analysed the effect of vitamin D on oxidative stress and
AGEs in human subjects (Tayebinejad et al., 2012; Yiu et al., 2013; Nikooyeh et al.,
2014; Krul-Poel et al., 2015; Shab-Bidar et al., 2015). However, of those one-third
have demonstrated a significant reduction in AGEs following vitamin D
supplementation (Tayebinejad et al., 2012; Nikooyeh et al., 2014). To the best of the
researcher’s knowledge, only one study exists demonstrating a reduction in oxidative
stress following vitamin D supplementation (Shab-Bidar et al., 2015). The findings of
these studies are summarised in Table 1.2.

30
Table 1.2: Vitamin D intervention studies in diabetic and obese patients.
Study paper Study Population
N= sample size
Inclusion
Criteria
Study
design
Length
of
interven
tion
Type and
Dose of
Vitamin D
Outcome measures Association
(+ p value)
serum
25(OH)D,
at baseline
serum
25(OH)D,
at end of
study
(Raghuramulu
et al., 1992)
N=42
30-60 yrs
T2DM (India)
Intervention
1 month
25(OH)D3
300,000 IU
IM injection
Cholesterol
Calcium
Fasting serum insulin
Yes (p <0.02)
Yes (p <0.01)
Increased but not
significantly
N/A
N/A
(Orwoll et al.,
1994)
N=20
40-70 yrs
T2DM (USA)
Double-
blind RCT
4 days
1, 25(OH)D2
200 IU/day
1,25-
Dihydroxyvitamin D
FBS, Insulin
secretion, Calcium
No significant change
No significant change
N/A
N/A
(Taylor and
Wise 1998)
N= 3
Male=1
Female=2
T2DM (UK)
Case study
3 months
Ergocalciferol
300,000 IU
stat
IM injection
serum 25(OH)D,
FBS, TG, fasting
inulin
HbA1c
Increase in all, not
significant
Decreased significantly
Patient 1=
5.2 ng/ml
Patient 2=
5.2 ng/ml
Patient 3=
3.2 ng/ml
Patient 1=
20.4 ng/ml
Patient 2=
18.8 ng/ml
Patient 3=
13.2 ng/ml
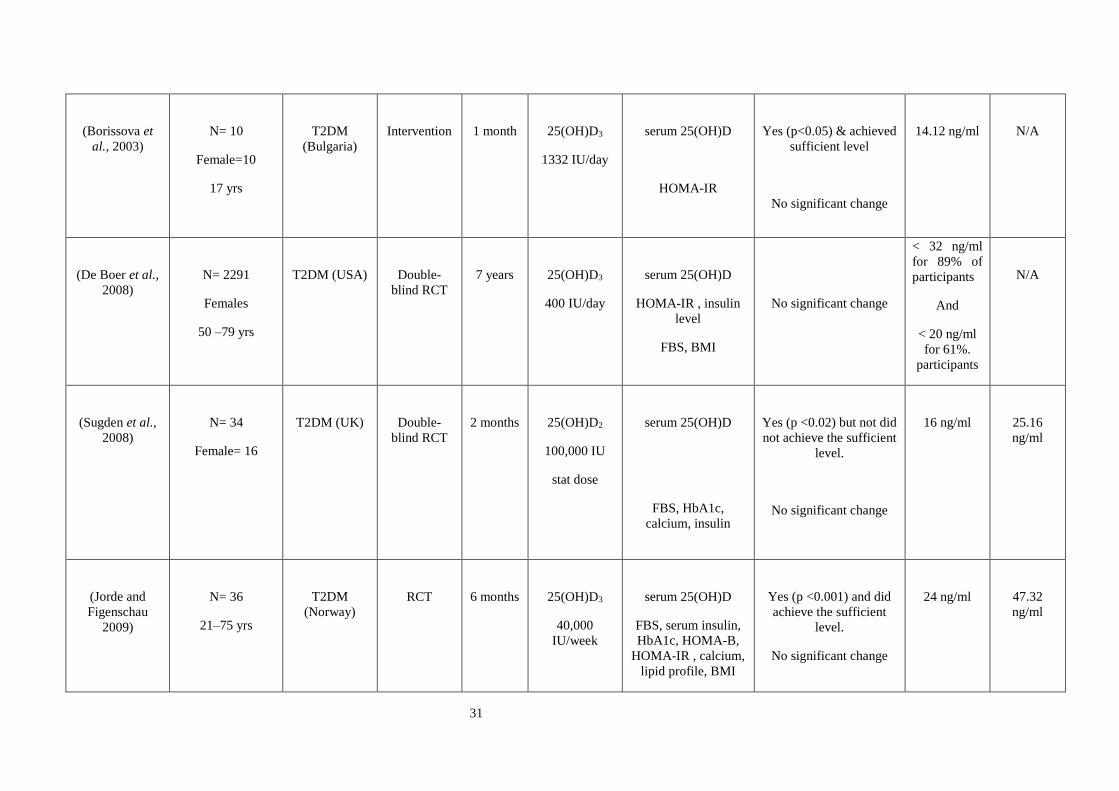
31
(Borissova et
al., 2003)
N= 10
Female=10
17 yrs
T2DM
(Bulgaria)
Intervention
1 month
25(OH)D3
1332 IU/day
serum 25(OH)D
HOMA-IR
Yes (p<0.05) & achieved
sufficient level
No significant change
14.12 ng/ml
N/A
(De Boer et al.,
2008)
N= 2291
Females
50 –79 yrs
T2DM (USA)
Double-
blind RCT
7 years
25(OH)D3
400 IU/day
serum 25(OH)D
HOMA-IR , insulin
level
FBS, BMI
No significant change
< 32 ng/ml
for 89% of
participants
And
< 20 ng/ml
for 61%.
participants
N/A
(Sugden et al.,
2008)
N= 34
Female= 16
T2DM (UK)
Double-
blind RCT
2 months
25(OH)D2
100,000 IU
stat dose
serum 25(OH)D
FBS, HbA1c,
calcium, insulin
Yes (p <0.02) but not did
not achieve the sufficient
level.
No significant change
16 ng/ml
25.16
ng/ml
(Jorde and
Figenschau
2009)
N= 36
21–75 yrs
T2DM
(Norway)
RCT
6 months
25(OH)D3
40,000
IU/week
serum 25(OH)D
FBS, serum insulin,
HbA1c, HOMA-B,
HOMA-IR , calcium,
lipid profile, BMI
Yes (p <0.001) and did
achieve the sufficient
level.
No significant change
24 ng/ml
47.32
ng/ml
32
(Witham et al.,
2010)
N= 61
18 years+
T2DM
(Scotland)
Double-
blind RCT
4 months
25(OH)D3
100,000 IU ,
or
200,000 IU
stat oral dose
serum 25(OH)D
HbA1c, HOMA-IR,
cholesterol
Yes (p =0.003) only
sufficient in the 200,000
IU group
No significant change
N/A
100,000 IU
group =
23.6 ng/ml
200,000 IU
group =
30.4 ng/ml
Patel, 2010
N= 24
Male=7
Female=17
T2DM (Israel)
Pilot
prospective
randomized
trial no
control
4 months
25(OH)D3
400 IU/day
or
1200 IU/day
serum 25(OH)D
HbA1c, FBS, lipid
profile, BMI, calcium
Yes (p<0.001) but did
not achieve the sufficient
level at either dose
No significant change
400 IU/day
group = 17.6
ng/ml
1200 IU/day
group = 15.6
ng/ml
400 IU/day
group =
25.5 ng/ml
1200
IU/day
group =
27.4 ng/ml
(Bonakdaran
and Afkhami
Zadeh 2011)
N= 58
T2DM (Iran)
Intervention
study
2 months
1,25(OH)2D3
(calcitriol)
0.5 microgram
per day
FBS, HbA1c,
cholesterol, TG,
HOMA-IR,
LDL
Decrease but not
significantly
Significant decrease
N/A
N/A

33
(Al-Daghri et
al., 2012)
N= 92
Male=34
Female=58
30-70 yrs
T2DM (Saudi)
Non-RCT,
Intervention
18
months
25(OH)D3
2000 IU/day
serum 25(OH)D
Corrected calcium
LDL
TC
HOMA-B
HOMA-IR, Insulin
Yes (p < 0.001) but did
not achieve the sufficient
level.
Yes (p =0.003)
Yes (p =0.004)
Yes (p <0.001)
Yes (p =0.002)
Yes (p <0.0001)
Summary: improved
lipid profile more
significant in females
12.88 ng/ml
21.88
ng/ml
Soric, 2012
N= 37
Female = 22 21–
75 yrs
T2DM (USA)
Single-blind
RCT
3 months
25(OH)D3
2000 IU/day
HbA1c
Significant decrease (p <
0.013) in patients with
baseline HbA1c >9%
N/A
N/A

34
Heshmat, 2012
N= 42
Male=15
Female=27
37-79 years
T2DM (Iran)
Double-
blind RCT
3 months
25(OH)D3
300,000 IU
stat IM
injection
serum 25(OH)D
HbA1c, HOMA-IR,
BMI, FBS
Yes (p = 0.009) and did
achieve the sufficient
level
No significant change
46.9 ng/ml
69.3 ng/ml
Tayebinejad,
2012
N= 60
Males and
females
30-60 years
T2DM
(Iran)
RCT
3 months
25(OH)D3
fortified
yogurt drink
1000IU/day
vitamin D
25(OH)D
Serum of AGEs
FBS
HbA1c
HOMA-IR
Yes (p<0.001) and
achieve the sufficient
level.
Yes (p = 0.029)
Yes (p = 0.016)
Yes (p = 0.001)
Yes (p < 0.001)
16.24 ng/ml
30.72
ng/ml
Breslavsky,
2013
N= 47
Male=22
Female=25
T2DM (Israel)
Double-
blind RCT
12
months
25(OH)D3
1000 IU/day
serum 25(OH)D
FBS, serum insulin,
HbA1c, HOMA-B,
HOMA-IR, lipid
profile
No significant change
11.8 ng/ml
17.6 ng/ml
35
Yiu, 2013
N= 100
Male = 50
Female = 50
T2DM (Hong
Kong)
Double-
blind RCT
3 months
25(OH)D3
5000 IU/day
serum 25(OH)D
Oxidative stress,
FBS,HbA1c,
lipid profile
Yes (p <0.001) and
achieved the sufficient
level
No significant change
21.1 ng/ml
58.6 ng/ml
Talaei, 2013
N= 100
70% women
30%men
30 to 70 years
T2DM (Iran)
Single blind
study
2 months
25(OH)D3
50,000
IU/week
serum 25(OH)D
lipid profile
serum insulin
HOMA-IR
FBS
Yes (p =0.02) but were
already sufficient at
baseline
No significant change
Yes (p =0.02)
Yes (p =0.008)
Yes (p =0.02)
43.03 ng/ml
60.12
ng/ml
36
Alkharfy, 2013
N= 499
Male=267
Female=232
21-60 years
T2DM (Saudi)
RCT
12
months
25(OH)D3
2000 IU/day
serum 25(OH)D
BMI, FBS
TG, LDL, Total
cholesterol, HDL
Yes (p =0.04) but did not
achieve sufficient levels
No significant change
Yes (p <0.001 )
13.64 ng/ml
19.24
ng/ml
Eftekhari, 2013
N= 70
Male=35
le=35
30-75 years
T2DM (Iran)
Double-
blind RCT
3 months
2 x capsules of
calcitriol (0.25
µg
1,25dihydroxy
cholecalciferol
per capsule)
per day
HDL, oxidative
stress
LDL, Total
cholesterol, TG
No significant change
No significant change
N/A
N/A
Ryu, 2014
N= 62
47 to 63 years
T2DM
(Korea)
RCT
6 months
2000 IU/day +
calcium
25(OH)D
HOMA-IR, FBS,
Total cholesterol,
HDL, TG , HbA1c,
BMI
Yes (p < 0.001) and
achieve the sufficient
level
No significant change
12.3 ng/ml
35.4 ng/ml
37
Yousefi RAD,
2014
N= 58
Male=36
Female=22
30-60 years
T2DM (Iran)
Double-
blind RCT
2 months
25(OH)D3
4000 IU/day
serum 25(OH)D
HbA1c
insulin concentration
HDL
LDL, Total
cholesterol, TG
Yes (p <0.001) but did
not achieve sufficient
level
Yes (p =0.001)
Yes (p =0.027)
Significantly increased
No significant change
15.55 ng/ml
27.50
ng/ml
Labban, 2014
N= 722
Male= 360
Female= 362
36 to 61 years
T2DM
(Morocco)
RCT
2 months
25(OH)D3
2000 IU/day
serum 25(OH)D
HbA1c
Increased significantly
(p<0.001) but did not
achieve the sufficient
level
yes (p=0.02)
14.23 ng/ml
23.89
ng/ml

38
Alzahrani, 2014
N= 248
T2DM (Saudi)
RCT
3 months
25(OH)D3
45000 IU/day
for 2 months
Stat dose
45,000 IU in
the last month
serum 25(OH)D
HbA1c, FBS, lipid
profile,
BMI
Yes (p =0.01) and
achieved the sufficient
level
No significant change
10.12 ng/ml
33.12
ng/ml
Kampmann,
2014
N= 16
Male=8
Female=8
18 years+
T2DM
(Denmark)
Double-
blind RCT
3 months
25(OH)D3
11,200 IU/day
for 2 weeks
5,600 IU/day
for 10 weeks
serum 25(OH)D
HbA1c, HOMA,
BMI, lipid profile,
calcium, FBS, serum
insulin
Insulin secretion
Yes (p =0.02) and
achieve the sufficient
level
No significant change
Increased but not
significantly
12.4 ng/ml
41.96
ng/ml

39
Tabesh, 2014
N= 118
Female=60
30 years +
T2DM (Iran)
Double-
blind RCT
2 months
25(OH)D3
50,000
IU/week
vitamin D +
1,000 mg/day
calcium
Serum 25(OH)D
Serum insulin,
HbA1c, HOMA-IR,
LDL, Total
cholesterol,
HOMA-B, HDL
BMI
Yes (p <0.001) but not
did not achieve the
sufficient level
Reduced significantly
Significant increase
No significant
change
11.2 ng/ml
N/A
Nikooyeh, 2014
N= 90
Males and
females
30-60 years
T2DM
(Iran)
RCT
3 months
25(OH)D3
fortified
yogurt drink
1000IU/day
vitamin D
25(OH)D
Serum of AGEs
HbA1c
Markers of oxidative
stress
Yes (p<0.001) but
already had sufficient
levels at baseline
Yes (p <0.001)
Yes (p < 0.001)
No significant change
44.5 ng/ml
74.6 ng/ml
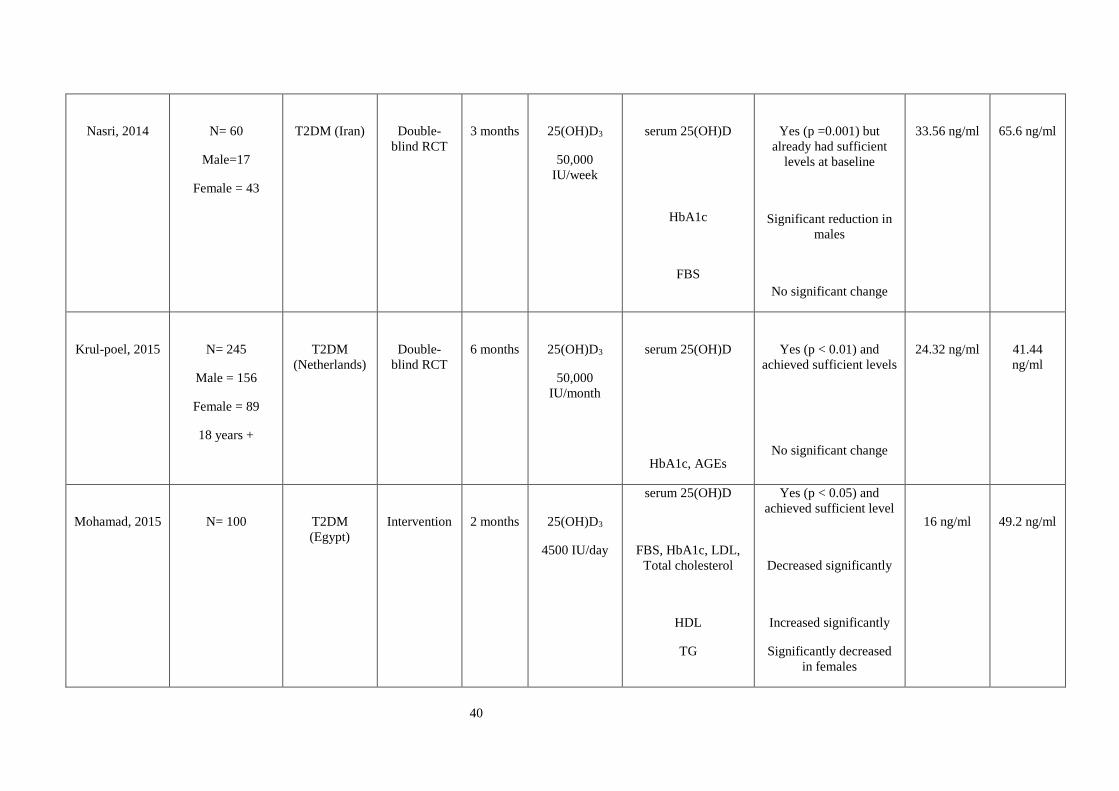
40
Nasri, 2014
N= 60
Male=17
Female = 43
T2DM (Iran)
Double-
blind RCT
3 months
25(OH)D3
50,000
IU/week
serum 25(OH)D
HbA1c
FBS
Yes (p =0.001) but
already had sufficient
levels at baseline
Significant reduction in
males
No significant change
33.56 ng/ml
65.6 ng/ml
Krul-poel, 2015
N= 245
Male = 156
Female = 89
18 years +
T2DM
(Netherlands)
Double-
blind RCT
6 months
25(OH)D3
50,000
IU/month
serum 25(OH)D
HbA1c, AGEs
Yes (p < 0.01) and
achieved sufficient levels
No significant change
24.32 ng/ml
41.44
ng/ml
Mohamad, 2015
N= 100
T2DM
(Egypt)
Intervention
2 months
25(OH)D3
4500 IU/day
serum 25(OH)D
FBS, HbA1c, LDL,
Total cholesterol
HDL
TG
Yes (p < 0.05) and
achieved sufficient level
Decreased significantly
Increased significantly
Significantly decreased
in females
16 ng/ml
49.2 ng/ml
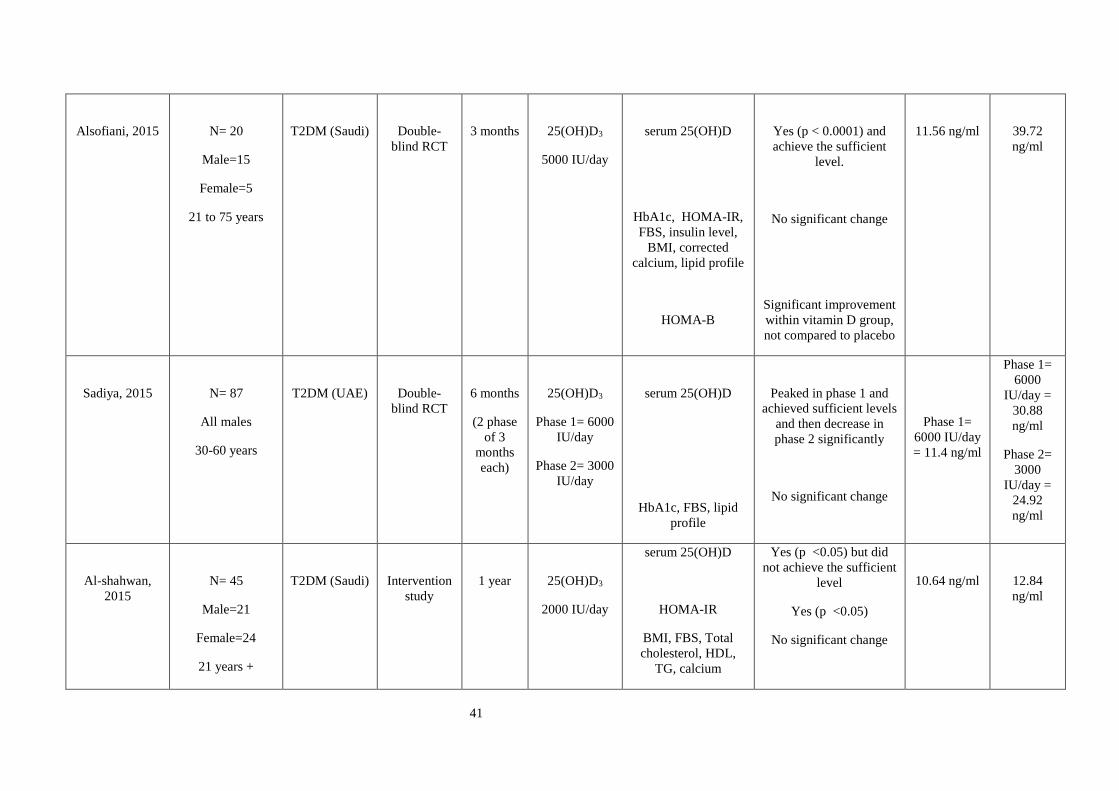
41
Alsofiani, 2015
N= 20
Male=15
Female=5
21 to 75 years
T2DM (Saudi)
Double-
blind RCT
3 months
25(OH)D3
5000 IU/day
serum 25(OH)D
HbA1c, HOMA-IR,
FBS, insulin level,
BMI, corrected
calcium, lipid profile
HOMA-B
Yes (p < 0.0001) and
achieve the sufficient
level.
No significant change
Significant improvement
within vitamin D group,
not compared to placebo
11.56 ng/ml
39.72
ng/ml
Sadiya, 2015
N= 87
All males
30-60 years
T2DM (UAE)
Double-
blind RCT
6 months
(2 phase
of 3
months
each)
25(OH)D3
Phase 1= 6000
IU/day
Phase 2= 3000
IU/day
serum 25(OH)D
HbA1c, FBS, lipid
profile
Peaked in phase 1 and
achieved sufficient levels
and then decrease in
phase 2 significantly
No significant change
Phase 1=
6000 IU/day
= 11.4 ng/ml
Phase 1=
6000
IU/day =
30.88
ng/ml
Phase 2=
3000
IU/day =
24.92
ng/ml
Al-shahwan,
2015
N= 45
Male=21
Female=24
21 years +
T2DM (Saudi)
Intervention
study
1 year
25(OH)D3
2000 IU/day
serum 25(OH)D
HOMA-IR
BMI, FBS, Total
cholesterol, HDL,
TG, calcium
Yes (p <0.05) but did
not achieve the sufficient
level
Yes (p <0.05)
No significant change
10.64 ng/ml
12.84
ng/ml
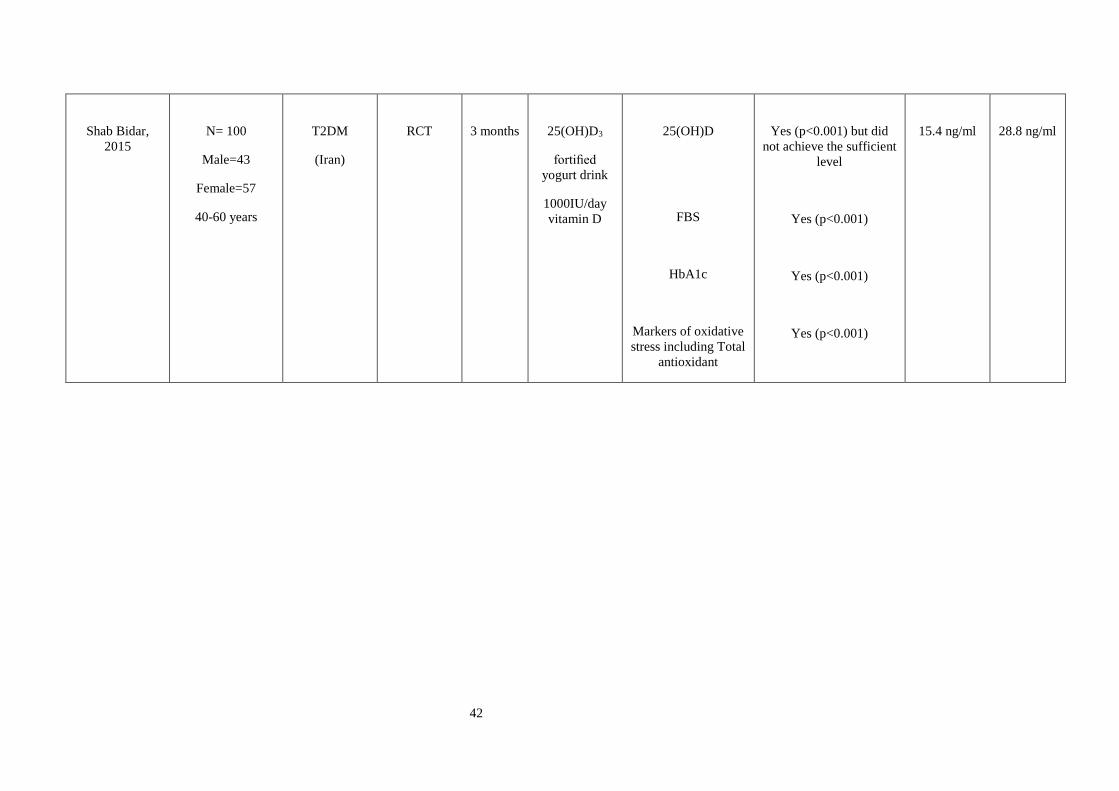
42
Shab Bidar,
2015
N= 100
Male=43
Female=57
40-60 years
T2DM
(Iran)
RCT
3 months
25(OH)D3
fortified
yogurt drink
1000IU/day
vitamin D
25(OH)D
FBS
HbA1c
Markers of oxidative
stress including Total
antioxidant
Yes (p<0.001) but did
not achieve the sufficient
level
Yes (p<0.001)
Yes (p<0.001)
Yes (p<0.001)
15.4 ng/ml
28.8 ng/ml

43
As shown in Table 1.2, evidence from recent experimental and observation studies has
highlighted a potential role for vitamin D in improving glycaemic control,
dyslipidaemia and markers of oxidative damage in diabetic patients. Vitamin D has
been demonstrated to improve pancreatic beta cell function and decrease insulin
resistance, reduce serum LDL-cholesterol and triglyceride levels and to upregulate
potent endogenous antioxidants to combat oxidative stress. Despite these encouraging
developments, the role of vitamin D supplementation in diabetes remains controversial
and there are still many questions that need to be answered. In the Saudi population
where both type 2 diabetes and vitamin D deficiency are so prevalent, the potential for
vitamin D as an adjuvant to conventional diabetic therapies is all the more exciting.
1.8 Aims and objectives
The aim of this study was to understand glycaemia, dyslipdaemia and oxidative stress
in Saudi Arabian women who were vitamin D deficient with poorly controlled type 2
diabetes.
The objectives were as follows:
• To assess the effect of vitamin D3 supplementation on markers of glycaemia,
including fasting serum glucose level, insulin resistance and secretion, and
glycated haemoglobin in Saudi adult females
• To assess the effect of vitamin D3 supplementation on diabetic dyslipidaemia,
including serum low density lipoprotein (LDL), high density lipoprotein
(HDL), triglycerides (TG) and total cholesterol in Saudi adult females
• To assess the effect of vitamin D3 supplementation on oxidative stress,
including total serum antioxidant levels and advanced glycation endproducts
(AGEs) in Saudi adult females
• To establish whether different doses of vitamin D3 elicit different responses in
relation to markers of glycaemia, dyslipidaemia and oxidative stress

44
Chapter 2. Materials & Methods
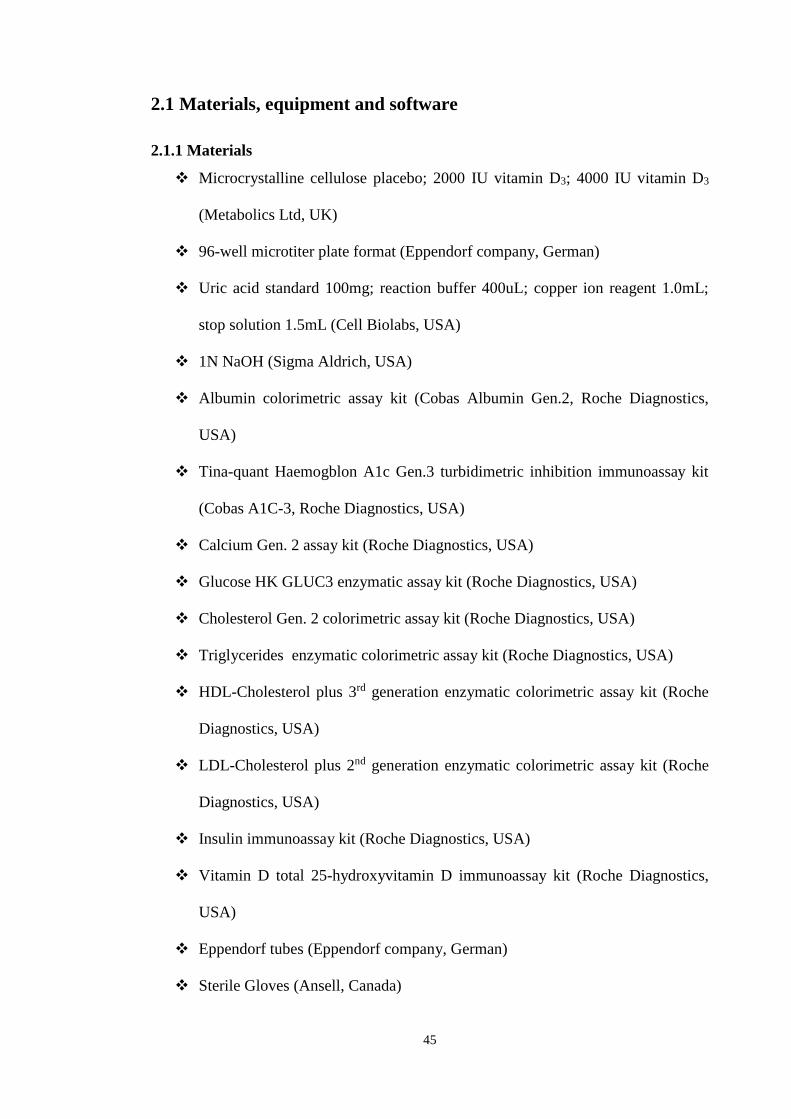
45
2.1 Materials, equipment and software
2.1.1 Materials
❖ Microcrystalline cellulose placebo; 2000 IU vitamin D3; 4000 IU vitamin D3
(Metabolics Ltd, UK)
❖ 96-well microtiter plate format (Eppendorf company, German)
❖ Uric acid standard 100mg; reaction buffer 400uL; copper ion reagent 1.0mL;
stop solution 1.5mL (Cell Biolabs, USA)
❖ 1N NaOH (Sigma Aldrich, USA)
❖ Albumin colorimetric assay kit (Cobas Albumin Gen.2, Roche Diagnostics,
USA)
❖ Tina-quant Haemogblon A1c Gen.3 turbidimetric inhibition immunoassay kit
(Cobas A1C-3, Roche Diagnostics, USA)
❖ Calcium Gen. 2 assay kit (Roche Diagnostics, USA)
❖ Glucose HK GLUC3 enzymatic assay kit (Roche Diagnostics, USA)
❖ Cholesterol Gen. 2 colorimetric assay kit (Roche Diagnostics, USA)
❖ Triglycerides enzymatic colorimetric assay kit (Roche Diagnostics, USA)
❖ HDL-Cholesterol plus 3rd generation enzymatic colorimetric assay kit (Roche
Diagnostics, USA)
❖ LDL-Cholesterol plus 2nd generation enzymatic colorimetric assay kit (Roche
Diagnostics, USA)
❖ Insulin immunoassay kit (Roche Diagnostics, USA)
❖ Vitamin D total 25-hydroxyvitamin D immunoassay kit (Roche Diagnostics,
USA)
❖ Eppendorf tubes (Eppendorf company, German)
❖ Sterile Gloves (Ansell, Canada)
46
❖ Deionized water (Local store, Saudi Arabia)
2.1.2 Equipment
❖ Automated electrochemiluminescence assays (Roche Cobas E601, USA)
❖ Automated electrochemiluminescence assays (Roche Cobas E501, USA)
❖ OxiSelect TAC assay kit (Cell Biolabs, USA)
❖ Pipettes (Eppendorf company, German)
❖ Spectrophotometric microplate reader (BioTek, USA)
❖ AGE reader (Diagnoptics Technologies B.V., Groningen, the Netherlands)
❖ 50uL to 300uL adjustable single and multichannel micropipettes (Eppendorf
company, German)
❖ Standard tape measure (Seca, Germany)
❖ Free-standing stadiometer (Seca, Germany)
❖ Weighing scales (Seca, Germany)
❖ 21G needle (BD, USA)
❖ EDTA, serum and lithium heparin tubes for blood collection (BD Vacutainer®,
USA)
❖ Centrifuge 5702 (Eppendorf, Germany)
❖ Laboratory freezer minus 20 (Philip Kirsch, German)
❖ Laboratory freezer at minus 80 (Philip Kirsch, German)
❖ Laboratory fridge (Philip Kirsch, German)
❖ Orbital shaker (Lab tech, Korea)
❖ Informed consent form (see appendices)
❖ Pre-screening questionnaire (see appendices)
❖ Supplement recording calendar (see appendices)
❖ Debriefing questionnaire (see appendices)

47
❖ Blood analysis flow chart (see appendices)
2.1.3 Software
❖ Microsoft office 2013 (Microsoft, USA)
❖ Statistics Package for Social Sciences (SPSS, version 20 for Windows) (SPSS
Inc., Chicago, USA)
❖ Microsoft excel 2013 (Microsoft, USA)
❖ Powerful statistical software (Minitab 17) (Minitab Inc, USA)
❖ Microsoft Paint (Microsoft, USA)
❖ BMI calculator (NHS Tools, UK)
2.2 Ethical approval
Ethical approval was granted on the 8th August 2013 by the Manchester Metropolitan
Ethics Committee. Authorisation from Al-Noor Specialist Hospital, Saudi Arabia, was
received on the 9th December 2013, and submitted to the Manchester Metropolitan
Ethics Committee. Ethical approval was also granted from the Ethics committee at Al-
Noor Specialist Hospital, Saudi Arabia, following receipt of the research proposal.
Funding has been granted through the Saudi Arabian Government Scholarship scheme
by the Saudi Arabian Culture Bureau.
2.3 Study overview
In this study, 156 poorly-controlled T2DM Saudi female patients were recruited from
Al-Noor hospital (Saudi Arabia), between December 2013 and January 2014. Subjects
who met the inclusion criteria (Figure 2.1) were randomly allocated to one of three test
groups: placebo, 2000 IU vitamin D3 daily and 4000 IU vitamin D3 daily.
Participants were referred to the study by the consultant overseeing their care. If the
participant met the inclusion criteria they were invited for an initial meeting between
the participant and researcher where the objectives and expectations were outlined and
informed consent obtained and documented clearly. Anthropometric measurements
were taken, along with blood samples for analysis and a 16-week course of

48
supplements were allocated. A follow-up appointment was made at 16 weeks where
repeat blood samples and anthropometric measurements were taken, a debriefing
questionnaire completed and any remaining supplements collected. The general outline
of the study is shown in Figure 2.1.
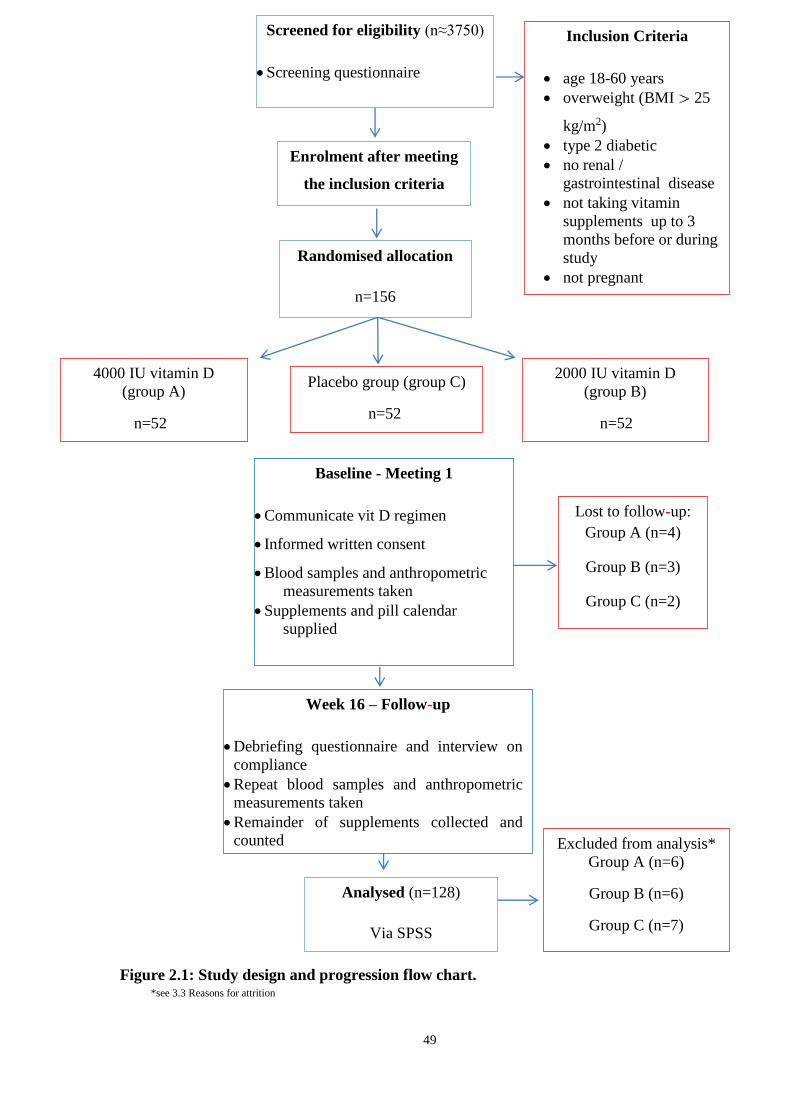
49
*see 3.3 Reasons for attrition
Figure 2.1: Study design and progression flow chart.
Enrolment after meeting
the inclusion criteria
Screened for eligibility (n≈3750)
• Screening questionnaire
Inclusion Criteria
• age 18-60 years
• overweight (BMI 25
kg/m2)
• type 2 diabetic
• no renal /
gastrointestinal disease
• not taking vitamin
supplements up to 3
months before or during
study
• not pregnant
• not hypercalcaemia
Randomised allocation
n=156
4000 IU vitamin D
(group A)
n=52
Placebo group (group C)
n=52
2000 IU vitamin D
(group B)
n=52
Baseline - Meeting 1
• Communicate vit D regimen
• Informed written consent
• Blood samples and anthropometric
measurements taken
• Supplements and pill calendar
supplied
Week 16 – Follow-up
• Debriefing questionnaire and interview on
compliance
• Repeat blood samples and anthropometric
measurements taken
• Remainder of supplements collected and
counted
Excluded from analysis*
Group A (n=6)
Group B (n=6)
Group C (n=7)
Analysed (n=128)
Via SPSS
Lost to follow-up:
Group A (n=4)
Group B (n=3)
Group C (n=2)
50
2.4 Interventions
Participants were randomly allocated one of three groups, 4000 IU per day (Group A),
2000 IU per day (Group B) or placebo (Group C). Both these supplement doses have
been shown to be effective in raising serum vitamin D concentrations in a number of
previous studies (Von Hurst et al., 2008; Mitri et al., 2011; Al-Daghri et al., 2012).
The placebo contained only microcrystalline cellulose as used in previous similar
studies (Pittas et al., 2007a) and was chosen as it cannot be readily absorbed by the
body (Grossmann and Tangpricha 2010; Kaptchuk et al., 2010).
The random allocation of patients to one of the three study groups was also imperative
to minimize bias and ensure a balanced distribution of important variables between
groups (Practice Committee of American Society for Reproductive 2008). In this
study, patients were randomly allocated one of the three groups depending on the order
in which they presented for their scheduled follow-up appointment with the doctor.
These appointments had already been allocated by an impartial third party prior to this
study commencing. For example, the patient attending appointment one was allocated
group A, patient attending appointment two was allocated group B and so on. This use
of third party randomisation enabled the order of allocation to the groups to be
concealed to the researcher, thus eliminating bias. Furthermore, the researcher and the
patient were both blind to which group would be assigned which supplement dose or
placebo. In order to maintain the blinding, all tablets and packaging looked the same.
Blinding has been a key facet of trials analysing vitamin D3 supplementation on
markers of diabetic control in order to minimise bias (Pittas et al., 2007a; De Boer et
al., 2008; Von Hurst et al., 2008; Nagpal et al., 2009; Mitri et al., 2011).
2.5 Safety margins
Vitamin D intoxication is an uncommon but avoidable issue, which would result in
hypercalcaemia. Safety is paramount in research on human subjects and thus the upper
limit of safe vitamin D supplementation had to be determined prior to study initiation.
The current consensus is that 10,000 IU/day is the recommended highest daily intake
to be sure of no adverse outcomes (Hathcock et al., 2007). As this study used 2000 IU
and 4000 IU vitamin D3 supplementation, it can be assured that all supplementation
was within safe parameters.
51
In order to prevent hypercalcaemia as a result of vitamin D intervention, levels of
corrected calcium were measured prior to inclusion in the study. Any patient found to
have higher than acceptable levels of corrected calcium became ineligible for further
participation in the study.
2.6 Recruitment and sittings
The target population was specifically Saudi females with poorly controlled type 2
diabetes between the ages of 18 and 60 years. Al-Noor hospital is the hub for
outpatient diabetes clinics in the Makkah area. The researcher first determined eligible
women for the study by reviewing around 125 files daily of Saudi diabetic females at
the Diabetic Centre, looking for patients who met the inclusion criteria using the
screening questionnaire for recruiting participants. A list of suitable patients was
compiled for the attention of the specialist conducting the diabetic clinic to refer the
patients on after their appointment. The women referred by the consultants were
between 18 and 60 years of age and had poorly controlled T2DM. Participants who
met the eligibility criteria were then invited to take part in the study via phone call.
Participants were also sent flyers about the benefit of vitamin D and invited by
What’sapp (if they use the app) to attend a meeting with the researcher after their next
appointment with the specialist. During the appointment the study researcher explained
the possible benefits of vitamin D in diabetic patients and what would be expected of
them if they were to participate in the study. If they chose to participate it was also
explained how to fill in a supplement recording calendar, the vitamin D3 supplements
were given out, and blood samples taken for baseline measurements and initial AGE
measurements taken.
All patient appointments and biological tests were carried out in Saudi Arabia. Patient
appointments were conducted at the Al-Noor hospital. Laboratory tests were carried
out by trained laboratory staff at the Al-Noor clinical laboratory. Study coordination,
analysis and subsequent work were all undertaken at the Manchester Metropolitan
University, Manchester, UK.
2.7 Inclusion and exclusion criteria
Inclusion criteria for the study as shown in Figure 7 was as follows: Saudi Arabian
women, whose parents were both Saudi Arabian, between the ages of 18 and 60 years

52
with poorly controlled type 2 diabetes (defined as glycated haemoglobin > 8%) (Kuo
et al., 2006; Wolff-McDonagh et al., 2010) and BMI above 25 kg/m2 with no prior
history of renal, liver or gastrointestinal disease.
Patients with renal, liver or gastrointestinal disease, pregnancy or prior use of vitamin
D supplements (three months prior to or during the study time) were excluded from the
study as seen in Table 2.1. Vitamin D has a circulating half-life of 15 days and
turnover in the body of two months (Jones 2008) and therefore excluding patients who
had taken supplements within the past three months negated any confounding results
from previous supplementation. Vitamin D3 is absorbed by the gut and then activated
in the liver and kidneys. Previous studies have shown that renal or liver disease and
gastrointestinal disease limits the activation or absorption of vitamin D3, thus rendering
the intervention less effective (Ritz et al., 1979; Farraye et al., 2011; Vavricka and
Rogler 2012; Stokes et al., 2013). Pregnancy has been linked to vitamin D deficiency
and resulting clinical outcomes such as gestational diabetes (Barrett and McElduff
2010). Pregnancy can further complicate the measurement of diabetes as diabetic
control is more difficult as glucose levels change according to hormonal factors (Rafat
and Ahmad 2012). Due to the added complications that pregnancy could bring to
diabetic control, pregnant women were excluded from the study.
Table 2.1: Study Inclusion and exclusion criteria.
Inclusion Criteria Exclusion Criteria
✓ Females aged 18-60 years ➢ Renal, liver or gastrointestinal disease
e.g. Crohn’s disease or liver failure
✓ BMI ≥ 25 ➢ Those taking supplements that include
vitamin D
✓ Glycated haemoglobin > 8% (Poorly
controlled type 2 diabetics)
➢ Pregnancy
✓ Participant and their parents are both
Saudi Arabian
➢ Hypoglycaemic changes

53
2.8 Sample size calculation
ANCOVA was used to assess changes in outcomes after intervention, but the
limitation of ANCOVA is that the statistical interpretations based on the F tests are
sensitive to sample size. When the sample size is too small, there is inadequate power
to calculate the F statistic and the hypothesis cannot be appropriately tested. The use of
sample sizes which are inadequate can lead to misrepresentative results which may
have profoundly negative clinical outcomes (Bailar et al., 1992).
Specific power calculations for this study were therefore undertaken using G*Power 3
(Faul et al., 2007) and the recommendations of a statistician to ensure that the sample
size was sufficient to detect the effect of vitamin D3 supplementation on biological
outcomes. A power level of 80% was assumed, an effect size explaining 25% of the
variance in vitamin D concentrations, with three groups to the study, a minimum
sample size of N=128 was calculated to obtain significance at the p=0.05 level.
Inevitably, some patients were lost to follow up. To compensate for this the number
recruited was increased by 20%. If loss to follow up was greater than this, the analysis
might be unsound and may not be publishable (Schulz and Grimes 2002). Consultation
on the power calculations was taken with Dr M Sullivan, a Senior Lecturer at
Manchester Metropolitan University. On consultation of similar previous
interventional studies, it was noted that sample sizes ranging from between 37 and 92
participants had achieved significant validated results over various durations of one to
18 months (Raghuramulu et al., 1992; Sugden et al., 2008; Witham et al., 2010; Al-
Daghri et al., 2012; Soric et al., 2012).
2.9 Informed consent form
Written information sheets contribute to patient understanding of a trial more than
verbal discussion of the information (Langdon et al., 2002; Shukla et al., 2012). It has
also been shown that such information sheets are often overly complicated in the
language that they use, especially if the target audience is young or has low literacy
levels (Franck and Winter 2004). The optimum design for an informed consent form
has been shown to be brief and to the point (Epstein and Lasagna 1969). In this study,
an informed consent sheet was given to the participants which explained what was
expected of them during the study and what would happen at each stage. The language
used in the form was simple and easy to understand. The participant was asked to

54
confirm in writing that they understood the information presented to them and to
accept or decline the offer to take part in the study. Contact information for the
researcher was included on the information sheet so that participants could raise any
questions directly and at any time. The researcher also spent a one-to-one session with
each participant, which has been shown to increase participant understanding in
previous studies (Flory and Emanuel 2004).
2.10 Pre-study screening questionnaire
Potential participants attended a meeting with the researcher where their eligibility for
the study was assessed. The researcher first checked that the potential participants met
the inclusion criteria and did not breach the exclusion criteria. Those participants that
met the inclusion criteria and agreed to participate in the study then went on to
complete the pre-screening questionnaire which is discussed below.
In order to produce an effective questionnaire, the language used must be simple,
understandable and precise. The language used should not be too formal or scientific in
order to minimise confusion and misunderstanding (McLeod 2008; Gould 2011). The
questionnaire for this study was developed in English and then translated to Arabic.
The responses were then translated back in to English for analysis. The questions
asked in this questionnaire fell in to two categories: personal information and medical
information. These were arranged in a logical order, with the personal information
questions first (Berdie et al., 1986; Hague 1993). The questions were closed where
possible, with a minimum number of open ended questions as these are more difficult
to analyse (Oppenheim 1992). For closed questions, a set number of responses were
provided, and the subject prompted to circle the most appropriate answer.
The questionnaire was given out in a face-to-face meeting with the study researcher.
This ensures that any misunderstanding is rectified and the errors or unanswered
questions kept to a minimum and so response rates improved (Oppenheim 1992). A
number of background questions were used to determine patients’ gender, age, marital
status, education level, employment history, ethnic origin and smoking status. The
questionnaire also indicated whether the participants were currently taking daily
vitamin supplements, or whether they were taking vitamin D supplements three
months prior to inclusion in the study. Specific medical conditions were checked,
together with listing the prescribed medications that the participants were taking. This
55
section of the questionnaire aimed to identify factors that potentially confound the
data.
2.11 Anthropometric measurements
Body mass index (BMI) is known to be a strong indicator of diabetes risk (Schulze et
al., 2012). Participants’ height and weight were measured and recorded by the study
researcher. Height (in centimetres) was recorded whilst the subject was standing erect
and barefoot using a free-standing stadiometer. Weight (in kilograms) was measured
using a hospital grade scale (Jack et al., 1994). BMI was calculated as weight (kg) /
height (m)2.
2.12 Blood collection
10 mL of blood was collected at baseline and at 16 weeks. It was drawn by a trained
phlebotomist from the medial cubital vein using aseptic technique and a 21G needle.
Blood was taken to fill a 4 mL vacutainer plain tube (to test vitamin D3 and insulin), 2
mL vacutainer EDTA tube (to test HbA1c) and 4 mL vacutainer lithium heparin tube
(to test lipids, fasting glucose, calcium, albumin and antioxidant). The patient’s
information was recorded on the blood bottles as Name, Date of Birth and Hospital
number (or equivalent) for identification. In order to test fasting glucose levels,
participants were asked to fast (no food or beverages except water) for a minimum of
ten hours prior to the phlebotomy appointment (Nagpal et al., 2009). This is due to the
fact that test results could be affected by consuming food and beverages. This can lead
to imprecise results as during fasting, glucagon is activated which raises plasma
glucose levels (The global diabetes community 2013).
The withdrawn blood was taken to the hospital lab to be centrifuged and kept in the
freezer at minus 20°C until the end of the recruitment period. The only exception to
this was the sample of total antioxidant levels which had to be stored off-site at King
Abulaziz Research Centre at a temperature of -80°C. Once all the data had been
collated at baseline and following the 16-week trial, the researcher went to the lab to
run the tests with the technicians.
56
2.13 Supplement compliance
In this study, the aim was to quantify compliance and employ methods which increase
compliance to optimal levels. A calendar and pill counting were used to assess
compliance by Talaei et al. (2013) and von Hurst et al. (2010). Subject interview can
be particularly useful as it provides qualitative details on why the subject may not have
complied, not solely whether they complied or not. In the case of von Hurst et al.
(2010), subjects reported difficulty in taking four capsules per day for six months. This
was taken into account in the present study to reduce the number of capsules required
as this could negatively affect compliance.
Pill counting of the surplus supply by weight or number is a proven method of
obtaining an objective figure for compliance during the study period (Al-Sofiani et al.,
2015). This method has been employed in a number of studies (De Boer et al., 2008;
Dong et al., 2010; Talaei et al., 2013).
Other aids for improving compliance involve calendar charts, which enable the subject
to record days when the pill was taken and thus highlights to the researcher the days
when it was missed. In a meta-analysis of the success of compliance methods in 153
studies showed that no particular intervention had a clear advantage over another
(Roter et al., 1998). However, methods that encompassed cognitive and behavioural
components improved compliance substantially.
Whilst there is no gold standard for compliance assessment, this study incorporated a
calendar for recording pill usage, along with a debriefing questionnaire and interview
on compliance issues during the study period and counting remaining supply at 16
weeks. In addition, the researcher contacted each participant daily via What’sapp
asking them to reply that they had taken their supplement that day. This method of
contacting participants via SMS has been shown to improve medication adherence by
17.8% (Strandbygaard et al., 2010).
2.14 Debriefing Questionnaire
At the end of the 16-week trial, an appointment was made for every participant to meet
with the researcher. Again, participants were reminded via phone one week in advance
to attend their appointment. At this final appointment, any leftover tablets were
collected, along with the calendars and the left over pills counted. A debriefing
57
questionnaire was administered to ensure that no changes had occurred during the
study that would inadvertently affect the results. These included changes to prescribed
medicines, onset of new medical conditions and use of any additional vitamins. The
baseline anthropometric measurements were re-recorded, along with the AGEs
measured and blood samples taken for the previous parameters.
2.15 Blood analysis
All blood sampling methods are in accordance with the procedures in place at the Al-
Noor clinical laboratory and information received from Roche (Roche 2013). Storage
and deposition of blood samples were in line with the Human Tissue Act and
Manchester Metropolitan University guidelines.
2.15.1 Measurement of the concentration of vitamin D
Analysis was carried out using the Roche Cobas E601 analyser. This is a competitive
electrochemiluminescent protein binding assay designed to measure total 25-OH
vitamin D in serum or plasma, using vitamin D binding protein (VDBP) as capture
protein to bind vitamin D3 and vitamin D2. 16µl of serum was incubated with pre-
treatment reagent, releasing the vitamin D from its binding partner Vitamin D Binding
Protein (VDBP).
The sample was then incubated with ruthenium labelled VDBP, forming vitamin D-
ruthenium labelled VDBP complexes. Finally, streptavidin-coated micro-particles were
added which occupy any free sites in the ruthenium labelled VDBP. The sample was
then aspirated into the measuring cell, and the microparticles magnetically attach to the
surface of the electrode. A voltage was applied to the electrode, inducing
chemiluminescent emission, which was measured by a photomultiplier. Results were
determined via a calibration curve that was generated by the analysis system.
Calibration was performed once every 24 hours. The control interval was set with the
lower limit value between 13.180- 20.620 ng/ml and the upper limit value of 25.200-
37.800 ng/ml using PreciControl Varia.
Previous studies have looked at this method of vitamin D measurement and compared
to other methods of measurement and found high concordance (Abdel-Wareth et al.,
2013). According to the classification of The Endocrine Society, vitamin D deficiency
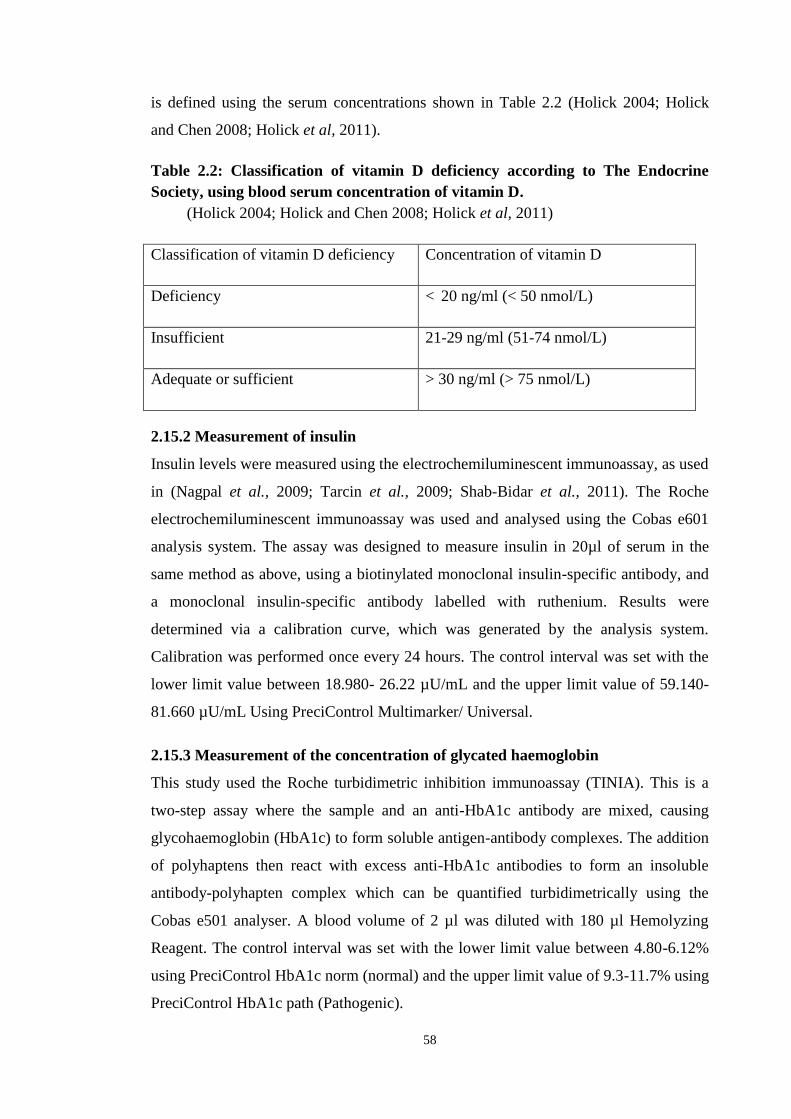
58
is defined using the serum concentrations shown in Table 2.2 (Holick 2004; Holick
and Chen 2008; Holick et al, 2011).
Table 2.2: Classification of vitamin D deficiency according to The Endocrine
Society, using blood serum concentration of vitamin D.
(Holick 2004; Holick and Chen 2008; Holick et al, 2011)
Classification of vitamin D deficiency Concentration of vitamin D
Deficiency < 20 ng/ml (< 50 nmol/L)
Insufficient 21-29 ng/ml (51-74 nmol/L)
Adequate or sufficient > 30 ng/ml (> 75 nmol/L)
2.15.2 Measurement of insulin
Insulin levels were measured using the electrochemiluminescent immunoassay, as used
in (Nagpal et al., 2009; Tarcin et al., 2009; Shab-Bidar et al., 2011). The Roche
electrochemiluminescent immunoassay was used and analysed using the Cobas e601
analysis system. The assay was designed to measure insulin in 20µl of serum in the
same method as above, using a biotinylated monoclonal insulin-specific antibody, and
a monoclonal insulin-specific antibody labelled with ruthenium. Results were
determined via a calibration curve, which was generated by the analysis system.
Calibration was performed once every 24 hours. The control interval was set with the
lower limit value between 18.980- 26.22 µU/mL and the upper limit value of 59.140-
81.660 µU/mL Using PreciControl Multimarker/ Universal.
2.15.3 Measurement of the concentration of glycated haemoglobin
This study used the Roche turbidimetric inhibition immunoassay (TINIA). This is a
two-step assay where the sample and an anti-HbA1c antibody are mixed, causing
glycohaemoglobin (HbA1c) to form soluble antigen-antibody complexes. The addition
of polyhaptens then react with excess anti-HbA1c antibodies to form an insoluble
antibody-polyhapten complex which can be quantified turbidimetrically using the
Cobas e501 analyser. A blood volume of 2 µl was diluted with 180 µl Hemolyzing
Reagent. The control interval was set with the lower limit value between 4.80-6.12%
using PreciControl HbA1c norm (normal) and the upper limit value of 9.3-11.7% using
PreciControl HbA1c path (Pathogenic).

59
A diagnosis of diabetes is made with HbA1c levels of 6.5% or greater (WHO 2011;
American Diabetes Association 2012). This study was interested in patients with
poorly controlled T2DM, defined as HbA1c levels of greater than 8%, as used in
previous studies (Rotchford et al., 2002; Kuo et al., 2006; Wolff-McDonagh et al.,
2010).
2.15.4 Measurement of the concentration of lipids
This study used an enzymatic method to measure high-density lipoprotein (HDL), low
density lipoprotein (LDL), triglycerides (TG) and total cholesterol (TC). HDL and
LDL was measured using the Roche enzymatic colorimetric assay system. The
concentration of HDL- and LDL- cholesterol is determined enzymatically by
cholesterol esterase and cholesterol oxidase. Cholesterol esters are broken down into
free cholesterol and fatty acids by cholesterol esterase. In the presence of oxygen,
cholesterol is oxidized by cholesterol oxidase to 4-cholestenone and hydrogen
peroxide. In the presence of peroxidase, the hydrogen peroxide generated reacts with
4-amino-antipyrine and HSDA to form a purple-blue dye. The colour intensity of this
dye is directly proportional to the cholesterol concentration and is measured
photometrically using the Cobas analyser e501. A volume of 2.5µl of serum was used
to measure HDL and 2µl of serum for LDL. The control intervals for HDL- cholesterol
were set as 23.7-32.5 mg/dL for the lower limit using PreciControl ClinChem Multi 1
and 53.2-73.6 mg/dL for the upper limit using PreciControl ClinChem Multi 2. The
control intervals for LDL- cholesterol were set 44.6-61.4 mg/dL for the lower limit and
80.3-110.7 mg/dL for the upper limit, again using PreciControl Multi 1 & 2
respectively.
Triglycerides (TG) were measured using a Roche assay that uses a lipoprotein lipase
for the rapid and complete hydrolysis of triglycerides to glycerol followed by oxidation
to dihydroxyacetone phosphate and hydrogen peroxide. The hydrogen peroxide
produced then reacts with 4-aminophenazone and 4-chlorophenol under the catalytic
action of peroxidase to form a red dyestuff. The colour intensity of the red dyestuff
formed is directly proportional to the triglyceride concentration and can be measured
photometrically. A sample size of 2 µl was used and the control intervals set as 93-113
mg/dL for the lower limit using PreciControl ClinChem Multi 1 and 184-224 mg/dL
for the upper limit using PreciControl ClinChem Multi 2.

60
Total cholesterol (TC) was measured using a Roche assay. Cholesterol esters are
cleaved by the action of cholesterol esterase to yield free cholesterol and fatty acids.
Cholesterol oxidase then catalyzes the oxidation of cholesterol to cholest-4-en-3-one
and hydrogen peroxide. In the presence of peroxidase, the hydrogen peroxide formed
effects the oxidative coupling of phenol and 4-aminophenazone to form a red quinone-
imine dye. The colour intensity of the dye formed is directly proportional to the
cholesterol concentration. It is determined by measuring the increase in absorbance
using the Cobas e501 analyser. A volume of 2µl of serum was sampled and the control
intervals set as 74.1-90.5 mg/dL for the lower limit using PreciControl ClinChem
Multi 1 and 155-191 mg/dL for the upper limit using PreciControl ClinChem Multi 2.
Table 2.3 shows the desirable, low, borderline high, high and very high cut off points
for lipid measurements, as defined by the American Heart Association (The American
Heart Association 2013). These cut offs were used to compare the lipid levels pre-
intervention and post-intervention to assess whether vitamin D3 has significantly
altered lipid values.
The American Diabetes Association published guidelines in 2012 on desirable lipid
levels for diabetic patients, whilst adding a limit for a low HDL cut-off (American
Diabetes Association 2012). These are in agreement with the optimal levels shown in
Table 2.3.
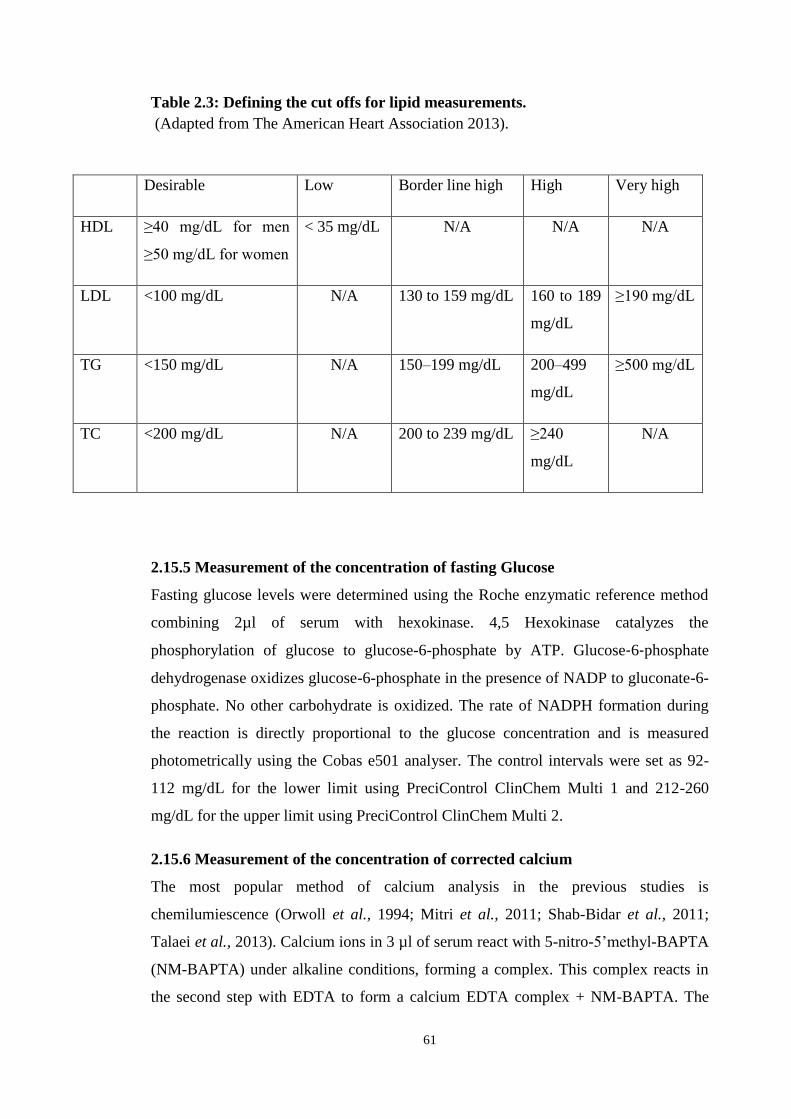
61
Table 2.3: Defining the cut offs for lipid measurements.
(Adapted from The American Heart Association 2013).
2.15.5 Measurement of the concentration of fasting Glucose
Fasting glucose levels were determined using the Roche enzymatic reference method
combining 2µl of serum with hexokinase. 4,5 Hexokinase catalyzes the
phosphorylation of glucose to glucose-6-phosphate by ATP. Glucose‑6‑phosphate
dehydrogenase oxidizes glucose-6-phosphate in the presence of NADP to gluconate-6-
phosphate. No other carbohydrate is oxidized. The rate of NADPH formation during
the reaction is directly proportional to the glucose concentration and is measured
photometrically using the Cobas e501 analyser. The control intervals were set as 92-
112 mg/dL for the lower limit using PreciControl ClinChem Multi 1 and 212-260
mg/dL for the upper limit using PreciControl ClinChem Multi 2.
2.15.6 Measurement of the concentration of corrected calcium
The most popular method of calcium analysis in the previous studies is
chemilumiescence (Orwoll et al., 1994; Mitri et al., 2011; Shab-Bidar et al., 2011;
Talaei et al., 2013). Calcium ions in 3 µl of serum react with 5-nitro-5’methyl-BAPTA
(NM-BAPTA) under alkaline conditions, forming a complex. This complex reacts in
the second step with EDTA to form a calcium EDTA complex + NM-BAPTA. The
Desirable Low Border line high High Very high
HDL ≥40 mg/dL for men
≥50 mg/dL for women
< 35 mg/dL N/A N/A N/A
LDL <100 mg/dL N/A 130 to 159 mg/dL 160 to 189
mg/dL
≥190 mg/dL
TG <150 mg/dL N/A 150–199 mg/dL 200–499
mg/dL
≥500 mg/dL
TC <200 mg/dL N/A 200 to 239 mg/dL ≥240
mg/dL
N/A

62
change in absorbance is directly proportional to the calcium concentration and is
measured photometrically. The control intervals were set as 8.00-9.40 mg/dL for the
lower limit using PreciControl ClinChem Multi 1 and 12.6-15.0 mg/dL for the upper
limit using PreciControl ClinChem Multi 2.
About 45% of calcium in the blood is normally transported partly bound to plasma
proteins, notably albumin. When albumin concentrations fluctuate substantially, total
calcium levels may vary (Goltzman 2000). Such discrepancies can be ‘corrected’ using
the formula:
Corrected calcium (mM) = measured total Ca (mM) + [40 - serum albumin (g/L)] X
0.02
Albumin was measured using the Roche cobas c 501 colorimetric assay. A buffer
solution is added to 3µl of serum to give a pH value of 4.1. At this concentration,
albumin is able to bind with bromcresol green (BCG), an anionic dye, to form a blue-
green complex. The colour intensity of the blue-green colour is directly proportional to
the albumin concentration in the sample and is measured photometrically. The control
intervals were set as 2.83-3.59 gm/dL for the lower limit using PreciControl ClinChem
Multi 1 and 4.45-5.65 gm/dL for the upper limit using and PreciControl ClinChem
Multi 2.
2.15.7 Measurement of Oxidative Stress (Total Antioxidant Capacity)
Total antioxidant capacity (TAC) has been demonstrated to be a reliable method for
measuring oxidative stress, with a lower TAC representing higher levels of oxidative
stress (Ceriello et al., 1997). TAC was assessed using a colorimetric method with the
commercially available Cell Biolabs’ OXiSelect TAC assay kit (Antibodies online
2013). This method utilises a standard against which to measure the total antioxidant
capacity (ascorbic acid; bovine serum albumin [BSA]; glutathione [GSH]; vitamin E;
uric acid; butylated hydroxytoulene [BHT]). 20µl of plasma was collected with heparin
and then centrifuged at 4°C for 10 minutes. To measure total antioxidant capacity in
the samples, the samples were compared to a known concentration of uric acid
standard within a 96-well microtiter plate format. Samples and standards were diluted
with a reaction buffer and a reading obtained using a standard 96-well
spectrophotometric microplate reader at 490nm. Upon addition of the copper ion
reagent into each well the reaction proceeded for a few minutes. The reaction was then
63
stopped and once again read with the spectrophotometric microplate reader at 490nm.
Quality control solutions of a fixed concentration of total antioxidants were ran in
duplicate and the absorbance of the control sample measured as with the plasma
samples.
2.16 Homeostasis Model Assessment
Insulin resistance and progressive pancreatic β-cell dysfunction have been shown to be
paramount in the pathogenesis of type 2 diabetes (Song et al., 2007). There have been
various methods employed to assess these factors, including fasting insulin level,
fasting glucose/insulin ratio (FGIR), homeostasis model assessment for insulin
resistance (HOMA-IR) and quantitative insulin-sensitivity check index (QUICKI)
(Matthews et al., 1985; Bergman 1989; Katz et al., 2000; Cutfield et al., 2003;
Kurtoglu et al., 2010). HOMA-IR, however has been found to be far superior to FGIR
and QUICKI in accurately determining insulin resistance (Keskin et al., 2005).
Therefore, HOMA-IR is a frequently used marker in clinical research studies (Wallace
and Matthews 2002; Cutfield et al., 2003). The Homeostasis Model Assessment
(HOMA) estimates both beta cell function (%B) insulin resistance (%IR), as
percentages of a normal reference population. It is derived from calculating the balance
between hepatic glucose secretion and insulin secretion from fasting levels of glucose
and insulin using the following formulas: (Matthews et al., 1985; Wallace et al., 2004).
HOMA-B = Fasting insulin level/ fasting glucose concentrations – 3.5 (Wallace et al.,
2004).
HOMA-IR= Fasting insulin (μU/mL) x Fasting glucose (mg/dL) /405 (Matthews et al.,
1985).
As the HOMA model uses only a single measurement of fasting insulin and glucose it
is seen to be an easy, cheap and reliable alternative to large-scale epidemiologic
studies.
2.17 Advanced Glycation Endproducts (AGE) measurement
An AGE reader was used. This can assess AGE levels within the skin in less than 30
seconds and is a non-invasive procedure. Some AGEs have auto-fluorescence
capabilities. The AGE reader has a UV light source which penetrates the skin to a

64
depth of 1 mm. The AGEs become excited, and emit auto-fluorescence at particular
wavelengths. The detector within the AGE reader can assess the wavelengths of auto-
fluorescence produced by the AGEs, and its intensity, which correlate to the quantity
of AGEs present within the skin tissue (Diagnoptics 2012).
2.18 Data protection
The researcher obtained an MRC data protection certificate prior to commencing the
study and the study followed data protection 1998 guidelines to ensure that only those
involved in the study had access to data and that all computers that store this data are
encrypted with a password (Smith and Harding 2013). The study was anonymised and
all subjects given a unique study number. A key linking patient names and their study
number was held by the study supervisor.
2.19 Data handling and cleaning
All data was entered in to and maintained in Microsoft Excel. All entries were double
checked to minimise data entry errors. Before statistical analysis, data was cleaned and
checked for mistakes. If during the course of the study, changes had occurred that
would inadvertently affect the results, these subjects were excluded from the study.
This included non-compliance with taking vitamin, changes to prescribed medicines,
onset of new medical conditions, use of any additional vitamins and not returning after
16 weeks. Adherence to medication was calculated by taking the worst outcome from
either the pill calendar, debriefing questionnaire or returned supplements. This value
for the number of pills not taken during the study period was used to calculate
percentage adherence (number of pills not taken/total number prescribed) x100. Where
adherence was found to be less than 80%, participants were excluded from further
analyses. This method of adherence calculation has been shown to be an acceptable
level of adherence (Winkler et al., 2002; Osterberg and Blaschke 2005; Mitri et al.,
2011).
2.20 Statistical analyses
Microsoft Excel was used to handle and maintain the data. All statistical analyses was
performed using Statistics Package for Social Sciences (SPSS, version 20).
65
The population was characterised using descriptive statistics including mean, median,
mode and range summary statistics for age, BMI and biological test results. Pill
adherence was calculated as described in the previous section and compared between
test groups by means of a one-way ANOVA. The Kolmogorov-Smirnov test was used
to test the assumption that the clinical outcome measures are normally distributed. If
necessary, appropriate transformations such as logarithms were used to normalise the
data.
To compare pre- and post-treatment variables, a multivariate approach is needed
(Young 2007). An ANCOVA model was used to adjust the mean values of the 16-
week outcome measures by controlling for the within-subjects differences in the
baseline measures, leading to precise estimates of the between-subjects effects of the
treatments, taking in to account the interactions between covariates and treatment
groups (Albert 1999; Raab et al., 2000; Pocock et al., 2002). The ANCOVA was based
upon the General Linear Model (GLM) procedure, with statistical significance α<0.05.
The GLM assumption of homogeneity of regression slopes (i.e. that the slopes of the
lines of the outcome measures versus the baseline measures are equal for each test
group) was tested by determining the significance of the interaction between covariates
and the three treatment groups. A non-significant interaction at α=0.05 implies
homogeneity of regression slopes (Rutherford 2001). The effect sizes were interpreted
according to the criteria of Ferguson (2009) where eta squared < .04 = negligible; .041
to .249 = low; .250 to .639 = moderate; .640 to 1.00 = high.
Mixed ANOVA considers the number of times the dependent variable is measured per
participant (Robert 2012). Two-way interaction is used to examine whether the effect
of one factor depends on the level of another factor and vice versa (Robert 2012). In
the present study, the effect of two different doses of vitamin D supplementation were
compared against a placebo over time (pre-test and post-test). Mixed ANOVA was
used to examine if there was an interaction within subject groups (pre-test and post-
test) and between subject groups (A, B and C) on the dependent variable.

66
Chapter 3. Patient Demographics

67
3.1 Introduction
As with many diseases, certain traits and lifestyle factors can influence a person’s
susceptibility to developing diabetes. There are many factors which confer a small
amount of risk such as certain genetic polymorphisms, and others which confer a much
larger risk such as obesity. Many studies have found that non-modifiable risk factors
such as gender, age at onset of disease, duration of diabetes and the current age of the
patient directly affect HbA1c (Verma et al., 2006).
It is well documented that middle-aged and older adults are at highest risk of
developing type 2 diabetes (CDC 2014). A wider age range of 18-60 years was
selected in this study to enable comparisons with other similar studies (Mitri et al.,
2011; Al-Daghri et al., 2012). Several studies have shown a robust inverse
relationship, especially in women, between T2DM prevalence and education level. The
relationship between education level and health is, however, a complex one and is
likely influenced by many factors, including lifestyle, access to health services and
awareness of health promotion (Sacerdote et al., 2012). Lifestyle factors such as diet
and smoking are considered to be strong risk factors for the development of diabetes. It
is widely acknowledged that appropriate use of diet and exercise can increase insulin
sensitivity, improve glycaemic control and reduce the need for intervention with oral
medication or insulin (Ainsworth et al., 1993; Nielsen 1998a).
It is well documented that having a family history of diabetes increases the risk of
developing the disease, however the contribution of genetics to diabetes is not a simple
topic (Valdez et al., 2007). There is considerable variation in the heredity of diabetes
among different populations and in different environments. Studies have also shown
that an increased duration of diabetes correlates with higher HbA1c levels (Verma et
al., 2006).
Obesity is one of the main non-genetic risk factors for diabetes (Hamman 1992).
Weight gain has been shown to cause a decrease in insulin sensitivity, possibly as a
mechanism to halt further weight gain (Hamman 1992). Increases in BMI amongst
type 2 diabetics have been shown to be a strong indicator of changes in HbA1c as
documented in longitudinal cohort studies. Similarly, patients who lose weight are far
more likely to reach their target HbA1c than those whose weight remains stable or
increases (Wilding 2014).

68
The risk factors that are linked to worse prognostic outcomes may confound results if
they are unevenly distributed between groups (Practice Committee of American
Society for Reproductive 2008). The aim of this study was to identify the relevant
modifiable and non-modifiable risk factors and to control for their effects. As such, the
following parameters were measured across the two groups (Group A: 4000 IU of
vitamin D per day, and Group B: 2000 IU per day) and compared against the age-
matched control group:
• Age, education level, smoking status, BMI and diet
• Family history and duration of type 2 diabetes
3.2 Materials & methods
Ethical approval was granted by the Manchester Metropolitan University Ethics
Committee as stated in section 2.2. This was a double-blind, randomized control trial
of 156 female type 2 diabetics with HbA1c levels greater than 8.0 percent. All
participants were recruited from Al-Noor hospital in Saudi Arabia and informed
consent was obtained as detailed in sections 2.6 and 2.9. Subjects who met the
inclusion criteria were randomly allocated to one of three test groups. These were as
follows: 2000 IU vitamin D per day; 4000 IU vitamin D per day; or a placebo, as
described in section 2.3. Participants were also asked to attend a meeting and complete
a pre-study screening questionnaire at baseline, and a debriefing questionnaire at 16
weeks as per sections 2.10 and 2.14.
3.3 Results
One hundred and fifty-six subjects were initially recruited, however, due to attrition
between the baseline measurements and the final measurements (collected 16 weeks
after the baseline), the total number of participants was n = 128: 42 in group A, 43 in
group B and 43 in group C. The reasons for the attrition of 10 individuals from Group
A and nine individuals each from Groups B and C (based on the responses to the
debriefing questionnaire) are listed in Table 3.1.

69
Table 3.1: Reasons for attrition
Reason Group
A
Group
B
Group
C
Non-compliance with taking vitamin D supplements 1 2 2
Contracted gastrointestinal malabsorption during the
intervention
1 1 0
Changed diabetic medication during the intervention 4 3 2
Did not return after 16 weeks 4 3 2
Took additional vitamin D 0 0 3
The demographic characteristics of the 128 participants, classified into groups A, B,
and C, as reported in the Pre-Questionnaire, are summarized in Table 3.2. All of the
participants were Saudi women. The most frequent age-group, representing about half
of the women in Group A, B, and C was 45 to 54 years. The next most frequent age-
group, representing about one third of the women in Group A, B, and C was 55 to 60
years. The most frequent levels of education of over half the women in each group
were no schooling or primary school. About 14 percent of the women in each group
were employed, and over 70 percent in each group were unemployed. Consequently, in
terms of their demographic characteristics, the women in groups A, B, and C appeared
to be approximately equivalent.
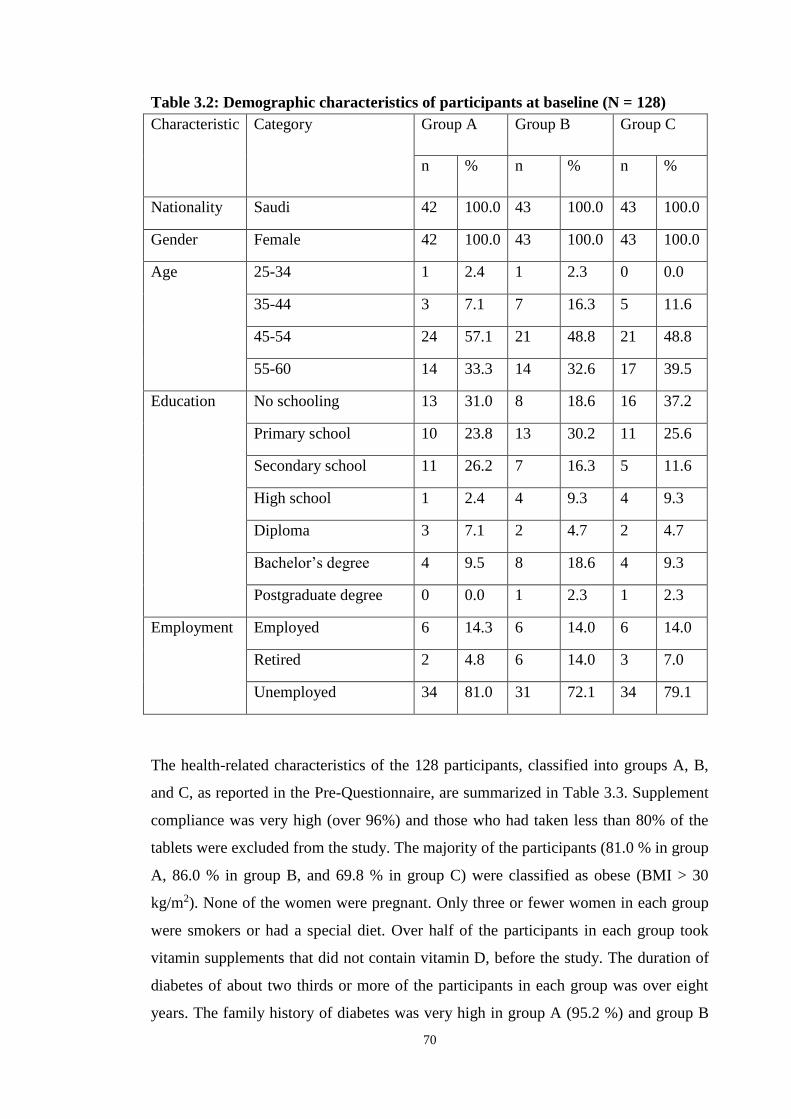
70
Table 3.2: Demographic characteristics of participants at baseline (N = 128)
Characteristic Category Group A Group B Group C
n % n % n %
Nationality Saudi 42 100.0 43 100.0 43 100.0
Gender Female 42 100.0 43 100.0 43 100.0
Age 25-34 1 2.4 1 2.3 0 0.0
35-44 3 7.1 7 16.3 5 11.6
45-54 24 57.1 21 48.8 21 48.8
55-60 14 33.3 14 32.6 17 39.5
Education No schooling 13 31.0 8 18.6 16 37.2
Primary school 10 23.8 13 30.2 11 25.6
Secondary school 11 26.2 7 16.3 5 11.6
High school 1 2.4 4 9.3 4 9.3
Diploma 3 7.1 2 4.7 2 4.7
Bachelor’s degree 4 9.5 8 18.6 4 9.3
Postgraduate degree 0 0.0 1 2.3 1 2.3
Employment Employed 6 14.3 6 14.0 6 14.0
Retired 2 4.8 6 14.0 3 7.0
Unemployed 34 81.0 31 72.1 34 79.1
The health-related characteristics of the 128 participants, classified into groups A, B,
and C, as reported in the Pre-Questionnaire, are summarized in Table 3.3. Supplement
compliance was very high (over 96%) and those who had taken less than 80% of the
tablets were excluded from the study. The majority of the participants (81.0 % in group
A, 86.0 % in group B, and 69.8 % in group C) were classified as obese (BMI > 30
kg/m2). None of the women were pregnant. Only three or fewer women in each group
were smokers or had a special diet. Over half of the participants in each group took
vitamin supplements that did not contain vitamin D, before the study. The duration of
diabetes of about two thirds or more of the participants in each group was over eight
years. The family history of diabetes was very high in group A (95.2 %) and group B

71
(93.0 %) but relatively low in group C (18.6 %). All of the participants reported
complications, of which the most frequent were neuropathy (about 80 % or more in
groups A, B, and C); and cardiovascular disease (over 80 % in groups A, B, and C).
Hypothyroidism was present in about one fifth of the patients in each group.
Consequently, in terms of their health related characteristics, groups A, B, and C
appeared to be approximately equivalent (with the exception of family history of
diabetes).
Table 3.3: Health-related characteristics of participants at baseline (N = 128)
Characteristic Category Group A Group B Group C
n % n % n %
Overweight (BMI =
25.1 to 30)
8 19.0 6 14.0 13 30.2
Obese (BMI > 30) 34 81.0 37 86.0 30 69.8
Pregnancy Not pregnant 42 100.0 43 100.0 43 100.0
Smoking Smoker 2 5.8 3 7.0 2 4.7
Diet Special diet 3 7.1 3 7.0 1 2.3
Supplements (not
containing
vitamin D).
Yes 25 59.5 27 62.8 22 51.2
Duration of diabetes 1-2 years 7 16.7 3 7.0 4 9.3
3-5 years 2 4.8 10 23.3 5 11.6
6-8 years 2 4.8 2 4.7 5 11.6
> 8 years 31 73.8 28 65.1 29 67.4
Family history of DM Yes 40 95.2 40 93.0 8 18.6
Complications Yes 42 100.0 43 100.0 43 100.0

72
Nephropathy 0 0.0 0 0.0 1 2.3
Neuropathy 37 88.1 35 81.4 34 79.1
Diabetic Cataract 8 19.0 6 14.0 14 32.6
Cardiovascular
disease (e.g. coronary
artery disease,
hypertension, heart
failure etc.)
12 28.6 5 11.6 4 9.3
Dyslipidaemia 37 88.1 39 90.7 36 83.7
Retinopathy 12 28.6 18 41.9 9 20.9
Comorbidities Hypothyroidism 10 23.8 8 18.6 9 20.9
3.4 Discussion
In this chapter the modifiable and non-modifiable risk factors and their effect on
diabetes will be discussed.
3.4.1 Age and duration of diabetes
The mean age group across all study groups was 45-54 years. This is unsurprising
given that older age is a well-documented risk factor for the development of type 2
diabetes and the peak age of onset of type 2 diabetes is usually later than type 1 (CDC
2014). In the 25-34 age group there were only 1.5 percent (n=2) of participants. Orwoll
et al. (1994) has previously suggested that young patients with type 2 diabetes mellitus
may confound outcomes due to the perceived lowered insulin secretion in diabetics of
shorter duration. Therefore, despite low numbers of type 2 diabetics in Orwoll’s 1994
study, it was important to take into account the duration of diabetes before analysis of
the results.
The average duration of diabetes was over eight years in two-thirds of the study
population. Studies have shown that an increased duration of diabetes correlates with
higher HbA1c levels (Verma et al., 2006). With increased age and duration of diabetes

73
the tendency is for the blood sugar level to increase, followed by an increase in the
HbA1c and the fasting insulin level (Shera et al., 2004).
3.4.2 Education level
The mean education level of study participants was no schooling or primary school
education (55.4 percent, n= 71). This supports what previous studies have found that
lower levels of education are related to higher prevalence of type 2 diabetes amongst
women (Robbins et al., 2001; Agardh et al., 2011; Sacerdote et al., 2012). Education
level is not thought to directly influence the biology of type 2 diabetes; however its
effect on the disease is mediated through other risk factors associated with low levels
of education (smoking status, diet, exercise, BMI). Conversely, a higher level of
education is thought to relate to positive health impacts (Winkleby et al., 1992;
Berkman and Macintyre 1997). For example, those who are more educated are likely
to be more amenable to health education and to have better access to healthcare,
enabling them to exhibit more positive health practices. It is therefore perhaps
unsurprising that the majority of the participants in this study had had little education.
3.4.3 Smoking
The incidence of smoking amongst participants in all groups was low (5.5 percent,
n=7). This was surprising given that smoking is a well-documented risk factor for the
development of type 2 diabetes (Eliasson 2003; Haire-Joshu et al., 2004). A systematic
review by Willi et al., found that 24 of the 25 selected studies for their review showed
a positive association between smoking and diabetes (Willi et al., 2007). A pooled
analysis of these studies gave a relative risk for developing diabetes of 1.44 per cent
for smokers compared to non-smokers. However, although there is a wealth of data to
show that smoking is associated with diabetes, a causal relationship has yet to be
established. Smoking is often associated with other risk factors such as lack of physical
activity and poor diet, and so mechanisms for direct causality or indirect association
must still be investigated. Similarly, the low prevalence of female smokers in this
study may be explained by cultural factors. Studies have found gender disparities
amongst young Arab smokers, with 65 percent of adolescent males claiming to be
smokers, compared with just 11.1 percent of adolescent females (Abdalla et al., 2007).
This is perhaps unsurprising given that Arab males are actively encouraged to spend
time with friends and are not supervised as strictly as females. Arab females, however,

74
may consider smoking to affect their reputation and feminine Islamic image,
consequently affecting their marriage prospects (Islam and Johnson 2003).
3.4.4 Obesity
Obesity has been shown to be a robust indicator for the development of type 2 diabetes
with one study conducted in a cohort of over 110,000 women finding that for those
with a BMI in the range of 23 to 23.9 kg/m2 the relative risk for development of type 2
diabetes was 3.6 compared to women with a BMI of 22 kg/m2 or lower (Colditz et al.,
1990). The mean BMI across all study groups was above 30 kg/m2, highlighting that
the majority of the study population were not just overweight (21 %, n= 27) but fell
into the category of obese (79 %, n= 101) as per the WHO classification for BMI
(WHO expert consultation 2004). Previous studies in Saudi Arabia have drawn similar
conclusions. Al-Nozha et al. (2005) found 72.5 percent of his study population to be
obese or overweight. Prevalence was also higher in females than males, with 44
percent of Saudi females being obese compared to 26.4 percent of males. The reasons
for this are plentiful. The Saudi population is experiencing a nutritional transition
where traditional food is being substituted for high calorie, high fat, fast-food (Al-
Nozha et al., 1991). Alongside this, the lifestyle is predominantly sedentary, especially
for females, who spend the majority of their time indoors. Physical activity such as
sports is practiced by a very small percent of the population and socialising is instead
predominantly around meals that are high in carbohydrates and fats, for example meals
composed of rice with whole lamb. The hot climate discourages individuals from
participating in physical activity and vehicles are used for even moderate distances of
travel (Al-Othaimeen et al., 2007).
3.4.5 Family history
The family history of diabetes was very high in group A (95.2 %) and group B (93.0
%) but relatively low in group C (18.6 %). It has been well-documented that first-
degree relatives of diabetic parents have an increased risk of developing type 2
diabetes themselves (Midhet et al., 2010). There is strong evidence for hereditary
aspects of diabetes, most notably because concordance rates are higher in monozygotic
twins compared to dizygotic twins and sibling recurrence rates are higher than for the
general population (O'Rahilly et al., 2005). However, roughly half of the risk of T2DM
can be attributed to lifestyle, and half to genetics (Midhet et al., 2010). Whilst family

75
history is a good indicator of future development of type 2 diabetes, it is unlikely that
having a positive or negative family history would affect the results of vitamin D
supplementation (Krul-Poel et al., 2015).
4.4.6 Summary
All of the above measured modifiable and non-modifiable risk factors were roughly
equal across all study groups. The only exception to this was the prevalence of a strong
family history for diabetes amongst the subjects.

76
Chapter 4. Vitamin D3 Status

77
4.1 Introduction
The Endocrine Society Clinical Practice Guidelines state that an optimal concentration
of serum vitamin D is above 30 ng/ml (Holick et al, 2011). Vitamin D deficiency is
defined as serum concentrations below 20 ng/ml, whilst insufficiency is defined as
between 21 and 29 ng/ml (Bischoff-Ferrari et al., 2006; Lee et al., 2008; Holick et al,
2011). A minimum daily dose of 400 IU of vitamin D is expected to raise serum
concentrations by 2.8 ng/ml in deficient subjects and this dose has been also
recommended by Public Health England to be taken daily in autumn and winter
(Heaney et al., 2003; Public Health England, 2016). However, the rise in serum
vitamin D is related to the baseline concentration, and a severely deficient patient is
likely to require an even higher dose to normalise their status (Heaney et al., 2003).
Multiple studies have found improvements in markers of diabetes in those involving
vitamin D deficient subjects, whose vitamin D status is then normalised through
supplementation (Norman et al., 1980; Cade and Norman 1986). Furthermore, it has
been shown that where sufficient serum vitamin D concentrations were not achieved,
despite similar doses of supplementation, the effect on diabetic markers is far less
(Sugden et al., 2008). It is therefore important that this study measured serum vitamin
D concentrations before and after supplementation.
It has been proposed that high doses of vitamin D supplementation above 10,000
IU/day may lead to toxic effects due to hypercalcaemia (Yiu al., 2013; Holick et al,
2011). This can present with symptoms of anorexia, nausea, constipation and
depression and can be life-threatening (Joshi et al., 2010). It was therefore important in
this study to measure baseline and 16-week corrected calcium levels to ensure subject
safety throughout the study. Vitamin D supplementation below 10,000 IU/day has not
been found to have any adverse effects (Hathcock et al., 2007).
Obesity has long been associated with an increased risk of developing type 2 diabetes
(Kahn et al., 2006). The current literature highlights an inverse relationship between
vitamin D and obesity (Dalgard et al., 2011; Salekzamani et al., 2011). Serum
concentrations of 25(OH) D have been shown to be lower in obese subjects and obese
subjects appear to have a lower vitamin D intake than those of a normal weight
(Kamycheva et al., 2003; Jorde et al., 2010). One hypothesis is that vitamin D
deficiency increases parathyroid hormone (PTH) which in turn increases the cytosolic

78
calcium level, preventing lipolysis and promoting expression of fatty acid synthase (Ni
et al., 1994; Zemel et al., 2000; Xue et al., 2001). However, to date, the research has
failed to demonstrate that supplementation with vitamin D in obese subjects aids
weight loss (Sneve et al., 2008; Zittermann et al., 2009).
This study aims to test the hypothesis that 16 weeks of vitamin D supplementation
would lead to an improvement in serum vitamin D concentrations and BMI, with no
adverse effect on the serum corrected calcium concentration.
4.2 Methodology
Blood samples were collected from all 128 participants at baseline and 16 weeks using
the aseptic technique described in section 2.12. Vitamin D status was measured using
the Roche electrochemiluminescent protein binding assay Cobas E601 as per section
2.15.1. Serum corrected calcium levels were analysed using chemilumiescence as
indicated in section 2.15.6. Anthropometric measurements were taken at baseline and
16 weeks, and calculated using the BMI formula as described in section 2.11.
4.3 Results
4.3.1 Vitamin D Status
The changes in the mean serum vitamin D of the participants (post-test minus pre-test)
in the 4000 IU group (A), the 2000 IU/day group (B), and the placebo group (C) are
compared in Table 4.1. The difference in mean serum vitamin D concentrations
between the post-test and the pre-test, as well as the differences across the three groups
is shown in Figure 4.1.
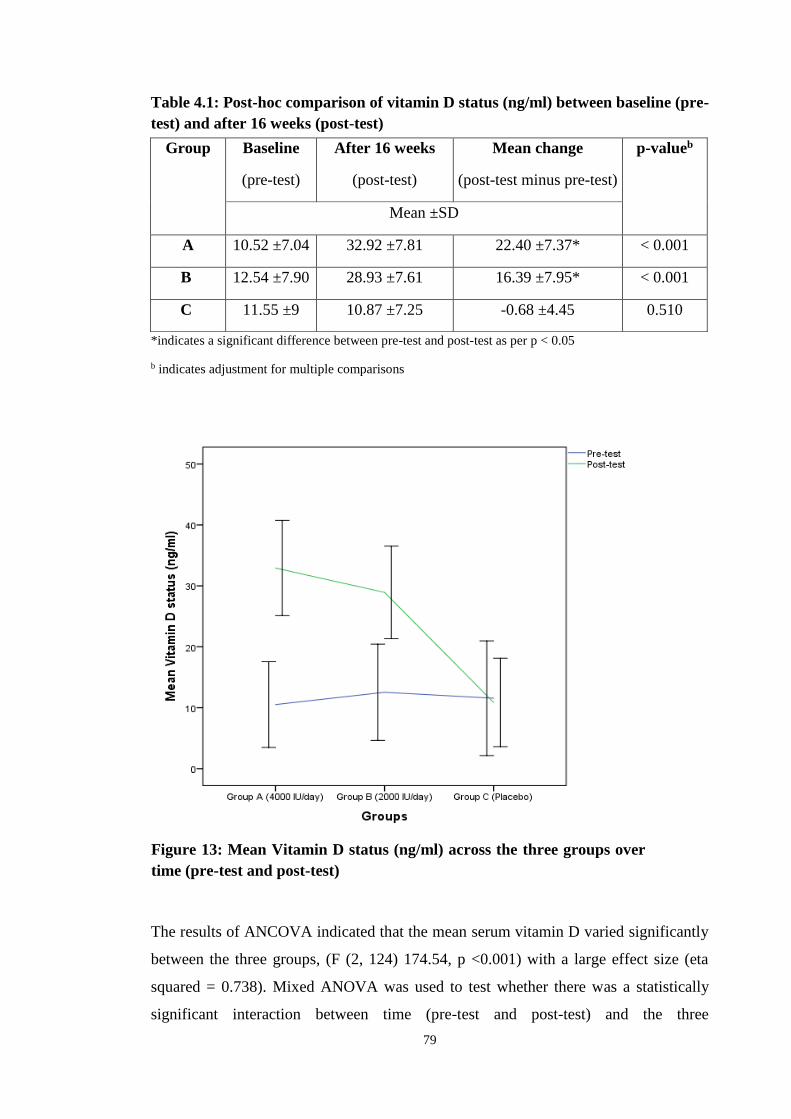
79
Table 4.1: Post-hoc comparison of vitamin D status (ng/ml) between baseline (pre-
test) and after 16 weeks (post-test)
*indicates a significant difference between pre-test and post-test as per p < 0.05
b indicates adjustment for multiple comparisons
The results of ANCOVA indicated that the mean serum vitamin D varied significantly
between the three groups, (F (2, 124) 174.54, p <0.001) with a large effect size (eta
squared = 0.738). Mixed ANOVA was used to test whether there was a statistically
significant interaction between time (pre-test and post-test) and the three
Group Baseline
(pre-test)
After 16 weeks
(post-test)
Mean change
(post-test minus pre-test)
p-valueb
Mean ±SD
A 10.52 ±7.04 32.92 ±7.81 22.40 ±7.37* < 0.001
B 12.54 ±7.90 28.93 ±7.61 16.39 ±7.95* < 0.001
C 11.55 ±9 10.87 ±7.25 -0.68 ±4.45 0.510
Figure 4.1: Figure 13: Mean Vitamin D status (ng/ml) across the three groups over
time (pre-test and post-test)
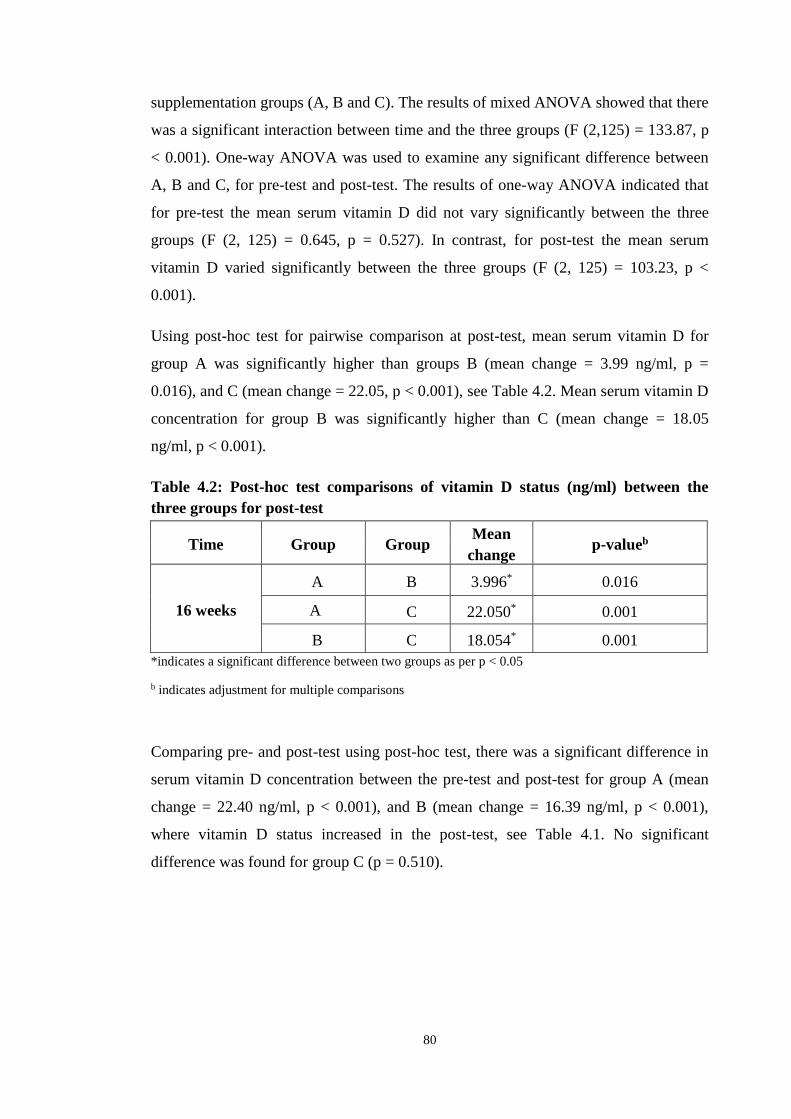
80
supplementation groups (A, B and C). The results of mixed ANOVA showed that there
was a significant interaction between time and the three groups (F (2,125) = 133.87, p
< 0.001). One-way ANOVA was used to examine any significant difference between
A, B and C, for pre-test and post-test. The results of one-way ANOVA indicated that
for pre-test the mean serum vitamin D did not vary significantly between the three
groups (F (2, 125) = 0.645, p = 0.527). In contrast, for post-test the mean serum
vitamin D varied significantly between the three groups (F (2, 125) = 103.23, p <
0.001).
Using post-hoc test for pairwise comparison at post-test, mean serum vitamin D for
group A was significantly higher than groups B (mean change = 3.99 ng/ml, p =
0.016), and C (mean change = 22.05, p < 0.001), see Table 4.2. Mean serum vitamin D
concentration for group B was significantly higher than C (mean change = 18.05
ng/ml, p < 0.001).
Table 4.2: Post-hoc test comparisons of vitamin D status (ng/ml) between the
three groups for post-test
*indicates a significant difference between two groups as per p < 0.05
b indicates adjustment for multiple comparisons
Comparing pre- and post-test using post-hoc test, there was a significant difference in
serum vitamin D concentration between the pre-test and post-test for group A (mean
change = 22.40 ng/ml, p < 0.001), and B (mean change = 16.39 ng/ml, p < 0.001),
where vitamin D status increased in the post-test, see Table 4.1. No significant
difference was found for group C (p = 0.510).
Time Group Group Mean
change p-valueb
16 weeks
A B 3.996* 0.016
A C 22.050* 0.001
B C 18.054* 0.001

81
The frequencies of serum vitamin D concentrations of the three groups of participants
(A, B, and C), as classified by The Endocrine Society (Holick et al, 2011), are
presented in Figures 4.2 and 4.3.
4.3.2 Corrected calcium (mg/dl)
The changes in the mean corrected calcium of the participants (post-test minus pre-
test) in groups A, B, and C are compared in Table 4.3. The difference in mean
corrected calcium between the post-test and the pre-test, as well as the differences
across the three groups is shown in Figure 4.4.
Table 4.3: Post-hoc comparisons of corrected calcium (mg/dl) between baseline
(pre-test) and after 16 weeks (post-test)
*indicates a significant difference between pre-test and post-test as per p < 0.05
b indicates adjustment for multiple comparisons
Group Baseline
(pre-test)
After 16 weeks
(post-test)
Mean change
(post-test minus pre-
test)
p-valueb
Mean ±SD
A 9.66 ±0.33 9.77 ±0.35 0.11 ±0.40 0.060
B 9.52 ±0.37 9.58 ±0.37 0.06 ±0.38 0.302
C 9.79 ±0.25 9.76 ±0.27 -0.03 ±0.37 0.583
Figure 4.2: Vitamin D status of participants at
baseline (%)
Figure 4.3: Vitamin D status of participants at 16
weeks (%)

82
Figure 4.4: Mean corrected calcium (mg/dl) across the three groups over time
(pre-test and post-test)
The results of ANCOVA indicated that the mean corrected calcium did not vary
significantly between the three groups (F (2, 124) = 2.137, p = 0.122). In none of the
three test groups did corrected calcium exceed the safety margin of 10.5 mg/dl. Mixed
ANOVA testing revealed no significant interaction between time and the three groups
(F (2,125) = 1.555, p = 0.215). Post- hoc test showed no significant difference in
corrected calcium between pre-test and post for each group, see Table 4.3.
4.3.3 BMI
The changes in the mean BMI of the participants in groups A, B, and C (post-test
minus pre-test) are compared in Table 4.4. The difference in mean BMI between the
post-test and the pre-test, as well as the differences across the three groups is shown in
Figure 4.5.
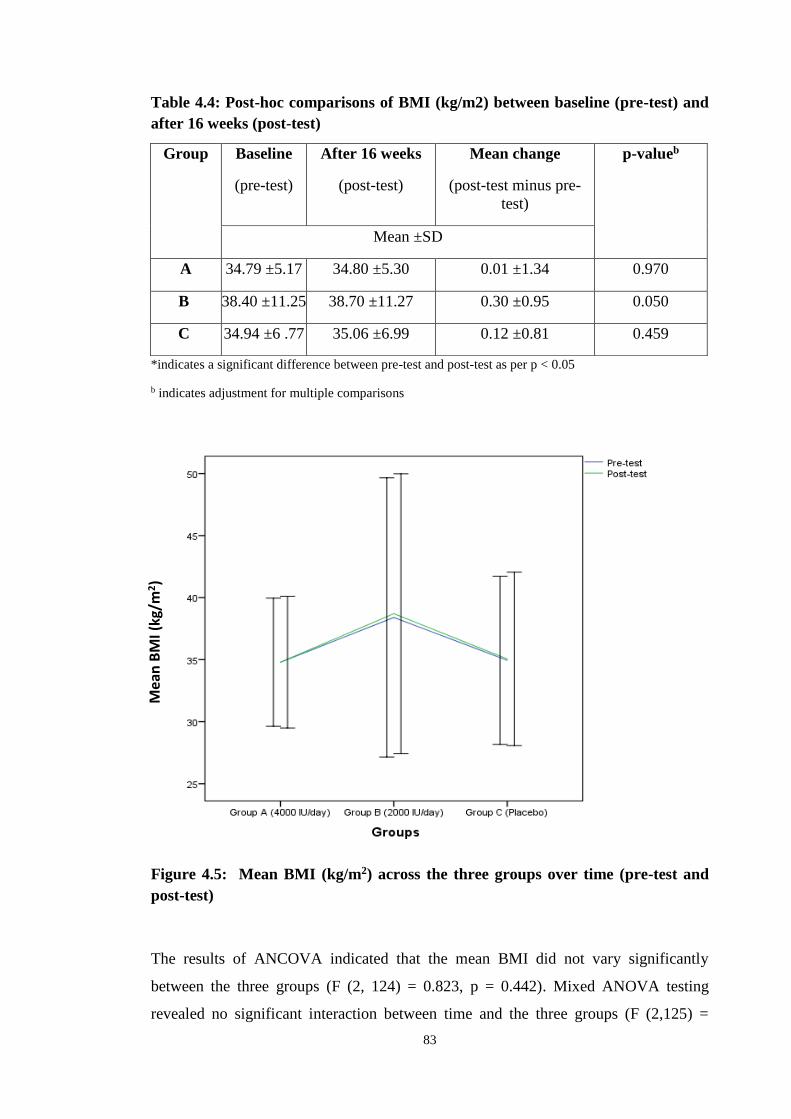
83
Table 4.4: Post-hoc comparisons of BMI (kg/m2) between baseline (pre-test) and
after 16 weeks (post-test)
*indicates a significant difference between pre-test and post-test as per p < 0.05
b indicates adjustment for multiple comparisons
Figure 4.5: Mean BMI (kg/m2) across the three groups over time (pre-test and
post-test)
The results of ANCOVA indicated that the mean BMI did not vary significantly
between the three groups (F (2, 124) = 0.823, p = 0.442). Mixed ANOVA testing
revealed no significant interaction between time and the three groups (F (2,125) =
Group Baseline
(pre-test)
After 16 weeks
(post-test)
Mean change
(post-test minus pre-
test)
p-valueb
Mean ±SD
A 34.79 ±5.17 34.80 ±5.30 0.01 ±1.34 0.970
B 38.40 ±11.25 38.70 ±11.27 0.30 ±0.95 0.050
C 34.94 ±6 .77 35.06 ±6.99 0.12 ±0.81 0.459
Mea
n B
MI (
kg/m
2)

84
0.964, p = 0.384). Post- hoc test showed no significant difference in BMI between pre-
and post test for each group, see Table 4.4.
4.4 Discussion
4.4.1 Vitamin D status
This study found a significant improvement in vitamin D status in both of the
supplemented groups. The doses used (4000 IU/day and 2000 IU/day) were found to
be safe, as the results did not demonstrate an adverse effect on the serum corrected
calcium concentration.
The absence of any supporting evidence for a positive relationship between vitamin D
and diabetes has often been accredited to suboptimal dosing and short study duration.
Studies have found that normal serum concentrations of vitamin D can be achieved
using supplementation doses of at least 1332 IU/day for one month to 50,000
IU/month for six months in vitamin D deficient subjects (Borissova et al., 2003; Yiu et
al., 2013; Al-Zahrani et al., 2014; Kampmann et al., 2014; Nasri et al., 2014; Al-
Sofiani et al., 2015; Krul-Poel et al., 2015; Mohamad et al., 2015; Sadiya et al., 2015).
However, when doses of less than 1332 IU/ day were used, such as de Boer’s (2008)
study of 2291 type 2 diabetic females using 400 IU/ day, sufficient serum
concentrations of vitamin D were not achieved even with a study duration of seven
years. Similarly, a study using 1000 IU vitamin D per day for 12 months was not
adequate to raise serum vitamin D concentrations into the sufficient range (Breslavsky
et al., 2013). Moreover, certain studies have highlighted how serum concentrations of
vitamin D may be more important in improving markers of diabetes than
supplementation alone. A systematic review of several studies found no improvement
in diabetic outcomes in participants with already sufficient serum vitamin D
concentrations (Pittas et al., 2007b). Whilst clear improvements have been
demonstrated in the serum concentrations of vitamin D in both the supplemented
groups in this study, neither dose was enough to ensure all participants had sufficient
concentrations post intervention. Further work investigating the dose-response effect
of vitamin D on serum status is warranted.

85
4.4.2 Corrected calcium
In this study mean corrected calcium levels did not increase significantly in either of
the supplemented groups. None of the participants exceeded the upper limit for normal
safe calcium levels and no patient developed hypercalcaemia. This supports what other
studies have concluded that using a safe dose of vitamin D supplements does not cause
serum corrected calcium levels to increase beyond the normal range (Sugden et al.,
2008; Jorde and Figenschau 2009; Al-Sofiani et al., 2015). Although some studies
found a significant increase in corrected calcium levels, which was attributed to the
role of vitamin D in calcium homeostasis, this never exceeded the normal upper limit
(Raghuramulu et al., 1992; Al-Daghri et al., 2012).
4.4.3 BMI
This study showed no significant change in BMI following 16 weeks of
supplementation with either dose of vitamin D. This supports several other studies
demonstrating vitamin D to have no significant impact on BMI in obese subjects with
type 2 diabetes (Sugden et al., 2008; Jorde and Figenschau 2009; Al-Daghri et al.,
2012; Heshmat et al., 2012; Alkharfy et al., 2013; Breslavsky et al., 2013; Al-Zahrani
et al., 2014; Kampmann et al., 2014; Ryu et al., 2014; Tabesh et al., 2014; Al-Sofiani
et al., 2015).
4.4.4 Summary
In conclusion, this study demonstrates a significant improvement in serum vitamin D
concentrations (p < 0.001) in both the 4000 IU/day and 2000 IU/day groups. The level
of corrected calcium remained within normal parameters in all subjects and no side
effects of vitamin D supplementation were demonstrated in any of the trial
participants. Vitamin D supplementation of either 2000 IU/day or 4000 IU/day did not
have an effect on BMI.

86
Chapter 5. Vitamin D3 and Markers of Glycaemia

87
5.1 Introduction
HbA1c is the principle measure of glycaemia. One study reported that a fall in HbA1c
of just one percent was associated with a 21 per cent decrease in diabetic
complications and a 37 percent decrease in microvascular disease (Stratton et al.,
2000). Given that Asian populations develop type 2 diabetes at an earlier age than their
Caucasian counterparts (Barnett et al., 2006), controlling glycaemia through the
monitoring of HbA1c is even more pertinent.
It has been established that high incidence of diabetes in the Middle East is strongly
related to low vitamin D status (Zhang 2016). Several cross-sectional studies exist
which demonstrate a relationship between low serum vitamin D concentrations and
higher fasting blood glucose levels and insulin resistance (Saedisomeolia et al., 2013).
Recent interventional studies exploring the effect of vitamin D supplementation on
markers of glycaemia have, however, yielded inconsistent results and a definitive
relationship between vitamin D and glucose metabolism is yet to be confidently
established (Alvarez and Ashraf 2010). It has been proposed that vitamin D may affect
glycaemia by binding to the vitamin D receptor (VDR) on pancreatic beta cells,
resulting in increased transcription of the insulin gene and increased peripheral glucose
uptake (Krul-Poel et al., 2014). Vitamin D may also facilitate glucose transport across
target cells indirectly through the regulation of extra- and intra-cellular calcium (Krul-
Poel et al., 2014).
This study aims to test the hypothesis that vitamin D supplementation improves insulin
resistance and beta cell function, as reflected by a reduction in glycated haemoglobin
and fasting blood glucose levels.
5.2 Methodology
Blood samples were taken from all 128 participants at baseline and 16 weeks using the
aseptic technique described in section 2.12. Fasting insulin was measured using the
Roche electrochemiluminescent immunoassay Cobas e601 as described in section
2.15.2. Fasting glucose levels were determined using the Roche enzymatic reference
method described in section 2.15.5. Beta cell function and insulin resistance were
calculated according to the Homeostasis Assessment Model as described in section

88
2.16. Glycated haemoglobin levels were determined using the Roche turbidimetric
inhibition immunoassay as per section 2.15.3.
5.3 Results
5.3.1 Fasting blood glucose
The changes in the mean fasting blood glucose of the participants (post-test minus pre-
test) in groups A, B, and C are compared in Table 5.1. The difference in mean fasting
blood glucose between the post-test and the pre-test, as well as the differences across
the three groups is shown in Figure 5.1.
Table 5.1: Post-hoc test comparisons of fasting blood glucose (mg/dl) between
baseline (pre-test) and after 16 weeks (post-test)
*indicates a significant difference between pre-test and post-test as per p < 0.05
b indicates adjustment for multiple comparisons
Group Baseline
(pre-test)
After 16 weeks
(post-test)
Mean change
(post-test minus pre-test)
p-value
Mean ±SD
A 215.21 ±70.67 175.14 ±73.31 -40.07 ±63.48* 0.001
B 192.13 ±76.80 183.16 ±73.55 -8.97 ±72.54 0.435
C 181.65 ±63.42 180.65 ±72.02 -1.00 ±87.09 0.931
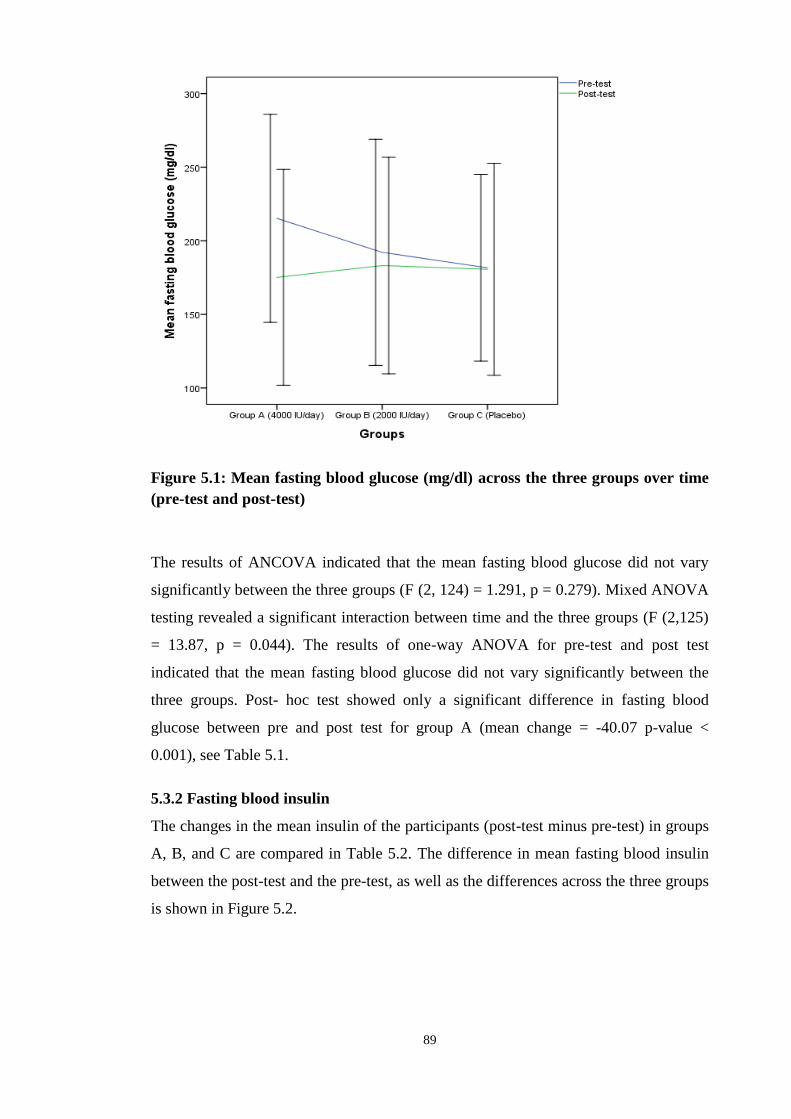
89
Figure 5.1: Mean fasting blood glucose (mg/dl) across the three groups over time
(pre-test and post-test)
The results of ANCOVA indicated that the mean fasting blood glucose did not vary
significantly between the three groups (F (2, 124) = 1.291, p = 0.279). Mixed ANOVA
testing revealed a significant interaction between time and the three groups (F (2,125)
= 13.87, p = 0.044). The results of one-way ANOVA for pre-test and post test
indicated that the mean fasting blood glucose did not vary significantly between the
three groups. Post- hoc test showed only a significant difference in fasting blood
glucose between pre and post test for group A (mean change = -40.07 p-value <
0.001), see Table 5.1.
5.3.2 Fasting blood insulin
The changes in the mean insulin of the participants (post-test minus pre-test) in groups
A, B, and C are compared in Table 5.2. The difference in mean fasting blood insulin
between the post-test and the pre-test, as well as the differences across the three groups
is shown in Figure 5.2.

90
Table 5.2: Post-hoc test comparisons of fasting insulin (μU/mL) between baseline
(pre-test) and after 16 weeks (post-test)
*indicates a significant difference between pre-test and post-test as per p < 0.05
b indicates adjustment for multiple comparisons
Figure 5.2: Mean fasting insulin (μU/mL) across the three groups over time (pre-
test and post-test)
The results of ANCOVA indicated that the mean fasting insulin did not vary
significantly between the three groups, (F (2, 124) 0.776, p = 0.463). Mixed ANOVA
testing revealed no significant interaction between time and the three groups (F (2,125)
Group Baseline
(pre-test)
After 16 weeks
(post-test)
Mean change
(post-test minus pre-
test)
p-valueb
Mean ±SD
A 15.34 ±10.40 17.80 ±12.64 2.46 ±10.05 0.213
B 16.03 ±10.79 15.91 ±10.05 -0.11 ±12.20 0.954
C 20.56 ±20.81 18.16 ±20.55 -2.40 ±15.28 0.218

91
= 1.55, p = 0.216). Post- hoc test showed no significant difference in fasting blood
insulin between pre and post test for each group, see Table 5.2.
5.3.3 Insulin resistance (HOMA-IR)
The changes in the mean HOMA-IR of the participants (post-test minus pre-test) in
groups A, B, and C are compared in Table 5.3. The difference in mean HOMA-IR
between the post-test and the pre-test, as well as the differences across the three groups
is shown in Figure 5.3.
Table 5.3: Post-hoc test comparisons of HOMA-IR (%) between baseline (pre-
test) and after 16 weeks (post-test)
*indicates a significant difference between pre-test and post-test as per p < 0.05
b indicates adjustment for multiple comparisons
Figure 5.3: Mean HOMA-IR (%) across the three groups over time (pre-test and
post-test)
Group Baseline
(pre-test)
After 16 weeks
(post-test)
Mean change
(post-test minus pre-
test)
p-valueb
Mean ±SD
A 8.69 ±8.43 8.05 ±7.50 -0.64 ±6.27 0.576
B 7.62 ±5.27 7.15 ±5.20 -0.47 ±6.44 0.672
C 11.32 ±20.13 9.08 ±14.46 -2.24 ±9.00 0.050
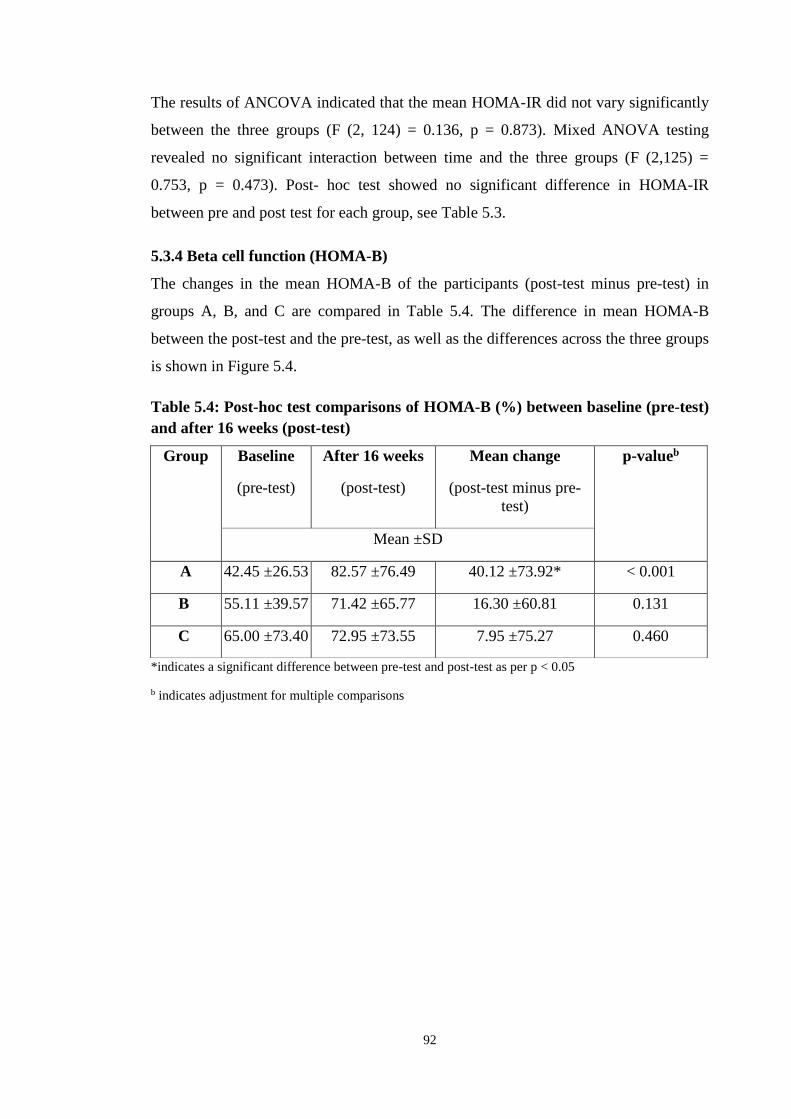
92
The results of ANCOVA indicated that the mean HOMA-IR did not vary significantly
between the three groups (F (2, 124) = 0.136, p = 0.873). Mixed ANOVA testing
revealed no significant interaction between time and the three groups (F (2,125) =
0.753, p = 0.473). Post- hoc test showed no significant difference in HOMA-IR
between pre and post test for each group, see Table 5.3.
5.3.4 Beta cell function (HOMA-B)
The changes in the mean HOMA-B of the participants (post-test minus pre-test) in
groups A, B, and C are compared in Table 5.4. The difference in mean HOMA-B
between the post-test and the pre-test, as well as the differences across the three groups
is shown in Figure 5.4.
Table 5.4: Post-hoc test comparisons of HOMA-B (%) between baseline (pre-test)
and after 16 weeks (post-test)
*indicates a significant difference between pre-test and post-test as per p < 0.05
b indicates adjustment for multiple comparisons
Group Baseline
(pre-test)
After 16 weeks
(post-test)
Mean change
(post-test minus pre-
test)
p-valueb
Mean ±SD
A 42.45 ±26.53 82.57 ±76.49 40.12 ±73.92* < 0.001
B 55.11 ±39.57 71.42 ±65.77 16.30 ±60.81 0.131
C 65.00 ±73.40 72.95 ±73.55 7.95 ±75.27 0.460
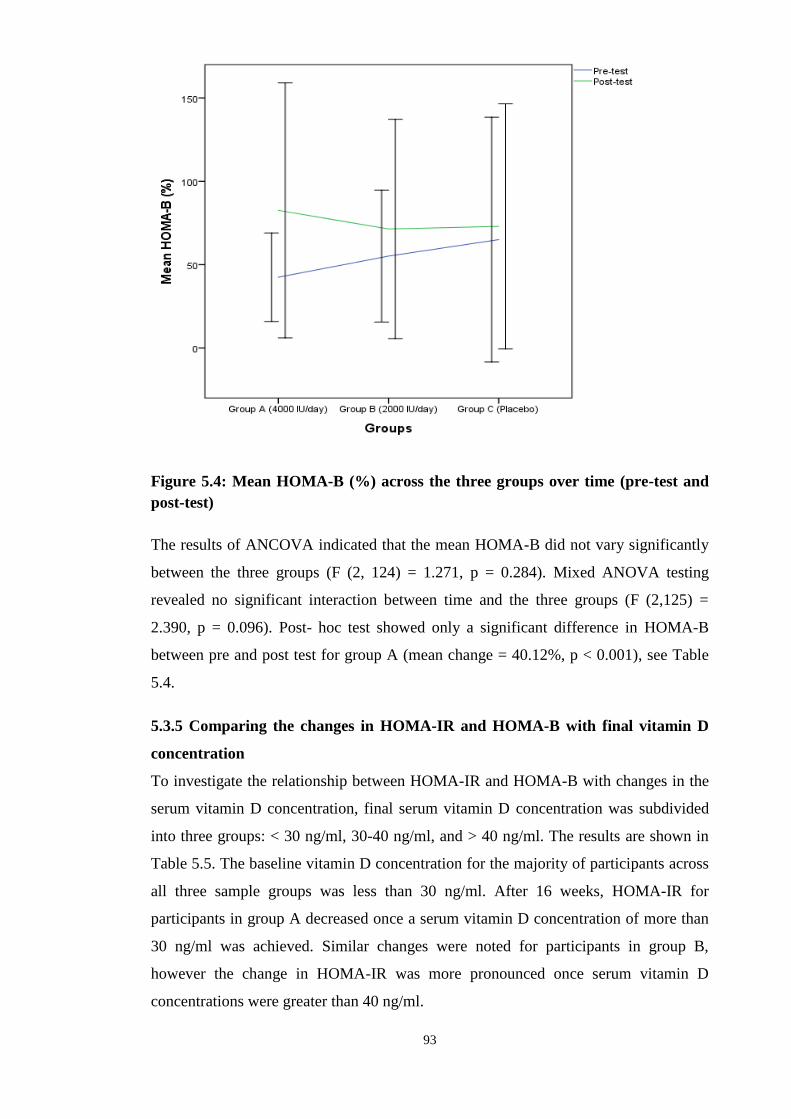
93
Figure 5.4: Mean HOMA-B (%) across the three groups over time (pre-test and
post-test)
The results of ANCOVA indicated that the mean HOMA-B did not vary significantly
between the three groups (F (2, 124) = 1.271, p = 0.284). Mixed ANOVA testing
revealed no significant interaction between time and the three groups (F (2,125) =
2.390, p = 0.096). Post- hoc test showed only a significant difference in HOMA-B
between pre and post test for group A (mean change = 40.12%, p < 0.001), see Table
5.4.
5.3.5 Comparing the changes in HOMA-IR and HOMA-B with final vitamin D
concentration
To investigate the relationship between HOMA-IR and HOMA-B with changes in the
serum vitamin D concentration, final serum vitamin D concentration was subdivided
into three groups: < 30 ng/ml, 30-40 ng/ml, and > 40 ng/ml. The results are shown in
Table 5.5. The baseline vitamin D concentration for the majority of participants across
all three sample groups was less than 30 ng/ml. After 16 weeks, HOMA-IR for
participants in group A decreased once a serum vitamin D concentration of more than
30 ng/ml was achieved. Similar changes were noted for participants in group B,
however the change in HOMA-IR was more pronounced once serum vitamin D
concentrations were greater than 40 ng/ml.
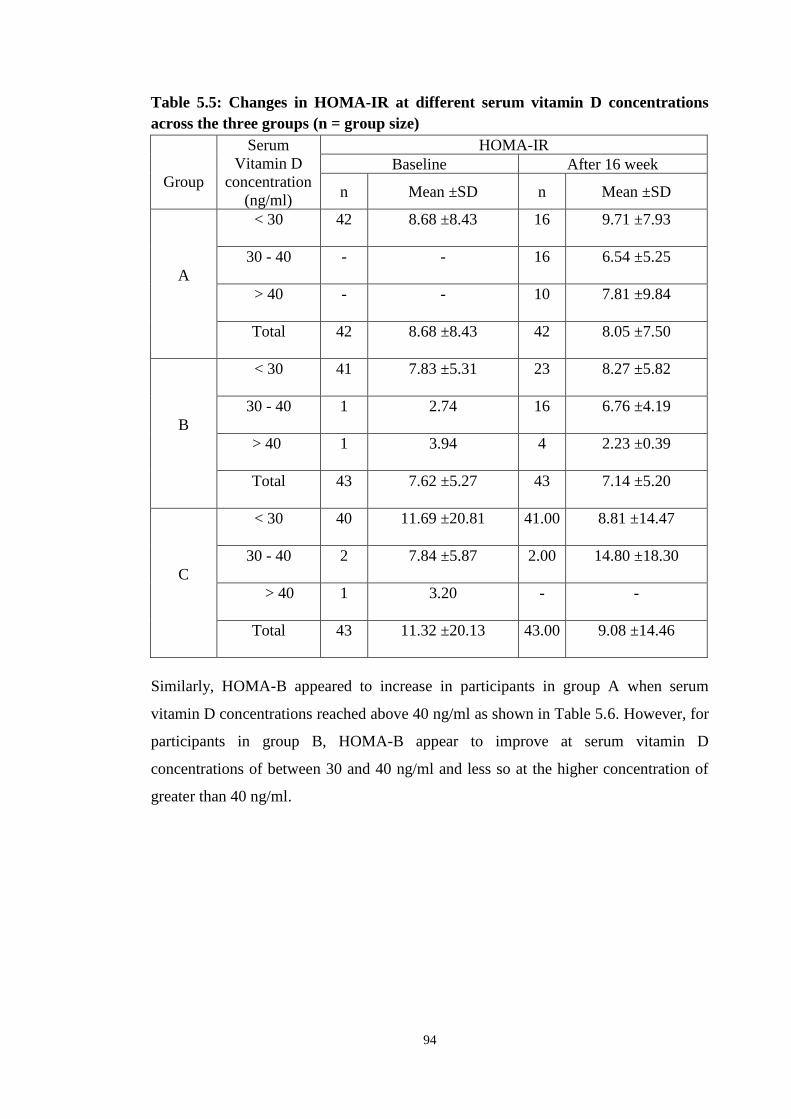
94
Table 5.5: Changes in HOMA-IR at different serum vitamin D concentrations
across the three groups (n = group size)
Group
Serum
Vitamin D
concentration
(ng/ml)
HOMA-IR
Baseline After 16 week
n Mean ±SD n Mean ±SD
A
< 30 42 8.68 ±8.43 16 9.71 ±7.93
30 - 40 - - 16 6.54 ±5.25
> 40 - - 10 7.81 ±9.84
Total 42 8.68 ±8.43 42 8.05 ±7.50
B
< 30 41 7.83 ±5.31 23 8.27 ±5.82
30 - 40 1 2.74 16 6.76 ±4.19
> 40 1 3.94 4 2.23 ±0.39
Total 43 7.62 ±5.27 43 7.14 ±5.20
C
< 30 40 11.69 ±20.81 41.00 8.81 ±14.47
30 - 40 2 7.84 ±5.87 2.00 14.80 ±18.30
> 40 1 3.20 - -
Total 43 11.32 ±20.13 43.00 9.08 ±14.46
Similarly, HOMA-B appeared to increase in participants in group A when serum
vitamin D concentrations reached above 40 ng/ml as shown in Table 5.6. However, for
participants in group B, HOMA-B appear to improve at serum vitamin D
concentrations of between 30 and 40 ng/ml and less so at the higher concentration of
greater than 40 ng/ml.

95
Table 5.6: Changes in HOMA-B at different serum vitamin D concentrations
across the three groups (n = group size)
Group
Serum
Vitamin D
concentration
(ng/ml)
HOMA-B
Baseline After 16 week
n Mean ±SD n Mean ±SD
A
< 30 42 42.45 ±26.54
16 81.26 ±55.95
30 - 40 - -
16 65.62 ±61.68
> 40 - - 10 111.78±
116.75
Total 42 42.45 ±26.54 42 82.57 ±76.49
B
< 30 41 56.85 ±39.57
23 58.68 ±42.46
30 - 40 1 34.92
16 94.96 ±90.60
> 40 1 4.19
4 50.55 ±38.86
Total 43 55.12 ±39.57
43 71.42 ±65.77
C
< 30 40 67.46 ±75.44
41.00 71.98 ±75.23
30 - 40 2 34.37 ±29.75
2.00 92.80 ±4.75
> 40 1 27.74
-
Total 43 65.00 ±73.41
43.00 72.95 ±73.55
5.3.6 Glycated haemoglobin (HbA1c)
The changes in the mean HbA1c of the participants (post-test minus pre-test) in groups
A, B, and C are compared in Table 5.7. The difference in mean HbA1c between the
post-test and the pre-test, as well as the differences across the three groups is shown in
Figure 5.5.

96
Table 5.7: Post-hoc test comparisons of HbA1c (%) between baseline (pre-test)
and after 16 weeks (post-test)
*indicates a significant difference between pre-test and post-test as per p < 0.05
b indicates adjustment for multiple comparisons
Figure 5.5: Mean HbA1c (%) across the three groups over time (pre-test and
post-test)
The results of ANCOVA indicated that the mean HbA1c varied significantly between
the three groups, (F (2, 124) = 7.135, p = 0.001) although the effect size was relatively
Group Baseline
(pre-test)
After 16 weeks
(post-test)
Mean change
(post-test minus pre-
test)
p-valueb
Mean ±SD
A 9.91 ±1.19 9.50 ±1.72 -0.41 ±1.08* 0.027
B 9.57 ±1.15 9.27 ±1.44 -0.30 ±1.29 0.106
C 9.70 ±1.29 10.19 ±1.39 0.48 ±1.18* 0.009

97
low (eta squared = 0.103). The results from mixed ANOVA showed that there was a
significant interaction between time and the three groups (F (2,125) = 125, p = 0.001).
The results of one-way ANOVA indicated that the mean HbA1c for pre-test did not
vary significantly between the three groups, (F (2, 125) = 0.905, p = 0.407). In
contrast, for post-test, the mean HbA1c varied significantly between the three groups
(F (2, 125) = 4.169, p = 0.018).
Post-hoc test for pairwise comparison at post-test indicated that the mean HbA1c for
group A was significantly less than group C (mean change = -0.679 ng/ml, p = 0.042),
see Table 5.8. In addition, group B was significantly less than group C (mean change =
-0.914 ng/ml, p = 0.006) see Table 5.8.
Table 5.8: Post-hoc test comparisons of HbA1 (%) between the three groups for
post-test
Time Group Group Mean change p-valueb
Post-test
A B 0.235 0.478
A C -0.679* 0.042
B C -0.914* 0.006 *indicates a significant difference between two groups as per p < 0.05
b indicates adjustment for multiple comparisons
Comparing pre- and post-test using post-hoc test showed a significant difference in
HbA1c for group A (mean change = -0.41 %, p = 0.027), where HbA1c decreased at
post-test, see Table 5.7. There was also a significant difference for group C (mean
change = 0.48 %, p = 0.009), where HbA1c increased at post-test, see Table 5.7.
5.4 Discussion
5.4.1 Fasting blood glucose level
This study has found no significant change in fasting blood glucose level as a result of
vitamin D supplementation of either 4000 IU or 2000 IU per day. These findings
support previous studies that have found no relationship between vitamin D
supplementation and improved fasting blood glucose levels (Patel et al., 2010; Al-
Zahrani 2013; Kampmann et al., 2014; Nasri et al., 2014; Ryu et al., 2014; Tabesh et
al., 2014; Sadiya et al., 2015). Orwoll et al. (1994) recruited 20 type 2 diabetic subjects
98
in a double-blind, placebo-controlled trial with 200 IU vitamin D supplemented daily
for four days. The study concluded that vitamin D supplementation had no effect on
fasting blood glucose levels in type 2 diabetics, supporting the results of this study. A
similar randomised, placebo-controlled study of 47 type 2 diabetics given a daily dose
of 1000 IU vitamin D for a longer period of 12 months, still showed no improvement
in fasting blood glucose levels (Breslavsky et al., 2013). Even at higher doses and
where sufficient serum concentrations have been achieved, vitamin D supplementation
has not been found to improve fasting blood glucose levels. Jorde and Figenschau
(2009) conducted a randomised control trial on 36 subjects with type 2 diabetes,
supplemented with 40,000 IU per week of vitamin D. At six months, the fasting blood
glucose levels were not significantly different from the baseline values. Furthermore,
there was no difference in fasting blood glucose levels between the vitamin D and the
placebo group. This is consistent with the findings from a larger 2012 study involving
100 type 2 diabetics randomised to either 5000 IU per day of vitamin D or a placebo
for 12 weeks (Yiu et al., 2013). The study concluded that vitamin D supplementation
had no effect on fasting blood glucose levels even at a higher dose. The results of this
study suggest that vitamin D supplementation has no effect on fasting blood glucose
levels.
A 2014 systematic review of 25 randomised control trials evaluating the effect of
vitamin D supplementation on subjects without diabetes, with pre-diabetes and with
type 2 diabetes drew somewhat different conclusions (Seida et al., 2014). Whilst the
participants with type 2 diabetes showed no improvement in fasting blood glucose
levels following supplementation, those with pre-diabetes had a significantly lower
increase in fasting blood glucose when compared to those randomised to a placebo. A
similar observation was made by Pittas et al. (2007a) in a randomised control study of
314 subjects given vitamin D for the treatment of osteoporosis (Pittas et al., 2007a). Of
those studied, 92 exhibited an impaired fasting blood glucose level. After three years,
those subjects allocated vitamin D supplements had a significantly lower increase in
their fasting blood glucose in comparison to those randomised to placebo (0.4 mg/dl
compared to 6.12 mg/dl). Similarly, Boucher et al. (1995) highlighted improvements
in glucose tolerance after vitamin D supplementation in vitamin D deficient subjects
with impaired glucose tolerance.
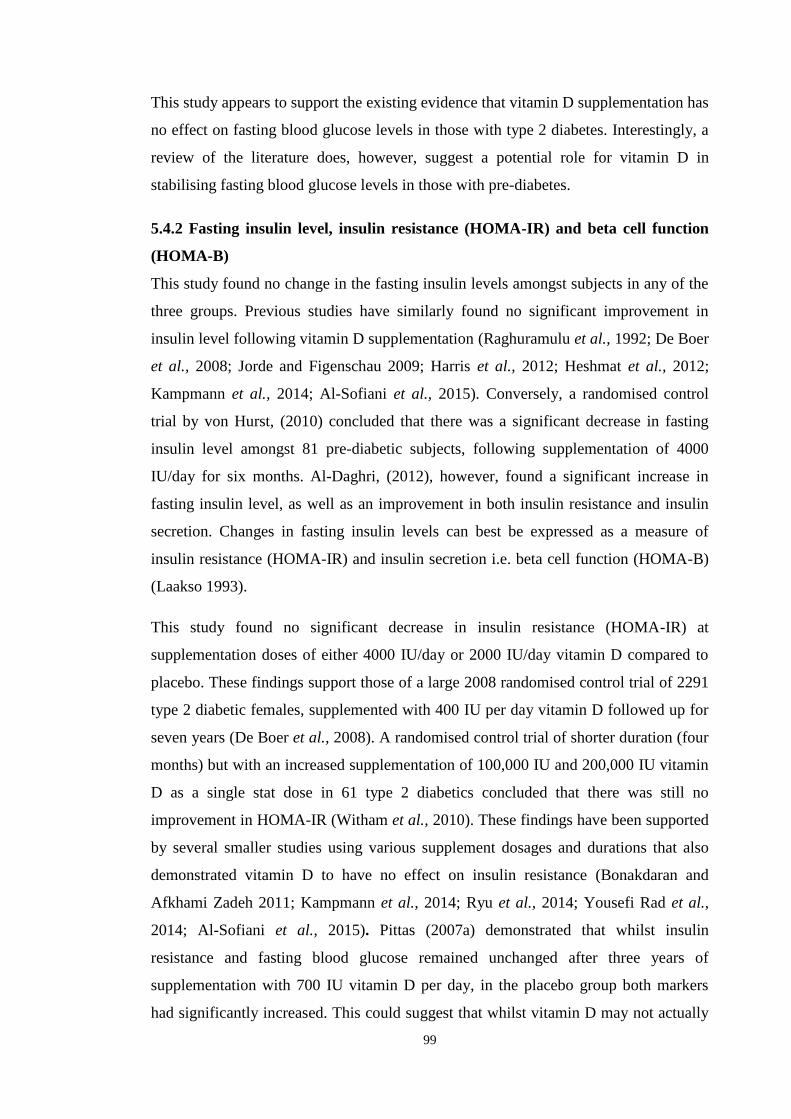
99
This study appears to support the existing evidence that vitamin D supplementation has
no effect on fasting blood glucose levels in those with type 2 diabetes. Interestingly, a
review of the literature does, however, suggest a potential role for vitamin D in
stabilising fasting blood glucose levels in those with pre-diabetes.
5.4.2 Fasting insulin level, insulin resistance (HOMA-IR) and beta cell function
(HOMA-B)
This study found no change in the fasting insulin levels amongst subjects in any of the
three groups. Previous studies have similarly found no significant improvement in
insulin level following vitamin D supplementation (Raghuramulu et al., 1992; De Boer
et al., 2008; Jorde and Figenschau 2009; Harris et al., 2012; Heshmat et al., 2012;
Kampmann et al., 2014; Al-Sofiani et al., 2015). Conversely, a randomised control
trial by von Hurst, (2010) concluded that there was a significant decrease in fasting
insulin level amongst 81 pre-diabetic subjects, following supplementation of 4000
IU/day for six months. Al-Daghri, (2012), however, found a significant increase in
fasting insulin level, as well as an improvement in both insulin resistance and insulin
secretion. Changes in fasting insulin levels can best be expressed as a measure of
insulin resistance (HOMA-IR) and insulin secretion i.e. beta cell function (HOMA-B)
(Laakso 1993).
This study found no significant decrease in insulin resistance (HOMA-IR) at
supplementation doses of either 4000 IU/day or 2000 IU/day vitamin D compared to
placebo. These findings support those of a large 2008 randomised control trial of 2291
type 2 diabetic females, supplemented with 400 IU per day vitamin D followed up for
seven years (De Boer et al., 2008). A randomised control trial of shorter duration (four
months) but with an increased supplementation of 100,000 IU and 200,000 IU vitamin
D as a single stat dose in 61 type 2 diabetics concluded that there was still no
improvement in HOMA-IR (Witham et al., 2010). These findings have been supported
by several smaller studies using various supplement dosages and durations that also
demonstrated vitamin D to have no effect on insulin resistance (Bonakdaran and
Afkhami Zadeh 2011; Kampmann et al., 2014; Ryu et al., 2014; Yousefi Rad et al.,
2014; Al-Sofiani et al., 2015). Pittas (2007a) demonstrated that whilst insulin
resistance and fasting blood glucose remained unchanged after three years of
supplementation with 700 IU vitamin D per day, in the placebo group both markers
had significantly increased. This could suggest that whilst vitamin D may not actually

100
improve insulin resistance and fasting blood glucose, it may slow the natural
progression of diabetes.
Other studies conducted in the Middle East have found vitamin D supplementation to
have a significant effect on insulin resistance (Al-Daghri et al., 2012; Talaei et al.,
2013; Al-Shahwan et al., 2015). A 2015 randomised control trial of 45 Saudi type 2
diabetics demonstrated a significant improvement in insulin resistance after one year of
supplementation of 2000 IU vitamin D per day (Al-Shahwan et al., 2015). Von Hurst
et al. (2010) not only highlighted how insulin resistance had significantly improved
after six months of supplementation at 4000 IU/day, but that the improvement was
most marked when serum 25(OH)D concentrations reached above 32 ng/ml. This
suggests that achieving a certain serum vitamin D concentration may be of greater
importance than the dose of supplement given. Similarly, Talaei (2013) reported
improvements in insulin resistance only when serum vitamin D concentrations reached
40-60 ng/ml and found no effect when lower serum vitamin D concentrations were
achieved. This corroborates what the present study found with regards to HOMA-IR
and vitamin D concentration. Whilst these changes were descriptive and not
statistically significant, the findings do suggest that the serum vitamin D concentration
is more important than the dose of supplementation given. This suggests there is scope
for further research on the role of vitamin D in insulin resistance when higher serum
vitamin D concentrations have been achieved.
This study demonstrates an improvement in pancreatic beta cell function (HOMA-B)
as a result of vitamin D supplementation, however this was not found to be significant.
A growing body of evidence suggests that vitamin D plays a role in improving beta
cell function (Borissova et al., 2003; Harris et al., 2012; Al-Sofiani et al., 2015),
however this study did not support these findings. An 18 month prospective
interventional study of 34 males and 58 females with type 2 diabetes in Saudi Arabia,
supplemented with 2000 IU/day vitamin D, further showed that this improvement was
more marked in females than in males (Al-Daghri et al., 2012). Harris et al. (2012) in a
randomized control trial of 89 pre-diabetics and type 2 diabetics supplemented with
4000 IU/day vitamin D saw a significant improvement in beta cell function after 12
weeks.

101
Other studies, however, have found vitamin D to play no role in improving pancreatic
beta cell function (Orwoll et al., 1994; Jorde and Figenschau 2009; von Hurst et al.,
2010). A cross-sectional analyses of the National Health & Nutrition Examination
Survey 1989-1994 (NHANES III) found serum 25(OH)D concentrations to be
inversely related to diabetes risk and insulin resistance. However, no relationship was
found between serum 25(OH)D concentrations and beta-cell function (Scragg et al.,
2004). This discrepancy in the evidence may be related to insufficient doses of
supplementation used, the duration of supplementation given and the validity of the
study. Orwoll et al. (1994) found no relationship between vitamin D and improved
beta cell secretion, however as previously mentioned the very small sample size used
(n=20), small supplement dosage (400 IU/day) and short duration of trial (four days)
made drawing any valid conclusions difficult. Sufficient serum vitamin D
concentrations were also not achieved following intervention. Similarly, it is hard to
draw reliable conclusions from the cross-sectional analyses of the NHANES III as it
was an observational rather than an interventional study and therefore it is difficultly to
demonstrate causality. In contrast to this, Jorde and Figenschau (2009) and von Hurst
et al. (2010) both used supplementation doses of 40,000 IU/ week and 4000 IU/day
respectively and both for a duration of six months, yet still found no relationship
between vitamin D and beta cell function.
In conclusion, this study has demonstrated no significant improvements in either beta
cell function or insulin resistance following four months of supplementation with
vitamin D. This is likely due to not achieving a serum vitamin D concentration above
40 ng/ml as previous studies have demonstrated. Furthermore, vitamin D has been
shown to delay the progression of insulin resistance and beta cell dysfunction in those
with impaired fasting glucose. As a result it may be the case that whilst vitamin D does
not necessarily improve these two markers, it has a role in delaying the progression of
diabetic complications.
5.4.3 Glycated haemoglobin
This study found a significant improvement in glycated haemoglobin in those
supplemented with vitamin D. After 16 weeks of vitamin D supplementation, 62% of
patients had a lower HbA1c level compared to baseline. Of those patients that received
4000 IU vitamin D per day this figure was even higher at 72%, compared to 51% of
those that received the lower dose of 2000 IU per day. In comparison, 67% of those

102
patients given the placebo had an increase in their HbA1c from baseline after 16
weeks. These findings are consistent with several cross-sectional analyses also finding
vitamin D to be inversely associated with HbA1c (Schwalfenberg 2008; Sabherwal et
al., 2010; Dalgard et al., 2011; Zoppini et al., 2013; Sebekova et al., 2015). A 2012
cross-sectional analysis of 158 vitamin D deficient, type 2 diabetics demonstrated that
as serum vitamin D concentrations improved, so too did glycated haemoglobin
(Dalgard et al., 2011). Similarly, a 2013 cross-sectional study of 715 type 2 diabetics
with known serum 25(OH)D concentrations concluded that serum vitamin D
concentration was inversely associated with HbA1c (Zoppini et al., 2013).
Furthermore, Sabherwal et al. (2010) found the greater the increase in serum vitamin D
concentrations following supplementation, the greater the decrease in HbA1c in a
retrospective study of 52 South Asians with both type 2 diabetes and vitamin D
deficiency.
Discrepancies continue to exist within the current literature as to whether vitamin D
supplementation improves HbA1c levels. Several interventional studies from the
Middle East and North Africa have demonstrated a causal link between improved
serum vitamin D concentrations and a decrease in HbA1c levels (Labban 2014; Nasri
et al., 2014; Yousefi Rad et al., 2014; Mohamad et al., 2015). A 2014 randomised
control trial of 722 Moroccan type 2 diabetics supplemented with 2000 IU/day vitamin
D demonstrated a 21.0% improvement in HbA1c levels after three months (Labban
2014). Similarly, Nasri (2014) demonstrated a significant improvement in the HbA1c
levels of 60 Iranian type 2 diabetic participants following supplementation with 50,000
IU vitamin D per week for three months. A 2008 case report of two female type 2
diabetics receiving 3000 IU/day and 2000 IU/day vitamin D respectively, found a
substantial decrease in HbA1c level of 13.5 percent and 9.0 percent respectively after
nine months (Schwalfenberg 2008).
Conversely, several large-scale interventional studies have demonstrated no causal
relationship between vitamin D and HbA1c (Sugden et al., 2008; Jorde and Figenschau
2009; Patel et al., 2010; Witham et al., 2010; Heshmat et al., 2012; Al-Zahrani et al.,
2014; Kampmann et al., 2014; Ryu et al., 2014; Al-Sofiani et al., 2015; Krul-Poel et
al., 2015). A 2012 randomised double-blind control trial on 42 Iranian type 2 diabetic
patients supplemented with a single intramuscular injection of 300,000 IU vitamin D
found there to have been no change in HbA1c levels after three months (Heshmat et

103
al., 2012). The researcher concluded that in this case the sample size was likely too
small to see significant improvements. Similarly, Sugden et al. (2008), Jorde and
Figenschau (2009), Patel et al. (2010), Kampmann et al. (2014) and Al-Sofiani et al.
(2015) all used sample sizes likely too small to demonstrate a significant effect of
vitamin D therapy on glucose metabolism. Furthermore, a 2010 pilot prospective
randomised trial of 24 type 2 diabetics with serum concentrations of vitamin D below
25 ng/ml, were supplemented with either 400 IU/ day or 1200 IU/ day of vitamin D,
well below the 2000 IU required to achieve significant results (Patel et al., 2010).
Therefore, this discrepancy in the evidence may be related to the different doses of
supplementation used, the sample size and the ethnic background of the study
population.
This study appears to support the existing evidence that vitamin D supplementation has
a significant effect on glycated haemoglobin in participants from the Middle East and
North Africa with type 2 diabetes. Interestingly, improvements were seen when
vitamin D supplements of 2000 IU/day or higher were used and sample sizes ranged
from between 58 to 722 participants.
5.4.4 Summary
In conclusion, this study demonstrates no significant relationship between vitamin D
supplementation of either 2000 IU/day or 4000 IU/day on fasting insulin and glucose
levels, insulin resistance and beta cell function. However, a significant improvement in
glycated haemoglobin (p = 0.001) was demonstrated in both groups supplemented with
vitamin D, with the higher dose proving to be the more effective of the two. This
suggests vitamin D may play a positive role in diabetic control and prevention of
diabetic complications, particularly in Middle Eastern countries. Further human studies
at higher doses of vitamin D supplementation, achieving serum concentrations of 40-
60 ng/ml, will be useful in cementing the role of vitamin D in the long-term
management of type 2 diabetes.

104
Chapter 6. Vitamin D3 and Lipidaemia

105
6.1 Introduction
A review of the literature indicates that the relationship between vitamin D and
dyslipidaemia remains controversial. Observational studies have, however, shown low
serum concentrations of vitamin D are associated with unfavourable lipid profiles and
it has been suggested that vitamin D may affect serum lipid levels in a number of ways
(Kendrick et al., 2009; Wang et al., 2012). Vitamin D increases absorption of intestinal
calcium, which in turn affects the amount of fat absorbed in the gut. The calcium binds
to fatty acids and bile acids, forming calcium-fatty acid soaps, which are excreted in
the faeces (Boon et al., 2007). This decreases the absorption of fat from the gut,
reducing serum total and LDL-cholesterol, as well as triglyceride concentrations
(Saunders et al., 1988; Grundy and Denke 1990; Van der meer et al., 1990; Vaskonen
et al., 2002; Vaskonen 2003; Cho et al., 2005; Zittermann et al., 2009). In addition, the
action of vitamin D on serum parathyroid hormone (PTH) concentrations may inhibit
dyslipidaemia (Jorde and Grimnes 2011). Raised serum PTH levels are associated with
an increased risk of obesity and have been shown to reduce lipolysis in vitro
(Kamycheva et al., 2004a; Kamycheva et al., 2004b; Jorde et al., 2005; Hagstrom et
al., 2009). It has therefore been proposed that vitamin D may lower serum lipid
concentrations through the suppression of PTH secretion from the parathyroid glands
(Zemel et al., 2000).
Apolipoprotein A1 has been shown to persistently correlate with vitamin D
concentrations (Satin 2000; Gagnon et al., 2012; Salum et al., 2012; Vacek et al.,
2012). Elevations in serum apolipoprotein A1 concentrations lead to a direct increase
in HDL particle formation and increase reverse cholesterol transport (Vacek et al.,
2012). To date, the effects of vitamin D on apolipoprotein gene expression and
cholesterol levels remains controversial and further research is required.
The aim of this study was to test the hypothesis that vitamin D supplementation
improved markers of dyslipidaemia in poorly controlled type 2 diabetic females within
the Saudi Arabian population.
6.2 Methodology
Blood samples were taken from all 128 participants to determine the lipid profile,
including high density lipoprotein (HDL), low density lipoprotein (LDL), triglycerides
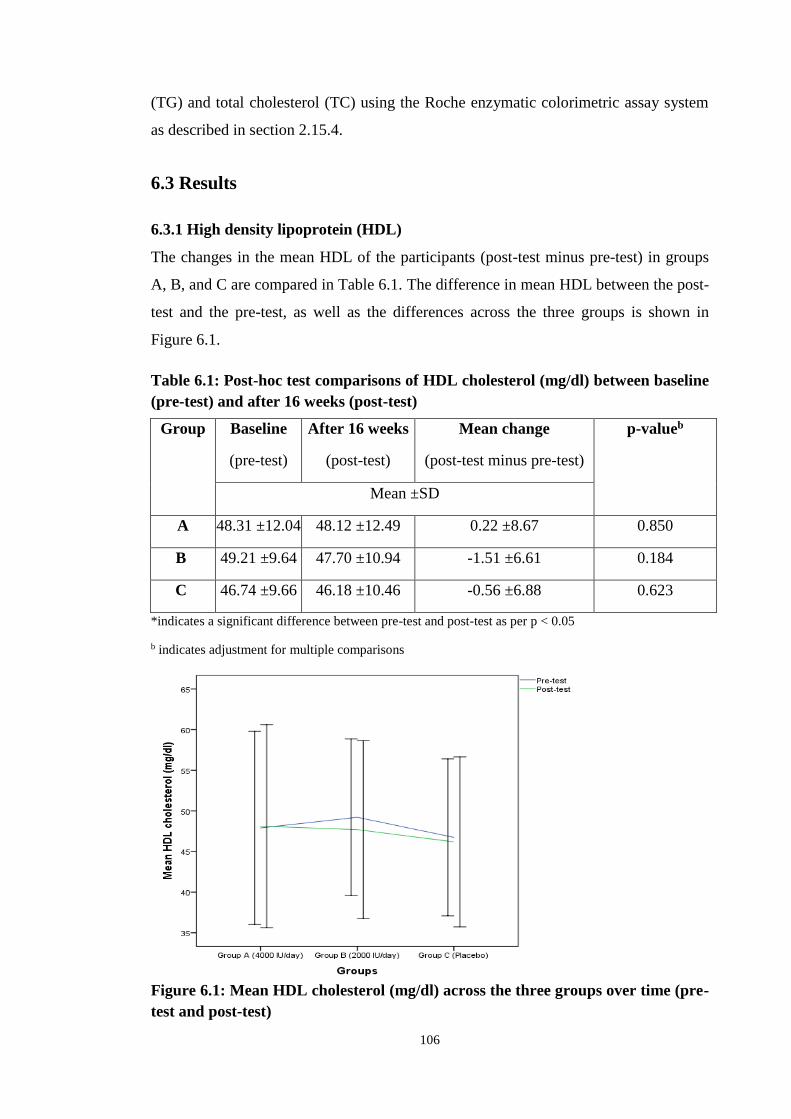
106
(TG) and total cholesterol (TC) using the Roche enzymatic colorimetric assay system
as described in section 2.15.4.
6.3 Results
6.3.1 High density lipoprotein (HDL)
The changes in the mean HDL of the participants (post-test minus pre-test) in groups
A, B, and C are compared in Table 6.1. The difference in mean HDL between the post-
test and the pre-test, as well as the differences across the three groups is shown in
Figure 6.1.
Table 6.1: Post-hoc test comparisons of HDL cholesterol (mg/dl) between baseline
(pre-test) and after 16 weeks (post-test)
*indicates a significant difference between pre-test and post-test as per p < 0.05
b indicates adjustment for multiple comparisons
Figure 6.1: Mean HDL cholesterol (mg/dl) across the three groups over time (pre-
test and post-test)
Group Baseline
(pre-test)
After 16 weeks
(post-test)
Mean change
(post-test minus pre-test)
p-valueb
Mean ±SD
A 48.31 ±12.04 48.12 ±12.49 0.22 ±8.67 0.850
B 49.21 ±9.64 47.70 ±10.94 -1.51 ±6.61 0.184
C 46.74 ±9.66 46.18 ±10.46 -0.56 ±6.88 0.623

107
The results of ANCOVA indicated, however, that the HDL did not vary significantly
between the three groups (F (2, 123) = 0.468, p = 0.628). Mixed ANOVA testing
revealed no significant interaction between time and the three groups (F (2,125) = 573,
p = 0.565). Post- hoc test showed no significant difference in HDL between pre and
post test for each group, see Table 6.1.
6.3.2 Low density lipoprotein (LDL)
The changes in the mean LDL of the participants (post-test minus pre-test) in groups
A, B, and C are compared in Table 6.2. The difference in mean LDL between the post-
test and the pre-test, as well as the differences across the three groups is shown in
Figure 6.2.
Table 6.2: : Post-hoc comparisons of LDL cholesterol (mg/dl) between baseline
(pre-test) and after 16 weeks (post-test)
*indicates a significant difference between pre-test and post-test as per p < 0.05
b indicates adjustment for multiple comparisons
Group Baseline
(pre-test)
After 16 weeks
(post-test)
Mean change
(post-test minus pre-test)
p-valueb
Mean ±SD
A 105.45 ±36.25 103.71 ±39.84 -1.74 ±37.16 0.949
B 105.91 ±34.21 100.44 ±25.41 -5.47 ±32.06 0.282
C 102.79 ±32.53 115.30 ±36.37 12.51 ±30.18* 0.015

108
Figure 6.2: Mean LDL cholesterol (mg/dl) across the three groups over time (pre-
test and post-test)
The results of ANCOVA indicated that the mean LDL varied significantly between the
three groups (F (2, 123) = 3.684, p = 0.028) although the effect size was relatively low
(eta squared = 0.057). The results of mixed ANOVA showed that there was a
significant interaction between time and the three groups (F (2,125) = 3.342, p =
0.039). The results of one-way ANOVA indicated that at both pre and post test the
mean LDL did not vary significantly between the three groups.
Using post-hoc test for pairwise comparison at post-test, mean LDL cholesterol in
group B was significantly lower than group C (mean change = -14.86, p = 0.043), see
Table 6.3. Comparing pre and post test using post-hoc test, the only significant
difference in LDL was for group C (mean change = 12.51, p = 0.015), see Table 6.2.
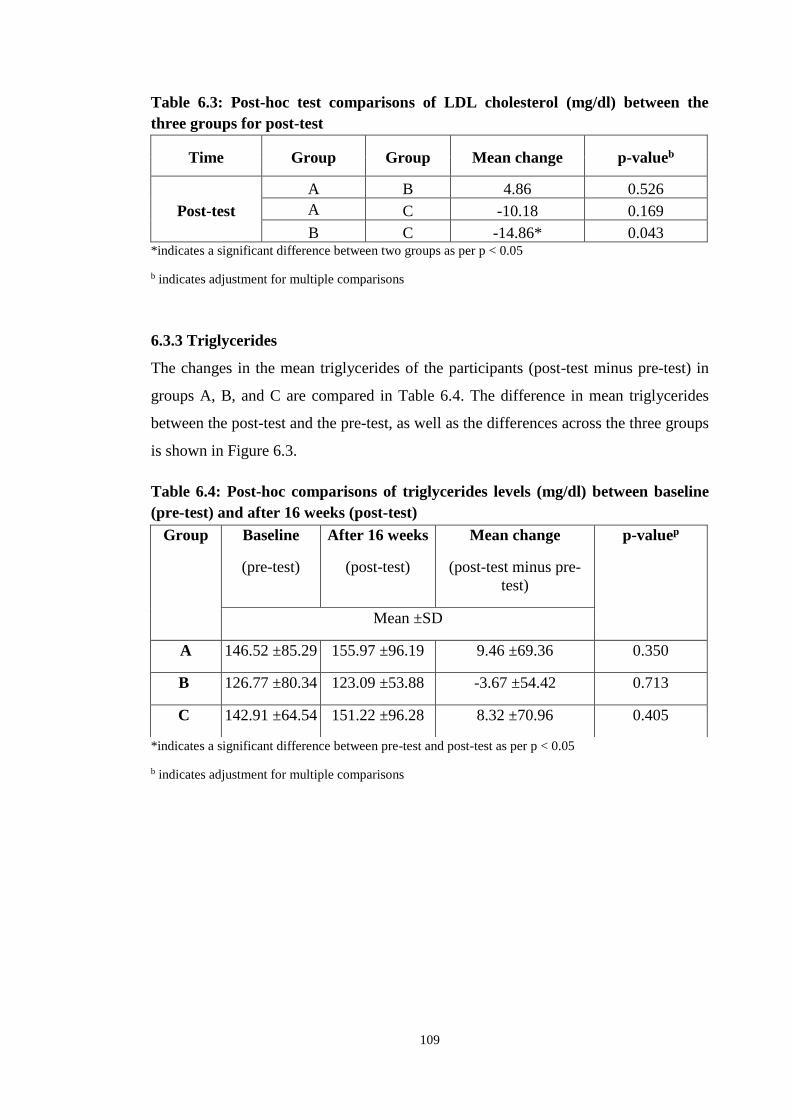
109
Table 6.3: Post-hoc test comparisons of LDL cholesterol (mg/dl) between the
three groups for post-test
Time Group Group Mean change p-valueb
Post-test
A B 4.86 0.526
A C -10.18 0.169
B C -14.86* 0.043 *indicates a significant difference between two groups as per p < 0.05
b indicates adjustment for multiple comparisons
6.3.3 Triglycerides
The changes in the mean triglycerides of the participants (post-test minus pre-test) in
groups A, B, and C are compared in Table 6.4. The difference in mean triglycerides
between the post-test and the pre-test, as well as the differences across the three groups
is shown in Figure 6.3.
Table 6.4: Post-hoc comparisons of triglycerides levels (mg/dl) between baseline
(pre-test) and after 16 weeks (post-test)
*indicates a significant difference between pre-test and post-test as per p < 0.05
b indicates adjustment for multiple comparisons
Group Baseline
(pre-test)
After 16 weeks
(post-test)
Mean change
(post-test minus pre-
test)
p-valuep
Mean ±SD
A 146.52 ±85.29 155.97 ±96.19 9.46 ±69.36 0.350
B 126.77 ±80.34 123.09 ±53.88 -3.67 ±54.42 0.713
C 142.91 ±64.54 151.22 ±96.28 8.32 ±70.96 0.405
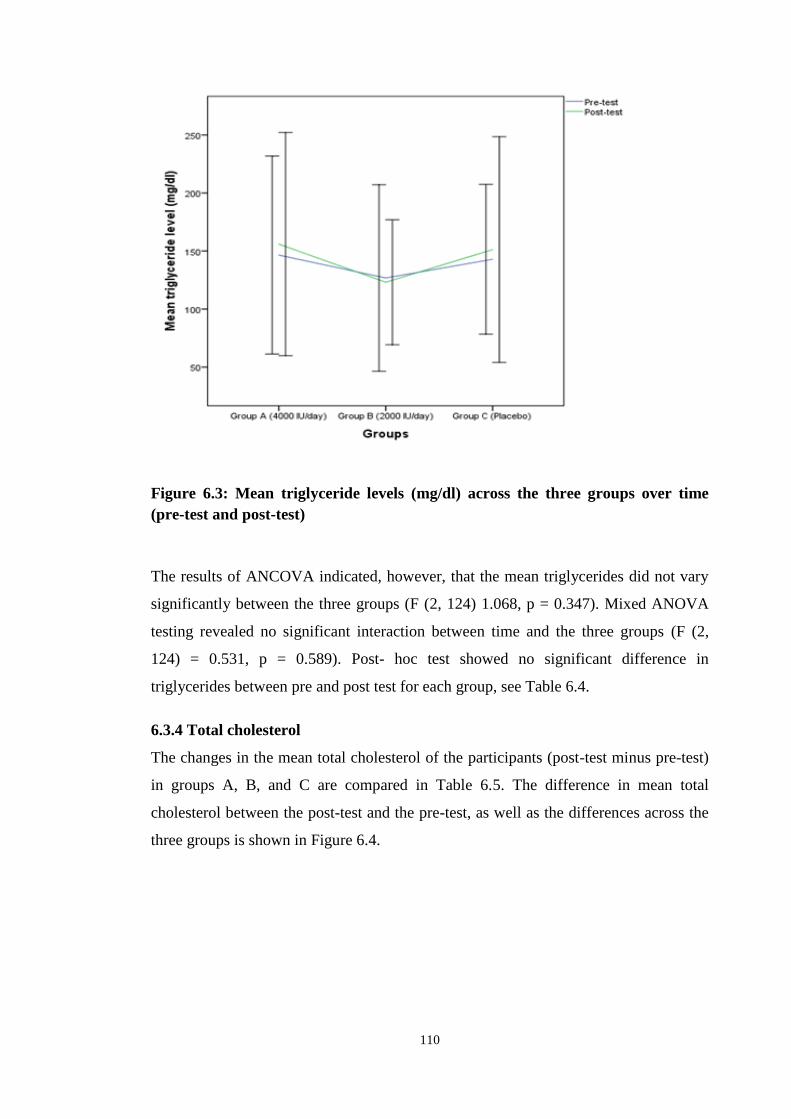
110
Figure 6.3: Mean triglyceride levels (mg/dl) across the three groups over time
(pre-test and post-test)
The results of ANCOVA indicated, however, that the mean triglycerides did not vary
significantly between the three groups (F (2, 124) 1.068, p = 0.347). Mixed ANOVA
testing revealed no significant interaction between time and the three groups (F (2,
124) = 0.531, p = 0.589). Post- hoc test showed no significant difference in
triglycerides between pre and post test for each group, see Table 6.4.
6.3.4 Total cholesterol
The changes in the mean total cholesterol of the participants (post-test minus pre-test)
in groups A, B, and C are compared in Table 6.5. The difference in mean total
cholesterol between the post-test and the pre-test, as well as the differences across the
three groups is shown in Figure 6.4.
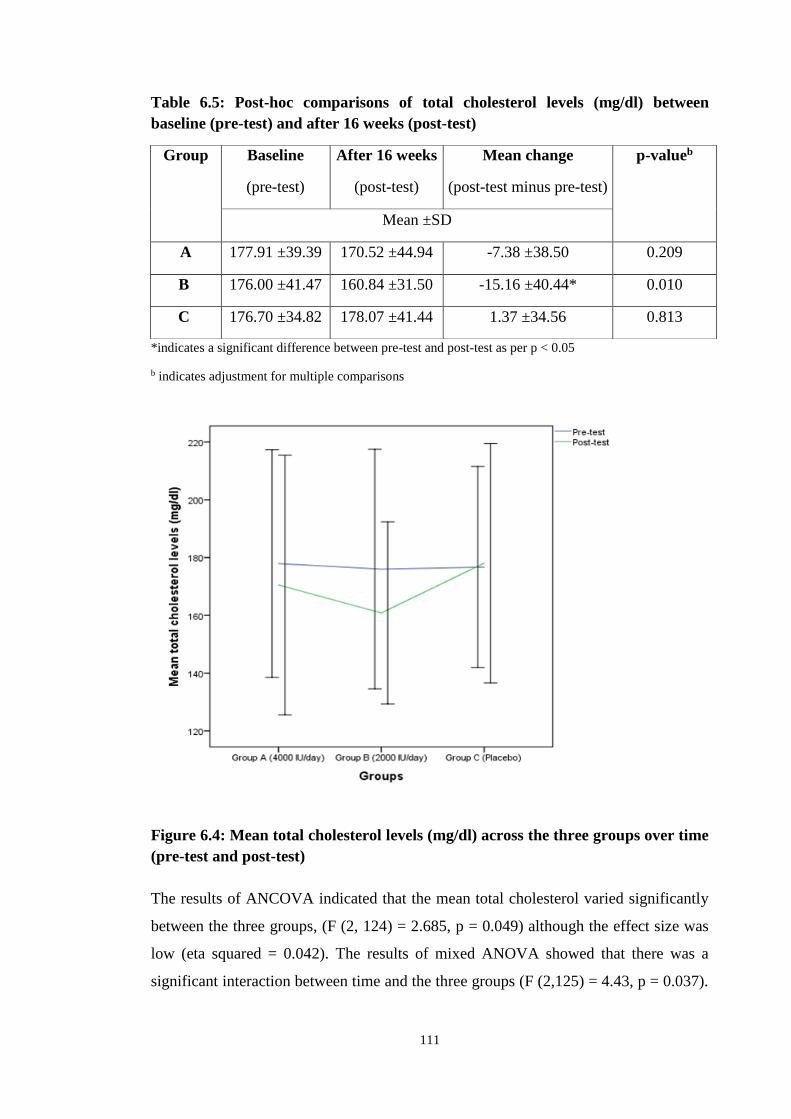
111
Table 6.5: Post-hoc comparisons of total cholesterol levels (mg/dl) between
baseline (pre-test) and after 16 weeks (post-test)
*indicates a significant difference between pre-test and post-test as per p < 0.05
b indicates adjustment for multiple comparisons
Figure 6.4: Mean total cholesterol levels (mg/dl) across the three groups over time
(pre-test and post-test)
The results of ANCOVA indicated that the mean total cholesterol varied significantly
between the three groups, (F (2, 124) = 2.685, p = 0.049) although the effect size was
low (eta squared = 0.042). The results of mixed ANOVA showed that there was a
significant interaction between time and the three groups (F (2,125) = 4.43, p = 0.037).
Group Baseline
(pre-test)
After 16 weeks
(post-test)
Mean change
(post-test minus pre-test)
p-valueb
Mean ±SD
A 177.91 ±39.39 170.52 ±44.94 -7.38 ±38.50 0.209
B 176.00 ±41.47 160.84 ±31.50 -15.16 ±40.44* 0.010
C 176.70 ±34.82 178.07 ±41.44 1.37 ±34.56 0.813
112
The results of one-way ANOVA indicated that for pre and post test the mean total
cholesterol did not vary significantly between the three groups.
Using post-hoc test for pairwise comparison at post-test, there was a significant
difference in total cholesterol levels between groups B and C (mean change = -14.86, p
= 0.046), with group B having a lower mean total cholesterol than group C, see table
6.6. Comparing pre and post test using post-hoc test, the mean total cholesterol was
significantly lower (mean change = -15.16, p = 0.010) in group B, see Table 6.5.
Table 6.6: Post- hoc test comparisons of total cholesterol levels (mg/dl) between
the three groups for post-test
*indicates a significant difference between two groups as per p < 0.05
b indicates adjustment for multiple comparisons
6.4. Discussion
6.4.1 HDL cholesterol
This study found no significant relationship between vitamin D supplementation and
changes in serum HDL cholesterol concentrations. This supports the existing literature
base that vitamin D supplementation does not improve HDL cholesterol significantly
(Jorde and Figenschau 2009; Patel et al., 2010; Al-Daghri et al., 2012; Breslavsky et
al., 2013; Eftekhari et al., 2013; Talaei et al., 2013; Yiu et al., 2013; Al-Daghri et al.,
2014; Kampmann et al., 2014; Ryu et al., 2014; Al-Sofiani et al., 2015; Sadiya et al.,
2015). A 2015 randomised double blind control trial of 87 vitamin D-deficient obese,
type 2 diabetics supplemented with 6000 IU/day vitamin D for three months, and 3000
IU/day for a further three months showed no effect on serum HDL concentrations
(Sadiya et al., 2015). Similarly, a 2015 Saudi study of 20 diabetic subjects found no
significant change in HDL cholesterol concentration following supplementation of
5000 IU/day for three months (Al-Sofiani et al., 2015). Even when a larger sample size
and greater dose was used, such as in Talaei’s (2013) study of 100 type 2 diabetics
Time Group Group
Mean change
between two
groups
p-valueb
Post-test
A B 9.69 0.263
A C -7.54 0.382
B C -14.86* 0.046

113
supplemented with 50,000 IU/ week for two months, no significant improvements
were demonstrated in serum HDL cholesterol concentrations.
To the best of the researcher’s knowledge only two studies from the Middle East exist
that demonstrate a significant improvement in HDL cholesterol following vitamin D
supplementation (Yousefi Rad et al., 2014; Mohamad et al., 2015). Yousefi Rad
(2014) conducted a randomised control trial of 58 type 2 diabetics, the majority of
which were female, supplemented with 4000 IU/day for two months (Yousefi Rad et
al., 2014). Despite the small sample size and short duration of the study, a significant
improvement in HDL cholesterol was demonstrated following vitamin D
supplementation. The reasons behind this are unclear. Interestingly, a 2015 study of
100 type 2 diabetics given 4500 IU/ day of vitamin D for two months demonstrated
significantly higher HDL cholesterol levels in those subjects with double the sufficient
concentration of serum vitamin D (> 61 ng/ml) post supplementation (Mohamad et al.,
2015). This suggests further work on the dose response of vitamin D is warranted and
achieving serum vitamin D concentrations greater than 61 ng/ml may show significant
improvements in HDL cholesterol.
6.4.2 LDL cholesterol
This study demonstrates a significant decrease in LDL cholesterol in the vitamin D
supplemented groups. Interestingly, LDL cholesterol levels increased in the placebo
group after 16 weeks. These findings have been supported by similar Middle Eastern
studies by Al-Daghri et al., (2012), Eftekhari (2013), Bonakdaran and Afkhami Zadeh
(2011) and Mohamad (2015) who also demonstrated a significant improvement in
LDL cholesterol following vitamin D supplementation of varying doses and durations.
Despite the improvements in LDL cholesterol demonstrated by Eftekhari (2013) and
Bonakdaran and Afkhami Zadeh (2011), it is hard to draw definite conclusions from
these two studies. Both used lower doses (< 2000 IU/day) of vitamin D than the two
other studies as well as the present study and did not measure serum concentrations of
25(OH)D. Al-Daghri’s 2012 study of 92 Saudi type 2 diabetics supplemented with
2000 IU/day for 18 months demonstrated a significant decrease in LDL cholesterol,
more marked in females than males, when serum vitamin D concentrations also
increased significantly. Similarly, Mohamad (2015) demonstrated a significant
decrease in LDL cholesterol in subjects with greater than double the sufficient serum
level of vitamin D (> 61 ng/ml) when compared to those with lower serum levels post

114
supplementation. This suggests that higher serum 25(OH)D concentrations may be
required in order to achieve favourable effects on the lipid profile. This supports the
findings of the present study; 61.9 percent of participants in the 4000 IU/day group
achieved sufficient serum vitamin D concentrations post supplementation compared to
just 41.9 percent of participants in the 2000 IU/day group.
Conversely, the bulk of literature conducted from the rest of the world to date appears
to suggest vitamin D plays no significant role in improving LDL cholesterol (Patel et
al., 2010; Breslavsky et al., 2013; Talaei et al., 2013; Yiu et al., 2013; Kampmann et
al., 2014; Ryu et al., 2014; Yousefi Rad et al., 2014; Al-Sofiani et al., 2015; Sadiya et
al., 2015). This may be explained partly by the sample sizes of the studies, all of which
used a much smaller number of participants than the present study. To some extent,
short study duration may also explain the inconsistency in the findings; only three of
the cited trials had study durations equal to or greater than the present study
(Breslavsky et al., 2013; Ryu et al., 2014; Sadiya et al., 2015). The majority of the
studies that did not find any correlation between vitamin D supplementation and
improved LDL cholesterol levels did not achieve sufficient post-supplementation
serum vitamin D concentrations (> 30 ng/ml). Furthermore, only two studies (Talaei et
al., 2013; Yiu et al., 2013) achieved close to the 61 ng/ml demonstrated in Mohamad’s
(2015) study to be the optimal serum level for reduced LDL-cholesterol levels. The
reliability of Talaei’s (2013) study may be questionable given that it was only a single
blinded study. Similarly, Yiu et al., 2013 study was not conducted in the Middle East
and therefore the reproducibilty of the results in the Saudi population is dubious.
The evidence base suggests that significant improvements in LDL cholesterol levels
have been achieved in Middle Eastern countries where a dose of at least 2000 IU/day
vitamin D is used. Those studies that achieved serum concentrations of vitamin D
above 61 ng/ml appeared to produce the most significant decrease on LDL cholesterol.
6.4.3 Triglycerides
This study found no significant relationship between serum triglycerides and improved
vitamin D status. These findings are supported by the current body of literature which
suggests there is no relationship between vitamin D supplementation and triglyceride
levels (Jorde and Figenschau 2009; Talaei et al., 2013; Ryu et al., 2014; Yousefi Rad

115
et al., 2014; Al-Sofiani et al., 2015; Sadiya et al., 2015; (Bonakdaran and Afkhami
Zadeh 2011; (Patel et al., 2010).
To the best of the researcher’s knowledge, only three studies conducted to date, all of
which have been in the Middle East, have demonstrated a significant reduction in
triglyceride levels following supplementation with vitamin D (Alkharfy et al., 2013;
Eftekhari et al., 2013; Mohamad et al., 2015). Of note, is Alkharfy’s (2013) study of
499 Saudi participants supplemented with 2000 IU/day for 12 months. It is likely the
large sample size and long study duration contributed to the finding of a significant
relationship between vitamin D and improved triglyceride levels. In contrast to the
current findings, a 1998 case study of three vitamin D–deficient subjects with type 2
diabetes receiving a single intramuscular dose of 300,000 IU of vitamin D,
demonstrated a significant increase in serum triglycerides after three months. This
suggests that too high a dose of vitamin D supplementation may in fact have negative
effects on triglycerides (Taylor and Wise 1998). Once again, more research is
warranted to assess the most appropriate dose of vitamin D supplementation in
reducing triglyceride concentrations in 12 months.
6.4.4 Total cholesterol
This study demonstrates a significant decrease in total cholesterol in the vitamin D
supplemented groups. In contrast, the placebo had a significant increase in total
cholesterol after 16 weeks. To a certain extent, these findings can be explained by the
parallel decrease in LDL cholesterol as total cholesterol is a sum of serum LDL-,
HDL- cholesterol and triglyceride levels. These findings have echoed similar studies
conducted in the Middle East that demonstrated significant decreases in serum total
cholesterol following supplementation with vitamin D (Al-Daghri et al., 2012;
Alkharfy et al., 2013; Eftekhari et al., 2013). However, the effect of vitamin D on total
cholesterol in the current literature remains controversial and many studies have
demonstrated no relationship between the two variables (Jorde and Figenschau 2009;
Patel et al., 2010; Witham et al., 2010; Breslavsky et al., 2013; Talaei et al., 2013; Yiu
et al., 2013; Kampmann et al., 2014; Ryu et al., 2014; Yousefi Rad et al., 2014; Al-
Sofiani et al., 2015; Sadiya et al., 2015). This may be explained by ethnic background,
sample size and short study duration of less than three months. It has been suggested
that significant improvements in total cholesterol can be achieved in Middle Eastern

116
countries where studies include at least 70 participants and use a study duration of four
months of greater (Alkharfy et al., 2013).
6.4.5 Summary
In conclusion, this study demonstrates no significant relationship between vitamin D
supplementation of either 2000 IU/day or 4000 IU/day on serum HDL cholesterol and
triglyceride levels. A significant improvement in serum LDL cholesterol (p = 0.028)
and total cholesterol levels (p = 0.049) was demonstrated in both groups supplemented
with vitamin D. Further interventional studies are clearly required using higher doses
of vitamin D supplementation in order to achieve serum concentrations of greater than
61 ng/ml and to replicate these positive findings on the lipid profile of type 2 diabetics.
It is worth mentioning that the majority of the participants in the present study were
already taking statins (87.5%, n = 112) prior to enrolment and thus a large percentage
had a lipid profile within normal parameters at baseline. Statins have a considerable
anti-inflammatory effect (Pickup 2004), that may have masked the anti-inflammatory
effect of vitamin D. Alternatively, the extent of inflammation may already be so
established in type 2 diabetics that four months of vitamin D supplementation had no
effect. To the best of the researcher’s knowledge, no study to date has analysed the
effect of vitamin D supplementation on the lipid profile of type 2 diabetic patients who
are not already taking statins. This indicates there is scope for future work to assess the
effect of vitamin D in deficient, type 2 diabetics with uncontrolled lipid profile.

117
Chapter 7. Vitamin D3 and Oxidative Stress

118
7.1 Introduction
Oxidative stress is considered to be a vital component in the pathogenesis and
development of diabetic vascular complications (Ceriello et al., 2002). Sustained
hyperglycaemia is associated with heightened production of reactive oxygen species
(ROS) as well as a reduction in the intrinsic antioxidant defence mechanisms,
rendering diabetic individuals more susceptible to oxidative damage (Tsai et al., 1994;
Kakkar et al., 1998). Type 2 diabetics have consistently been shown to have far lower
total antioxidant capacities (TAC) than their healthy counterparts (Illing et al., 1951;
Sundaram et al., 1996; Maxwell et al., 1997; Opara et al., 1999; Serafini and Del Rio
2004). This imbalance between oxidant and antioxidant levels leads to both functional
and morphological damage to blood vessels and results in the development of micro-
and macrovascular complications (Baynes 1991). Oxidative reactions also increase the
formation of advanced glycation endproducts (AGEs) and their accumulation in
cardiovascular tissues (Smith and Thornalley 1992).
Advanced glycation endproducts are a group of compounds formed non-enzymatically
by glycation and oxidation of proteins. In type 2 diabetics, the formation of AGEs is
increased as a result of hyperglycaemia and an abundance of free radicals (Singh et al.,
2001). The accumulation of AGEs in the skin has been shown to be a strong indicator
for the development of both micro- and macrovascular complications (Gerrits et al.,
2008a; Meerwaldt et al., 2008). AGEs bind to the RAGE receptor in endothelial cells,
resulting in further oxidative stress, superoxide radical generation and cell apoptosis
(Vincent et al., 2007).
Vitamin D has been shown to enhance antioxidant defences and reduce the damage
caused by both oxidative stress and AGEs, and may be of benefit in the treatment of
diabetic vascular complications (Codoner-Franch et al., 2012; Gradinaru et al., 2012;
Jain et al., 2013). Recent animal studies have shown vitamin D to upregulate the
activity of certain antioxidant enzymes, such as catalase, superoxide dismutase (SOD)
and glutathione peroxidase (GSH-px) in diabetic rats (Noyan et al., 2005).
Furthermore, vitamin D may improve vascular endothelium function through the
modulation of radical generation and RAGE expression, averting the overproduction of
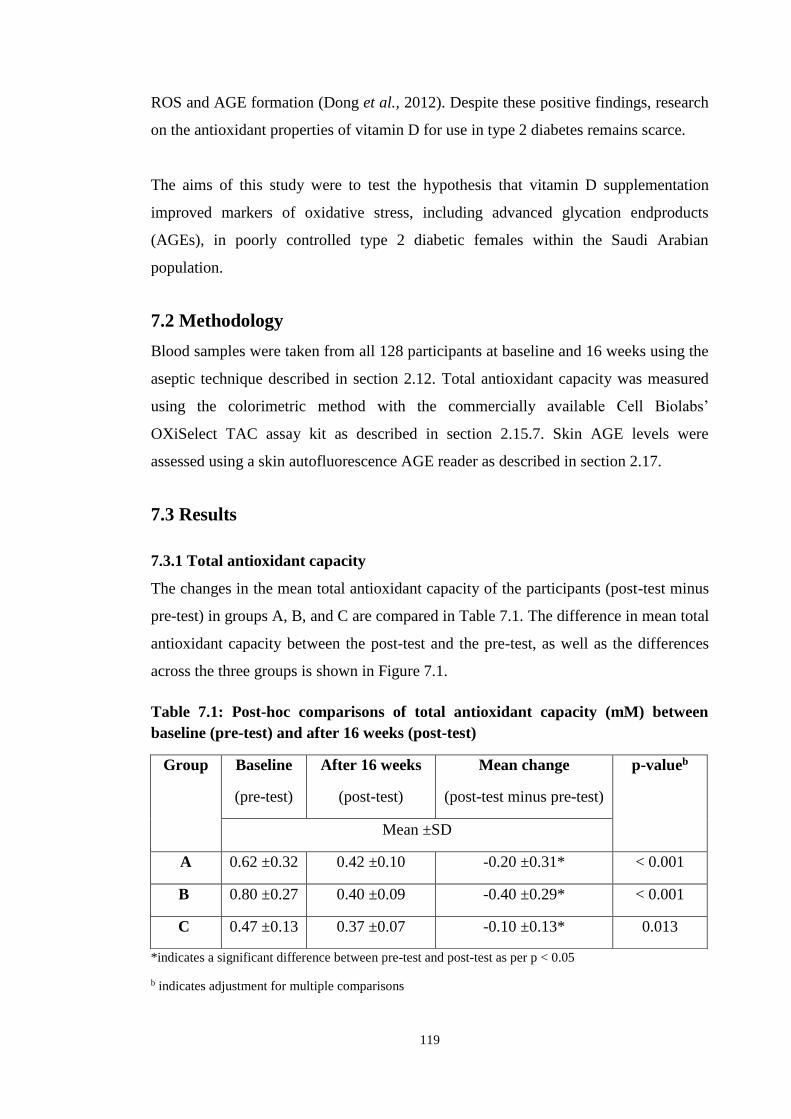
119
ROS and AGE formation (Dong et al., 2012). Despite these positive findings, research
on the antioxidant properties of vitamin D for use in type 2 diabetes remains scarce.
The aims of this study were to test the hypothesis that vitamin D supplementation
improved markers of oxidative stress, including advanced glycation endproducts
(AGEs), in poorly controlled type 2 diabetic females within the Saudi Arabian
population.
7.2 Methodology
Blood samples were taken from all 128 participants at baseline and 16 weeks using the
aseptic technique described in section 2.12. Total antioxidant capacity was measured
using the colorimetric method with the commercially available Cell Biolabs’
OXiSelect TAC assay kit as described in section 2.15.7. Skin AGE levels were
assessed using a skin autofluorescence AGE reader as described in section 2.17.
7.3 Results
7.3.1 Total antioxidant capacity
The changes in the mean total antioxidant capacity of the participants (post-test minus
pre-test) in groups A, B, and C are compared in Table 7.1. The difference in mean total
antioxidant capacity between the post-test and the pre-test, as well as the differences
across the three groups is shown in Figure 7.1.
Table 7.1: Post-hoc comparisons of total antioxidant capacity (mM) between
baseline (pre-test) and after 16 weeks (post-test)
*indicates a significant difference between pre-test and post-test as per p < 0.05
b indicates adjustment for multiple comparisons
Group Baseline
(pre-test)
After 16 weeks
(post-test)
Mean change
(post-test minus pre-test)
p-valueb
Mean ±SD
A 0.62 ±0.32 0.42 ±0.10 -0.20 ±0.31* < 0.001
B 0.80 ±0.27 0.40 ±0.09 -0.40 ±0.29* < 0.001
C 0.47 ±0.13 0.37 ±0.07 -0.10 ±0.13* 0.013
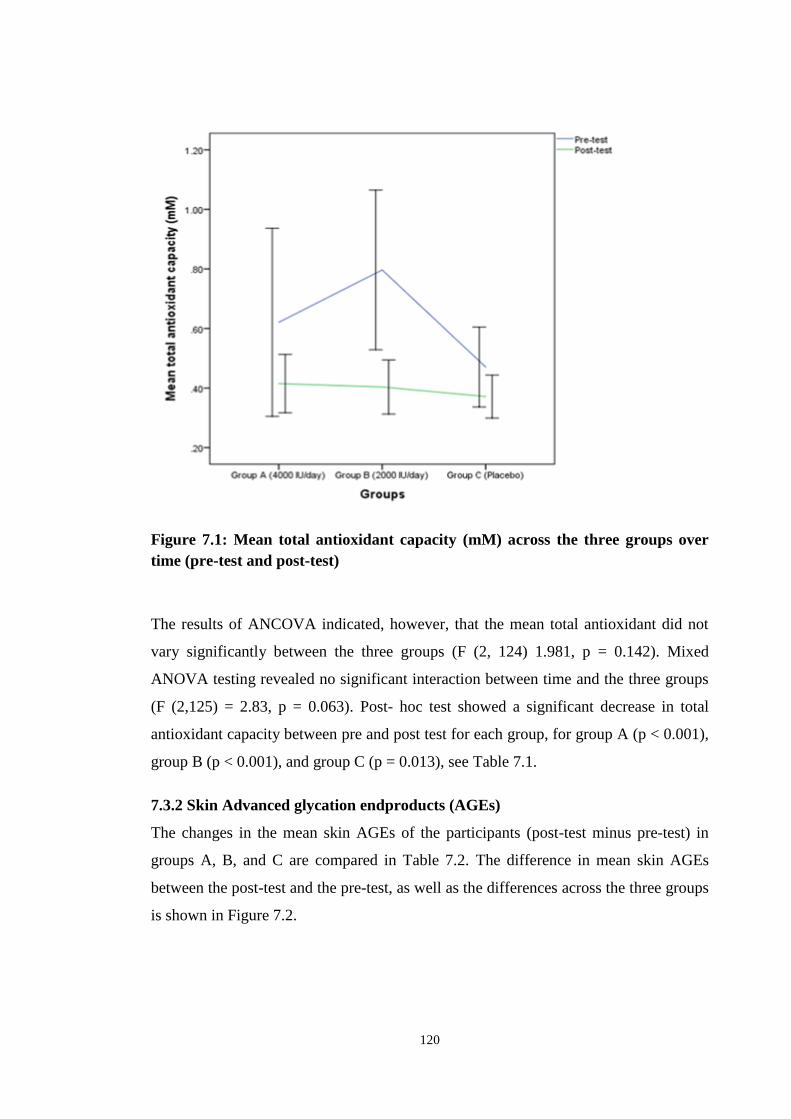
120
Figure 7.1: Mean total antioxidant capacity (mM) across the three groups over
time (pre-test and post-test)
The results of ANCOVA indicated, however, that the mean total antioxidant did not
vary significantly between the three groups (F (2, 124) 1.981, p = 0.142). Mixed
ANOVA testing revealed no significant interaction between time and the three groups
(F (2,125) = 2.83, p = 0.063). Post- hoc test showed a significant decrease in total
antioxidant capacity between pre and post test for each group, for group A (p < 0.001),
group B (p < 0.001), and group C (p = 0.013), see Table 7.1.
7.3.2 Skin Advanced glycation endproducts (AGEs)
The changes in the mean skin AGEs of the participants (post-test minus pre-test) in
groups A, B, and C are compared in Table 7.2. The difference in mean skin AGEs
between the post-test and the pre-test, as well as the differences across the three groups
is shown in Figure 7.2.

121
Table 7.2: Post-hoc comparisons of skin AGEs (arbitrary units) between baseline
(pre-test) and after 16 weeks (post-test)
*indicates a significant difference between pre-test and post-test as per p < 0.05
b indicates adjustment for multiple comparisons
Figure 7.2: Mean skin AGEs (arbitrary units) across the three groups over time
(pre-test and post-test)
The results of ANCOVA indicated that the mean AGEs did not vary significantly
between the three groups (F (2, 124) = 1.478, p = 0.232). Mixed ANOVA testing
revealed no significant interaction between time and the three groups (F (2,125) =
Group Baseline
(pre-test)
After 16 weeks
(post-test)
Mean change
(post-test minus pre-test)
p-valueb
Mean ±SD
A 3.13 ±0.87 3.12 ±0.81 -0.01 ±0.59 0.971
B 2.98 ±0.65 2.86 ±0.57 -0.13 ±0.64 0.524
C 3.17 ±2.82 2.94 ±1.18 -0.23 ±2.05 0.234
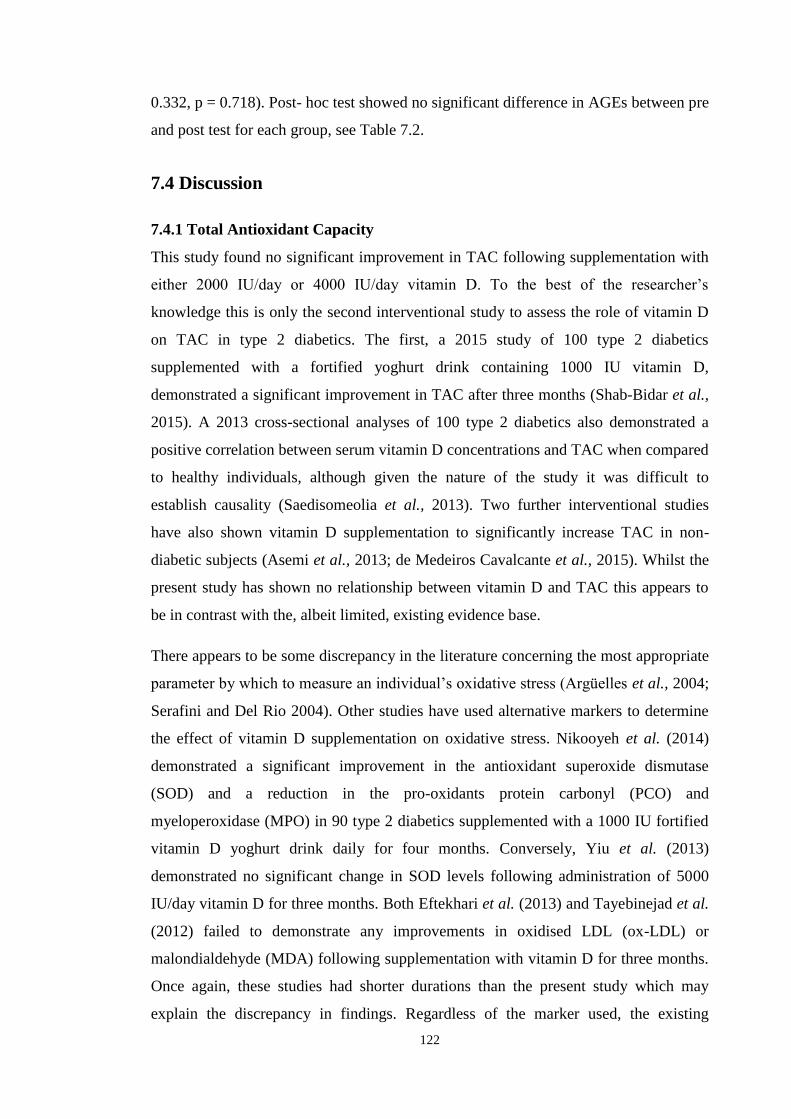
122
0.332, p = 0.718). Post- hoc test showed no significant difference in AGEs between pre
and post test for each group, see Table 7.2.
7.4 Discussion
7.4.1 Total Antioxidant Capacity
This study found no significant improvement in TAC following supplementation with
either 2000 IU/day or 4000 IU/day vitamin D. To the best of the researcher’s
knowledge this is only the second interventional study to assess the role of vitamin D
on TAC in type 2 diabetics. The first, a 2015 study of 100 type 2 diabetics
supplemented with a fortified yoghurt drink containing 1000 IU vitamin D,
demonstrated a significant improvement in TAC after three months (Shab-Bidar et al.,
2015). A 2013 cross-sectional analyses of 100 type 2 diabetics also demonstrated a
positive correlation between serum vitamin D concentrations and TAC when compared
to healthy individuals, although given the nature of the study it was difficult to
establish causality (Saedisomeolia et al., 2013). Two further interventional studies
have also shown vitamin D supplementation to significantly increase TAC in non-
diabetic subjects (Asemi et al., 2013; de Medeiros Cavalcante et al., 2015). Whilst the
present study has shown no relationship between vitamin D and TAC this appears to
be in contrast with the, albeit limited, existing evidence base.
There appears to be some discrepancy in the literature concerning the most appropriate
parameter by which to measure an individual’s oxidative stress (Argüelles et al., 2004;
Serafini and Del Rio 2004). Other studies have used alternative markers to determine
the effect of vitamin D supplementation on oxidative stress. Nikooyeh et al. (2014)
demonstrated a significant improvement in the antioxidant superoxide dismutase
(SOD) and a reduction in the pro-oxidants protein carbonyl (PCO) and
myeloperoxidase (MPO) in 90 type 2 diabetics supplemented with a 1000 IU fortified
vitamin D yoghurt drink daily for four months. Conversely, Yiu et al. (2013)
demonstrated no significant change in SOD levels following administration of 5000
IU/day vitamin D for three months. Both Eftekhari et al. (2013) and Tayebinejad et al.
(2012) failed to demonstrate any improvements in oxidised LDL (ox-LDL) or
malondialdehyde (MDA) following supplementation with vitamin D for three months.
Once again, these studies had shorter durations than the present study which may
explain the discrepancy in findings. Regardless of the marker used, the existing
123
literature base provides inconsistent evidence for the role of vitamin D in ameliorating
oxidative stress in diabetic individuals. It is suggested that intervention studies on a
larger scale are warranted. These should use greater doses of vitamin D
supplementation and have a study duration longer than the present study, using a
variety of different markers to measure oxidative stress.
7.4.2 Skin Advanced Glycation Endproducts
This study found no significant relationship between vitamin D supplementation and
reduced levels of advanced glycation end products. These findings are supported by a
2015 randomised control trial of 245 type 2 diabetics given 50,000 IU/month vitamin
D for six months (Krul-Poel et al., 2015). Whilst skin autofluorescence (as a measure
of AGE accumulation) was found to be significantly higher in those with a serum
25(OH)D concentration of less than 20 ng/ml, compared to patients with serum
concentrations above 30 ng/ml, there was no reduction in AGE levels after six months
of intervention. This is likely due to the fact that skin AGEs have a mean half life of 10
to 15 years (Gerrits et al., 2008b) and therefore the length of the intervention may be
too short to demonstrate any perceivable outcomes. Furthermore, using an AGE-reader
to measure the accumulated AGEs in the skin may not be sufficient to record all AGE
types, for example circulating AGEs and AGEs without fluorescent properties (Krul-
Poel et al., 2015). Similarly, a 2015 cross-sectional study of 233 type 2 diabetics,
concluded that vitamin D deficiency did not enhance the skin autofluorescence or
plasma AGE levels (Sebekova et al., 2015).
In contrast, studies performed on diabetic rats have shown vitamin D supplementation
to reduce AGE deposition within the vasculature and to downregulate the effects of the
RAGE receptor (Salum et al., 2013; Lee et al., 2014). AGEs have been shown to bind
to the RAGE receptor in endothelial cells, resulting in further oxidative stress,
superoxide radical generation and cell inflammation (Vincent et al., 2007). Two recent
in vitro studies demonstrated a reduction in endothelial inflammation following
supplementation with vitamin D. It has been suggested that vitamin D may act as a
vascular protective agent, offsetting the harmful effects of AGEs on endothelial cells
(Talmor et al., 2008; Salum et al., 2013; Krul-Poel et al., 2015). Similar findings have
also been demonstrated in human studies. Two recent randomised control trials of 60
and 90 type 2 diabetics respectively found significant decreases in serum AGEs

124
following supplementation with two 500 IU fortified yoghurt drinks a day
(Tayebinejad et al., 2012; Nikooyeh et al., 2014). It is worth noting that this
improvement was in serum AGEs, corresponding with our observations in Chapter 5.
Whilst this study has demonstrated no relationship between vitamin D and skin AGE
accumulation, the positive findings from both in vitro and in vivo studies suggests
further work within this field is warranted with longer study durations for both serum
and skin AGE concentrations.
7.4.3 Summary
In conclusion, this study has demonstrated no significant relationship between markers
of oxidative stress and vitamin D in type 2 diabetic Saudi females. Current evidence,
whilst limited, is inconsistent and more research within this field is required to assess
the role for vitamin D, if any, in ameliorating oxidative stress. These studies should
use longer durations and supplement doses, as well as assessing AGE response in both
skin and serum.

125
Chapter 8. Discussion

126
8.1 General Discussion
Diabetes Mellitus represents a condition that is characterised by chronic
hyperglycaemia, resulting from deficits in insulin secretion and sensitivity (WHO
2016). Saudi Arabia has amongst the highest incidence of type 2 diabetes in the world,
with nearly 20 percent of adults suffering from the condition (International Diabetes
Federation 2012). Mortality rates amongst diabetics are nearly twice that of healthy
individuals and are largely due to microvascular and macrovascular complications that
arise from the disease (Roglic et al., 2005).
Biological processes within the body produce reactive oxygen species (ROS) that harm
tissues and cells (Skrha 2003). In healthy individuals this process is limited by
exogenous and endogenous antioxidant defences (Betteridge 2000). In type 2 diabetes
high concentrations of intracellular glucose increase the production of ROS (Lorenzi
2007). This is compounded by significantly reduced antioxidant levels and accelerated
formation of advanced glycation endproducts (AGEs). This imbalance between
oxidant and antioxidant defences results in functional and morphological damage to
the vasculature and the initiation of diabetic angiopathy (Baynes 1991). AGEs are a
group of compounds formed non-enzymatically via the glycation and oxidation of
proteins. Their formation is accelerated in type 2 diabetics as a result of
hyperglycaemia and an increased number of free radicals (Singh et al., 2001). The
accumulation of AGEs in the skin has been shown to cause the development of
diabetic vascular complications (Gerrits et al., 2008a; Meerwaldt et al., 2008).
Vitamin D has been shown to enhance antioxidant defences and limit the harm caused
by both oxidative stress and AGEs and therefore may be of benefit in the treatment of
diabetic complications (Codoner-Franch et al., 2012; Gradinaru et al., 2012; Jain et al.,
2013). The prevalence of vitamin D deficiency in type 2 diabetics has repeatedly been
shown to be nearly twice that of non-diabetic individuals; within the Saudi Arabian
population it is estimated that somewhere between 30 and 85% of females are vitamin
D deficient (Scragg et al., 1995; Isaia et al., 2001; Scragg et al., 2004; Al-Zahrani
2013). Despite a number of recent interventional studies on vitamin D and diabetes in
Saudi Arabia, none to date have considered the effect of vitamin D supplementation on
markers of oxidative stress. Whilst being the first study of this kind, unfortunately the
present study has demonstrated no significant effect on total antioxidant capacity or
127
skin autofluroscence (AGEs) in the type 2 diabetic Saudi population. There have been
few previous studies on vitamin D, diabetes and oxidative stress in any population and
all have provided conflicting results. This study concludes that vitamin D has limited,
if any effect, antioxidant properties.
Administration of vitamin D supplementation has differed between studies, with daily
doses proving to be more effective in raising serum concentrations than weekly or
monthly doses (Von Hurst et al., 2010). This is likely to be due to more consistent
absorption in the gut (Chel et al., 2008). Recent meta-analysis of 51 randomised
control trials using doses of vitamin equivalent to 1000 IU per day has failed to
demonstrate any beneficial effects of vitamin D on diabetic outcomes (Elamin et al.,
2011). However, for studies using higher doses of vitamin D the results have proved
more inconclusive.
In the present study, the therapeutic effect of daily oral supplementation of vitamin D
in 128 female patients with type 2 diabetes mellitus and hypovitaminosis D was
investigated. The results demonstrate that daily oral supplementation with doses of
2000 IU and 4000 IU was both safe and effective in significantly (p < 0.001)
improving vitamin D status in patients with type 2 diabetes. The majority of Saudi
studies have used a supplement dose of 2000 IU for varying durations, yet this is the
first to consider the effect of a higher dose of 4000 IU on diabetic parameters. Serum
vitamin D concentrations increased by 212% in the 4000 IU group and 131% in the
2000 IU group (compared to a 5% decrease in the placebo group). However, only 61.9
% of the 4000 IU group and 41.9 % of the 2000 IU group had achieved sufficient (>30
ng/ml) vitamin D concentrations post supplementation. No patients developed either
clinically or biochemically significant hypercalcaemia.
These findings confirm that greater doses of vitamin D supplementation are likely to
be required in order to achieve sufficient serum concentrations amongst female type 2
diabetics. This may in part be due to the baseline BMIs of participants; one of the
inclusion criteria was for subjects to have a BMI greater than 25. Wortsman et al.
(2003) reported that obese patients were able to raise their serum vitamin D
concentrations by no more than 50 percent when compared to their non-obese
counterparts and hence this may be accountable for the suboptimal increase in many of
the participants. However, this study demonstrated no relationship between BMI and
128
vitamin D. Other similar studies have demonstrated that using 6000 IU vitamin D per
day for three months was effective in safely increasing serum concentrations from
deficient to sufficient (Sadiya et al., 2015; Al-Zahrani et al., 2014). However, it was
noted that this dose may still be inadequate to achieve optimum vitamin D function.
Whilst the effects of vitamin D on oxidative stress have been somewhat disappointing,
the present study has demonstrated significant improvements (p = 0.001) in the
glycaemic profile of participants. After 16 weeks, subjects who had taken vitamin D
supplements had a significantly lower HbA1c level than at baseline. HbA1c is a
marker of average serum glucose concentrations over the previous three months and
therefore is indicative of glucose homeostasis (Woerle et al., 2004). The UK
Prospective Diabetes Study (UKPDS) demonstrated a one percent reduction in HbA1c
to be associated with a 21 percent decrease in diabetic complications and a further 37
percent reduction in microvascular disease (Stratton et al., 2000). The findings of this
study suggest that vitamin D supplementation may therefore produce a significant
reduction in diabetes-related morbidity and mortality, and may be used as an adjuvant
to regular anti-hyperglycaemic agents.
It has been further suggested that improvements in HbA1c are more likely to be seen in
vitamin D-deficient female type 2 diabetics than in their insufficient and sufficient
counterparts. Sabherwal’s 2010 study demonstrated a 0.70% improvement in HbA1c
levels amongst vitamin D-deficient type 2 diabetics compared to a 0.21% improvement
in those who were vitamin D insufficient (Sabherwal et al., 2010). Similarly, Jorde and
Figenschau (2009) and Krul-Poel et al. (2015) found that vitamin D replacement
therapy had no effect on HbA1c in type 2 diabetics with sufficient serum vitamin D
concentrations. Due to the similar numbers of deficient and insufficient subjects across
all of the intervention groups, it is impossible to either prove or disprove this theory in
the present study. It was found that giving a higher dose of 4000 IU vitamin D per day
improved HbA1c levels more than a dose of 2000 IU per day. Of the 37 female
subjects found to be vitamin D deficient at baseline who received the higher dose, 80%
of them elevated their vitamin D status after 16 weeks. This was in comparison to 76%
of those in the lower supplementation group and therefore suggests a higher dose may
not be that beneficial.
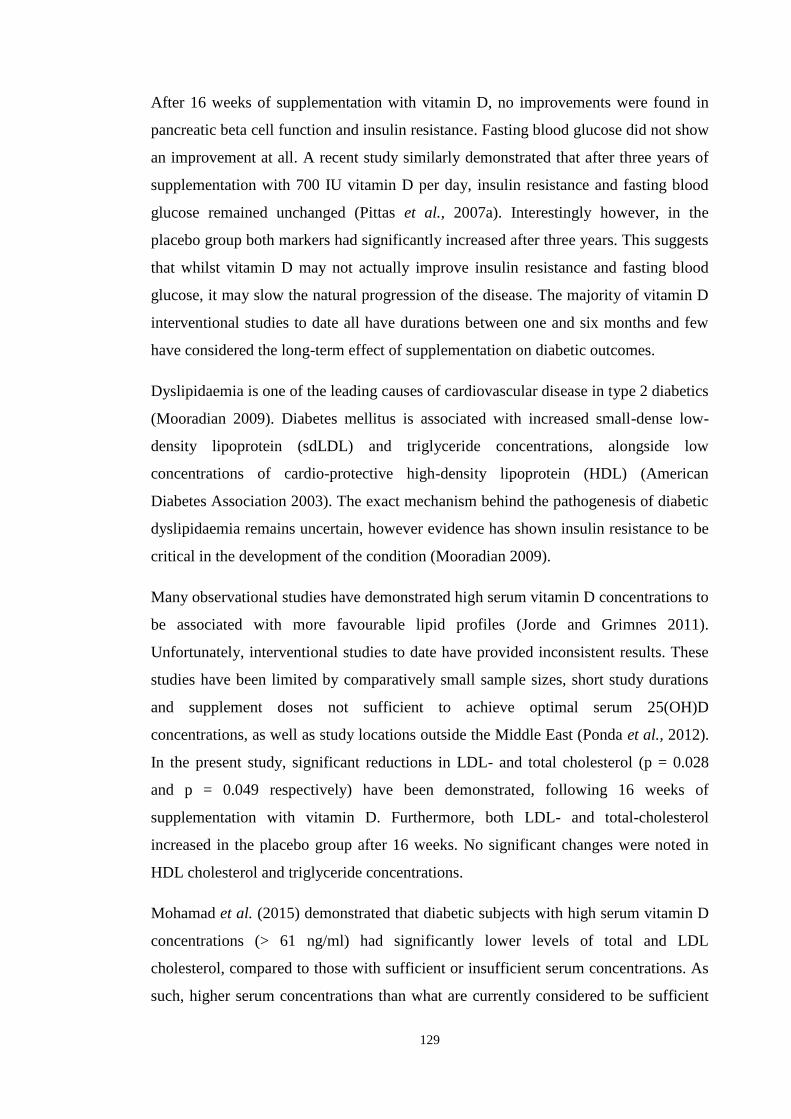
129
After 16 weeks of supplementation with vitamin D, no improvements were found in
pancreatic beta cell function and insulin resistance. Fasting blood glucose did not show
an improvement at all. A recent study similarly demonstrated that after three years of
supplementation with 700 IU vitamin D per day, insulin resistance and fasting blood
glucose remained unchanged (Pittas et al., 2007a). Interestingly however, in the
placebo group both markers had significantly increased after three years. This suggests
that whilst vitamin D may not actually improve insulin resistance and fasting blood
glucose, it may slow the natural progression of the disease. The majority of vitamin D
interventional studies to date all have durations between one and six months and few
have considered the long-term effect of supplementation on diabetic outcomes.
Dyslipidaemia is one of the leading causes of cardiovascular disease in type 2 diabetics
(Mooradian 2009). Diabetes mellitus is associated with increased small-dense low-
density lipoprotein (sdLDL) and triglyceride concentrations, alongside low
concentrations of cardio-protective high-density lipoprotein (HDL) (American
Diabetes Association 2003). The exact mechanism behind the pathogenesis of diabetic
dyslipidaemia remains uncertain, however evidence has shown insulin resistance to be
critical in the development of the condition (Mooradian 2009).
Many observational studies have demonstrated high serum vitamin D concentrations to
be associated with more favourable lipid profiles (Jorde and Grimnes 2011).
Unfortunately, interventional studies to date have provided inconsistent results. These
studies have been limited by comparatively small sample sizes, short study durations
and supplement doses not sufficient to achieve optimal serum 25(OH)D
concentrations, as well as study locations outside the Middle East (Ponda et al., 2012).
In the present study, significant reductions in LDL- and total cholesterol (p = 0.028
and p = 0.049 respectively) have been demonstrated, following 16 weeks of
supplementation with vitamin D. Furthermore, both LDL- and total-cholesterol
increased in the placebo group after 16 weeks. No significant changes were noted in
HDL cholesterol and triglyceride concentrations.
Mohamad et al. (2015) demonstrated that diabetic subjects with high serum vitamin D
concentrations (> 61 ng/ml) had significantly lower levels of total and LDL
cholesterol, compared to those with sufficient or insufficient serum concentrations. As
such, higher serum concentrations than what are currently considered to be sufficient
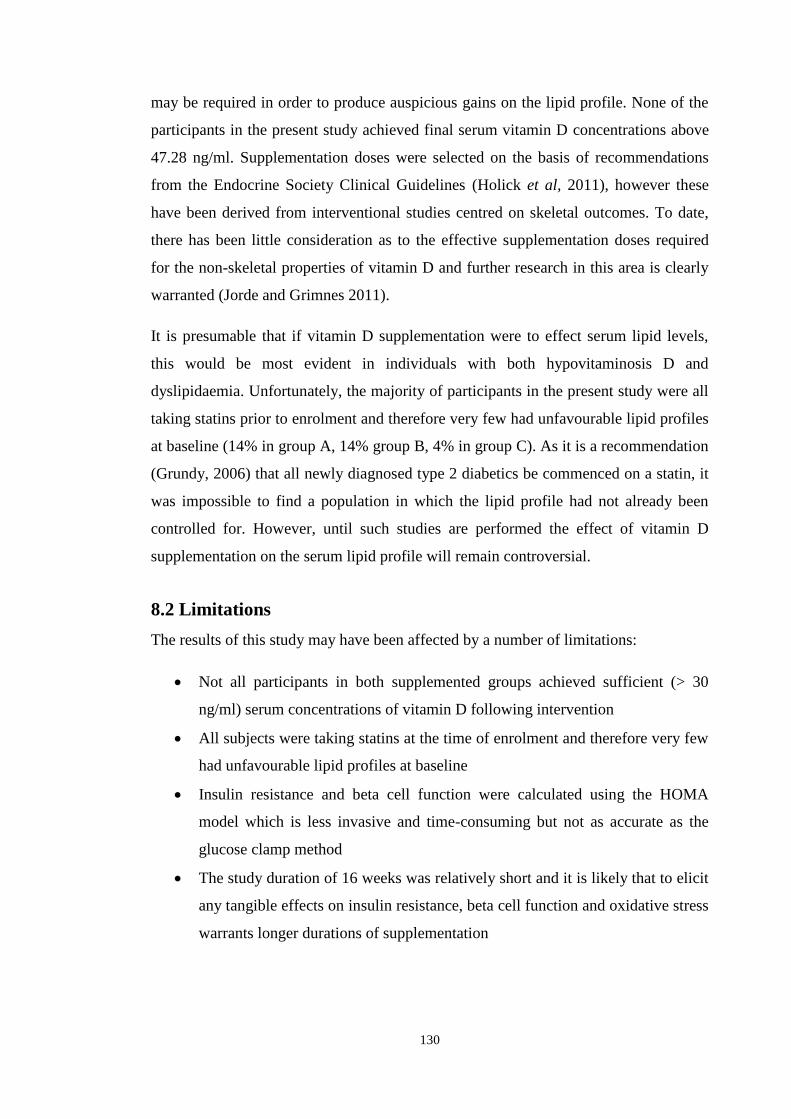
130
may be required in order to produce auspicious gains on the lipid profile. None of the
participants in the present study achieved final serum vitamin D concentrations above
47.28 ng/ml. Supplementation doses were selected on the basis of recommendations
from the Endocrine Society Clinical Guidelines (Holick et al, 2011), however these
have been derived from interventional studies centred on skeletal outcomes. To date,
there has been little consideration as to the effective supplementation doses required
for the non-skeletal properties of vitamin D and further research in this area is clearly
warranted (Jorde and Grimnes 2011).
It is presumable that if vitamin D supplementation were to effect serum lipid levels,
this would be most evident in individuals with both hypovitaminosis D and
dyslipidaemia. Unfortunately, the majority of participants in the present study were all
taking statins prior to enrolment and therefore very few had unfavourable lipid profiles
at baseline (14% in group A, 14% group B, 4% in group C). As it is a recommendation
(Grundy, 2006) that all newly diagnosed type 2 diabetics be commenced on a statin, it
was impossible to find a population in which the lipid profile had not already been
controlled for. However, until such studies are performed the effect of vitamin D
supplementation on the serum lipid profile will remain controversial.
8.2 Limitations
The results of this study may have been affected by a number of limitations:
• Not all participants in both supplemented groups achieved sufficient (> 30
ng/ml) serum concentrations of vitamin D following intervention
• All subjects were taking statins at the time of enrolment and therefore very few
had unfavourable lipid profiles at baseline
• Insulin resistance and beta cell function were calculated using the HOMA
model which is less invasive and time-consuming but not as accurate as the
glucose clamp method
• The study duration of 16 weeks was relatively short and it is likely that to elicit
any tangible effects on insulin resistance, beta cell function and oxidative stress
warrants longer durations of supplementation
131
8.3 Scope for future work
To date, recommendations for vitamin D supplementation doses have been based
solely on its calcaemic properties. Further research is currently warranted into the dose
of vitamin D that is not only adequate for bone health but for its potential non-
calcaemic actions. It is recommended that these studies use doses starting at 6000 IU
per day aiming to achieve serum concentrations of greater than 60 ng/ml. Longer study
durations of 18 months or greater are warranted to assess the long-term effect of
vitamin D supplementation on insulin resistance, beta cell function and using different
markers to measure oxidative stress. Furthermore, further work is warranted to assess
the different accumulation of AGEs in serum and skin for longer study durations as
well to demonstrate which marker is the most effective measurement of oxidative
stress. This study has highlighted the need for further investigation in newly diagnosed
female type 2 diabetics who have not yet been commenced on statins in order to
accurately assess the effect of vitamin D on the lipid profile.
8.4 Overall conclusion
In conclusion, the results from the present study indicate that HbA1c levels
significantly decreased following 16 weeks of supplementation with vitamin D. These
findings were most evident at the greater dose of 4000 IU day (p < 0.001), however
this was still not adequate to achieve sufficient serum vitamin D concentrations in all
participants. Similar improvements were noted in LDL- and total cholesterol. No
significant improvements in oxidative stress were demonstrated. This study adds to a
growing body of evidence that vitamin D supplementation may be beneficial not only
in bone-related conditions, but as an adjuvant therapy in female type 2 diabetes
management in the Middle Eastern diabetic population.
132
References
Abdalla AM, Al-Kaabba AF, Saeed AA, Abdulrahman BM, Raat H (2007) Gender
differences in smoking behavior among adolescents in Saudi Arabia. Saudi Medical
Journal 28: 1102-1108.
Abdel-Wareth L, Haq A, Turner A, Khan S, Salem A, Mustafa F, Hussein N,
Pallinalakam F, Grundy L, Patras G, Rajah J (2013) Total vitamin D assay comparison
of the Roche Diagnostics "Vitamin D total" electrochemiluminescence protein binding
assay with the Chromsystems HPLC method in a population with both D2 and D3
forms of vitamin D. Nutrients 5: 971-980.
Adiels M, Westerbacka J, Soro-Paavonen A, Haekkinen AM, Vehkavaara S, Caslake
MJ, Packard C, Olofsson SO, Yki-Jaervinen H, Taskinen MR, Boren J (2007) Acute
suppression of VLDL1 secretion rate by insulin is associated with hepatic fat content
and insulin resistance. Diabetologia 50: 2356-2365.
Agardh E, Allebeck P, Hallqvist J, Moradi T, Sidorchuk A (2011) Type 2 diabetes
incidence and socio-economic position: a systematic review and meta-analysis.
International Journal of Epidemiology 40: 804-818.
Ahmed N (2005) Advanced glycation endproducts--role in pathology of diabetic
complications. Diabetes Research and Clinical Practice 67: 3-21
Aiello LP, Gardner TW, King GL, Blankenship G, Cavallerano JD, Ferris FL, 3rd,
Klein R (1998) Diabetic retinopathy. Diabetes Care 21: 143-156.
Ainsworth BE, Haskell WL, Leon AS, Jacobs DR, Jr., Montoye HJ, Sallis JF,
Paffenbarger RS, Jr. (1993) Compendium of physical activities: classification of
energy costs of human physical activities. Medicine and Science in Sports and
Exercise 25: 71-80.
Albert PS (1999) Longitudinal data analysis (repeated measures) in clinical trials.
Statistics in Medicine 18: 1707-1732.
Alberti KG, Zimmet PZ (1998) Definition, diagnosis and classification of diabetes
mellitus and its complications. Part 1: diagnosis and classification of diabetes mellitus
provisional report of a WHO consultation. Diabetic Medicine 15: 539-553.
133
AlBuhairan FS, Tamim H, Al Dubayee M, AlDhukair S, Al Shehri S, Tamimi W, El
Bcheraoui C, Magzoub ME, de Vries N, Al Alwan I (2015) Time for an Adolescent
Health Surveillance System in Saudi Arabia: Findings From "Jeeluna". Journal of
Adolescent Health. 57: 263-9.
Al-Daghri NM, Al-Attas OS, Alokail MS, Alkharfy KM, Sabico SLB, Chrousos GP
(2010) Decreasing Prevalence of the Full Metabolic Syndrome but a Persistently High
Prevalence of Dyslipidemia among Adult Arabs. Plos One 5: e12159.
Al-Daghri NM, Alfawaz H, Aljohani NJ, Al-Saleh Y, Wani K, Alnaami AM, Alharbi
M, Kumar S (2014) A 6-month "self-monitoring" lifestyle modification with increased
sunlight exposure modestly improves vitamin D status, lipid profile and glycemic
status in overweight and obese Saudi adults with varying glycemic levels. Lipids in
Health and Disease 13:87.
Al-Daghri NM, Alkharfy KM, Al-Othman A, El-Kholie E, Moharram O, Alokail MS,
Al-Saleh Y, Sabico S, Kumar S, Chrousos GP (2012) Vitamin D supplementation as
an adjuvant therapy for patients with T2DM: an 18-month prospective interventional
study. Cardiovascular Diabetology 11: 85.
Alkharfy K, Al-Daghri N, Sabico S, Al-Othman A, Moharram O, Alokail M, Al-Saleh
Y, Kumar S, Chrousos G (2013) Vitamin D supplementation in patients with diabetes
mellitus type 2 on different therapeutic regimens: a one-year prospective study.
Cardiovascular Diabetology 12: 113.
Al-Mesallamy HO, Hammad LN, El-Mamoun TA, Khalil BM (2011) Role of
advanced glycation end product receptors in the pathogenesis of diabetic retinopathy.
Journal of Diabetes and its Complications 25: 168-174.
Al-Nozha M, Al-Kanhal A, Al-Othaimeen A, Al-Mohaeza A, Osman A, Al-Shammery
A, EL-Shabrawy M (1991) Final Report of evaluation of the nutritional status of the
people of Saudi Arabia. Riyadh.
Al-Nozha MM, Al-Mazrou YY, Al-Maatouq MA, Arafah MR, Khalil MZ, Khan NB,
Al-Marzouki K, Abdullah MA, Al-Khadra AH, Al-Harthi SS, Al-Shahid MS, Al-
Mobeireek A, Nouh MS (2005) Obesity in Saudi Arabia. Saudi Medical Journal 26:
824-829.

134
Al-Othaimeen AI, Al-Nozha M, Osman AK (2007) Obesity: an emerging problem in
Saudi Arabia. Analysis of data from the National Nutrition Survey. Eastern
Mediterranean Health Journal 13: 441-448.
Al-Quwaidhi AJ, Pearce MS, Sobngwi E, Critchley JA, O'Flaherty M (2014)
Comparison of type 2 diabetes prevalence estimates in Saudi Arabia from a validated
Markov model against the International Diabetes Federation and other modelling
studies. Diabetes Research and Clinical Practice 103: 496–503.
Al-Shahwan MA, Al-Othman AM, Al-Daghri NM, Sabico SB (2015) Effects of 12-
month, 2000 IU/day vitamin D supplementation on treatment naive and vitamin D
deficient Saudi type 2 diabetic patients. Saudi Medical Journal 36: 1432-1438.
Al-Sofiani ME, Jammah A, Racz M, Khawaja RA, Hasanato R, El-Fawal HAN,
Mousa SA, Mason DL (2015) Effect of Vitamin D Supplementation on Glucose
Control and Inflammatory Response in Type II Diabetes: A Double Blind,
Randomized Clinical Trial. International Journal of Endocrinology and Metabolism
13: e22604.
Al-Turki HA, Sadat-Ali M, Al-Elq AH, Al-Mulhim FA, Al-Ali AK (2008) 25-
Hydoxyvitamin D levels among healthy Saudi Arabian women. Saudi Medical Journal
29: 1765-1768.
Alvarez JA, Ashraf A (2010) Role of vitamin d in insulin secretion and insulin
sensitivity for glucose homeostasis. International Journal of Endocrinology 2010:
351385.
Al-Zahrani M (2013) The Prevalence of Vitamin D Deficiency in Type 2 Diabetic
Patients. Journal of Medical Science & Research 3: 32-34.
Al-Zahrani MK, Elnasieh AM, Alenezi FM, Almoushawah AA, Almansour M,
Alshahrani F, Rahman SU, Al-Zahrani A (2014) A 3-month oral vitamin D
supplementation marginally improves diastolic blood pressure in Saudi patients with
type 2 diabetes mellitus. International Journal of Clinical and Experimental Medicine
7: 5421-5428.
American Diabetes Association (2003) Management of Dyslipidemia in Adults With
Diabetes. Diabetes Care 26: S83–S86.

135
American Diabetes Association (2010) Diagnosis and classification of diabetes
mellitus. Diabetes Care 1: S62-69
American Diabetes Association (2012) Standards of Medical Care in Diabetesd 2012.
Diabetes Care 35: S11.
Amore A, Cirina P, Mitola S, Peruzzi L, Gianoglio B, Rabbone I, Sacchetti C, Cerutti
F, Grillo C, Coppo R (1997) Nonenzymatically glycated albumin (Amadori adducts)
enhances nitric oxide synthase activity and gene expression in endothelial cells. Kidney
International 51: 27-35.
Andress DL (2005) Vitamin D treatment in chronic kidney disease. Seminars in
Dialysis 18: 315-321.
Antibodies online. (2013) Total Antioxidant Capacity (T-AOC).
Antonelli-Orlidge A, Saunders KB, Smith SR, D’Amore (1989) An activated form of
transforming growth factor beta is produced by cocultures of endothelial cells and
pericytes. Proceedings of the National Academy of Sciences of the USA 86: 4544 –
4548.
Ardawi MS, Qari MH, Rouzi AA, Maimani AA, Raddadi RM (2011) Vitamin D status
in relation to obesity, bone mineral density, bone turnover markers and vitamin D
receptor genotypes in healthy Saudi pre- and postmenopausal women. Osteoporosis
International 22: 463-475.
Argacha J-F, Egrise D, Pochet S, Fontaine D, Lefort A, Libert F, Goldman S, van de
Borne P, Berkenboom G, Moreno-Reyes R (2011) Vitamin D Deficiency-induced
Hypertension Is Associated With Vascular Oxidative Stress and Altered Heart Gene
Expression. Journal of Cardiovascular Pharmacology 58: 65-71.
Argüelles S, García S, Maldonado M, Machado A, Ayala A (2004) Do the serum
oxidative stress biomarkers provide a reasonable index of the general oxidative stress
status? Biochimica et Biophysica Acta 1674: 251-9.
Aruoma OI (1998) Free radicals, oxidative stress, and antioxidants in human health
and disease. Journal of the American Oil Chemists Society 75: 199-212.

136
Asemi Z, Samimi M, Tabassi Z, Shakeri H, Esmailzadeh A (2013) Vitamin D
Supplementation Affects Serum High-Sensitivity C-Reactive Protein, Insulin
Resistance, and Biomarkers of Oxidative Stress in Pregnant Women. Journal of
Nutrition 143: 1432-1438.
Bailar J, Mosteller F, Chalmers T, Smith H, Kuebler R (1992) The importance of beta,
the type II error, and sample size in the design and interpretation of the randomized
controlled trial: survey of two sets of “negative” trials. In: J.C. Bailar & F. Mosteller
F., Boston, MA: NEJM Books: Medical uses of statistics.
Balkau B, Shipley M, Jarrett RJ, Pyorala K, Pyorala M, Forhan A, Eschwege E (1998)
High blood glucose concentration is a risk factor for mortality in middle-aged
nondiabetic men. 20-year follow-up in the Whitehall Study, the Paris Prospective
Study, and the Helsinki Policemen Study. Diabetes Care 21: 360-367.
Bao B-Y, Ting H-J, Hsu J-W, Lee Y-F (2008) Protective role of 1 alpha, 25-
dihydroxyvitamin D(3) against oxidative stress in nonmalignant human prostate
epithelial cells. International Journal of Cancer 122: 2699-2706.
Barnett AH, Dixon AN, Bellary S, Hanif MW (2006) Type 2 diabetes and
cardiovascular risk in the UK south Asian community. Diabetologia 49: 2234-2246.
Barnett PA, Gonzalez RG, Chylack LT, Cheng HM (1986) The effect of oxidation on
sorbitol pathway kinetics. Diabetes 35: 426-432.
Barrett H, McElduff A (2010) Vitamin D and pregnancy: An old problem revisited.
Best practice & research. Clinical Endocrinology & Metabolism 24: 527-539.
Baynes JW (1991) Role of oxidative stress in development of complications in
diabetes. Diabetes 40: 405-412.
Beilfuss J, Berg V, Sneve M, Jorde R, Kamycheva E (2012) Effects of a 1-year
supplementation with cholecalciferol on interleukin-6, tumor necrosis factor-alpha and
insulin resistance in overweight and obese subjects. Cytokine 60: 870-874.
Beltramo E and Porta M (2013) Pericyte loss in diabetic retinopathy: mechanisms and
consequences. Current Medical Chemistry 20: 3218-25.
137
Berdie D, Anderson J, Niebuhr M (1986) Questionnaires: Design and use, Second
edn. London: The Scarecrow press.
Bergman RN (1989) Toward Physiological Understanding of Glucose Tolerance:
Minimal-Model Approach. Diabetes 38: 1512-1527.
Berkman LF, Macintyre S (1997) The measurement of social class in health studies:
old measures and new formulations. IARC Scientific Publications 138: 51-64.
Betteridge DJ (2000) What is oxidative stress? Metabolism 49: 3-8.
Bikle D (2014) Vitamin D Metabolism, Mechanism of Action, and Clinical
Applications. Chemistry and Biology 21: 319–329.
Bischoff-Ferrari HA, Giovannucci E, Willett WC, Dietrich T, Dawson-Hughes B
(2006) Estimation of optimal serum concentrations of 25-hydroxyvitamin D for
multiple health outcomes. American Journal of Clinical Nutrition 84: 18-28.
Bland R, Markovic D, Hills CE, Hughes SV, Chan SLF, Squires PE, Hewison M
(2004) Expression of 25-hydroxyvitamin D-3-1 alpha-hydroxylase in pancreatic islets.
Journal of Steroid Biochemistry and Molecular Biology 89-90: 121-125.
Boel E, Selmer J, Flodgaard HJ, Jensen T (1995) Diabetic late complications: will
aldose reductase inhibitors or inhibitors of advanced glycosylation endproduct
formation hold promise? Journal of Diabetes and its Complications 9: 104-129
Bonakdaran S, Afkhami Zadeh M (2011) Effect of calcitriol on glycemic and lipid
control in type 2 diabetes. Iranian Journal of Endocrinology and Metabolism 12: 513-
519.
Bonnefont-Rousselot D (2001) Antioxidant and anti-AGE therapeutics: evaluation and
perspectives. Journal de la Societe de Biologie 195: 391-398.
Boon N, Hul GBJ, Stegen JHCH, Sluijsmans WEM, Valle C, Langin D, Viguerie N,
Saris WHM (2007) An intervention study of the effects of calcium intake on faecal fat
excretion, energy metabolism and adipose tissue mRNA expression of lipid-
metabolism related proteins. International Journal of Obesity 31: 1704-1712.
138
Borissova AM, Tankova T, Kirilov G, Dakovska L, Kovacheva R (2003) The effect of
vitamin D3 on insulin secretion and peripheral insulin sensitivity in type 2 diabetic
patients. International Journal of Clinical Practice 57: 258-261.
Boucher BJ, Mannan N, Noonan K, Hales CN, Evans SJ (1995) Glucose intolerance
and impairment of insulin secretion in relation to vitamin D deficiency in east London
Asians. Diabetologia 38:1239–1245
Brancati FL, Kao WHL, Folsom AR, Watson RL, Szklo M (2000) Incident type 2
diabetes mellitus in African American and white adults - The atherosclerosis risk in
communities study. Journal of the American Medical Association 283: 2253-2259.
Breslavsky A, Frand J, Maras Z, Boaz M, Barnea Z, Shargorodsky M (2013) Effect of
high doses of vitamin D on arterial properties, adiponectin, leptin and glucose
homeostasis in type 2 diabetic patients. Clinical Nutrition 32: 970-975.
Bucala R, Makita Z, Vega G, Grundy S, Koschinsky T, Cerami A, Vlassara H (1994)
Modification of low density lipoprotein by advanced glycation end products
contributes to the dyslipidemia of diabetes and renal insufficiency. Proceedings of the
National Academy of Sciences of the United States of America 91: 9441-9445.
Bucala R, Tracey KJ, Cerami A (1991) Advanced glycosylation products quench nitric
oxide and mediate defective endothelium-dependent vasodilatation in experimental
diabetes. Journal of Clinical Investigation 87: 432-438.
Cade C, Norman AW (1986) Vitamin D3 improves impaired glucose tolerance and
insulin secretion in the vitamin D-deficient rat in vivo. Endocrinology 119: 84-90.
Candido R, Srivastava P, Cooper ME, Burrell LM (2003) Diabetes mellitus: a
cardiovascular disease. Current Opinion in Investigational Drugs (London, England :
2000) 4: 1088-1094.
CDC (2014) National Diabetes Statistics Report: Estimates of Diabetes and Its Burden
in the United States, 2014. Atlanta.
Ceriello A, Bortolotti N, Pirisi M, Crescentini A, Tonutti L, Motz E, Russo A,
Giacomello R, Stel G, Taboga C (1997) Total plasma antioxidant capacity predicts
thrombosis-prone status in NIDDM patients. Diabetes Care 20: 1589-1593.

139
Ceriello A, Taboga C, Tonutti L, Quagliaro L, Piconi L, Bais B, Da Ros R, Motz E
(2002) Evidence for an independent and cumulative effect of postprandial
hypertriglyceridemia and hyperglycemia on endothelial dysfunction and oxidative
stress generation - Effects of short- and long-term simvastatin treatment. Circulation
106: 1211-1218.
Cersosimo E, Solis-Herrera C, Trautmann ME, Malloy J, Triplitt CL (2014)
Assessment of Pancreatic beta-Cell Function: Review of Methods and Clinical
Applications. Current Diabetes Reviews 10: 2–42.
Chahil TJ, Ginsberg HN (2006) Diabetic dyslipidemia. Endocrinology and Metabolism
Clinics of North America 35: 491-510.
Chakravarthy U, Stitt AW, McNally J, Bailie JR, Hoey EM, Duprex P (1995) Nitric
oxide synthase activity and expression in retinal capillary endothelial cells and
pericytes. Current Eye Research 14: 285-294.
Chavakis T, Bierhaus A, Al-Fakhri N, Schneider D, Witte S, Linn T, Nagashima M,
Morser J, Arnold B, Preissner KT, Nawroth PP (2003) The pattern recognition
receptor (RAGE) is a counterreceptor for leukocyte integrins: a novel pathway for
inflammatory cell recruitment. The Journal of Experimental Medicine 198: 1507-1515.
Chel V, Wijnhoven H, Smit J, Ooms M, Lips P (2008) Efficacy of different doses and
time intervals of oral vitamin D supplementation with or without calcium in elderly
nursing home residents. Osteoporosis International 19: 663-71.
Chiang K-C, Yeh C-N, Chen TC (2011) Vitamin d and pancreatic cancer-an update.
Cancers 3: 213-226.
Cho HJ, Kang HC, Choi SA, Ju YC, Lee HS, Park HJ (2005) The possible role of
Ca2+ on the activation of microsomal triglyceride transfer protein in rat hepatocytes.
Biological & Pharmaceutical Bulletin 28: 1418-1423.
Cigolini M, Iagulli MP, Miconi V, Galiotto M, Lombardi S, Targher G (2006) Serum
25-hydroxyvitamin D3 concentrations and prevalence of cardiovascular disease among
type 2 diabetic patients. Diabetes Care 29: 722-724.
140
Codoner-Franch P, Tavarez-Alonso S, Simo-Jorda R, Laporta-Martin P, Carratala-
Calvo A, Alonso-Iglesias E (2012) Vitamin D status is linked to biomarkers of
oxidative stress, inflammation, and endothelial activation in obese children. Journal of
Pediatrics 161: 848-854.
Colagiuri S1, Cull CA, Holman RR; UKPDS Group (2002) Are lower fasting plasma
glucose levels at diagnosis of type 2 diabetes associated with improved outcomes?:
U.K. prospective diabetes study 61. Diabetes Care 25: 1410-7.
Colditz GA, Willett WC, Stampfer MJ, Manson JE, Hennekens CH, Arky RA, Speizer
FE (1990) Weight as a risk factor for clinical diabetes in women. American Journal of
Epidemiology 132: 501-513.
Coughlan MT, Cooper ME, Forbes JM (2005) Can advanced glycation end product
inhibitors modulate more than one pathway to enhance renoprotection in diabetes?
Annals of the New York Academy of Sciences 1043: 750-758.
Craven PA, Davidson CM, Derubertis FR (1990) Increase in diacylglycerol mass in
isolated glomeruli by glucose from de novo synthesis of glycerolipids. Diabetes 39:
667-674.
Cutfield WS, Jefferies CA, Jackson WE, Robinson EM, Hofman PL (2003) Evaluation
of HOMA and QUICKI as measures of insulin sensitivity in prepubertal children.
Pediatric Diabetes 4: 119-125.
Dalgard C, Petersen MS, Weihe P, Grandjean P (2011) Vitamin D Status in Relation to
Glucose Metabolism and Type 2 Diabetes in Septuagenarians. Diabetes Care 34:
1284-1288.
De Boer IH, Tinker LF, Connelly S, Curb JD, Howard BV, Kestenbaum B, Larson JC,
Manson JE, Margolis KL, Siscovick DS, Weiss NS (2008) Calcium plus vitamin D
supplementation and the risk of incident diabetes in the Women's Health Initiative.
Diabetes Care 31: 701-707.
de Medeiros Cavalcante IG, Silva AS, Carvalho Costa MJ, Persuhn DC, Issa CI, de
Luna Freire TL, Rodrigues Goncalves MdC (2015) Effect of vitamin D3
supplementation and influence of BsmI polymorphism of the VDR gene of the
inflammatory profile and oxidative stress in elderly women with vitamin D

141
insufficiency Vitamin D3 megadose reduces inflammatory markers. Experimental
Gerontology 66: 10-16.
DeFronzo RA (2009) From the Triumvirate to the Ominous Octet: A New Paradigm
for the Treatment of Type 2 Diabetes Mellitus. Diabetes 58: 773-795.
Del Pilar Solano M, Goldberg RB (2005) Management of diabetic dyslipidemia.
Endocrinology and Metabolism Clinics of North America 34: 1-25.
Desouza CJ, Meier AH (1987) Circadian and seasonal variations of plasma insulin and
cortisol concentrations in the Syrian hamster, Mesocricetus auratus. Chronobiology
International 4: 141-151.
Diagnoptics (2012) AGE Reader. Vol. 2013.
Dong J, Wong SL, Lau CW, Lee HK, Ng CF, Zhang L, Yao X, Chen ZY, Vanhoutte
PM, Huang Y (2012) Calcitriol protects renovascular function in hypertension by
down-regulating angiotensin II type 1 receptors and reducing oxidative stress.
European Heart Journal 33: 2980-2990.
Dong Y, Stallmann-Jorgensen IS, Pollock NK, Harris RA, Keeton D, Huang Y, Li K,
Bassali R, Guo DH, Thomas J, Pierce GL, White J, Holick MF, Zhu H (2010) A 16-
week randomized clinical trial of 2000 international units daily vitamin D3
supplementation in black youth: 25-hydroxyvitamin D, adiposity, and arterial stiffness.
Journal of Clinical Endocrinology and Metabolism 95: 4584-4591.
Donnelly R, Davis KR (2000) Type 2 diabetes and atherosclerosis. Diabetes Obesity &
Metabolism 2: S21-S30.
Draznin B, Lewis D, Houlder N, Sherman N, Adamo M, Garvey WT, Leroith D,
Sussman K (1989) Mechanism of Insulin Resistance Induced by Sustained Levels of
Cytosolic Free Calcium in Rat Adipocytes. Endocrinology 125: 2341-2349.
Draznin B, Sussman K, Kao M, Lewis D, Sherman N (1987) The existence of an
optimal range of cytosolic free calcium for insulin-stimulated glucose transport in rat
adipocytes. Journal of Biological Chemistry 262: 14385-14388.
Dworkin LD, Ichikawa I, Brenner BM (1983) Hormonal modulation of glomerular
function. American Journal of Physiology 244: F95-104.

142
Eftekhari MH, Akbarzadeh M, Dabbaghmanesh MH, Hassanzadeh J (2013) The effect
of calcitriol on lipid profile and oxidative stress in hyperlipidemic patients with type 2
diabetes mellitus. ARYA Atherosclerosis 10: 82-88.
Elamin M, Abu Elnour N, Elamin K, Fatourechi M, Alkatib A, Almandoz J, Liu H,
Lane M, Mullan R, Hazem A, Erwin P, Hensrud D, Murad M, Montori V (2011)
Vitamin D and cardiovascular outcomes: a systematic review and meta-analysis.
Journal of Clinical Endocrinology & Metabolism 96: 1931-42.
El-Bab MF, Shawky N, Al-Sisi A, Akhtar M (2012) Retinopathy and risk factors in
diabetic patients from Al-Madinah Al-Munawarah in the Kingdom of Saudi Arabia.
Clinical Ophthalmology 6: 269-276.
Eliasson B (2003) Cigarette smoking and diabetes. Progress in Cardiovascular
Diseases 45: 405-413.
Epstein LC, Lasagna L (1969) Obtaining informed consent. Form or substance.
Archives of Internal Medicine 123: 682-688.
Farraye FA, Nimitphong H, Stucchi A, Dendrinos K, Boulanger AB, Vijjeswarapu A,
Tanennbaum A, Biancuzzo R, Chen TC, Holick MF (2011) Use of a novel vitamin D
bioavailability test demonstrates that vitamin D absorption is decreased in patients
with quiescent Crohn's disease. Inflammatory Bowel Diseases 17: 2116-2121.
Faul F, Erdfelder E, Lang AG, Buchner A (2007) G*Power 3: a flexible statistical
power analysis program for the social, behavioral, and biomedical sciences. Behavior
Research Methods 39: 175-191.
Ferguson C (2009) An Effect Size Primer: A Guide for Clinicans and Researchers.
Professional Psychology: Research and Practice 40: 532-538.
Flory J, Emanuel E (2004) Interventions to improve research participants'
understanding in informed consent for research: a systematic review. JAMA 292: 1593-
1601.
Fong DS, Aiello L, Gardner TW, King GL, Blankenship G, Cavallerano JD, Ferris FL,
3rd, Klein R (2003) Diabetic retinopathy. Diabetes Care 26: S99-S102.

143
Fonseca V, Tongia R, el-Hazmi M, Abu-Aisha H (1984) Exposure to sunlight and
vitamin D deficiency in Saudi Arabian women. Postgraduate Medical Journal 60:
589-591.
Franck L, Winter I (2004) Research participant information sheets are difficult to read.
Bulletin of Medical Ethics 195: 13-16.
Frank RN (2004) Diabetic retinopathy. The New England Journal of Medicine 350:
48-58.
Frayn KN (2001) Adipose tissue and the insulin resistance syndrome. Proceedings of
the Nutrition Society 60: 375-380.
Frayn KN, Coppack SW (1992) Insulin resistance, adipose tissue and coronary heart
disease. Clinical Science 82: 1-8.
Fuller JH, McCartney P, Jarrett RJ, Keen H, Rose G, Shipley MJ, Hamilton PJ (1979)
Hyperglycaemia and coronary heart disease: the Whitehall study. Journal of Chronic
Diseases 32: 721-728.
Gabbay KH, Mayman C, Henshaw E, Field R (1973) sorbitol pathway and
complications of diabetes. New England Journal of Medicine 288: 831-836.
Gagnon C, Lu ZX, Magliano DJ, Dunstan DW, Shaw JE, Zimmet PZ, Sikaris K,
Ebeling PR, Daly RM (2012) Low Serum 25-Hydroxyvitamin D Is Associated with
Increased Risk of the Development of the Metabolic Syndrome at Five Years: Results
from a National, Population-Based Prospective Study (The Australian Diabetes,
Obesity and Lifestyle Study: AusDiab). Journal of Clinical Endocrinology &
Metabolism 97: 1953-1961.
Geraldes P, King GL (2010) Activation of Protein Kinase C Isoforms and Its Impact
on Diabetic Complications. Circulation Research 106: 1319-1331.
Gerrits EG, Lutgers HL, Kleefstra N, Graaff R, Groenier KH, Smit AJ, Gans RO, Bilo
HJ (2008a) Skin autofluorescence - A tool to identify type 2 diabetic patients at risk
for developing microvascular complications. Diabetes Care 31: 517-521.
Gerrits EG, Lutgers HL, Kleefstra N, Groenier KH, Smit AJ, Gans RO (2008b) Skin
advanced glycation end product accumulation is poorly reflected by glycemic control
144
in type 2 diabetic patients (ZODIAC‑9). Journal of Diabetes Science and Technology
2:572–577.
Golbidi S, Ebadi SA, Laher I (2011) Antioxidants in the treatment of diabetes. Current
Diabetes Reviews 7: 106-125.
Goltzman D (2000) Approach to Hypercalcemia. In Endotext, De Groot LJ, Beck-
Peccoz P, Chrousos G, Dungan K, Grossman A, Hershman JM, Koch C, McLachlan
R, New M, Rebar R, Singer F, Vinik A, Weickert MO (eds). South Dartmouth (MA):
MDText.com, Inc.
Gonzalez RG, Miglior S, Vonsaltza I, Buckley L, Neuringer LJ, Cheng HM (1988) P-
31 NMR-STUDIES OF THE DIABETIC LENS. Magnetic Resonance in Medicine 6:
435-444.
Gould S. (2011) How to write a questionnaire. Centre for Academic Success, Vol.
2013.
Gradinaru D, Borsa C, Ionescu C, Margina D, Prada GI, Jansen E (2012) Vitamin D
status and oxidative stress markers in the elderly with impaired fasting glucose and
type 2 diabetes mellitus. Aging Clinical and Experimental Research 24: 595-602.
Grossmann RE, Tangpricha V (2010) Evaluation of vehicle substances on vitamin D
bioavailability: a systematic review. Molecular Nutrition & Food Research 54: 1055-
1061.
Grundy S (2006) Diabetes and coronary risk equivalency: what does it mean? Diabetes
Care 29:457-60.
Grundy SM, Denke MA (1990) Dietary influences on serum lipids and lipoproteins.
Journal of Lipid Research 31: 1149-1172.
Gu K, Cowie CC, Harris MI (1998) Mortality in adults with and without diabetes in a
national cohort of the U.S. population, 1971-1993. Diabetes Care 21: 1138-45.
Hadi HAR, Suwaidi JA (2007) Endothelial dysfunction in diabetes mellitus. Vascular
Health and Risk Management 3: 853-876.

145
Hagstrom E, Hellman P, Larsson TE, Ingelsson E, Berglund L, Sundstrom J, Melhus
H, Held C, Lind L, Michaelsson K, Arnlov J (2009) Plasma Parathyroid Hormone and
the Risk of Cardiovascular Mortality in the Community. Circulation 119: 2765-U2734.
Hague P (1993) Questionnaire design, England: Clays Ltd.
Haire-Joshu D, Glasgow RE, Tibbs TL (2004) Smoking and diabetes. Diabetes Care
27: S74-75.
Halicka HD, Zhao H, Li J, Traganos F, Studzinski GP, Darzynkiewicz Z (2012)
Attenuation of constitutive DNA damage signaling by 1,25-dihydroxyvitamin D3.
Aging 4: 270-278.
Hamden K, Carreau S, Jamoussi K, Miladi S, Lajmi S, Aloulou D, Ayadi F, Elfeki A
(2009) 1 alpha,25 Dihydroxyvitamin D3: Therapeutic and Preventive Effects against
Oxidative Stress, Hepatic, Pancreatic and Renal Injury in Alloxan-Induced Diabetes in
Rats. Journal of Nutritional Science and Vitaminology 55: 215-222.
Hamman RF (1992) Genetic and environmental determinants of non-insulin-dependent
diabetes mellitus (NIDDM). Diabetes Metabolism Reviews 8: 287-338.
Harris SS, Pittas AG, Palermo NJ (2012) A randomized, placebo-controlled trial of
vitamin D supplementation to improve glycaemia in overweight and obese African
Americans. Diabetes Obesity & Metabolism 14: 789-794.
Hartog JW, Voors AA, Bakker SJ, Smit AJ, van Veldhuisen DJ (2007) Advanced
glycation end-products (AGEs) and heart failure: pathophysiology and clinical
implications. European Journal of Heart Failure 9: 1146-1155.
Hathcock JN, Shao A, Vieth R, Heaney R (2007) Risk assessment for vitamin D.
American Journal of Clinical Nutrition 85: 6-18.
Haussler MR, Whitfield GK, Kaneko I, Haussler CA, Hsieh D, Hsieh JC, Jurutka PW
(2013) Molecular mechanisms of vitamin D action. Calcified Tissue International 92:
77-98.
Heaney RP, Davies KM, Chen TC, Holick MF, Barger-Lux MJ (2003) Human serum
25-hydroxycholecalciferol response to extended oral dosing with cholecalciferol.
American Journal of Clinical Nutrition 77: 204-210.
146
Heshmat R, Tabatabaei-Malazy O, Abbaszadeh-Ahranjani S, Shahbazi S,
Khooshehchin G, Bandarian F, Larijani B (2012) Effect of vitamin D on insulin
resistance and anthropometric parameters in Type 2 diabetes; a randomized double-
blind clinical trial. Daru-Journal of Pharmaceutical Sciences 20: 10.
Hirschi KK, Rohovsky SA, D’Amore (1998) PDGF, TGF-beta, and heterotypic cell-
cell interactions mediate endothelial cell-induced recruitment of 10T1/2 cells and their
differentiation to a smooth muscle fate. The Journal of Cell Biology 141: 805 –814.
Holick MF (1994) McCollum Award Lecture, 1994: vitamin D--new horizons for the
21st century. American Journal of Clinical Nutrition 60: 619-630.
Holick MF (2004) Sunlight and vitamin D for bone health and prevention of
autoimmune diseases, cancers, and cardiovascular disease. American Journal of
Clinical Nutrition 80: 1678s-1688s.
Holick MF (2007) Vitamin D deficiency. New England Journal of Medicine 357: 266-
281.
Holick MF (2009) Vitamin D Status: Measurement, Interpretation, and Clinical
Application. Annals of Epidemiology 19: 73-78.
Holick MF, Binkley NC, Bischoff-Ferrari HA, Gordon CM, Hanley DA, Heaney RP,
Murad MH, Weaver CM, Endocrine Society (2011). Evaluation, treatment, and
prevention of vitamin D deficiency: an Endocrine Society clinical practice guideline.
Journal of Clinical Endocrinology & Metabolism 96: 1911–1930.
Holick MF, Chen TC (2008) Vitamin D deficiency: a worldwide problem with health
consequences. American Journal of Clinical Nutrition 87: 1080s-1086s.
Hong CY, Chia KS (1998) Markers of diabetic nephropathy. Journal of Diabetes and
its Complications 12: 43-60.
Hudson BI, Hofmann MA, Bucciarelli L, Wendt T, Moser B, Lu Y, Qu W, Stern DM,
D'Agati V, Du Yan S, Yan SF, Grant PJ, Schmidt AM (2002) Glycation and diabetes:
The RAGE connection. Current Science 83: 1515-1521.
Illing EKB, Gray CH, Lawrence RD (1951) Blood glutathione and non-glucose
reducing substances in diabetes. Biochemical Journal 48: 637-640.

147
Inoguchi T, Battan R, Handler E, Sportsman JR, Heath W, King GL (1992)
Preferential elevation of protein kinase C isoform beta II and diacylglycerol levels in
the aorta and heart of diabetic rats: differential reversibility to glycemic control by islet
cell transplantation. Proceedings of the National Academy of Sciences of the United
States of America 89: 11059-11063.
Institute of Medicine Committee to Review Dietary Reference Intakes for Vitamin
DaC (2011) The National Academies Collection: Reports funded by National Institutes
of Health. In Dietary Reference Intakes for Calcium and Vitamin D, Ross AC, Taylor
CL, Yaktine AL, Del Valle HB (eds). Washington (DC): National Academies Press
(US) National Academy of Sciences.
International Diabetes Federation. (2012) Diabetes at a glance, 2012. Qatar.
Isaia G, Giorgino R, Adami S (2001) High prevalence of hypovitaminosis D in female
type 2 diabetic population. Diabetes Care 24: 1496-1496.
Islam SMS, Johnson CA (2003) Correlates of smoking behavior among Muslim Arab-
American adolescents. Ethnicity & Health 8: 319-337.
Jack W, John T, Mary R, Santiago B, Steven H, Richard p (1994) Asians have lower
body mass index (BMI) but higher percent body fat than do whites: comparisons of
anthropometric measurements. American Journal of Clinical Nutrition 60: 23-8.
Jain SK, Manna P, Micinski D, Lieblong BJ, Kahlon G, Morehead L, Hoeldtke R,
Bass PF, 3rd, Levine SN (2013) In African American type 2 diabetic patients, is
vitamin D deficiency associated with lower blood levels of hydrogen sulfide and cyclic
adenosine monophosphate, and elevated oxidative stress? Antioxid Redox Signal 18:
1154-1158.
Jakus V (2000) The role of free radicals, oxidative stress and antioxidant systems in
diabetic vascular disease. Bratislavske lekarske listy 101: 541-551.
James WPT (2008) 22nd Marabou Symposium: the changing faces of vitamin D.
Nutrition Reviews 66: S213-S217.
Joergensen C, Gall M-A, Schmedes A, Tarnow L, Parving H-H, Rossing P (2010)
Vitamin D Levels and Mortality in Type 2 Diabetes. Diabetes Care 33: 2238-2243.

148
Johansen OE, Birkeland KI (2003) Preventing macrovascular disease in patients with
type 2 diabetes mellitus. American Journal of Cardiovascular Drugs : drugs, devices,
and other interventions 3: 283-297.
Johnson JA, Grande JP, Roche PC, Kumar R (1994) Immunohistochemical
localization of the 1, 25 (OH) 2D3 receptor and calbindin D28k in human and rat
pancreas. American Journal of Physiology 267: E356-E360.
Jones G (2008) Pharmacokinetics of vitamin D toxicity. American Journal of Clinical
Nutrition 88: 582s-586s.
Jorde R, Figenschau Y (2009) Supplementation with cholecalciferol does not improve
glycaemic control in diabetic subjects with normal serum 25-hydroxyvitamin D levels.
European Journal of Nutrition 48: 349-354.
Jorde R, Grimnes G (2011) Vitamin D and metabolic health with special reference to
the effect of vitamin D on serum lipids. Progress in Lipid Research 50: 303-312.
Jorde R, Sneve M, Emaus N, Figenschau Y, Grimnes G (2010) Cross-sectional and
longitudinal relation between serum 25-hydroxyvitamin D and body mass index: the
Tromso study. European Journal of Nutrition 49: 401-407.
Jorde R, Svartberg J, Sundsfjord J (2005) Serum parathyroid hormone as a predictor of
increase in systolic blood pressure in men. Journal of Hypertension 23: 1639-1644.
Joshi D, Center JR, Eisman JA (2010) Vitamin D deficiency in adults. Australian
Prescriber 33: 103-106.
Kahn SE, Hull RL, Utzschneider KM (2006) Mechanisms linking obesity to insulin
resistance and type 2 diabetes. Nature 444: 840-846.
Kahn SE, Prigeon RL, McCulloch DK, Boyko EJ, Bergman RN, Schwartz MW,
Neifing JL, Ward WK, Beard JC, Palmer JP, et al. (1993) Quantification of the
relationship between insulin sensitivity and beta-cell function in human subjects:
evidence for a hyperbolic function. Diabetes 42: 1663-1672.
Kakkar R, Mantha SV, Radhi J, Prasad K, Kalra J (1998) Increased oxidative stress in
rat liver and pancreas during progression of streptozotocin-induced diabetes. Clinical
Science 94: 623-632.

149
Kallay E, Bareis P, Bajna E, Kriwanek S, Bonner E, Toyokuni S, Cross HS (2002)
Vitamin D receptor activity and prevention of colonic hyperproliferation and oxidative
stress. Food and Chemical Toxicology 40: 1191-1196.
Kampmann U, Mosekilde L, Juhl C, Moller N, Christensen B, Rejnmark L, Wamberg
L, Orskov L (2014) Effects of 12 weeks high dose vitamin D3 treatment on insulin
sensitivity, beta cell function, and metabolic markers in patients with type 2 diabetes
and vitamin D insufficiency - a double-blind, randomized, placebo-controlled trial.
Metabolism-Clinical and Experimental 63: 1115-1124.
Kamycheva E, Joakimsen RM, Jorde R (2003) Intakes of calcium and vitamin D
predict body mass index in the population of northern Norway. Journal of Nutrition
133: 102-106.
Kamycheva E, Sundsfjord J, Jorde R (2004a) Serum parathyroid hormone level is
associated with body mass index. The 5th Tromso study. European Journal of
Endocrinology 151: 167-172.
Kamycheva E, Sundsfjord J, Jorde R (2004b) Serum parathyroid hormone levels
predict coronary heart disease: the Tromso Study. European Journal of
Cardiovascular Prevention & Rehabilitation 11: 69-74.
Kanan RM, Al Saleh YM, Fakhoury HM, Adham M, Aljaser S, Tamimi W (2013)
Year-round vitamin D deficiency among Saudi female out-patients. Public Health
Nutrition 16: 544-548.
Kaptchuk TJ, Friedlander E, Kelley JM, Sanchez MN, Kokkotou E, Singer JP,
Kowalczykowski M, Miller FG, Kirsch I, Lembo AJ (2010) Placebos without
deception: a randomized controlled trial in irritable bowel syndrome. PLoS One 5:
e15591.
Katz A, Nambi SS, Mather K, Baron AD, Follmann DA, Sullivan G, Quon MJ (2000)
Quantitative insulin sensitivity check index: A simple, accurate method for assessing
insulin sensitivity in humans. Journal of Clinical Endocrinology & Metabolism 85:
2402-2410.
Keen H (1994) The Diabetes Control and Complications Trial (DCCT). Health Trends
26: 41-43.

150
Kelley C, D’Amore P, Hechtman HB, Shepro D (1987) Microvascular pericyte
contractility in vitro: comparison with other cells of the vascular wall. The Journal of
Cell Biology 104: 483–490.
Kendrick J, Targher G, Smits G, Chonchol M (2009) 25-Hydroxyvitamin D deficiency
is independently associated with cardiovascular disease in the Third National Health
and Nutrition Examination Survey. Atherosclerosis 205: 255-260.
Kershaw EE, Hamm JK, Verhagen LAW, Peroni O, Katic M, Flier JS (2006) Adipose
triglyceride lipase - Function, regulation by insulin, and comparison with adiponutrin.
Diabetes 55: 148-157.
Keskin M, Kurtoglu S, Kendirci M, Atabek ME, Yazici C (2005) Homeostasis model
assessment is more reliable than the fasting glucose/insulin ratio and quantitative
insulin sensitivity check index for assessing insulin resistance among obese children
and adolescents. Pediatrics 115: E500-E503.
Koya D, King GL (1998) Protein kinase C activation and the development of diabetic
complications. Diabetes 47: 859-866.
Krauss RM, Siri PW (2004) Dyslipidemia in type 2 diabetes. Medical Clinics of North
America 88: 897-909.
Krul-Poel YHM, van Wijland H, Stam F, ten Boekel E, Lips P, Simsek S (2014) Study
protocol: a randomised placebo-controlled clinical trial to study the effect of vitamin D
supplementation on glycaemic control in type 2 Diabetes Mellitus SUNNY trial. BMC
Endocrine Disorders 14: 59.
Krul-Poel YHM, Westra S, Simsek S (2015) Effect of Vitamin D Supplementation on
Glycemic Control in Patients With Type 2 Diabetes (SUNNY Trial): A Randomized
Placebo-Controlled Trial. Diabetes Care 2015;38:1420-1426 Response. Diabetes Care
38: E191-E192.
Kuo CS, Pei D, Yao CY, Hsieh MC, Kuo SW (2006) Effect of orlistat in overweight
poorly controlled Chinese female type 2 diabetic patients: a randomised, double-blind,
placebo-controlled study. International Journal of Clinical Practice 60: 906-910.

151
Kurtoglu S, Hatipoglu N, Mazicioglu M, Kendirici M, Keskin M, Kondolot M (2010)
Insulin resistance in obese children and adolescents: HOMA-IR cut-off levels in the
prepubertal and pubertal periods. Journal of Clinical Research in Pediatric
Endocrinology 2: 100-106.
Laakso M (1993) How good a marker is insulin level for insulin resistance? Am
Journal of Epidemiology 137: 959-965.
Laakso M, Lehto S (1998) Epidemiology of risk factors for cardiovascular disease in
diabetes and impaired glucose tolerance. Atherosclerosis 137: S65-S73.
Labban L (2014) Therapeutic applications of vitamin D supplementation on type 2
diabetes. Open Access Library 1: 1-10.
Lander HM, Tauras JM, Ogiste JS, Hori O, Moss RA, Schmidt AM (1997) Activation
of the receptor for advanced glycation end products triggers a p21(ras)-dependent
mitogen-activated protein kinase pathway regulated by oxidant stress. Journal of
Biological Chemistry 272: 17810-17814.
Langdon IJ, Hardin R, Learmonth ID (2002) Informed consent for total hip
arthroplasty: does a written information sheet improve recall by patients? Annals of the
Royal College of Surgeons of England 84: 404-408.
Latter. (2014) Diabetic retinopathy. Vol. 2015.
Leahy JL (2005) Pathogenesis of type 2 diabetes mellitus. Archives of Medical
Research 36: 197-209.
Lee JH, O'Keefe JH, Bell D, Hensrud DD, Holick MF (2008) Vitamin D Deficiency
An Important, Common, and Easily Treatable Cardiovascular Risk Factor? Journal of
the American College of Cardiology 52: 1949-1956.
Lee T-W, Kao Y-H, Lee T-I, Chang C-J, Lien G-S, Chen Y-J (2014) Calcitriol
modulates receptor for advanced glycation end products (RAGE) in diabetic hearts.
International Journal of Cardiology 173: 236-241.
Lee YH1, Bae SC, Choi SJ, Ji JD, Song GG (2011) Associations between vitamin D
receptor polymorphisms and susceptibility to rheumatoid arthritis and systemic lupus
erythematosus: a meta-analysis. Molecular Biology Report 38: 3643-51.

152
Lehmann U1, Hirche F, Stangl GI, Hinz K, Westphal S, Dierkes J (2013)
Bioavailability of vitamin D(2) and D(3) in healthy volunteers, a randomized placebo-
controlled trial. The Journal of Clinical Endocronology and Metabolism 98: 4339-45.
Litchfield JE, Thorpe SR, Baynes JW (1999) Oxygen is not required for the browning
and crosslinking of protein by pentoses: relevance to Maillard reactions in vivo. The
International Journal of Biochemistry & Cell Bology 31: 1297-1305.
Lorenzi M (2007) The polyol pathway as a mechanism for diabetic retinopathy:
attractive, elusive, and resilient. Experimental Diabetes Research 2007: 61038-61038.
Lum H, Roebuck KA (2001) Oxidant stress and endothelial cell dysfunction. American
Journal of Physiology-Cell Physiology 280: C719-C741.
Mackic JB, Stins M, McComb JG, Calero M, Ghiso J, Kim KS, Yan SD, Stern D,
Schmidt AM, Frangione B, Zlokovic BV (1998) Human blood-brain barrier receptors
for Alzheimer's amyloid-beta 1- 40. Asymmetrical binding, endocytosis, and
transcytosis at the apical side of brain microvascular endothelial cell monolayer.
Journal of Clinical Investigation 102: 734-743.
Maestro B, Campion J, Davila N, Calle C (2000) Stimulation by 1,25-
dihydroxyvitamin D-3 of insulin receptor expression and insulin responsiveness for
glucose transport in U-937 human promonocytic cells. Endocrine Journal 47: 383-391.
Maestro B, Davila N, Carranza MC, Calle C (2003) Identification of a Vitamin D
response element in the human insulin receptor gene promoter. Journal of Steroid
Biochemistry and Molecular Biology 84: 223-230.
Maestro B, Molero S, Bajo S, Davila N, Calle C (2002) Transcriptional activation of
the human insulin receptor gene by 1,25-dihydroxyvitamin D(3). Cell Biochemistry
and Function 20: 227-232.
Maritim AC, Sanders RA, Watkins JB, 3rd (2003) Diabetes, oxidative stress, and
antioxidants: a review. Journal of Bochemical and Molecular Toxicology 17: 24-38.
Matthews DR, Hosker JP, Rudenski AS, Naylor BA, Treacher DF, Turner RC (1985)
Homeostasis model assessment: insulin resistance and β-cell function from fasting
plasma glucose and insulin concentrations in man. Diabetologia 28: 412-419.

153
Mauer SM, Chavers BM (1985) A comparison of kidney disease in type I and type II
diabetes. Advances in Experimental Medicine and Biology 189: 299-303.
Maxwell SRJ, Thomason H, Sandler D, Leguen C, Baxter MA, Thorpe GHG, Jones
AF, Barnett AH (1997) Antioxidant status in patients with uncomplicated insulin-
dependent and non-insulin-dependent diabetes mellitus. European Journal of Clinical
Investigation 27: 484-490.
McLeod SA. (2008) Simply Psychology; Qualitative Quantitative. Simply Psychology,
Vol. 2013.
Meerwaldt R, Links T, Zeebregts C, Tio R, Hillebrands J-L, Smit A (2008) The
clinical relevance of assessing advanced glycation endproducts accumulation in
diabetes. Cardiovascular Diabetology 7:29.
Menon R, Rickard A, Mannan N, Timms P, Sharp S, Martineau A, Boucher B,
Chowdhury T, Griffiths C, Griffin S, Hitman G. (2013) The effects of vitamin D2 or
D3 supplementation on glycaemic control and related metabolic parameters in people
at risk of type 2 diabetes: protocol of a randomised double-blind placebo-controlled
trial. BMC Public Health 13:999.
Midhet FM, Al-Mohaimeed AA, Sharaf FK (2010) Lifestyle related risk factors of
type 2 diabetes mellitus in Saudi Arabia. Saudi Medical Journal 31: 768-774.
Milner RD, Hales CN (1967) The role of calcium and magnesium in insulin secretion
from rabbit pancreas studied in vitro. Diabetologia 3: 47-49.
Mithal A, Wahl DA, Bonjour JP, Burckhardt P, Dawson-Hughes B, Eisman JA,
Fuleihan GE-H, Josse RG, Lips P, Morales-Torres J, Advisors IOFCS (2009) Global
vitamin D status and determinants of hypovitaminosis D. Osteoporosis International
20: 1807-1820.
Mitri J, Dawson-Hughes B, Hu FB, Pittas AG (2011) Effects of vitamin D and calcium
supplementation on pancreatic beta cell function, insulin sensitivity, and glycemia in
adults at high risk of diabetes: the Calcium and Vitamin D for Diabetes Mellitus
(CaDDM) randomized controlled trial. American Journal of Clinical Nutrition 94:
486-494.

154
Miura J, Uchigata Y, Yamamoto Y, Takeuchi M, Sakurai S, Watanabe T, Yonekura H,
Yamagishi S, Makita Z, Sato A, Omori Y, Yamamoto H, Iwamoto Y (2004) AGE
down-regulation of monocyte RAGE expression and its association with diabetic
complications in type 1 diabetes. Journal of Diabetes and its Complications 18: 53-59.
Miura J, Yamagishi S, Uchigata Y, Takeuchi M, Yamamoto H, Makita Z, Iwamoto Y
(2003) Serum levels of non-carboxymethyllysine advanced glycation endproducts are
correlated to severity of microvascular complications in patients with Type 1 diabetes.
Journal of Diabetes and its Complications 17: 16-21.
Miyata T, Ueda Y, Yoshida A, Sugiyama S, Iida Y, Jadoul M, Maeda K, Kurokawa K,
van Ypersele de Strihou C (1997) Clearance of pentosidine, an advanced glycation end
product, by different modalities of renal replacement therapy. Kidney International 51:
880-887.
Mohamad MI, El-Sherbeny EE, Bekhet MM (2015) The Effect of Vitamin D
Supplementation on Glycemic Control and Lipid Profile in Patients with Type 2
Diabetes Mellitus. Journal of the American College of Nutrition 21: 1-6.
Molyneaux LM, Constantino MI, McGill M, Zilkens R, Yue DK (1998) Better
glycaemic control and risk reduction of diabetic complications in Type 2 diabetes:
comparison with the DCCT. Diabetes Research and Clinical Practice 42: 77-83.
Monnier M (2003) Intervention against the Maillard reaction in vivo. In Arch Biochem
Biophys Vol. 419, pp 1-15. United States
Monnier VM, Bautista O, Kenny D, Sell DR, Fogarty J, Dahms W, Cleary PA, Lachin
J, Genuth S (1999) Skin collagen glycation, glycoxidation, and crosslinking are lower
in subjects with long-term intensive versus conventional therapy of type 1 diabetes:
relevance of glycated collagen products versus HbA1c as markers of diabetic
complications. DCCT Skin Collagen Ancillary Study Group. Diabetes Control and
Complications Trial. Diabetes 48: 870-880.
Monnier VM, Sell DR, Genuth S (2005) Glycation products as markers and predictors
of the progression of diabetic complications. Annals of the New York Academy of
Sciences 1043: 567-581.

155
Monnier VM, Sell DR, Nagaraj RH, Miyata S, Grandhee S, Odetti P, Ibrahim SA
(1992) Maillard reaction-mediated molecular damage to extracellular matrix and other
tissue proteins in diabetes, aging, and uremia. Diabetes 41: 36-41.
Monnier VM, Stevens VJ, Cerami A (1981) Maillard reactions involving proteins and
carbohydrates in vivo: relevance to diabetes mellitus and aging. Progress in Food &
Nutrition Science 5: 315-327.
Mooradian A (2009) Dyslipidemia in type 2 diabetes mellitus. Nature Clinical
Practice Endocrinology & Metabolism 5: 150-159.
Mooradian AD, Haas MJ, Wehmeier KR, Wong NCW (2008) Obesity-related changes
in high-density lipoprotein metabolism. Obesity 16: 1152-1160.
Mooradian AD, Haas MJ, Wong NCW (2004) Transcriptional control of
apolipoprotein A-I gene expression in diabetes. Diabetes 53: 513-520.
Motiejunaite R, Kazlauskas A (2008) Pericytes and ocular diseases. Experimental Eye
Research 86: 171-177.
Nagpal J, Pande JN, Bhartia A (2009) A double-blind, randomized, placebo-controlled
trial of the short-term effect of vitamin D3 supplementation on insulin sensitivity in
apparently healthy, middle-aged, centrally obese men. Diabetic Medicine 26: 19-27.
Nasri H, Behradmanesh S, Maghsoudi AR, Ahmadi A, Nasri P, Rafieian-Kopaei M
(2014) Efficacy of supplementary vitamin D on improvement of glycemic parameters
in patients with type 2 diabetes mellitus; a randomized double blind clinical trial.
Journal of Renal Injury Prevention 3: 31-34.
Neumann A, Schinzel R, Palm D, Riederer P, Munch G (1999) High molecular weight
hyaluronic acid inhibits advanced glycation endproduct-induced NF-kappa B
activation and cytokine expression. Febs Letters 453: 283-287.
Neyestani T (2013) Vitamin D, Oxidative Stress and Diabetes: Is There A Link? In
Diabetes: Oxidative Stress and Dietary Antioxidants, Preedy V (ed), pp 111-119.
Cambridge: Academic Press
Ni ZM, Smogorzewski M, Massry SG (1994) Effects of parathyroid hormone on
cytosolic calcium of rat adipocytes. Endocrinology 135: 1837-1844.

156
Nielsen (1998a) Report on Television. New York.
Nielsen JV (1998b) Peripheral neuropathy, hypertension, foot ulcers and amputations
among Saudi Arabian patients with type 2 diabetes. Diabetes Research and Clinical
Practice 41: 63-69.
Nikooyeh B, Neyestani TR, Farvid M, Alavi-Majd H, Houshiarrad A, Kalayi A,
Shariatzadeh N, Gharavi A, Heravifard S, Tayebinejad N, Salekzamani S, Zahedirad
M (2011) Daily consumption of vitamin D- or vitamin D + calcium-fortified yogurt
drink improved glycemic control in patients with type 2 diabetes: a randomized
clinical trial. American Journal of Clinical Nutrition 93: 764-771.
Nikooyeh B, Neyestani TR, Tayebinejad N, Alavi-Majd H, Shariatzadeh N, Kalayi A,
Zahedirad M, Heravifard S, Salekzamani S (2014) Daily intake of vitamin D- or
calcium-vitamin D-fortified Persian yogurt drink (doogh) attenuates diabetes-induced
oxidative stress: evidence for antioxidative properties of vitamin D. Journal of Human
Nutrition and Dietetics 27: 276-283.
Norman AW, Frankel BJ, Heldt AM, Grodsky GM (1980) Vitamin D deficiency
inhibits pancreatic secretion of insulin. Science 209: 823-825.
Noyan T, Balaharoglu R, Komuroglu U (2005) The oxidant and antioxidant effects of
25-hydroxyvitamin D3 in liver, kidney and heart tissues of diabetic rats. Clinical and
Experimental Medicine 5: 31-36.
Oates PJ (2002) Polyol pathway and diabetic peripheral neuropathy. Neurobiology of
Diabetic Neuropathy 50: 325-392.
Obayashi H, Nakano K, Shigeta H, Yamaguchi M, Yoshimori K, Fukui M, Fujii M,
Kitagawa Y, Nakamura N, Nakamura K, Nakazawa Y, Ienaga K, Ohta M, Nishimura
M, Fukui I, Kondo M (1996) Formation of crossline as a fluorescent advanced
glycation end product in vitro and in vivo. Biochemical and Biophysical Research
Communications 226: 37-41.
Ojuka EO (2004) Role of calcium and AMP kinase in the regulation of mitochondrial
biogenesis and GLUT4 levels in muscle. Proceedings of the Nutrition Society 63: 275-
278.

157
Opara EC, Abdel-Rahman E, Soliman S, Kamel WA, Souka S, Lowe JE, Abdel-Aleem
S (1999) Depletion of total antioxidant capacity in type 2 diabetes. Metabolism-
Clinical and Experimental 48: 1414-1417.
Oppenheim A (1992) Questionnaire design, interviewing and attitude measurement,
New edn. London: Biddles.
O'Rahilly S, Barroso I, Wareham NJ (2005) Genetic factors in type 2 diabetes: the end
of the beginning? Science 307: 370-373.
Orwoll E, Riddle M, Prince M (1994) Effects of vitamin D on insulin and glucagon
secretion in non-insulin-dependent diabetes mellitus. American Journal of Clinical
Nutrition 59: 1083-1087.
Osterberg L, Blaschke T (2005) Adherence to medication. The New England Journal
of Medicine 353: 487-497.
Park KS, Kim SS, Kim JC, Kim HC, Im YS, Ahn CW, Lee HK (2008) Serum and tear
levels of nerve growth factor in diabetic retinopathy patients. American Journal of
Ophthalmology 145: 432-437.
Patel P, Poretsky L, Liao E (2010) Lack of effect of subtherapeutic vitamin D
treatment on glycemic and lipid parameters in Type 2 diabetes: A pilot prospective
randomized trial. Journal of Diabetes 2: 36-40.
Peppa M, Brem H, Ehrlich P, Zhang JG, Cai W, Li Z, Croitoru A, Thung S, Vlassara
H (2003) Adverse effects of dietary glycotoxins on wound healing in genetically
diabetic mice. Diabetes 52: 2805-2813.
Pickup JC (2004) Inflammation and activated innate immunity in the pathogenesis of
type 2 diabetes. Diabetes Care 27: 813-823.
Pittas AG, Dawson-Hughes B, Sheehan PR, Rosen CJ, Ware JH, Knowler WC, Staten
MA; D2d Research Group (2014) Rationale and Design of the Vitamin D and Type 2
Diabetes (D2d) Study: A Diabetes Prevention Trial. Diabetes Care 12: 3227-34.
Pittas AG, Harris SS, Stark PC, Dawson-Hughes B (2007a) The effects of calcium and
vitamin D supplementation on blood glucose and markers of inflammation in
nondiabetic adults. Diabetes Care 30: 980-986.

158
Pittas AG, Lau J, Hu FB, Dawson-Hughes B (2007b) Review: The role of vitamin D
and calcium in type 2 diabetes. A systematic review and meta-analysis. Journal of
Clinical Endocrinology & Metabolism 92: 2017-2029.
Pocock SJ, Assmann SE, Enos LE, Kasten LE (2002) Subgroup analysis, covariate
adjustment and baseline comparisons in clinical trial reporting: current practice and
problems. Statistics in Medicine 21: 2917-2930.
Ponda M, Huang X, Odeh M, Breslow J, Kaufman H (2012) Vitamin D may not
improve lipid levels: a serial clinical laboratory data study. Circulation 126: 270-277.
Poornima IG, Parikh P, Shannon RP (2006) Diabetic cardiomyopathy: the search for a
unifying hypothesis. Circulation Research 98: 596-605.
Popov D (2010) Endothelial cell dysfunction in hyperglycemia: Phenotypic change,
intracellular signaling modification, ultrastructural alteration, and potential clinical
outcomes. International Journal of Diabetes Mellitus 2: 189–195.
Practice Committee of American Society for Reproductive M (2008) Interpretation of
clinical trial results. Fertility and Sterility 90: S114-120.
Public Health England (2016) PHE publishes new advice on vitamin D [online] PHE.
Available from: https://www.gov.uk/government/news/phe-publishes-new-advice-on-
vitamin-d [Accessed 25/01/2017].
Raab GM, Day S, Sales J (2000) How to select covariates to include in the analysis of
a clinical trial. Controlled Clinical Trials 21: 330-342.
Rafat D, Ahmad J (2012) HbA1c in pregnancy. Diabetes & Metabolic Syndrome 6:
59-64.
Raghuramulu N, Raghunath M, Chandra S, Sahay K, Gupta P (1992) Vitamin D
improves oral glucose tolerance and insulin secretion in human diabetes. Journal of
Clinical Biochemistry and Nutrition 13: 45-51.
Ramasamy R, Yan S, Schmidt A (2011) Receptor for AGE (RAGE): signaling
mechanisms in the pathogenesis of diabetes and its complications. Annals of the New
York Academy of Sciences 1243:88-102.

159
Reunanen A, Knekt P, Aaran RK, Aromaa A (1998) Serum antioxidants and risk of
non-insulin dependent diabetes mellitus. European Journal of Clinical Nutrition 52:
89-93.
Reusch JEB (2003) Diabetes, microvascular complications, and cardiovascular
complications: what is it about glucose? Commentary. Journal of Clinical
Investigation 112: 986-988.
Ritz E, Kreusser W, Boland R, Bommer J (1979) Vitamin D metabolism in kidney
insufficiency: disorders of an endocrine regulatory zone]. Klinische Wochenschrift 57:
1053-1059.
Robbins JM, Vaccarino V, Zhang HP, Kasl SV (2001) Socioeconomic status and type
2 diabetes in African American and non-Hispanic white women and men: Evidence
from the Third National Health and Nutrition Examination Survey. American Journal
of Public Health 91: 76-83.
Robert R (2012) Statistics in Medicine, third edition. California, USA.
Roche. (2013) Diagnostics Sections.
Roglic G, Unwin N, Bennett PH, Mathers C, Tuomilehto J, Nag S, Connolly V, King
H (2005) The burden of mortality attributable to diabetes: realistic estimates for the
year 2000. Diabetes Care 28: 2130-2135.
Rotchford AP, Rotchford KM, Machattie T, Gill GV (2002) Assessing diabetic control
- reliability of methods available in resource poor settings. Diabetic Medicine 19: 195-
200.
Roter DL, Hall JA, Merisca R, Nordstrom B, Cretin D, Svarstad B (1998)
Effectiveness of interventions to improve patient compliance: a meta-analysis. Medical
care 36: 1138-1161.
Rother KI (2007) Diabetes treatment--bridging the divide. New England Journal of
Medicine 356: 1499-1501.
Rutherford A (2001) Introducing ANOVA and ANCOVA: A GLM approach, Thousand
Oaks: CA Sage.
160
Ryu O-H, Chung W, Lee S, Hong K-S, Choi M-G, Yoo HJ (2014) The effect of high-
dose vitamin D supplementation on insulin resistance and arterial stiffness in patients
with type 2 diabetes. Korean Journal of Internal Medicine 29: 620-629.
Sabherwal S, Bravis V, Devendra D (2010) Effect of oral vitamin D and calcium
replacement on glycaemic control in South Asian patients with type 2 diabetes.
International Journal of Clinical Practice 64: 1084-1089.
Sacerdote C, Ricceri F, Rolandsson O, Baldi I, Chirlaque M-D, Feskens E, Bendinelli
B, Ardanaz E, Arriola L, Balkau B, Bergmann M, Beulens JWJ, Boeing H, Clavel-
Chapelon F, Crowe F, de Lauzon-Guillain B, Forouhi N, Franks PW, Gallo V,
Gonzalez C, Halkjaer J, Illner A-K, Kaaks R, Key T, Khaw K-T, Navarro C, Nilsson
PM, Dalton SO, Overvad K, Pala V, Palli D, Panico S, Polidoro S, Ramon Quiros J,
Romieu I, Sanchez M-J, Slimani N, Sluijs I, Spijkerman A, Teucher B, Tjonneland A,
Tumino R, van der A D, Vergnaud A-C, Wennberg P, Sharp S, Langenberg C, Riboli
E, Vineis P, Wareham N (2012) Lower educational level is a predictor of incident type
2 diabetes in European countries: The EPIC-InterAct study. International Journal of
Epidemiology 41: 1162-1173.
Sadat-Ali M, Al Elq A, Al-Farhan M, Sadat NA (2013) Fortification with vitamin D:
Comparative study in the Saudi Arabian and US markets. Journal of Family &
Community Medicine 20: 49-52.
Sadiya A, Ahmed SM, Carlsson M, Tesfa Y, George M, Ali SH, Siddieg HH,
Abusnana S (2015) Vitamin D supplementation in obese type 2 diabetes subjects in
Ajman, UAE: a randomized controlled double-blinded clinical trial. European Journal
of Clinical Nutrition 69: 707-711.
Saedisomeolia A, Taheri E, Djalali M, Djazayeri A, Qorbani M, Rajab A, Larijani B
(2013) Vitamin D status and its association with antioxidant profiles in diabetic
patients: A cross-sectional study in Iran. Indian Journal of Medical Sciences 67: 29-37.
Saintonge S, Bang H, Gerber LM (2009) Implications of a New Definition of Vitamin
D Deficiency in a Multiracial US Adolescent Population: The National Health and
Nutrition Examination Survey III. Pediatrics 123: 797-803.

161
Salekzamani S, Neyestani TR, Alavi-Majd H, Houshiarrad A, Kalayi A, Shariatzadeh
N, Gharavi A (2011) Is vitamin D status a determining factor for metabolic syndrome?
A case-control study. Diabetes, Metabolic Syndrome and Obesity 4: 205-212.
Salum E, Kals J, Kampus P, Salum T, Zilmer K, Aunapuu M, Arend A, Eha J, Zilmer
M (2013) Vitamin D reduces deposition of advanced glycation end-products in the
aortic wall and systemic oxidative stress in diabetic rats. Diabetes Research and
Clinical Practice 100: 243-249.
Salum E, Kampus P, Zilmer M, Eha J, Butlin M, Avolio AP, Podramaegi T, Arend A,
Aunapuu M, Kals J (2012) Effect of vitamin D on aortic remodeling in streptozotocin-
induced diabetes. Cardiovascular Diabetology 11: 58.
Satin LS (2000) Localized calcium influx in pancreatic beta-cells - Its significance for
Ca2+-dependent insulin secretion from the islets of Langerhans. Endocrine 13: 251-
262.
Saunders D, Sillery J, Chapman R (1988) Effect of calcium-carbonate and aluminum
hydroxide on human intestinal function. Digestive Diseases and Sciences 33: 409-413.
Schlondorff D (1987) The glomerular mesangial cell: an expanding role for a
specialized pericyte. FASEB Journal 1: 272-281.
Schmidt AM, Hori O, Brett J, Yan SD, Wautier JL, Stern D (1994) Cellular receptors
for advanced glycation end products. Implications for induction of oxidant stress and
cellular dysfunction in the pathogenesis of vascular lesions. Arteriosclerosis and
Thrombosis 14: 1521-1528.
Schmidt AM, Yan SD, Wautier JL, Stern D (1999) Activation of receptor for advanced
glycation end products: a mechanism for chronic vascular dysfunction in diabetic
vasculopathy and atherosclerosis. Circulation Research 84: 489-497.
Schulz KF, Grimes DA (2002) Generation of allocation sequences in randomised
trials: chance, not choice. Lancet 359: 515-519.
Schulze MB, Thorand B, Fritsche A, Haring HU, Schick F, Zierer A, Rathmann W,
Kroger J, Peters A, Boeing H, Stefan N (2012) Body adiposity index, body fat content
and incidence of type 2 diabetes. Diabetologia 55: 1660-1667.

162
Schwalfenberg G (2008) Vitamin D and diabetes - Improvement of glycemic control
with vitamin D3 repletion. Canadian Family Physician 54: 864-866.
Scragg R, Holdaway I, Singh V, Metcalf P, Baker J, Dryson E (1995) Serum 25-
hydroxyvitamin D3 levels decreased in impaired glucose tolerance and diabetes
mellitus. Diabetes Research and Clinical Practice 27: 181-188.
Scragg R, Sowers M, Bell C (2004) Serum 25-hydroxyvitamin D, diabetes, and
ethnicity in the Third National Health and Nutrition Examination Survey. Diabetes
Care 27: 2813-2818.
Sebekova K, Sturmer M, Fazeli G, Bahner U, Stab F, Heidland A (2015) Is vitamin D
deficiency related to accumulation of advanced glycation end products, markers of
inflammation, and oxidative stress in diabetic subjects? BioMed Research
International 2015: 958097.
Sedrani SH, Elidrissy A, Elarabi KM (1983) ) Sunlight and vitamin-d status in normal
Saudi subjects. American Journal of Clinical Nutrition 38: 129-132.
Seida JC, Mitri J, Colmers IN, Majumdar SR, Davidson MB, Edwards AL, Hanley
DA, Pittas AG, Tjosvold L, Johnson JA (2014) Effect of Vitamin D-3
Supplementation on Improving Glucose Homeostasis and Preventing Diabetes: A
Systematic Review and Meta-Analysis. Journal of Clinical Endocrinology &
Metabolism 99: 3551-3560.
Sekido H, Suzuki T, Jomori T, Takeuchi M, Yabe-Nishimura C, Yagihashi S (2004)
Reduced cell replication and induction of apoptosis by advanced glycation end
products in rat Schwann cells. Biochemical and Biophysical Research
Communications 320: 241-248.
Serafini M, Del Rio D (2004) Understanding the association between dietary
antioxidants, redox status and disease: is the Total Antioxidant Capacity the right tool?
Redox Report 9: 145-152.
Shab-Bidar S, Neyestani TR, Djazayery A (2015) The interactive effect of
improvement of vitamin D status and VDR FokI variants on oxidative stress in type 2
diabetic subjects: a randomized controlled trial. European Journal of Clinical
Nutrition 69: 216-222.

163
Shab-Bidar S, Neyestani TR, Djazayery A, Eshraghian MR, Houshiarrad A, Gharavi
A, Kalayi A, Shariatzadeh N, Zahedirad M, Khalaji N, Haidari H (2011) Regular
consumption of vitamin D-fortified yogurt drink (Doogh) improved endothelial
biomarkers in subjects with type 2 diabetes: a randomized double-blind clinical trial.
BMC Medicine 9: 125.
Shera AS, Jawad F, Maqsood A, Jamal S, Azfar M, Ahmed U (2004) Prevalence of
chronic complications and associated factors in type 2 diabetes. Journal of the
Pakistan Medical Association 54: 54-59.
Shiba T, Inoguchi T, Sportsman JR, Heath WF, Bursell S, King GL (1993) Correlation
of diacylglycerol level and protein kinase C activity in rat retina to retinal circulation.
American Journal of Physiology 265: E783-E793.
Shukla AN, Daly MK, Legutko P (2012) Informed consent for cataract surgery: patient
understanding of verbal, written, and videotaped information. Journal of Cataract and
Refractive Surgery 38: 80-84.
Siddiqui AM, Kamfar HZ (2007) Prevalence of vitamin D deficiency rickets in
adolescent school girls in Western region, Saudi Arabia. Saudi Medical Journal 28:
441-444.
Sims TJ, Rasmussen LM, Oxlund H, Bailey AJ (1996) The role of glycation cross-
links in diabetic vascular stiffening. Diabetologia 39: 946-951.
Singh R, Barden A, Mori T, Beilin L (2001) Advanced glycation end-products: a
review. Diabetologia 44: 129-146.
Singh VP, Bali A, Singh N, Jaggi AS (2014) Advanced Glycation End Products and
Diabetic Complications. Korean Journal of Physiology & Pharmacology 18: 1-14.
Skolnik EY, Yang Z, Makita Z, Radoff S, Kirstein M, Vlassara H (1991) Human and
rat mesangial cell receptors for glucose-modified proteins: potential role in kidney
tissue remodelling and diabetic nephropathy. Journal of Experimental Medicine 174:
931-939.
Skrha J (2003) Pathogenesis of angiopathy in diabetes. Acta Diabetologica 40: S324-
S329.
164
Smith p, Harding D. (2013) Data Protection Act 1998: Guidelines for social research.
Smith PR, Thornalley PJ (1992) Mechanism of the degradation of non-enzymatically
glycated proteins under physiological conditions. Studies with the model fructosamine,
N epsilon-(1-deoxy-D-fructos-1-yl)hippuryl-lysine. European Journal of Biochemistry
210: 729-739.
Sneve M, Figenschau Y, Jorde R (2008) Supplementation with cholecalciferol does
not result in weight reduction in overweight and obese subjects. European Journal of
Endocrinology 159: 675-684.
Song YQ, Manson JE, Tinker L, Howard BV, Kuller LH, Nathan L, Rifai N, Liu SM
(2007) Insulin sensitivity and insulin secretion determined by homeostasis model
assessment and risk of diabetes in a multiethnic cohort of women - The Women's
Health Initiative Observational Study. Diabetes Care 30: 1747-1752.
Soric MM, Renner ET, Smith SR (2012) Effect of daily vitamin D supplementation on
HbA1c in patients with uncontrolled type 2 diabetes mellitus: A pilot study. Journal of
Diabetes 4: 104-105.
Steffes MW, Osterby R, Chavers B, Mauer SM (1989) Mesangial expansion as a
central mechanism for loss of kidney function in diabetic patients. Diabetes 38: 1077-
1081.
Stehouwer CDA, Schaper NC (1996) The pathogenesis of vascular complications of
diabetes mellitus: One voice or many? European Journal of Clinical Investigation 26:
535-543.
Stitt AW (2003) The role of advanced glycation in the pathogenesis of diabetic
retinopathy. Experimental and Molecular Pathology 75: 95-108.
Stokes CS, Volmer DA, Grunhage F, Lammert F (2013) Vitamin D in chronic liver
disease. Liver International 33: 338-352.
Strandbygaard U, Thomsen SF, Backer V (2010) A daily SMS reminder increases
adherence to asthma treatment: A three-month follow-up study. Respiratory Medicine
104: 166-171.
165
Stratton I, Adler A, Neil H, Matthews D, Manley S, Cull C, Hadden D, Turner R,
Holman R (2000) Association of glycaemia with macrovascular and microvascular
complications of type 2 diabetes (UKPDS 35): prospective observational study. BMJ
321: 405–12.
Stratton IM, Adler AI, Neil HAW, Matthews DR, Manley SE, Cull CA, Hadden D,
Turner RC, Holman RR, Grp UKPDS (2000) Association of glycaemia with
macrovascular and microvascular complications of type 2 diabetes (UKPDS 35):
prospective observational study. British Medical Journal 321: 405-412.
Sugden JA, Davies JI, Witham MD, Morris AD, Struthers AD (2008) Vitamin D
improves endothelial function in patients with Type 2 diabetes mellitus and low
vitamin D levels. Diabetic Medicine 25: 320-325.
Sugimoto K, Nishizawa Y, Horiuchi S, Yagihashi S (1997) Localization in human
diabetic peripheral nerve of Nɛ-carboxymethyllysine-protein adducts, an advanced
glycation endproduct. Diabetologia 40: 1380-1387.
Sun X, Zemel MB (2007) 1 alpha,25-dihydroxyvitamin D-3 modulation of adipocyte
reactive oxygen species production. Obesity 15: 1944-1953.
Sundaram RK, Bhaskar A, Vijayalingam S, Viswanathan M, Mohan R,
Shanmugasundaram KR (1996) Antioxidant status and lipid peroxidation in type II
diabetes mellitus with and without complications. Clinical Science 90: 255-260.
Szwergold BS, Kappler F, Brown TR (1990) Identification of fructose 3-phosphate in
the lens of diabetic rats. Science 247: 451-454.
Tabesh M, Azadbakht L, Faghihimani E, Tabesh M, Esmaillzadeh A (2014) Effects of
calcium-vitamin D co-supplementation on metabolic profiles in vitamin D insufficient
people with type 2 diabetes: a randomised controlled clinical trial. Diabetologia 57:
2038-2047.
Takeuchi M, Bucala R, Suzuki T, Ohkubo T, Yamazaki M, Koike T, Kameda Y,
Makita Z (2000) Neurotoxicity of advanced glycation end-products for cultured
cortical neurons. Journal of Neuropathology and Experimental Neurology 59: 1094-
1105.
166
Talaei A, Mohamadi M, Adgi Z (2013) The effect of vitamin D on insulin resistance in
patients with type 2 diabetes. Diabetology & Metabolic Syndrome 5: 8.
Talmor Y, Golan E, Benchetrit S, Bernheim J, Klein O, Green J, Rashid G (2008)
Calcitriol blunts the deleterious impact of advanced glycation end products on
endothelial cells. American Journal of Physiology-Renal Physiology 294: F1059-
F1064.
Tarcin O, Yavuz DG, Ozben B, Telli A, Ogunc AV, Yuksel M, Toprak A, Yazici D,
Sancak S, Deyneli O, Akalin S (2009) Effect of vitamin D deficiency and replacement
on endothelial function in asymptomatic subjects. The Journal of Clinical
Endocrinology and Metabolism 94: 4023-4030.
Taskinen MR (2003) Diabetic dyslipidaemia: from basic research to clinical practice.
Diabetologia 46: 733-749.
Tayebinejad N, Neyestani T, Rashidkhani B, Nikooyeh B, Kalayi A, Shariatzadeh N,
Zahedirad M (2012) The effect of daily consumption of Iranian yogurt drink doogh
fortifide with vitamin D or vitamin D plus calcium on the serum advanced glycation
end products (AGEs) and oxidized LDL concentrations in type 2 diabetes patients: a
randomized clinical trial. Iranian Journal of Nutrition Sciences & Food Technology 7:
1-9.
Taylor AVG, Wise PH (1998) Vitamin D replacement in Asians with diabetes may
increase insulin resistance. Postgraduate Medical Journal 74: 365-366.
Teixeira PC, Ducret A, Ferber P, Gaertner H, Hartley O, Pagano S, Butterfield M,
Langen H, Vuilleumier N, Cutler P (2014) Definition of Human Apolipoprotein A-I
Epitopes Recognized by Autoantibodies Present in Patients with Cardiovascular
Diseases. Journal of Biological Chemistry 289: 28249-28259.
The American Heart Association. (2013) What Your Cholesterol Levels Mean. Vol.
2013.
The global diabetes community. (2013) Fasting Blood Sugar Levels. Vol. 2013.

167
Tsai EC, Hirsch IB, Brunzell JD, Chait A (1994) Reduced plasma peroxyl radical
trapping capacity and increased susceptibility of LDL to oxidation in poorly controlled
IDDM. Diabetes 43: 1010-1014.
Tsiaras WG, Weinstock MA (2011) Factors influencing vitamin D status. Acta
Dermato-venereologica 91: 115-124.
UKPDS (1998) Intensive blood-glucose control with sulphonylureas or insulin
compared with conventional treatment and risk of complications in patients with type 2
diabetes (UKPDS 33). UK Prospective Diabetes Study (UKPDS) Group. Lancet 352:
837-853.
Vacek JL, Vanga SR, Good M, Lai SM, Lakkireddy D, Howard PA (2012) Vitamin D
deficiency and supplementation and relation to cardiovascular health. American
Journal of Cardiology 109: 359-363.
Valdez R, Yoon PW, Liu T, Khoury M (2007) Family history and prevalence of
diabetes in the US population - The 6-year results from the national health and
nutrition examination survey (1999-2004). Diabetes Care 30: 2517-2522.
Van der meer R, Welberg JWM, Kuipers F, Kleibeuker JH, Mulder NH, Termont D,
Vonk RJ, Devries HT, Devries EGE (1990) Effects of supplemental dietary calcium on
the intestinal association of calcium, phosphate, and bile acids. Gastroenterology 99:
1653-1659.
Vaskonen T (2003) Dietary minerals and modification of cardiovascular risk factors.
Journal of Nutritional Biochemistry 14: 492-506.
Vaskonen T, Mervaala E, Sumuvuori V, Seppanen-Laakso T, Karppanen H (2002)
Effects of calcium and plant sterols on serum lipids in obese Zucker rats on a low-fat
diet. British Journal of Nutrition 87: 239-245.
Vavricka SR, Rogler G (2012) Intestinal absorption and vitamin levels: is a new focus
needed? Digestive Diseases 30: 73-80.
Verma M, Paneri S, Badi P, Raman PG (2006) Effect of increasing duration of
diabetes mellitus type 2 on glycated hemoglobin and insulin sensitivity. Indian Journal
of Clinical Biochemistry: IJCB 21: 142-146.

168
Vidal A, Sun Y, Bhattacharya SK, Ahokas RA, Gerling IC, Weber KT (2006) Calcium
paradox of aldosteronism and the role of the parathyroid glands. American Journal of
Physiology-Heart and Circulatory Physiology 290: H286-H294.
Vincent AM, Perrone L, Sullivan KA, Backus C, Sastry AM, Lastoskie C, Feldman
EL (2007) Receptor for advanced glycation end products activation injures primary
sensory neurons via oxidative stress. Endocrinology 148: 548-558.
Vlassara H, Brownlee M, Cerami A (1981) Nonenzymatic glycosylation of peripheral
nerve protein in diabetes mellitus. Proceedings of the National Academy of Sciences of
the United States of America 78: 5190-5192.
von Hurst PR, Stonehouse W, Coad J (2010) Vitamin D supplementation reduces
insulin resistance in South Asian women living in New Zealand who are insulin
resistant and vitamin D deficient - a randomised, placebo-controlled trial. The British
Journal of Nutrition 103: 549-555.
Von Hurst PR, Stonehouse W, Matthys C, Conlon C, Kruger MC, Coad J (2008) Study
protocol--metabolic syndrome, vitamin D and bone status in South Asian women
living in Auckland, New Zealand: a randomised, placebo-controlled, double-blind
vitamin D intervention. BMC Public Health 8: 267.
Wada R, Yagihashi S (2005) Role of advanced glycation end products and their
receptors in development of diabetic neuropathy. Annals of the New York Academy of
Sciences 1043: 598-604.
Wallace TM, Levy JC, Matthews DR (2004) Use and abuse of HOMA modeling.
Diabetes Care 27: 1487-1495.
Wallace TM, Matthews DR (2002) The assessment of insulin resistance in man.
Diabetic Medicine 19: 527-534.
Wang H, Xia N, Yang Y, Peng DQ (2012) Influence of vitamin D supplementation on
plasma lipid profiles: a meta-analysis of randomized controlled trials. Lipids in Health
& Disease 11:42.

169
Watkins NG, Thorpe SR, Baynes JW (1985) Glycation of amino groups in protein.
Studies on the specificity of modification of RNase by glucose. The Journal of
Biological Chemistry 260: 10629-10636.
Wautier MP, Chappey O, Corda S, Stern DM, Schmidt AM, Wautier JL (2001)
Activation of NADPH oxidase by AGE links oxidant stress to altered gene expression
via RAGE. American Journal of Physiology, Endocrinology and Metabolism 280:
E685-694.
Wehmeier KR, Mazza A, Hachem S, Ligaray K, Mooradian AD, Wong NCW, Haas
MJ (2008) Differential regulation of apolipoprotein A-I gene expression by vitamin D
receptor modulators. Biochimica Et Biophysica Acta-General Subjects 1780: 264-273.
Weiss MF, Erhard P, Kader-Attia FA, Wu YC, Deoreo PB, Araki A, Glomb MA,
Monnier VM (2000) Mechanisms for the formation of glycoxidation products in end-
stage renal disease. Kidney International 57: 2571-2585.
West IC (2000) Radicals and oxidative stress in diabetes. Diabetic Medicine 17: 171-
180.
WHO (2006) definition and diagnosis of diabetes mellitus and intermediate
hyperglycemia. [Online] WHO. Available from:
http://apps.who.int/iris/bitstream/10665/43588/1/9241594934_eng.pdf [Accessed
16/12/2016].
WHO (2011) Use of Glycated Haemoglobin (HbA1c) in the Diagnosis of Diabetes
Mellitus. Geneva: Abbreviated Report of a WHO Consultation.
WHO (2014) The top 10 causes of death. [Online] WHO. Available from:
http://www.who.int/mediacentre/factsheets/fs310/en/# [Accessed 02/07/2016].
WHO (2016) Global report on diabetes. France: WHO Press.
WHO expert consultation (2004) Appropriate body-mass index for Asian populations
and its implications for policy and intervention strategies. Lancet 363: 157-163.
Wilding JPH (2014) The importance of weight management in type 2 diabetes
mellitus. International Journal of Clinical Practice 68: 682-691.

170
Willi C, Bodenmann P, Ghali WA, Faris PD, Cornuz J (2007) Active smoking and the
risk of type 2 diabetes: a systematic review and meta-analysis. JAMA 298: 2654-2664.
Williams PF, Caterson ID, Cooney GJ, Zilkens RR, Turtle JR (1990) High affinity
insulin binding and insulin receptor-effector coupling: Modulation by Ca2+. Cell
Calcium 11: 547-556.
Winkleby MA, Jatulis DE, Frank E, Fortmann SP (1992) Socioeconomic status and
health: how education, income, and occupation contribute to risk factors for
cardiovascular disease. American Journal of Public Health 82: 816-820.
Winkler A, Teuscher AU, Mueller B, Diem P (2002) Monotoring adherence to
prescribed medication in type 2 diabetic patients treated with sulfonylureas. Swiss
Medical Weekly 132: 379-385.
Witham MD, Dove FJ, Dryburgh M, Sugden JA, Morris AD, Struthers AD (2010) The
effect of different doses of vitamin D-3 on markers of vascular health in patients with
type 2 diabetes: a randomised controlled trial. Diabetologia 53: 2112-2119.
Woerle H, Pimenta W, Meyer C, Gosmanov N, Szoke E, Szombathy T, Mitrakou A,
Gerich J (2004) Diagnostic and therapeutic implications of relationships between
fasting, 2-hour postchallenge plasma glucose and hemoglobin a1c values. Archevis of
Internal Medicin 164: 1627–1632.
Wolf G, Butzmann U, Wenzel UO (2003) The renin-angiotensin system and
progression of renal disease: from hemodynamics to cell biology. Nephron. Physiology
93: P3-13.
Wolff SP, Bascal ZA, Hunt JV (1989) "Autoxidative glycosylation": free radicals and
glycation theory. Progress in Clinical and Biological Research 304: 259-275.
Wolff SP, Dean RT (1988) Aldehydes and dicarbonyls in non-enzymic glycosylation
of proteins. Biochemical Journal 249: 618-619.
Wolff-McDonagh P, Kaufmann J, Foreman S, Wisotsky S, Wisotsky JA, Wexler C
(2010) Using insulin pump therapy in poorly controlled type 2 diabetes. The Diabetes
Educator 36: 657-665.

171
Wong VW, Ross DL, Park K, Boyages SC, Cheung NW (2004) Hyperglycemia: still
an important predictor of adverse outcomes following AMI in the reperfusion era.
Diabetes Research and Clinical Practice 64: 85-91.
Wortsman J, Matsuoka L, Chen T, Lu Z, Holick M (2003) Decreased bioavailability of
vitamin D in obesity. American Jurnal of Clinical Nutrition 72: 690 –693.
Wright M. (2015) Diabetes: the leading danger element for kidney patients., Vol.
2015.
Wu DM, Kawamura H, Sakagami K, Kobayashi M, Puro DG (2003) Cholinergic
regulation of pericyte-containing retinal microvessels. American Journal of
Physiology. Heart Circulatory Physiology 284: H2083–H2090.
Xia P, Inoguchi T, Kern TS, Engerman RL, Oates PJ, King GL (1994)
Characterization of the Mechanism for the Chronic Activation of Diacylglycerol-
Protein Kinase C Pathway in Diabetes and Hypergalactosemia. Diabetes 43: 1122-
1129.
Xue BZ, Greenberg AG, Kraemer FB, Zemel MB (2001) Mechanism of intracellular
calcium ([Ca2+]i) inhibition of lipolysis in human adipocytes. FASEB Journal 15:
2527-9.
Yamagishi S-i, Nakamura K, Matsui T, Ueda S, Fukami K, Okuda S (2008) Agents
that block advanced glycation end product (AGE)-RAGE (receptor for AGEs)-
oxidative stress system: a novel therapeutic strategy for diabetic vascular
complications. Expert Opinion on Investigational Drugs 17: 983-996.
Yan SD, Schmidt AM, Anderson GM, Zhang J, Brett J, Zou YS, Pinsky D, Stern D
(1994) Enhanced cellular oxidant stress by the interaction of advanced glycation end
products with their receptors/binding proteins. The Journal of Biological Chemistry
269: 9889-9897.
Yaylayan VA, Huyghues-Despointes A (1994) Chemistry of Amadori rearrangement
products: analysis, synthesis, kinetics, reactions, and spectroscopic properties. Critical
Reviews in Food Science and Nutrition 34: 321-369.

172
Yiu YF, Yiu KH, Siu CW, Chan YH, Li SW, Wong LY, Lee SW, Tam S, Wong EW,
Lau CP, Cheung BM, Tse HF (2013) Randomized controlled trial of vitamin D
supplement on endothelial function in patients with type 2 diabetes. Atherosclerosis
227: 140-146.
Yoshida N, Okumura K, Aso Y (2005) High serum pentosidine concentrations are
associated with increased arterial stiffness and thickness in patients with type 2
diabetes. Metabolism 54: 345-350.
Young J (2007) Statistical errors in medical research--a chronic disease? In Swiss
Medical Weekly Vol. 137, pp 41-43. Switzerland
Young MJ, Boulton AJ, MacLeod AF, Williams DR, Sonksen PH (1993) A
multicentre study of the prevalence of diabetic peripheral neuropathy in the United
Kingdom hospital clinic population. Diabetologia 36: 150-154.
Yousefi Rad E, Djalali M, Koohdani F, Saboor-Yaraghi AA, Eshraghian MR, Ja-
Vanbakht MH, Saboori S, Zarei M, Hosse-Inzadeh-Attar MJ (2014) The Effects of
Vitamin D Supplementation on Glucose Control and Insulin Resistance in Patients
with Diabetes Type 2: A Randomized Clinical Trial Study. Iranian Journal of Public
Health 43: 1651-1656.
Zemel MB, Shi H, Greer B, Dirienzo D, Zemel PC (2000) Regulation of adiposity by
dietary calcium. FASEB Journal 14: 1132-1138.
Zhang FF, Al Hooti S, Al Zenki S, Alomirah H, Jamil KM, Rao A, Al Jahmah N,
Saltzman E, Ausman LM (2016) Vitamin D deficiency is associated with high
prevalence of diabetes in Kuwaiti adults: results from a national survey. BMC Public
Health 16: 100.
Zittermann A, Frisch S, Berthold HK, Goetting C, Kuhn J, Kleesiek K, Stehle P,
Koertke H, Koerfer R (2009) Vitamin D supplementation enhances the beneficial
effects of weight loss on cardiovascular disease risk markers. American Journal of
Clinical Nutrition 89: 1321-1327.
Zoppini G, Galletti A, Targher G, Brangani C, Pichiri I, Negri C, Stoico V, Cacciatori
V, Bonora E (2013) Glycated Haemoglobin Is Inversely Related to Serum Vitamin D
Levels in Type 2 Diabetic Patients. Plos One 8: e82733.

173
Appendix

174
Screening Questionnaire for recruiting participants
Name:…………..…………………………………… Today’s date: ____/_____/_____
Address:…………………………………………………………………………………............
.......
Telephone:………………………………………………………………………………………
…...
Patient’s file number……………………………………………
Patient’s next appointment ………………………………..
1- Age?
(1) Less than 18 (2) 18 - 24 (3) 25 -34 (4) 35 - 44 (5) 45 - 5 (6)
55-60 (7) 61 and over
Date of birth: ------/-------/--------
2- Does the patient have type 2 diabetes?
(1) Yes (2) No
• Current HbA1c ________________%
• Calculated BMI ________________m2
• Participant’s Height? ________________cm
• Participant’s Weight? ________________kg
• Calcium level ________________mmol/l
3- Does the patient have any of the following medical conditions?
(1) Renal failure
(2) Gastrointestinal Malabsorption (e.g. Crohn’s disease, Colitis)
(3) Thyroid and parathyroid disease
(4) Hypercalcaemia
(5) Liver disease
4- Does the patient take vitamin supplements?
(1) Yes (2) No
If yes, please specify type and brand
............................................................................................
5- Is the patient taking vitamin D?
(1) No (2) Yes
If yes, please specify type and brand
……………………………………………………………
Eligible Not eligible Participant number…………
175
INFORMATION SHEET
Project title:- Effect of vitamin D3 supplementation on markers of glycaemia and
oxidative stress in Saudi women with Type 2 Diabetes Mellitus
Dear Participant,
This information sheet is to provide you with information about a project being
conducted as a PhD in Nutritional Physiology at Manchester Metropolitan University.
This study will provide valuable information about whether vitamin D supplements may
help control type two diabetes.
Study requirements:-
• Questionnaires
This study will involve two questionnaires, one at the start and one after 16 weeks which
should take approximately 5-10 minutes to be completed.
• Anthropometric data
For the purpose of the study, your weight, height and waist circumference will be
measured at the start of the study and after 16 weeks.
• Blood samples
As part of the research blood will be taken at pre-screening, the start of the study and
after 16 weeks.
• Vitamin D Supplements
This study requires participants to take one tablet on a daily basis for 16 weeks. You
will also need to record the days in which supplements were taken and whether any
supplements were missed.
Confidentiality and data protection
You may decide not to answer some or any of the questions provided. You may also
decide to withdraw from this study at any time. The information you provide will be
considered confidential, except that with your permission anonymised quotations may
be used. If you request confidentiality, beyond anonymised quotations, the information
you provide will be treated only as a source of background research, alongside books
and web-based research and the information presented by others. All the information
you provide will be handled in line with the Data Protection Act and will not be used for
anything other than this research study. Your name and any other personal identifying
information will not appear in the course project paper resulting from this study; neither

176
will there be anything to identify your address. Only the study team will have access to
the data itself.
If you have any questions regarding this study or would like additional information
please contact the email below. Thank you for your assistance in this project.
Alaa Hatim Qadhi
E-mail [email protected]
Consent form
Have you read the information sheet?
Do you understand what the project is about?
Are you aware that you will be asked to complete a medical background questionnaire?
Are you aware that four blood samples will be taken?
Are you aware that these blood samples will be analysed?
Are you aware that you need to consume a tablet on a daily basis?
Are you aware that you can stop participating in the study at any time?
Are you willing for your blood to be used for further analysis?
If you are willing to participate please sign your name below.
I ................................................................ agree to take part in the above research study.

177
I am aware that all information will be kept confidential in line with the Data Protection
Act and that I can withdraw at any time.
Signed......................................................................
Date..........................................................................
Should you have any questions about this research project please contact Alaa Qadhi on
this E-mail [email protected]

178
Pre-study Screening Questionnaire
A. Participant Section:
Background
Name:…………..…………………………………… Today’s date: ____/_____/_____
Address:…………………………………………………………………………………............
Telephone:………………………………………………………………………………………
1- Are you male or female?
(1) Male (2) Female
2- How old are you?
(1) Less than 18 (2) 18 - 24 (3) 25 -34 (4) 35 - 44 (5) 45 - 5 (6)
55-60 (7) 61 and over
Date of birth: ------/-------/--------
3- Are you currently?
(1) Single (2) Married (3) Divorced (4) Widowed
4- What is your ethnicity?
(1) Arab (2) Caucasian (3) African
(4) Indian subcontinent (5) Other. Please
specify…………………………….
5- Please circle the highest year of school completed:
(1) No schooling (2) Primary school (3) Secondary school (4) High
school (5) Diploma (6) Bachelor’s degree (7) Post-graduate degree
6- Are you currently?
(1) Student (2) Employed (3) Unemployed (4) Retired
7- Are you pregnant?
(1) Yes (2) No
8- Do you currently smoke cigarettes or any other tobacco products on a daily basis?
(1) Yes (2) No
9- Are you on a special diet?
(1) Yes (2) No If Yes Please specify:. . . . . . . . . . . . . . . . .
179
Medications
10- How long have you been diagnosed with type 2 diabetes?
(1) 1-2 years (2) 3-5 years (3) 6-8 years (4) over 8 years
11- Has either of your parents, or any of your brothers or sisters been diagnosed with
diabetes?
(1) Yes (2) No
12- Do you have any diabetic complications?
(1) Yes (2) No (3) Don’t know
If yes please give details of relevant diabetic complications:
(1) Nephropathy (2) Neuropathy (3) Diabetic
cateract
(4) Cardiovascular disease (5) Dyslipidemia (6) Retinopathy
Other:………………………………………………………………………………………
13- Do you have any of the following medical conditions? Circle every relevant condition.
(1) Renal failure (2) Gastrointestinal Malabsorption (e.g. Crohn’s disease,
Colitis)
(3) Parathyroid disease (4) Hypercalcaemia (5) Liver disease
14- Are you currently taking prescribed medications?
Name of Drug Dose How many times a day?
e.g. Metformin 1 tablet of 1g 2 times with meals
15- Do you take vitamin supplements?
(1) Yes (2) No
If yes, please specify type and brand
............................................................................................

180
16- Have you taken vitamin supplements 3 months prior to today’s date?
(1) No (2) Yes
If yes, please specify type and brand
……………………………………………………………
B. Researcher Section - Anthropometric Measurements
• Participant’s Height? ________________cm
• Participant’s Weight? ________________kg
• Calculated BMI ________________m2
• Current HbA1c ________________%
• Calcium level ________________mmol/l
• Date tested ____/_____/_____
Eligible Not eligible

181
Debriefing Questionnaire
C. Participant Section:
Background
Name: …………..…………………………………… Today’s date:
____/_____/_____
Address:
…………………………………………………………………………………...................
Telephone:
…………………………………………………………………………………………...
1- I know it must be difficult to take medications regularly. How often did you miss
taking the vitamin tablet?
(1) Once a week (2) twice a week (3) three or more times a week (4) never
took them
2- How many times did you forget to record your pill taking on the calendar?
(1) Once a week (2) twice a week (3) three or more times a week (4) never
recorded
3- Have you been prescribed any new medications since you started taking the
vitamin supplements, if so please specify?
(1) No (2) Yes
If yes, please specify
. . . . . . . . . . . . . . . . . . . . . . . . . . . . . . . . . . . . . . . . . . . . . . . . . . . . . . . . . . . . . . . . . . . . . . . . .
. . . . . . . . . . . . . . . . . . . . . . . . . . . . . . . . . . . . . . . . . . . . . . . . . . . . . . . . . . . . . . . . . . . . . . . . .
4- Have you stopped taking any prescribed medications since you started taking the
tablets?
(1) No (2) Yes
If yes, please explain
. . . . . . . . . . . . . . . . . . . . . . . . . . . . . . . . . . . . . . . . . . . . . . . . . . . . . . . . . . . . . . . . . . . . . . . . .
. . . . . . . . . . . . . . . . . . . . . . . . . . . . . . . . . . . . . . . . . . . . . . . . . . . . . . . . . . . . . . . . . . . . . . . . .
5- Have the doses of your medications changed since you started taking the tablets?
(1) No (2) Yes
If yes, please explain
. . . . . . . . . . . . . . . . . . . . . . . . . . . . . . . . . . . . . . . . . . . . . . . . . . . . . . . . . . . . . . . . . . . . . . . . .
. . . . . . . . . . . . . . . . . . . . . . . . . . . . . . . . . . . . . . . . . . . . . . . . . . . . . . . . . . . . . . . . . . . . . . . . .

182
6- Have you taken vitamin supplements other than those supplied during the study?
(1) No (2) Yes
If yes, please explain
. . . . . . . . . . . . . . . . . . . . . . . . . . . . . . . . . . . . . . . . . . . . . . . . . . . . . . . . . . . . . . . . . . . . . . . . .
. . . . . . . . . . . . . . . . . . . . . . . . . . . . . . . . . . . . . . . . . . . . . . . . . . . . . . . . . . . . . . . . . . . . . . . . .
7- Did you suffer from any of the following medical conditions in the last 16 weeks?
Circle every relevant condition.
(1) Renal failure (2) Gastrointestinal Malabsorption (e.g. Crohn’s disease, Colitis) (3)
Parathyroid disease (4) Hypercalcaemia (5) other, please specify . . . . . . . . . . . . . . . . . . . .
. . . . . . . . . . . . . . . . . . . . . . . . . . . . . . . . . . . . . . . . . . . . . . . . . . . . . . . . . . . . . . . . . . . . . . . . .
. . . . . . . . . . . . . . . . . . . . . . . . . . . . . . . . . . .
8- Are you pregnant?
(1) No (2) Yes
9- Did you start any special diets?
(1) No (2) Yes
If yes, please explain
. . . . . . . . . . . . . . . . . . . . . . . . . . . . . . . . . . . . . . . . . . . . . . . . . . . . . . . . . . . . . . . . . . . . . . . . .
. . . . . . . . . . . . .
10- Overall, how would you say the control of your diabetes has been over the last 16
weeks?
(1) Better than before (2) Worse than before (3) No change
11- Have you been diagnosed with any other conditions?
. . . . . . . . . . . . . . . . . . . . . . . . . . . . . . . . . . . . . . . . . . . . . . . . . . . . . . . . . . . . . . . . . . . . . . . . .
. . . . . . . . . . . . . . . . . . . . . . . . . . . . . . . . . . . . . . . . . . . . . . . . . . . . . . . . . . . . . . . . . . . . . . . . .
D. Researcher Section - Anthropometric Measurements
• Participant’s Height? ________________cm
• Participant’s Weight? ________________kg
• Calculated BMI ________________m2
• AGE reading ________________units
Participant number…………………………….
Checklist:

183
Questionnaire complete
Tablets returned
Calendar returned
Anthropometric measures
Blood sample taken
184

185
Pill Record
Name ……………………………………………
Participant number …………………………….
If you took the pill on a particular day please mark the appropriate box with a tick. If
you did not take a pill on a certain day please mark this with a cross.
Week Sunday Monday Tuesday Wednesday Thursday Friday Saturday
1
2
3
4
5
6
7
8
9
10
11
12
13
14
15
16

186
مشاركة 240استبيان لمرحلة المسح ل
................................................................... االسم: ....................... رقم الملف:
......................................................................................................... العنوان: .............................................................. الهاتف:
___/___/_____ تاريخ اليوم: ........................................ تاريخ الموعد:
العمر؟ -1 61( أكثر من 7) 60-55( 6) 54 – 45( بين 5)44-35( بين 4) 34-25( بين 3سنة ) 24-18( بين 2) سنة 18( دون 1)
---/----/----تاريخ الميالد: هل تعاني المريضة من السكري النوع الثاني؟-2 ( ال 2( نعم )1)
%________ الحالية السكري الهيموغلوبيننسبة 2م ________ مؤشر كتلة الجسم؟
سم________________ طول المشاركة؟ كجم ________________ لمشاركة؟وزن ا
mg/dL ___________ مستوى الكالسيوم
التالية؟ الطبية الحاالت من أي تعاني المريضة من هل-3 الكلوي الفشل (1)
(القولون والتهاب كرون مرض مثل)المعوي متصاصاال سوء (2)
والجار درقية الدرقية الغدة مرض (3)
الدم كالسيوم فرط (4)
الكبد أمراض (5) ومن أي تاريخ بدأت تناولها؟ هل تتناول المريضة مكمالت الفيتامينات؟ -4 ال( 2) نعم( 1)
تحديد يرجى بنعم، اإلجابة كانت إذا الفيتامين....................... نوع ية له..................التجار والعالمة هل تتناول المريضة فيتامين د؟ -5 ال( 2) عمن( 1)
تاريخ بدأ تناوله .................................. تحديد يرجى بنعم، اإلجابة كانت إذا
رقم المشاركة ............. غير مناسبة مناسبة

187
ورقة معلوماتهاد األكسدة لدى النساء على مستويات السكر في الدم وإج 3عنوان المشروع: أثر مكمالت فيتامين د
النوع الثاني السعوديات الالتي تعانين من من داء السكري
عزيزتنا المشاركةبجامعة التغذية فسيولوجيايقصد بهذه الورقة التي بين أيدينا موافِاتك بمعلومات عن المشروع المنفذ في إطار رسالة دكتوراة في مجال
معلومات قيمة عما إذا كانت مكمالت فيتامين د تساعد في التحكم في النمط الثاني من داء مانشستر متروبوليتان؛ حيث تطرح الدراسة السكري أم ال.
أدوات الدراسة: استبيانات •
أسبوًعا من بدايتها، ويستغرق كل استبيان منهما 16تشمل هذه الدراسة إجراء استبيانين؛ أحدهما في بداية الدراسة واآلخر بعد مرور دقائق الستكماله. 10-5حوالي
بيانات ذات صلة بالجسم •
.بدايتها أسبوًعا من 16ألغراض الدراسة ستخضعين لقياس وزنك وطولك ومحيط الورك في بداية الدراسة وكذلك بعد مرور
عينات الدم •
أسبوًعا من بدئها. 16يجرى فحص للدم قبل بدء الدراسة كجزء من البحث ويجرى نفس الفحص مجدًدا بعد مرور
مكمالت فيتامين د •
لتدوين األيام التي أسبوًعا، ومن ثم فإنِك ستحتاجين 16هذه الدراسة من المشاركات تناول قرًصا واحًدا يومًيا لمدة تتطلب تتناولين فيها المكمالت وما إذا انقطعِت عن استخدام أي مكمالت أخرى أم ال.
السرية وحماية البياناتعن إجابة بعض األسئلة المطروحة أو االنسحاب من الدراسة كلية في أي وقت كان نضمن لك سرية في حالة رغبِتك في االمتناع
معلوماِتك، فيما عدا بعض االقتباسات التي يمكن استخدامها بتصريح منك دون اإلفصاح عن هوية قائلها، فإذا كنِت راغبة في االحتفاظ يها عن هويتك، فسوف تعامل المعلومات التي تدلي بها لنا معاملة مصادر بسرية معلوماتك، دون هذه االقتباسات التي ال نفصح ف
البحث األساسية التي تضاف للكتب وأبحاث الشبكة والمعلومات التي يقدمها اآلخرون، فكافة المعلومات التي تدلين بها يجري التعامل هذه الدراسة، وال يظهر اسمك أو أي معلومات تعريف معها وفًقا لقانون حماية البيانات وال تستخدم ألي أغراض أخرى غير أغراض
شخصية أخرى في ورقة المشروع التي تطرحها هذه الدراسة، كما أنها لن تشمل أي بيانات للتعريف بعنوانك؛ حيث أنه من المسموح لفريق البحث وحده دون غيره اإلطالع على البيانات.عبر ذا كنت ترغبين في الحصول على أي معلومات إضافية بشأنها يرجى التواصلإذا كانت لديِك أي استفسارات تتصل بالدراسة أو إ
البريد اإللكتروني الموضح أسفله، نشكر لك تعاونك معنا في هذا المشروع.
stu.mmu.ac.uk@10997250االء حاتم قاضي البريد اإللكتروني:

188
نموذج الموافقة
هل اطلعت على ورقة المعلومات؟
هل تشعرين أنِك ملمة بموضوع المشروع؟
هل تعلمين أنه سيطلب منِك تعبئة استبيان عن تاريخك الطبي؟
هل تعرفين أنه سيؤخذ منك أربعة عينات دم؟
هل تعرفين أن هذه العينات ستخضع للتحليل؟
رفين أنه سيكون عليك تناول قرًصا واحًدا يومًيا؟هل تع
هل تعلمين أنه بإمكانك االنسحاب من الدراسة في أي وقت ترغبين في ذلك؟
هل ترحبين باستخدام عينة الدم الخاصة بك في مزيد من التحاليل؟
إذا كنِت ترغبين في المشاركة يرجى التوقيع باسمك أدناه.
............................. على المشاركة في الدراسة البحثية المذكورة أعاله.أوافق أنا وأقر بعلمي بالحفاظ على سرية كافة البيانات وفًقا لقانون حماية البيانات وبأنه بوسعي االنسحاب من الدراسة في
أي وقت أرغب فيه في ذلك. ..................التوقيع: ........................................
التاريخ: ..........................................................إذا كانت لديِك أي استفسارات بشأن مشروع هذا البحث يرجى التواصل مع االء قاضي عبر البريد اإللكتروني:

189
استبيان المقابلة األولى
خاص بالمشارك: -أ معلومات أساسية:
العنوان: ....... رقم المشاركة:.......االسم: .....................................................................................................................................................................
تاريخ اليوم: ___/___/_____ الهاتف: .............................................................. ( أنثى2) ذكر (1)هل أنت ذكر أم أنثى؟ -1 كم عمرك؟ -2 60-55( 6) 54 – 45( بين 5)44-35( بين 4) 34-25( بين 3سنة ) 24-18( بين 2) سنة 18( دون 1) 61( أكثر من 7)
---/----/----تاريخ الميالد: هل أنت؟ -3 ( أرملة4) ( مطلقة3) ( متزوجة2) ( عزباء1) ما هي الجنسية التي تحملينها؟ -4 ( غير سعودية2) ( سعودية1) برجاء وضع دائرة على أعلى شهادة دراسية حصلت عليها؟ -5( 5) ( شهادة الثانوية4( شهادة المتوسطة )3ة االبتدائية )( الشهاد2) ( لم التحق بالمدرسة1)
شهادة الدبلوم ( دراسات عليا7) ( شهادة البكالوريوس6) هل أنت؟ -6 ( متقاعدة4) ( ال تعملين 3) ( موظفة2) ( طالبة1) هل أنِت حامل؟ -7 ( ال2) ( نعم1) التبغ يومًيا؟ هل تدخنين في الوقت الحالي أو تستخدمين أحد منتجات -8 ( ال2) ( نعم1) هل تتبعين حمية غذائية خاصة؟ -9إذا كانت اإلجابة بنعم يرجى تحديد الحمية الغذائية المتبعة ( ال2) ( نعم1)
........................ أسئلة طبية ودوائية
منذ متى جرى تشخيص حالتك على أنها حالة داء السكري النوع الثاني؟ -10 8( أكثر من 4) سنوات 8-6( 3) سنوات 5-3( 2) سنتين –واحدة ( سنة1)
سنوات هل أصيب أحد والديك أو أحد إخوتك أو أخواتك بداء السكري؟ -11
( ال2) ( نعم1)

190
هل تعانين من أي مضاعفات لداء السكري؟ -12 ( ال أعلم3) ( ال2) ( نعم1)
م تفاصيل عن مضاعفات داء السكري التي تعاني منها:إذا كانت اإلجابة بنعم برجاء تقدي( إعتام عدسة العين الناتج عن اإلصابة 3) ( االعتالل العصبي2) ( اعتالل الكلى1)
بداء السكري ( اعتالل الشبكية6) )ارتفاع نسبة الدهون( دسليبيدميا( 5) ( أمراض القلب واألوعية الدموية4)
مضاعفات أخرى: ....................................................................................................
بصفة عامة، كيف تصفين حالة داء السكري لديك؟ -13 ( لم تتغير3) ( أسوأ من ذي قبل2) ( أفضل من ذي قبل1)
ي منها:تعان حالة كل على دائرةضع التالية؟ الطبية الحاالت من أي تعانين من هل -14
(القولون والتهاب كرون مرض مثل) المعوي متصاصاال سوء( 2 الكلوي الفشل( 1)والجار الدرقية الغدة مرض( 3)
درقية الكبد أمراض( 5) الدم كالسيوم فرط( 4)
هل تتناول حالًيا أي أدوية موصوفة لك؟ يمكنك استخدام هذه الصور للتعرف على األدوية -15
كم مرة في اليوم؟ ةالجرع اسم الدواء الطعام وجبات مع مرتين ، جرام1واحد، قرص الميتفورمين ،المثال سبيل على
الفيتامينات؟هل تتناولين مكمالت -16 ال( 2) نعم( 1)
ية لهالتجار والعالمةالفيتامين نوع تحديد يرجى بنعم، اإلجابة كانت إذا
؟اليوم تاريخ من أشهر 3 قبل الفيتامينات تناولت هل -17 نعم( 2) ال( 1)
ية لهالتجار والعالمةالفيتامين نوع تحديد يرجى بنعم، اإلجابة كانت إذا الجسم قياسات –ة خاص بالباحث -ب
سم________________طول المشاركة؟ • 2م ________حساب مؤشر كتلة الجسم • %________الحالية السكري الهيموغلوبيننسبة •
تاريخ االختبار ____/_____/______
رقم المشاركة ............. غير مناسبة مناسبة
________________ ؟ةوزن المشارك •
كجم mg/dL ___________مستوى الكالسيوم •
________________ ؟ةوزن المشارك •
كجم
191
استبيان المعلومات للمرحلة الثانية
)المقابلة الثانية( خاص بالمشاركة: -أ
معلومات أساسية
رقم المشاركة:................ االسم:........................................................ ....................العنوان:......................................................................................................
الهاتف:............................................................ تاريخ اليوم: ....../....../.......... ات التي لم تتناولين فيها أقراص مر عدد ال كم ،بانتظام األدوية تناول الصعب من نحن نعلم أنه -1
الفيتامين؟ مرات أو أكثر في 3( 3) رتان في األسبوع( م2) ( مرة في األسبوع1)
األسبوع ( لم أتناولها مطلًقا4)
كم عدد المرات التي لم تتذكرين فيها تسجيل تناول أقراص الدواء الخاص بك في المفكرة؟ -2مرات أو أكثر في 3( 3) ( مرتان في األسبوع2) ( مرة في األسبوع1)
األسبوع ( لم أسجلها مطلًقا4)
،كذلك األمر كان وإذا الفيتامينات، في تناول مكمالت بدأت أن منذلك جديدة أدوية أي وصف تم هل -3 ؟األدوية الموصوفة تحديد يرجى
( نعم2) ( ال 1) تحديدال يرجى بنعم، اإلجابة كانت إذا
..........................................................................................................................................................................................................................
.......................................... هل توقفتين عن تناول أية أدوية موصوفة منذ أن بدأتين في تناول األقراص؟ -4 ( نعم2) ( ال1)
إذا كانت اإلجابة نعم، يرجى التوضيح .............................................................................................................
.......................................................................................................................................................
هل تغيرت جرعات األدوية التي تتناوليها منذ أن بدأتين في تناول األقراص؟ -6 ( نعم2) ( ال1)
إذا كانت اإلجابة نعم، يرجى التوضيح

192
..........................................................................................................................................................................................................................
.......................................... هل تناولتين مكمالت فيتامين بخالف تلك المقَدمة أثناء الدراسة؟ -6 ( نعم2) ( ال1)
إذا كانت اإلجابة نعم، يرجى التوضيح..........................................................................................................................................................................................................................
.......................................... األخيرة؟ ضعي دائرة حول أي حالة تعاني 16هل عانيتي من أي من الحاالت الطبية التالية في األسابيع الـ -7
منها.( مرض الغدة الدرقية 3( سوء االمتصاص المعوي )مثل مرض كرون، والتهاب القولون( )2( الفشل الكلوي )1)( أمراض أخرى، يرجى 5وم الدم )( فرط كالسي4)
تحديدها...................................................................................................................................................................................................................
......... ................................ هل أنِت حامل؟ -8 ( نعم2) ( ال1) هل بدأتي أية ِحميات غذائية خاصة؟ -9 )نعم( ( ال1)
إذا كانت اإلجابة نعم، يرجى التوضيح.............................................................................................................
.......................................................................................................................................................
بصفة عامة، كيف تصفين حالة داء السكري خالل -10 األخيرة؟ 16األسابيع الـ
من ذي قبل( أسوأ 2) ( أفضل من ذي قبل1) ( لم تتغير3)
هل هناك تشخيص ألي حاالت أخرى لديكي؟ -11..........................................................
................................................... ..........................................................
...................................................
قياسات الجسم -خاص بالباحث -ب
كجم ________________ ؟ةوزن المشارك •
كجم ________________ ؟ةوزن المشارك •
كجم ________________ ؟ةوزن المشارك •
كجم ________________ ؟ةوزن المشارك •

193
سم________________طول المشاركة؟ • 2م ________حساب مؤشر كتلة الجسم • _____________ AGEs ال معدل •
...................................رقم المشاركة جعة:قائمة المرا
االستبيانإكمال إعادة األقراص
إعادة الجدول قياسات الجسم أخذ عينة دم