the effect on federal spending of legislation creating a
TRANSCRIPT

Authors:
Henry Grabowski Professor of Economics and Director of the Program in Pharmaceuticals and Health Economics Duke University [email protected] Iain Cockburn Professor of Finance and Economics Boston University [email protected] Genia Long Vice President Analysis Group, Inc. [email protected] Richard Mortimer Vice President Analysis Group, Inc. Scott Johnson Associate Analysis Group, Inc.
The Effect on Federal Spending of Legislation Creating a Regulatory Framework for Follow-on Biologics: Key Issues and Assumptions
White Paper August, 2007

Page 1
Executive Summary
Legislative proposals to create an expedited pathway for review of follow-on biologic drugs (“FOBs”; also called biosimilars) have generated much debate about potential cost savings, with estimates of federal budget savings over ten years of $3.6 to $14.1 billion.
This very broad range reflects substantial uncertainty about a number of critical assumptions underlying such forecasts, and policymakers should therefore proceed cautiously in assessing the potential impacts of legislation establishing an expedited pathway for FOBs.
Direct empirical evidence of rates of market share uptake and price effects due to FOBs is limited to a few recent approvals in Europe. This paper reviews currently available data on the factors that will drive pricing and utilization of FOB products and provides an economics-based perspective on these questions. In addition to data from that limited European experience, we also draw on lessons from the U.S. experience with: generic drug competition with complex small molecule products that display some key economic similarities to biologics; branded competition between products in the human growth hormone market; and market performance and competition between first generation and next-generation products in the erythropoietin stimulating agent and granulocyte-colony stimulating factor product markets.
We conclude that:
• The magnitude of the federal budgetary impact of proposed legislation is highly uncertain, as is the speed with which cost savings will be realized.
• Estimates of federal savings are very sensitive not only to the specific legislative language that emerges, but also to a range of critical assumptions about scientific, regulatory, and clinical issues, the nature of competition in markets for specific biologics, as well as future intellectual property protection, and related litigation and the development of case law.
• All of these factors are highly uncertain, and any one of them could have a substantial impact on the magnitude of potential federal savings and the speed with which they are realized.
• As a result, best available evidence and straightforward economic analysis indicates that cost savings are likely to lie at or below the lower end of the range of estimates currently before Congress.
Aggregate cost savings will reflect the impact of an expedited approval process on both prices and utilization of each affected reference biologic product. While there is considerable heterogeneity among these innovator biologics, a number of critical factors can be identified that will drive these market outcomes:
• The timing of patent expiry for these products, the nature of their intellectual property protection (more complex and more uncertain than for traditional small molecule drugs), and the associated litigation and emerging case law (assumed to permit FOB entry by

Page 2
2013 to 2017 for the largest categories of federal spending on biologics approved under the Public Health Service Act)
• The time required to develop an FDA regulatory scheme, testing requirements, or product-class guidelines following passage of any legislation (two to six years, varying by therapeutic area and on the regulatory guidance approach selected by FDA)
• The time required for manufacturers to obtain regulatory approval (three to five years for pre-clinical and clinical testing, and one-and-a-half to two years for FDA review and approval) and to bring manufacturing capacity on-line (four to six years, likely developed concurrently with product development schedule)
• The evolution of utilization of currently approved biologics, driven by:
– Demographics, disease incidence, medical practice, and regulatory and reimbursement practice
– The pace and extent of uptake of next generation patent-protected products in markets where FOBs have entered (limiting longer-term uptake of FOBs in markets with unmet medical need)
• The nature of the competitive model in markets for biologics that experience entry by FOBs (likely to be driven by the marketing of branded, proprietary products rather than the “commodity” competition based on price alone seen among generic small molecule generic drugs), and its effect on:
– The pace and extent of uptake of follow-on products for currently marketed branded products (likely slower and less extensive than for many small-molecule drugs, or 10 to 45% FOB share)
– The price impact of entry by follow-on products (limited discounts of 10 to 30% off brand)
Because shorter-term budgetary savings must be balanced against longer-term interests in protecting innovation incentives in the biotech industry, we urge a cautious approach in developing and implementing a legislative framework for an expedited approval pathway for follow-on biologics. Just as the Hatch-Waxman Act fundamentally reshaped competition, pricing, and innovation for “conventional” small molecule drugs in 1984, Congressional action on a regulatory framework for follow-on biologics will have far-reaching implications, resetting the competitive and market landscape in the dynamic biotechnology industry for years to come. These changes have the potential to result in significant long-term economic realignment in the biotech and pharmaceutical industries.
Though outcomes are highly uncertain, budget savings are likely to be much smaller than suggested by some advocates. Therefore, we also urge a cautious approach in interpreting estimates of the federal budgetary impact of any regulatory framework for expedited review and approval of follow-on biologics.

Page 3
1. Introduction and Context
In 1984, the Hatch-Waxman Act created a legislative framework for the expedited approval by the FDA of generic versions of drugs regulated under the Food, Drug and Cosmetic Act of 1938 (“FD&C Act”), greatly facilitating generic drug approvals and contributing to the tremendous growth of the generic drug industry. This expedited approval process does not extend to biologics approved under the Public Health Service Act (“PHS Act biologics”), where there is no such legislative authority. Several legislative proposals under consideration currently would establish an expedited pathway for the approval of follow-on biologics (“FOBs”) for PHS Act biologics.1
There has been much debate about the likely impact on the federal budget of these or similar proposals, with estimates ranging from total federal savings over a standard ten-year scoring period of $3.6 billion (Avalere Health) to $14.1 billion (Engel & Novitt). Representatives from Express Scripts presented an estimate of $71 billion for savings to all payers, private and public.2 Earlier estimates by Express Scripts and Engel & Novitt did not distinguish between the two types of biologics (FD&C Act biologics, which would be unaffected by the proposed legislation, and PHS Act biologics), and did not take into consideration the delay associated with new regulatory action required, intellectual property protection for on-market biologics, or the likely timing of market entry, and therefore overestimated the likely savings during the next ten years due to the legislative proposals under consideration. The later estimate by Avalere Health took these factors into consideration, and as a result arrived at a significantly lower figure.
The wide range of these estimates reflects substantial uncertainty about key assumptions and parameter values that underlie any such forecast, suggesting that policymakers should be cautious in assessing the potential impacts of legislation that establishes an expedited pathway for FOBs. The objective of this paper is to provide additional insight and perspective to policy-makers that can be used in assessing the impact on federal spending of such legislation, specifically by reviewing and summarizing the best available empirical evidence for key assumptions in an appropriate economic framework. While we do not compute a specific estimate of the budgetary impact of such legislation, this review strongly suggests that it is likely to fall in the low end of the current range of estimates presented to Congress.
In this paper we summarize the best available evidence for each of the assumptions required to estimate the budgetary impact of an expedited pathway for approval of FOBs, focusing
1 H.R. 6257/S. 4016, H.R. 1956, S. 1505, H.R. 1038, S. 623. 2 A Ahlstrom, R King, R Brown, J Glaudemans, D Mendelson, “Modeling Federal Cost Savings from Follow-on Biologics,” Avalere Health LLC, April 2007; Engel & Novitt, LLP, “Potential Savings That Might Be Realized by the Medicare Program from Enactment of Legislation Such As The Access to Life-Saving Medicine Act (H.R. 6257/S. 4016) That Establishes a New cBLA Pathway for Follow-on Biologics,’ Pharmaceutical Care Management Associates, January 2007; S Miller and J Houts, “Potential Savings of Biogenerics in the United States,” Express Scripts (February 2007).

Page 4
particularly on possible rates of uptake of FOBs for corresponding innovator branded biologics, as this key assumption has received less attention to-date. Estimates of federal savings are very sensitive not only to the specific legislative language that emerges, but also to a number of scientific, regulatory, clinical, market behavior, intellectual property protection, and litigation-related assumptions, all of which are uncertain, and any one of which could have a substantial impact on both the timing and magnitude of potential federal savings.
Direct empirical market evidence of share and price effects due to FOBs is limited. There are two recent examples in Europe, where two human growth hormone follow-on products have been approved, Sandoz’s Omnitrope and Biopartner’s Valtropin. Initial uptake has been limited, with Omnitrope accounting for only roughly a 1% share of the market thus far.3,4 To supplement this evidence of the effects of expedited FOB entry in Europe, we review empirical evidence and market results from situations with some analogous characteristics in the U.S. that provide indirect evidence for key estimation parameters:
• Generic entry and price-based competition in the case of more complex small molecule drugs that exhibit some features that suggest they are closer to biologics than are other drugs; and
• Branded competition in the human growth hormone market.
Beyond these examples, we also examine market performance and competition by next-generation products in the erythropoetin stimulating agent (“ESA”)5 and granulocyte-colony stimulating factor (“G-CSF”) markets in order to review potential longer-run implications for FOB products which will compete both against their first generation reference products, and against successive generations of products which may offer additional clinical, patient convenience, or economic benefits. We use the term “biosimilar competition” in this paper to refer to the competition between an FOB product and its reference biologic, as distinguished from competition between both of these products (i.e., an FOB product and its reference product) and future entrants which may offer additional features and benefits.
For conventional drugs with more complex characteristics we find that rates of generic uptake and generic to brand price ratios were significantly lower than for non-complex generics. These figures were generally on the order of 60% of the corresponding indicators for non-complex drugs, measured twelve months after generic entry, or a mean generic share of 45% measured
3 Market share as reported in A Ahlstrom, R King, R Brown, J Glaudemans, D Mendelson, “Modeling Federal Cost Savings from Follow-on Biologics,” Avalere Health LLC, June 2007. 4 ‘“Sales are developing with a slow uptake… there needs to be a lot of education and training for doctors and patients,” says a Sandoz spokesperson.’ G. Kamath, “Sticker shock: Biotech copycats are discovering the real cost of going West. And it is not cheap.” http://www.businessworld.in/content/view/1394/1451/ (most recently accessed June 19, 2007). 5 We use the term “ESA” in this paper to refer to both epoetin alfa and darbepoetin alfa products. Elsewhere these products are also commonly referred to separately as EPO, for epoetin alfa products, and DARB, for darbepoetin alfa products.

Page 5
one year after generic entry (the lowest figure was only 9% for the most complex drug in the sample). This should be viewed as an upper bound estimate for the potential share impact of FOB entry for two reasons: even more complex conventional drugs may not be as complex as biologics; and because generic entrants face a more favorable set of economic incentives for uptake due to their ratings of therapeutic interchangeability (generally an AB rating) and their distribution through retail pharmacies.
For human growth hormones, we find the branded competition model employed is associated with essentially no change in average Medicaid reimbursement per prescription measures over the fifteen-year period 1991-2006.6
For erythropoetin and granulocyte-colony stimulating factor, we observe that dynamic competition in the form of next-generation products has a significant impact on the sales of first generation products, which have been flat over the 2000-2006 period.
This paper reviews the likely universe of projected federal expenditures on PHS Act biologics over the next ten years (the “baseline”), applying to it a framework that incorporates the following key parameters:
• Timing considerations:
– Time required for development and promulgation of an FDA regulatory scheme following passage of any legislation
– Timing of patent expiry and the impact of intellectual property protections
– Timing of FOB market entry
• FOB uptake and average price effects:
– Degree of FOB uptake and market share
– Extent of average price effects generated by FOB entry.
With regard to timing, the first U.S. FOB entry is likely to follow the passage of legislation (assumed to be effective in 2008) by a number of years, due to: delays in developing regulations and resolving scientific issues; the expiration of complex intellectual property protection for innovator biologics; the development and regulatory approval times for FOBs, dependent on FDA requirements for establishing similarity, safety and efficacy through pre-clinical testing and clinical trials; and the need to build, license or secure manufacturing capacity. While a number of these developments will proceed in tandem, nevertheless it will likely be a number of years before significant FOB entry is likely to occur. In particular, FOB entry is problematic prior to 2013 for two of the largest categories of federal PHS Act spending (ESAs and G-CSF) due to intellectual property protections.
6 Tev-Tropin has adopted a price-based competitive strategy with significant reductions below other products; over two years post-launch it has failed to capture more than one percent of the market. As a result of its small share, Tev-Tropin has had virtually no effect on the average level of Medicaid reimbursements per prescription for human growth hormone products.

Page 6
The extent of entry will likely be much lower for FOBs than for conventional generic drugs, reflecting differences in market size and high fixed costs of entry for many biologics. Average price effects and rates of FOB uptake for innovator products are likely to be limited in the short run due to the low number and timing of entry of FOBs, limitations to perceived substitutability between innovator biologics and FOBs on the part of physicians and patients, incentives for limited price-based competition between FOBs and innovator products, and the lack of structural features of the distribution system that currently limit the rapid diffusion of generic drugs. Given the history of rapid advances for biological products, over the longer-term, dynamic competition with patent-protected next generation protein products is expected to be a more significant force than biosimilar competition between FOBs and existing original innovator products in the therapeutic areas with significant unmet medical need. Next generation biologics are expected to bring valued clinical, patient convenience, or economic benefits to the market, but will reduce the market for the first generation products that FOBs substitute for, limiting federal savings.
While a product-by-product assessment of savings is most appropriate because federal spending is concentrated on a relatively small number of products, and there are varying circumstances in each market, an aggregate view of savings is consistent with the approach used by the Congressional Budget Office (“CBO”) and is adopted here. In order to populate this aggregate view with an appropriate set of assumptions, it is necessary to:
(1) project federal spending on PHS Act biologics over the bill scoring time frame, by year
(2) appropriately netting out growth due to dynamic competition over time in the form of new-branded entrants with additional features and benefits that will reduce the market for the reference innovator biologic and the associated FOB
(3) identify the likely timing of FOB entry following passage of the bill, given regulatory, intellectual property/patent, and product development and application delays
(4) identify the average price discounts that might be expected from an FOB entrant, and
(5) determine what share of the reference innovator biologics the FOB is likely to capture

Page 7
These considerations can be reflected in an equation of the following form:
itititt
itproductsalli
ShareFOBDiscountFOBEntryFOBicbioPHSonSpendingFederalFuture
SavingsFederal
×××
=
∑ ∑= ∈
2017
2008
log
Where Future Federal Spending on PHS biologic is the projected federal spending on product i (a PHS Act biologic) in year t, appropriately netting out growth due to dynamic competition over time in the form of new-branded entrants with additional features and benefits that will reduce the market for the reference innovator biologic; FOB Entry is equal to 1 if there is at least one FOB entrant for product i in year t and zero otherwise; FOB Discount is the average price discount offered by FOB entrants for product i in year t; and FOB Share is the total FOB share of the reference innovator biologic product i that the FOB captures in year t.
There is considerable uncertainty surrounding these critical parameters. Federal savings from an expedited approval pathway for FOBs are therefore difficult to assess with any precision. We do not present a specific dollar estimate of likely federal budgetary savings over the next ten years, but, based on our review of the best available empirical evidence, we conclude that savings are likely to be significantly limited by delays in FOB entry, modest expected FOB price discounts, and limited FOB shares of the relevant markets. Over the longer run, dynamic competition with successive generations of branded products which may offer additional clinical, patient convenience, or economic benefits in therapeutic categories with unmet need will reduce the share of the market subject to FOB uptake.
These considerations suggest that federal budgetary savings over a ten year standard scoring period are likely to be limited, falling at or below the lower end of the range of estimates presented to Congress. In addition, given that careful consideration should be given not only to short-term budget savings but also to the appropriate balance between these benefits from enhanced price competition and longer-term interests in protecting innovation incentives in the biotech industry, caution is therefore warranted in both developing and implementing a legislative framework for an expedited approval pathway for FOBs.

Page 8
SUMMARY OF KEY PARAMETERS AFFECTING THE LEVEL OF FEDERAL SAVINGS DUE TO FOBs
Key Parameter Estimate Estimate Based On:
(1) Future Federal Spending On PHS Act Biologics
- 2005 Federal Spending on PHS Act biologics
2005 Medicare Part B on PHS Act biologics: $4.3 billion 2005 ESRD program spending on ESAs:$2.0 billion
• 2005 Medicare Part B spending for PHS Act biologics among top 200 HCPCs (approximately 85% of biologics spending was for PHS Act biologics)
• GAO report of ESRD spending on ESAs
- Annual Increases in Spending (Taking effects of competition with next generation products into consideration)
0% to 10% average annual increase in spending on first generation top biologics in Part B program from 2003 to 2005 Competition from next-generation entrants may limit growth of first-generation biologics (the likely targets of FOB entry)
• Average annual increase 2003-05 for older generation Part B biologics (13% decrease for ESAs and 15% increase for G-CSF)
(2) Time to first FOB Entry 2013 or later
- Establish FDA Testing Requirements or Guidelines
2 to 6 years May vary by therapeutic area and depends on regulatory guidance approach selected by FDA
• Hatch-Waxman and EMEA experience • Some generics approved prior to
issuance of final Hatch-Waxman regulations
• Potential for moratorium to allow time for FDA to develop product-class guidances or testing requirements
- Patent Expiration
2013 to 2017 for the largest categories of federal PHS Act biologic spending
• Reported ESA and G-CSF patent expirations
- Drug Development/ Approval
3 to 5 years for pre-clinical and clinical testing 1.5 to 2 years for FDA
• Estimated development times in EMEA • 4 to 6 years required for new owned
manufacturing capacity (likely developed

Page 9
application review and approval Likely to require additional FDA resources and/or organizational realignment
concurrently with product development schedule)
• Historical BLA approval times (18 months) and EMEA approval times for FOBs (2 years)
• Phase III average duration of 33 months, average approval phase time of 16 months for a sample of biologics (innovator study duration would be an upper bound for FOB required phase III studies)
(3) FOB Price Discount 10% to 30% off brand
• Analysis of hGH • Analysis of complex conventional
generics • Reported Omnitrope pricing
(4) FOB Share *
- Short-Term FOB Share of Reference Biologic
- Longer-Term Dynamic Competition and Entry of Next-Generation Products
10% to 45% Limits FOB Market Potential
• Analysis of hGH • Analysis of complex conventional
generics • Aranesp captured 11% of the ESA
market within a year and 40% within four years; Neulasta captured 50% of the G-CSF market within a year and 70% within four years
* The share for FOB entrants is measured as the share of prescriptions of the reference biologic achieved by the FOB.

Page 10
2. Outline of this Document
The remainder of this document is organized as follows:
• Section 3 provides a brief summary of the U.S. regulation of biologics and the relevant regulatory context for the expedited approval of follow-on biologics
• Section 4 discusses a range of estimates of projected baseline federal expenditures on PHS Act biologics over the next ten years
• Section 5 outlines factors affecting the possible timing of FOB entry
• Section 6 identifies characteristics affecting price discounts generated by FOB entry, and the degree of FOB penetration and market share
• Section 7 describes empirical analyses undertaken to estimate the extent of price discounts and FOB penetration, including analyses based on small molecule generic entry and analysis based on biologic entry in selected therapeutic areas
• Section 8 summarizes our conclusions
• Appendix A contains a table of new biopharmaceutical products approved between 1980 and 2005, with the regulatory process noted (whether approved under the PHS or FD&C Act)

Page 11
3. Background: U.S. Regulation of Biologics
A. STATUTORY FRAMEWORKS FOR DRUGS AND BIOLOGICAL PRODUCTS
Currently, there are two different regulatory paths to market for biologics. While the PHS Act clearly covers certain products specifically enumerated such as blood products and vaccines, manufacturers of other biologics may have applied for market entry under the FD&C Act (under which drugs are regulated). For example, human growth hormone (“hGH”), insulin, menotropin hormone, conjugated estrogen, urokinase enzyme, and enzymes used to treat Gaucher’s disease were all approved under the FD&C Act. These products would be unaffected by the proposed legislation, which would apply to PHS Act biologics only. PHS Act biologics include epoeitin stimulating agents (“ESA”) Epogen, Procrit and Aranesp (for anemia related to cancer therapy or chronic kidney disease), granulocyte stimulating factors (“G-CSF”) such as Neupogen and Neulasta (for inadequate white blood cell production due to cancer or other causes), interferons, and monoclonal antibodies such as Herceptin (for cancer), Enbrel, Remicade and Humira (for rheumatoid arthritis and other immunological disorders).
Under the FD&C Act, new innovator drugs apply for market entry through the New Drug Application (“NDA”) process under Section 505(b)(1).7 In 1984, the Drug Price Competition and Patent Term Restoration Act (known informally as the Hatch-Waxman Act), established a well-defined abbreviated pathway for the approval of generic versions of existing innovator drugs approved under the FD&C Act for whom patents are not otherwise a bar to entry. Under Hatch-Waxman, the Abbreviated New Drug Application (“ANDA”) approval process provides that generic applicants may rely on safety and efficacy data submitted by an innovator drug and need demonstrate only bioequivalence.
Manufacturers can in some cases also apply under an alternative abbreviated NDA pathway under Section 505(b)(2), in which the FDA can rely on data from an existing comparable product when considering a new application from the same or a different manufacturer. The FDA relied on this pathway in its recent approval of Sandoz’s Omnitrope application, which had the effect of approving an additional, non-therapeutically equivalent (non AB-rated) branded agent. The FDA has narrowly circumscribed the conditions under which it would consider applications under the Section 505(b)(2) pathway to those proteins that are less complex and whose mechanisms are well understood and characterized.8 This specification includes hGH products
7 21 U.S.C. 321 (g)(1) <http://www4.law.cornell.edu/uscode/21/321.html - accessed on July 6, 2007>. The FD&C Act defines drugs as: “(A) articles intended for use in the diagnosis, cure, mitigation, treatment, or prevention of disease in man …” and/or “(B) articles (other than food) intended to affect the structure or any function of the body of man ….”. 8 Omnitrope (somnatropin [rDNA origin]) Questions and Answers. May 30, 2006 <http://www.fda.gov/cder/drug/infopage/somatropin/qa.htm - accessed March 30, 2007>.

Page 12
and would encompass other more simple biologics with NDA approvals such as insulins, but likely rules out more complex biologics.
Under the PHS Act, biologics are approved for market entry through a Biologic License Application (“BLA”).9 The majority of biologics applied under the PHS Act. The PHS Act currently provides no abbreviated pathway for the approval process. Instead, all biologics under the PHS Act, including follow-on versions, must file a BLA and undertake all required efficacy and safety clinical trials for such approval. Current proposed legislation aims to create such an abbreviated pathway, and the potential effect of such a pathway for FOB approval of PHS Act biologics on federal spending is the focus of this paper, as well as other recent estimates.
B. DIFFERENCES BETWEEN DRUGS AND BIOLOGICS
In recent years, entry of bioequivalent generics for small molecule, chemically synthesized drugs, (“conventional drugs”) has resulted in substantial generic penetration and average price effects for the molecules in question. Recent examples of generic entry for conventional drugs are unlikely to present an accurate prediction of what may occur should a legislative framework be established for expedited approval of FOBs, however, due to fundamental differences between the two types of compounds:
• Conventional drugs, small molecules produced through chemical synthesis, are typically synthetic organic compounds having well-defined structures and physical and chemical characteristics. Researchers can generally assume the products’ activities based on the similarity of overall chemical structures to those of other compounds and can assess safety based on standard short- and long-term toxicology studies.
• In contrast, biologics are large molecule products, often proteins, sometimes with significant glycosylation (i.e., chains of sugar molecules attached), which are either composed of, or are extracted from, living organisms. As a result, they are heterogeneous mixtures. Macromolecular by nature, determining their physiochemical characteristics is far more complex, leading them to be less well defined. They are generally immunogenic (i.e., provoking an immune response and the formation of antibodies), but the associated clinical implications might range from negligible, to loss of effective response to the therapy over time, to serious and immediate clinical reaction. Toxicology studies may require novel approaches.10
These differences in turn lead to important differences in the economics of discovery, development, manufacturing, and distribution for drugs and biologics. Consequently, it is
9 42 U.S.C. 262 (i) <http://www4.law.cornell.edu/uscode/42/262.html - accessed June 25, 2007>. Biologics are defined as “any virus, serum, toxin, antitoxin, vaccine, blood, blood component or derivative, allergenic product or analogous product applicable to the prevention, treatment, or cure of diseases or injuries in man.” 10 Biologics Development: A Regulatory Overview. Third Edition. Edited by Mark Mathieu. PAREXEL International Corporation. 2004. pp. 10-1.

Page 13
necessary to take account of these unique attributes when assessing the impact of expedited FOB entry on federal spending.
These differing properties pose numerous challenges to approving follow-on biologic molecules for marketing, as well as to ensuring their safe and reliable manufacturing. Policy makers will undoubtedly consider first the implications these differences have for necessary safeguards to the public health, given the demonstrated risk with even small intra-firm variations in manufacturing processes.11,12 Given the complexity of these molecules, the FDA will consider, in each instance, whether existing analytical tools are sufficient to determine whether two products are bioequivalent: “There are unique scientific issues associated with follow-on biologics (as opposed to generic small-molecule drugs), including how to ensure safety and efficacy, how to measure sameness, and immunogenicity of products. There are additional market and public policy implications for specific types of products, such as vaccines and blood products. At present, the science does not exist to adequately protect patient safety and ensure product efficacy through an abbreviated follow-on pathway for all biologic products, and questions exist whether some products, such as vaccines or blood products, would ever lend themselves to such a pathway”and elsewhere in the same letter from Secretary of Health and Human Services Michael Levitt to Senator Kennedy, “(t)here is a spectrum of scientific complexity for protein products, from relatively simple peptides to large proteins with highly complex structures. Scientific understanding and technology (e.g., available analytical techniques) does not currently support the approval of larger and more complex protein products under an abbreviated process such as section 505(j) of the FDCA.”13 Because the quality, safety, and potency of biologics can be very sensitive to changes in manufacturing conditions, the FDA will need to consider these factors. As Dr. Janet Woodcock (2007), Chief Medical Officer of the FDA, emphasizes, “Even well-characterized, highly purified recombinant proteins may exhibit minor degrees of structural variability from lot to lot resulting from variants in the manufacturing process. The quality and nature of natural source products can vary depending on the condition of the source material, processes used to extract and purify the product and other factors.”14 Woodcock provides several examples of the case-by-case approach that the FDA has used in the past when evaluating
11 In 2002, Johnson & Johnson (J&J) made a change to its Eprex erythropoietin manufacturing processes to eliminate the use of human serum albumin due to concern by health authorities about the potential transmission of Creutzfeldt-Jakob disease. While the resultant product did not exhibit any detected differences from J&J’s original product some patients developed pure red blood cell aplasia, an immunologic response due to which red blood cells fail to develop. Patients’ bodies rejected both natural and recombinant erythropoietin, the lack of which leads to failure to develop red blood cells. The suspected cause of the problem was a minor formulation change and potential reaction with rubber stoppers. 12 Woodcock, J., Follow-on Protein Products, Statement before the Committee on Oversight and Government Reform, U.S. House of Representatives, March 26, 2007. 13 Letter from Secretary of Health and Human Services Michael O. Leavitt to The Honorable Edward M. Kennedy, Chairman, Committee on Health, Education, Labor and Pensions, United States Senate, June 26, 2007. 14 Ibid.

Page 14
follow-on and second-generation biologics, and illustrates the reliance and challenges to scientific reasoning when extrapolating findings from one biologic product to a similar one.15
The markets for biologics also differ substantially from small molecule, chemically synthesized drugs. The size of typical biologic product markets, capital structure and the importance of venture capital for early stage development programs, the structure of distribution systems, and economic incentives for substituting follow-on products for innovator products all differ from conditions in small molecule markets. Together, these differences will likely result in FOBs having a less significant impact on market outcomes than has been observed in the case of generic drugs.
15 Woodcock, J. “The FDA’s Assessment of Follow-on Protein Products: A Historical Perspective,” Nature Reviews Drug Discovery, 6: 437-442, June 2007.

Page 15
4. Baseline Federal Expenditures on PHS Act Biologics
A. CURRENT BASELINE: MEDICARE PART B FEDERAL SPENDING FOR PHS ACT BIOLOGICS
Total U.S. sales of biologics have been elsewhere estimated at $32 billion in 2005, whether funded by individual out-of-pocket, or federal, state and private third-party spending. This total includes spending on both FD&C Act and PHS Act biologics. Based on a review of allowable charges for the top 200 HCPCS codes, we estimate that approximately $5.0 billion of this total represented spending under the Part B program on biologics, $4.3 billion of which was for PHS
Key Assumptions:
Projected Federal Spending on PHS Act Biologics* Estimate Based On:
• $4.3 billion in Part B PHS Act biologic spending in 2005
• 2005 Medicare Part B spending for PHS Act biologics among top 200 HCPCs (approximately 85% of biologics spending was for PHS Act biologics)
• $2.0 billion in ESRD spending on ESAs in 2005
• GAO report of ESRD spending on erythopoetin stimulating agents (ESAs)
• 0% to 10% annual increase in spending on first generation top biologics in Part B program
• Average annual increase 2003-05 for older generation Part B biologics (13% decrease for ESAs and 15% increase for G-CSF)
• Spending growth on first generation products may be limited or negative due to dynamic competition with successive generations of new products
* Excludes Veterans Administration/Department of Defense purchases, federal portion of Medicaid program spending on PHS Act biologics.

Page 16
Act biologics, or approximately 85% of the total. This figure corresponds with other estimates of the portion of total spending on biologics associated with PHS Act biologics.16 Another $2.0 billion was spent by the end stage renal disease (“ESRD”) program on Epogen, Amgen’s erythropoietin stimulating agent.17,18 These figures represent the majority of federal spending, but exclude Veterans Administration/Department of Defense purchases, the federal portion of Medicaid program spending on PHS Act biologics, and Part D federal payments for self-injectable biologics. They also excludes PHS Act biologics with less than $20 million in 2005 Medicare Part B reimbursements; these smaller drugs are less likely to be targets of FOB entry due to their limited market size.
Care must be given in any calculation of savings to the federal budget not to “double count” savings already anticipated from other proposals. In this case, a change to the current ESRD reimbursement system in which payment for drugs such as Epogen are separately billed to one in which reimbursement would be bundled with all other ESRD services is also under active consideration and development. One anticipated outcome of this proposal is to reduce spending on separately billed drugs. Because specific details on the contents of the bundle, its implementation, and the structure of periodic adjustments to its reimbursement level over time are unavailable, we focus here instead on the implications of FOBs for the Part B program. To the extent that FOB entry provides additional savings to the ESRD program above and beyond that resulting from transition to a bundled payment system, focusing solely on savings to the Part B program would underestimate federal savings from FOB entry.
A list of biologics and whether they entered the market under the PHS or FD&C Act appears in Appendix A.
B. PROJECTED FUTURE INCREASES IN BASELINE FEDERAL SPENDING FOR PHS ACT BIOLOGICS
Increases in spending on PHS biologics over this baseline figure will reflect increases in both average prices and utilization, for both existing and for new products. While increases in sales for the entire category of biologics have recently totaled 20%19, these increases reflect price and utilization effects from both existing products and new entrants. As calculated in Section 7, all of the growth between 2001 and 2006 in sales of erythropoietin stimulating agents and
16 See, for instance, the estimate by Ahlstrom et al. that 86% of total spending on biologics from 2005 IMS data for all payers is due to products for which there is not currently an abbreviated application pathway. 17 United States Government Accountability Office, “Report to the Chairman, Committee on Ways and Means, House of Representatives. End-Stage Renal Disease: Bundling Medicare’s Payment for Drugs with Payment for All ESRD Services Would Promote Efficiency and Clinical Flexibility.” November 2006. Available on-line at: http://www.gao.gov/new.items/d0777.pdf. 18 This figure includes the 20% coinsurance due by beneficiaries. 19 IMS Health Inc., “IMS Reports U.S. Prescription Sales Jump 8.3 Percent in 2006, to $274.9 Billion.” March 8, 2007. Available on-line at: http://www.imshealth.com/ims/portal/front/articleC/0,2777,6599 3665 80415465,00.html. (accessed most recently June 20th,2007)

Page 17
granulocyte-colony stimulating factor biologics is due to next-generation products, with sales of first generation products remaining level or having declined. While there would be potential savings associated with future follow-on biologics for recent or new market entrants, these savings would accrue many years in the future, beyond the ten-year scoring window. A growth rate for existing, first generation biologics should be calculated in order to arrive at an appropriate adjusted baseline federal spending figure for those biologics that are likely to be the target of FOB entry during the scoring window.
Isolating the increases in spending just for existing products with patent protection that would be expiring over the next several years and therefore be the focus of FOB entry, the average annual increases between 2003 and 2005 vary:20
• a 6% increase for all erythropoietin stimulating agents reflects a 13% decline for first generation products Epogen and Procrit and a 36% increase for Aranesp21
• an average growth rate of 46% for combined first and second generation granulocyte-colony stimulating factors reflects a 15% increase for first generation product Neupogen and a 62% increase for second generation product Neulasta.22
Future savings are sensitive to the assumption selected for rates of future growth in the absence of a new regulatory pathway for PHS biologics, and to the level of future dynamic competition assumed. For example, assuming federal spending on PHS Act biologics of $4.3 billion in 2005, a 5% straight line annual growth rate yields forecast baseline federal spending of $5.0 billion in 2008, increasing to $7.8 billion in 2017. The corresponding figures are baseline federal spending of $5.7 billion in 2008, increasing to $13.5 billion in 2017 if one assumes a 10 percent straight line annual growth rate. Logistic “S” curve patterns of growth are generally preferred for longer term projections, however, and should also be considered.
C. MEDICARE PART B SPENDING FOR TOP PHS BIOLOGICS
Table 1 summarizes Part B reimbursements for top biologics (i.e., all those biologics appearing in the top 200 HCPCs codes). In addition to 2005 reimbursement totals for these biologics, two factors affecting the timing of FOB market entry are also included. The assumed dates of patent expiration, where readily available, are listed. We also present a proxy measure for the complexity of the task of establishing comparability and therefore whether the biologic may be
20 Monoclonal antibodies (for whom data for both years are available) experienced growth of 12% 21 Future federal spending growth on ESAs may be reduced by new Medicare coverage and reimbursement policies for ESA products. CMS has begun a national coverage review that could restrict the list of indications that are covered under the program. To the extent that CMS finalizes a decision that significantly restricts coverage, the pool of potential savings from FOBs would also be correspondingly reduced. 22 Federal spending on combined first and second generation G-CSF products increased 12% between 2004 and 2005, but a very high growth rate in pegfilgrastim (Neupogen) federal spending between 2003 and 2004 drives up the overall G-CSF growth rate estimate for 2003 to 2005.

Page 18
subject to earlier, rather than later, entry by indicating whether a product-specific annex guideline has already been issued by the European Medicines Agency (“EMEA”). If EMEA guidance has not been issued, indicating greater scientific and regulatory complexity in establishing comparability for those biologics, FOB entry is likely to occur later.
The existence of EMEA guidance has been a useful indicator for successful FOB applications in Europe. Manufacturers may submit an application to EMEA without the existence of a product-specific annex, but so far FOB approvals have been limited to areas with product-specific annexes. In addition to its approval of two applications for FOBs for human growth hormones (somatropin and valtropin), EMEA rejected an application by BioPartners for its interferon-alpha product, a therapeutic area for which a product-specific annex had not been issued (one is now under development). Erythropoetin stimulating agents and granulocyte-colony stimulating factor are the only classes of PHS biologics for which EMEA has already established product-specific annex guidelines. Recently, the advisory committee to the EMEA has recommended approval of Novartis’s FOB application for erythopoetin alfa, referencing Eprex.23,24 In addition to serving as a measure of the complexity of the scientific and regulatory task involved in review of a manufacturer’s application, it may be the case that, depending on the reference product selected, some of the trials conducted for EMEA applications may be accepted in a U.S. application.25 The issues relating to the timing of FOB market entry are discussed in the following section.
23 Three related applications, for Binocrit from Sandoz, Epoetin alfa from Hexal, and Abseamed from Medice Arzneimittel Puetter, were recommended for approval. Sandoz and Hexal are Novartis subsidiaries and Medice arzneimittel Puetter is a Novartis licensing partner. 24 “Committee for Medicinal Products for Human Use June 2007 Plenary Meeting Monthly Report,” EMEA/267656/2007, 29 June 2007, <http://www.emea.europa.eu/pdfs/human/press/pr/26765607en.pdf> accessed June 29, 2007. Hirschler, B. “Update 2-EU Experts back Novartis Biosimilar Anemia Drug,” Reuters, June 22, 2007, <http://yahoo.reuters.com/news/articlebusiness.aspx?type=health&storyid=nL22860315&WTmodLoc=HybArt-R2-IndustryNews-3&from=business>, accessed June 29, 2007. Eprex is an epoietin alfa product distributed by Johnson & Johnson in Europe. 25 Based on the number of patients and duration of clinical trials submitted by Sandoz in both the FDA and EMEA applications for its human growth hormone Omnitrope, the same trials may have been relied upon in both approvals.

Page 19
Table 1: 2005 Medicare Part B Spending on PHS Act Biologics
CAGR Patent EMEATherapeutic Area Description 2005 2004 2003 2003-2005 Expiration Guidance
EPO Aranesp (Darbepoetin alfa) $962 $911 $523 36% 2016
EPO Procrit and Epogen (Epoetin alpha) $772 $984 $1,017 -13% 2013
MAB Rituxan (Rituximab) $761 $595 $570 16%
MAB Remicade (Infliximab) $539 $544 $487 5%
G-CSF Neulasta (Pegfilgrastim) $523 $504 $200 62% 2017
MAB Avastin (Bevacizumab) $282 not ranked not ranked NA
G-CSF Neupogen (Filgrastim) $159 $106 $120 15% 2013-2015
MAB Herceptin (Trastuzumab) $125 $95 $88 19%
MAB Erbitux (Cetuximab) $112 not ranked not ranked NA
Other Botox (Botulinum toxin a) $65 $56 $53 11%
Interferon Intron A (Alfa-2b interferon) $21 $30 $33 -20% Expired
Interferon Avonex (Beta-1a interferon) $20 $21 $12 29% Expired
$4,341 $3,846 $3,103 18%EPO All EPO $1,734 $1,895 $1,540 6% 2013-2016
G-CSF All G-CSF $682 $610 $320 46% 2013-2017MAB All MABs with complete data
(2003 to 2005)$1,425 $1,234 $1,145 12%
Total PHS Act Biologics
Allowed Charges (in millions)
Notes: • Procrit and Epogen are first generation ESA biologics, with Aranesp being a next-generation product.
Similarly, Neupogen is a first generation G-CSF biologic, with Neulasta being a next-generation product. • Data are allowed charges for reimbursed physician services for the 200 most expensive level II HCPCS
codes including all products, supplies, and services not included in the physician service reimbursement (i.e., CPT) codes, which encompass all biologics covered under Medicare Part B, excluding drugs for end stage renal disease. Source: http://www.cms.hhs.gov/MedicareFeeforSvcPartsAB/04_MedicareUtilizationforPartB.asp, accessed June 6, 2007.

Page 20
5. Timing of Follow-on Biologic Entry
Even after passage of legislation creating an abbreviated approval pathway for FOBs under the PHS Act, it will likely be a number of years before the first FOB market entry based on that pathway. Prior to market entry of a specific follow-on biologic, a number of additional steps must occur, including:
• Development and promulgation of an FDA regulatory scheme
• Expiration of patent protection for an innovator product
• Development, required pre-clinical testing and clinical trials, manufacturing scale-up, and FDA review/approval
While a number of these developments will proceed in tandem, nevertheless, it will likely be a number of years before significant FOB entry is likely to occur.
A. DEVELOPMENT OF FDA REGULATORY FRAMEWORK
Key Assumptions:
Development and promulgation of FDA regulations Estimate Based On:
• 2 to 6 years
May vary by therapeutic area and depends on regulatory guidance approach selected by FDA
• Likelihood of FDA case-by-case approach26
• Other FDA regulatory development examples from non-biologics: 4 years from passage of Hatch-Waxman Act to final FDA regulations (although some drugs approved prior to issuance of final regulations)
• 4 to 6 years for issuance of overarching EMEA guidelines and product-specific annexes for insulin, somatropin, G-CSF, ESAs
• Potential for two to five year moratorium in some proposals to allow time for FDA to develop guidance27
26 See discussion in J Woodcock, et al., “The FDA’s assessment of follow-on protein products: a historical perspective,” Nature Reviews Drug Discovery 6:, 437-442. June 2007. 27 Senator Kennedy staff discussion draft, as reported in K Cacciatore et al., “Nothing Generic About Generic Biologics,” Cowen and Company. June 2007.

Page 21
There would likely be a significant period of time required following passage of legislation establishing an abbreviated pathway for FOB entry until the finalization of regulatory guidelines establishing the required procedures for FOB review and approval. The timing of FDA regulation development and promulgation, and the impact of this timing on FOB entry, may vary by therapeutic area and depends on a number of factors, including: whether or not the FDA elects to adopt an overarching set of regulatory guidances supplemented by product-specific annexes, as is the case in Europe, or review applications on a case-by-case basis without such regulatory structure, whether FOB manufacturers wait for regulations to be in place before submitting applications, and whether a moratorium on such applications or similar provision is included in legislation. It is possible that such a framework would follow a similar path as adopted by the EMEA, which first developed general overarching guidance, then developed specific guidance for a limited number of biologic product areas and case-by-case reviews. Alternatively, the FDA could elect to follow a “case law” approach which is developed through reviewing and responding to specific individual manufacturer applications.
This period could range from 2 years (optimistic) to 6 years (pessimistic), depending on the specific approach adopted by the FDA (i.e., whether a case-by-case approach similar to that adopted for Europe by EMEA), the scope of the therapeutic areas for which guidelines are initially developed (product-specific annexes have been issued for insulins, somatropin/human growth hormone, growth colony stimulating factor, and erythropoietin stimulating agents, in Europe), and the legal and scientific issues that were identified but not resolved during the FDA’s public hearing process. In a June 26, 2007 letter to Senator Kennedy, Secretary of Health and Human Services Michael Leavitt advocates for a “guidance approach”:
“The Administration believes that the legislation should be amended to require a predictable and public product-class guidance process prior to acting on any follow-on applications. It should ensure that FDA receives expert and public scientific and technical advice, but should include flexibility for FDA to adjust the process to meet its scientific needs with respect to data requirements and other matters. This guidance process would signal to stakeholders which product classes FDA considers appropriate for follow-on applications and data elements that might allow review and approval of a follow-on product. Such a process will ensure the agency has optimum information regarding safety and efficacy considerations for follow-on products; enhance transparency of decision-making; establish a level-playing field for all follow-on applicants; and encourage follow-on applications by describing Agency expectations for application content.”28
We assume that even after four years, there would be a number of biologic therapeutic areas where specific guidelines would not have been developed or the scientific and regulatory issues
28 Letter from Secretary of Health and Human Services Michael O. Leavitt to The Honorable Edward M. Kennedy, Chairman, Committee on Health, Education, Labor and Pensions, United States Senate, June 26, 2007.

Page 22
fully resolved, given the complex and contentious issues involved. In some biologic therapeutic areas, there may be some FOB manufacturers willing to undertake drug development and testing “at risk”, in advance of FDA regulations being promulgated. In these areas, development and pre-clinical and clinical testing may proceed in tandem with the development and promulgation of regulations or guidance documents, although there may be few manufacturers with sufficient tolerance for risk to pursue this route given the magnitude of clinical testing investments potentially involved. In the case of generic entry under the ANDA procedures established by Hatch-Waxman, several firms submitted applications to the FDA and received approval prior to the issuance of specific regulations, one notable example being for diazepam (Valium).29
In the past, development of general guidance for similar regulatory frameworks both in the US and Europe has taken four to five years. In the US, approximately four years passed from the passage of the Hatch-Waxman Act to the issuance of the first set of specific regulations that allowed for imitator entry.30 In Europe, the EMEA published its first overarching guidance in October 2005, four years after beginning an analysis in 2001. This was followed by further clarifications of the general clinical, non-clinical and quality issues for biosimilars, as well as product-specific guidelines for hGH, insulin, ESAs, and G-CSF in June of 2006. As of 2007 (six years following passage of legislation), EMEA guidance is restricted to these four therapeutic areas (guidance for interferon-alpha is under development).
Of these four areas, only ESAs and G-CSF are PHS Act biologics; hGH and insulin biologics received FDA approval under the FD&C Act and would be unaffected by the proposed legislation.31 The experience gained in Europe in developing guidelines and in reviewing FOB applications may inform the FDA’s review, but the FDA may be likely to adopt a case-by-case evaluation of the requirements for clinical studies establishing the safety and efficacy of FOBs for the U.S. Woodcock notes with respect to evaluating the scientific issues of determining safety and efficacy of FOB products, next generation innovator biologics, and changes in the manufacturing process for innovator biologics, “The FDA has addressed the scientific challenges
29 H.G. Grabowski and J.M. Vernon, “Brand Loyalty, Entry, and Price Competition in Pharmaceuticals After the 1984 Drug Act,” Journal of Law and Economics 35 (1992): 331-350. 30 The FDA published regulations pertaining to the Hatch-Waxman Act on March 7, 1988 – 21 C.F.R. Part 60, < http://www.accessdata.fda.gov/scripts/cdrh/cfdocs/cfcfr/CFRSearch.cfm?CFRPart=60> accessed June 26, 2007. 31 Biologics approved under the FD&C Act would not be affected by legislation establishing an abbreviated pathway for FOB approval of PHS Act biologics, and should not be included in the calculation of potential federal savings from such legislation. Abbreviated pathways for biologics approved under the FD&C Act under sections 505(j) and 505(b)(2) already exist. We have assumed, consistent with the position advocated by Secretary Leavitt in a June 26, 2007 letter to Senator Kennedy, that there would be no ex post transfer of authority for products (such as insulins) currently regulated under section 505 of the FD&C Act to section 351 of the PHS Act. If such a provision is included in legislation, but is not effective for ten years following enactment, any effects would be beyond the standard ten year scoring window. Further, unless any new pathway resulted in lower costs and barriers to entry than the existing pathways, no savings would be associated with the legislation even beyond the scoring window.

Page 23
presented by these types of evaluations on a case-by-case basis.”32 This suggests that the FDA is likely to evaluate future FOB applications on a case-by-case basis as well.
B. TIMING OF EFFECTIVE PATENT EXPIRATION
Key Assumptions:
Expiration of patent protection Estimate Based On:
• Epoetin and Procrit – 2013 to 2015
• Expiration of U.S. process (2012), product claims (2013), pharmaceutical compositions (2013), production cell (2015) patents33
• G-CSF – 2013 to 2017
• Expiration of Amgen U.S. patents: claimed sequence – 2013 pegylated versions – 2017 method of preparation – 2015 method of treatment – 2013
Even once an FDA regulatory framework is in place, FOB entry will face delays because many biologics will continue to be protected by existing patents. The patent estate is generally more complicated for a biologic than a conventional drug. In addition to patents on the compound, the composition, and the method of treatment such as those that protect conventional drugs, biologics may also be protected by patents on the research and manufacturing tools used (e.g., host cells, expression systems, process of making), with the potential for multiple such manufacturing process patents, as well as component patents, for a single biologic.34 In addition, the data generated during clinical trials may be proprietary, and trade secrets with respect to the manufacturing of some biologics may further limit FOB entry even after effective patent protection has expired. Finally, the ownership of intellectual property rights may be much more complex, particularly for upstream methods and tools, with universities, individuals, and firms all having some relevant patent rights. Changes in the intellectual property environment due to evolving case law and new legislation are possible, which could have a significant impact on FOB entry and therefore on potential federal savings.
32 J. Woodcock, “The FDA’s Assessment of Follow-on Protein Products: A Historical Perspective,” Nature Reviews Drug Discovery 6: 437-442. June 2007. 33 U.S. Patent Office, as summarized by K Cacciatore et al., “Nothing Generic About Generic Biologics,” Cowen and Company report, June 2007. 34 J. Kushan, presentation to American Enterprise Institute, June 11, 2007. Available on-line at: http://www.aei.org/events/eventID.1535,filter.all/event_detail.asp (last accessed June 20, 2007).

Page 24
In line with several security analysts, we have assumed for purposes of analysis that Epoetin and Procrit (two of the largest PHS Act biologics in terms of federal spending) will be protected in the U.S. by patents on the compound until 2013, precluding U.S. FOB applications for approval until that time.35 Although some key European patents and the U.S. patent for DNA and host cells expired in 2004, there are other patents on the compound that would extend the effective U.S. patent life of Epoetin and Procrit to 2013.36 Security analysts also indicate that the next generation darberythropoietin biologic Aranesp (Epoetin and Procrit are first generation ESAs) is protected in the U.S. by patents until 2016.37 There is uncertainty around this assumption, and litigation is likely. In addition, the ability of potential entrants to “invent around” existing methods patents in order to bring FOBs to market is unknown.
G-CSF drugs similarly have U.S. patent protection till at least 2013 and possibly extending till 2017 for some versions. For Amgen’s G-CSF drugs, U.S. patents on sequence, method of preparation, and method of treatment extend to 2015, and patents for the pegylated versions extend further to 2017. These assumptions are also subject to uncertainty around whether the patents are likely to hold, or may be invented around to permit entry without infringement. The specific patent situation for each significant biologic will differ and need to be evaluated individually in order to accurately assess potential federal savings due to the legislative proposals under consideration.
35 K Cacciatore et al., “Nothing Generic About Generic Biologics,” Cowen and Company report, June 2007. 36 Interviews with pharmaceutical company representatives. 37 K Cacciatore et al., “Nothing Generic About Generic Biologics,” Cowen and Company report, June 2007.

Page 25
C. TIMING OF DRUG DEVELOPMENT, PRE-CLINICAL TESTING, CLINICAL TRIALS, MANUFACTURING SCALE-UP, AND FDA REVIEW / APPROVAL
Key Assumptions:
Development, required pre-clinical testing and clinical trials, manufacturing scale-up, and FDA review/approval Estimate Based On:
• 3 to 5 years for development, pre-clinical testing and clinical trials
• Estimated development times in EMEA: 1-2 years for cell biology, 1 year for process/analytics, 2-4 years for clinical trials38
• Historic drug development times (DiMasi, 2003)
• DiMasi and Grabowski (2007) Phase III average duration of 33 months for a sample of biologics39
• 3 (contracted) to 7 (in-house, more complex new construction) years for manufacturing capacity development (whether owned or contracted)
• Estimated cell culture facility development times40
• 1.5 to 2 years for marketing application review and approval
• Historic drug approval times of 18 months (DiMasi, 2003)
• Average approval phase time of 16 months for a sample of biologics (DiMasi and Grabowski, 2007)
• EMEA experience of approximately 2 years for Omnitrope and Valtropin
38 E. Schafer, CEO BioGeneriX “Opportunities for FOBs in Europe – A Risk Benefit Analysis with EPO” (Presentation at the Institute for International Research Follow-on Biologics forum, Washington, D.C., April 2005). 39 J.A. DiMasi and H.G. Grabowski, “The Cost of Biopharmaceutical R&D: Is Biotech Different?” Managerial and Decision Economics, June 2007. 40 Interviews with manufacturing consultants and biotech companies summarized in K Cacciatore et al., “Nothing Generic About Generic Biologics,” Cowen and Company report, June 2007.

Page 26
Following the development of FDA guidelines and once patent protection is no longer effective for a specific branded innovator biologic, an FOB manufacturer will still need to complete required pre-clinical testing and clinical trials of the drug, secure approvable manufacturing capacity for the drug, and obtain FDA approval of its application for the FOB prior to market entry.
As opposed to the case for generic drugs, where only approximately $1-2 million in cost and only approximately two years are necessary to demonstrate bioequivalence41, FOB development and trials will likely take 3 to 5 years, and obtaining FDA approval another one and a half to two years. Obtaining approvable manufacturing capacity may take 3 to 7 years, depending on whether the facility will rely on bacterial fermentation or mammalian cell lines, and whether the manufacturer has existing experience or partnerships in place. Some of these activities can be pursued in parallel, particularly the development or securing of manufacturing capacity. As a result, these delays should not be interpreted as additive.42 We have assumed that any FOB legislation will contain a “Safe Harbor” provision allowing for FOB drug and manufacturing development to begin prior to patent expiration for the innovator drug. Lack of experience on both the part of manufacturers and the FDA will likely result in longer development and approval times for the first potential FOBs to come to market, which then may decrease over time, all other factors being equal.
1. Clinical Trials and Approval for FOBs
We assume that, given concerns around establishing true bioequivalence between innovator drugs and FOB applicants, and the potential for immunogenicity, clinical trials will be required for all PHS Act biologics. We anticipate that the extent of clinical trials for FOBs required by the FDA will vary by therapeutic area, and that those therapeutic areas requiring more extensive trials will experience greater delays to entry.
a) EMEA Experience
As a benchmark, EMEA product-specific annexes present pre-clinical and clinical testing requirements that increase with increasing molecular complexity:43
41 H. Grabowski, “Patents and New Product Development in the Pharmaceutical and Biotechnology Industries,” Georgetown Public Policy Review 8, no. 2 (2003): 7-24. 42 It is unknown whether the FDA could allow FOB manufacturers to rely on trials already undertaken for approval in other jurisdictions with reference products relevant to the U.S., thereby expediting their FDA approval process. 43 EMEA product-specific annexes, as summarized by Citigroup “A Global ‘Generics Biologic’ Guidebook,” November 6, 2006.

Page 27
• Insulin: Comparative in vitro bioassays; no in vivo pharmacodynamics study; no clinical efficacy studies needed; 6 month comparative immunogenicity study; pharmacovigilance program
• Somatropin (human growth hormone): Comparative in vitro bioassays; at least one in vivo pharmacodynamic rodent study; one randomized clinical efficacy study needed; 12 month immunogenicity study; pharmacovigilance program
• G-CSF: Comparative in vitro bioassays; at least one in vivo pharmacodynamic rodent study; at least one two- or three-arm clinical efficacy study needed; immunogenicity study with one year follow-up for chronic administration; pharmacovigilance program
• ESAs: Comparative in vitro bioassays; at least one in vivo pharmacodynamic rodent study; at least one randomized clinical efficacy studies needed (separate studies for pre-dialysis and dialysis patients, and for subcutaneous and IV administration); 12 month immunogenicity study; pharmacovigilance program
G-CSF and ESAs have the greatest requirements placed on them by EMEA guidelines and are also likely to face substantial requirements in an FDA regulatory framework, resulting in lengthy development and approval times.
Development times have been estimated in EMEA at a total of five to eight years, from beginning development to market approval: 44
• one to two years for cell biology
• one year for process/analytics
• two to four years for clinical trials
• one year for approval
Omnitrope’s application included several non-clinical tests, three clinical combined pharmacokinetic and pharmacodynamic studies, one Phase III comparative clinical efficacy study with 89 patients for 9 months (patients continue to be followed for up to 24 months), and one Phase III open label non-comparative clinical safety study with 51 patients for 12 months (study is still ongoing beyond the 12-month data submission). Actual approval times for Omnitrope and Valtropin were closer to two years.
44 E. Schafer, CEO BioGeneriX “Opportunities for FOBs in Europe – A Risk Benefit Analysis with EPO” (Presentation at the Institute for International Research Follow-on Biologics forum, Washington, D.C., April 2005).

Page 28
b) Innovator Biologic Experience
A recent analysis by DiMasi and Grabowski (2007) examined the R&D costs and times for a data set of recombinant proteins and monoclonal antibodies, and compared them to corresponding figures for development of new drugs (DiMasi et al., 2003), making appropriate adjustments for the difference in the time periods studied.45 The authors assembled drug-specific R&D cost and duration data by development phase for a sample of seventeen biologics, and integrated them with a larger database on transition probabilities and development times for new biologics. Mean development times for innovator biologics were longer than clinical development times for drugs (ninety-eight months versus ninety months). Clinical development and approval times for this sample of innovator biotech drugs and the larger sample of drugs are presented in Figure 1.
Of most interest are the average Phase II and Phase III development times:
• Average duration of the biotech innovator’s Phase II program was 29 months
• Average duration of a full Phase III program for biotech innovators were calculated to be 33 months (approximately the same as the corresponding figure for new drug development programs).
• The corresponding mean actual out-of-pocket cost figure was $96 million (Phase III) for an investigational biopharmaceutical compound.
While FOB applicants are unlikely to have to repeat the innovator’s full clinical testing investments, it is likely that some clinical testing will be required, varying with the complexity of the molecule at issue. Even if full Phase III trials of the same magnitude and duration are not required, abbreviated trials with a few hundred patients would still cost tens of millions of dollars and take several years to complete.
2. Timing of Development of Manufacturing Capacity
In addition to obtaining FDA approval, an FOB manufacturer will need to develop or secure manufacturing capacity to produce the biologic for market. Because biologics are inherently unstable, they are sensitive to even minute changes in manufacturing parameters such as temperature, pH, and pressure. As a result, manufacturing requires highly specialized assets and time-tested expertise. Firms may elect to develop in-house capacity or to partner with a contract manufacturing organization (CMO). The CMO market has increased over the years, reaching an estimated 66% of the more straightforward microbial manufacturing capacity and 25% of
45 J.A. DiMasi and H.G. Grabowski, “The Cost of Biopharmaceutical R&D: Is Biotech Different?” Managerial and Decision Economics, June 2007.

Page 29
mammalian cell manufacturing capacity.46 While contracted manufacturing reduces the level of capital investment required, it also reduces profit margins.
Estimates of the time and cost to develop new construction vary, but generally total at least $250 million, and potentially much higher, depending on the specific nature of the capacity required:
• Interviews with manufacturing consultants and biotech company representatives conducted by investment analysts peg the cost and timing of cell culture facilities at $250 to $300 million and approximately 5 to 7 years47
• A Deloitte Consulting report describes the costs of setting up a plant at typically about $400 million and models the expected time to build an average biologics plant for self-manufacture at 4 years 48
• Genentech describes costs ranging from $200 million to $800 million, with a timeline of 4 to 6 years49
• An industry director of biologics production describes the typical timeline for an antibody project new production facility as being over 4 years from design to start of production50
• Molowa described the timeline to develop a large scale mammalian cell culture manufacturing plant as taking 4 to 5 years and $250 to $400 million (2001 figures)51
For new construction, Molowa outlines the primary steps in the process of developing capacity and the average time to complete each step, for an overall total of 5 years (assuming some overlap across steps).
• Conceptual/preliminary engineering (1.5 years)
• Detailed engineering (1 year)
46 Citigroup report, “Lonza Group AG.” September 2005. 47 Interviews with manufacturing consultants and biotech companies summarized in K Cacciatore et al., “Nothing Generic About Generic Biologics,” Cowen and Company report, June 2007. 48 C Chao and J Lakshmikanthan, “For biologics production, contract manufacturing organizations can bring real economic benefits,” available online at: http://www.deloitte.com/dtt/article/0,1002,sid%253D2218%2526cid%253D123912,00.html (last accessed June 21, 2007). 49 “Genentech Manufacturing,” available online at: http://www.gene.com/gene/news/kits/corporate/pdf/manufacturing-backgrounder.pdf (last accessed June 21, 2007). 50 G Welch, “Regulatory and Economic Challenges in Biotechnology Manufacturing,” presentation, November 2003. 51 Molowa DT . 2001 The State of Biologics Manufacturing. JP Morgan Securities, February 16th.

Page 30
• Construction (2 years)
• Start-up and validation (1.25 years)
• Filing, plant inspection and regulatory review (1 year).
Welch (2003) alternately describes the steps as consisting of: design; construction; commissioning and validation; and start of production. He arrives at similar overall estimates for a typical timeline for a new antibody production facility of over 4 years. In the case of contracting for manufacturing capacity, Welch notes that a manufacturing strategy needs to be in place typically prior to Phase III studies, in order that registration batches and ultimate market launch material can be produced from the same facility. An additional challenge to potential FOB firms without existing biologics manufacturing capacity is that the market for biologics manufacturing is highly concentrated, either among a small number of CROs (microbial manufacturing) or a mix of in-house manufacturers and CROs (mammalian cell manufacturing). Potential FOB entrants without either existing capacity or close relationships with CROs may find it difficult to secure manufacturing capacity without expensive guarantees to lock in committed capacity in advance of demonstrated market demand for the product.
3. Timing of FDA Review and Approval of FOB Application
Standard FDA review times for innovator biologics are approximately 16 months on average (18.2 months for conventional drugs).52 EMEA review times for Omnitrope and Valtropin were each approximately two years. We anticipate that the initial FOB applications will take a comparable period of time for the FDA to review and reach an approval decision, or between one and a half and two years. Both firm and FDA reviewer inexperience with a new process, involving the review of complex molecules, with greater clinical risks and relatively new clinical requirements will result in longer review times. Over the long-term, review periods may decrease, all other factors being equal, depending on in-market actual clinical experience.
52 DiMasi, Joseph A., and Grabowski, Henry G. The Cost of Biopharmaceutical R&D: Is Biotech Different? Managerial and Decision Economics, June 2007.

Page 31
6. Follow-on Biologic Pricing and Rates of Uptake
Once FOB entry occurs, savings resulting from that entry will depend on: (1) FOB price discounts compared to the brand; (2) the level of uptake of the FOB product; and (3) dynamic competition over time in the therapeutic area with other branded products which may offer improved clinical and patient convenience benefits. Various factors will affect FOB pricing and share, including the number of FOB entrants in any given product market, the competitive model adopted by FOB manufacturers (i.e., whether primarily price-based, or based on product feature differentiation and brand value), and the behavior of other stakeholders and economic agents in a position to influence the rate of FOB uptake or level of price discount achieved.
FOB uptake assumptions over time involve a complex interaction between competition from biosimilars based on the rate of uptake of the FOB for the branded reference product in the short run, and dynamic competition considerations of the share that either the branded reference product or the FOB will achieve of all treatment in the therapeutic area. The latter includes the effect over time of successive generations of new therapies which may offer additional clinical, patient convenience, or economic benefits. Some dynamic competition effects may be triggered by FOB entry; innovators may respond to anticipated FOB entry by developing and releasing next generation products that supplant the use of the first generation biologics subject to FOB competition.
The main factors determining FOB pricing and share results for any biologic include:
• The extent of FOB entry, which affects both FOB price and share and is primarily determined by:
– Market size
– Fixed costs of entry
• Other factors affecting FOB price discounts:
– FOB product marketing and competitive strategy (i.e., whether primarily price-based or based on product feature differentiation and brand value)
• Other factors affecting FOB share:
– Physician, patient, and payer acceptance of FOB products as substitutes for the branded innovator product
– Dynamic competitive responses by innovator manufacturers
– Structure of the distribution system and set of economic incentives for FOB uptake
Page 32
This section includes a discussion of these issues and summary of relevant findings from the published literature. In the next section we present empirical evidence from two potential competitive model outcomes:
• a branded competition model (using observations from branded competition in the human growth hormone market); and
• a generic competition model (using data from generic entry and competition in the more complex conventional drugs that share some features with biologics).
A. EXTENT OF FOB ENTRY
Potential federal savings depend not only on FOB entry occurring, but also on the price discounts and level of uptake of the FOB for its branded counterpart that are achieved. Existing economic analyses of the conventional drug market find that the number of entrants is strongly related to both the generic price discount (i.e., the generic to brand price ratio) and the extent of generic share (i.e., the generic share of the molecule) and we expect that these relationship will also hold true for the biologics market.
For some biologics, the markets are too small and the expected fixed costs of entry too high to encourage any FOB entry. For larger market biologics, such as ESAs and G-CSF, the magnitude of potential development and clinical trial costs may constrain entry to only a few entrants. There is already some evidence in Europe that development programs in this area are undergoing some consolidation, as a result of the expected fixed costs of entry implied by the EMEA product-specific annex.53 There are currently only two approved FOB hGH entrants in Europe. In the U.S., five companies serve the bulk of the innovator hGH market (Genentech’s Nutropin and the older generation somatrem Protropin, Eli Lilly’s Humatrope, Novo Nordisk’s Norditropin, Pfizer’s Genotropin, and Serono Labs’s Saizen, Serostim and Zorbtive). Teva Pharmaceuticals’s somatropin product Tev-Tropin recently entered the market, but as of Q1 2006 has achieved negligible sales. Other FOB markets with less well-characterized proteins or smaller markets may see fewer entrants. The pace of FOB approvals in Europe may increase as regulators review additional FOB applications and as manufacturers are better able to anticipate what types of clinical trials will be required and design programs that will pass regulatory muster. The advisory committee to the EMEA has recently recommended approval of Sandoz’s FOB version of Eprex.54,55
53 See, for instance, analysis by PipelineReview.com at http://www.pipelinereview.com/pipeline_samples/biogenerics_bfm.pdf (most recently accessed June 14, 2007). 54 “Committee for Medicinal Products for Human Use Summary of Positive Opinion for Binocrit,” EMEA/CHMP/236267/2007, 21 June 2007, <http://www.emea.europa.eu/pdfs/human/opinion/23636707en.pdf> accessed June 26, 2007. 55 The recent recommendation of an expert panel for the EMEA in favor of approval of three FOBs whose reference product was the ESA Eprex were closely related applications – Sandoz and Hexal are Novartis subsidiaries and Medice Arzneimittel Puetter is a licensing partner of Sandoz. There is unlikely to be direct competition between these applicants, therefore.

Page 33
Two key factors affecting the extent of FOB entry are the potential market size and the fixed costs of entry. Saha, Grabowski, et al. (2006), Reiffen and Ward (2005), and Grabowski, Ridley, and Schulman (2007) all find that the number of entrants strongly determines both the generic price discount and the extent of generic share for conventional drugs.56 The sales and growth rate of sales for the innovator drug prior to FOB entry is generally a good measure of the potential market available to an FOB entrant. The fixed costs of entry can depend on many factors, but will likely be closely tied to the cost of obtaining manufacturing capacity and the extent of clinical trials that the FDA requires for FOB approval in each therapeutic area. Therapeutic areas requiring more extensive trials are likely to see lower levels of FOB entry, all other factors held equal.
1. Market Size
The speed of entry and number of FOB entrants for a specific biologic drug depends on the potential market size for FOB therapies in that category. Firms will only enter if expected revenues are sufficient to cover the fixed costs of entry, with an appropriate risk premium, as well as the variable costs of each unit sold after entry. Saha, Grabowski, et al. (2006) found that for conventional drugs, the level of brand sales prior to generic entry is a key determinant of the subsequent number of generic entrants.57 Reiffen and Ward (forthcoming) also found that the hypothetical market size was a major determinant of generic entry.58 A number of biologic markets are smaller than conventional drug markets and have higher fixed and variable costs, all of which will limit entry compared to conventional drugs. As is the case for conventional drugs, the sales distribution for biologics is highly skewed, with a few biologics accounting for a disproportionate share of sales and profits. In an analysis of thirty new biologics introduced between 1982 and 1994, Grabowski (2003) finds that the top 20% of biologics accounted for approximately 70% of 2002 sales.59 We expect these biologics to be the primary targets of FOB manufacturers.
Anecdotal evidence also supports this analytical conclusion. For example, STADA/Bioceuticals note that they abandoned an interferon-beta FOB development project because the “marketing opportunities do not justify the high expenditures for the completion of the project.”60
56 Saha, A., Grabowski, H., Birnbaum, H., and Greenberg, P., “Generic Competition in the U.S. Pharmaceutical Industry,” International Journal of the Economics of Business 13, no. 1 (2006): 15–38; Reiffen, D. and Ward, M., “‘Branded Generics’ as a Strategy to Limit Cannibalization of Pharmaceutical Markets,” Managerial and Decision Economics, (forthcoming); Grabowski, H., Ridley, D., and Schulmann, K., “Entry and Competition in Generic Biologics,” Managerial and Decision Economics (forthcoming). 57 Saha, A., Grabowski, H., Birnbaum, H., and Greenberg, P., “Generic Competition in the U.S. Pharmaceutical Industry,” International Journal of the Economics of Business 13, no. 1 (2006): 15–38 58 D. Reiffen and M. Ward, “‘Branded Generics’ as a Strategy to Limit Cannibalization of Pharmaceutical Markets,” Managerial and Decision Economics, (forthcoming). 59 Grabowski HG 2003. “Patents and New Product Development in the Pharmaceutical and Biotechnology Industries,” Georgetown Public Policy Review 8 (2): 7-24. 60 <http://www.stada.de/english/about/profile/leadership.asp>, accessed June 14, 2007.

Page 34
2. Fixed Costs of Entry
The fixed costs of developing an FOB drug and bringing it to market also strongly affects the number of likely FOB entrants for that biologic. The higher the fixed costs of entry for any given biologic, the fewer FOB manufacturers there are that will find it profitable to enter (for any given market size). Clinical trials will comprise a major component of these fixed FOB costs of entry and the extent of these trials and costs will depend on FDA requirements. For example, whether the FDA requires that an FOB demonstrate bioequivalence to the branded product and safety with limited trials, or more extensive phase III clinical trials, could mean a difference of tens of millions of dollars. Post market entry pharmacovigilance requirements can also be important forms of fixed costs, since provision for them may need to be made in advance of any market performance experience.
a. Biologic Drug Development Costs
DiMasi and Grabowski (2007) found total out-of-pocket R&D costs for a sample of new biologic introductions to be $198 million in the preclinical period, $361 million in the clinical testing period, for a total of $559 million.61 Taking into account opportunity costs, using a real cost of capital of 11.5%, overall capitalized costs for the representative new biological entity are $1.24 billion.62, 63 While the development costs for FOBs will be smaller than for new innovator biologicals, they are still likely to substantially exceed the estimate of $600,000 to $2,000,000 associated with the development of generic small-molecule drugs.64
Actual out-of-pocket phase III trial costs for the sample of innovator biotech drugs averaged $96 million for investigational biopharmaceutical compounds.65 While FOB applicants are unlikely to have to repeat the innovator’s full clinical testing investments, it is likely that some clinical testing will be required, varying with the complexity of the molecule at issue. Even if full Phase III trials of the same magnitude and duration are not required, abbreviated trials with a few hundred patients would still cost tens of millions of dollars and take several years to complete. 61 DiMasi, J. A. and Grabowski, H. G., “The Cost of Biopharmaceutical R&D: Is Biotech Different?” Managerial and Decision Economics (forthcoming). 62 Assuming a historical rate of inflation of 3 to 3.5%, the corresponding nominal cost of capital would be approximately 15%. The cost of capital estimate is based on a capital asset pricing model analysis for a small set of biotech firms with a history of profitability based on multiple marketed products. These companies also had an extensive portfolio of new biological product candidates over the period 1990-2003. (DiMasi and Grabowski, 2007) 63 Grossman, M. (2003) estimates that biotechnology firms without a marketed product but with one or more drug candidates in phase II or III trials have an average nominal cost of capital of 27.4%. He also estimates a nominal cost of capital for biotechnology firms with at least one drug approved have of 18.l7%. Grossmann, M. 2003. Entrepreneurship in Biotechnology, Physica-Verlag New York. 64 Reiffen, D. and Ward, M., “‘Branded Generics’ as a Strategy to Limit Cannibalization of Pharmaceutical Markets,” Managerial and Decision Economics, (forthcoming). 65 Grabowski, H., Ridley, D., and Schulmann, K., “Entry and Competition in Generic Biologics,” Managerial and Decision Economics (forthcoming); DiMasi JA and Grabowski HG. The Cost of Biopharmaceutical R&D: Is Biotech Different? Managerial and Decision Economics (forthcoming).

Page 35
Elsewhere, the cost of development, including abbreviated Phase III studies has been estimated at $30 to $50 million.66
Fixed costs will vary by therapeutic area, depend on the trials required, and be higher in the short-run due to firm inexperience. There will be costs to the firm due to learning, on both the part of the regulators and the firms submitting FOB applications, because of the uninsurable uncertainty in the regulatory process.
Even the relatively simple and well characterized human growth hormone Omnitrope was required to undertake substantial testing to gain EMEA approval, including: several non-clinical tests, three clinical combined pharmacokinetic and pharmacodynamic studies, one Phase III comparative clinical efficacy study with 89 patients for 9 months (patients continue to be followed for up to 24 months), and one Phase III open label non-comparative clinical safety study with 51 patients for 12 months (study is still ongoing beyond the 12-month data submission).67,68 Sandoz’s U.S. application for Omnitrope through the FD&C Act Section 505(b)(2) pathway reflected four multi-center phase III clinical trials demonstrating safety and efficacy.
b. Manufacturing and Other Costs
Additional costs that would need to be considered for any entry decision include the costs of building manufacturing facilities, variable costs, and the costs of post-marketing surveillance. A new manufacturing plant can take three to five years to build, and can cost $200 million to as high as $800 million, with most estimates ranging from $200 million to $450 million (see earlier discussion on delays to entry). In the alternative, contract manufacturing solutions can be sought, but come at the price of margin reductions and can present challenges to secure. Variable costs of manufacturing are higher for biologics due to higher input costs and higher costs of manufacturing in the biological versus conventional drug manufacturing process. Post marketing surveillance costs for FOBs may be substantial as well, considering the potential for significant side effects associated with even seemingly minimal modifications to a biologic.
66 Interviews with manufacturing consultants and biotech companies summarized in K Cacciatore et al., “Nothing Generic About Generic Biologics,” Cowen and Company report, June 2007. Earlier, Biogenerix estimated these costs at $20 to $80 million. E. Schafer, CEO BioGeneriX “Opportunities for FOBs in Europe – A Risk Benefit Analysis with EPO” (Presentation at the Institute for International Research Follow-on Biologics forum, Washington, D.C., April 2005). 67 Omnitrope European Public Assessment Report, http://www.emea.europa.eu/humandocs/PDFs/EPAR/Omnitrope/060706en6.pdf 68 A second Phase III safety study was required due to the initial batch of Omintrope used in the first study containing a high concentration of impurities causing 60 percent of the patients in that study to develop non-neutralizing antibodies to Omintrope (compared to 2 percent in the reference product). Wang, E. J. Jerman, P. Heldman, A. Swanson, ”A Global ’Generic Biologics’ Guidebook,” Citigroup Equity Research, November 6, 2006. This highlights some of the difficulties in manufacturing even a relatively simple biologic such as hGH.

Page 36
B. OTHER FACTORS AFFECTING FOB AVERAGE PRICE DISCOUNTS
As in the market for conventional drugs, average price discounts for FOBs are expected to reflect the number of FOB entrants, with greater numbers of entrants resulting in greater price reductions, but can also be influenced by other factors such as the strategy that the FOB manufacturer assumes in marketing the follow-on drug. Given the high fixed costs of development, non-negligible risks (regulatory risk, product liability risk, risk of protracted intellectual property litigation), and uncertain acceptance by physicians and patients, rather than compete solely on price, FOB manufacturers may have incentives to follow a branded competition model in order to fund the marketing and sales investments that may be necessary to maximize market success of the FOB product.
In that case, the FOB would be marketed in a similar manner to a branded biologic, potentially generating greater economic rents (and reflecting the fact that FOBs are unlikely to receive an A rating, reflecting therapeutic substitutability for the corresponding branded innovator product). The incentive to pursue a non-price competition strategy would increase with the level of safety and efficacy data required in the regulatory review process. Significant marketing and sales force investments may be needed in order to achieve acceptance among often brand-loyal specialist physicians, who often require more intensive and focused educational marketing spend than primary care physicians (although they are fewer in number). Margins will need to be sufficient to support higher levels of marketing spend (prices for generic conventional drugs, by contrast, do not need to support marketing, promotion, or sales force investments, as sales forces need only call on a small handful of major retail pharmacy chains and sales are driven by “demand pull” from payers and pharmacists rather than “marketing push” by manufacturers). Such marketing oriented, branded competition strategies are likely to result in limited reduction in the average price for the biologic therapy, depending on other factors, and therefore limited federal savings from FOB entry.
C. OTHER FACTORS AFFECTING FOB UPTAKE
Factors other than the extent of FOB entry that could substantially affect the level of uptake achieved by the FOB for the corresponding branded innovator product include two major hurdles that the FOB needs to overcome: (1) the need to convince often brand-loyal and time-pressed physicians and clinically vulnerable patients that the FOB is substitutable for the innovator biologic; and (2) the lack of a mature set of distribution system incentives favoring rapid and deep FOB uptake.
1. Physician, Patient, and Payer Acceptance
The level of FOB uptake will be strongly influenced by the degree to which physicians and patients accept the substitutability of innovator and FOB therapies and perceive them to be of equal safety and efficacy. Delays or limitations in physician use of FOBs due to lack of familiarity, and perceived or actual differences between the FOB and innovator drug, will be in part determined by the amount of clinical evidence establishing the FOB’s safety and efficacy.

Page 37
FOBs are unlikely to be rated as interchangeable with their branded innovator counterparts and switching studies may be required in order to demonstrate that FOBs have similar clinical results. Physician and patient comfort with “tried and true” products is unlikely to be matched at least initially by the FOB, which may be emphasized in innovator marketing messages.
If the FOB is required to complete significant phase III clinical trials and switching studies, then physicians and patients may be more willing to accept the FOB as a substitute for the innovator drug. However, extensive trials raise the fixed costs of FOB entry, reducing the number of FOBs entrants and raising price. Reduced FOB entry could result in lower FOB price discounts and limited federal savings from FOB entry.
2. Dynamic Competitive Responses by Innovator Manufacturers
The perceived substitutability of the FOB and innovator drug is likely also to be influenced by the marketing approach adopted by the follow-on manufacturer and the dynamic competitive behavior of the innovator and other manufacturers in the market (e.g., investment in differential messaging, and follow-on products which may offer value-added features and benefits by the innovator and other manufacturers). In addition to marketing responses to differentiate the existing innovator biologic from the FOB, competition within therapeutic classes is dynamic and products are subject to competition not just from FOBs, but also from new branded products with the same general mode of action but which may offer enhanced efficacy, safety, patient convenience, or economic features and benefits. The degree to which next generation products affect the rate of uptake or eventual share achieved by FOBs is a function, among other factors, of how significant these enhanced features and benefits are to clinicians, patients and payers, as compared with the features and benefits offered by the FOB reference product. All other factors being equal, if the next generation product offers only modest, incremental improvements in a therapeutic area with needs that are largely met, the expected impact of the next generation product on uptake of the FOB would be modest, and conversely, the expected impact of the FOB on uptake of the next generation product would be substantial. On the other hand, all other factors being equal, if the next generation product offers significant improvements in a therapeutic area with significant unmet need, the expected impact of the next generation product on uptake of the FOB would be substantial, and the expected impact of the FOB on uptake of the next generation product would be modest.
Innovator manufacturers will have incentives to invest in product improvements and next generation products that will increase consumer welfare, but will reduce FOB market shares. These next generation products are less likely to be priced at a discount to current on-market products. As a result of these two factors, federal savings may be limited.
The rate at which new drugs are subject to such competition has increased over time, with DiMasi and Paquette (2004) showing that the number of first-in-class drugs that do not face competition has declined strongly since the 1970s, reflecting a decline in the barriers to entry for new molecules within established classes. DiMasi and Paquette cite a number of structural

Page 38
factors for this phenomenon, including supply side factors such as enabling technological advances in basic biomedical research.69
3. Structure of the Distribution System and Economic Incentives for FOB Uptake
The rapid generic penetration for many conventional drugs that we observe today reflects a mature system of economic incentives encouraging generic substitution by pharmacists in the retail sales channel that took time to develop. “Autopilot” factors such as state generic substitution laws, higher retail pharmacy margins on generics than on branded products, and public and private insurer benefit structures (including higher copays or coinsurance on non-preferred drugs) all play an important role in the rapid generic substitution observed for many products today. FOBs are unlikely to be rated as fully therapeutically substitutable, and therefore FOB demand would not be driven to the same degree by these policies. This position is reflected in a letter from Secretary of Health and Human Services Michael Leavitt to Senator Kennedy:
“Because of the variability and complexity of protein molecules, current limitations of analytical methods, and the difficulties in manufacturing a consistent product, it is unlikely that, for most proteins, a manufacturer of a follow-on product could demonstrate that its product is identical to an already approved product. Technology is not yet sufficiently advanced to allow this type of comparison for more complex protein products … For many follow-on protein products, there is a known significant risk in repeatedly switching between products and a resulting negative impact on both patient safety and/or effectiveness. While there may be the possibility of determining interchangeability in the future, pharmacies or patients might substitute biological products determined to be biosimilar, but not determined to be interchangeable for one another, possibly resulting in serious injury or death. Therefore, in light of the current scientific limitations on the ability to make determinations of interchangeability, and because it is critical to protect patient safety, the Administration believes that patients should not be switched from the innovator biologic product to a follow-on biologic product (or vice versa) without the express consent and advice of the patient’s physician, and legislation should not allow for determinations of interchangeability at this time.” 70
Even if legislation allows for interchangeability, such a determination by the FDA would likely require patient crossover studies. The pathway to interchangeability would therefore be much more challenging than for generic drugs.71,72
69 DiMasi JA and Paquette c. 2004. ”The Economics of Follow-on Drug Resarch and Development,” PharmacoEconomics, Vol. 22, Suppl. 2, pp 1-14. 70 Letter from Secretary of Health and Human Services Michael O. Leavitt to The Honorable Edward M. Kennedy, Chairman, Committee on Health, Education, Labor and Pensions, United States Senate, June 26, 2007. 71 Proposed Biologics Price Competition and Innovation Act of 2007. 72 Remarks of Scott Gottlieb at AEI symposium “What Should Congress Do About Generic or Follow-On Biologic Drugs?”, Washington D.C., June 11, 2007. See also S. Gottlieb presentation at: http://www.aei.org/publications/pubID.25967,filter.all/pub_detail.asp.

Page 39
In addition, many biologics are currently managed as medical, rather than pharmacy, benefits in commercial third party insurance plans. As a result, the well-developed and often complex system of patient and provider economic incentives and requirements favoring generic substitution would not apply. From an expenditure management perspective, while biologic therapies might be significant as compared with pharmaceutical expenditures, they are much less significant in comparison with medical expenditure such as hospitalizations.
In some therapeutic areas, managed care controls may be limited by liability concerns, depending on the severity of the indication, the payer’s leverage over the specialty physicians administering the drug, and the perception of safety issues involved in substituting the innovator product for the FOB. The ability of the managed care organization to negotiate with manufacturers on price will be based on the applicability of the above, the level of physician outcry, and related concerns about safety and plan liability. To the degree that FOBs are not therapeutically equivalent and therefore not substitutable by retail pharmacists for the reference branded innovator product, the financial incentive due to higher retail pharmacy margins on generic than on branded drugs that help drive generic substitution in the case of conventional drugs will be muted. In many cases, retail pharmacies may not be involved in the distribution of biologics, although specialty pharmacy vendors may be a force for FOB uptake. However, as biologics represent a greater share of insurance plan spending, and as their management becomes integrated with the management of pharmacy budgets, public and private sector managed care payers will have an increasing interest in FOB uptake. Specialty drug tiers and coinsurance are emerging and may be applied in order to encourage FOB uptake.

Page 40
7. FOB Pricing and Uptake – Evidence
Key Assumptions:
FOB Price and Share Estimate Based On:
FOB Price Discount:
10% to 30% off brand
• Empirical analysis of generic entry for non-biologic drugs with complex characteristics
• Empirical analysis of Medicaid reimbursements for hGH (somatropin recombinant) biologics
• Reported Omnitrope pricing
Short-Term FOB Share of Reference Biologic:
10% to 45%
• Empirical analysis of generic entry for non-biologic drugs with complex characteristics
• Empirical analysis of Medicaid reimbursements for hGH (somatropin recombinant) biologics
Longer-Term Dynamic Competition and Entry of Next-Generation Products:
Limits FOB Market Potential
• Empirical analysis of next generation ESAs - Aranesp captured 11% of the ESA market within a year
and 40% within four years
• Empirical analysis of next generation G-CSF drugs - Neulasta captured 50% of the G-CSF market within a
year and 70% within four years
Both biosimilar and dynamic competition affect the actual level of uptake of an FOB for an innovator biologic product (and consequently the level of potential federal savings):
• Biosimilar competition effect: When FOB entry occurs, there will be some uptake of the FOB rather than the innovator product. Key considerations in the case of biologics beyond the level of price discount offered alone are the behavioral and structural barriers to uptake (e.g., physician and patient acceptance of substitutes, lack of economic incentives and mature systems for uptake).
• Dynamic competition effects: FOB products will not only compete with their reference innovator products, but also dynamically with next generation products which may offer additional features, offsetting short-term uptake effects to some degree. A large part of the growth in biologic spending is due to the introduction of next-generation products that target areas of unmet need. FOBs will compete with first generation products, and so the potential market for FOB use is likely to grow much more slowly than the overall biologic market.

Page 41
We review evidence relevant to both the FOB potential share of the reference product sales and dynamic market measures incorporating the impact of product improvements on FOB and reference product share of total therapy in a given therapeutic area. Federal savings are affected by both biosimilar and dynamic competition factors. For example, even in the case where an FOB captures a large share of the sales of the reference biologic product, if next-generation products enter and quickly largely displace the older generation reference product and the FOB, then federal savings from FOB entry will be small.
Limited direct empirical market evidence of uptake and price effects due to follow-on biologics is available. Only two human growth hormone follow-on products have been approved in Europe, both recently. Omnitrope, an FOB version of Pfizer’s hGH biologic Genetropin has been marketed for the past year in Europe and somewhat longer than that in Australia. Anecdotal reports typically cite Omnitrope being available at a 20 to 25 percent price discount in Germany and a 10 to 20 percent price discount in Australia.73 Uptake of Omnitrope has been limited to only approximately 1%, with a Sandoz spokesperson stating that, “[s]ales are developing with a slow uptake… there needs to be a lot of education and training for doctors and patients.”74
To supplement this limited empirical experience with FOBs in Europe, we present empirical evidence from several situations with some analogous characteristics:
• price-based competition in the form of generic entry of more complex conventional drugs that share some features suggestive of biologics;
• branded competition in the human growth hormone market; and
• dynamic competition with entry of next generation products in the ESA and G-CSF markets.
73 Pisani, J. and Bonduelle, Y., “Opportunites and Barriers in the Biosimilar Market: Evolution or Revolution for Generics Companies?” PricewaterhouseCoopers LLP; and Pipelinereview.com <Http://www.pipelinereview.com/joomla/content/view/10955/286/ -- accessed June 22, 2007. 74 <Http://www.businessworld.in/content/view/1394/1451/> -- accessed June 19, 2007.

Page 42
A. PRICE-BASED COMPETITION: EVIDENCE FROM GENERIC ENTRY OF COMPLEX CONVENTIONAL DRUGS
While many conventional drugs experience rapid price declines and substantial generic shares following generic entry, this experience does not hold for all conventional drugs. Some drugs have characteristics that begin to approximate the features of biologics:
• black box warnings
• a narrow therapeutic index75
• use by specialists rather than primary care physicians
• use in oncology
• a manufacturing technology available to only a limited number of firms.
We find that these more complex products experienced much lower levels of generic penetration and price discounts than did other conventional drugs. For example, at one year following initial generic entry, the share of generic Coumadin (a drug with a narrow therapeutic index) was 9 percent, while the share of generic Prozac was ten times higher, or 89 percent. Even four years after initial generic entry the share of generic Coumadin had reached only 20 percent. Because generic drugs benefit from economic and structural incentives for substitution, even complex drugs may achieve levels of generic penetration in excess of those which FOBs might achieve when pursuing a strategy of competing on price.
1. Generic Substitution Among More Complex Drugs
We analyzed price and quantity data from IMS for 35 conventional (i.e., non-biologic) drugs that experienced generic entry between 1997 and 2003. We then determined whether the characteristics listed above that begin to approximate some of the features of biologics were associated with each of the 35 drugs, and compared rates of generic substitution and generic price discounts for drugs with and without these characteristics. We found that they are associated with lower levels of generic share and price discounts. Generic share is substantially lower for drugs having an FDA-required black box warning on the drug label, a narrow therapeutic index, an oncology indication, a delivery technology possessed by few generics manufacturers, or one that is used primarily by specialist physicians.
Figure 2 compares the average generic share over time for drugs with two or more of the above complex characteristics to drugs with one or none of these characteristics. At one year following initial generic entry, the mean generic share for drugs with two or more complex characteristics is 45%, while drugs with one or no complex characteristics had a mean generic share of 78% (1.7
75 Drugs with a narrow therapeutic index are those drugs that exhibit the desired therapeutic effect at a dose level close to the toxic dose level for that drug. As a result, small deviations from the appropriate dosing level could have significant harmful effects.

Page 43
times higher).76 Among drugs with two or more of the above characteristics, the rate of generic share erosion was lowest for Coumadin, a narrow therapeutic index drug, where one year following initial generic entry, generic erosion totaled only 9%.
While these data from conventional generics cannot be directly applied to estimate FOB shares following market entry in the biologics market, they suggest that FOB uptake will be significantly lower than observed in the case of generic drugs. Even more complex generic drugs are nevertheless rated therapeutically equivalent (i.e., have an A rating) and therefore benefit from some “automatic” substitution. In order to avoid substitution, physicians need to specify in “do not substitute” orders that prescriptions are to be dispensed as written. FOBs will not be rated therapeutically equivalent and therefore will not be subject to “automatic” substitution. Further, to the degree that distribution occurs through physicians’ offices and similar settings under a “buy and bill” system, historically there have been incentives for higher, rather than lower priced products. These factors, together with additional factors related to specialist brand loyalty, clinically vulnerable patient populations, and physician conservatism in switching stable patients to new therapies, are likely to reduce rates of FOB uptake below levels observed in these more complex drugs.
2. Prices
Figure 3 compares the generic price discounts from the brand over time for drugs with two or more of the above complex characteristics to drugs with one or none of these characteristics. At one year following initial generic entry, the generic price discount for drugs with two or more complex characteristics is 35%, while drugs with one or no complex characteristics had a generic discount of 58% (1.6 times higher).77
Results are summarized in the table below. In each case, the mean value of the variable shown for drugs with two or more complex characteristics is roughly 60% of the value of that variable for drugs with one or no such characteristics. The lower mean levels of generic shares and price discounts for drugs with two or more complex characteristics are also reflected in a lower number of generic entrants. On average, drugs with two or more characteristics faced 2.5 generic entrants one year following initial generic entry, while drugs with one or no characteristics faced an average of 8.5 generic entrants.
76 The difference in mean generic shares measured twelve months after generic entry for drugs with two or more characteristics and drugs with one or no characteristics is statistically significant at the 99% confidence level. 77 The difference in mean generic price discounts measured twelve months after generic entry for drugs with two or more characteristics and drugs with one or no characteristics is statistically significant at the 98% confidence level.

Page 44
Generic Share and Generic Price Discounts from Brand One Year After Generic Entry
Average Generic Share of the Molecule
Generic Price Discount from the Brand
Drugs with Two or More Complex Characteristics:
– Mean – Minimum (Coumadin)
45% 9%
35% 0%
Drugs with One or No Complex Characteristics 78% 58%
Ratio for Drugs with Two or More Characteristics to Those with One orNone
0.6 0.6
B. BRANDED COMPETITION AMONG HUMAN GROWTH HORMONE BIOLOGICS
As biologics themselves, human growth hormones may provide a useful approximation of FOB entry and competition for some PHS Act less complex biologics.78 Most human growth hormones are derived from the same molecule, somatropin recombinant, chemical variations are minimal and are well understood, and competition takes place between branded products on multiple dimensions including price, promotion and delivery features (e.g., cartridge and pen systems).79 As a result, the entry of new somatropin recombinant biologics may provide a baseline for estimating the potential effects of FOB entry in other biologic therapies, should manufacturers adopt a branded competition model of market behavior.
78 In addressing concerns regarding the approval process for Omnitrope, a FOB to Pfizer’s Genotropin, the FDA stated that “[a]mong other things, human growth hormone (hGH) has several characteristics that enable one hGH product to be adequately compared to another for purposes of approval…hGH is well characterized…[t]he primary structure of hGH is known…hGH’s mechanism of drug action is known, and its human toxicity profile is well understood,” Omnitrope (somnatropin [rDNA origin]) Questions and Answers, May 30, 2006, http://www.fda.gov/cder/drug/infopage/somatropin/qa.htm (accessed June 1, 2007). 79 According to the FDA, human growth hormones, hGHs, are well characterized and non-glycosylated (that is, sugar molecules are not added to the protein, which minimizes the complexity of a protein and makes it easier to compare the structures from one version of the protein to another using standard tools such as mass spectrometry). The primary structure of hGH is known, and physicochemical tests exist for the determination of an hGH product’s secondary and tertiary structures (how the protein folds upon itself). Clinically relevant bioassays and qualified biomarkers are available for hGH, and hGH has a long and well documented history of clinical use as a replacement for endogenous growth hormone deficiency. The mechanism of hGH drug action is known, and its human toxicity profile is well understood. Omnitrope (somnatropin [rDNA origin]) Questions and Answers. May 30, 2006. http://www.fda.gov/cder/drug/infopage/somatropin/qa.htm. Accessed on March 30, 2007.

Page 45
We collected Medicaid state drug utilization data from 1991 through the first quarter of 2006 on all somatropin recombinant hGH products. This molecule comprises the vast majority of hGH sales. While these Medicaid reimbursement data may not be directly indicative of the effects on Part B federal expenditures, the Medicaid data are complete and provide a substantial time horizon for analysis, and may be generally indicative of outcomes for public payers in similar markets with multiple entrants in more highly substitutable biologics markets where there is both price-based and non-price based competition.
1. Average Reimbursements per Prescription
Between 1991 and 2006, the number of separate somatropin recombinant biologics increased from 1 to eight products.80 Despite this substantial increase in the number of biologics, the average market reimbursement per Rx for somatropin recombinant biologics was not significantly affected, excluding Serostim, as illustrated in Figure 4. Two products, Serostim and Protropin, exhibit characteristics that are not shared by other products: Serostim is the only hGH product was an indication for use in AIDS Wasting Syndrome (and so the pricing and sales of this product may reflect a separate market from the other hGH products); and Protropin is an entirely different molecule, a recombinant somatrem rather than a recombinant somatropin. For these reasons, we compare results for the remaining more closely related products.
All of the somatropin recombinant products were similarly priced (excluding Serostim). Products have largely chosen to compete on dimensions other than price, such as delivery system and dosing convenience. All of the major branded products have pen or needle-free delivery systems. One exception is the product Tev-Tropin, introduced by Teva Pharmaceuticals in February 2005 without the dosing and delivery convenience features of other competitors (Tev-Tropin is delivered with a conventional needle system, as is Omnitrope). Despite a price discount of roughly 40% from other somatropin products, over two years later, in April 2007, Tev-Tropin had failed to capture more than 1% of all somatropin prescriptions81 (less than 1% of Medicaid prescriptions in the time period we examined) and therefore had a negligible effect on overall Medicaid spending.
Most manufacturers have chosen not to compete on price despite the fact that all of the drugs are derived from somatropin and may share many common attributes. This suggests that non-price competition may be a desirable strategy for potential FOB entrants in PHS Act biologic markets. In the one case where an hGH product, Tev-Tropin, appears to have selected a strategy of competing on price it has failed to capture much of the market.
2. Rate of Uptake
We also observe that as new somatropin recombinant biologics enter they do not substantially affect the trend in prescriptions for existing products, as seen in Figure 5. The prescription path for Serostim is unique, reflecting its indication for AIDS Wasting Syndrome and substantial sales in that market, which likely expanded the overall market for somatropin.
80 We combined products such as Nutropin, Nutropin AQ, and Nutropin Depot into a single biologic when generating these counts of unique biologics 81 K Cacciatore et al., “Nothing Generic About Generic Biologics,” Cowen and Company report, June 2007.

Page 46
As noted, Protropin also exhibits a unique prescription path reflecting its position as an older generation somatrem recombinant (rather than a somatropin recombinant) product. The manufacturer of Protropin, Genentech, subsequently released the somatropin recombinant product Nutropin.
Even excluding Serostim, the size of the hGH market has grown substantially, fueled by new entry. A similar dynamic may be observed in the markets for some PHS Act biologics, with additional entrants expanding the market, due to marketing and product differentiation, rather than leading only to share effects on other innovator drugs. A more complete analysis would go beyond these descriptive observations and carefully control for factors which may affect share such as delivery system unique features and level and mix of marketing spending and tactics in order to isolate the determinants of share and to estimate the degree to which new entrants expanded the total market.
C. DYNAMIC COMPETITION WITH SUCCESSIVE GENERATIONS OF PRODUCTS: EVIDENCE FROM ESA AND G-CSF BIOLOGICS
Dynamic competition through market entry of products which may offer additional features is an important consideration when investigating the impact of FOB entry on federal spending. To the extent that innovator manufacturers introduce new products with features not available in the FOB, then the size of the market available to the FOB may be reduced over time. Even if the FOB gains a large share of sales from the benchmark innovator biologic, the FOB’s share of overall treatment may decline or remain limited. This is likely to be particularly true in markets with substantial unmet need, where physicians and patients may readily adopt new products with additional patient convenience or clinical efficacy and side effect benefits. Conversely, in more established therapeutic areas, where current drugs are highly effective and side effects minimal, FOBs may achieve higher levels of uptake. Further, the prospect of FOB entry will provide innovator manufacturers with additional incentives to develop and introduce these next-generation products.
1. ESA
In 2002 Amgen began marketing the next generation ESA drug Aranesp. Prior to that time the market for ESAs was served largely by the drugs Epogen and Procrit in the U.S., identical drugs marketed under two names depending on the clinical indication. Aranesp is approved for both renal failure and chemotherapy related anemia, allowing use of Aranesp as an alternative for both biologics. Aranesp’s less frequent dosing schedule has given it an advantage in the ESA market. Figure 6 illustrates the growth in ESA sales since the introduction of Aranesp is entirely due to Aranesp sales, while the sales of Epogen and Procrit have remained relatively unchanged. Aranesp captured 11% of the ESA market in the first year following its release and 40% within four years. An FOB for Epogen and Procrit will face a segmented ESA market.82
82 Other factors may also affect the pattern of share uptake between these similar biologics, such as marketing approach and tactics. This brief discussion is not intended to be a comprehensive discussion of market interactions between the ESA products, but rather a suggestion that successive generation biologic products can have significant impacts on market outcomes for first generation biologics and their FOBs, even when they are very similar (CMS treats Aranesp/DARB as functionally equivalent to EPO from a reimbursement point of view).

Page 47
Other factors could also affect the total size of the ESA market in future years and the likely share that an ESA FOB might capture, including the unknown resolution of certain cardiovascular and oncology concerns that could result in changes to current dosing practices, and future competition from other products (such as Roche’s CERA) and other entirely new therapies in development including oral agents.
2. G-CSF
Also in 2002, Amgen began marketing the next generation pegylated G-CSF drug Neulasta. Prior to that time the market for G-CSF was served largely by its drug Neupogen. As a result of the structural change, Neulasta does not have to be administered as often as Neupogen. Figure 7 displays the change in Neupogen sales over the 2000 to 2006 period, which have declined, with sales of Neulasta, which have increased substantially. Neulasta captured 50% of sales in the first year following its release and 70% of sales within four years. An FOB entrant based on Neupogen would face significant challenges in competing with Neulasta.

Page 48
8. Conclusion
Just as the Hatch-Waxman Act fundamentally reshaped competition, pricing, and innovation for “conventional” small molecule drugs in 1984, Congressional action on a regulatory framework for follow-on biologics will have far-reaching implications, resetting the competitive and market landscape in the dynamic biotechnology industry for years to come. These changes have the potential to result in significant long-term economic realignment in the biotech and pharmaceutical industries. Elsewhere, we have discussed the need for careful consideration in structuring the appropriate balance between long-term interests in protecting innovation incentives in the biotech industry and shorter-term interests in enhanced price competition.83 We have also examined the importance of setting an appropriate data exclusivity period that reflects the demand and supply side characteristics of this market: early stage research concentrated in start-up companies typically financed by venture capital firms and partnerships; long, costly and risky R&D in which most candidate molecules never reach the market; and market sales distributions that are highly skewed, with long payoff periods to profitability.84
This paper examines in greater detail the key assumptions which will drive market outcomes, specifically the likely timing and magnitude of federal savings due to the creation of a regulatory framework for follow-on biologics under the Public Health Service Act. Although some industry observers have suggested that market outcomes for follow-on biologics may closely parallel those observed in the case of generic drug entry after the implementation of the Hatch-Waxman Act, we find that similar outcomes are unlikely due to significant differences between the two situations and sets of therapies that will result in different market outcomes.
We summarize the best available evidence for each key assumption, focusing particularly on the potential effects of biosimilar competition (i.e., possible rates of uptake of FOBs in cases where the corresponding innovator branded biologics would otherwise have been used) and competition with future next generation biologic products, as these key assumptions have received less attention to-date. Direct market evidence of share and price effects due to FOBs is limited, and largely confined to recent experience in Europe. Therefore, we also review the available empirical market data on outcomes in the most closely analogous situations in the U.S., including generic entry for more complex small molecule drugs, and branded competition in the human growth hormone market, as well as experience with competition between first and succeeding generation biologic products. Each of these examples suggests modest savings in the short run, consistent with potential FOB price discounts of between 10% and 30%, and FOB shares of 10% to 45%, and market entry for the most significant products in 2013 or later.
83 H.G. Grabowski, I. Cockburn and G Long, “The Market for Follow-On Biologics: How Will It Evolve?”, Health Affairs 25 (5)L 1291-1301. 84 H.G. Grabowski, “Data Exclusivity for New Biological Entities,” Duke University Department of Economics Working Paper, June 2007.

Page 49
In addition, we conclude that estimates of federal savings are very sensitive not only to the specific legislative language that emerges, but also to a range of critical assumptions about scientific, regulatory, and clinical issues, the nature of competition in markets for specific biologics, as well as future intellectual property protection, and related litigation and development of case law. All of these factors are highly uncertain, and any one of them could have a substantial impact on the magnitude of potential federal savings and the speed with which they are realized. Nonetheless, our review of the relevant evidence, combined with considerations of the structure of competition and economic incentives, suggests that such savings are likely to fall at the lower end of the very wide range of estimates that have been put forward. As a result, we recommend a cautious approach in developing and interpreting estimates of the federal budgetary impact of any regulatory framework for expedited review and approval of follow-on biologics.

Page 50
Acknowledgments
This research was supported in part by funding from Johnson & Johnson and the Biotechnology Industry Organization. The design, analysis, and composition of the analyses and manuscript were conducted independently and entirely by the authors, and we are solely responsible for any errors.

Page 51
Figure 1: Clinical Development and Approval Times: Biotech and Pharma Source: DiMasi, Joseph A., and Grabowski, Henry G. The Cost of Biopharmaceutical R&D: Is Biotech Different? Managerial and Decision Economics, June 2007.
12.3
19.5
26.0
29.3
33.8
32.9
18.2
16
0 120
Pharma
Biotech
Months
Phase I Phase II Phase III RR

Page 52
Figure 2: Generic Share of Molecule for Drugs with and without Multiple Complex Characteristics
Average Generic Share of the MoleculeBy Complex Drug Characteristics
0%
20%
40%
60%
80%
100%
0 3 6 9 12 15 18 21 24
Months Following Initial Generic Entry
Drugs with 2 or more Complex Characteristics
Drugs with 1 or No Complex Characteristics
Gen
eric
Sha
re o
f the
Mol
ecul
e(p
erce
nt o
f Rx)
Source: Authors’ calculations from a sample of 35 drugs experiencing generic entry between 1997 and 2003.

Page 53
Figure 3: Generic Price Discounts for Drugs with and without Multiple Complex Characteristics
Average Generic Price Discount from Brand Price for the MoleculeBy Complex Drug Characteristics
0%
20%
40%
60%
80%
100%
0 3 6 9 12 15 18 21 24
Months Following Initial Generic Entry
Drugs with 2 or more Complex Characteristics
Drugs with 1 or No Complex Characteristics
Gen
eric
Pric
e D
isco
unt f
rom
Bra
nd P
rice
(per
cent
)
Source: Authors’ calculations from a sample of 35 drugs experiencing generic entry between 1997 and 2003.

Page 54
Figure 4: Average Amount Reimbursed per Prescription for Somatropin Recombinant Products
Dollars Reimbursed per Rx for Somatropin Recombinant Products1991 - 2006
$0
$1,000
$2,000
$3,000
$4,000
1991
Q1
1991
Q3
1992
Q1
1992
Q3
1993
Q1
1993
Q3
1994
Q1
1994
Q3
1995
Q1
1995
Q3
1996
Q1
1996
Q3
1997
Q1
1997
Q3
1998
Q1
1998
Q3
1999
Q1
1999
Q3
2000
Q1
2000
Q3
2001
Q1
2001
Q3
2002
Q1
2002
Q3
2003
Q1
2003
Q3
2004
Q1
2004
Q3
2005
Q1
2005
Q3
2006
Q1
Dol
lars
Rei
mbu
rsed
per
Rx
Average Medicaid Reimbursement per Rx
Average Medicaid Reimbursement per Rx - Excluding Serostim
Notes: 1) Calculations based on products derived from Somatropin Recombinant. 2) Variations of a brand product are not counted separately in # of available Somitropin Drugs (e.g., Nutropin, Nutropin AQ, and Nutropin Depot only count as one drug). 3) Serostim is the only HgH indicated for AIDS Wasting and therefore many of its sales may be in a separate market from the other HgH drugs.Source: Medicaid SDUD data.
# Of Available Recombinant
Somitropin Drugs2
3
4(3)
5(4)
6(5)
7(6)
8(7)
9(8)

Page 55
Figure 5: Prescriptions of Somatropin Recombinant Products
Total Medicaid TRx by Somatropin Recombinant Product1991 - 2006
0
5,000
10,000
15,000
20,000
25,000
1991
Q1
1991
Q3
1992
Q1
1992
Q3
1993
Q1
1993
Q3
1994
Q1
1994
Q3
1995
Q1
1995
Q3
1996
Q1
1996
Q3
1997
Q1
1997
Q3
1998
Q1
1998
Q3
1999
Q1
1999
Q3
2000
Q1
2000
Q3
2001
Q1
2001
Q3
2002
Q1
2002
Q3
2003
Q1
2003
Q3
2004
Q1
2004
Q3
2005
Q1
2005
Q3
2006
Q1
Tota
l Med
icai
d TR
x
TOTAL GENTROPIN HUMATROPE NORDITROPINNUTROPIN PROTROPIN (SOMATREM) SAIZEN SEROSTIMTEV-TROPIN ZORBTIVE
Notes: 1) All products shown are derived from Somatropin Recombinant. 2) Products include all variation of the brand name (e.g., Nutropin includes, Nutropin, Nutropin AQ, and Nutropin Depot). 3) Serostim is the only HgH indicated for AIDS Wasting and therefore many of its sales may be in a separate market from the other HgH drugs. 4) Manufacturers corresponding to the listed biologics include: Genentech – Protropin and Nutropin; Eli Lilly – Humatrope; Novo Nordisk – Norditropin; Pfizer – Gentropin; Serano Labs – Saizen, Serostim, and Zorbtive; and Teva Pharmaceuticals -- Tev-Tropin.Source: Medicaid SDUD data.

Page 56
Figure 6: Sales of First Generation (Procrit/Epogen) and Next-Generation (Aranesp) ESA Products
$0
$500
$1,000
$1,500
$2,000
$2,500
$3,000
Q1 Q2 Q3 Q4 Q1 Q2 Q3 Q4 Q1 Q2 Q3 Q4 Q1 Q2 Q3 Q4 Q1 Q2 Q3 Q4 Q1 Q2 Q3 Q4 Q1 Q2 Q3 Q4
2000 2001 2002 2003 2004 2005 2006
US
Dol
lars
(in
mill
ions
)
Aranesp
Epogen
Procrit
Sources: Amgen 10-K (2000 - 2006), Amgen 10-Q (2000-2006), Johnson & Johnson 10-K (2001-2006), Johnson & Johnson 10-Q (2003-2006), and Tsao, A., "J&J's Rx for the Anxious Investor," Business Week , June 27, 2001.Note: Quarterly sales were estimated for Procrit in 2000, 2001, and 2002 by dividing annual sales by 4 (quarterly sales were unavailable in these years).

Page 57
Figure 7: Sales of First Generation (Neupogen) and Next-Generation (Neulasta) G-CSF Products
$0
$200
$400
$600
$800
$1,000
$1,200
Q1 Q2 Q3 Q4 Q1 Q2 Q3 Q4 Q1 Q2 Q3 Q4 Q1 Q2 Q3 Q4 Q1 Q2 Q3 Q4 Q1 Q2 Q3 Q4 Q1 Q2 Q3 Q4
2000 2001 2002 2003 2004 2005 2006
US
Dol
lars
(in
mill
ions
)
NeulastaNeupogen
Sources: Amgen 10-K (2000 - 2006) and Amgen 10-Q (2000-2006).

Page 58
Appendix A. Approved Biologics by Pathway
Product Company FDA Approval Date
Approval Pathway
Factor Products
Advate (Recombinant antihemophilic factor produced without any added human or animal plasma proteins and albumin)
Baxter Healthcare Corp.
July 2003 NDA
BeneFix™ (coagulation factor IX) Wyeth February 1997 BLA
Bioclate™ (antihemophilic factor) Aventis Behring December 1993 BLA
Helixate® (antihemophilic factor) Aventis Behring February 1994 BLA
Kogenate®FS (antihemophilic factor) Bayer Corp. September 1989 BLA
NovoSeven® (coagulation factor VIIa) Novo Nordisk March 1999 BLA
Recombinate® rAHF/ (antihemophilic factor) Baxter Healthcare
Corp. February 1992 Unknown
ReFacto® (antihemophilic factor) Wyeth March 2000 BLA
Hormone Products
GenoTropin® (human somatropin) Pharmacia August 1995 NDA
Humatrope® (somatotropin) Eli Lilly and
Company December 1996 NDA
Norditropin®/Norditropin Nordiflex® (somatropin [rDNA])
Novo Nordisk May 1995 NDA
Nutropin Depot™ (sustained-release formulation of somatropin)
Alkermes, Inc., and Genentech, Inc.
December 1999 NDA
Nutropin® (somatropin) Genentech, Inc. October 1985 NDA
Protropin® (somatrem) Genentech, Inc. October 1985 NDA
Saizen® (somatropin) Serono S.A. October 1996 NDA
Zorbtive™ (Serostim® ) (Somatotropin) Serono S.A. August 1996 NDA
BioTropin™ (human growth hormone) Biotech General May 1995 NDA
Follistim™ (follitropin beta) Organon (unit of September 1997 NDA

Page 59
Akzo Nobel)
Gonal-F® (follitropin alfa) Serono S.A. September 1998 NDA
Thyrogen® (thyrotropin alfa) Genzyme December 1998 NDA
Insulin Products
Humalog® (insulin) Eli Lilly and
Company June 1996 NDA
Humulin® (human insulin) Eli Lilly And
Company October 1982 NDA
Lantus® (insulin glargine) Aventis April 2000 NDA
Levemir® (insulin detemir [rDNA origin] injection) Novo Nordisk June 2005 NDA
Novolin L® (insulin; zinc suspension;) Novo Nordisk June 1991 NDA
Novolin N® (insulin; isophane suspension) Novo Nordisk July 1991 NDA
Novolin R® (insulin, regular;) Novo Nordisk June 1991 NDA
Novolin® (insulin;) Novo Nordisk October 1982 NDA
Novolin® 70/30 (70% insulin isophane suspension
and 30% regular insulin) Novo Nordisk June 1991 NDA
NovoLog® (insulin aspart) Novo Nordisk May 2000 NDA
Velosulin® BR (insulin; buffered formulation) Novo Nordisk July 1999 NDA
Vaccine Products
Comvax™ (Haemophilus B conjugate [meningococcal conjugate] and hepatitis B [recombinant] vaccine)
Merck & Co., Inc. October 1996 BLA
Engerix-B® (hepatitis B vaccine) GlaxoSmithKline September 1989 BLA
Pediarix™ (diphtheria and tetanus toxoids and acellular pertussis adsorbed, hepatitis B [recombinant] and inactivated polio-virus vaccine combined)
GlaxoSmithKline December 2002 BLA
Recombivax-HB®/Recombivax HB Dialysis
Formulation (hepatitis B vaccine) Merck & Company,
Inc. July 1986 BLA
Twinrix® (hepatitis A inactivated and hepatitis B [recombinant] vaccine)
SmithKline Beecham Biologicals (unit of GlaxoSmithKline)
May 2001 BLA
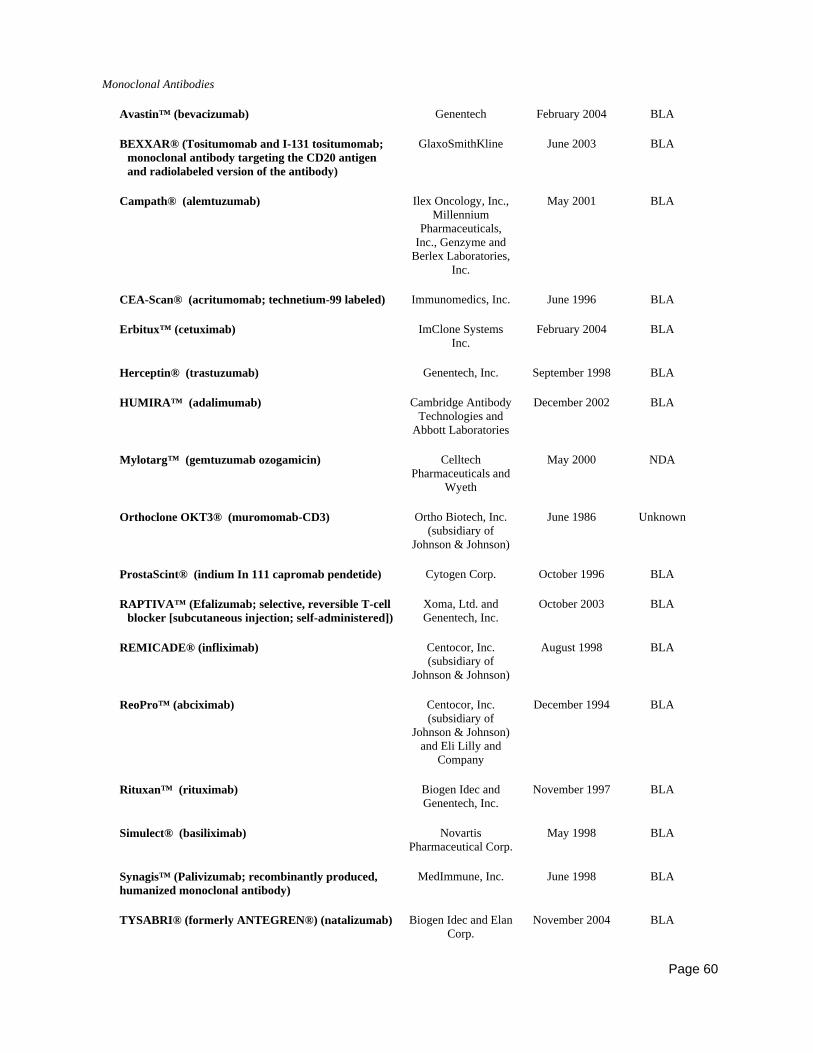
Page 60
Monoclonal Antibodies
Avastin™ (bevacizumab) Genentech February 2004 BLA
BEXXAR® (Tositumomab and I-131 tositumomab; monoclonal antibody targeting the CD20 antigen and radiolabeled version of the antibody)
GlaxoSmithKline June 2003 BLA
Campath® (alemtuzumab) Ilex Oncology, Inc., Millennium
Pharmaceuticals, Inc., Genzyme and
Berlex Laboratories, Inc.
May 2001 BLA
CEA-Scan® (acritumomab; technetium-99 labeled) Immunomedics, Inc. June 1996 BLA
Erbitux™ (cetuximab) ImClone Systems
Inc. February 2004 BLA
Herceptin® (trastuzumab) Genentech, Inc. September 1998 BLA
HUMIRA™ (adalimumab) Cambridge Antibody Technologies and
Abbott Laboratories
December 2002 BLA
Mylotarg™ (gemtuzumab ozogamicin) Celltech Pharmaceuticals and
Wyeth
May 2000 NDA
Orthoclone OKT3® (muromomab-CD3) Ortho Biotech, Inc. (subsidiary of
Johnson & Johnson)
June 1986 Unknown
ProstaScint® (indium In 111 capromab pendetide) Cytogen Corp. October 1996 BLA
RAPTIVA™ (Efalizumab; selective, reversible T-cell
blocker [subcutaneous injection; self-administered]) Xoma, Ltd. and Genentech, Inc.
October 2003 BLA
REMICADE® (infliximab) Centocor, Inc. (subsidiary of
Johnson & Johnson)
August 1998 BLA
ReoPro™ (abciximab) Centocor, Inc. (subsidiary of
Johnson & Johnson) and Eli Lilly and
Company
December 1994 BLA
Rituxan™ (rituximab) Biogen Idec and
Genentech, Inc. November 1997 BLA
Simulect® (basiliximab) Novartis
Pharmaceutical Corp. May 1998 BLA
Synagis™ (Palivizumab; recombinantly produced, humanized monoclonal antibody)
MedImmune, Inc. June 1998 BLA
TYSABRI® (formerly ANTEGREN®) (natalizumab) Biogen Idec and Elan
Corp. November 2004 BLA

Page 61
Xolair® (Omalizumab; recombinant DNA-derived humanized monoclonal antibody targeting immunoglobulin-E [subcutaneous])
Genentech, Tanox, Inc. and Novartis Pharmaceuticals
June 2003 BLA
Zenapax® (daclizumab) Hoffmann-La Roche, Inc., and Protein
Design Labs
December 1997 BLA
Zevalin™ (ibritumomab tiuxetan) Biogen Idec February 2002 BLA
Interferons
Actimmune® (interferon gamma-1b) InterMune
Pharmaceuticals, Inc. December 1990 BLA
Alferon N® (interferon alfa-N3, human leukocyte
derived) Interferon Sciences,
Inc October 1989 BLA
Avonex® (interferon beta-1a; recombinant) Biogen Idec May 1996 BLA
Betaseron® (Interferon beta-1b) Berlex Laboratories and Chiron Corporation
August 1993 BLA
Infergen® (interferon alfacon-1) InterMune Pharmaceuticals, Inc., and Amgen
October 1997 BLA
Intron A® (alpha-interferon) Schering-Plough
Corp. June 1986 BLA
Pegasys® (peginterferon alfa-2a) Roche and Nektar
Therapeutics, Inc. October 2002 BLA
PEG-Intron™ (pegylated version of interferon alfa-2b)
Enzon, Inc., and Schering-Plough
Corp.
January 2001 BLA
Pegasys® (peginterferon alfa-2a) Roche and Nektar
Therapeutics, Inc. October 2002 BLA
PEG-Intron™ (pegylated version of interferon alfa-2b)
Enzon, Inc., and Schering-Plough
Corp.
January 2001 BLA
Rebetron™ (combination of ribavirin and alpha
interferon) Schering-Plough
Corp. June 1998 Unknown
Rebif®/Rebif® Titration Pack (interferon beta 1-a) Serono S.A., and
Pfizer, Inc. March 2002 BLA
Roferon-A® (interferon alfa-2a) Hoffmann-La Roche,
Inc. June 1986 BLA
All Other Products
Activase®/Cathflo® Activase® (alteplase; tissue Genentech, Inc. November 1987 BLA

Page 62
plasminogen activator)
Aldurazyme® (laronidase) BioMarin Pharmaceuticals Inc.
and Genzyme
April 2003 BLA
Amevive® (Alefacept; recombinant, dimeric fusion
protein; targets CD45RO+ T-cells) Biogen Idec January 2003 BLA
Aranesp™ (darbepoetin alfa) Amgen September 2001 BLA
Cerezyme® (imiglucerase; recombinant form of
beta-glucocerebrosidase) Genzyme May 1994 NDA
Elitek® (rasburicase) Sanofi-Synthelabo July 2002 BLA
ENBREL® (etanercept) Amgen and Wyeth November 1998 BLA
Epogen® (epoetin alfa) Amgen June 1989 BLA
Fabrazyme® (algasidase beta) Genzyme April 2003 BLA
FORTEO® (teriparatide) Eli Lilly and
Company November 2002 NDA
FORTICAL® Nasal Spray (calcitonin salmon) Unigene Laboratories
Inc. August 2005 NDA
GEM 21S® (GEM 215 is composed of the tissue growth factor, recombinant human Platelet-Derived Growth Factor (rhPDGF-BB), and a synthetic bone matrix, Beta-tricalcium phosphate.)
BioMimetic Therapeutics Inc.
November 2005 Unknown
Geref® Serono S.A. October 1997 Unknown
GlucaGen® (glucagon) Novo Nordisk June 1998 NDA
Hylenex™ (recombinant human hyaluronidase) Halozyme
Therapeutics Inc. December 2005 NDA
Increlex™ (mecasermin) Tercica Inc.
Genentech Inc. August 2005 NDA
INFUSE™ Bone Graft/LT-CAGE™ (device utilizing recombinant human bone morphogenetic protein [rhBMP-2-]/absorbable collagen sponge)
Wyeth and Medtronic Sofamor Danek
July 2002 Unknown
IPLEX™ (mecasermin rinfabate [rDNA origin]) Insmed Inc. December 2005 NDA
Kepivance (palifermin) Amgen December 2004 BLA
Kineret™ (anakinra) Amgen November 2001 BLA
Leukine®/Leukine® Liquid (granulocyte
macrophage colony-stimulating factor) Berlex Laboratories March 1991 BLA
Luveris (lutropin alfa for injection) Serono October 2004 NDA

Page 63
LYMErix™ (OspA lipoprotein) SmithKline Beecham Biologicals
(subsidiary of GlaxoSmithKline)
December 1998 Unknown
Myobloc™ (botulinum toxin type B) Elan Corp. December 2000 BLA
Naglazyme™ (galsulfase) BioMarin
Pharmaceuticals May 2005 BLA
Natrecor® (nesiritide) Scios, Inc. August 2001 NDA
Neulasta™ (pegfilgrastim) Amgen January 2002 BLA
Neumega® (oprelvekin) Wyeth November 1997 BLA
Neupogen® (filgrastim) Amgen February 1991 BLA
NeutroSpec™ (formerly LeuTech®) (Technetium [99m Tc] fanolesomab)
Palatin Technologies and Mallinckrodt Imaging (Tyco
Healthcare)
July 2004 BLA
Ontak® (denileukin diftitox) Ligand
Pharmaceuticals, Inc. February 1999 BLA
Orencia™ (abatacept, fully human soluable fusion
protein) Bristol-Myers Squibb
Company December 2005 BLA
Procrit® (epoetin alfa) Ortho Biotech, Inc. December 1990 BLA
Proleukin, IL-2® (aldesleukin) Chiron Corp. May 1992 BLA
Pulmozyme® (dornase alfa) Genentech, Inc. December 1993 BLA
Refludan® (lepirudin) Berlex Laboratories March 1998 NDA
Regranex® Gel (gel becaplermin) Ortho-McNeil and
Chiron Corp. December 1997 BLA
Retavase™ (reteplase) Centocor, Inc. (subsidiary of
Johnson & Johnson)
October 1996 BLA
SOMAVERT® (pegvisomant) Nektar Therapeutics
and Pfizer, Inc. March 2003 NDA
TNKase™ (tenecteplase) Genentech, Inc. June 2000 BLA
Xigris™ (drotrecogin alfa) Eli Lilly and
Company November 2001 BLA
Note: Unknown approval pathway indicates that there was no relevant listing at the Drugs@FDA website; (http://www.accessdata.fda.gov/scripts/cder/drugsatfda/)
Sources: Approved Biotechnology Drugs, BIO, available at http://bio.org/speeches/pubs/er/approveddrugs.asp