the effectiveness and cost- effectiveness of...
TRANSCRIPT
i
The effectiveness and cost-
effectiveness of upgraded red light
speed cameras in Western
Australia: a preliminary analysis
CURTIN-MONASH ACCIDENT RESEARCH CENTRE
School of Public Health
Curtin University
Chen HY, Meuleners L, Hendrie D
May 2012
ii
DOCUMENT RETRIEVAL INFORMATION
Title The effectiveness and cost-effectiveness of upgraded red light speed cameras in Western Australia: a preliminary analysis __________________________________________________________________________ Author(s) Chen HY, Meuleners L, Hendrie D ___________________________________________________________________________ Performing Organisation Curtin-Monash Accident Research Centre Curtin University GPO BoxU1987 Perth WA 6845 Tel: (08) 9266 9590 Fax: (08) 9266 2958 ___________________________________________________________________________ Sponsor Main Roads WA Don Aitken Centre Waterloo Crescent EAST PERTH WA 6004 ___________________________________________________________________________ Abstract This report presents the preliminary results of an evaluation of red light speed cameras that were upgraded from existing red light cameras between July 7 and August 8, 2010 in the Perth metropolitan area, Western Australia. The purpose of this report was to evaluate the effectiveness of the cameras in terms of reduction in crash frequency (presented for all-reported crashes, and specifically right angle/right turn through crashes, rear-end crashes and serious injury crashes) and the net economic worth of these treatments. In addition, changes in traffic infringements targeted by red light speed cameras, including speeding and running a red light were presented. This evaluation includes eleven sites that were upgraded from a red light camera to a red light speed camera. The average length of follow up crash data post treatment for all treated sites was 531 days. The preliminary results found that the upgraded red light speed cameras significantly reduced all reported crashes, right angle/ right turn through crashes, rear-end crashes and serious injury crashes by 19%, 41%, 20% and 72%, respectively. After accounting for the initial project costs of $1.65 million ($150,000 per site) and operating and maintenance costs, the net cost savings to the community were estimated as $2.29 million. This is the equivalent of a BCR of 1.8. The number of speeding infringements after installation of red light speed cameras showed a significantly decreasing trend (p<0.0001), which provides preliminary evidence for the management of speeding at these camera sites. The red light running infringement analyses also found a significant decreasing trend (p=0.01). The results provide Main Roads WA and other road safety organisations with preliminary information about the potential role of red light speed cameras in reducing road trauma in Western Australia. _________________________________________________________________________________________ Keywords Red light speed camera, evaluation, cost-effectiveness, cost-benefit analysis ___________________________________________________________________________
iii
TABLEOFCONTENTS
EXECUTIVE SUMMARY ......................................................................................................... i
ACKNOWLEDGEMENTS ....................................................................................................... v
1. INTRODUCTION .................................................................................................................. 1 1.1. Aim …………………………………………………………………………………….3 1.2. Significance ..................................................................................................................... 3
2. METHODS ............................................................................................................................. 4 2.1. Study Design .................................................................................................................... 4 2.2. Camera Sites .................................................................................................................... 4 2.3. Data Collection ................................................................................................................ 5
2.3.1. Integrated Road Information System (IRIS) .......................................................... 5 2.3.2. Red light speed camera sites .................................................................................. 8 2.3.3. Traffic infringement data ........................................................................................ 8 2.3.4. Selection of Comparison Sites ............................................................................... 9
2.4. Factors that may affect an evaluation of red light speed cameras ................................. 12 2.4.1. Site Specific Factors ............................................................................................. 12 2.4.2. Regression to the Mean ........................................................................................ 12 2.4.3. Crash (accident) Migration ................................................................................... 13 2.4.4. Misclassification bias ........................................................................................... 13
2.5. Statistical Analysis ......................................................................................................... 15 2.6. Economic Analysis ........................................................................................................ 16
3. RESULTS ............................................................................................................................. 19 3.1. Crash effectiveness evaluation ....................................................................................... 19 3.2. All-Reported Crash Reduction for All Crash Types ...................................................... 20 3.3. Serious Injury Crash Reduction for All Crash Types .................................................... 26 3.4. Analysis of Infringements .............................................................................................. 28
3.4.1. Analyses of speeding related infringements ......................................................... 28 3.4.2. Analyses of infringements related to running a red light ..................................... 30
3.5. Economic Evaluation of the red light speed camera ..................................................... 32
4. DISCUSSION ...................................................................................................................... 34
5. CONCLUSIONS AND RECOMMENDATIONS ............................................................... 37
6. REFERENCES ..................................................................................................................... 39 APPENDIX A RED LIGHT SPEED CAMERA SITES ................................................... 41 APPENDIX B RED LIGHT CAMERA SITES ................................................................. 42 APPENDIX C SELECTED COMPARISON SITES ......................................................... 43 APPENDIX D THE NUMBER OF CRASH BEFORE AND AFTER TREATMENT BY
TYPE OF CRASH AT EACH RED LIGHT SPEED CAMERA SITE ........................ 44 APPENDIX E THE NUMBER OF CRASH BEFORE AND AFTER TREATMENT BY
TYPE OF CRASH AT EACH COMPARISON SITE .................................................. 45
iv
APPENDIX F THE ESTIMATED ALL-REPORTED CRASH REDUCTION BY GEE POISSON ....................................................................................................................... 46
APPENDIX G THE ESTIMATED RIGHT ANGLE/RIGHT TURN THROUGH CRASH REDUCTION BY GEE POISSON ............................................................................... 46
APPENDIX H THE ESTIMATED REAR-END CRASH REDUCTION BY GEE POISSON ....................................................................................................................... 46
APPENDIX I THE ESTIMATED SERIOUS INJURY CRASH REDUCTION BY GEE POISSON ....................................................................................................................... 46
v
LIST OF TABLES
Table 2.1 Speeding and red light traffic infringements .............................................................. 9
Table 3.1 Red light speed camera effect on all-reported crashes for all crash types, 2005 – 2011 .................................................................................................................. 21
Table 3.2 Red light speed camera effect on right angle/right turn through crashes, 2005 – 2011 .................................................................................................................. 23
Table 3.3 Red light speed camera effect on rear-end crashes, 2005 – 2011 ............................ 25
Table 3.4 Red light speed camera effect on serious injury crashes for all crash types, 2005 – 2011 .................................................................................................................. 27
vi
LIST OF FIGURES
Figure 2.1 A typical red light speed camera in Perth ................................................................. 7
Figure 2.2 Typical sign warning of an approaching red light speed camera. ............................ 7
Figure 2.3 Location of the 11 red light speed camera sites and corresponding matched comparison sites in Western Australia (Source: Main Roads WA) ................. 11
Figure 3.1 Number of all reported crashes for red light speed camera sites and comparison sites before and after treatment ......................................................................... 21
Figure 3.2 Number of right angle/right turn through crashes for red light speed camera sites and comparison sites before and after treatment .............................................. 23
Figure 3.3 Number of rear-end crashes for red light speed camera sites and comparison sites before and after treatment ................................................................................. 25
Figure 3.4 Number of casualty crashes for red light speed camera sites and comparison sites before and after treatment ................................................................................. 27
Figure 3.5 Red light speed camera effect on speeding incidents, 2005 – 2011 ....................... 29
Figure 3.6 Red light speed camera effect on speeding infringements, 2005 – 2011 ............... 29
Figure 3.7 Red light speed camera effect on red light running incidents, 2005 – 2011 ........... 31
Figure 3.8 Red light speed camera effect on red light running infringements, 2005 – 2011 ... 31
i
EXECUTIVE SUMMARY
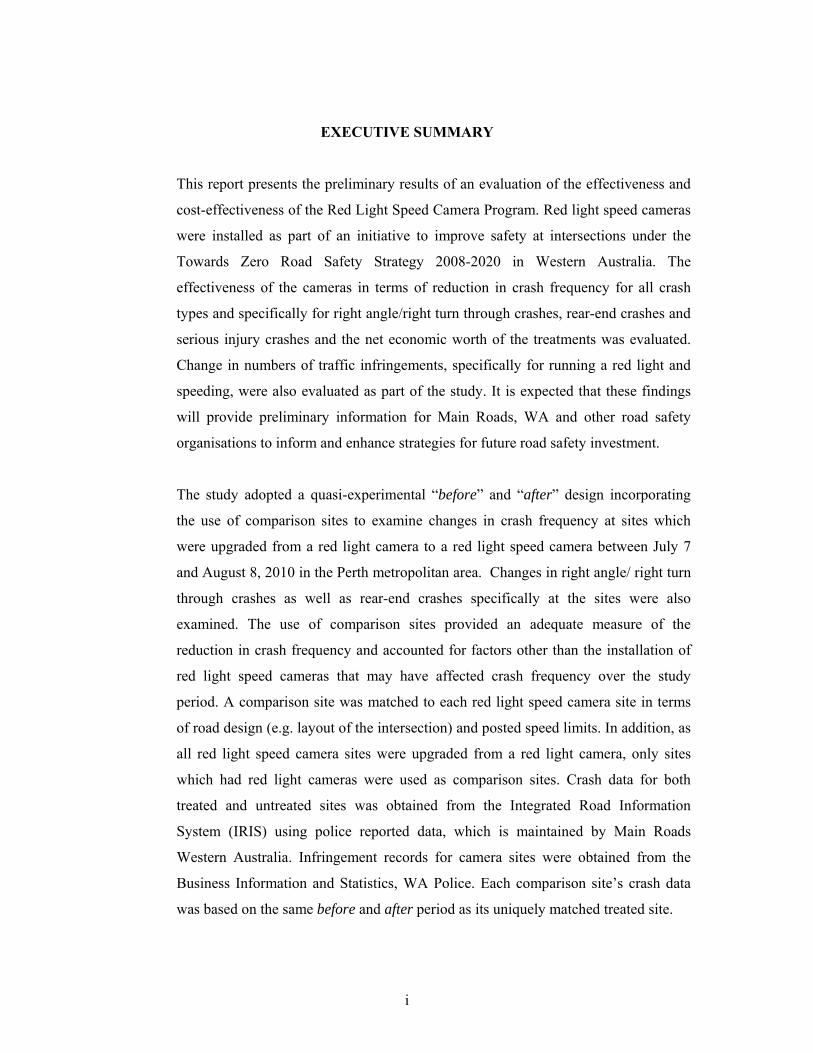
This report presents the preliminary results of an evaluation of the effectiveness and
cost-effectiveness of the Red Light Speed Camera Program. Red light speed cameras
were installed as part of an initiative to improve safety at intersections under the
Towards Zero Road Safety Strategy 2008-2020 in Western Australia. The
effectiveness of the cameras in terms of reduction in crash frequency for all crash
types and specifically for right angle/right turn through crashes, rear-end crashes and
serious injury crashes and the net economic worth of the treatments was evaluated.
Change in numbers of traffic infringements, specifically for running a red light and
speeding, were also evaluated as part of the study. It is expected that these findings
will provide preliminary information for Main Roads, WA and other road safety
organisations to inform and enhance strategies for future road safety investment.
The study adopted a quasi-experimental “before” and “after” design incorporating
the use of comparison sites to examine changes in crash frequency at sites which
were upgraded from a red light camera to a red light speed camera between July 7
and August 8, 2010 in the Perth metropolitan area. Changes in right angle/ right turn
through crashes as well as rear-end crashes specifically at the sites were also
examined. The use of comparison sites provided an adequate measure of the
reduction in crash frequency and accounted for factors other than the installation of
red light speed cameras that may have affected crash frequency over the study
period. A comparison site was matched to each red light speed camera site in terms
of road design (e.g. layout of the intersection) and posted speed limits. In addition, as
all red light speed camera sites were upgraded from a red light camera, only sites
which had red light cameras were used as comparison sites. Crash data for both
treated and untreated sites was obtained from the Integrated Road Information
System (IRIS) using police reported data, which is maintained by Main Roads
Western Australia. Infringement records for camera sites were obtained from the
Business Information and Statistics, WA Police. Each comparison site’s crash data
was based on the same before and after period as its uniquely matched treated site.
ii
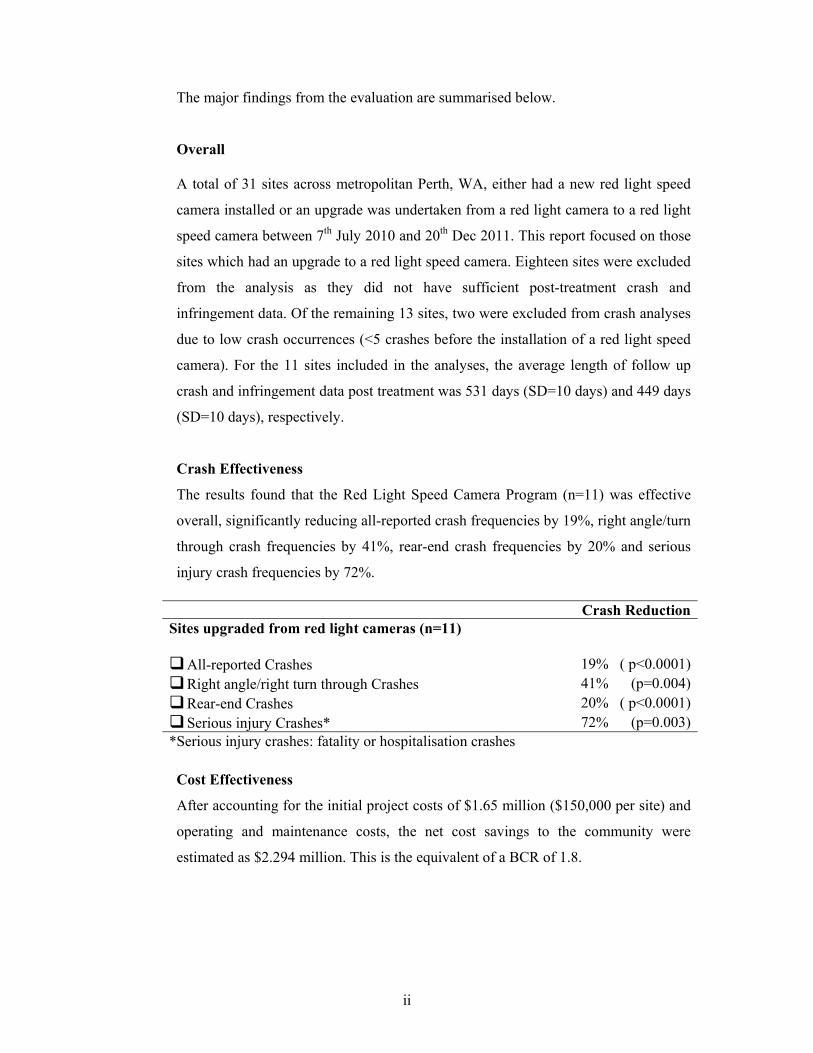
The major findings from the evaluation are summarised below.
Overall A total of 31 sites across metropolitan Perth, WA, either had a new red light speed
camera installed or an upgrade was undertaken from a red light camera to a red light
speed camera between 7th July 2010 and 20th Dec 2011. This report focused on those
sites which had an upgrade to a red light speed camera. Eighteen sites were excluded
from the analysis as they did not have sufficient post-treatment crash and
infringement data. Of the remaining 13 sites, two were excluded from crash analyses
due to low crash occurrences (<5 crashes before the installation of a red light speed
camera). For the 11 sites included in the analyses, the average length of follow up
crash and infringement data post treatment was 531 days (SD=10 days) and 449 days
(SD=10 days), respectively.
Crash Effectiveness
The results found that the Red Light Speed Camera Program (n=11) was effective
overall, significantly reducing all-reported crash frequencies by 19%, right angle/turn
through crash frequencies by 41%, rear-end crash frequencies by 20% and serious
injury crash frequencies by 72%.
Cost Effectiveness
After accounting for the initial project costs of $1.65 million ($150,000 per site) and
operating and maintenance costs, the net cost savings to the community were
estimated as $2.294 million. This is the equivalent of a BCR of 1.8.
Crash Reduction Sites upgraded from red light cameras (n=11)
All-reported Crashes 19% ( p<0.0001) Right angle/right turn through Crashes 41% (p=0.004) Rear-end Crashes 20% ( p<0.0001) Serious injury Crashes* 72% (p=0.003)*Serious injury crashes: fatality or hospitalisation crashes
iii
Infringement analysis
An examination of the change in speeding infringements after upgrading to red light
speed cameras showed a significant decreasing trend (p<0.0001), with the number of
speeding infringements decreasing by about 25 per week after upgrade.
Due to data limitations, information on traffic infringements at comparison sites and
before the upgrade to red light speed cameras was not complete at the time of writing
this report. Only the changes in number of red light running infringements at red
light speed camera sites were examined. The results showed that the number of
infringements issued for running a red light significantly decreased by 1 per week (
p=0.01) after upgrading to a red light speed camera.
Discussion
Preliminary analyses confirmed that the upgrade of red light cameras to red light
speed cameras in the Perth metropolitan area was highly effective in reducing overall
crashes, as well as specific crashes such as right angle/right turn through crashes and
rear-end crashes. Red light speed cameras were also effective in reducing serious
injury crashes. Although an average of less than 1.5 years of follow-up post
treatment data was available for the evaluation, these initial findings are very
encouraging. Nonetheless, an evaluation with a longer period of follow-up data
would provide more conclusive evidence of the effectiveness of red light speed
cameras.
This study was also able to show the effectiveness of red light speed cameras for
detecting and deterring certain risky driving behaviours. The number of speeding
infringements significantly decreased over time. This decrease in speeding
infringements may partly explain the significant decrease in crash frequencies at sites
with red light speed cameras; however, this finding needs to be examined in more
detail. This study also found a small but significant decrease in infringements for
running a red light after upgrading red light cameras to red light speed cameras,
highlighting the potential for changing this driving behaviour. A longer post-
treatment follow-up of infringement data would help to verify this finding.
iv
A limitation of this study was the lack of data to examine possible effects of “crash
migration”, which is a phenomenon whereby the number of crashes increases at sites
that are untreated (e.g. no camera installed) but that are located nearby to treated sites
(Maher 1990; Elvik 1997). The examination of crashes at surrounding intersections
in the future may help ascertain the true effect of red light speed cameras.
Furthermore, the comparison site selection may introduce bias to the results as
potential confounders such as traffic volumes, weather conditions and road lighting
were not able to be matched with the treatment sites. Therefore, the findings of this
study should be interpreted with caution in light of these limitations.
Recommendations and Conclusion
In conclusion, this project illustrated the potential role of red light speed cameras in
reducing road trauma in Western Australia. This project also found that the reduction
in crashes observed may be partly attributed to reduced risky driving behaviours such
as speeding at red light speed camera sites. This is in line with the Safe System
approach, which intends to build safer roads along with safer road user behaviour. As
the results of this study are based on sites that were upgraded from red light cameras
to red light speed cameras with a short period of post-treatment data, it is also
recommended that the evaluation be repeated when longer post-treatment data is
available and more red light speed cameras are installed.
Recommendations include:
Identification of road intersections where a red light speed camera would be
effective in reducing crashes in both metropolitan and rural areas.
Evaluation of new red light speed camera sites when more follow-up data is
available and more sites have red light speed cameras in stalled.
Explore the effects of crash migration from the red light speed camera sites to
other intersections or sections of the road.
v
ACKNOWLEDGEMENTS
This report was funded by Main Roads Western Australia. The authors would like to
acknowledge the contributions of the following people: Maurice Cammack, John
Venable, Craig Symes, Sanath Jayamanna, Thandar Lim, Tony Radalj and Syeda
Sultana from Main Roads, WA for their time, support and feedback with various
aspects of the data management related to this project. The authors would also like to
thank Mark Ridley, Ken Burns, Adam Gomez and Tony Carabetta from WA Police
for their kind assistance in the extraction and management of the data.
1
1. INTRODUCTION
Speed and red light enforcement cameras are commonly used as road safety tools to
manage speeding and red light running behaviours. Previous research suggests that
speed enforcement devices, such as speed cameras, are significantly associated with
reductions in crashes and speeding. The effects of red light cameras are less
conclusive and have even been shown to lead to increases in frequencies of certain
types of crashes (Retting, Ferguson et al. 2003; Aeron-Thomas and Hess 2005;
Wilson, Willis et al. 2006; Erke 2009; Allsop 2010; Wilson, Willis et al. 2010).
Despite inconclusive findings, speed and red light cameras have been commonly
used around the world to reduce speed-related and red light running crashes over the
past two decades.
Western Australia (WA) also uses speed and red light cameras to assist police in
managing road safety. Speed cameras and red light cameras are located across the
Perth metropolitan area to detect vehicles travelling over the posted speed limit or
vehicles that run red lights. A previous evaluation of these cameras conducted in
1996, showed that speed cameras were effective in reducing speeding incidence and
red light cameras reduced right angle crashes at intersections (Office of the Auditor
General WA 1996). Although the report found red light cameras and speed cameras
in WA to be effective, it suggested that the selection of cameras sites should be based
on comprehensive crash data which helps identify crash black spots (Office of the
Auditor General WA 1996).
While speed cameras and red light cameras have been independently used by the
police to detect and deter speeding and/or running a red light, a new technology was
developed in 2002 that functions as both a red light and speed camera simultaneously
(Cameron, Delaney et al. 2003). This type of camera is used at locations where there
is a signalised intersection. During the green and yellow phases of the traffic signal,
these cameras operate in a fixed position as a speed camera to detect vehicles
travelling at excessive speed. During the red light phase, these cameras are able to
capture vehicles that enter the intersection during this phase, while still operating as a
speed camera. This means that a vehicle entering the intersection against the signal at
2
a speed exceeding the posted speed limit could receive two infringement notices at
the same time (Cameron, Delaney et al. 2003). Theoretically, this new red light speed
camera technology should improve road safety at intersections as this device
discourages drivers from speeding in order to pass through the intersection without
being caught for running a red light. Red light speed cameras are currently in
operation in all States of Australia, along with other police enforcement cameras.
The WA Towards Zero road safety strategy for the years 2008-2017 has
recommended the use of red light speed cameras as a part of the “Safe System
Approach” to intersection safety in metropolitan Perth (Corben, Logan et al. 2010).
The first red light speed camera was installed at the Riverside Drive and Barrack
Street intersection in Perth in July 2010. As of October 2011, there were 31 such
cameras in operation; however, one camera was removed in early 2011 due to low
crash occurrence at the site (Great Eastern Highway and Shepperton Road
intersection). Although a strong body of research has demonstrated the effectiveness
of both speed cameras and red light cameras, little is known about the effectiveness
of red light speed cameras in WA.
Only two studies to date have evaluated the effectiveness of red light speed cameras
and they were both conducted in Australia. The first evaluation was conducted in
Canberra and examined crash frequency by comparing three pairs of treated and
untreated sites in the study (Brimson and Anderson 2002). A significant reduction in
speeding was found at two of three sites but a significant increase in rear-end crashes
was also reported after installation of red light speed cameras. While the evaluation
included only one year of crash data after camera installation, the preliminary results
suggested that red light speed cameras were successful in reducing speeding.
A recent report evaluated the effectiveness of a total of 87 red light speed cameras
across Victoria using an average of three years of follow-up crash data. The study
results found significant reductions in crashes after the installation of red light speed
cameras (Budd, Scully et al. 2011). It was estimated that red light speed cameras in
Victoria significantly reduced casualty crashes by 26% (47% when only vehicles
travelling in the approach direction of the camera were considered) after controlling
for crash trends at comparison sites. Right angle and right turn crashes were reduced
3
by 44% and severe injury/fatal crashes by 37% when considering crashes involving
vehicles from all approaches. These findings are promising and the use of
comparison sites may have minimised the effect of crash migration in this study.
However, the crash reductions observed may be biased by spillover effects
(comparison sites were signalised intersections located close to the red light speed
camera sites), which may underestimate the effect of red light speed cameras. As
well, the impact of red light speed cameras on targeted risky behaviours including
speeding and red light running was not evaluated in the report.
Lastly, the impact of red light speed cameras on rear-end crashes is also important to
examine as a few studies have reported an increase in rear-end crashes after the
installation of red light cameras (Retting, Ferguson et al. 2003; Erke 2009). These
issues need to be examined in order to better understand the full impact of red light
speed cameras.
1.1. Aim
This project aims to evaluate the effectiveness and cost-effectiveness of upgraded
red light speed cameras installed in the Perth metropolitan area by examining the
reductions in all reported crash frequency, as well as serious injury crashes, right
angle/right turn through crashes and rear-end crashes as well as crash costs from July
7, 2010 to December 11, 2011. A second aim of this project is to examine changes in
the number of infringements for speeding and red light running at intersections after
they were upgraded to red light speed cameras.
1.2. Significance
The results of this analysis will provide relevant information to road authorities in
WA and guide future investments in new road technologies to reduce road casualties
in WA. The findings of the economic analysis may also assist road authorities in
managing limited resources and funding to maximise the benefits achieved from the
implementation of red light speed cameras.
4
2. METHODS
2.1. Study Design
A quasi-experimental ‘before’ and ‘after’ study design was used to assess the
reduction in all reported crash frequency as well as specific crash types including
right angle/right turn through and rear-end crashes after upgrade of red light cameras
to red light speed cameras. The reduction in serious injury crashes (fatal and
hospitalisation crashes) was also assessed.
This study compared the number of crashes occurring over a five-year period at each
of the 11 sites ‘before’ treatment to at least six months of crash data ‘after’ treatment.
This was based on the assumption that there was no difference in crash distribution
over the five-year period. In order to ensure that the change in crash frequency at the
red light speed camera sites was not due to overall crash trends at metropolitan
intersections, an appropriate comparison site was chosen for each red light speed
camera site. Comparison sites were matched on the layout of the intersection and
posted speed limits. Since treatment sites were all upgraded from red light cameras to
red light speed cameras, they were matched with comparison sites that had red light
cameras only for the duration of the study period. This is important as crash patterns
at sites with red light cameras could be considerably different from sites without red
light cameras.
As the comparison sites had no speed cameras only infringements that occurred at
sites that were upgraded to red light speed cameras were examined.
2.2. Camera Sites
Red light speed cameras were installed at sites across the Perth metropolitan area by
WA Police as part of the Road Towards Zero Action Plan, in order to reduce crashes
or minimise crash outcomes for crashes occurring at intersections.
The location for the red-light speed cameras was based on an analysis of the number
of 'right angle' and 'right turn through' crashes at signalised intersections (Cameron
5
and Delaney 2006; Cameron 2008) as well as crash severity and traffic volumes.
Following a technical analysis and other operational considerations (e.g. future road
upgrades), a list of the sites for red-light speed camera installation was produced and
is included in Appendix A. Sites that already had a red light camera installed are also
included in Appendix A. A complete list of red light speed camera sites can be found
at the WA Police website.
2.3. Data Collection
Information on each red light speed camera site, the “go live date” of each red light
speed camera and the number of traffic infringements by type and by site was
obtained from the WA Police. Crash data from January 1, 2005 to December 31,
2011 was obtained from the Integrated Road Information System (IRIS) using police
reported data which is maintained by Main Roads Western Australia.
2.3.1. Integrated Road Information System (IRIS)
The Integrated Information System (IRIS) database contains detailed information on
the characteristics of those involved in road crashes, including crash circumstances,
police reported injury, vehicle characteristics and road information related to the
crash location. Crash data for the evaluation was obtained from the crash database,
extracted for the period of January 1, 2005 up to and including December 31, 2011.
The definition of a crash used throughout this report is the definition used by the
Road Safety Council in its annual publication “Reported Road Crashes in Western
Australia” (Legge, Kirov et al. 2006). A crash is “any apparently unpremeditated
collision reported to the police which resulted from the movement of at least one
road vehicle on a road open to and used by the public and involving death or injury
to any person, or property damages”. In WA during the study period, it was
mandatory to report a crash to the police if a person was injured or if property
damage exceeded $1,000 before July 1, 2008 and $3,000 from July 1, 2008.
6
In addition to all reported crashes, specific types of crashes were also evaluated
separately. These crash types were right angle/right turn through crashes, rear-end
crashes and serious injury crashes. A serious injury crash in this report is defined as
“a road crash which resulted in a person being killed, or hospitalised”.
Critical data retrieved for use in the study were:
Crash date;
Crash severity;
Geographic location (Local Government Area) of crash;
Crash type (identified by the “Nature” code) ;
Specific crash location.
The approach adopted in this study was to use five years of pre treatment crash data
and at least six months of post treatment crash data to a maximum of five years,
excluding the trial period (approximately 10 days after installation of the red light
speed camera). The WA Police have a policy of installing camera signs on all
approaches to the intersection, irrespective of the location of the camera, to raise
driver awareness of the camera surveillance and enforcement. Hence, all crashes
which occurred at the intersection where the red light speed camera was located were
included in the analyses.
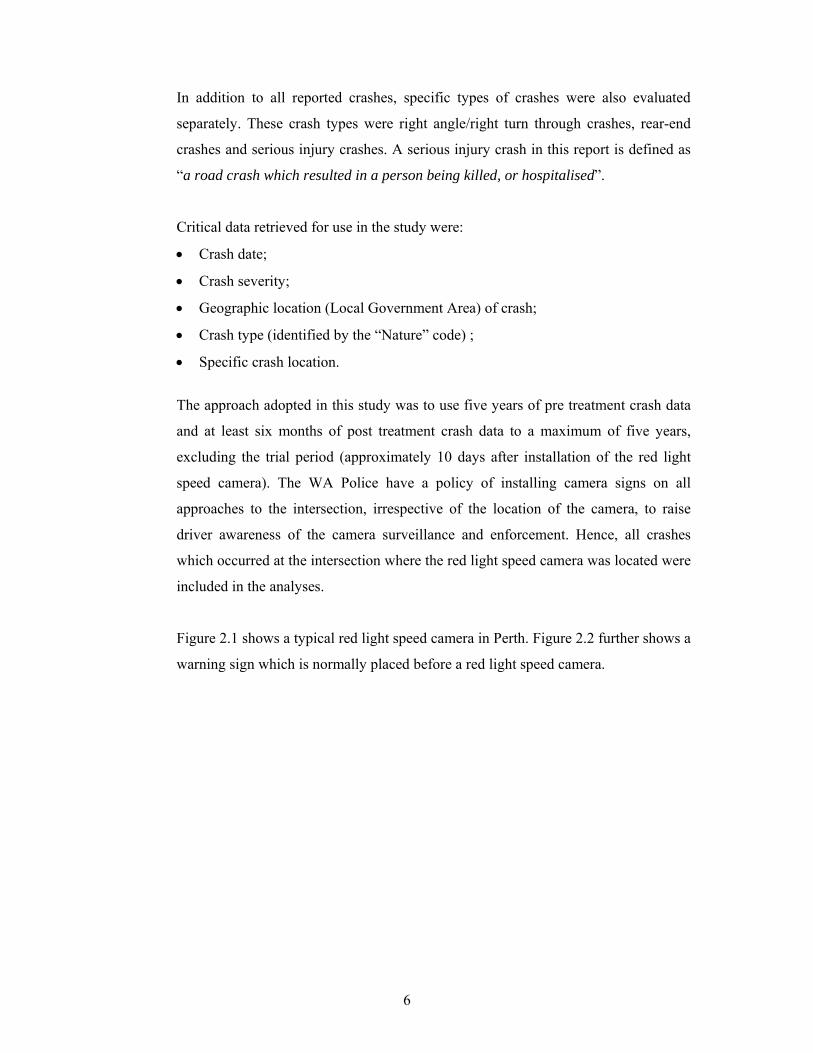
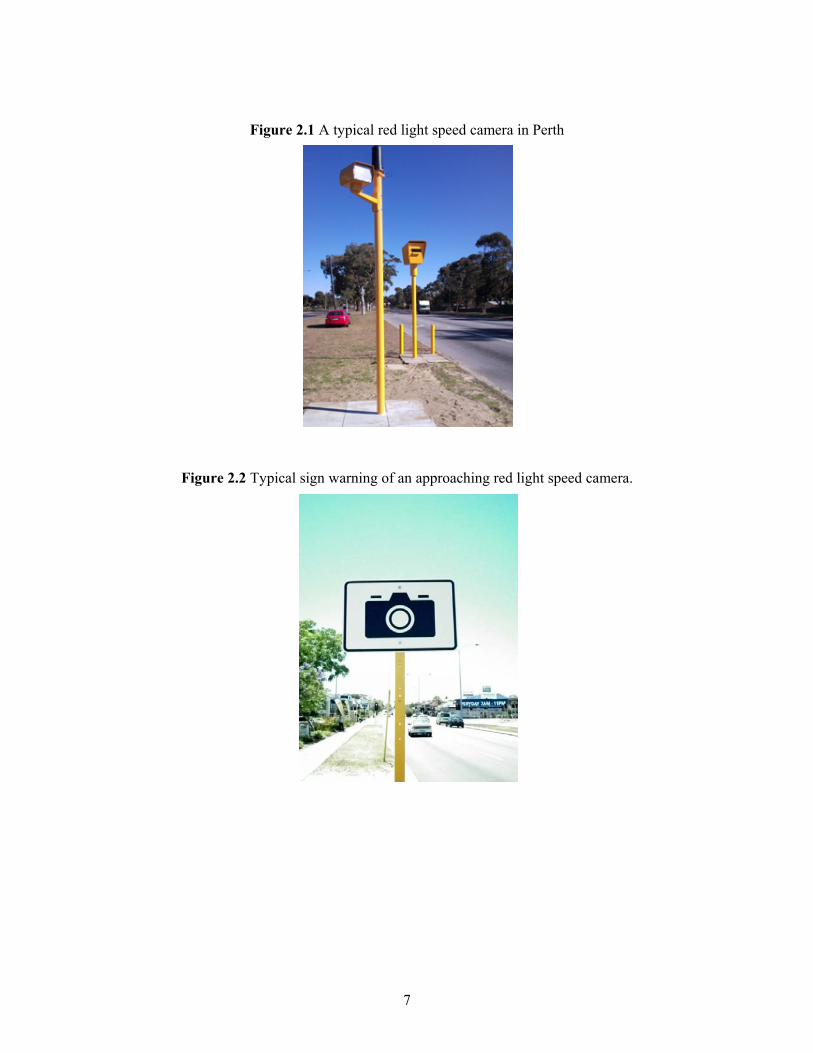
Figure 2.1 shows a typical red light speed camera in Perth. Figure 2.2 further shows a
warning sign which is normally placed before a red light speed camera.
7
Figure 2.1 A typical red light speed camera in Perth
Figure 2.2 Typical sign warning of an approaching red light speed camera.
8
2.3.2. Red light speed camera sites
WA Police provided details about each red light speed camera site. This included
information related to location and municipality, the road, the intersecting road,
treatment description, and precise active date. See Appendix A for site specific
details.
Information provided included:
Site number;
Treatment location (intersection) and Location government area (LGA);
“Go live” date of camera;
Treatment description (upgrade from a red light camera or new installation);
The average treatment costs were approximately A$150,000 per site as there was
very little reuse of existing infrastructure. The treatment life was expected to be 10
years for each red light speed camera.
2.3.3. Traffic infringement data
WA Police also provided information on traffic infringements at each red light speed
camera site from January 1, 2006 to September 23, 2011. The information included
the type of infringement, infringement description and the date and location where
the infringement occurred. Specifically, the infringement types can be grouped into
two categories: speeding and red light infringements, as well as more detailed
infringement types, such as “exceed speed limit by not more than 9 km/h” or
“contravene a red traffic control signal by proceeding beyond the stop line”. The
following table shows a list of infringements detected by the red light speed camera
divided into the two categories. In this study, only “contravene a red arrow signal”
and “contravene a red traffic control signal by proceeding beyond the stop line” are
considered to be running a red light.

9
Table 2.1 Speeding and red light traffic infringements
Speeding Red light
Exceed speed limit by not more than
9km/h
Contravene a red arrow signal by
proceeding beyond the stop line
Exceed speed limit between 10-19 km/h Contravene a red traffic control signal by
proceeding beyond the stop line
Exceed speed limit between 20-29 km/h Contravene a yellow signal or arrow
Exceed speed limit between 30-40 km/h Drive contrary to traffic lane arrows at
intersection
Exceed speed limit by 41-44 km/h or
more
Make right turn when not in far right lane
U turn at traffic lights where no U turn
permitted sign displayed
Exceed speed limit by 45 km Reckless driving (speed)
2.3.4. Selection of Comparison Sites
Ideally, a comparison site should have identical characteristics to each treated site.
This is because crash frequencies and crash types should be identical or at least very
similar to treatment sites. Comparison sites provide an indication of what would have
happened at the treated sites if no treatment was applied, thereby increasing the
validity of the findings on the effectiveness of treated sites. However, it is impossible
to match comparison and treatment sites on all road characteristics. Therefore, in this
report, intersection configuration and speed limit at the treated site were each
matched to a unique comparison site. In addition, since treatment sites were all
upgraded from red light cameras to red light speed cameras, they were matched with
comparison sites that had red light cameras only for the duration of the study period.
Main Roads WA provided a list of sites which had a red light camera installed over
the study period (see Appendix B). The final list of comparison sites is in Appendix
C.
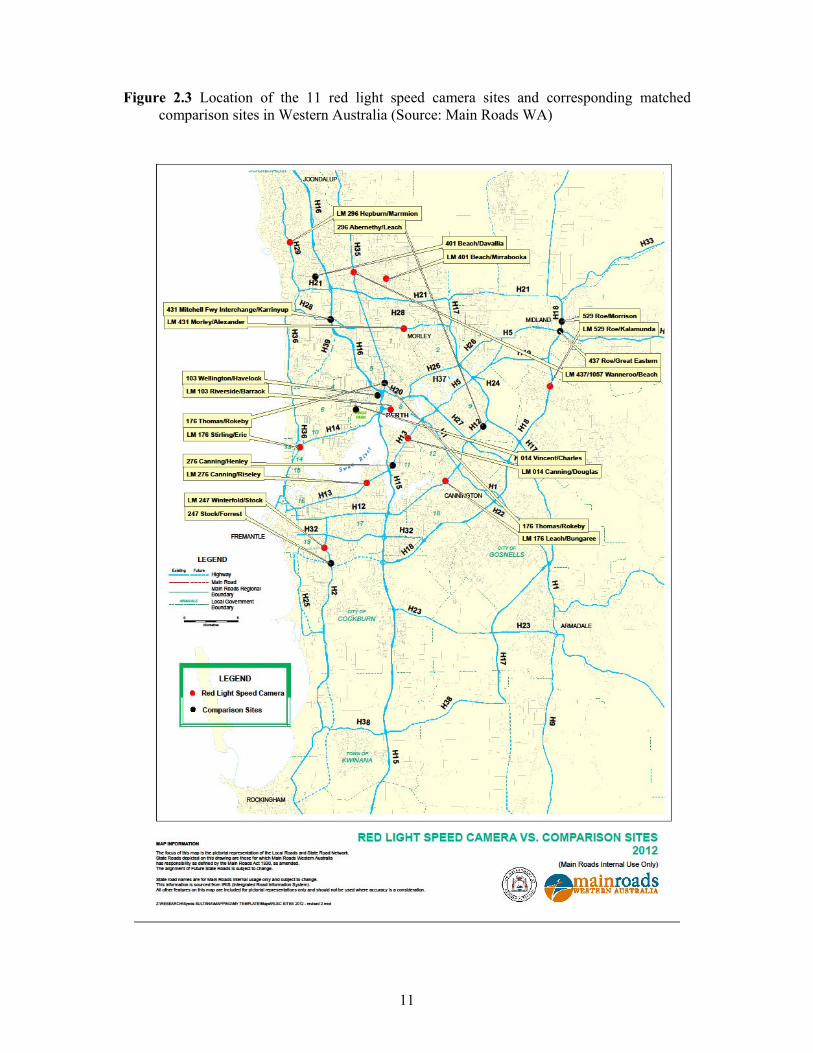
A separate database of crash data for the comparison sites was obtained from the
Integrated Road Information System (IRIS) at Main Roads Western Australia. Crash
data was retrieved for each comparison site based on the same before and after
period for its uniquely matched treatment site. If the speed limit or intersection
10
configuration of the comparison site did not match the treated site, then the
intersection with the most similar road characteristics was used. Once the matching
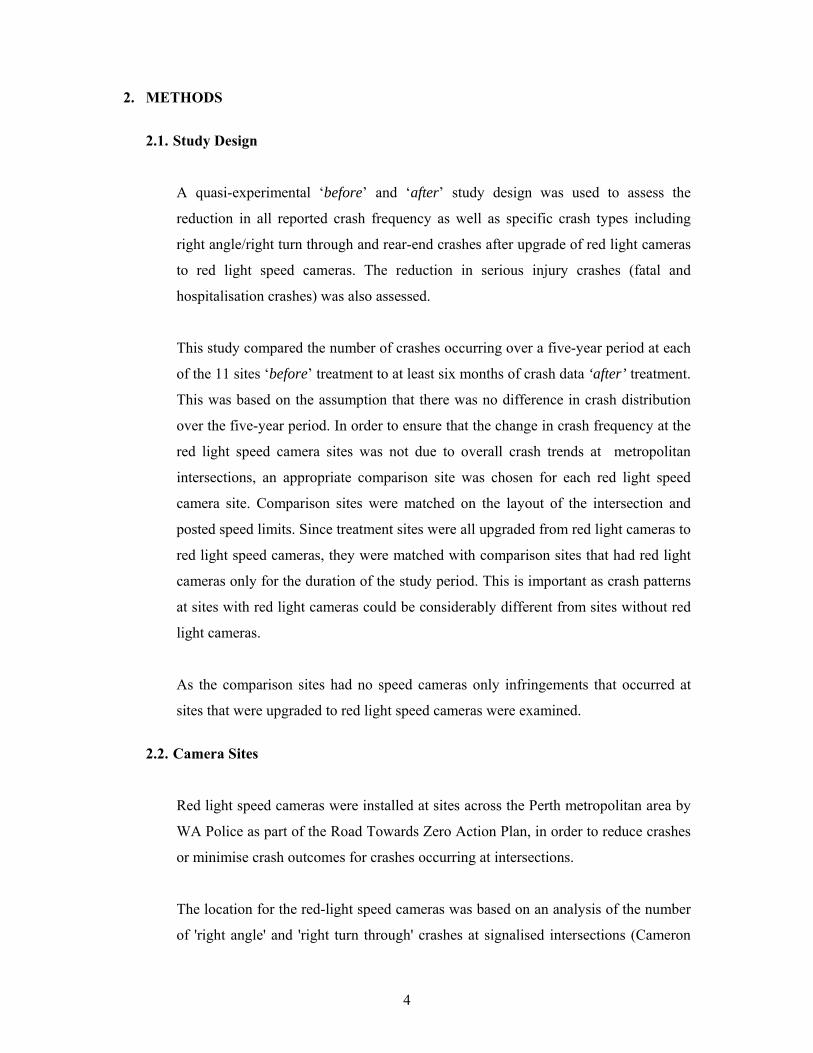
criteria were satisfied, the crash data was extracted from the IRIS database. Figure
2.3 shows the location of the 11 sites treated with red light speed cameras and their
corresponding matched comparison sites in Perth, Western Australia. Site inspections
for several red light speed camera sites and comparison sites were undertaken.
11
Figure 2.3 Location of the 11 red light speed camera sites and corresponding matched comparison sites in Western Australia (Source: Main Roads WA)

12
2.4. Factors that may affect an evaluation of red light speed cameras
All known factors that have the potential to affect the evaluation should be accounted
for when estimating the treatment effect. However, as found by Elvik (1997) the
more factors that are accounted for, the less effective the treatment appears to be.
Some of the factors that may affect this evaluation of the effectiveness of red light
speed cameras are described below. These include site-specific factors, regression-to-
the mean, crash migration, and misclassification bias.
2.4.1. Site Specific Factors
The observed change in the number and severity of crashes at a red light speed
camera site may be attributed to specific events or factors other than the red light
speed camera installation. These can include weather conditions, road lighting and
sign conspicuousness. These factors may lead to an increase in driver caution, which
could lead to a reduction in crashes that has little to do with the camera. Also, the
increased publicity about the use of the new camera may have a novelty effect, which
may disappear over time when public interest in the new technology decreases.
While it was not possible to assess these effects in this report, it seems unlikely that
site specific factors would have a significant effect on the evaluation of the camera
treatments as a whole. However, these factors may have an effect on the analysis at a
particular site (Bureau of Transport Economics 2001).
2.4.2. Regression to the Mean
Regression to the mean is a statistical phenomenon where the second measurement
of a variable will tend to be closer to the average, especially when the first
measurement is extremely high. It is possible that this occurred in the current study
when the number of crashes/infringements “before” and “after” the treatment at a
particular site was counted. The reductions in crashes/infringements observed may
simply be attributed to chance or other hazards at the sites or a combination of both,
rather than the treatment (a red light speed camera in this study). This indicates a

13
potential for overestimating the effectiveness of red light speed cameras if regression
to the mean effect is not considered.
Previous work found that at least three, and preferably five years of data is the
preferred before and after time period to smooth out any random fluctuations, as well
as providing sufficient evidence of any trend or change in an established pattern of
crashes (Nicholson 1986). Although all sites evaluated in this study used five-years
of pre treatment crash/infringement data, the average of 1.5 years of follow-up may
be too short to accommodate the random fluctuation of the data. However, the
statistical methodology used in this report recognised the level and distribution of
random variation in the data and provided appropriate confidence intervals and
significance levels.
2.4.3. Crash (accident) Migration
The term crash migration (also referred as accident migration) describes an increase
in crashes at sites that are adjacent to those treated sites following the treatment. This
is because the treatment may alter travel patterns (e.g. increase traffic volume at
intersections nearby) and thus move crashes away from the treated site to the
surrounding area. It is still controversial whether crash migration is a real effect.
Therefore the analysis has not attempted to deal with crash migration. A more in-
depth discussion of crash migration can be found elsewhere (Elvik 1997).
2.4.4. Misclassification bias
Here we specifically refer to non differential misclassification bias. This may occur
for variety of reasons. The number of crashes shown on the police reports for the two
intersections may not reflect the true number of crashes for each of these. Similarly,
misplacement of crashes might have happened for intersections determined by two
roads with separate intersections for each carriageway e.g. Reid Hwy and
Mirrabooka Ave, North and South intersections. However, WA Police have a policy
of placing signage on all approaches to the intersection, therefore all crashes from all
approaches were extracted for each intersection. Hence, the effect of
misclassification bias should be minimal.
14
2.5. Cost Data
Two types of cost data were used in the economic evaluation of the upgraded red
light speed cameras: the cost of the cameras and cost savings from a reduction in the
number of road crashes following installation of the cameras.
The cost of the cameras included the initial capital outlay plus operating and
maintenance costs. These cost data were obtained from Main Roads WA and WA
Police. The initial capital outlay of $150,000 per camera was based on actual costs,
while operating and maintenance costs and expected treatment life were estimates.
Operating costs included the cost of annual certification as well as weekly manual
test checks and monthly data transmission costs. Currently, the annual certification
cost is $10,000 per camera but is expected to halve after three years as a result of the
Police negotiating a lower rate in the next tendering process. The annual cost of the
manual test checks and data transmission was estimated as $5,700 per camera.
Maintenance costs such as pole replacement and electrical upkeep were estimated to
be $200 per camera per month.
Cost savings from fewer road crashes at treated sites were calculated based on the
road crash severity costs for Western Australia in 2011, which were provided by
Main Roads WA. For fatal, serious injury and other injury crashes, these costs are
based on the willingness to pay values for risk reduction used in New South Wales,
while the cost of property damage only crashes are based on repair and replacement
costs. Excluded from the estimates of crash costs are road user costs such as vehicle
operating costs and travel time. Applying certain treatments may change the travel
time on particular routes as well as vehicle operating costs and maintenance costs.
However, to include this type of analysis in calculating the benefits and costs of
treated sites requires extensive data and for this reason studies evaluating the cost-
effectiveness of road safety programs tend to exclude such costs (Bureau of
Transport Economics, 2001). The unit of costing used in the economic analysis of the
camera program was the road crash, with these costs shown below.
15
Crash severity $
Fatal 6,833,125
Hospital admission 297,509
Medical Treatment 70,890
Property Damage Only 11,090
The use of crash costs based on crash severity rather than type of crash (e.g. head on,
right angle turn) has the disadvantage that a single serious crash at a site can
potentially have a considerable impact on the calculation of the cost-effectiveness of
a site. However, if the number of treatment sites being assessed is sufficiently large
and the time period of the evaluation is sufficiently long, this effect should cancel
out. Recent Australian studies evaluating the cost-effectiveness of road safety
programs have used crash costs based on severity rather than crash type (Bureau of
Transport Economics, 2001; Newstead & Corben, 2001; Bureau of Infrastructure,
Transport and Regional Economics, 2009).
In this study a single fatal crash was recorded in the five years prior to the
installation of the upgraded red light speed cameras with no fatal crashes recorded in
the follow up period. Since the follow-up period of 1.5 years on average was
relatively short, the single fatal crash in the pre-treatment period was assigned as a
hospital admission crash to avoid the problem of a single random fluctuation of the
data overstating the cost-effectiveness of the program.
2.6. Statistical Analysis
The analysis compared the rate of crashes for the red light speed camera sites and the
comparisons sites “before” and “after” treatment using a generalised estimating
equation (GEE) Poisson regression model. The number of crashes in one year is a
discrete “count” variable and is assumed to follow a Poisson distribution. The use of
Poisson regression is appropriate to establish whether changes in the number of
crashes and traffic infringements that occurred at treated sites were significantly
16
different to changes in the number of crashes and traffic infringements at non-treated
sites. However, the longitudinal nature of the observations render the application of
standard Poisson regression analysis inappropriate, and methods such as the GEE
Poisson model should be used to accommodate the inherent correlation of the
longitudinal data. A GEE Poisson model takes account of the correlated nature of the
repeated measures taken before and after red light speed camera treatment. The
statistical modelling also took account of the different crash exposure periods post
treatment. Details about the GEE technique can be found in Dupont (2002) and
Twisk (2003).
An interaction term was included in each model to examine the effect of the red light
speed camera for sites compared to the comparison sites. This is because changes in
the number of crashes over time may be different between the red light speed camera
sites and the comparison sites. Therefore an interaction term between time (before
treatment and after treatment) and group (treated sites and untreated sites) will
account for these changes in the model.
A different methodology was applied to the traffic infringement analysis. As
speeding infringements prior to treatment were not recorded at any site and there
were some difficulties in extracting red light running infringement data before the
upgrade to red light speed cameras, only post treatment infringement data was
analysed. Due to the large number of infringements, a linear regression model was
fitted to the data to examine the trend in the number of speeding as well as red light
running infringements after red light speed cameras were upgraded.
The SAS (9.2) data package was used for data extraction and statistical analysis. The
SAS default, the robust variance estimator, may be biased when the number of
clusters (number of sites) is small (Horton and Lipsitz 1999). As the number of sites
was less than 20, the model-based variance estimator, which provided better
estimates (Prentice 1988), was used when performing the GEE model.
2.7. Economic Analysis
17
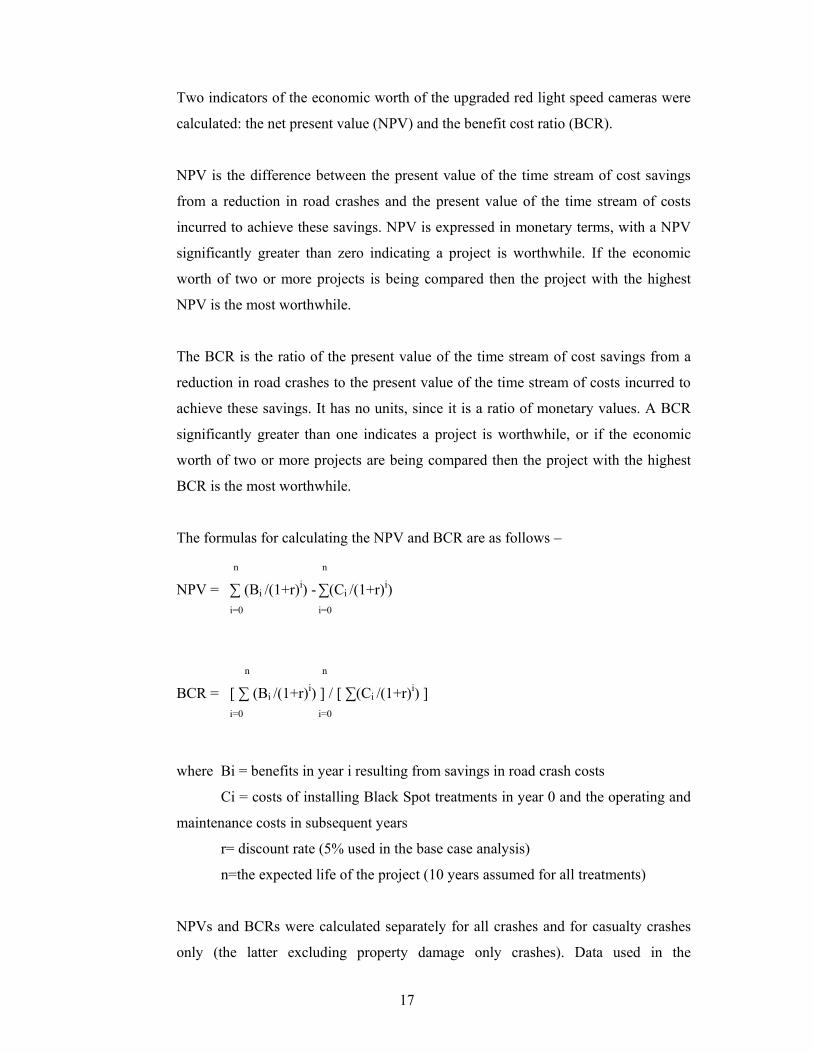
Two indicators of the economic worth of the upgraded red light speed cameras were
calculated: the net present value (NPV) and the benefit cost ratio (BCR).
NPV is the difference between the present value of the time stream of cost savings
from a reduction in road crashes and the present value of the time stream of costs
incurred to achieve these savings. NPV is expressed in monetary terms, with a NPV
significantly greater than zero indicating a project is worthwhile. If the economic
worth of two or more projects is being compared then the project with the highest
NPV is the most worthwhile.
The BCR is the ratio of the present value of the time stream of cost savings from a
reduction in road crashes to the present value of the time stream of costs incurred to
achieve these savings. It has no units, since it is a ratio of monetary values. A BCR
significantly greater than one indicates a project is worthwhile, or if the economic
worth of two or more projects are being compared then the project with the highest
BCR is the most worthwhile.
The formulas for calculating the NPV and BCR are as follows –
n n
NPV = ∑ (Bi /(1+r)i) - ∑(Ci /(1+r)i)
i=0 i=0
n n
BCR = [ ∑ (Bi /(1+r)i) ] / [ ∑(Ci /(1+r)i) ]
i=0 i=0
where Bi = benefits in year i resulting from savings in road crash costs
Ci = costs of installing Black Spot treatments in year 0 and the operating and
maintenance costs in subsequent years
r= discount rate (5% used in the base case analysis)
n=the expected life of the project (10 years assumed for all treatments)
NPVs and BCRs were calculated separately for all crashes and for casualty crashes
only (the latter excluding property damage only crashes). Data used in the
18
calculations included the following: (i) the capital costs of purchasing and installing
the upgraded red light speed cameras (ii) operating and maintenance costs (iii) the
expected treatment life (iv) the effectiveness of treatments in reducing the number of
road crashes and (v) the unit road crash cost data. Savings from a reduction in road
crash costs achieved since installing the upgraded red light speed cameras were
assumed to be maintained over the entire expected life of the cameras. In the base
case analysis, future costs and cost savings were discounted using a 5% discount rate
as suggested by Main Roads WA.
One way sensitivity analysis was conducted based on varying the assumptions
relating to the expected life of the cameras, the discount rate and the annual
certification cost. The expected life of the cameras was set at five and 15 years in the
sensitivity analysis, and the discount rate at 3% and 8%. In the case of the annual
certification cost, the assumption this would halve after three years was dropped and
the current annual certification cost of $10,000 was assumed to hold for the entire
expected life of the cameras.

19
3. RESULTS
The first section of the results summarises the analyses for all-reported and specific
types of crashes, including right angle/right turn through crashes and rear-end
crashes. The results of the analyses for serious injury crash frequency are also
summarised. The second section presents the findings for traffic infringements due to
speeding and red light running, followed by the results of the economic evaluation.
3.1. Crash effectiveness evaluation
There were a total of 31 sites where a red light speed camera was upgraded from a
red light camera or a new camera was installed. Eighteen sites were not included in
the analysis as there was insufficient follow-up data. Of the remaining 13 sites, two
of these were excluded as the number of crashes before treatment was less than five.
This report examined the remaining 11 sites, which were all upgraded from red light
cameras to red light speed cameras. The average length of follow-up crash data for
these sites was 531 days (SD=10 days) with a minimum of 511 days and a maximum
of 539 days. To view the crash numbers at each site before and after the upgrade see
Appendix D (red light speed camera sites) and Appendix E (comparison sites).
Table 3.1 shows the effect of red light speed cameras for all-reported crashes and
Table 3.2, Table 3.3 and Table 3.4 show the effect for right angle/right turn through
crashes, rear-end crashes and serious injury crashes, respectively. In both tables, β
represents the regression coefficient in terms of the log-scale of the outcome variable
so that the reduction rate is given by 1-eβ. A negative value for β indicates that the
rates for all-reported crashes (including fatality, hospitalisation, injury and PDO
crashes), right angle/right turn through crashes, or rear-end crashes decreased
following treatment, and vice versa for a positive value for β. The p value indicates
the statistical significance of the reduction or increase, and p<0.05 indicates a
significant finding. The incidence rate ratio (IRR) is shown in the last column of
Table 3.1, Table 3.2, Table 3.3 and Table 3.4. The percentage reduction in the
number of all reported crashes, right angle/right turn through and rear-end crashes
was obtained from the IRR.

20
3.2. All-Reported Crash Reduction for All Crash Types
3.2.1. All-reported crashes
Based on the estimated incidence rate ratio for the interaction term between time
(before treatment and after treatment) and group (treated sites and untreated sites), a
significant reduction of 19% (p<0.0001) was found for all-reported crashes in the
post treatment period, for the 11 treated sites compared to the untreated sites (see
Table 3.1 and Figure 3.1). To view full results see Appendix F.

Table 3.1 Red light speed camera effect on all-reported crashes** for all crash types, 2005 – 2011
Estimate (β)
Standard Error
Probability 0<p<1
IRR*
Upgraded camera sites (n=11) Time
0=before treatment 1=after treatment 0.16 0.039 <0.0001 1.17
Group 0=untreated sites
1=treated sites 0.19 0.024 <0.0001 1.21 Time* group -0.21 0.050 <0.0001 0.81
* Incidence rate ratio **Includes all crashes-fatality, hospitalisation, injury and property damage major and minor crashes
Figure 3.1 Number of all reported crashes for red light speed camera sites and comparison sites before and after treatment
0
200
400
600
800
1000
1200
1400
1600
Before After
Red light speed camera sites
Comparison sites
Num
ber
of a
ll-r
epor
ted
cras
hes

22
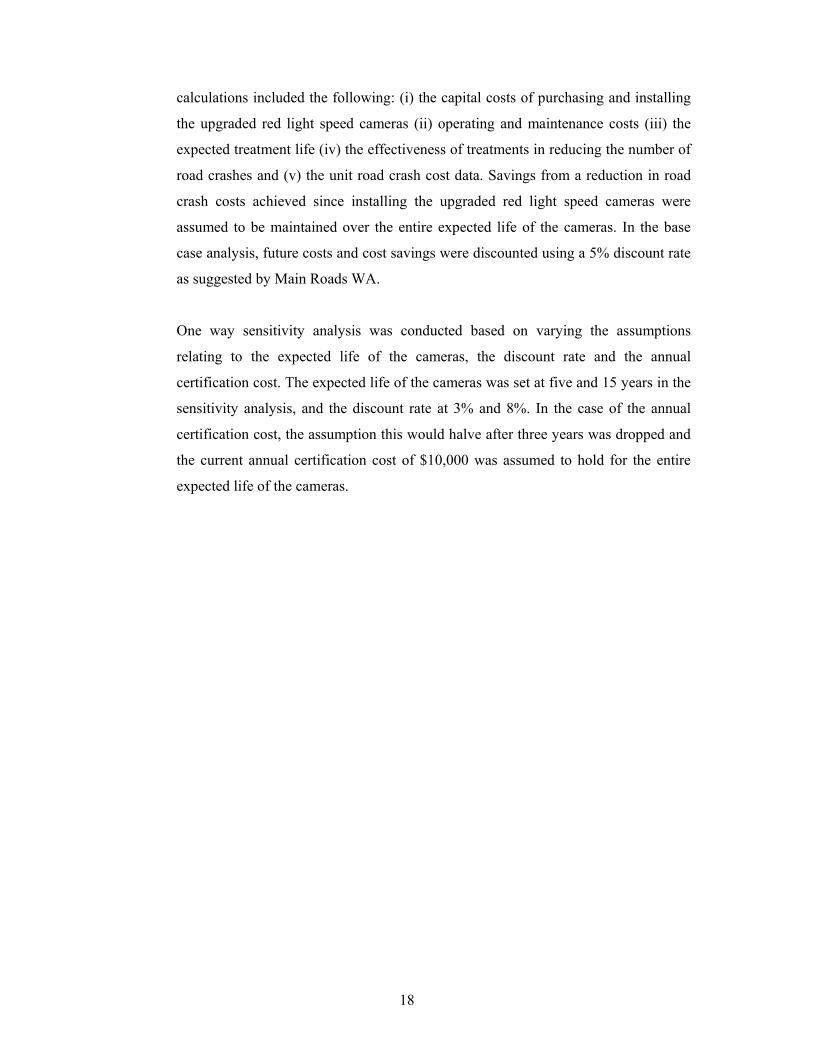
3.2.2. Right angle/right turn through crashes
Based on the estimated incidence rate ratio for the interaction term between time
(before treatment and after treatment) and group (treated sites and untreated sites), a
significant 41% reduction in right angle/right turn through crashes was identified
(p=0.004) (see Table 3.2 and Figure 3.2). To view full results see Appendix G.
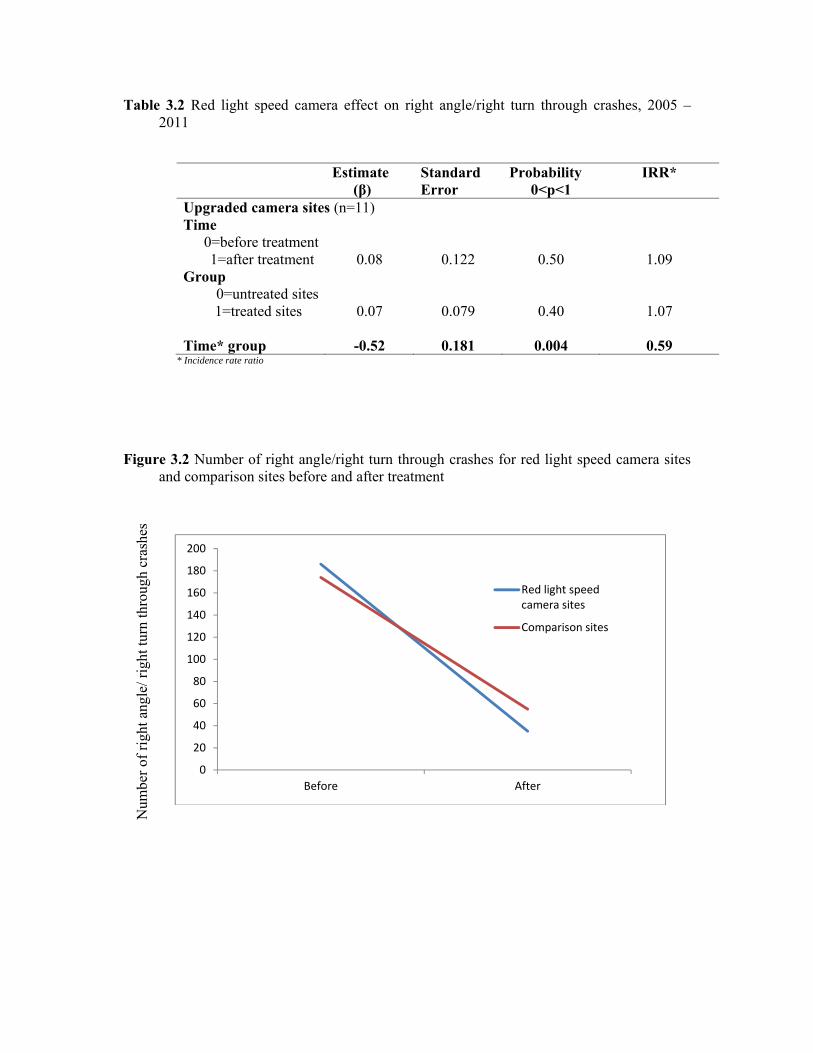
Table 3.2 Red light speed camera effect on right angle/right turn through crashes, 2005 – 2011
Estimate (β)
Standard Error
Probability 0<p<1
IRR*
Upgraded camera sites (n=11) Time
0=before treatment 1=after treatment 0.08 0.122 0.50 1.09
Group 0=untreated sites
1=treated sites 0.07 0.079 0.40 1.07 Time* group -0.52 0.181 0.004 0.59
* Incidence rate ratio
Figure 3.2 Number of right angle/right turn through crashes for red light speed camera sites and comparison sites before and after treatment
0
20
40
60
80
100
120
140
160
180
200
Before After
Red light speed camera sites
Comparison sites
Num
ber
of r
ight
ang
le/ r
ight
turn
thro
ugh
cras
hes

24
3.2.3. Rear-end crashes
Similar to the findings for all-reported crashes, there was a significant reduction in
rear-end crashes by 20% at the 11 upgraded camera sites (p<0.0001) (see Table 3.2
and Figure 3.2). To view full results see Appendix H.
Table 3.3 Red light speed camera effect on rear-end crashes, 2005 – 2011
Estimate
(β) Standard Error
Probability 0<p<1
IRR*
Upgraded camera sites (n=11) Time
0=before treatment 1=after treatment 0.23 0.042 <0.0001 1.26
Group 0=untreated sites
1=treated sites 0.19 0.027 <0.0001 1.20 Time* group -0.22 0.053 <0.0001 0.80
* Incidence rate ratio
Figure 3.3 Number of rear-end crashes for red light speed camera sites and comparison sites before and after treatment
0
100
200
300
400
500
600
700
800
900
1000
Before After
Red light speed camera sites
Comparison sites
Num
ber
of r
ear-
end
cras
hes

26
3.3. Serious Injury Crash Reduction for All Crash Types
Based on the estimated incidence rate ratio for the group* time interaction, a
significant reduction of 72% (p=0.007) for serious injury crashes was found in the
post treatment period for the 11 treated sites compared to the untreated sites (see
Table 3.5 and Figure 3.4). To view full results see Appendix I.
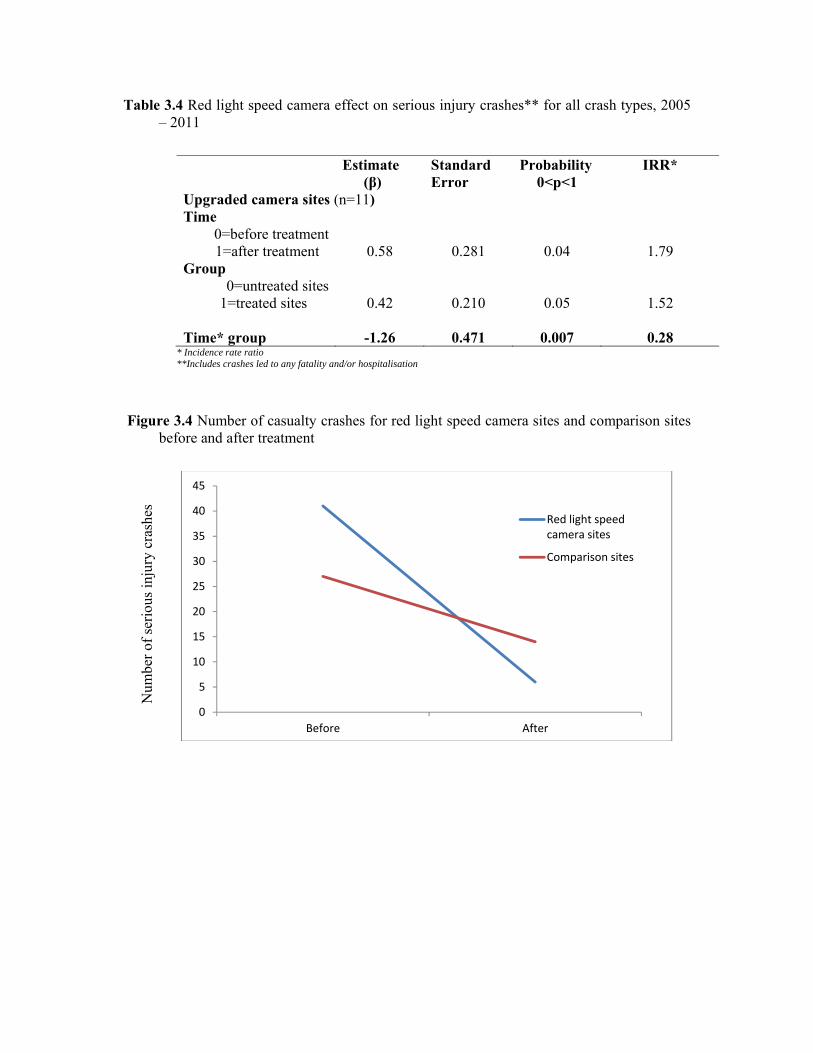
Table 3.4 Red light speed camera effect on serious injury crashes** for all crash types, 2005 – 2011
Estimate (β)
Standard Error
Probability 0<p<1
IRR*
Upgraded camera sites (n=11) Time
0=before treatment 1=after treatment 0.58 0.281 0.04 1.79
Group 0=untreated sites
1=treated sites 0.42 0.210 0.05 1.52 Time* group -1.26 0.471 0.007 0.28
* Incidence rate ratio **Includes crashes led to any fatality and/or hospitalisation
Figure 3.4 Number of casualty crashes for red light speed camera sites and comparison sites before and after treatment
0
5
10
15
20
25
30
35
40
45
Before After
Red light speed camera sites
Comparison sites
Num
ber
of s
erio
us in
jury
cra
shes
28
3.4. Analysis of Infringements
The infringement analyses were also based on the 11 sites that were upgraded from
red light cameras.
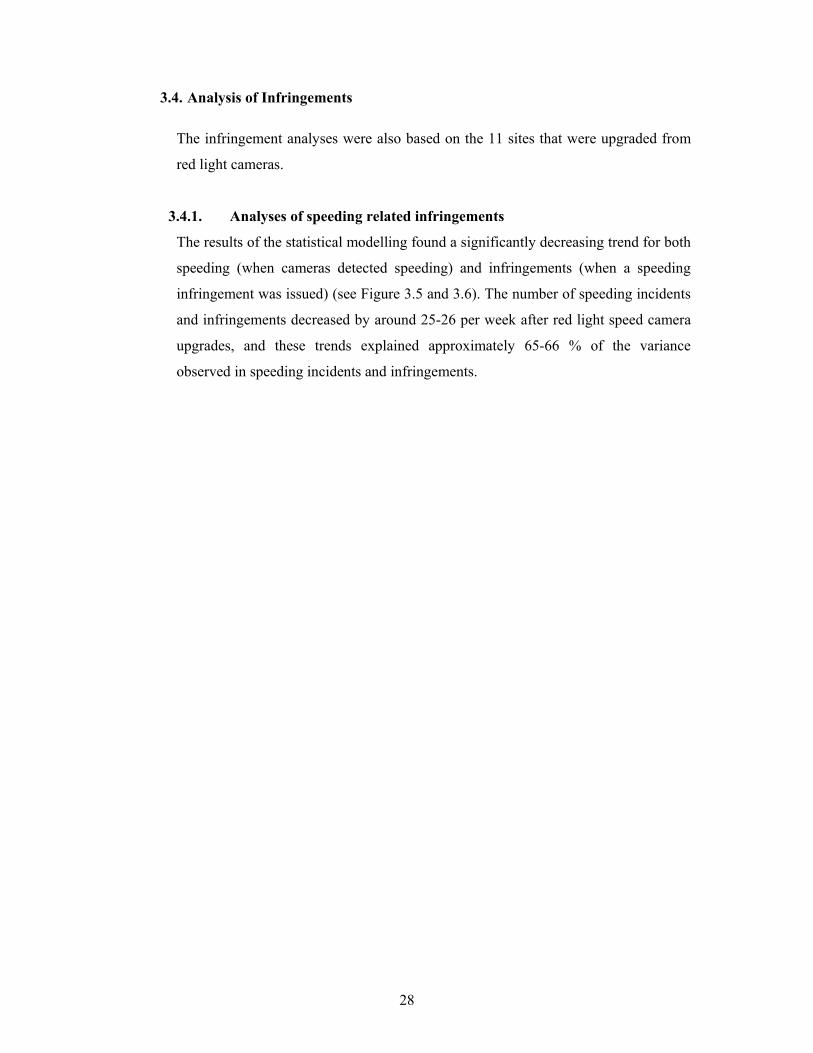
3.4.1. Analyses of speeding related infringements
The results of the statistical modelling found a significantly decreasing trend for both
speeding (when cameras detected speeding) and infringements (when a speeding
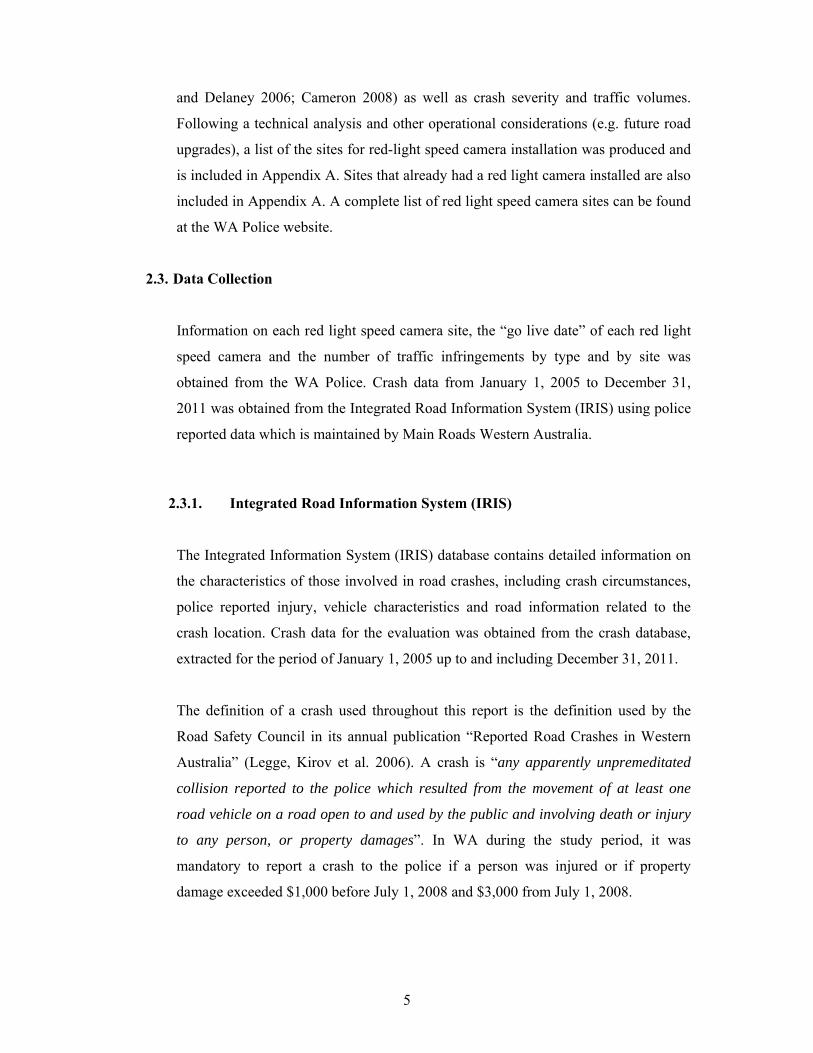
infringement was issued) (see Figure 3.5 and 3.6). The number of speeding incidents
and infringements decreased by around 25-26 per week after red light speed camera
upgrades, and these trends explained approximately 65-66 % of the variance
observed in speeding incidents and infringements.
Figure 3.5 Red light speed camera effect on speeding incidents, 2005 – 2011
Figure 3.6 Red light speed camera effect on speeding infringements, 2005 – 2011
y = ‐26x + 2187.1Adjusted R² = 0.66
0
500
1000
1500
2000
2500
3000
3500
1 3 5 7 9 11131517192123252729313335373941434547495153555759
y = ‐25x + 2109.3Adjusted R² = 0.65
0
500
1000
1500
2000
2500
3000
3500
1 3 5 7 9 11131517192123252729313335373941434547495153555759
Num
ber
of s
peed
ing
inci
dent
s
Week
Num
ber
of s
peed
ing
infr
inge
men
ts
Week
30
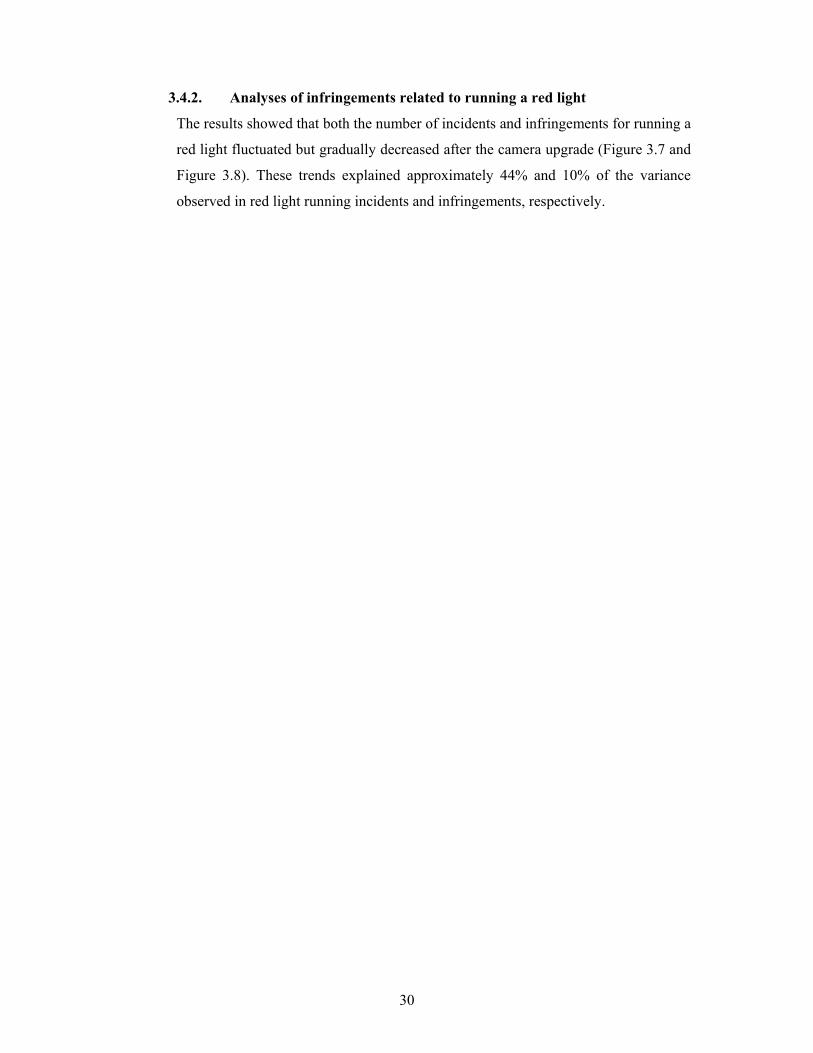
3.4.2. Analyses of infringements related to running a red light
The results showed that both the number of incidents and infringements for running a
red light fluctuated but gradually decreased after the camera upgrade (Figure 3.7 and
Figure 3.8). These trends explained approximately 44% and 10% of the variance
observed in red light running incidents and infringements, respectively.
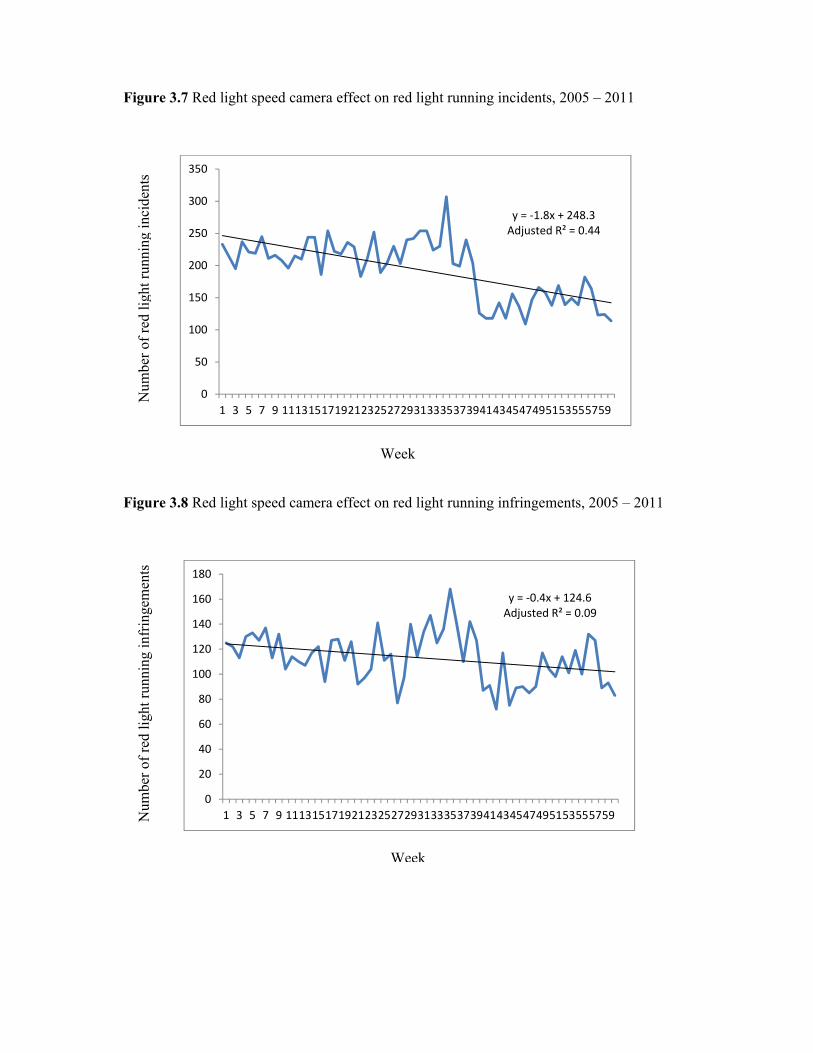
Figure 3.7 Red light speed camera effect on red light running incidents, 2005 – 2011
Figure 3.8 Red light speed camera effect on red light running infringements, 2005 – 2011
y = ‐1.8x + 248.3Adjusted R² = 0.44
0
50
100
150
200
250
300
350
1 3 5 7 9 11131517192123252729313335373941434547495153555759
y = ‐0.4x + 124.6Adjusted R² = 0.09
0
20
40
60
80
100
120
140
160
180
1 3 5 7 9 11131517192123252729313335373941434547495153555759
Num
ber
of r
ed li
ght r
unni
ng in
cide
nts
Week
Num
ber
of r
ed li
ght r
unni
ng in
frin
gem
ents
Week
32
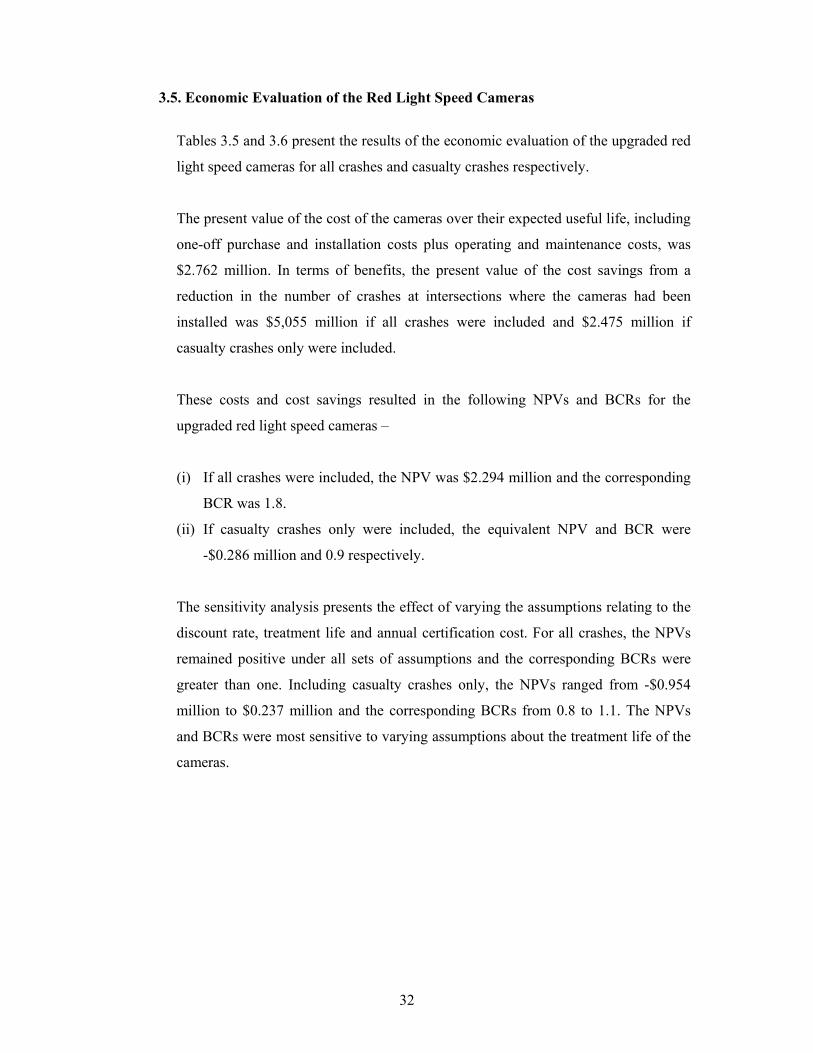
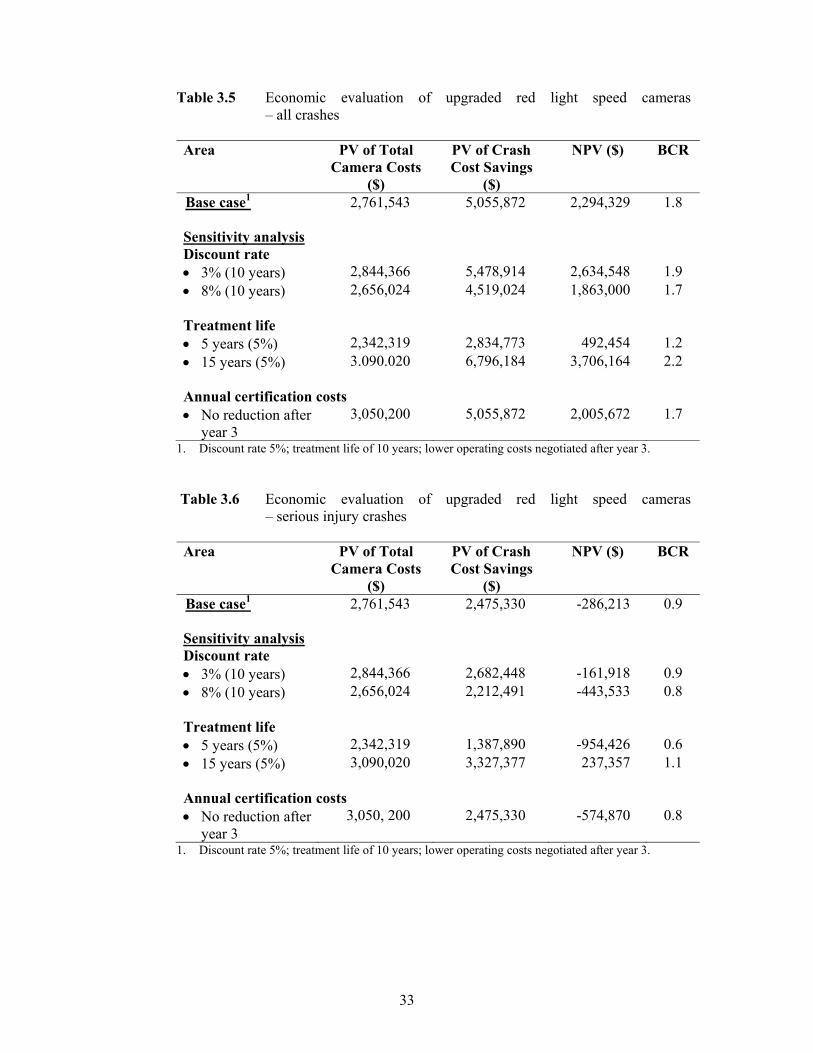
3.5. Economic Evaluation of the Red Light Speed Cameras
Tables 3.5 and 3.6 present the results of the economic evaluation of the upgraded red
light speed cameras for all crashes and casualty crashes respectively.
The present value of the cost of the cameras over their expected useful life, including
one-off purchase and installation costs plus operating and maintenance costs, was
$2.762 million. In terms of benefits, the present value of the cost savings from a
reduction in the number of crashes at intersections where the cameras had been
installed was $5,055 million if all crashes were included and $2.475 million if
casualty crashes only were included.
These costs and cost savings resulted in the following NPVs and BCRs for the
upgraded red light speed cameras –
(i) If all crashes were included, the NPV was $2.294 million and the corresponding
BCR was 1.8.
(ii) If casualty crashes only were included, the equivalent NPV and BCR were
-$0.286 million and 0.9 respectively.
The sensitivity analysis presents the effect of varying the assumptions relating to the
discount rate, treatment life and annual certification cost. For all crashes, the NPVs
remained positive under all sets of assumptions and the corresponding BCRs were
greater than one. Including casualty crashes only, the NPVs ranged from -$0.954
million to $0.237 million and the corresponding BCRs from 0.8 to 1.1. The NPVs
and BCRs were most sensitive to varying assumptions about the treatment life of the
cameras.
33
Table 3.5 Economic evaluation of upgraded red light speed cameras – all crashes
Area PV of Total
Camera Costs ($)
PV of Crash Cost Savings
($)
NPV ($) BCR
Base case1 2,761,543
5,055,872 2,294,329 1.8
Sensitivity analysis Discount rate 3% (10 years) 2,844,366 5,478,914 2,634,548 1.9 8% (10 years) 2,656,024 4,519,024 1,863,000 1.7 Treatment life 5 years (5%) 2,342,319 2,834,773 492,454 1.2 15 years (5%) 3.090.020 6,796,184 3,706,164 2.2 Annual certification costs No reduction after
year 3 3,050,200
5,055,872
2,005,672 1.7
1. Discount rate 5%; treatment life of 10 years; lower operating costs negotiated after year 3.
Table 3.6 Economic evaluation of upgraded red light speed cameras – serious injury crashes
Area PV of Total
Camera Costs ($)
PV of Crash Cost Savings
($)
NPV ($) BCR
Base case1 2,761,543
2,475,330 -286,213 0.9
Sensitivity analysis Discount rate 3% (10 years) 2,844,366 2,682,448 -161,918 0.9 8% (10 years) 2,656,024 2,212,491 -443,533 0.8 Treatment life 5 years (5%) 2,342,319 1,387,890 -954,426 0.6 15 years (5%) 3,090,020 3,327,377 237,357 1.1 Annual certification costs No reduction after
year 3 3,050, 200
2,475,330 -574,870 0.8
1. Discount rate 5%; treatment life of 10 years; lower operating costs negotiated after year 3.
34
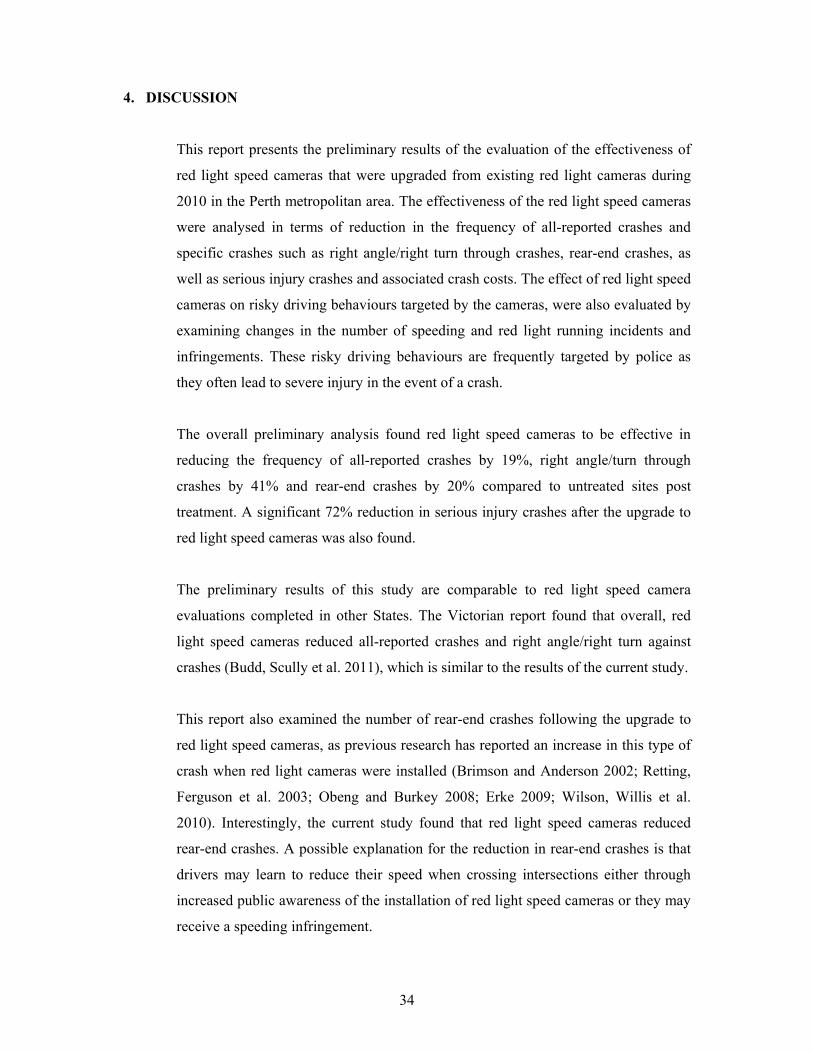
4. DISCUSSION
This report presents the preliminary results of the evaluation of the effectiveness of
red light speed cameras that were upgraded from existing red light cameras during
2010 in the Perth metropolitan area. The effectiveness of the red light speed cameras
were analysed in terms of reduction in the frequency of all-reported crashes and
specific crashes such as right angle/right turn through crashes, rear-end crashes, as
well as serious injury crashes and associated crash costs. The effect of red light speed
cameras on risky driving behaviours targeted by the cameras, were also evaluated by
examining changes in the number of speeding and red light running incidents and
infringements. These risky driving behaviours are frequently targeted by police as
they often lead to severe injury in the event of a crash.
The overall preliminary analysis found red light speed cameras to be effective in
reducing the frequency of all-reported crashes by 19%, right angle/turn through
crashes by 41% and rear-end crashes by 20% compared to untreated sites post
treatment. A significant 72% reduction in serious injury crashes after the upgrade to
red light speed cameras was also found.
The preliminary results of this study are comparable to red light speed camera
evaluations completed in other States. The Victorian report found that overall, red
light speed cameras reduced all-reported crashes and right angle/right turn against
crashes (Budd, Scully et al. 2011), which is similar to the results of the current study.
This report also examined the number of rear-end crashes following the upgrade to
red light speed cameras, as previous research has reported an increase in this type of
crash when red light cameras were installed (Brimson and Anderson 2002; Retting,
Ferguson et al. 2003; Obeng and Burkey 2008; Erke 2009; Wilson, Willis et al.
2010). Interestingly, the current study found that red light speed cameras reduced
rear-end crashes. A possible explanation for the reduction in rear-end crashes is that
drivers may learn to reduce their speed when crossing intersections either through
increased public awareness of the installation of red light speed cameras or they may
receive a speeding infringement.
35
This report also demonstrated the effectiveness of red light speed cameras for
reducing serious injury crashes by approximately 72%. These results must be
interpreted with caution due to the short exposure period post installation and small
number of sites. However, it is possible that upgrading red light cameras to red light
speed cameras did provide additional safety benefits to the intersection. Previous
research by Cameron and Delaney (2006) estimated that fixed speed cameras can
reduce serious casualty crashes by around 50% (Cameron and Delaney 2006) but
adding speed cameras to sites that already have red light cameras may only bring a
further reduction in serious injury crashes by 15% on the top of the 25-30%
reduction resulting from red light cameras (Cameron 2010). In this current report, the
reductions in serious injury crashes at red light speed camera sites may be slightly
higher (about 72%, 95%CI:29-89%) than expected (about 50%) but the difference
was not outside the bounds of chance variation. A longer term evaluation with more
post-treatment data may further confirm the real benefits of red light speed cameras.
The results of this study also found that speeding infringements significantly
decreased after the upgrade to red light speed cameras, which is similar to the
findings of the Canberra study (Brimson and Anderson 2002). It is possible this may
have contributed to the significant reduction in right angle/turn through crashes, rear-
end crashes and serious injury crashes in this study. This is consistent with the
findings of previous research which evaluated the effectiveness of speed enforcement
detection devices (Oei 1997; Brimson and Anderson 2002; Wilson, Willis et al.
2010), and found improved road safety outcomes when speed was reduced (Moore,
Dolinis et al. 1995; Hirst, Mountain et al. 2005; D'Elia, Newstead et al. 2007; Retting
and Teoh 2008). Therefore, the use of red light speed cameras may help to develop
“safer road behaviours” which is one of the key components of the Safe System
approach. However, the decreasing trend in speed related infringements will need to
be re-examined regularly to determine the ongoing effects of red light speed cameras
on driver behaviour.
The analysis of red light running infringement data showed that red light speed
cameras had less impact on red light running behaviours compared with speeding.
Although the number of infringements for running a red light seemed to gradually
reduce, the decrease in infringements was less than 1 per week. The most plausible
36
reason for this is that most drivers were aware of the red light cameras previously
located at these sites, so the new red light speed cameras only had a limited effect on
red light running behaviour. Another study with longer follow-up periods at new red
light speed camera sites should be conducted to validate the effects of red light speed
cameras on red light running behaviour.
It is a common misconception that speed cameras and other cameras are only about
raising revenue. However, previous research found that the use of red light speed
cameras resulted in fewer people speeding, running red lights and undertaking other
risky behaviours at these sites (Retting, Ferguson et al. 2003; Erke 2009; Wilson,
Willis et al. 2010). The results of this preliminary study also provide further evidence
of the positive effects of red light speed cameras in terms of reductions in both risky
driving behaviours and serious injury crashes. Although the findings of this report
may be limited by the fact that all sites were upgraded from a red light camera, the
results are still informative for road authorities and show that upgrading red light
cameras to red light speed cameras is an option for improving road safety.
Red light speed cameras are a promising new technology that has great potential to
make the road system safer and achieve the goals of WA’s road safety strategy--
Towards Zero (Office of Road Safety 2009; Main Roads WA 2011). Nevertheless,
there is other advanced technology that could be used to further protect road users in
WA. For example, in Sweden, they use a special algorithm in road systems to detect
any vehicle that passes a set distance with a speed higher than a pre-set speed, and
then sends a signal to the traffic control unit to extend the red light phase for the
drivers on the intersecting road. This system therefore detects the offenders, and
more importantly, allows the offender to pass through the intersection without a
collision (Heidstra, Goldenbeld et al. 2000). This method aligns well with the Safe
System approach which promotes designing a road system that can tolerate human
error (The Australasian College of Road Safety 2010).
A major limitation of the preliminary results of the study was the short exposure
follow-up period for the evaluation. Ideally five years of data is recommended;
however the average length of follow-up crash data was 531 days with a minimum of
511 days and a maximum of 539 days.
37
Another limitation was the inability to directly control for possible effects of “crash
migration”, where crashes prevented by road engineering treatments on one road
section may occur further along another untreated road section. As red light speed
cameras were upgraded on major or arterial roads, the chance of shifting traffic
volume to other roads is minimal. Furthermore, while every effort was made to
match treatment and comparison sites on as many variables as possible, other
possible confounding factors such as traffic volume, weather conditions and road
lighting have not been accounted for. Finally, regression to the mean may affect the
results of this study. However, since crash rates are similar in the sufficiently long
“before” period for the comparison and treatment sites, the crash reductions
observed in the “after” period seem to be due to the benefits of the upgraded red
light speed cameras.
5. CONCLUSIONS AND RECOMMENDATIONS
In conclusion, the preliminary results of this study found red light speed cameras to
be effective and should produce positive outcomes for the WA community in terms
of road safety. These cameras reduced all-reported crash frequency by 19%, right
angle/turn through crashes by 41%, rear-end crashes by 20% and serious injury
crashes by 72% and are estimated to reduce crash costs by $5.056 million over the
expected life of the treated sites. After accounting for the initial project costs of
$1.65 million ($150,000 per site) and operating and maintenance costs, the net cost
savings to the community were estimated as $2.294 million. This is the equivalent of
a BCR of 1.8.
Recommendations
This project highlighted the potential role of new technology such as red light speed
cameras for reducing road trauma in Western Australia. However, there are also
other new technologies that could be combined with the cameras to promote safer
driving and allow for human error at intersections. Such technologies comply with
the Safe System approach, which aims to modify risky driving behaviours and make
crashes less likely to occur.

38
Finally, the current analysis may not be sufficient to determine the full effect of red
light speed cameras since the evaluated sites were upgraded from red light cameras
and the post-treatment period was relatively short. However, the effectiveness of red
light speed cameras should continue to be monitored and further research undertaken
to determine their effectiveness for crash reduction with respect to crash type.
Recommendations include:
Identification of road intersections where a red light speed camera would be
effective in reducing crashes in both metropolitan and rural areas.
Evaluation of red light speed cameras when more follow-up data is available and
more sites have red light speed cameras in stalled.
Explore the effects of crash migration from the red light speed camera sites to
other intersections or sections of the road.
39
6. REFERENCES
Aeron-Thomas, A. S. and S. Hess (2005). "Red-light cameras for the prevention of road traffic crashes." Cochrane Database of Systematic Reviews(2): CD003862.
Allsop, R. (2010). The Effectiveness of Speed Cameras. Brimson, T. and R. Anderson (2002). Fixed Red Light and Speed Cameras in Canberra:
Evaluating a New Digital Technology. Budd, L., J. Scully, et al. (2011). Evaluation of the Crash Effects of Victoria’s Fixed Digital
Speed and Red-Light Cameras. Melbourne, Victoria, Monash University Accident Research Centre.
Bureau of Infrastructure, Transport and Regional Economics 2009. Cost of road crashes in Australia 2006 Canberra: Department of Infrastructure, Transport, Regional Development and Local Government
Bureau of Transport Economics (2001). The Black Spot Program 1996-2002: An Evaluation of the First Three Years. Canberra, Bureau of Transport Economics, Commonwealth of Australia.
Cameron, I. (2008). Development of strategies for best practice in speed enforcement in speed enforcement in Western Australia--Supplementary report. Melbourne, Victoria, Monash University Accident Research Centre.
Cameron, I. (2010). Policy advice to guide the placement of fixed and speed/red-light cameras in Western Australia. Melbourne, Victoria, CAMCOMP.
Cameron, I. and A. Delaney (2006). Development of strategies for best practice in speed enforcement in speed enforcement in Western Australia--Final report. Melbourne, Victoria, Monash University Accident Research Centre.
Cameron, M., A. Delaney, et al. (2003). Scientific basis for the strategic directions of the safety camera program in Victoria. Melbourne, Victoria, Monash University Accident Research Centre.
Corben, B. F., D. B. Logan, et al. (2010). "Strengthening road safety strategy development 'Towards Zero' 2008-2020-Western Australia's experience scientific research on road safety management SWOV workshop 16 and 17 November 2009." Safety Science 48(9): 1085-1097.
D'Elia, A., S. Newstead, et al. (2007). "Overall impact of speed-related initiatives and factors on crash outcomes." Annual Proceedings/Association for the Advancement of Automotive Medicine 51: 465-484.
Dupont, W. D., Ed. (2002). Statistical Modeling for Biomedical Researchers: A Simple Introduction to the Analysis of Complex Data. Cambridge, UK., Cambridge University Press.
Elvik, R. (1997). "Evaluations of road accident blackspot treatment: A case of the iron law of evaluation studies?" Accident Analysis & Prevention 29(2): 191-199.
Erke, A. (2009). "Red light for red-light cameras? A meta-analysis of the effects of red-light cameras on crashes." Accident Analysis & Prevention 41(5): 897-905.
Heidstra, J., C. Goldenbeld, et al. (2000). "New concepts in automatic enforcement." Recommended applications in a European enforcement project. The” Escape” Project, Deliverable 6.
Hirst, W. M., L. J. Mountain, et al. (2005). "Are speed enforcement cameras more effective than other speed management measures? An evaluation of the relationship between speed and accident reductions." Accident Analysis & Prevention 37(4): 731-741.
Horton, N. J. and S. R. Lipsitz (1999). "Review of software to fit generalized estimating equation regression models." American Statistician: 160-169.
40
Legge, M., C. Kirov, et al. (2006). Reported road crashes in Western Australia 2003. Perth, Road Safety Council of Western Australia.
Maher, M. J. (1990). "A bivariate negative binomial model to explain traffic accident migration." Accident Analysis & Prevention 22(5): 487-498.
Main Roads WA (2011). Main Roads WA Road Safety Strategy 2011-2015. Perth, Australia, Main Roads WA.
Moore, V. M., J. Dolinis, et al. (1995). "Vehicle speed and risk of a severe crash." Epidemiology 6(3): 258-262.
Nicholson, A. J. (1986). Estimation of the Underlying True Accident Rate: A New Procedure. 13th ARRB-5th REAA Combined Conference. Adelaide. 13.
Obeng, K. and M. Burkey (2008). "Explaining crashes at intersections with red light cameras: a note." Transportation Research Part A: Policy and Practice 42(5): 811-817.
Oei, H. (1997). Evaluation of the red light and speed camera at intersections in Amsterdam, SWOV, Leidschendam.
Office of Road Safety (2009). Towards Zero-Road Safety Strategy. Perth, Australia, Office of Road Safety.
Office of the Auditor General WA (1996). Improving road safety : speed and red light cameras, the Road Trauma Trust Fund : performance examination. West Perth, The Office.
Prentice, R. L. (1988). "Correlated binary regression with covariates specific to each binary observation." Biometrics 44(4): 1033-1048.
Retting, R. A., S. A. Ferguson, et al. (2003). "Effects of red light cameras on violations and crashes: a review of the international literature." Traffic Injury Prevention 4(1): 17-23.
Retting, R. A. and E. R. Teoh (2008). "Traffic speeds on interstates and freeways 10 years after repeal of national maximum speed limit." Traffic Injury Prevention 9(2): 119-124.
The Australasian College of Road Safety (2010). Safe System Approach, 2010. Journal of Australasian College of Road Safety.
Twisk, J., Ed. (2003). Applied Longitudinal Data Analysis for Epidemiology: A Practical Guide. Cambridge, UK, Cambridge University Press.
Wilson, C., C. Willis, et al. (2006). "Speed enforcement detection devices for preventing road traffic injuries." Cochrane Database of Systematic Reviews(2): CD004607.
Wilson, C., C. Willis, et al. (2010). "Speed cameras for the prevention of road traffic injuries and deaths." Cochrane Database of Systematic Reviews 11: CD004607.
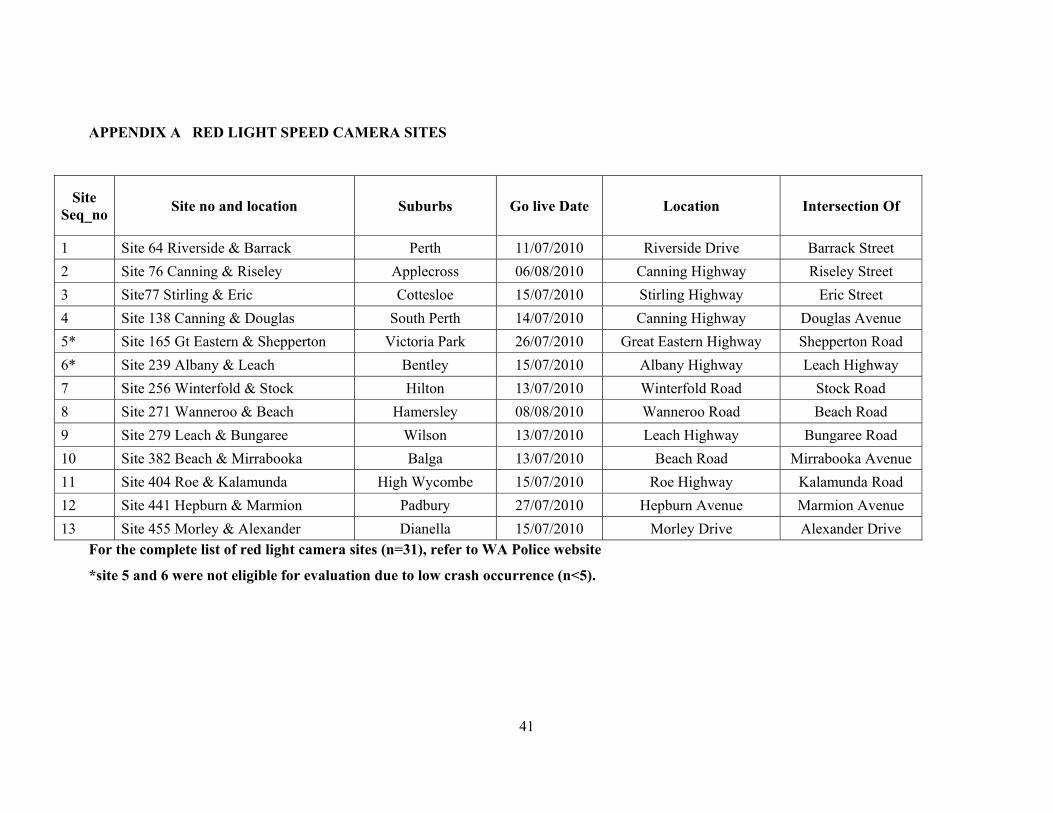
41
APPENDIX A RED LIGHT SPEED CAMERA SITES
Site Seq_no
Site no and location Suburbs Go live Date Location Intersection Of
1 Site 64 Riverside & Barrack Perth 11/07/2010 Riverside Drive Barrack Street
2 Site 76 Canning & Riseley Applecross 06/08/2010 Canning Highway Riseley Street
3 Site77 Stirling & Eric Cottesloe 15/07/2010 Stirling Highway Eric Street
4 Site 138 Canning & Douglas South Perth 14/07/2010 Canning Highway Douglas Avenue
5* Site 165 Gt Eastern & Shepperton Victoria Park 26/07/2010 Great Eastern Highway Shepperton Road
6* Site 239 Albany & Leach Bentley 15/07/2010 Albany Highway Leach Highway
7 Site 256 Winterfold & Stock Hilton 13/07/2010 Winterfold Road Stock Road
8 Site 271 Wanneroo & Beach Hamersley 08/08/2010 Wanneroo Road Beach Road
9 Site 279 Leach & Bungaree Wilson 13/07/2010 Leach Highway Bungaree Road
10 Site 382 Beach & Mirrabooka Balga 13/07/2010 Beach Road Mirrabooka Avenue
11 Site 404 Roe & Kalamunda High Wycombe 15/07/2010 Roe Highway Kalamunda Road
12 Site 441 Hepburn & Marmion Padbury 27/07/2010 Hepburn Avenue Marmion Avenue
13 Site 455 Morley & Alexander Dianella 15/07/2010 Morley Drive Alexander Drive For the complete list of red light camera sites (n=31), refer to WA Police website
*site 5 and 6 were not eligible for evaluation due to low crash occurrence (n<5).
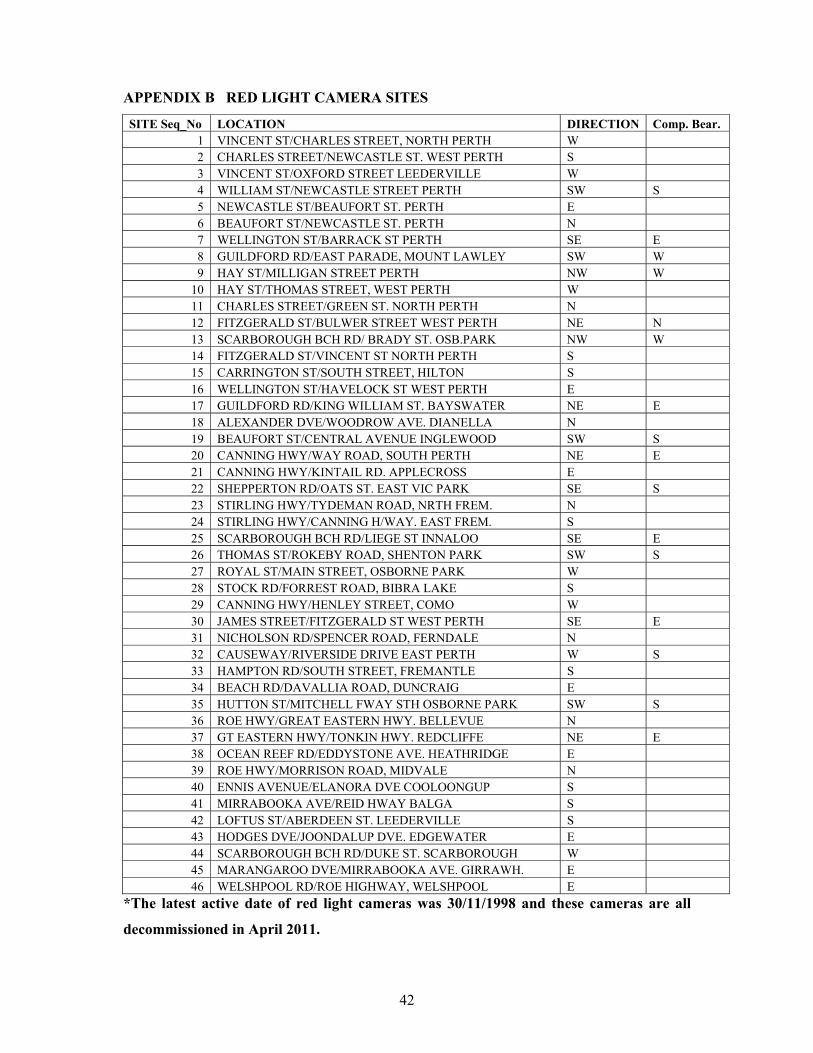
42
APPENDIX B RED LIGHT CAMERA SITES
SITE Seq_No LOCATION DIRECTION Comp. Bear. 1 VINCENT ST/CHARLES STREET, NORTH PERTH W 2 CHARLES STREET/NEWCASTLE ST. WEST PERTH S 3 VINCENT ST/OXFORD STREET LEEDERVILLE W 4 WILLIAM ST/NEWCASTLE STREET PERTH SW S 5 NEWCASTLE ST/BEAUFORT ST. PERTH E 6 BEAUFORT ST/NEWCASTLE ST. PERTH N 7 WELLINGTON ST/BARRACK ST PERTH SE E 8 GUILDFORD RD/EAST PARADE, MOUNT LAWLEY SW W 9 HAY ST/MILLIGAN STREET PERTH NW W
10 HAY ST/THOMAS STREET, WEST PERTH W 11 CHARLES STREET/GREEN ST. NORTH PERTH N 12 FITZGERALD ST/BULWER STREET WEST PERTH NE N 13 SCARBOROUGH BCH RD/ BRADY ST. OSB.PARK NW W 14 FITZGERALD ST/VINCENT ST NORTH PERTH S 15 CARRINGTON ST/SOUTH STREET, HILTON S 16 WELLINGTON ST/HAVELOCK ST WEST PERTH E 17 GUILDFORD RD/KING WILLIAM ST. BAYSWATER NE E 18 ALEXANDER DVE/WOODROW AVE. DIANELLA N 19 BEAUFORT ST/CENTRAL AVENUE INGLEWOOD SW S20 CANNING HWY/WAY ROAD, SOUTH PERTH NE E 21 CANNING HWY/KINTAIL RD. APPLECROSS E 22 SHEPPERTON RD/OATS ST. EAST VIC PARK SE S 23 STIRLING HWY/TYDEMAN ROAD, NRTH FREM. N 24 STIRLING HWY/CANNING H/WAY. EAST FREM. S 25 SCARBOROUGH BCH RD/LIEGE ST INNALOO SE E 26 THOMAS ST/ROKEBY ROAD, SHENTON PARK SW S 27 ROYAL ST/MAIN STREET, OSBORNE PARK W 28 STOCK RD/FORREST ROAD, BIBRA LAKE S 29 CANNING HWY/HENLEY STREET, COMO W 30 JAMES STREET/FITZGERALD ST WEST PERTH SE E 31 NICHOLSON RD/SPENCER ROAD, FERNDALE N 32 CAUSEWAY/RIVERSIDE DRIVE EAST PERTH W S 33 HAMPTON RD/SOUTH STREET, FREMANTLE S 34 BEACH RD/DAVALLIA ROAD, DUNCRAIG E 35 HUTTON ST/MITCHELL FWAY STH OSBORNE PARK SW S 36 ROE HWY/GREAT EASTERN HWY. BELLEVUE N 37 GT EASTERN HWY/TONKIN HWY. REDCLIFFE NE E 38 OCEAN REEF RD/EDDYSTONE AVE. HEATHRIDGE E 39 ROE HWY/MORRISON ROAD, MIDVALE N 40 ENNIS AVENUE/ELANORA DVE COOLOONGUP S 41 MIRRABOOKA AVE/REID HWAY BALGA S 42 LOFTUS ST/ABERDEEN ST. LEEDERVILLE S 43 HODGES DVE/JOONDALUP DVE. EDGEWATER E 44 SCARBOROUGH BCH RD/DUKE ST. SCARBOROUGH W 45 MARANGAROO DVE/MIRRABOOKA AVE. GIRRAWH. E 46 WELSHPOOL RD/ROE HIGHWAY, WELSHPOOL E
*The latest active date of red light cameras was 30/11/1998 and these cameras are all
decommissioned in April 2011.

APPENDIX C SELECTED COMPARISON SITES
Site Seq_no
Red light camera site Matched comparison Site Intersection Of Suburb
1 Site 64 Riverside & Barrack Wellington St Havelock St West Perth
2 Site 76 Canning & Riseley Canning Hwy Henley St Como
3 Site77 Stirling & Eric Thomas St Rokeby Rd Shenton Park
4 Site 138 Canning & Douglas Vincent St Charles St North Perth
5 Site 165 Gt Eastern & Shepperton x x x
6 Site 239 Albany & Leach x x x
7 Site 256 Winterfold & Stock Stock Rd Forrest Rd Bibra Lake
8 Site 271 Wanneroo & Beach Roe Hwy Great Eastern Hwy Bellevue
9 Site 279 Leach & Bungaree Thomas St Rokeby Rd Shenton Park
10 Site 382 Beach & Mirrabooka Beach Rd Davallia Rd Duncraig
11 Site 404 Roe & Kalamunda Roe Hwy Morrison Rd Midvale
12 Site 441 Hepburn & Marmion Abernethy Rd Leach Hwy Cloverdale
13 Site 455 Morley & Alexander Mitchell Fwy Interchange Karrinyup Rd Stirling
*site 5 & 6 were excluded from analyses due to low crash occurrence (n<5) over the 5 years before the treatment

APPENDIX D NUMBER OF CRASHES BEFORE AND AFTER TREATMENT BY TYPE OF CRASH AT EACH RED LIGHT
SPEED CAMERA SITE
Red light speed camera sites
All-reported crash Right angle/right
turn through crash Rear-end crash
Serious injury crash
Site location Before After Before After Before After Before After
Site 64 Riverside & Barrack 91 38 3 1 78 31 1 1
Site 76 Canning & Riseley 94 21 3 0 76 18 3 0
Site77 Stirling & Eric 73 20 13 3 43 8 1 1
Site 138 Canning & Douglas 80 22 18 0 52 17 2 0
Site 256 Winterfold & Stock 52 9 19 3 31 6 0 0
Site 271 Wanneroo & Beach 109 39 9 4 83 30 3 0
Site 279 Leach & Bungaree 43 15 9 2 25 13 1 0
Site 382 Beach & Mirrabooka 93 29 39 12 43 15 7 0
Site 404 Roe & Kalamunda 179 51 11 0 142 46 6 0
Site 441 Hepburn & Marmion 382 96 28 8 296 72 10 2
Site 455 Morley & Alexander 141 25 34 2 70 18 7 2
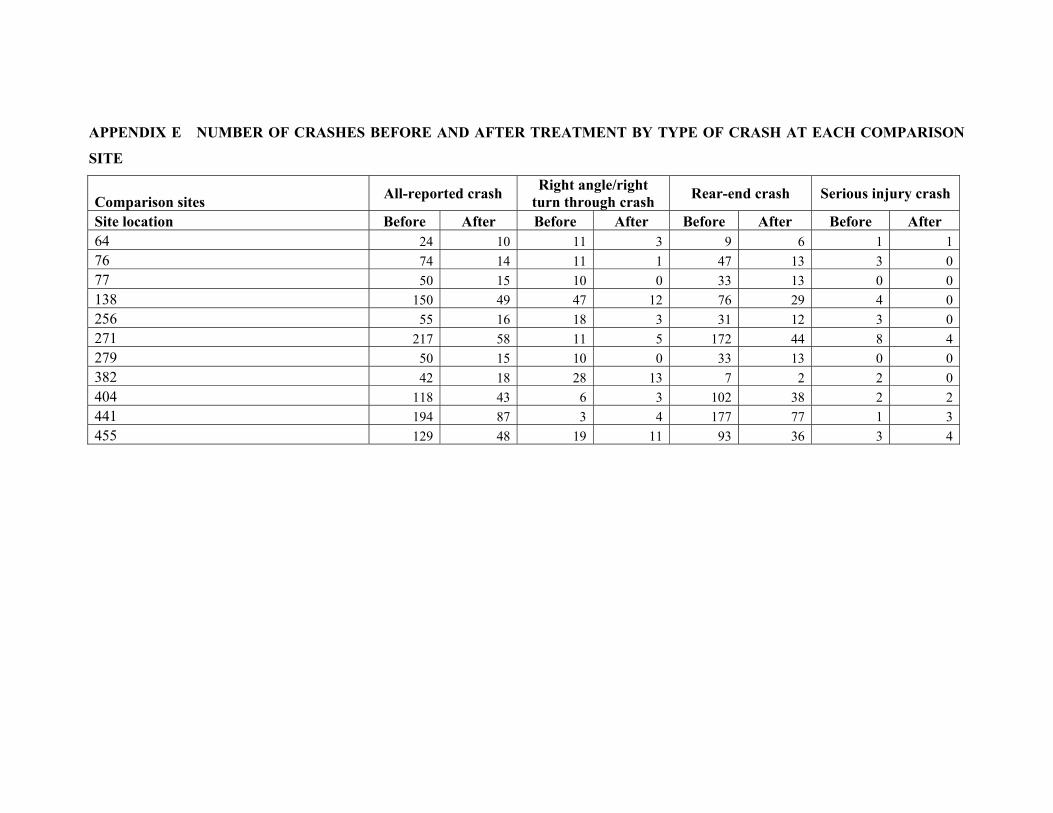
APPENDIX E NUMBER OF CRASHES BEFORE AND AFTER TREATMENT BY TYPE OF CRASH AT EACH COMPARISON
SITE
Comparison sites All-reported crash
Right angle/right turn through crash
Rear-end crash Serious injury crash
Site location Before After Before After Before After Before After 64 24 10 11 3 9 6 1 1
76 74 14 11 1 47 13 3 0
77 50 15 10 0 33 13 0 0
138 150 49 47 12 76 29 4 0
256 55 16 18 3 31 12 3 0
271 217 58 11 5 172 44 8 4
279 50 15 10 0 33 13 0 0
382 42 18 28 13 7 2 2 0
404 118 43 6 3 102 38 2 2
441 194 87 3 4 177 77 1 3
455 129 48 19 11 93 36 3 4
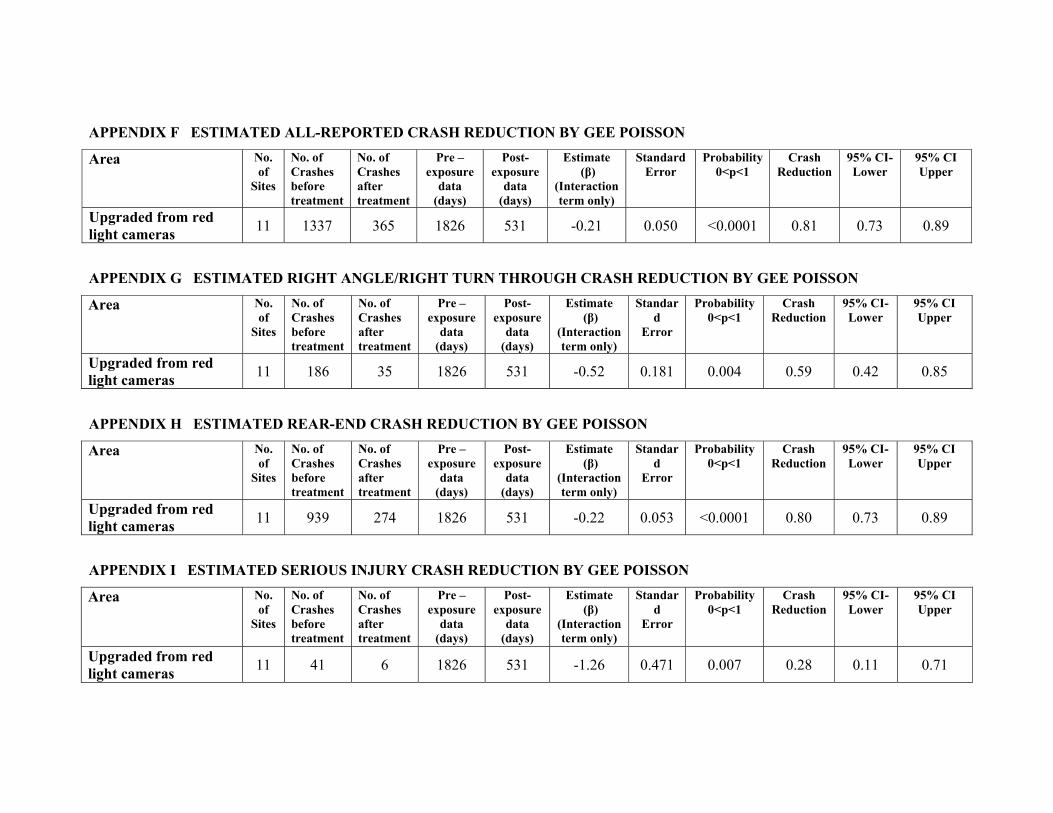
APPENDIX F ESTIMATED ALL-REPORTED CRASH REDUCTION BY GEE POISSON
Area No. of
Sites
No. of Crashes before treatment
No. of Crashes after treatment
Pre –exposure
data (days)
Post-exposure
data (days)
Estimate (β)
(Interaction term only)
Standard Error
Probability0<p<1
Crash Reduction
95% CI-Lower
95% CI Upper
Upgraded from red light cameras
11 1337 365 1826 531 -0.21 0.050 <0.0001 0.81 0.73 0.89
APPENDIX G ESTIMATED RIGHT ANGLE/RIGHT TURN THROUGH CRASH REDUCTION BY GEE POISSON
Area No. of
Sites
No. of Crashes before treatment
No. of Crashes after treatment
Pre –exposure
data (days)
Post-exposure
data (days)
Estimate (β)
(Interaction term only)
Standard
Error
Probability 0<p<1
Crash Reduction
95% CI-Lower
95% CI Upper
Upgraded from red light cameras
11 186 35 1826 531 -0.52 0.181 0.004 0.59 0.42 0.85
APPENDIX H ESTIMATED REAR-END CRASH REDUCTION BY GEE POISSON
Area No. of
Sites
No. of Crashes before treatment
No. of Crashes after treatment
Pre –exposure
data (days)
Post-exposure
data (days)
Estimate (β)
(Interaction term only)
Standard
Error
Probability 0<p<1
Crash Reduction
95% CI-Lower
95% CI Upper
Upgraded from red light cameras
11 939 274 1826 531 -0.22 0.053 <0.0001 0.80 0.73 0.89
APPENDIX I ESTIMATED SERIOUS INJURY CRASH REDUCTION BY GEE POISSON
Area No. of
Sites
No. of Crashes before treatment
No. of Crashes after treatment
Pre –exposure
data (days)
Post-exposure
data (days)
Estimate (β)
(Interaction term only)
Standard
Error
Probability 0<p<1
Crash Reduction
95% CI-Lower
95% CI Upper
Upgraded from red light cameras
11 41 6 1826 531 -1.26 0.471 0.007 0.28 0.11 0.71
