the effectiveness eheehhe1e - dtic · this study compares the strategies of code reading,...
TRANSCRIPT

7 D-AISS 136 COMPRING THE EFFECTIVENESS OF SOFTHRE TESTING
/IlSTRATEGIES(U) MARYLAND UNIV COLLEGE PARK DEPT OFCOMPUTER SCIENCE V R BASIL! ET AL. MAY 95 CS-TR-1501
UNCLSSIFIED FOSR-TR-5-985F4962 99 SF/9/2 L
EhEEhhE1E

WL- 12.51111 1.0 _ ___ii
-~~ V~I~1.2L~
liiIlia.1 1.1 ~ NNW
111.8
MICROCOPY RESOLUTION TEST CHARTNATIONAL SUREAU OF STANOAftOS - 1963 -A
k.7..

A1IO Th" 85- 0 8 0 5
technical Reoort TR-1501 Mav 1985
(0 Comparing the Effectiveness of
U Software Testing Strazegies
Victor R. Basili.Richard W. Selby, Jr.
Department of Computer Science
Universitv of Mar':land .!v
College Park
COMPUTER SCIENCETECHNICAL REPORT SERIES
DTICELECTE
OCT tI In
8 :. UNIVERsITY OF MARYLAN .
COLLEGE PARK, MARYLAT4D .
20742
g3 0 11 079
-'........ ..

Technical Report TR-1501 May 1985
Comparing the Effectiveness ofSoftware Testing Strategies
Victor R. BasiliRichard W. Selby, Jr.
Department of Computer ScienceUniversity of Maryland
College Park
DTIC
B
KEYWORDS:software testing, functional testing, structural testing, code reading,off-line software review, empirical study, methodology evaluation,software measurement
Research supported in part by the Air Force office of Scientific Research
-1 o
ontracc AFOSR-F49620-80-C-OOl and the National Aeronautics and SpaceAdministration Grant NSG-5123 to the University of Maryland. Computersupport provided in part by the facilities of NASA/Goddard Space FlightCenter and the Computer Science Center at the University of Maryland.
LDWDUTIONTATM AAjppwvod in publia i.1.cq
Sbrb t s U U i d i r D y ~ o

*.2
,17
ABSTRACT
This study compares the strategies of code reading, functional testing, and structur-
al testing In three aspects of software testing: fault detection effectiveness, fault detec-
tion cost, and classes of faults detected. Thirty two professional programmers and 42
advanced students applied the three techniques to four unit-sized programs In a frac-
tional factorial experimental design. The major results of this study are the following.
* 1) WIth the professional programmers, code reading detected more software faults and
*had a higher fault detection rate than did functional or structural testing, while func-
tional testing detected more faults than did structural testing, but functional and struc-
tural testing were not different In fault detection rate. 2) In one advanced student sub-
Ject group, code reading and functional testing were not different in faults found, but
were both superior to structural testing, while In the other advanced student subject
group there was no difference among the techniques. 3) With the advanced student sub-
Jects, the three techniques were not different In fault detection rate. 4) Number of
faults observed, fault detection rate, and total effort In detection depended on the type
of software tested. 5) Code reading detected more Interface faults than did the other
methods. 8) Functional testing detected more control faults than did the other
methods. 7) When asked to estimate the percentage of faults detected, code readers
* gave the most accurate estimates while functional testers gave the least accurate est'-
mates.
-o'
*.... ;T I ,.

Table of Contents
1 Introduction ................................................................................. 12 Testing T'ech~niques...........................................................................
*2.1 Investigation Goals .................................................................... 2*3 Emirical Study ........................................................................... 2*3.1 Iterative Experimentation............................................................. 3*3.2 Subject and Program/Fault Selection............................................... 3
3.2.1 Subjects.......................................................................... 33.2.2 Programs..........................................................................53.2.3 Faults ..............................................................................
3.2.3.1 Fault Origin........................................................... 83.2.3.2 Fault Classification................................................... 73.2.3.3 Fault Description..................................................... 8
3.3 Experimental Design................................................................... 83.3.1 Independent and Dependent Variables...................................... 83.3.2 Analysis of Variance Model.....................................................g
3.4 Experimental Operation.............I.................................................. 124 Data Analysis ............................................................................. 14
4.1 Fault Detection Effectiveness......................................................... 144.1.1 Data Distributions ............................................................. 144.1.2 Number of Faults Detected ................................................... 1s4.1.3 Percentage of Faults Detected................................................ 154.1.4 Dependence on Software Type ................................................ 184.1.5 Observable vs. Observed Faults .............................................. 174.1.8 Dependence on Program Coverage........................................... 174.1.7 Dependence on Programmer Expertise ..................................... 184.1.8 Accuracy of Self-Estimates ............................................ 1i4.1.9 Dependence on Interactions ................................................... 184.1.10 Summary of Fault Detection Effectiveness ............................... 19
4.2 Fault Detection Cost.................................................................. 194.2.1 Data Distributions ............................................................. 204.2.2 Fault Detection Rate and Total Time....................................... 204.2.3 Dependence on Software Type................................................ 214.2.4 Computer Costs ................................................................ 224.2.5 Dependence on Programmer Expertise.......................................22
* . ... . * v~ * . *~* % %*

4.2.8 Dependence on Interactions ....... ........................................... 234.2.7 Relationships Between Fault Detection Effectiveness and Cost ......... 234.2.8 Summary or Fault Detection Cost ........................................... 23
-4.3 Characterization or Faults Detected................................................. 244.3.1 Omission vs. Commission Classification.................................... 244.3.2 Six-Part Fault Classification.......o........................................... 254.3.3 Observable Fault Classification .............................................. 254.3.4 Summary of Characterization of Faults Detected ......................... 28
5 Conclusions ................................................................................. 28*8 Acknowledgement .......................................................................... 28*7 Appendices ................................................................................ 29
7.1 Appendix A. The Specifications for the Programs ............................... 29*7.2 Appendix B. The Source Code for the Programs ................................. 32
*8 References................................................................................... 50

1. Introduction
The processes of software testing and defect detection continue to challenge the
-software community. Even though the software testing and defect detection activities
are Inexact and Inadequately understood, they are crucial to the success of a software
project. The controlled study presented addresses the uncertainty of how to test soft-
ware effectively. In this investigation, common testing techniques were applied todifferent types of software by subjects that had a wide range of professional experience.
This work Is Intended to characterize how testing effectiveness relates to several factors:
testing technique, software type, fault type, tester experience, and any interactions
among these factors. This examination extends previous work by incorporating different
testing techniques and a greater number of persons and programs, while broadening the
scope of Issues examined and adding statistical significance to the conclusions.
The following sections describe the testing techniques examined, the Investigation
* goals, the experimental design, operation, analysis, and conclusions.
2. Testing Techniques
To demonstrate that a particular program actually meets Its specifications, profes-
"" sional software developers currently utilize many different testing methods. Before
* presenting the goals for the empirical study comparing the popular techniques of code
'" reading, functional testing, and structural testing, a description will be given of the test-Ing strategies and their different capabilities (see Figure 1.). In functional testing, which
Is a "black box" approach [Howden 80], a programmer constructs test data from the
program's specification through methods such as equivalence partitioning and boundary
* value analysis [Myers 79]. The programmer then executes the program and contrasts Its
actual behavior with that Indicated In the specification. In structural testing, which Is a"white box" approach [Howden 78, Howden 81], a programmer Inspects the source code
• ?and then devises and executes test cases based on the percentage of the program's state-
ments or expressions executed (the "test set coverage") [Stucki 77]. The structural cov-
.oerage criteria used was 100% statement coverage. In code reradlng by stepwise abstrac-
tion, a person identifies prime subprograms In the software, determines their functions,
,* and composes these functions to determine a function for the entire program [Mills 72.
1
:-...-. .-.- ,:.' : .. :.:.: -.. :. ., - :,,.. , -,- : -.- :.-, .:,-.:.* ---- : -- . ,: -. :,., .: -. :.,,.. -, - .,.. -,- .,

[w 7
Linger, Mills & WItt 79]. The code reader then compares this derived function and the
specifications (the intended function). In order to contrast these various strategies, an
-empirical study has been conducted using the techniques of code reading, functional
* testing, and structural testing.
2.1. Investigation Goals
The goals of this study comprise three different aspects of software testing: fault
. detection effectiveness, fault detection cost, and classes of faults detected. An applica-
- tion of the goal/question/metric paradigm [Basill & Selby 84, Basill & Weiss 84] leads to
the framework of goals and questions for this study appearing In Figure 2.
The first goal area is performance oriented and Includes a natural first question
(I.A): which of the techniques detects the most faults In the programs? The comparison
between the techniques Is being made across programs, each with a different number of
- faults. An alternate Interpretation would then be to compare the percentage of faults
. found In the programs (question I.A.1). The number of faults that a technique exposes
should also be compared; that Is, faults that are made observable but not necessarily ob-
served and reported by a tester (I.A..2). Because of the differences in types of software
and in testers' abilities, It Is relevant to determine whether the number of faults detect-
* ed Is either program or programmer dependent (I.B, I.C). Since one technique may find
* a few more faults than another, It becomes useful to know how much effort that tech-
- nique requires (I.A). Awareness of what types of software require more effort to test
(Il.B) and what types of programmer backgrounds require less effort In fault uncovering
* (II.C) Is also quite useful. If one Is Interested In detecting certain classes of faults, such
as In error-based testing (Foster 80, Valdes & Goel 831, It Is appropriate to apply a tech-
nlque sensitive to that particular type (III.A). Classifying the types of faults that are
observable yet go unreported could help focus and Increase testing effectiveness (II.B).
3. Empirical Study
Admittedly, the goals stated here are quite ambitious. In no way Is It Implied that
this study can definitively answer all of these questions for all environments. It Is In-
tended, however, that the statistically significant analysis presented lends Insights Into
their answers and Into the merit and appropriateness of each of the techniques. Note
* 2
- .. -. . . - •k . . .- , -. ,

* that this study compares the Individual application of the three testing techniques In
order to Identify their distinct advantages and disadvantages. This approach Is a first
step toward proposing a composite testing strategy, which possibly Incorporates several
testing methods. The following sections describe the empirical study undertaken to pur-
sue these goals and questions, Including the selection of subjects, programs, and experi-
mental design, and the overall operation of the study.
* 3.1. Iterative Experimentation
The empirical study consisted of' three phases. The first and second phases of the
* study took place at the University of Maryland In the Falls of 1982 and 1983 respective-
* ly. The third phase took place at Computer Sciences Corporation (CSC - Silver Spring,
MID) and NASA Goddard Space Flight Center (Greenbelt, MD) In the Fall of 1084. The
sequential experimentation supported the Iterative nature of the learning process, and
* enabled the Initial set of goals and questions to be expanded and resolved by further
* analysis. The goals were further refined by discussions of the preliminary results [Selby
83, Selby 84]. These three phases enabled the pursuit of result reproducibility across en-
vironments having subjects with a wide ran-;~ of experience.
- 3.2. Subject and Program/Fault Selection
A primary consideration In this study was to use a realistic testing environment to
- assess the effectiveness of these different testing strategies, as opposed to creating a best
* possible testing situation (Hetzel 78]. Thus, 1) the subjects for the study were chosen to
* be representative of different levels of expertise, 2) the programs tested correspond to
- different types of software and reflect common programming style, and 3) the faults In
* the programs were representative of those frequently occurring In software. Sampling
* the subjects, programs, and faults In this manner Is Intended to evaluate the testing
methods reasonably, and to facilitate the generalization of the results to other environ-
* meats.
* 3.2.1. Subjects
The three phases of the study Incorporated a total of 74 subjects: the Individual
* phases had 29, 13, and 32 subjects respectively. The subjects were selected, based on
3.

* several criteria, to be representative of three different levels of computer science exper-
* tUse: advanced, Intermediate, and junior. The number of subjects In each level of exper-
tise for the different phases appears In Figure 3.
The 42 subjects In the first two phases of the study were the members of the upper
level "Software Design and Development" course at the University of Maryland In the
Falls of 1982 and 1983. The Individuals were either upper-level computer science majors
* or graduate students; some were working part-time and all were In good academic
* standing. The topics of the course Included structured programming practices, function-al correctness, top-down design, modular specification and design, step-wise refinement,
and PDL, In addition to the presentation of the techniques of code reading, functional
testing, and structural testing. The references for the testing methods were (Mills 75,
* Fagan 78, Myers 79, Howden 801, and the lectures were presented by V. R. Basili and F.
T. Baker. The subjects from the University of Maryland spanned the Intermediate and
Junior levels of computer science expertise. The assignment of Individuals to levels of
* expertise was based on professional experience and prior academic performance In
* relevant computer science courses. The Individuals In the first and second phases had
overall averages of 1.7 (SD = 1.7) and 1.5 (SD = 1.5) years of professional experience.
The nine Intermediate subjects In the first phase had from 2.8 to 7 years of professional
experience (average of 3.9 years, SD = 1.3), and the four In the second phase had from
2.3 to 5.5 years of professional experience (average of 3.2, SD = 1.5). The twenty
Junior subjects In tihe first phases and the nine In the second phase both had from 0 to 2
years professional experience (averages of 0.7, SD =0.8, and 0.8, SD =0.8, respective-
* ly).
The 32 subjects In the third phase of the study were programming professionals
* rfrom NASA and Computer Sciences Corporation. These Individuals were inathernati-
clans, physicists, and engineers that develop ground support software for satellites.
They were familiar with all three testing techniques, but had used functional testing pri-
* mantly. A four hour tutorial on the testing techniques was conducted for the subjects
* by R. W. Selby. This group of subjects, examined In the third phase of the experiment,
* spanned all three expertise levels and had an overall average of 10.0 (SD = 5.7) years
professional experience. Several criteria were considered In the assignment of subjects to
4

expertise levels, Including years of professional experience, degree background, and their
manager's suggested assignment. The eight advanced subjects ranged from 9.5 to 20.5
years professional experience (average of 15.0, SD = 4.1). The eleven Intermediate sub-
jects ranged from 3.5 to 17.5 years experience (average of 10.9, SD = 4.9). The thirteen
junior subjects ranged from 1.5 to 13.5 years experience (average of 8.1, SD = 4.4).
3.2.2. Programs
The experimental design enables the distinction of the testing techniques while al-
lowing for the effects of the different programs being tested. The four programs ued In
the Investigation were chosen to be representative of several different types of software.
* The programs were selected specially for the study and were provided to the subjects for
testing; the subjects did not test programs that they had written. All programs were
*written In a high-level language with which the subjects were familiar. The three pro-
grams tested In the CSC/NASA phase were written In FORTRAN, and the programs
tested In the University of Maryland phases were written In the Slmpl-T structured pro-
gramming language fBasill & Turner 781. 1 The four programs tested were PI) a text
. processor, P 2 ) a mathematical plotting routine, PF) a numeric abstract data type, and
.: P4) a database maintainer. The programs are summarized in Figure 4. There exists
. some differentiation In size, and the programs are a realistic size for unit testing. Each
• .of the subjects tested three programs, but a total of four programs was used across the
three phases of the study. The programs tested In each of the three phases of the study
* appear In Figure 5. The specifications for the programs appear In Appendix A, and
their source code appears In Appendix B.
The first program is a text formatting program, which also appeared In [Myers 78].
A version of this program, originally written by [Naur 69] using techniques of program
*.correctness proofs, was analyzed In [Goodenough & Gerhart 75]. The second program Is
a mathematical plotting routine. This program was written by R. W. Selby, based
roughly on a sample program in [Jensen & Wirth 74]. The third program Is a numeric
SImpl-T Is a structured language that supports several string and file handlingprimitives, In addition to the usual control flow constructs available, for example, inPascal.
5,.
S. .. *.. . * . . . .."".**%*.*

-. 7
data abstraction consisting of a set of list processing utilities. This program was sub-
mitted for a class project by a member of an Intermediate level programming course at
the University of Maryland. [McMullin & Gannon 80]. The fourth program Is a main-
tainer for a database of bibliographic references. This program was analyzed In [Hetzel
78], and was written by a systems programmer at the University of North Carolina com-
putatlon center.
Note that the source code for the programs contalns no comments. This creates a
worst-case situation for the code readers. In an environment where code contained help-
ful comments, performance of code readers would likely Improve, especially If the source
code contained as comments the Intermediate functions of the program segments. In an
environment where the comments were at all suspect, they could then be Ignored.
3.2.3. Faults
The faults conialned In the programs tested represent a reasonable distribution of
faults that commonly occur In software [Weiss & BasIlI 85, Baslll & Perricone 84]. All
the faults In the database maintalner and the numeric abstract data type were made
during the actual development of the programs. The other two programs contain a mix
* of faults made by the original programmer and faults seeded In the code. The programs
contained a total of 34 faults; the text formatter had nine, the plotting routine had six,
the abstract data type had seven, and the database malntalner had twelve.
.* 3.2.3.1. Fault Origin
The faults in the text formatter were preserved from the article In which It ap-
peared (Myers 78], except for some of the more controversial ones [Callllau & Rubin 79].
In the mathematical plotter, faults made during program translation were supplemented
by additional representative faults. The faults In the abstract data type were the orlgi-
nal ones made by the program's author during the development of the program. The
faults In the database maIntalner were recorded during the development of the program,
-. and then reinserted Into the program. The next section describes a classification of the
different types of faults In the programs. Note that this Investigatlon of the fault
detecting ability of these techniques Involves only those types occurring In the source
code. not other types such as those In the requirements or the specifications.
o.6
.................. o-x.......... .'
.. . . . . . . . . . . . . .*° .*. . . . . . . .-.. . y .".**. ~ .K *
• - .. _.. .. . . . . . . . ..,. ... . . . .,.. . .-... ., C . .. - -. " - -. r _r r--° r,- ,r.. . -.. . , . .° °
*3.2.3.2. Fault Classification
The faults In the programs are classified according to two dIfferent abstract
classification schemes [Basill & Perricone 841. One fault categorization method separates
faults of omission from faults of commission. Faults of commission are those faults
present as a result of an Incorrect segment of existing code. For example, the wrong ar-
IthmetIc operator Is used for a computation In the right-hand-slde of an assignment
statement. Faults of omission are those faults present as a result of a programmer's for-
getting to include some entity In a module. For example, a statement is missing from
the code that would assign the proper value to a variable.
A second fault categorization scheme partitions software faults Into the six classes
of 1) Initialization, 2) computation, 3) control, 4) interface, 5) data, and 6) cosmetic.
Improperly Initializing a data structure constitutes an Initialization fault. For example,
assigning a variable the wrong value on entry to a module. Computation faults are
those that cause a calculation to evaluate the value for a variable incorrectly. The
above example of a wrong arithmetic operator in the right-hand-side of an assignment
. statement would be a computation fault. A control fault causes the wrong control flow
* path In a program to be taken for some Input. An incorrect predicate In an IF-THEN-
ELSE statement would be a control fault. Interface faults result when a module uses
and makes assumptions about entities outside the module's local environment. Interface
faults would be, for example, passing an Incorrect argument to a procedure, or assuming
In a module that an array passed as an argument was filled with blanks by the passing
routine. A data fault are those that result from the Incorrect use of a data structure.
For example, Incorrectly determining the Index for the last element In an array. Finally,
- cosmetic faults are clerical mistakes when entering the program. A spelling mistake In
,. an error message would be a cosmetic fault.
Interpreting and classifyIng faults in software Is a difficult and Inexact task. The
categorization process often requires trylng to recreate the original programmer's
misunderstanding of the problem [Johnson, Draper & Soloway 83]. The above two fault
classification schemes attempt to distinguish among different reasons that programmers
make faults In software development. They were applied to the faults In the programs
7

* In a consistent Interpretation; It is certainly possible that another analyst could have In-terpreted them differently. The separate application of each or the two classification
schemes to the faults categorized them In a mutually exclusive and exhaustive manner.
Figure 8 displays the distribution of faults In the programs according to these schemes.
3.2.3.3. Fault Description
The faults In the programs are described In Figure 7. There have been various
* efforts to determine a precise counting scheme for "defects" In software (Gloss-Soler 79,
TEE 83]. According to the explanations given, a software "fault" Is a specific manifes-
tation In the source code of a programmer "error." For example, due to a misconception
- or document discrepancy, a programmer commits an "error" (in his/her head) that may
result In more than one "fault" In a program. Using this Interpretation, software
- "faults* reflect the correctness, or lack thereof, In a program. The entities examined In
- this analysis are software faults.
* 3.3. Experiimental Design
The experimental design applied for each of the three phases of the study was a
* fractional factorial design [Cochran & Cox 50, Box, Hunter, & Hunter 781. This experi-
mental design distinguishes among the testing techniques, while allowing for variation In
* the ability of the particular Individual testing or In the program being tested. Figure 8
displays the fractional factorial design appropriate for the third phase of the study.
* Subject S1 Is In the advanced expertise level, and he structurally tested program P1,
* functionally tested program P5. and code read program P4. Notice that all of the sub-
Jects tested each of the three programs and used each of the three techniques. Of
* course, no one tests a given program more than once. The design appropriate for the
* third phase Is discussed In the following paragraphs, with the minor differences between
this design and the ones applied In the first two phases being discussed at the end of the
section.
3.3.1. Independent and Dependent Variables
The experimental design has the three Independent variables of testing technique,
software type, and level of expertise. For the design appearing In Figure 8, approprIat
8

- T
for the third phase of the study, the three main effects have the following levels:
1) testing technique: code reading, functional testing, and structural testing
2) software type: (PI) text processing, (Ps) numeric abstract data type, and (P4) data-
base maintainer
3) level of expertise: advanced, Intermediate, and junior
* Every combination of these levels occurs In the design. That Is, programmers In all
three levels of expertise applied all three testing techniques on all programs. In addition
to these three main effects, a factorial analysis of variance (ANOVA) model supports the
analysis of Interactions among each of these main effects. Thus, the Interaction effects
* of testing technique * software type, testing technique * expertise level, software type*
* expertise level, and the three-way Interaction of testing technique * software type * ex-
pertise level are Included In the model. There are several dependent variables examined
* In the study, Including number of faults detected, percentage of faults detected, total
* fault detection time, and rault detection rate. Observations from the on-line methods of
functional and structural testing also had as dependent variables number of computer
runs, amount of cpu-time consumed, maximum statement coverage achieved, connect
* time used, number of faults that were observable from the test data, percentage of
* faults that were observable from the test data, and percentage of faults observable In
* the from the test data that were actually observed by the tester.
* 3.3.2. Analysis of Variance Model
The three main effects and all the two-way and three-way Interactions effects are
called fixed effects In this factorial analysis of variance model. The levels of these effects
* given above represent all levels of interest In the Investigation. For example, the effect
of testlng technique has as particular levels code reading, functional testing, and struc-
* tural testing; these particular testing techniques are the only ones under comparison In
this study. The effect of the particular subjects that participated In this study requires
a little different Interpretation. The subjects examined In the study were random sam-
* pies of programmers from the large population of programmers at each of the levels of
expertise. Thus, the effect of the subjects on the various dependent variables Is a ran-
* dom variable, and this effect therefore is called a random effect. If the samples exam-
O8

L. . . . . . . . . . .. .. o. . - . . .
.ned are truly representative of the population of subjects at each expertise level, the
Inferences from the analysis can then be generalized across the whole population of sub-
jects at each expertise level, not just across the particular subjects In the sample chosen.
Since this analysis of variance model contains both fixed and random effects, It Is called
a mixed model. The actual ANOVA model for the design appearing In Figure 8 is given
below.
Tijkl = P + Cfi + j V-k + 6ki + Oij + Ot"/ik + 3Yjk + CtBfijk + eijki
where
T jk Is the observed response from subject I of experience level k using testing
technique I on program j
p Is the overall mean response
ci Is the main effect of testing technique I (I = 1,2,3)
is the main effect of program j (j - 1, 3, 4)
SYk Is the main effect of expertise level k (k = 1, 2, 3)6k, Is the random effect of subject I within expertise level k, a random variable (I
- 1, 2, ..., 32; k = 1, 2, 3)
Otij is the interaction effect of testing technique I with program j (I = 1, 2, 3; j
- 1, 3, 4)
a-/ik Is the Interaction effect of testing technique I with expertise level k (I = 1,
2, 3; k 1, 2, 3)
Iy'Tjk Is the Interaction effect of program J with expertise level k (j = 1, 3, 4; k -
1, 2, 3)
co Yijk Is the interaction effect of testing technique I with program j with experI-
ence level k (I = 1, 2, 3; j = 1, 3, 4; k -= 1, 2, 3)
e ijk Is the experimental error for each observatlon, a random variable
10

The F tests of hypotheses on all the fixed effects mentioned above use the error
(residual) mean square In the denominator, except for the test of the expertise level
* effect. The expected mean square for the expertise level effect contains a component for
* the actual variance of subjects within expertise level. In order to select the appropriate
error term for the denominator of the expertise level F test, the mean square for the
* effect of subjects nested within expertise level is chosen. The parameters for the random
* effect of subjects within expertise level are assumed to be drawn from a normally distri-
* buted random process with mean zero and common variance. The experimental error
terms are assumed to have mean zero and common variance.
The fractional factorial design applied In the first two phases of the analysis
* differed slightly from the one presented above for the third phase.2 In the third phase of
the study, programs P 1 , Pp and P 4 were tested by subjects In three levels of expertise.
* In both phases one and two, there were only subjects from the levels of Intermediate
and junior expertise. In phase one, programs P 1 , Pp, and Pe were tested. In phase
two, the programs tested were P 1, P V and P 4. The only modifications necessary to the
above explanation for phases one and two are 1) eliminating the advanced expertise lev-
el, 2) changing the program P subscripts appropriately, and 3) leaving out the three way
* Interaction term In phase two, because of the reduced number of subjects. In all three
* of the phases, all subjects used each of the three techniques and tested each of the three
* programs for that phase. Also, within all three phases, all possible combinations of ex-
* pertise level, testing techniques, and programs occurred.
The order of presentation of the testing techniques was randomized among the sub-
* jects In each level of expertise In each phase of the study. However, the Integrity of the
* results would have suffered If each of the programs In a given phase was tested at
* different times by different subjects. Note that each of the testing sessions took place
on a different day because of the amount of effort required. If different programs would
have been tested on different days, any discussion about the programs among subjects
2Although the data from all the phases can be analyzed together, the number ofempty cells resulting from not having all three experience levels and all four programs Inall phases limits the number of parameters that can be estimated and causes non-uniqueType IV partial sums of squares.

between testing sesons would have affected the future performance or others. There-
fore, all subjects In a phase tested the same program on the same day. The actual order
of program presentation was the order in which the programs are listed In the previous
paragraph.
3.4. Experimental Operation
Each of the three phases were broken Into five distinct pieces: training, three test-
Ing sessions, and a follow-up session. All groups of subjects were exposed to a similar
amount of training on the testing techniques before the study began. As mentioned ear-
Her, the University of Maryland subjects were enrolled In tjhe "Software Design and De-
velopment" course, and the NASA/CSC subjects were given a four-hour tutorial. Back-
ground Information on the subjects was captured through a questionnaire. Elementary
* exercises followed by a pretest covering all techniques were administered to all subjects
after the training anld before the testing sessions. Reasonable effort on the part of the
University of Maryland subjects was enforced by their being graded on the work and by
*theIr needing to use the techniques In a major class project. Reasonable effort on the
part of the NASA/CSC subjects was certain because of their desire for the study's out-
* come to Improve their software testing environment. All subjects groups were judged
* highly motivated during the study. The subjects were all familiar with the editors, ter-
* minals, machines, and the programs' Implementation language.
The Individuals were requested to use the three testing techniques to the best of
their ability. Every subject participated In all three testing sessions of his/her phase,
- using all techniques but each on a separate program. The Individuals using code read-
Ing were each given the specification for the program and Its source code. They were
* then asked to apply the methods of code reading by stepwise abstraction to detect
* discrepancies between the program's abstracted function and the specifIcation. The
functional testers were each given a specification and the ability to execute the program.
They were asked to perform equivalence partitioning and boundary value analysis to
select a set of test data for the program. Then they executed the program on this col-
lection of test data, and Inconsistencies between what the program actually performed
and what they though the specification said It should perform were noted. The struc-
12
.. ..... .. . . .......... .

tural testers were given the source code for the program, the ability to execute It, and a
description of the Input format for the program. The structural testers were asked to
examine the source and generate a set of test cases that cumulatively execute 100% of
the program's statements. When the subjects were applying an on-line technique, they
generated and executed their own test data; no test data sets were provided. The pro-
gram were Invoked through a test driver that supported the use the of multiple Input
data sets. This test driver, unbeknown to the subjects, drained off the Input cases sub-
mitted to the program for the experimenter's later analysis; the programs could only be
accessed through a test driver.
A structural coverage tool calculated the actual statement coverage of the test set
and which statements were left unexecuted for the structural testers. After the struc-
tural testers generated a collection of test data that met (or almost met) the 100% cov-
erage criteria, no further execution of the program or reference to the source code was
* allowed. They retained the program's output from the test cases they had generated.
* These testers were then provided with the program's specification. Now that they knew
what the program was Intended to do, they were asked to contrast the program's
* specification with the behavior of the program on the test data they derived. This
* scenario for the structural testers was necessary so that "observed" faults could be com-
pared.
At the end of each of the testing sessions, the subjects were asked to give a reason-
- 'able estimate of the amount of time spent detecting faults with a given testing tech-
* nlciue. The University of Maryland subjects were assured that this had nothing to with
the grading of the work. There seemed to be little Incentive for the subjects In any of
* the groups not to be truthful. At the completion of each testing session, the
* NASA/CSC subjects were also asked what percentage of the faults In the program that
they thought were uncovered. After all three testing sessions In a given phase were
completed, the subjects were requested to critique and evaluate the three testing tech-
niques regarding their understandability, naturalness, and effectiveness. The University
* of Mlaryland subjects submitted a written critique, while a two hour debrIefing forum
was conducted for the NASA/CSC Individuals. In addition to obtaining the Impressions
* of the Individuals, these follow-up procedures gave an understanding of how well the
13

subjects were comprehending and applying the methods. These final sessions also
afforded the Participants an opportunity to comment on any particular problems they
* had with the techniques or In applying them to the given programs.
* 4. Data Analysis
The analysis of the data collected from the various phases of the experiment Is
* presented according to the goal and question framework discussed earlier.
* 4.1. Fault Detection Effectiveness
The first goal area addresses the fault detection effectiveness of each of the tech-
* niques. Figure g presents a summary of the measures that were examined to pursue this
goal area. A brief description of each measure Is as follows - (*) means only relevant for
- on-line testing. a) # Faults detected - the number of faults detected by a subject ap-
plying a given testing technique on a given program. b) % Faults detected - the per-
* centage of a program's faults that a subject detected by applying a testing technique to
the program. c) # Faults observable ()-the number of faults that were observable
* from the program's behavior given the Input data submitted. d) % Faults observable
* (*) -the percentage of a program's faults that were observable from the program's
* behavior given the Input data submitted. e) 7b Detected/observable ()-the percen-
* tage of faults observable from the program's behavior on the given Input set that were
actually observed by a subject. f) % Faults felt found - a subject's estimate of the per-
centage of a program's faults that he/she thought were detected by his/her testing. g)
* Maximum statement coverage ()-the maximum percentage of a program's statements
that were executed In a set of test cases.
* 4.1.1. Data Distributions
The actual distribution of the number of faults observed by the subjects appears In
Figure 10, broken down by phase. From FIgures 9 and 10, the large variation In perfor-
* mance among the subjects Is clearly seen. The mean number of faults detected by the
subjects is displayed In Figure 11, broken down by technique, program, expertise level,
and phase.
14
. . . . . . . .. .. .. . . . . . . . . ~~.. . . . . * *- ****.*

* 4.1.2. Number of Faults Detected
The first question under this goal area asks which of the testing techniques detected
the most faults in the programs. The overall F-test of the techniques detecting an equal
number of faults in the programs is rejected In the first and third phases of the study
(a<.024 and a<.0001, respectively; not rejected in phase two, a>.05). Recall that the
phase three data was collected from 32 NASA/CSC subjects, and the phase one data
was from 29 University of Maryland subjects. With the phase three data, the contrast
of "reading - 0.5 * (functional + structural)" estimates that the technique of code read-
Ing by stepwise abstraction detected 1.24 more faults per program than did either of the
other techniques (a< .0001, c.l. 0.73 - 1.75). 3 Note that code reading performed well
* even though the professional subjects' primary experience was with functional testing.
Also with the phase three data, the contrast of "functional - structural" estimates that
the technique of functional testing detected 1.11 more faults per program than did
S•-structural testing (a<.0007, c.l. 0.52 - 1.70). In the phase one data, the contrast of
S"0.5 * (reading + functional) - structural" estimates that the technique of structural
testing detected 1.00 fault less per program than did either reading or functional testing
* (a<.0065, c.l. 0.31 - 1.89). In the phase one data, the contrast of "reading - function-
al" was not statistically different from zero (a>.05). The poor performance of structur-
al testing across the phases suggests the inadequacy of using statement coverage criteria.
The above pairs of contrasts were chosen because they are linearly independent.
4.1.3. Percentage of Faults Detected
Since the programs tested each had a different number of faults, a question In the
earlier goal/question framework asks which technique detected the greatest percentage
* of faults In the programs. The order of performance of the techniques Is the same as
above when the percentage of the programs' faults detected are compared. The overall
F-tests for phases one and three were rejected as before (a<.037 and a< .0001 respec-
tively; not rejected In phase two, a> .05). Applying the same contrasts as above: a) in
phase three, reading det-"cted 16.0% more faults per program than did the other tech-
- The probably of Type I error Is reported, the probability of erroneously rejectingthe null hypothesis. The abbreviation "c.l." stands for 95% confidence Interval.
15
,~~~~~~~~~~~~~~~~~~~~~~..- ,,.'.2... . ... ;. ... ~i a ..... _-.....:...... :.,........- .:.......- ,. ..;': ,,
nIques (a<.0001, c.I. 9.9 - 22.1), and functional detected 11.2% more faults than did
structural (a<.003, c.i. 4.1 - 18.3); b) In phase one, structural detected 13.2% fewer of
a program's faults than did the other methods (a<.011, c.l. 3.5 - 22.9), and reading and
functional were not statistically different as before.
4.1.4. Dependence on Software Type
Another question In this goal area queries whether the number or percentage of
faults detected depends on the program being tested. The overall F-test that the
number of faults detected is not program dependent Is rejected only In the phase three
data (a<.0001). Applying Tukey's multiple comparison on the phase three data reveals
that the most faults were detected In the abstract data type, the second most In the
text formatter, and the least number of faults were found In the database maintainer
--'* (simultaneous a< .05). When the percentage of faults found In a program Is considered,
however, the overall F-tests for the three phases are all rejected (Cf<.027, a<.01, and
* < .0001 in respective order). Tukey's -multiple comparison yields the following order-
Ings on the programs (all simultaneous a<.05). In the phase one data, the ordering was
(data type = plotter) > text formatter; that is, a, higher percentage of faults were
detected In either the abstract data type or the plotter than were found In the text for-
matter; there was no difference between the abstract data type and the plotter In the
percentage found. In the phase two data, the ordering of percentage of faults detected
S.was plotter > (text formatter c-- database malntalner). In the phase three data, the
ordering of percentage of faults found In the programs was the same as the number of
faults found, abstract data type > text formatter > database maintainer. Summarz-
Ing the effect of the type of software on the percentage of faults observed: 1) the pro-
* grams with the highest percentage of their faults detected were the abstract data type
and the mathematical plotter, the percentage detected between these two was not sta-
tistically different; 2) the programs with the lowest percentage of their faults detected
were the text formatter and the database malntalner; the percentage detected between
- these two was not statistically different In the phase two data, but a higher percentage
or faults In the text formatter was detected In the phase three data.
S%16
'~~~~~~~~~~~~~~~~..........- ........,.......... .....v....... ....................... ;...........-. .... .. :-. . . . .. . . . . . . . . . . . . . . . . . . . . . . . . . .' . .. . .. .

4.1.5. Observable vs. Observed Faults
One evaluation criteria of the success of a software testing session Is the number of
faults detected. An evaluation criteria of the particular test data generated, however, Is
* the ability of the test data to reveal faults In the program. A test data set's ability to
uncover faults In a program can be measured by the number or percentage of a
* program's faults that are made observable from execution on that Input. Distinguishing
* the faults observable In a program from the faults actually observed by a tester
* highlights the differences In the activities of test data generation and program behavior
examination. As shown In Figure 8, the average number of the programs' faults observ-
able was 88.0%S when Individuals were either functional testing or structurally testing.
Of course, with a nonexecutlon- based technique such as code reading, 100% of the faults
are observable. Test data generated by subjects using the technique of functional test-
* Ing resulted In 1.4 more observable faults (a<.0002, c-i. 0.79 - 2.01) than did the use of
structural testing In phase one of the study; the percentage difference of functional over
structural was estimated at 20.0% (a~<.0002, c.l. 11.2 - 28.8). The techniques did not
differ In these two measures In the third phase of the study. However, just considering
* the faults that were observable from the submitted test data, functional testers detected
* 18.5% more of these observable faults than did structural testers In the phase three data
(a< .0016, c.I. 8.9 - 28.1); they did not differ In the phase one data. Note that all faults
In the programs could be observed In the programs' output given the proper Input data.
When using the on-line techniques of functional and structural testing, subjects detected
70.3% of the faults observable In the program's output. In order to conduct a successful
testing session, faults In a pro;ram must be both revealed and subsequently observed.
* 4.1.6. Dependence on Program Coverage
Another measure of the ability of a test set to reveal a program's faults Is the per-
centage of a program's statements that are executed by the test set. The average max-
imum statement coverage achieved by the functional and structural testers was 97.0%.
The maximum statement coverage from the submitted test data was not statistically
* different between the functional and structural testers (a>.05). Also, there was no
* correlation between maximum statement coverage achieved and either number or per-
17
centage of faults found (a>.05).
4.1.7. Dependence on Programmer Expertise
A final question In this goal area concerns the contribution of programmer expertise
to fault detection effectiveness. In the phase three data from the NASA/CSC profes-
slonal environment, subjects of advanced expertise detected more faults than did either
the subjects of Intermediate or Junior expertise (a< .05). When the percentage of faults
detected s compared, however, the advanced subjects performed better than the junior
subjects (a<.05), but were not statistically different from the intermediate subjects
(a>.05). The Intermediate and junior subjects were not statistically different In any of
the three phases of the study In terms of number or percentage faults observed. When
*i several subject background attributes were correlated with the number of faults found,
total years of professional experience had a minor relationship (Pearson R = .22,
a<.05). Correspondence of performance with background aspects was examined across
all observations, and within each of the phases, Including previous academic perfor-
mance for the University of Maryland subjects. Other than the above, no relationships
were found.
4.1.8. Accuracy of Self-Estimates
Recall that the NASA/CSC subjects In the phase three data estimated, at the com-
pletlon of a testing session, the percentage of a program's faults they thought they had
uncovered. This estimation of the number of faults uncovered correlated reasonably
well with the actual percentage of faults detected (R = .57, a<.0001). Investigating
further, Individuals using the different techniques were able to give better estimates:
code readers gave the best estimates (R = .79, a<.0001), structural testers gave the
second best estimates (R = .57, a< .0007), and functional testers gave the worst esti-
mates (no correlation, a>.05). This last observation suggests that the code readers
were more certain of the effectiveness they had In revealing faults In the programs.
4.1.9. Dependence on Interactions
There were few significant Interactions between the main effects of testing tech-
nique, program, and expertise level. In the phase two data, there was an Interaction
18
['-" ', .' ,'.-'o'-. *'o*°= '. o' °'o '. -.. '. '..'.-'° ,°'°o°'- *4 ° *..".,'° '...-...-."...-......................,............"...".......................... " ," ., = " ° • -

--
W .. 7. 7. 7 .
between testing technique and program In both the number and percentage of faults
found (a<.0013, a<.0014 respectively). The effectiveness of code reading Increased on
the text formatter. In the phase three data, there was a slight three-way Interaction
- between testing technique, program, and expertise level for both the number and per-
centage of faults found (a<.05, a<.04 respectively).
4.1.10. Summary of Fault Detection Effectiveness
Summarizing the major results of the comparison of fault detection effectiveness: 1)
In the phase three data, code reading detected a greater number and percentage of
faults than the other methods, with functional detecting more than structural; 2) In the
phase one data, code reading and functional were equally effective, while structural was
• Inferior to both - there were no differences among the three techniques In phase two; 3)
the number of faults observed depends on the type of software: the most faults were
detected In the abstract data type and the mathematical plotter, the second most in the
text formatter, and (in the case of the phase three data) the least were found In the da-
tabase maintainer; 4) functionally generated test data revealed more observable faults
than did structurally generated test data in phase one, but not In phase three; 5) sub-
jects of Intermediate and junior expertise were equally effective In detecting faults, while
. advanced subjects found a greater number of faults than did either group; and 8) self-
estimates of faults detected were most accurate from subjects applying code reading, fol-
lowed by those doing structural testing, with estimates from persons functionally testing
having no relationship.
4.2. Fault Detection Cost
The second goal area examines the fault detection cost of each of the techniques.
Figure 12 presents a summary of the measures that were examined to Investigate this
goal area. A brief description of each measure is as follows - (*) means only relevant for
on-line testing. a) # Faults / hour - the number of faults detected by a subject a.pply-
- Ing a given technique normalized by the effort In hours required, called the fault detec-
tlon rate. b) Detection time - the total number of hours that a subject spent In testing
a program using a technique. c) Cpu-tlme (,) - the cpu-time In seconds used during the
testing session. d) Normalized cpu-time (,) - the cpu-time In seconds used during the
j 19
"'ig
.'.. . " ".... ." ** * ~ . * *..' ... . '. . .. . ... . '. - .'.... .".. .•..... ... . .-..... .-. .. '.'.. '
testing session, normalized by a factor for machine speed.4 e) Connect time (*) - the
number of minutes that a Individual spent on-line while testing a program. f) # Pro-
gram runs (,) - the number of executions of the program test driver; note that the
driver supported multiple sets of Input data. All of the on-line statistics were monitored
by the operating systems of the machines.
4.2.1. Data Distributions
The actual distribution of the fault detection rates for the subjects appears In Fig-
ure 13, broken down by phase. Once again, note the many-to-one differential In subject
performance. Figure 14 displays the mean fault detection rate for the subjects, broken
down by technique, program, expertise level, and phase.
4.2.2. Fault Detection Rate and Total Time
The first question In this goal area asks which testing technique had the highest
fault detection rate. The overall F-test of the techniques' having the same fault detec-
tion rate was rejected In the phase three data (a<.0014), but not In the other two
phases (a>.05). As before, the two contrasts of "reading - 0.5 * (functional + structur-
al)'" and "functional - structural" were examined to detect differences among the tech-
. niques. The technique of code reading was estimated at detecting 1.49 more faults per
* hour than did the other techniques In the phase three data (a<.0003, c.l. 0.75 - 2.23).
The techniques of functional and structural testing were not statistically different
(a> .05). Comparing the total time spent In fault detection, the techniques were not
statistically different In the phase two and three data; the overall F-test for the phase
one data was rejected (a<.013). In the phase one data, structural testers spent an es-
timated 1.08 hours less testing than did the other techniques (a<.004, c.l. 0.39 - 1.78),
while code readers were not statistically different from functional testers. Recall that in
phase one, the structural testers observed both a lower number and percentage of the
programs' faults than did the other techniques.
4 In the phase three data, testing was done on both a VAX 11/780 and an IM4341. As suggested by benchmark comparisons [Church 84], the V.X cpu-times weredivided by 1.6 and the IBM cpu-tImes were divided by 0.9.
20
S. [

4.2.3. Dependence on Software Type
Another question In this area focuses on how fault detection rate depends on soft-
ware type. The overall F-test that the detection rate Is the same for the programs Is re-
. jected In the phase one and phase three data (a<.01 and a<.0001 respectively); the
detection rate among the programs was not statistically different In phase two. Apply-
Ing Tukey's multiple comparisons on the phase one data finds that the fault detection
rate was greater on the abstract data type than on the plotter, while there was no
difference either between the abstract data type and the text formatter or between the
text formatter and the plotter (simultaneous a<.05). In the phase three data, the fault
detection rate was higher In the abstract data type than It was for the text formatter
and the database maintalner, with the text formatter and the database maintainer not
being statistically different (simultaneous a<.05). The overall effort spent In fault
.. detection was different among the programs In phases one and three (a<.012 and
a<.0001 respectively), while there was no difference In phase two. In phase one, more
effort was spent testing the plotter than the abstract data type, while there was no sta-
:. tIstIcal difference either between the plotter and the text formatter or between the text
*" formatter and the abstract data type (simultaneous a<.05). In phase three, more time
was spent testing the database maintainer than was spent on either the text formatter
or on the abstract data type, with the text formatter not differing from the abstract
data type (simultaneous a<.05). Summarizing the dependence of fault detection cost
on software type, 1) the abstract data type had a higher detection rate and less total
*detection effort than did either the plotter or the database maintainer, the latter two
were not different in either detection rate or total detection time; 2) the text formatter
and the plotter did not differ In fault detection rate or total detection effort; 3) the text
formatter and the database maintalner did not differ In fault detection rate overall and
did not differ In total detection effort In phase two, but the database malntalner had a
" higher total detection effort In phase three; 4) the text formatter and the abstract data
*,_. type did not differ in total detection effort overall and did not differ In fault detection
, rate iiu phase one, but the abstract data type had a higher detection rate In phase three.
21
'." .". . . . . . ..... . . .4-,m a- a - I'd mlnlm~~mma "- " ' ".. ... .. . . .". . . . . . . . . . . .."
- ";

- 4.2.4. Computer Costs
In addition to the effort spent by Individuals In software testing, on-line methods
Incur machine costs. The machine cost measures of cpu-time, connect time, and the
number of runs were compared across the on-line techniques of functional and structural
testing In phase three of the study. A nonexecutlon-based technique such as code read-
Ing, of course, Incurs no machine time costs. When the machine speeds are normalized
(see measure definitions above), the technique of functional testing used 28.0 more
seconds of cpu-time than did the technique of structural testing (a< .018, c.l. 7.0 -
45.0). The estimate of the difference Is 29.8 seconds when the cpu-tlmes are not normal-
*. ized (a< .012, c.l. 9.0 - 50.2). Individuals using functional testing used 28.4 more
minutes of connect time than did those using structural testing (a< .004, c.l. 11.7 -
45.1). The number of computer runs of a program's test driver was not different
between the two techniques (a>.05). These results suggest that Individuals using func-
tional testing spent more time on-line and used more cpu-time per computer run than
did those structurally testing.
4.2.5. Dependence on Programmer Expertise
The relation of programmer expertise to cost of fault detection Is another question
In this goal section. The expertise level of the subjects had no relation to the fault
detection rate In phases two and three (a>.05 for both F-tests). Recall that phase
three of the study used 32 professional subjects with all three levels of computer science
expertise. In phase one, however, the Intermediate subjects detected faults at a faster
rate than did the junior subjects (a<.005). The total effort spent In fault detection was
not different among the expertise levels In any of the phases (a>.05 for all three F-
tests). When all 74 subjects are considered, years of professional experience correlates
. positively with fault detection rate (R = .41, a< .0002) and correlates slightly negative-
ly with total detection time (R := -. 25, a<.03). These last two observations suggest
that persons with more years of professional experience detected the faults faster and
spent less total time doing so. Several other subject background measures showed no
relationship with fault detection rate or total detection time (a<.05). Background
measures were examined across all subjects and within the groups of NASA/CSC sub-
'.
• .. ,~. -2.2*

Jects and University of Maryland subjects.
4.2.6. Dependence on Interactions
There were few significant Interactions between the main effects of testing tech-
nlque, program, and expertise level. There was an Interaction between testing technique
oo and software type In terms of fault detection rate and total detection cost for the phase
three data (ct<.003 and a< .007 respectively). Subjects using code reading on the
abstract data type had an increased fault detection rate and a decreased total detection
time.
'- 4.2.7. Relationships Between Fault Detection Effectiveness and Cost
There were several correlations between fault detection cost measures and perfor-
mance measures. Fault detection rate correlated overall with number of faults detected
(R = .48, ai< .0001), percentage of faults found (R - .48, a< .0001), and total detec-
tion time (P. = -.53, a<.0001), but not with normalized cpu-time, raw cpu-time, con-
nect time, or number of computer runs (a>.05). Total detection time correlated with
normalized cpu-time (R = .36, a<.04) and raw cpu-time (R = .37, a<.04), but not
with connect time, number of runs, number of faults detected, or percentage of faults
detected. The number of faults detected in the programs correlated with the amount of
machine resources used: normalized cpu-time (R = .47, a< .007), raw cpu-time (R =
.52, a<.002), and connect time (R = .49, a<.003), but not with the number of com-
puter runs (a>.05). The correlations for percentage of faults detected with machine
-. resources used were similar. Although most of these correlations are minor, they suggest
• -that 1) the higher the fault detection rate, the more faults found and the less time spent
*In fault detection; 2) fault detection rate had no relationship with use of machine
* resources: 3) spending more time In detecting faults had no relationship with the
" amount of faults detected; and 4) the more cpu-time and connect time used, the more
faults found.
4.2.8. Summary of Fault Detection Cost
Summarizing the major results of the comparison of fault detection cost: 1) In the
phase three data, code reading had a higher fault detection rate than the other methods.
23
'X -: -."~~~ ~ ~ ~ -. . ._. ,, ." ." .. . .. .. .. .. .. .. " - " • - -- " . . . . . . " - . . " " "" .JM

with no difference between functional testing and structural testing; 2) In the phase one
and two data, the three techniques were not different In fault detection rate; 3) In the
phase two and three data, total detection effort was not different among the techniques,
but In phase one less effort was spent for structural testing than for the other tech-
niques, while reading and functional were not dIfferent; 4) fault detection rate and total
effort In detection depended on the type of software: the abstract data type had the
highest detection rate and lowest total detection effort, the plotter and the database
maintalner had the lowest detection rate and the highest total detection effort, and the
text formatter was somewhere In between depending on the phase; 5) functional testing
used more cpu-tlme and connect time than did structural testing, but they were not
different In the number of runs; 8) In phases two and three, subjects across expertise lev-
els were not different In fault detection rate or total detection time, In phase one Inter-
mediate subjects had a higher detection rate; and 7) there was a moderate correlation
between fault detection rate and years of professional experience across all subjects.
4.3. Characterization of Faults Detected
The third goal area focuses on determining what classes of faults are detected by
the different techniques. In the earlier section on the faults In the software, the faults
were characterized by two different classification schemes: omission or commission, and
*i Initialization, control, data, computation, Interface, or cosmetic. The faults detected
across all three study phases are broken down by the two fault classification schemes In
Figure 15. The entries In the figure are the average percentage (with standard devia-
: tons) of faults In a given class observed when a particular technique was being used.
Note that when a subject tested a program that had no faults In a given class, he/she
was excluded from the calculation of this average.
4.3.1. Omission vs. Commission Classification
When the faults are partitioned according to the omlsslon/commIssion scheme,
there Is a distinction among the techniques. Both code readers and functional testers
observed more omission faults than dId structural testers (a<.001), with code readers
and functional testers not being different (a>.05). Since a fault of omission occurs as a
result of some segment of code being left out, you would not expect structurally generat-
24
.................................................................

ed test data to find such faults. In fact, 44% of the subjects applying structural testing
found zero faults of omission when testing a program. A distribution of the faults ob-
served according to this classification scheme appears In Figure 16.
*4.3.2. Six-Part Fault Classification
When the faults are divided according to the second fault classification scheme,
- several differences are apparent. Both code reading and functional testing found more
Initialization faults than did structural testing (a< .05), with code reading and function-
al testing not being different (a> .05). Code reading detected more Interface faults than
* did either of the other methods (a< .01), with no difference between functional and
*structural testing (a>.05). This suggests that the code reading process of abstracting
and composing program functions across modules must be an effective technique for
-* finding interface faults. Functional testing detected more control faults than did either
of the other methods (a<.01), with code reading and structural testing not being
., dIfferent (a>.05). Recall that the structural test data generation criteria examined Is
based on determining the execution paths In a program and deriving test data that exe-
cute 100% of the program's statements. One would expect that more control path
* faults would be found by such a technique. However, structural testing did not do as
- well as functional testing In this fault class. The technique of code reading found more
computation faults than did structural testing (a< .05), with functional testing not be-
Ing different from either of the other two methods (a>.05). The three techniques were
not statistically different In the percentage of faults they detected In either the data or
cosmetic fault classes (a>.05 for both). A distribution of the faults observed according
. to this classification scheme appears In Figure 17.
'. 4.3.3. Observable Fault Classification
Figure 18 displays the average percentage (with standard deviations) of faults from
each class that were observable from the test data submitted, yet were not reported by
the tester.5 The two on-line techniques of functional and structural testing were not
s The standard deviations presented in the figure are high because of the several In-stances In which all observable faults were reported.
25

* " different in any of the faults classes (x>.05). Note that there was only one fault in the
cosmetic class.
4.3.4. Summary of Characterization of Faults Detected
- Summarizing the major results of the comparison of classes of faults detected: 1)
code reading and functional testing both detected more omission faults and initialization
faults than did structural testing; 2) code reading detected more interface faults than
did the other methods; 3) functional testing detected more control faults than did the
other methods; 4) code reading detected more computation faults than did structural
testing; and 5) the on-line techniques of functional and structural testing were not
different In any classes of faults observable but not reported.
* .5. Conclusions
J .This study compares the strategies of code reading by stepwlse abstraction, func-
.. tional testing using equivalence class partitioning and boundary value analysis, and
structural testing using 100% statement coverage. The study evaluates the techniques
across three data sets In three different aspects of software testing: fault detection
.- effectiveness, fault detection cost, and classes of faults detected. Each of the three test-
* Ing techniques showed merit In this evaluation. The Investigation Is intended to com-
l pare the different testing strategies in representative testing situations, using program-
mers with a wide range of experience, different software types, and common software
faults.
The major results of this study are 1) with the professional programmers, code
reading detected more software faults and had a higher fault detection rate than did
functional or structural testing, while functional testing detected more faults than did
structural testing, but functional and structural testing were not different In fault detec-
tion rate; 2) In one UoM subject group, code reading and functional testing were not
different in faults found, but were both superior to structural testing, while in the other
UoM subject group there was no difference among the techniques; 3) with the UoM sub-
jects, the three techniques were not different In fault detection rate; 4) number of faults
observed, fault detection rate, and total effort in detection depended on the type of soft-
ware tested; 5) code reading detected more interface faults than did the other methods;
26
,.',"<x'2- -"............................................................-.-. ...' ...-- ,-, "', .. '.-'.''.--.."..........

*L 8) functional testing detected more control faults than did the other methods; and 7)
when asked to estimate the percentage of faults detected, code readers gave the most
accurate estimates while functional testers gave the least accurate estimates.
The results suggest that code reading by stepwise abstraction (a nonexecution-
based method) Is at least as effective as on-line functional and structural testing in
*terms of number and cost of faults observed. They also suggest the inadequacy of using
100% statement coverage criteria for structural testing. Note that the professional pro-
grammers examined preferred the use of functional testing because they felt It was the
most effective technique; their intuition, however, turned out to be incorrect.
In comparing the results to related studies, there are mixed conclusions. A proto-
type analysis done at the University of Maryland In the Fall of 1981 [Hwang 81] sup-
ported the belief that code reading by stepwise abstraction does as well as the
computer-based methods, with each strategy having Its own advantages. In the Myers
experiment [Myers 78], the three techniques compared (functional testing, 3-person code
*reviews, control group) were equally effective. He also calculated that code reviews were
less cost-effective than the computer-based testing approaches. The first observation is
- supported in one study phase here, but the other observation Is not. A study conducted
-* by Hetzel [Hetzel 78] compared functional testing, code reading, and "selective" testing
(a composite of functional, structural, and reading techniques). He observed that func-
tional and "selective" testing were equally effective, with code reading being Inferior.
. As noted earlier, this Is not supported by this analysis. The study described in this
' analyss examined the technique of code reading by stepwise abstraction, while both the
Myers and Hetzel studies examined alternate approaches to off-line (nonexecution-based)
review/reading.
A few remarks are appropriate about the comparison of the cost-effectiveness and
- phase-availabllity of these testing techniques. When examining the effort associated
with a technique, both fault detection and fault Isolation costs should be compared.
The code readers have both detected and Isolated a fault; they located It In the source
code. Thus, the reading process condenses fault detection and Isolation into one actlvl-
-. ty. Functional and structural testers have only detected a fault; they need to delve Into
the source code and expend additional effort In order to Isolate the defect. Also, a
27
...-............-..--...-........- .. -
* ..-.
nonexecutlon-based reading process can be applied to any document produced during
the development process (e.g., high-level design document, low-level design document,
source code document). While functional and structural execution-based techniques
may only be applied to documents that are executable (e.g., source code), which are usu-
ally available ]-ter in the development process.
Investigations related to this work Include studies of fault classification [Weiss &
BasIli 85, Johnson, Draper & Soloway 83, Ostrand & Weyuker 83, BasilI & Perricone 84]
and Cleanroom software development [Selby, Basill & Baker 85J. In the Cleanroom soft-
ware development approach, techniques such as code reading are used In the develop-
*. ment of software completely off-line (i.e., without program execution). In the above
study, systems developed using Cleanroom met system requirements more completely
*- and had a higher percentage of successful operational test cases than did systems
* developed with a more traditional approach.
The empirical study presented is intended to advance the understanding of how
various software testing strategies contribute to the software development process and
to one another. The results given were calculated from a set of Individuals applying the
three techniques to unlt-sized programs - the direct extrapolation of the findings to oth-
*er testing environments Is not Implied. However, valuable Insights Into software testing
have been gained. Further work applying these and other results to devise effective
testing environments Is underway.
.- 6. Acknowledgement
The authors are grateful to the subjects from Computer Sciences Corporation,
NASA Goddard. and the University of Maryland for their enthusiastic particlpatlon In
the study.
28
- *"' , " .. --.' ".. a ., . *, - * :. * -*-,-: ** ,-,
- -unn m. i . .. . . j* . . u* C *.

7. Appendices
7.1. Appendix A. The Specifications for the ProgramnsPro gram 1
Given an input text of up to 80 characters consisting of words separated by blanksor new-lne characters, the program formats It Into a line-by-lne form such that 1) eachoutput line has a maximum of 30 characters, 2) a word In the Input text Is placed on asingle output line, and 3) each output line Is flled with as many words as possible.
The Input text Is a stream of characters, where the characters are categorized as el-* ther break or nonbreak characters. A break character Is a blank, a new-line character
(&), or an end-of-text character (/). New-lne characters have no special significance;they are treated as blanks by the program. The characters & and / should not appearIn the output.
A word Is defined as a nonempty sequence of nonbreak characters. A break Is a se-* quence of one or more break characters and Is reduced to a single blank character or
start of a new line In the output.
When the program Is Invoked, the user types the Input line, followed by a / (end-* or-text) and a carriage return. The program then echos the text Input and formats It on
the terminal.
If the Input text contains a word that Is too long to fit on a single output line, anerror message Is typed and the program terminates. If the end-of-text character Is miss-Ing, an error message Is Issued and the program awaits the Input of properly terminatedline of text.
Program 2Given ordered pairs (x,y) of either positive or negative Integers as Input, the pro-
gram plots them on a grid with a horizontal x-axis and a vertical y-axis which are ap-propriately labeled. A plotted point on the grid should appear as an asterisk ()
The vertical and horizontal scaling Is -handled as follows. If the maximum absolutevalue of any y-value Is less than or equal to twenty (20), the scale for vertical spacingwill be one line per Integral unit (e.g., the point (3,0) should be plotted on the sixth line;two lines above the point (3,4)). Note that the origin (point (0,0)) would correspond toan asterisk at the the intersection or the axes (the x-axis Is referred to as the 0th line).If the maximum absolute value of any x-value Is less than or equal to thirty (30), thescale ror horizontal spacing will be one space per Integral unit (e.g., the point (4,5)
* should be plotted rour spaces to the right of the y-axis; two spaces to the right of (2,5)).* However, If the maximum absolute value of any y-value Is greater than twenty (20), the
scale for vertical spacing will be one line per every (max abs o1f yval)/20 rounded-up.(e.g.. If the maximum absolute value of any y-value to be plotted Is 88, the vertical linespacing will be a line ror every four (4) integral units. In such a data set, points withy-values greater than or equal to eight and less than twelve will show up as asterisks In
* the second line, points with y-values greater than or equal to twelve and less than six-
2g
. . . . ..-

teen will show up as asterisks In the third line, etc. Continuing the example, the point(3,15) should be plotted on the third line; two lines above the point (3,5).) Horizontalscaling is handled analogously.
If two or more of the points to be plotted would show up as the same asterisk inthe grid (like the points (0,13) and (0,15) In the above example), a number '2' (or what-ever number is appropriate) should be printed instead of the asterisk. Points whose as-terlsks will lie on a axis or grid marker should show up in place of the marker.
Program 3
A list Is defined to be an ordered collection of integer elements which may have ele-ments annexed and deleted at either end, but not in the middle. The operations thatneed to be available are ADDFIRST, ADDLAST, DELETEFIRST, DELETELAST,FIRST, ISEMPTY, LISTLENGTH, REVERSE, and NEWLIST. Each operation Isdescribed In detail below. The lists are to contain up to a maximum of five (5) ele-ments. If an element Is added to the front of a "full" list (one containing five elementsalready), the element at the back of the list Is to be discarded. Elements to be added tothe back of a full list are discarded. Requests to delete elements from empty lists resultin an empty list, and requests for the first element of an empty list results In zero (0) be-Ing returned. The detailed operation descriptions are as below:
* ADDFIRST(LIST L, INTEGER I)Returns the list L with I as its first element followed by all the elements of L. If LIs "full" to begin with, L's last element is lost.
ADDLAST(LIST L, INTEGER I)Returns the list with all of the elements of L followed by I. If L Is full to beginwith, L Is returned (i.e., I Is Ignored).
DELETEFIRST(LIST L)Returns the list containing all but the first element of L. If L Is empty, then anempty list Is returned.
DELETELAST(LIST L)Returns the lst containing all but the last element of L. If L Is empty, then anempty list Is returned.
FIRST(LIST L)Returns the first element In L. If L Is empty, then it returns zero (0).
. ISE.NPTY(LIST L)Returns one (1) If L Is empty, zero (0) otherwise.
* LISTLENGTH(LIST L)Returns the number of elements In L. An empty list has zero (0) elements.
• NEVWLIST(LIST L)Returns an empty list.
REVERSE(LIST L)Returns a list containing the elements of L In reverse order.
30
.. . . . . . . . . . . . . . . . . ..--"'d a'l m' omd'mam mh dn l"- -'" ' " " " - " * . . . . .% . ....

Program 4(Note that a 'file' is the same thing as an IBM 'dataset'.)The program maintains a database of bibliographic references. It first reads a mas-
ter file of current references, then reads a file of reference updates, merges the two, andproduces an updated master file and a cross reference table of keywords.
The first input file, the master, contains records of 74 characters with the followingformat:
* column comment
* 1 - 3 each reference has a unique reference key4 - 14 author of publication
* 15 - 72 title of publication73 - 74 year issuedThe key should be a three (3) character unique identifier consisting of letters betweenA-Z. The next Input file, the update file, contains records of 75 characters in length.The only difference from a master file record is that an update record has either an 'A'(capital A meaning add) or a 'R' (capital R meaning replace) in column 75. Both themaster and update files are expected to be already sorted alphabetically by reference keywhen read into the program. Update records with action replace are substituted for thematching key record In the master file. Records with action add are added to the mas-ter file at the appropriate location so that the file remains sorted on the key field. Forexample, a valid update record to be read would be (including a numbered line just forreference)
12345678012345878012345878012345878901234567890 1234 587890123456788012 34 5
BITbaker an Introduction to program testing 83&The program should produce two pieces of output. It should first print the sorted
list of records In the updated master file in the same format as the original master file.It should then print a keyword cross reference list. All words greater than three charac-ters in a publication's title are keywords. These keywords are listed alphabetically fol-lowed by the key fields from the applicable updated master file entries. For example, ifthe updated master file contained two records,
ASCkermit introduction to software testing 82(J nes the realities of software management 81
then the keywords are Introduction, testing, realities, software, and management. Thecross reference list should look like
IntroductionABC
management* DDX
realltles
31
-,z. ._.,,. : ,.:. ,,__.,_,., .;,-'..-,.............,.........,....-................-.....""..'"."............'"'"..".."...'..""..".....""..........,.........,... ',.:,,,

L' ,Z -. -' . .- ' "v-- -w - " ' . - . :. .
. . . . - . - -. r .. . . , ., .o . -., . -_ . r - .. r.
DDXsoftware
ABCDDX
tebLlngABC
Some possible error conditions that could arise and the subsequent actions Includethe following. The master and update files should be checked for sequence, and If arecord out of sequence is found, a message similar to 'key ABC out of sequence' shouldappear and the record should be discarded. If an update record Indicates replace andthe matching key can not be found, a message similar to 'update key ABC not found'should appear and the update record should be Ignored. If an update record Indicatesadd and a matching key Is found, something like 'key ABC already In file' should ap-pear and the record should be Ignored. (End of specification.)
7.2. Appendix B. The Source Code for the Programs
Program 1
001: C NOTE THAT YOU DO NOT NEED TO VERIFY THE FUNCTION 'NIATCH'.002: C IT IS DESCRIBED THE FIRST TIME IT IS USED, AND ITS SOURCE CODE003: C IS INCLUDED AT THE END FOR COMPLETENESS.004: C005: C NOTE THAT FORMAT STATEMENTS FOR WRITE STATEMENTS INCLUDE
A LEADING. 006: C AND REQUIRED ' 'FOR CARRIAGE CONTROL,* 007:
008: C VARIABLE USED IN FIRST, BUT NEEDS TO BE INITIALIZED009: INTEGER MOREIN010:011: C STORAGE USED BY GCHAR012: INTEGER BCOUNT013: CHARA.CTER*I GBUFER(80)014: CHARACTER*80 GBUF015: C GBUFER AND GBUFSTR ARE EQUVALENCED
-" 016:-- 017: C STORAGE USED BY PCHAR
018: INTEGER I019: CHARACTER*l OUTLIN(31)020: C OUTLIN AND OUTLINST ARE EQUIVALENCED
" 021:, 022: CHARACTER*1 GCHAR
* 023:024: C CONSTANT USED THROUGHOUT THE PROGRAM025: CHARACTER*1 EOTEXT, BLANK, LINEFD
* 028: INTEGER MAYPOS* 027:
- 028: COMMON /ALL/ MOREIN, BCOUNT, I, MAXPOS, OUTLIN,. 029: X EOTEXT, BLANK, LI1NEFD, GBUFER, GBUF
030:031: DATA EOTEXT, BLANK, LINEFD, ALAXPOS / '/', '','&', 31 /
32

032:033:
034: CALL FIRST035: END038:037:038: SUBROUTINE FIRST039: INTEGER K, FILL, BUFPOS040: CHARACTER* 1 CW041: CHARACTER*1 BUFFER(31)
* 042:- 043: INTEGER MOREIN, BCOUNT, I, MAXPOS* 044: CHARACTER*l OUTLIN(31), GCHAR. EOTEXT, BLANK, LINEFD,
- 045: X GBUFER(80)048: CHARACTER*80 GBUF047:048: COMMON /ALL/ MORE, BCOUNT, I, MAXPOS, OUTLIN,049: X EOTEXT. BLANK. LINEFD, GBUFER, GBUF050:051: BUFPOS -a 0052: FILL = 0053: CW
*054:055: MOREIN = 1056:
" 057: 1 - 1058: K - i059: DOWHILE (K .LE. MAXPOS)
-.' 080: OUTLIN(K) ''0 061: K-K + i
- 062: ENDDO-. 063:
084: BCOUNT - 1065: K - 1
. 068: DOWHILE (K .LE. 80)- 067: GBUFER(K) = 'Z' 068: K - K + 1
09: ENDDO- 070:
071: DOWHILE (MOREIN)072: CW - GCHAR0073: IF ((CW .EQ. BLANK) OR. (CW .EQ. LINEFD) OR.074: X (CW .EQ. EOTEXT)) THEN
S075: IF (CW .EQ. EOTEXT) THEN076: IMOREIN - 0077: ENDIF
• 078: IF ((FILL+I+BUFPOS) .LE. MAXPOS) THEN. 079: CALL PCHAR(BLANK)
080: FILL - FILL + i081: ELSE
- 082: CALL PCHAR(LINEFD)083: FILL =0084: ENDIF085: K=1086: DOfVHlLE (K .LE. BUFPOS)
33
- (

087: CALL PCHAR(BUFFER(K))088: K=-K+ 1
*089: ENDDO090: FILL - FIL~L + BUFPOS091: BUFPOS = 0
*092: ELSE*093: IF (BUFPOS .EQ. MA-XPOS) THEN*094: WRITE(6,10)*095: 10 FORMAT( ','***WORD TO LONG**)
006: MOREIN = 1097: ELSE098: BLTFPOS = BUFPOS + 1099: BUFFER(BUFPOS) = CW
-100: ENDIF*101: ENDIF
102: ENI)DO103: CALL PCHAR(LINEFD)
*104: END105:
* 106:- 107: CHARACTER. 1 FUNCTION GCHAR()
108: INTEGER MATCH109: CHA.RACTER*80 GBUFSTR110:
*111: INTEGER MOREIN, BCOUNT, 1, MiAXPOS*112: CHARACTER*1 OUTLIN(31), EOTEXT, BLANK, LINEFD).
113: x GBUFER(80)114: CHARACTERmSO GBUF115: COMMON /ALL/ MOREIN, BCOUNT, I, MAXPOS, OUTLIN,116: X EOTEXT, BLANK. LInEFD, GBUFER, GEUF
* 117:* 11: EQUWVALENCE (GBtTFSTR,GBUFER)- 119:
120: IF (GBUFER(l) .EQ. WZ) THEN121: READ(5,20) GBUF122: 20 FORMAT(A80)
* 123: C124: C MATCH(CARRAY,C) RETUJRNS 1 IF CHARACTER C IS IN
CHARACTER ARRAY-125: C CARRAY. RETURNS 0 OTHERWISE. ARSIZE IS THE SIZE OF CARRAY.
126: C127: IF (,MATCH(GBUF,EOTEXT) .EQ. 0) THEN128: WRITE(B.30)129: 30 FORNLAT(- .'***NO END OF TEXT M4ARK**')130: GBIJFER(2) =EOTEXT
131: ELSE132: C GBUFE R() GBUF133: GBUFSTR GBTJF134: ENDIF135: ENDIF136: GCHAR = GBL7E(CUT137: BCOUNT BCOUNT i
138: END139:
7 140:
34

141: SUBROUTINJE PCHAR (C)142: CHARACTER*1 C143: CHARACTER*31 SOUT, OUTLINST144: INTEGER K
* 145:148: INTEGER MOREIN. BCOUNT, 1, MAJG'OS
*147: CHARACTER*1 OUTLIN(31), GCHAR, EOTEXT, BLANK, LINEFD,*148: X GBUPER(80)
149: CHLARACTER*80 GBUF* 150: COMM4ON /ALL/ MOREIN, BCOUNT, IL MAXPOS, OUTLIN,* 151: X EOTEXT, BLANK, LINEFD, GBUFER, GBIJF
152:153: EQUIVALENCE (OUTLINST.OUTLIN)154:155: IF (C .EQ. LIhJEFD) THEN156: SOUT = OUTLINST
-157: WRITE(8,40) SOUT158: 40 FORMAT(' ,A31)
* 159: K=*160: DOWILE (K .LE. MAkXPOS)- 161: OUTLIN(K)
162: K K + 1163: ENDDO164: 1 =1165: ELSE166: OUTLIN(I) =C
167: 1= I+1I168: ENDIF169: END
Program 2
* 1: INT XVTDTH = 30,2: HEIGHT - 20,3: GRIDWD = 61,4: LARGENUM = 100000000
- 5: STRING TICKS[811 z
6: + +-+-+-+-+-+-+-+-+ +
7:
9: PROC SORT (TNT ARRAY KEYBUF, TNT ARRAY FREEBLJF, INT N)10:11: INT 1. MA- XP12: INT ARRAY SRTKEYB( 100), SRTFREEB(100)13:14: I:= 0
*15: WHILE I <NDO* 16: ~SRTK<EYB(I) KYLFI
*17: SRTFREEB(l) :=FREEBUF(I)
* ~18: 1 4*19: END
20:21: I:= N2*2: NI-.E I > 0DO23: MLAX = \vL-%'LE(SRTKEYB I)
35

24: CEYBUF(N-I) :- SRTXa)".25: FREEBUF(N-I) :- SRTFREEB(MAXP)
26: CALL REMOVE(SRTKEYB>MAXP,I)27: CALL REMOVE(SRTFREEBM&XPI)28: I:=- 1
" 29: END30:31:
_; 32:33: DNT FUNC MAm 1 E (UThJ ARRAY BUF. nT N)
34:35: INT I, MAXPTR, MAX36:37: M;AXPTR :=- -138: MAX :- -LARGENUM39: I:- 040: WHILE I < N DO
* 41: IF BUF(I) > MAX42: THEN43: MAX := BUF(I)
' 44: MAXPTR := I45: END46: 1:- I+ i47: END48: RETURN(MAXP'R)49:50:51:52: INT FUNC MINELE (INT ARRAY BUF, INT N)53:54: INT I. MIPTR. MIN55:58: MINPTR := -157: MIN:= LARGENUM58: I:= 059: WHILE I < N DO60: IF BUF(I) < UIN81: THEN62: IN :== BLTF()63: MIIPTR :- I84: END65: I:=I +I66: END
i- . 67: RETU'RN( MINPTR).: 68:
69:70:71: PROC REMOVE (INT ARRAY BUF, INT PTR, INT N)
• .72:7 73: INT I74:75: I :- PTR76: VHILE I < N-i DO77: BTF(I) :- BUF(I+1)78: I:=I + i
38

79: END80:81:82:83: INT FUNC ABS (INT VAL)84:835: IFVAL < 088: THEN87: RETURN(-VAL)88: ELSE8: RETURN(VAL)90: END91:02:93:94: INT FUNC SLASH (INT TOP. INT BOT)95:96: INT RES97:98: RES := TOP/BOT99: IF TOP < > RES.BOT AND.
100: (TOP > 0 .AND. BOT > O.OR. TOP < 0 AND. BOT < 0)101: THEN RES :- RES + I
* 102: END' 103: RETTRN(RES)
104:* 105: INT FUNC MOD (INT N, INT M)
106:107: iNT VAL
"" 108:-109: VAL : N-N/M*M. 11o: IF VAL < oSill, THEN
112: VAL :- VAL + M113: END114: RETURN (VAL)115:116:117: PROC MAIN118:119: CHAR ARRAY GRID(81)120: STRING STR(61
- 121: TNT ARRAY XVAL(100). YVAL(100). 122: INT I. J. NLMOBS, MAXY.,%AXX. *MINqX. HORISP, VERTSP, VLINE"- 123:
124: I :- 0, 125: WHILE .NOT. EOI DO. 126: READ(XVAL(I),YVAL(I))
127: :,I+ 1128: END129: NLUvfOBS := I130:131: CALL SORT(YVAL.XVAL.NUMOBS)132: [AL4XY := YVAL(0)
- 133: VERTSP := SLASH(M2A-XY.HEIGHT)
37
1*:.7."'. . : .'" '. "" " .. . . . . . . . . . . . . . .. ." .. - . . . . . .
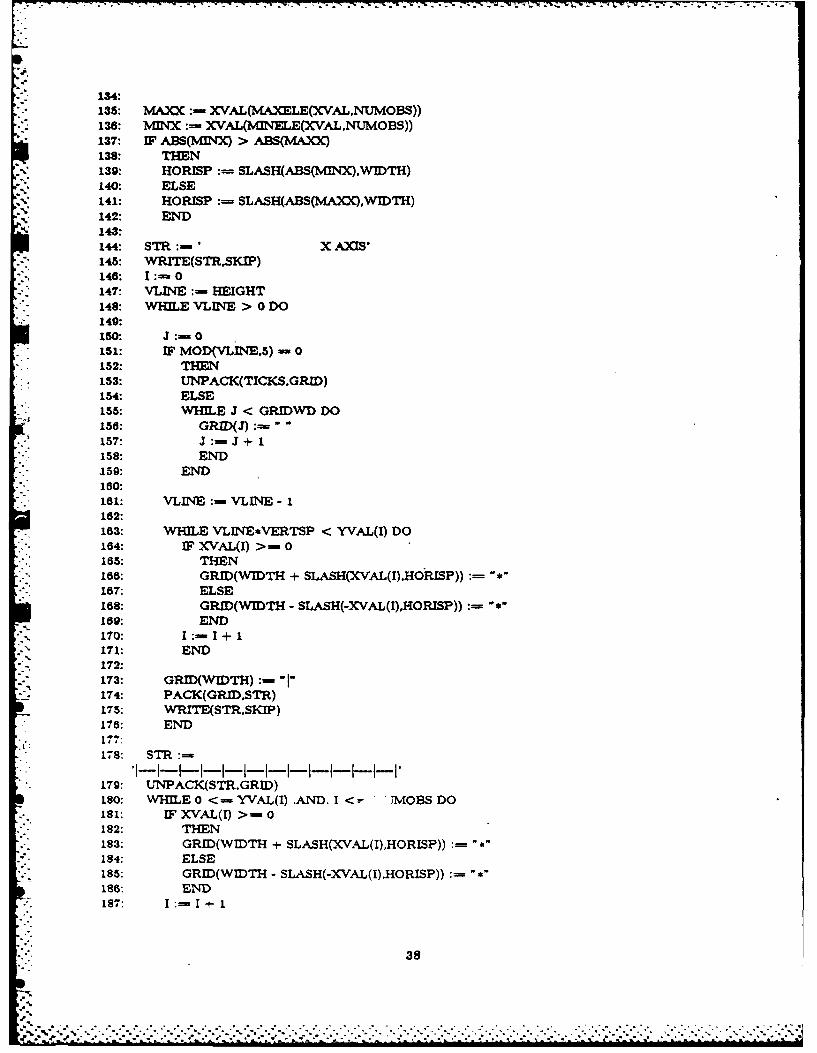
m- -. -m-
134:135: MAXOC:- XVAL(MAXLE(XVAL,NUMOBS))136: NW4X := XVAL(NMNLE(XVAL.NUMOBS))137: EF ABS(MNX)A > AES(MAXX)138: THEN139: HORISP := SLASH(ABS(MINX,WIDTH)
*140: ELSE141: HORISP := SLASH(ABS(MAMOQ,WIDTH)142: END143:144: STR :=' X AXIS'145: WRITE(STR.SKWP)146: I:==0147: VLTE:- HEIGHT
*148: WHILE VLINE > 0 DO149:150: J:=O0
* 151: IF MOD(VLINE.5) - 0*152: THEN
153: UNPACK(TICKS,GRID)*154: ELSE
155: WVfl.E J < GRIDWI) DO156: GRID(J) "-157: J:= J+ 1158: END159: END160:181: VLIE : VLINE - 1182:163: WHILE VLINE*VERTSP < YVAL(I) DO164: IF XVAL(I) >=- 0165: THEN166: GRID(WIDTH + SLASH(XVAL(I),HO]RISP)) :167: ELSE168: GRID(WIDTH - SLASH(-XVAL(I),HORISP)):169: END
171: END172:173: GRID(WIDTH) --174: PACK(GRID,STR)175: WRITE(STR,SKIP)176: END177:
* 178:. STR :==
* 179: UNPACK(STR.GRID)180: WHIE 0 < - YVAL(I) .VLD. I <~ TMOBS DO
*181: IF XVAL(I) > -0182: THEN183: GRD( WIDTH + SLASH(XVAL(I),HORISP)) :184: ELSE185: GRD( WIDTH - SLASH(-XVAL(I),HORISP)) :188: END187:+I
38

188: END189:190: PACK(GRDSTR)191: WRITE(STRSKIP)192: STR :- ' Y AXS'
. 193: WRITE(STR,SKIP).* 194:. 195: START MAIN
Program 3
001: C NOTE THAT YOU DO NOT NEED TO VERIFY THE FUNCTIONSDRIVER. GETARG,
002: C CHAREQ. CODE, AND PRINT. THEIR SOURCE CODE ISDESCRIBED AND
003: C INCLUDED AT THE END FOR COMPLETENESS.004: C NOTE THAT FORMAT STATEMENTS FOR WRITE STATEMENTS
INCLUDE A LEADING005: C AND REQUIRED ' 'FOR CARRIAGE CONTROL
. 006: C007: INTEGER POOL(7), LSTEND008: INTEGER LISTSZ
* 009: C. 010: COMMON /ALL/ LISTSZ
. 011: C- 012: C
0 013: LISTSZ - 5014: CALL DRIVER (POOL, LSTEND)015: STOP
S016: END~~ 017: C* 018: C" 019: FUNCTION ADFRST (POOL, LSTEND, I)
020: INTEGER ADFRST" 021: INTEGER POOL(7), LSTEND, I
022: INTEGER LISTSZ* 023: COMMON /ALL/ LISTSZ
024: C* 025: INTEGER A
028: C027: IF (LSTEND .GT. LISTSZ) THEN
* 028: LSTEND - LISTSZ - 1029: ENDIF030: LSTEND == LSTEND + 1031: A - LSTEND032: DOWHILE (A .GE. 1)
- 033: POOL(A+1) - POOL(A)" 034: A-A-1
035: ENDDO* 038: C" 037: POOL(l) = I
038: ADFRST - LSTEND039: RETURN040: END
* 041: C
39
.... . . . .. " . .. ... . - - , .

- -
042: C043: FUNCTION ADLAST (POOL, LSTEND, I)044: INTEGER ADLAST045: INTEGER POOL(7), LSTEND, I046: INTEGER LISTSZ047: COMMON /ALL/ LISTSZ048: C049: IF (LSTEND .LE. LISTSZ) THEN050. LSTEND - LSTEND + 1051: POOL(LSTEND) - I052: ENDIF053: ADLAST - LSTEND054: RETURN055: END056: C
*057: C058: FUNCTION DELFST (POOL. LSTEND)059: INTEGER DELFST060: INTEGER POOL(7), LSTEND061: INTEGER LISTSZ082: COMMON /ALL/ LISTSZ063: C064: INTEGER A065: IF (LSTEND .GT. 1) THEN0 066: A = 1
-. 067: LSTEND - LSTEND - 1-. 08: DOWHILE (A .LE. LSTEND)
069: POOL(A) - POOL(A+1)070: A - A + 1
* 071: ENDDO* 072: ENDIF
0 073: DELFST - LSTEND074: RETURN
* 075: END076: C077: C
; 078: FUNCTION DELLST (LSTEND)079: INTEGER DELLST
" 080: INTEGER LSTEND* 081: C
082: 'T (LSTEND .GE. 1) THEN083: LSTEND - LSTEND - 1
. 084: ENDIF. 085: DELLST - LSTEND
086: RETURNS087: END
*088:C089: C090: FUNCTION FIRST (POOL, LSTEND)091: INTEGER FIRST092: INTEGER POOL(7), LSTEND
*093: C" 094: IF (LSTEND .LE. 1) THEN
095: FIRST 0* 096: ELSE
40
h
-: * . -.. -.. • , .* .--.. ... . . , .. .** . . . .. . . . . .. . . .. .. . .. .. . .. :. . . .. . . .. . . . .

007: FIRST - POOL(t)098: ENDIF099: RETURN100: END101: C102: C103: FUNCTION EMPTY (LSTEND)104: INTEGER EMPTY105: INTEGER LSTEND106: C107: IF (LSTEND .LE. 1) THEN108: EMPTY - 1109: ELSE110: EMPTY - 0Ill: ENDIF112: RETURN113: END114: C115: C116: FUNCTION LSTLEN (LSTEND)117: INTEGER LSTLEN118: INTEGER LSTEND119: C120: LSTLEN = LSTEND - 1121: RETURN122: END123: C124: C125: FUNCTION NENVLST (LSTEND)128: INTEGER NEWLST127: INTEGER LSTEND128: C129: NEWLST = 0130: RETURN131: END132: C133: C134: SUBROUTINE REVERS (POOL, LSTEND)135: INTEGER POOL(7), LSTEND136: C137: INTEGER I. N138: C139: N = LSTEND140: 1=1141: DOW-ILE (I .LE. N)142: POOL(I) = POOL(N)143: N N -144: I=I+t145: ENDDO146: RETURN147: END
Program 4
001: C NOTE THAT YOU DO NOT NEED TO VERIFY THE ROUTINES
41
EL

DRIVER, STREQ. WORDEQ.002: C NXTSTR, ARRCPY, CHARPT. BEFORE, CHAREQ. AND WRDBEF.
TMMI SOURCE003: C CODE IS DESCRIBED AND INCLUDED AT THE END FOR
COMLETENESS.004: C NOTE THAT FORMAT STATEMENTS FOR WRITE STATEMENTS
INCLUDE A LEADING005: C AND REQUIRED ''FOR CARRIAGE CONTROL
* 008: C THE SFORT LANGUAGE CONSTRUCT '-IF (FEaPRESSION)' BEGINSA BLOCKED
007: C IF-THEN j-ELSE] STATEMENT, AND IT IS EQUIVALENT TOTHE F77
008: C 'IF (EXPRESSION) THEN'.009: C010: CALL DRIVER011: STOP012: END013: C014: C015: SUBROUTINJE MAIhJSB016: C017: LOGICAL*1 U$KE;Y(3),U$AUTH(11),U$TITL(58),U$YEAR(2),U$ACTN(l)018: LOGICAL* 1 M$KEY(3).M$AUTH(11),M$TITL(58),M$YEAR(2)019: LOGICALal ZZZ(3), LASTtJK(3), LASTMK(3)020: LOGICAL*1 STREQ, CHAREQ. BEFORE, CHARPT021: INTEGER I022: C023: LOGICAL*I WORD(500,12), REPKEY(l000,3)024: INTEGER NUMWDS, NUMREF, PTR(500), NEXT(1000)025: COMMION /WORDS/ WORD, REFKEY, NUMWDS, NUMREF, PTR, NEXT
* 026: C027: WRITE(8,290)028: 290 FORMAT(' ',' UPDATED LIST OF MLASTER ENTRIES')029: DO0300 1- 1, 3030: LASTMfl(I) = CHARPT(')031: LASTUK(I) = CHARPT(')032: ZZZ(I) = CHARPT(Z')033: 300 CONTINUE034: C035: NUMWDS=-0036: NUMREF - 0037: CALL GETNM(M$KEY,M$AUTH,M$TIThMYEA,LASTMK)038: CALL GETNLTP(U$KEY,USAUTH,U$TITL .U$YEAR.U$ACTN,LASTUK)039: C
* 040: DOWNILE ((.NOT.(STREQ(M$KEY.ZZZ,3))) .OR.041: X (.NOT.(STREQ(U$KEY,ZZZ,3))))
*042: -IF (STREQ(USKEY,MS$KEY,3))043: -IF (.NOT.(CHAREQ(USACTN(l),'R')))
*044: WRITE(6,100) USKEY*045: 100 FORMAT(' '.I=Y ',3A1,' IS ALREADY IN FILE')*048: EINDIF
047: CALL OUTPUT(USKEY,U$AUTH.U$TITL ,U$YAR)048: CALL DICTUP(U$KEYU$TITL,58)049: CALL GETNMv(MSKEY.Mf$AUTH,M$TITL, ,M$YEAR.LASTMIK)050: CALL GETNVP(USKEY,USAUTH,U$TITL .U$YEAR.U$ACTN,LASTUK)
42
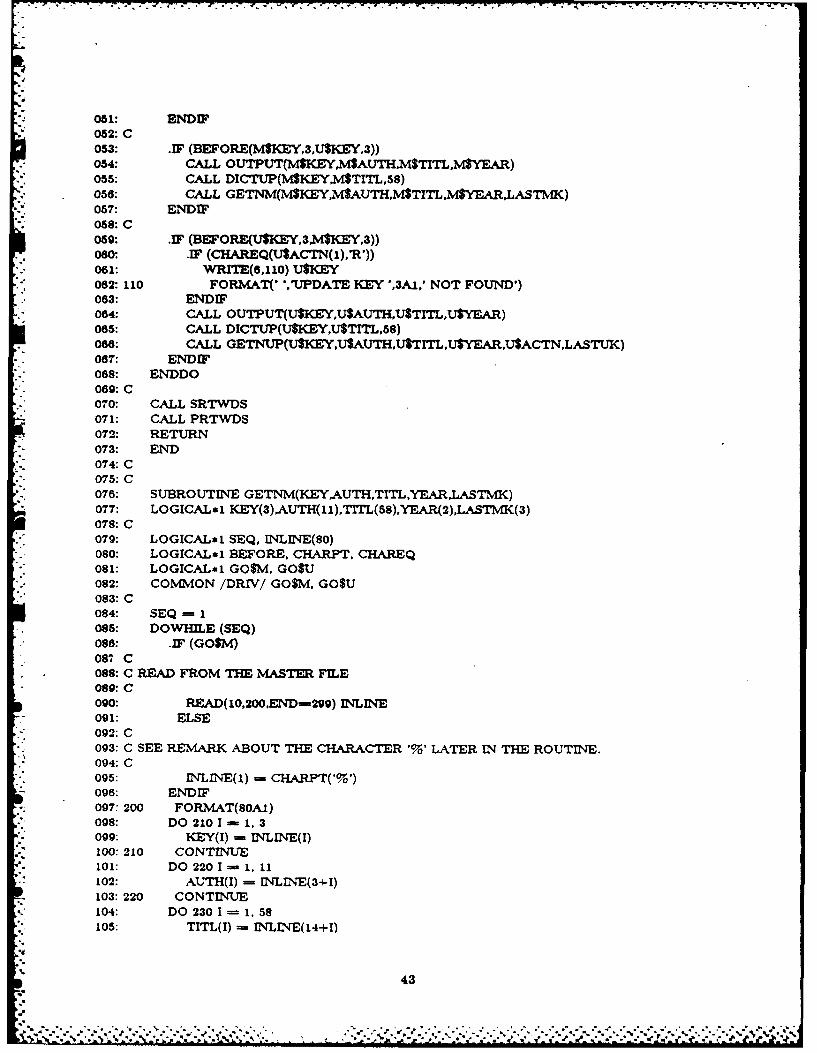
*051: ENDIF* 052: C
053: -IF (BEFORE(M$KEY,3,U$KEY,3))* 054: CALL OUTPUT(M$KEYM$AUTHM$TITLM$YEAR)
055: CALL DICTUP(M$KEY.M$TITL,58)058: CALL GETNM(M$KEY,M$AUTH.M$TITLM$Y'EARL.ASTMC)057: ENDIF
* 058: C059: -IF (BEFORE(USKE Y,3,M$KEY,3))080: -IF (CHAREQ(USACTN(1).RW))081: WRITE(6,110) U$KEY082: 110 FORMAT(* .UPDATE KEY *,3A1,' NOT FOUND-)063: ENDIF064: CALL OUTPUT(U$KEY,U$AUTH,tJ$TrTL,U$YEAR)065: CALL DICTUP(USKEY,USTITL.58)
*088: CALL GETNUP(U$KCEYU$AUTH.U$TITL ,TJYEAR,U$ACTN,L.ASTUK)067: ENDIF
*068: ENDDO* 069: C
07 0: CALL SRTWDS*071: CALL PRTWDS
072: RETURN-073: END* 074: C
075: C078: SUBROUTINE GETNM(KEYAUTH,TITLYEAR.LASTMK)
*077: LOGICAL.1 KEY(3).AUTH(11),TrTL(58),YEAR(2),LASTMK(3)078: C
*079: LOGICAL.1 SEQ, INLU-TE(80)-080: LOGICALwi BEFORE. CHARPT. CHAREQ*081: LOGICALal GOSM, GO$U- 082: COMMivON /DRIV/ GOSM. GO$U* 083: C
084: SEQ = 1*085: DOWHILE (SEQ)* 086: -IF' (GO$M)
087 C* 088: C READ FROM THE MASTER FILE* 0890:C
090: READ(102o.END-299) INLINE-091: ELSE
092: C* 093: C SEE REMARK ABOUT THE CHARACTER 'W'LATER IN THE ROUTINE.* 094: C*095: INLINE(1) - CHARPT('%')-096: ENDIF*007: 200 FORMAT(80A1)
*098: DO 2101 =1, 3*099: KEY(I) - INLINE(I)
100: 210 CONTINUE101: DO 220 1 -1, 11102: AIJTH(I) - INLINE(3+I)103: 220 CONTINUE104: DO 230 1=158105: TITL(I - IN4LLNE(14+I)
43

106: 230 CONTINUE
107: DO 240 1 - 1. 2108: YEAR(I) - INLINE(72+I)109: 240 CONTINUE110: C111: C A METHOD OF SPECIFYING END-OF-FILE IN A FILE IS TO PUT
THE CHARACTER %'112: C AS THE FIRST CHARACTER ON A LINE. THE DRIVER USES THIS
FOR MULTIPLE113: C SETS OF INPUT CASES.114: C115: .IF ((.NOT.(CHAREQ(KEY(1),'%'))) .AND.
* 118: X (BEFORE(KEY,3,LASTM,3)))S117: WRITE(8,20) KEY
118: 250 FORMAT(' ',KEY ',3A.,' OUT OF SEQUENCE')- 119: ELSE
120: CALL ARRCPY(KEYLASTMK,3)121: SEQ = 0122: ENDIF123: .IF (CHAREQ(KEY(),'%'))124: SEQ - 0125: DO 2701 1.3128: KEY(I) - CHARPT('Z')127: 270 CONTINUE128: ENDIF129: ENDDO130: RETURN131: 299 CONTINUE132: GOM == 0133: DO 2801 - 1, 3134: KEY(I) = CHARPT('Z')135: 280 CONTINUE138: RETURN
137: END138: C139: C
* 140: SUBROUTINE GETNUP(KEYAUTHTITL, fEARACTN,LASTUK)141: LOGICAL*I KEY(3),AUTH(11),TITL(58),YEAR(2),ACTN(1),LASTUK(3)142: C
. 143: LOGICAL*l SEQ, INLINE(80)144: LOGICAL*1 BEFORE, CHARPT, CHAREQ145: LOGICAL*1 GO$M, GO$U146: COMMON /DRIV/ GO$M, GOSU
* 147: C148: SEQ= 1140: DOW1HILE (SEQ)
* 150: .IF (GO$U)151: C
. 152: C READ FROM THE UPDATES FILE153: C
" 154: READ(I1,200.END=29g) INLINE155: ELSE156: C157: C SEE REMARK ABOUT THE CHARACTER '% LATER LN THE ROUTINE.158: C
44
',.:.:.....-. . . -...- ... . --............. .. * , .-.. , . .....-v ---.... . . . -.-..*llm I~lm ~ . . ... .' .

159o: INLINE(1) CHARPT('%-)180: ENDIF181: 200 FORMAT(80A1)162: DO 210 1 = 1, 3183: KEY(I) = INLINE(I)184: 210 CONTINUE185: DO 220 1 = 1, 11166: AUTH(I) = INLINE(3+I)187: 220 CONTINUE
* 168: DO 230 1 =- 1, 58189: TITL(I) - INLINE(14+I)170: 230 CONTINUE171: DO 2401- ,12172: YEAR(I) = INLINh'E(72+I)173: 240 CONTINUE174: ACTN(1) = INLINE(75)175: C178: C A METHOD OF SPECIFYING END-OF-FILE IN A FILE IS TO PUT
THE CHARACTER '%'* 177: C AS THE FIRST CHARACTER ON A LINE. THE DRIVER USES THIS
FOR MULTIPLE178: C SETS OF INPUT CASES.179: C180: .IF ((.NOT.(CHAREQ(KEY(1),'%'))) AND.181: X (BEFORE(KEY,3,LASTUK,3)))182: WRITE(8.250) KEY183: 250 FORMAT(' 1,'KEY ',3A.' OUT OF SEQUENCE')184: ELSE185: CALL ARRCPY(KEY,LASTUK,3)
* 188: SEQ = 0187: ENDIF
. 188: .IF (CHAREQ(KEY(i),'%'))189: SEQ - 0190: DO 270 1 = 1, 3191: KEY(I) = CHARPT('Z')192: 270 CONTINUE
• 193: ENDIF194: ENDDO195: RETURN
*196: 299 CONTINUE197: GO$U = 0198: DO 260 1 = 1, 3199: KEY(1) - CHARPT('Z')200: 260 CONTINUE201: RETURN202: END
*203: C* 204: C. 205: SUBROUTINE OUTPUT(KEY,AUTH,TITL,YEAR)
208: LOGICAL*1 KEY(3), AUTH(11), TITL(58). YEAR(2)207: C208: WRITE(8,200) KEY, AUTH, TITL, YEAR209:200 FORMAT(' ,3AI.11Al.58AI,2AI)210: RETURN211: END
45
'......... ....... .- "-"-.-".- ..-...-.-.- .,. - ** ... v . ... -..: . * .* ' - *. .. . . v > :t V, ,I , m,,l,-,..,..,.....*I l ,,. *,.*,,. l l~l''ll* 'l*ll.l l-l*..llll l * .....
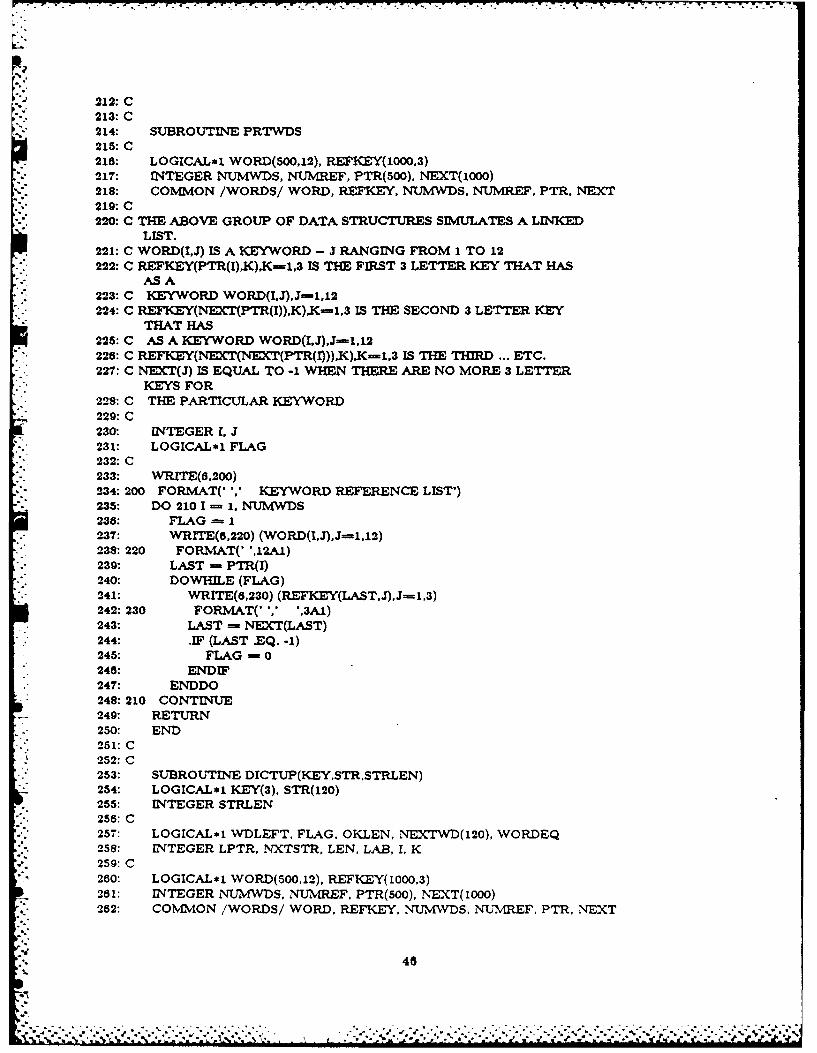
212: C213: C214: SUBROUTINE PRTWDS215: C216: LOGICAL*1 WORD(500,12), REFKEY(1000,3)
" 217: INTEGER NUMWDS, NUMREF, PTR(500), NEXT(1000)218: COMMON /WORDS/ WORD, REFKEY, NUMWDS, NUMREF, PTR, NEXT219: C220: C THE ABOVE GROUP OF DATA STRUCTURES SIMULATES A LINKED
LIST.221: C WORD(I,J) IS A KEYWORD - J RANGING FROM 1 TO 12222: C REFKEY(PTR(I).K),K=1,3 IS THE FIRST 3 LETTER KEY THAT HAS
ASA223: C KEYWORD WORD(I,J),J-I,12224: C REFKEY(NEXT(PTR(I)),K),K-1.3 IS THE SECOND 3 LETTER KEY
THAT HAS225: C AS A KEYWORD WORD(I,J),J-1.12226: C REFKVY(NEXT(NEXT(PTR(I))),K),K-1,3 IS THE THIRD ... ETC.227: C NEXT(J) IS EQUAL TO -1 WHEN THERE ARE NO MORE 3 LETTER
KEYS FOR228: C THE PARTICULAR KEYWORD
- 229:C230: INTEGER 1. J231: LOGICAL*1 FLAG232: C233: WRITE(6,200)234: 200 FORMAT(' ',' KEYWORD REFERENCE LIST')235: DO 210 I - 1, NUMWDS236: FLAG = 1237: WRITE(6,220) (WORD(I,J),J=1,12)238: 220 FORMAT(, ',12A1)239: LAST = PTR(I)240: DOWHILE (FLAG)241: WRITE(6,230) (REFKEY(LAST,J),J-1,3)242: 230 FORMAT('',, ',3A1)
S.243: LAST - NEXT(LAST)' 244: IF (LAST .EQ. -1)
245: FLAG - 0246: ENDIF247: ENDDO248: 210 CONTINUE249: RETURN250: END251: C252: C
. 253: SUBROUTINE DICTUP(KEY,STRSTRLEN)254: LOGICAL*1 KEY(3), STR(120)
* 255: INTEGER STRLEN256: C257: LOGICAL*I WDLEFT, FLAG, OKLEN, NEXTWD(120), VORDEQ258: INTEGER LPTR, NXTSTR, LEN, LAB, I, K259: C280: LOGICAL* WORD(500,12), REFKEY(1000,3)261: INTEGER NUMWDS, NU REF, PTR(500), NFXT(i000)262: COMIMON /WORDS/ WORD, REFKEY, NUNWDS. NUMREF, PTR, NEXT
" 40
* . *"* ."- - - -."%" '."•-"-." . . - - "2 , - ". ."-;' - "- " -"-'-"- ,-, .J-:¢ .. t . - . - - - . - . - . .. ;..'. ; -,,= ., . . . .: o - - . . . - - , . ..

i 263: C*284: C THE ABOVE GROUP OF DATA STRUCTURES SIMULATES A
LINKED LIST.., 288: C WORD(IJ) IS A KEYWORD - J RANGING FROM 1 TO 12
- 266: C REFKEY(PTR(I),K),K=1,3 IS THE FIRST 3 LETTER KEY THAT HAS
ASA267: C KEYWORD WORD(I,J),J=..,12268: C REFKEY(NEXT(PTR()),K)K=1,3 IS THE SECOND 3 LETTER KEY
THAT HAS289: C AS A KEYWORD WORD(I,J),J-1.12270: C REFKEY(NEXT(NEXT(PTR(I))),K),K-1.3 IS THE THIRD ... ETC.
271: C NEXT(J) IS EQUAL TO -1 WHEN THERE ARE NO MORE 3 LETTERKEYS FOR
272: C THE PARTICULAR KEYWORD273: C274: WDLEFT = I
" 275: LPTR - 1278: C277: DOWHILE (WDLEFT)278: FLAG =i279: OKLEN = i
280: LEN = NXTSTR(STR,STRLEN,LPTR,NEXTWD,120)281: .IF (LEN .EQ. 0)282: WDLEFT - 0283: ENDIF284: C285: F (LEN .LE. 2)286: OKLEN - 0287: ENDIF
. 288: C" 289: .IF (OKLEN)"" 290: I=1
291: DOWHILE ((I .LE. NUMWDS).ND. FLAG)
292: .IF (WORDEQ(NEXTWD,I))- 293: LAB - I
294: FLAG = 0" 295: ENDIF
298: 1= I + 1297: ENDDO298: IF (FLAG)
*299: NUMWDS = NUMVDS + 1* 300: NUMREF - NUMREF + I
301: DO 300 K 1, 12
" 302: WORD(NUMWDS,K) - NEXTWD(K)
. 303: 300 CONTINUE304: PTR(NUMWDS) - NTMREF305: DO 310 K = 1, 3308: REFKEY(NIUMREF,K) = KEY(K)
. 307: 310 CONTINUE308: NEXT(NUNMEF) = -
' 309: ELSE310: NUMREF - NUMREF + 1
311: DO 320 K = 1, 3312: REFKEY(N/UMREF,K) = KEY(K)313: 320 CONTINUE
47
, :---. , -..- . . . . ..-. . ..-.-'--...-. ...--... ..'..-.-. . . ..'-..-. ..--. ---- -. .*-- -*-':-:-i .::: -'-::" -:i' . ": :.':2 :.:.'. .:
314: NED'r(NUMREF) - PTR(LAB)315: PTR(LAB) - NUREF316: ENDIF317: ENDIF318: ENDDO319: C320: RETURN321: END322: C323: C324: SUBROUTINE SRTWDS
* 325: C326: LOGICAL*1 WORD(500,12), REFKEY(1000,3)327: INTEGER NUMWDS, NUMREF, PTR(500), NEXT(1000)328: COMMON /WORDS/ WORD, REFKEY, NUMWDS. NUMREF, PTR, NEXT329: C330: C THE ABOVE GROUP OF DATA STRUCTURES SIMULATES A
LINKED LIST.331: C WORD(Ij) IS A KEYWORD - J RANGING FROM 1 TO 12332: C REFKEY(PTR(I),K),K,1,3 IS THE FIRST 3 LETTER KEY THAT HAS
ASA333: C KEYWORD WORD(I.J),J=1,12334: C .REFKEY(NEXT(PTR(I)),K),K 1,3 IS THE SECOND 3 LETTER KEY
% THAT HAS335: C AS A KEYWORD WORD(IJ),J=1,12336: C REFKEY(NEXT(NED(PTR(I))),K),K=1,3 IS THE THIRD ... ETC.337: C NEXT(J) IS EQUAL TO -1 WHEN THERE ARE NO MORE 3 LETTER
KEYS FOR338: C THE PARTICULAR KEYWORD339: C
- 340: INTEGER 1. J. K, LAB, LOWER.B, UPPERB. 341: LOGICAL*l WRDBEF, NEXTWD(12). 342: C
343: UPPERB = NUMWDS - 1344: DO 400 I = 1, UPPERB345: LOWERB = I + I346: DO 410 J -= LOWERB, NUMWDS347: .IF (WRDBEF(JI))348: DO 300 K = 1, 12
- 349: NEXTWD(K) = WORD(I.K)350: 300 CONTINUE351: LAB = PTR(I)352: DO 31o K = 1. 12353: WORD(I.K) = WORD(J,K)354:310 CONTU-'UE355: PTR(I) - PTR(J)356: DO 320 K - 1, 12357: WORD(J,K) - NEXTWD(K)
- 358: 320 CONTINUE. 359: PTR(J) LABd 360: ENDIF
361: 410 CONTINUE362: 400 CONTINUE363: C364: RETURN
48.
, '.- "'-.''.-' -''-.. '-;- "'.-''-,'" -'''. .- " * / ;. * . *' * - * .. . * -. , '''. .- ,,....'V'',.. ''

-385: END
4g

8. References
[BasUl & Turner 78]V. R. BasIli and A. J. Turner, SIMPL-T: A Structured ProgrammingLanguage, Paladin House Publishers, Geneva, IL, 1978.
[Basill & Perricone 84]V. R. Baslll and B. T. Perricone, Software Errors and Complexity: An Em-pirical Investigation, Communications of the ACM 27, 1, pp. 42-52, Jan.1984.
(Basll! & Selby 84]V. R. Basill and R. W. Selby, Jr., Data Collection and Analysis in SoftwareResearch and Management, Proceedings of the American Statistical Associa-tion and Biometric Society Joint Statistical Meetings, Philadelphia, PA, Au-gust 13-18, 1984.
[Basill & Weiss 84]V. R. Basill and D. M. Weiss, A Methodology for Collecting Valid SoftwareEngineering Data*, Trans. Software Engr. SE-10, 8, pp. 728-738, Nov. 1084.
[Box, Hunter, & Hunter 78]G. E. P. Box, W. G. Hunter, and J. S. Hunter, Statistics for Experimenters,John Wiley & Sons, "4ew York, 1978.
* (Callliau & Rubin 79]R. Callilau and F. Rubin, ACM Forum: On a Controlled Experiment In Pro-gram Testing, Communications of the ACM 22, pp. 887-8, Dec. 1979.
* [Church 84]V. Church, Benchmark Statistics for the VAX 11/780 and the IBM 4341,Computer Sciences Corporation, Sliver Spring, MD, Internal Memo, 1984.
*[Cochran & Cox 50]W. G. Cochran and G. M. Cox, Experimental Designs, John Wiley & Sons,New York, 1950.
(Fagan 78]M. E. Fagan, Design and Code Inspections to Reduce Errors In Program De-velopment, IBM Sys. J. 15, 3, pp. 182-211, 1978.
(Foster 80]K. A. Foster, Error Sensitive Test Cases, IEEE Trans. Software Engr. SE-6,3, pp. 258-284, 1980.
50

*: (Gloss-Soler 79]S. A. Gloss-Soler, The DACS Glossary: A Bibliography of Software Engineer-Ing Terms, Data &: Analysis Center for Software, GrIffIss Air Force Base, NY13441, Rep. GLOS-1, Oct. 1979.
[Goodenough & Gerhart 75]J. B. Goodenough and S. L. Gerhart, Toward a Theory of Test Data Selec-tion, IEEE Trans. Software Engr., pp. 156-173, June 1975.
[Hetzel 781W. C. Hetzel, An Expermental Analysis of Program Verification Methods,Ph.D. Thesis, Univ. of North Carolina, Chapel Hill, 1978.
[Howden 781W. E. Howden, Algebraic Program Testing, Acta Informatica 10, 1978.
[Howden 80]W. E. Howden, Functional Program Testing, IEEE Trans. Software Engr.SE-6, pp. 162-189, Mar. 1980.
[Howden 81][Hw W.E. Howden, A Survey of Dynamic Analysts Methods, pp. 209-231 In Tu-
torial: Software Testing 8F Validation Techniques, 2nd Ed., ed. E. Miller andW. E. Howden, 1981.
[Hwang S]S-S. V. Hwang, An Empirical Study In Functional Testing, Structural Test-Ing, and Code Readlng/Inspectlon*, Dept. Com. Sc., Unlv. of Maryland,College Park, Scholarly Paper 382, Dec. 1981.
[IEEE 83]IEEE, IEEE Standard Glossary of Software Engineering Terminology, Rep.IEEE-STD-729-1983, IEEE, 342 E. 47th St, New York, 1983.
-. [Jensen & Wirth 74]K. Jensen and N. Wlrth, -PASCAL User Manual and Report, 2nd Ed.,Springer-Verlag, New York, 1974.
[Johnson, Draper & Soloway 83]V. L. Johnson, S. Draper, and E. Soloway, An Effective Bug Classification
1,4 Scheme Must Take the Programmer into Account, Proc. Workshop High-Level Debugging, Palo Alto, CA, 1983.
'4. 5 1
-. I.a ........... ....................... *~*

[Linger, Mills & Wltt 79]R. C. Linger, H. D. Mills, and B. I. Vltt, Structured Programming: Theoryand Practice, Addison-Wesley, Reading, MA, 1979.
[McMullin & Gannon 80]P. R. McMullln and J. D. Gannon, Evaluating a Data Abstraction Testing
.- System Based on Formal Speciflcations, Dept. Com. Scl., Univ. of Maryland,College Park, Tech. Rep. TR-993, Dec. 1980.
[Mills 72]H. D. Mills, Mathematical Foundations for Structural Programming, IBMReport FSL 72-8021, 1972.
(Mills 75]H. D. Mills, How to Write Correct Programs and Know It, Int. Conf on Re-liable Software, Los Angeles, pp. 383-370, 1975.
[Myers 78]G. J. Myers, A Controlled Experiment In Program Testing and CodeWalkthroughs/Inspectlons, Communications of the ACM, pp. 760-788, Sept.1978.
". [Myers 79]G. J. Myers, The Art of Software 'Testing, John Wiley & Sons, New York,1979.
[Naur 89]P. Naur, Programming by Action Clusters, BIT 9, 3, pp. 250-258, 1989.
[Ostrand & Weyuker 83]T. J. Ostrand and E. J. Weyuker, Collecting and Categorizing Software Er-ror Data In an Industrial Environment, Dept. Com. Scl., Courant Inst. Math.Scl., New York Univ., NY, Tech. Rep. 47, August 1982 (Revised May 1983).
. (Selby 831R. W. Selby, Jr., An Empirical Study Comparing Software Testing Tech-niques, Sixth Minnowbrook Workshop on Software Performance Evaluation,Blue Mountain Lake, NY. July 1-22, 1983.
[Seby 841 R W. Selby, Jr., Evaluating Software Testing Strategies, Proc. of the Ninth
Ann sal Software Engineering Workshop, NASA/GSFC, Greenbelt, NvD, Nov.1984.
52
,%-"- ,...,-.-..... . * .-.. .'.. ..- . -. "-"... ... ...- :. -,-....-,.....-........,...

[Selby, Basill & Baker 851R. W. Selby, Jr., V. R. Basill, and F. T. Baker, CLEANROOM Software De-velopment: An Empirical Evaluation, Dept. Com. Scl, Univ. Maryland, Col-lege Park, Tech. Rep. TR-1415, February 1Q85. (submitted to the IEEETrans. Software Engr.)
[Stucki 771L. G. Stuckl, New Directions In Automated Tools for Improving SoftwareQuality, In Current Trends in Programming Methodology, ed. R. T. Yeh,Prentice Hall, Englewood Cliffs, NJ, 1977.
[Valdes & Goel 83]P. M. Valdes and A. L. Goel, An Error-Specific Approach to Testing, Proc.Eight Ann. Software Engr. Workshop, NASA/GSFC, Greenbelt, MD, Nov.1983.
[Weiss & Basill 85]D. M. Weiss and V. R. BasIll, Evaluating Software Development by Analysisof Changes: Some Data from the Software" Engineering Laboratory, IEEETrans. Software Engr. SE-il, 2, pp. 157-168, February 1985.
53
................................h'.-

Figure 1. Cap ablitles of the testing methods.code reading functional structural
testing testing
view programspecification X X X
view sourcecode X X
executeprogram X X
Figure 2. Structure of goals/sub goals/ questions for testing experiment.
1. Fault detection effectiveness
A. For programmers doing unit testing, which of the testing techniques(code reading, functional testing, or structural testing) detects themost faults In programs?
1. 'Which of the techniques detects the greatest percentage of faults Inthe programs (the programs each contain a different number offaults)?
2. Which of the techniques exposes the greatest number (or percentage)or program faults (raults that are observable but not necessarilyreported)?
B. Is the number of faults observed dependent on software type?
C. Is the number of faults observed dependent on the expertise level of theperson testing?
HI. Fault detection cost
A. For programmers doing unit testing, which of the testing techniques(code reading, functional testing, or structural testing) detects thefaults at the highest rate (#faults/ effort)?
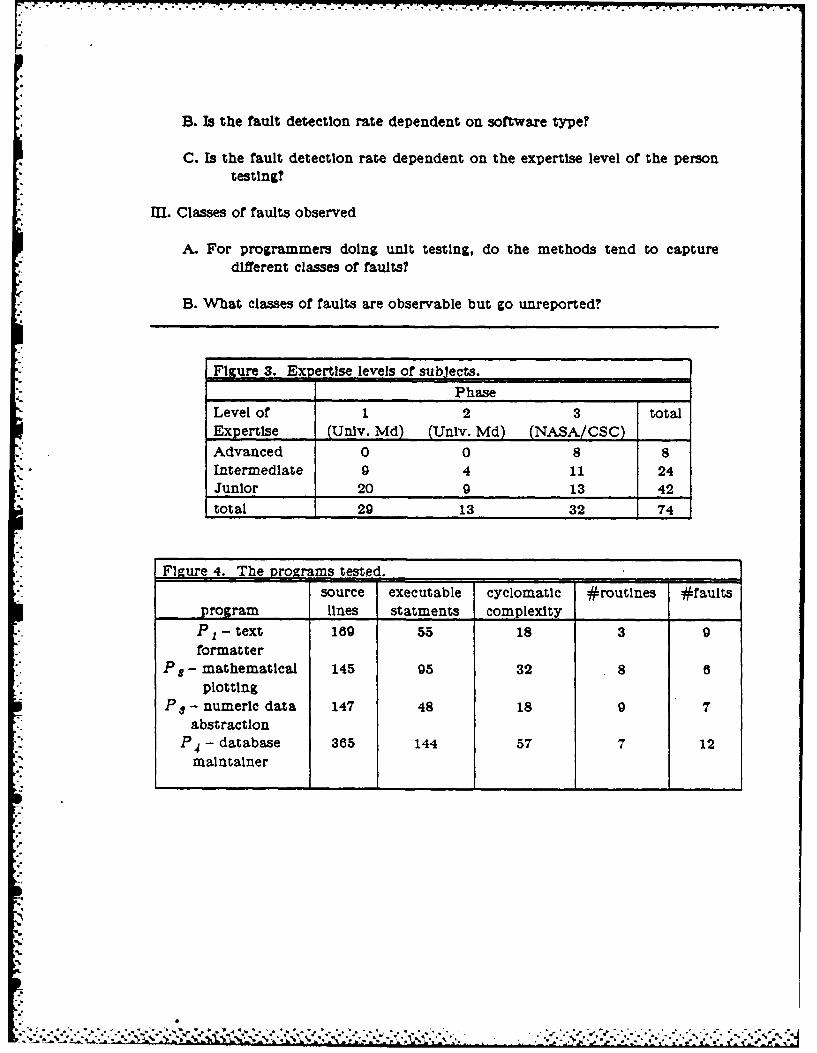
B. Ls the fault detection rate dependent on software type?
C. Is the fault detection rate dependent on the expertise level of the persontesting?
MII. Classes of faults observed
A. For programmers doing unit testing, do the methods tend to capturedifferent classes of faults?
B. What classes of faults are observable but go unreported?
Figure 3. Expertise levels of subjects.
PhaseLevel of 1 2 3 totalExpertise (Unlv. Md) (Univ. Md) (NASA/CSC)
" Advanced 0 0 8 8Intermediate 9 4 11 24Junior 20 9 13 42total 29 13 32 74
F1gure 4. The programs tested.source executable cyclomatic #routines #faults
program lines statments complexityP, - text 189 55 18 3 9formatter
Pgo - mathematical 145 95 32 8 6plotting
P - numeric data 147 48 18 9 7abstraction
P4 - database 365 144 57 7 12
maintainer
22-. :.., . ..-... -.-. ', . .,,... ,..,.,-.,,,..:. .' . ' ... ., .. .. . ... *.......,,.... ... .. . -..... < ...

Figure 5. Programs tested In each phase of the analysi1s.
Program Phase
1 2 3"._(Univ. Md) (Univ. Md) (NASA/CSC)
P1 - text formatter X X XP - mathematical plotting X XP 8 - numeric data abstraction X XP, - database maintainer X X
Figure 8. Distributlon of faults In the programs.
_Omission Commission TotalInitialization 0 2 2Computation 4 4 8Control 2 5 7Interface 2 11 13Data 2 1 3Cosmetic 0 1 1Total 10 24 34
FIgure 7. Fault classification and manifestation.FaultProgram Omission/ Class Description
Commissiona P1 omission control a blank Is printed before the first word
on the first line unless the first word Is30 characters long; In the latter case, ablank line Is printed before the firstword
b P1 commission Initializatlonthe character & (not$) Is the new-linecharacter
c P1 commission Initlallzatlonthe line size Is 31 characters (not 30);this fault causes the references to thenumber 30 In the other faults to be ac-
tually the number 31d P1 commission Interface since the program pads an empty input
buffer with the character "z," It ignoresa valid input line that has a "z" as afirst character
e P1 omission control successive break characters are not con-densed In the output
. . . . . . . . .. . . . . . .
-.. . . ~

f P1 commission cosmetic spelling mistake In the error message,*** word to long ***"
g P1 commission computationafter detecting a word In the Inputlonger than 30 characters, the message"*** word to long ***" Is printed once
for every character over 30, and the pro-cessing of the text does not terminate
h P1 omission Interface after detecting a word in the Inputlonger than 30 characters, the programprints whatever Is residing In Its outputbuffer
I P1 commission control after detecting an Input line without anend-of-text character, the program er-roneously Increments Its buffer pointerand replaces the first character of thenext Input line with a "z"
J P3 commission Interface routine FIRST returns zero (0) when thelist has one element
k P3 commission Interface routine ISEMPTY returns true (1) whenthe list has one element
S P3 commission Interface routine DELETEFIRST can not deletethe first list element when the list hasonly one element
m P3 commission Interface routine LISTLENGTH returns one lessthan than the actual length of the list
n P3 commission Interface routine ADDFIRST can add more thanthe specified five elements to the list
o P3 commission Interface routine ADDLAST can add more thanthe specified five elements to the list
p P3 omission computationroutine REVERSE does not reverse thelist properly when the list has more thanone element
q P4 commission computationwords greater than or equal to threecharacters (not strictly greater than) aretreated as cross reference keywords
r P4 commission Interface since the program uses the key "ZZZ" asan end-of-input sentinel, It does not pro-cess a valid record with key "ZZZ" andignores any following records
s P4 commission control update action add with the error condl-tion "key already In the master file" re-places the existing record; the updaterecord Is not Ignored

t P4 commission control update action replace with the error con-ditlon "key not found In the master file"adds the record; the update record Is notignored
u P4 omission data the number of references and number ofwords In the dictionary are not checkedfor overflow
v P4 omission computationtwo or more update transactions for thesame master record give Incorrect results
w P4 commission Interface keywords longer than 12 characters aretruncated and not distinguished
x P4 commission control an update record with column 80 neitheran add action "A" nor replace action"R" acts like an add transaction
y P4 commission Interface keyword Indices appear In reverse alpha-betical order
z P4 omission Interface no check Is made for unique keys In themaster file
A P4 commission Interface punctuation Is made a part of the key-word
B P4 omission data words appearing twice In a title get twocross reference entries
C P2 commission computatlonthe x and y axes are mislabeledD P2 omission computation points with negative y-values are not
processed and do not appear on thegraph
E P2 commission control the origin (0,0) appears on the graph re-gardless of whether It Is an Input point
F P2 commission data no points can appear on the vertical axisG P2 commission computatlonthe vertical and horizontal scaling for
the pixels are calculated Incorrectly,causing some points not to appear In theproper pixel
H P2 omission computationw hen more than one point would appearIn a given pixel, only an asterisk (*) ap-pears, not an appropriate Integer
S-.
'5" , ....... . .. . ......- . Li. . ........ . . . . . . . . .

Flgure 8. Fractional Factorial Design•
Code Functional StructuralReading Testing Testing
P, P1 P 4 PIPSP4 PIPSP4
S, -x -x- Advanced So -X- X -Subjects
S8 x- -x --
S 9 -X- X- .xInter- S1 o - -X- X.mediateSubjects
,19 X- X -X-
S 20 -X- X- -xJunior S 2 1 X- -x-X-
Subjects .
S32 -x -X--
V.:

Figure 9. Overall summary of detection effectiveness data.Note: some data pertain to only on-line techniques (*), and
some data were collected only In certain Phases.
Phase #SubJ. Measure Mean SD Min. Max.
1 29 # Faults detected 3.94 1.82 0.00 7.00
1 29 % Faults detected 54.78 26.11 0.00 100.00
1 29(*) # Faults observable 5.38 1.51 3.00 8.00
1 29(*) % Faults observable 74.59 20.54 33.3 100.00
1 29(*) % Detected/observable 70.99 24.01 0.00 100.00
2 13 # Faults detected 3.28 1.96 0.00 7.00
2 13 % Faults detected 39.53 27.25 0.00 100.00
3 32 # Faults detected 4.27 1.88 0.00 8.003 32 % Faults detected 49.82 27.44 0.00 100.00
3 32 % Faults felt found 75.10 24.07 0.00 100.00
3 32(*) #& Faults observable 5.61 1.52 3.00 9.00
3 32(*) % Faults observable 62.11 18.38 25.00 100.00
3 32(*) % Detected/observable 69.67 27.14 0.00 100.00
3 32(*) Max. % stmt. covered 97.02 7.83 46.00 100.00
Ave 74 : Faults detected 3.97 1.88 0.00 8.00
Ave 74 % Faults detected 49.96 27.29 0.00 100.00
Ave 61(*) # Faults observable 5.5 1.5 3.00 9.00
Ave 61(,) % Faults observable 68.0 20.3 25.0 100.0
Ave 61* % Detected /obse rvab le 70.3 25.6 0.0 j100.0
.i .
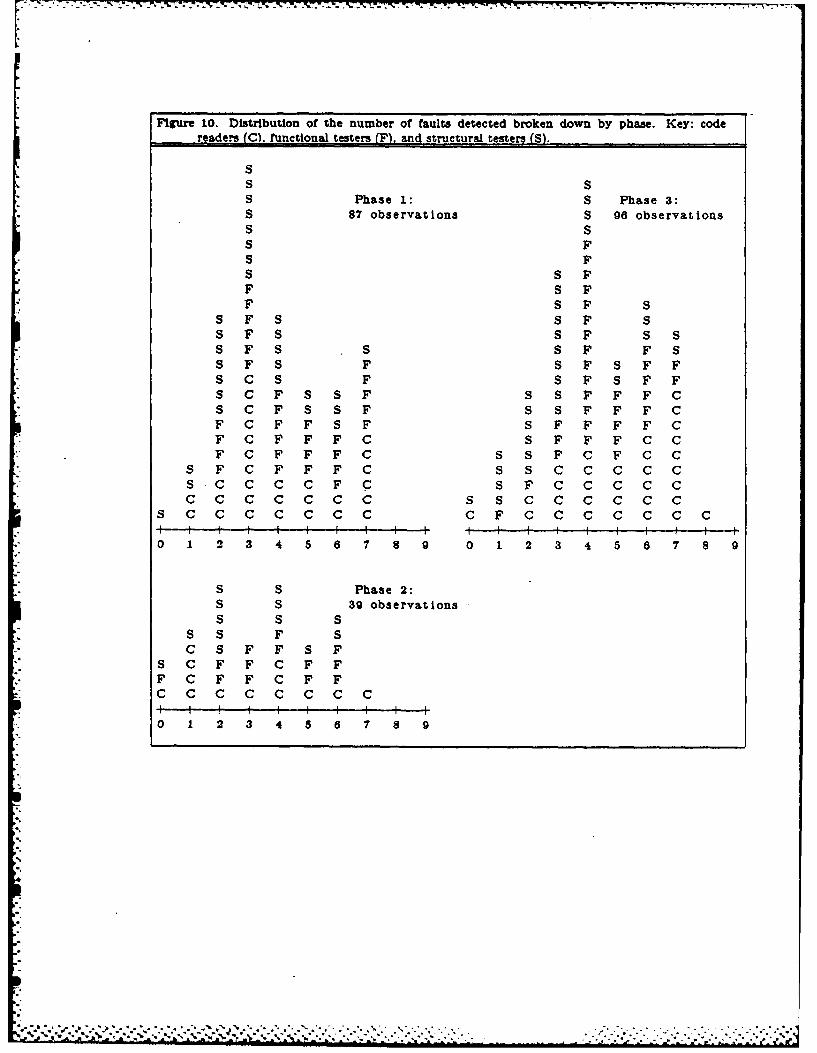
Figure 10. Distribution of the number of faults detected broken down by phase. Key: codereaders (C). functional testers (F), and structural testers (S).
S- S S
S Phase 1: S Phase 3:S 87 observations S 96 observationsS SS FS FS S FF S FF S F S
S F S S F SS F S S F S SS F S S S F F SS F S F S F S F FS C S F S F S F FS C F S S F S S F F F CS C F S S F S S F F F CF C F F S F S F F F F CF C F F F C S F F F C CF C F F F C S S F C F C C
S F C F F F C S S C C C C CS C C C C F C S F C C C C CC C C C C C C S S C C C C C C
S C C C C C C C C F C C C C C C C
0 1 2 3 4 5 6 7 8 9 0 1 2 3 4 5 6 7 8 9
S S Phase 2:S S 39 observations
S S SS S F SC S F F S F
S C F F C F FF F F C F FC C C C C C C C
I ', ', I I I, , , I
0 1 2 3 4 5 6 7 8 9
N.
.
. . . . .. . . . . . . . . . . . . . . . .
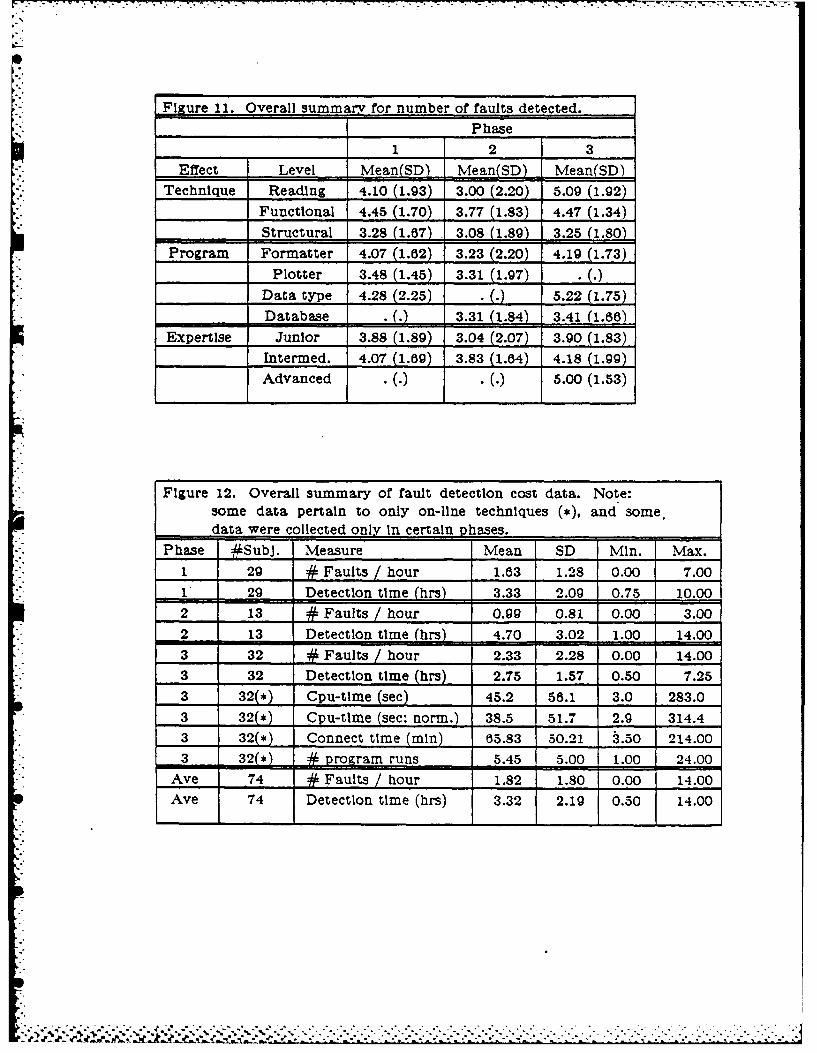
FIure 11. Overall summary for number of faults detected.Phase
1 2 3Effect Level Mean(SD) Mean(SD) Mean(SD)
Technique Reading 4.10 (1.93) 3.00 (2.20) 5.09 (1.92)Functional 4.45 (1.70) 3.77 (1.83) 4.47 (1.34)
Structural 3.28 (1.67) 3.08 (1.89) 3.25 (1.80)Program Formatter 4.07 (1.62) 3.23 (2.20) 4.19 (1.73)... .. Plotter 3.48 (1.45) 3.31 (1.97) . G)
Data type 4.28 (2.25) G) 5.22 (1.75)
Database .(.) 3.31 (1.84) 3.41 (1.66)
Expertise Junior 3.88 (1.89) 3.04 (2.07) 3.90 (1.83)Intermed. 4.07 (1.89) 3.83 (1.64) 4.18 (1.99)
Advanced . (.) . (.) 5.00 (1.53)
Figure 12. Overall summary of fault detection cost data. Note:some data pertain to only on-line techniques (*), and some.data were collected only In certain phases.
Phase LSubj. Measure Mean SD Min. Max.1 29 # Faults / hour 1.63 1.28 0.00 7.001 29 Detection time (hrs) 3.33 2.09 0.75 10.002 13 # Faults / hour 0.99 0.81 0.00 3.002 13 Detection time hrs) 4.70 3.02 1.00 14.003 32 # Faults / hour 2.33 2.28 0.00 14.003 32 Detection time (hrs) 2.75 1.57 0.50 7.253 32(*) Cpu-time (sec) 45.2 56.1 3.0 283.03 32(*) Cpu-time (sec; norm.) 38.5 51.7 2.9 314.43 32(*) Connect time (min) 85.83 50.21 3.50 214.003 32(*) 4 program runs 5.45 5.00 1.00 24.00
Ave 74 # Faults / hour 1.82 1.80 0.00 14.00Ave 74 Detection time (hrs) 3.32 2.19 0.50 14.00

Figure 13. Distribution of the fault detection rate (#faults detected per hour) broken downby iphase. Key: code readers (C), functional -testers (F). and structural testers (S)l.
SSS Phase 1: Phase 3:
SS 87 observations 96 observationsss SSS S
SS SFFSS SFFFS SF5FF5 SFSFFSS FFS SFFSS FFS SFFFS SFTF SCFFF SFCF FCFFF SFCF F SOCFF S SSFCFSF S
FCICF F SFCOSFS SCCOF F S FFCCCFFF SCcXXXFSSF SCFCcCFCC S C
SCCCOcaFCC CcC C CCCCccOctF CFC C c cc C
0 S 10 is 0 5 10 1
S Phase 2:F 39 observationsFSFSF5SFF5Scc scc S
SCCSFFFCCSCFS SOOSCFF F
0 S 10 is
'AA
9.6

Figure 14. Overall summary for fault detection rate (# faultsdetected per hour).
Phase1 2 3
Effect Level Mean(SD) Mean(SD) Mean(SD)Technique Reading 1.90 (1.83) 0.58 (0.48) 3.33 (3.42)
Functional 1.58 (0.90) 1.22 (0.91) 1.84 (1.08)__ _ Structural 1.40 (0.87) 1.18 (0.84) 1.82 (1.24)Program Formatter 1.60 1.39) 0.98 (0.67) 2.15 (1.10)
_"_ Plotter 1.19 (0.83) 0.92 (0.71) • G)
____ Data type 2.09 (1.42) .G) 3.70 (3.28)Database •(.) 1.05 (1.04) 1.14 (0.79)
Expertise Junior 1.38 (0.97) 1.00 (0.85) 2.14 (2.48)_______Intermed. 2.22 (1.88) 0.98 (0.74) 2.53 (2.48)
Advanced . (.) . (.) 2.38 (1.81)
Figure 15. Characterization of the faults detected.
Code Functional S..;uctural Overall,._ Reading Testing TestlnOmission 55.8 (40.1) 81.0 (39.5) 39.2 (41.8) 52.0 (41.3)
Commission 54.3 (32.1) 53.5 (25.4) 44.3 (28.6) 50.7 (28.4)Total 54.1 (29.2) 54.8 (24.5) 41.2 (28.1) 50.0 (27.3)Initial. 64.8 (40.3) 75. 46.2(39.8) 81.5(40.2)
Control 42.8 (38.8) 86.7 (34.9) 48.8 3.5) 52.8 (37.2)
Data 20.7 (38.8) 28.3 (44.9) 28.8 (41.9) 25.3 (41.0)Computat. 70.9 (37.0) 84.2 (40.8) 58.8 (43.5) 84.8 (40.8)
Interface 48.7 (38.5) 30.7 (33.5) 24.8 (29.4) 34.1 (35.1)Cosmetic 18.7 38.1) 8.3 (28.2) 7.7 (27.2) 10.8 (31.3)Total 54.1 (29.2) 54.8 (24.5) 41.2 (28.1) 50.0 (27.3)
, .*-°

Figure 18. Characterization of faults detected by the threetechniques: 10 omlsslon (0) vs. 24 commission (x). Thevertical axis Is the number of persons using the particulartechnique that observed the fault.
Reading Functional Structural
100%O OxO
xxxx Oxxx OxOxxx x
o x x75% x xOxxx x
xO x 0xxx xx xxxxx xx
x x50% Oxx
xxxO xOxxxOx xx Ox
xx x25% Oxx xxx
xxxx xOO 0
xOOxO OxO0
0% xOOxO xOx Oxx

Figure 17. Characterization of faults detected by the threetechniques: Initialization (2-A), computation (8-P), con-trol (7-C), data (3-D), interface (13-I), and cosmetic (I-S).The vertical axis is the number of persons using the par-ticular technique that observed the fault.
Reading Functional Structural
100%P PIP
PTMT P1TC PCCM IP A P
75% C ACPPC CAP C PAlP CC PCPCC PC
D A50% CPI
Ii DPIICP AD CI
PI I25% DCI IIC
SPIE HI D
SIPID CSDI
0% CPID IDI PHI
.o"- .- -

Figure 18. Characterization of the faults observable, but not reported.
Functional Structural OverallTesting Testing
Omission 15.7 (25.4) 21.3 (31.8) 18.5 (28.8)Commission 10.1 (20.0) 20.1 (16.6) 19.8 (18.3)Total 18.1 (17.8) lg.g (16.8) 19.0 (17.3)
Initial. 5.0 (15.4) 14.3 (32.2) 9.8 (25.5)Control 20.3 (30.0) 21.1 (31.4) 20.7 (30.8)Data 28.6 (43.5) 7.5 (24.5) 18.3 (38.7)Computat. 18.0 (31.3) 20.1 (37.6) 18.0 (34.5)Interface 16.1 (20.0) 20.3 (21.5) 18.2 (20.8)
Cosmetic 60.0(50.3) 8.5.7 (35.9) 73.2 (44.9)
Total 18.1 (17.8) 10.9 (18.8) 19.0 (17.3)
UNCLASSIFIEDSECURITY CLASSIFICATION OF THIS PAGE (When Data Entered),
PAGE READ INSTRUCTIONSREPORT DOCUMENTATION PBEFORE COMPLETING FORM
1. := SYR M 8 r 2. GOVT ACCESSION NO. 3. RECIPIENT'S CATALOG NUMBER
4. TITLE (and Subtitle) S. TYPE OF REPORT & PERIOD COVERED
COMPARING THE EFFECTIVENESS OF SOFTWARETESTING STRATEGIES Technical Report
6. PERFORMING OG. REPORT NUMBER
TR-1501
7. AUTHOR(&) 6. CONTRACT OR GRANT NUMBER(#)
0Victor R. Basili and Richard W. Selby, Jr. 4F@F49620-8O-C-00l
9. PERFORMING ORGANIZATION NAME AND ADDRESS 10. PROGRAM ELEMENT, PROJECT, TASK
AREA & WRORK UNIT NUMBERS
Department of Computer Science /IUniversity of MarylandCollege Park, Maryland 20742 P
II. CONTROLLING OFFICE NAME AND ADDRESS 12. REPORT DATE /Math. & Info. Sciences, AFOSR May 1985Bolling AFB 13. NUMBER OF PAGES
Washington, D. C. 20332 6714. MONITORING AGENCY NAME & ADDRESS(if different from Controlting Office) IS. SECURITY CLASS. (of this report)
UNCLASSIFIED
ia. DECLASSIFICATION/ DOWNGRADINGSCHEDULE
16. DISTRIBUTION STATEMENT (of this Report)
Approved for public release; distribution unlimited
17. DISTRIBUTION STATEMENT (of the abstract entered in Block 20, it different from Report)
I. SUPPLEMENTARY NOTES
19 K(EY WORDS (Continue on revers, side if necessary and identify by block number)
software testing, functional testing, structural testing, code reading,off-line software review, empirical study, methodology evaluation,software measurement
20 ABSTRACT 'Co.ninue on reverse idse If necessary and Identify by block number) This study compares thestrategies of code reading, functional testing, and structural testing inthree aspects of software testing: fault detection effectiveness, faultdetection cost, and classes of faults detected. Thirty-two professionalprogrammers and 42 advanced students a-plied the three techniques to fourunit-sized programs in a fractional factorial experimental design. The majorresults of this study are the following. 1) With the professional programmers,code reading detected more software faults and had a higher fault detection
DD , A11173 1473 EDITION OF I NOV GS IS OBSOLETE UNCLASSIFIEDSECURITY CLASSIFICATION OF THIS PAGE eWhen Data Entred)
,. . .. .. -... .-. . . . - ..... ..... . -. -

UNCLASSIFIEDSECURITY CLASSIFICATION OF THIS PAGE(Ihan Date En'tered)
rate than did functional or structural testing, while functional testingdetected more faults than did structural testing, but functional and struc-tural testing were not different in fault detection rate. 2) In one advancedstudent subject group, code reading and functional testing were not differentin faults found, but were both superior to structural testing, while in theother advanced student subject group there was no difference among the tech-niques. 3) With the advanced student subjects, the three techniques were notdifferent in fault detection rate. 4) Number of faults observed, faultdetection rate, and total effort in detection depended on the type of softwaretested. 5) Code reading detected more interface faults than did the othermethods. 6) Functional testing detected more control faults than did theother methods. 7) When asked to estimate the percentage of faults detected,code readers gave the most accurate estimates while functional testers gavethe least accurate estimates.
qJ
UNCLASSIFIEDSECuR!TY CLAS31FICATION4 OF ?T ' PAGErWh~rI Data Entered)

-.72.- .-- . - ~ -- -- 9.8 ~-%- - ~ a. .. " .a
FILMED
12-85
DTIC8**%