the effectiveness of an early grades literacy intervention on the...
TRANSCRIPT
The effectiveness of an early grades literacy intervention on
the cognitive achievement of Brazilian students1
Leandro Costa World Bank
Martin Carnoy
Stanford University
Abstract
Beginning in 2007, the Literacy Program at the Right Age (PAIC) in Brazil’s Ceara state required municipal schools to implement a tiered, whole-school early grades literacy intervention. This intervention was complemented by other policies to help municipalities improve student achievement. Observational studies of the PAIC suggest that it correlates with significant improvement in student test performance, but to date, there has been no causal analysis to PAIC’s contribution to more learning. This study presents more detailed evidence to support PAIC ‘s positive effect on student achievement. We base our estimates on state and school level panel data of student test scores from the National Assessment System of Basic Education (Prova Brasil). PAIC’s impact is identified using a triple-difference analysis (DDD approach) that relies on comparisons of the test-score changes in Ceara and bordering states and for grades and schools treated and not treated by the literacy program since 2007. Our results indicate that PAIC produced statistically significant increases in the average Portuguese performance of fifth graders (effect size 0.07-0.09 by 2011) and greater increases in math performance (effect size 0.12-0.18 by 2011). Increases were estimated to be larger for students with initially higher test scores. As a robustness check, we found evidence of much greater improvement in Portuguese (effect size 0.14-0.20) and mathematics (effect size 0.27-0.30) when we estimated a modified DDD approach that considers the interaction effect of students’ early childhood education and the PAIC program. This suggests that PAIC has not helped reduce the gap between students that have participated or not in early childhood education. Keywords: Impact Evaluation, Literacy Intervention, Literacy Program at the Right Age-PAIC Submission area: Econometrics JEL: C14; C52; I21
1 This study was sponsored by the Lemann Center for Educational Entrepreneurship and Innovation in Brazil at the Graduate School of Education, Stanford University.
1. Introduction
In 2012, the Brazilian Ministry of Education launched the National Pact of Literacy at the Right Age (PNAIC) in an effort to significantly improve the literacy and mathematics skills of 6 and 8 year-olds in public schools. Usually, such large-scale initiatives designed to change classroom instruction have a low probability of being effective (Elmore, 1996). However, the decision to implement PNAIC was based on the apparent success of an extensive professional development initiative in Ceara state—the Literacy Program at the Right Age (PAIC). Since its implementation in 2007, primary school students in the State of Ceara have made significant gains compared to other states in reading and math scores on Brazil’s national test. The question is whether these gains were due only to the PAIC or to other conditions particular to Ceara.
Recent empirical educational policy evaluations of literacy interventions in the United States are not especially favorable for the success of the Brazilian program. U.S. studies have shown inconsistent effects on students’ cognitive achievement. For example, Gansen et al (2008) found that the National Reading First program did not have a positive impact on students’ reading comprehension, particularly in early implementation. Baker (2011) argued that national studies could not be generalized to individual states and found positive effects for Oregon Reading First. Corin et al (2012) evaluation of the implementation and impact of a tiered, whole-school adolescent literacy intervention, the Content Literacy Continuum, found not only that it was inadequately implemented, but that it had no significant impact on student outcomes.
However, Jordam (2000) suggests that there are good theoretical reasons to expect a strong relationship between literacy interventions during the preschool and kindergarten years and later success in conventional literacy tasks (Neuman, Dickson, 2003; Adams, 1990; Snow, Burns, Griffin, 1998). Also, Cunha and Heckman (2010) state that a variety of intervention studies indicate that ability gaps in children from different socioeconomic groups can be reduced if remediation is attempted at early ages. This association can be related to recent studies confirming that the most important factor for school success and, consequently, for reaching higher levels of productivity as adults is early childhood education. Yet, there are no rigorous empirical studies of the interaction of early childhood education and the impact of literacy programs in the early primary grades.
In this paper, we will use the extensive database from PAIC to test the causal effect of the program in elementary public schools and therefore its possible impact nationally. We will analyze whether the improvement in literacy and mathematics by students who attended Ceara’s PAIC program are mainly the result of PAIC or also the result of early childhood education (ECD). Finally, we will assess whether the PAIC has reduced the gap between students with and without early childhood education.
Since PAIC only started in 2007 in the early grades of Ceara’s state public schools, the students in the 5th grade who took the Prova Brazil in 2011 is the first cohort participating in a full three years of the program. This is our treatment group. Ninth graders and 5th graders in neighboring states who took the Prova Brazil in 2011 did not participate in the PAIC. These are our “control” groups. We use the variation in PAIC implementation between grades and states to compare the 2011 5th grade student cohort in Ceara state with the untreated 5th graders in states bordering Ceara as well as the untreated 9th graders in Ceara state. We argue that this quasi-experimental research design allows us to estimate the effect of the literacy program on students’ cognitive achievement, accounting for the influence of state-level constant unobservable factors and within state programs that could have affected the students during the same period.
We find that the PAIC program as implemented in the first three grades of primary school in Ceara improved students’ Prova Brasil scores and that the improvements were greater for initially higher achieving students. We also find that it has not reduced the gap between students with and without ECD.
The paper is structured as follows: in the next section we describe Brazil’s literacy improvement policies and explain how the PAIC program is organized to promotes the literacy of students in Ceara’s primary schools. Section 3 describes the data. Section 4 outlines our empirical strategy and section 5 shows the results. Section 6 performs some robustness checks. Finally, Section 7 summarizes the results and concludes.
2. Literacy and the PAIC program
In 2007, the Brazilian government reported that more than 70 percent of pupils who
reach the last grade of primary education had inadequate literacy skills2. Findings from the National Survey of Brazil (PNAD) showed that the proportion of children between 7 and 14 years old who don’t know how to read a small piece of paper was 5.4 percent in 2011, and in rural areas the proportion was 10 percent. More than 97% of these illiterate children had attended school, suggesting that the quality of education plays a role in whether children attain minimal levels of literacy3. To resolve this problem, the Brazilian government initiated a nationwide public school literacy improvement program in 2012—the PNAIC. As in many past expensive programs created by the Ministry of Education in Brazil, no rigorous impact evaluation was implemented to assess the possible effect of the PNAIC before launching it on a national scale.
Nevertheless, the government did have some evidence that the PNAIC might be successful. PNAIC was based on Ceara’s statewide PAIC program and other international interventions.4 Ceara is one of the poorest states in Brazil. In 2011, 55 percent of children in Ceara finishing fourth grade of elementary school faced serious difficulties in reading, writing and comprehending simple texts. However, the state has significantly lowered its illiteracy rate among children from 7 to 14 years old from 18 percent in 2001 to 6 percent in 2011. The PAIC program was launched in 2007 (fully implemented in 2008) based on cooperation with municipal governments, which are the administrative entity most responsible for preschool and early primary education. The program was intended to have all children reach appropriate proficiency levels in reading, writing, and arithmetic skills by age eight.
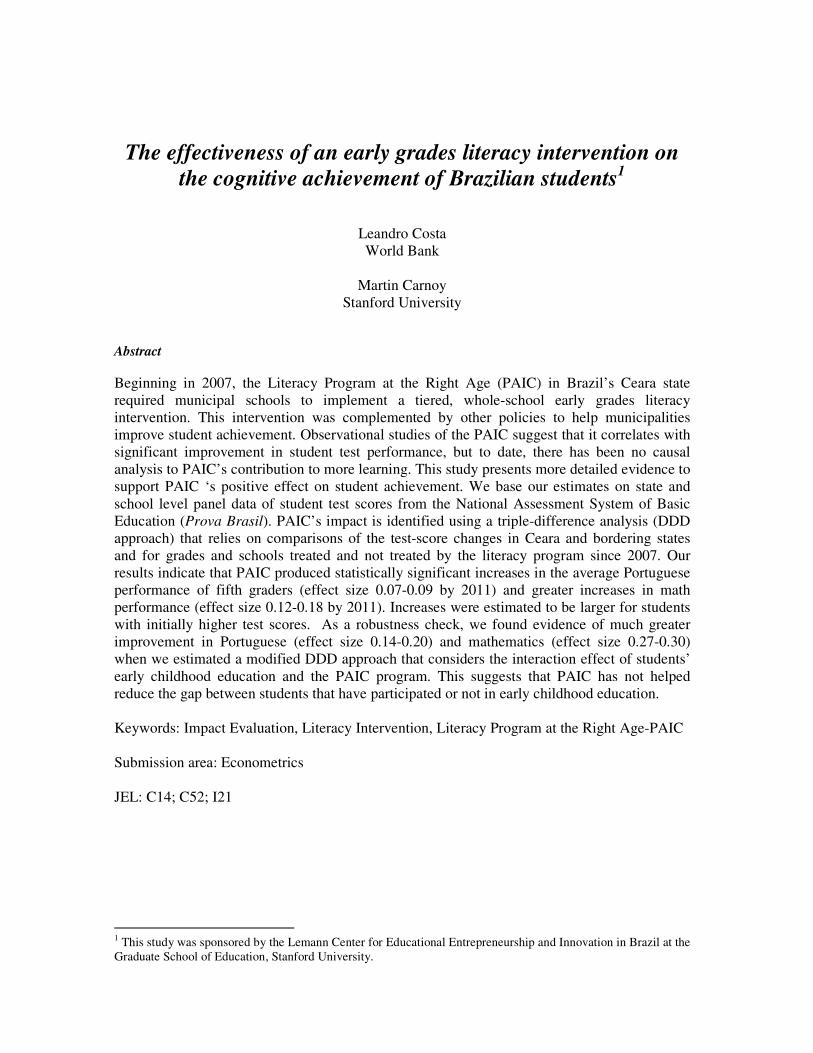
The PAIC is organized to support five relatively interrelated areas of the early grades in Ceara’s municipal schools (184 municipalities) designed to help achieve five program goals: i) reading promotion; ii) supporting municipal literacy strategies; iii) strengthening municipal management; iv) supporting early childhood education; and v) providing external learning evaluation. In terms of implementation, the program is divided into three broad activities related to three program areas: a) teacher and administrators training; b) municipality network mobilization; and c) provision of books to students.5 Table 1 provides a brief comparison of the design of PAIC and other early grades literacy/math programs.
These other international programs have similar designs and have been implemented around the world. They include Reading Recovery (New Zealand, UK and USA), Reading First 2 The 2007 Brazilian Government report—Children's Literacy: New Ways—discusses the serious problem of school illiteracy in Brazil. Based on data from the Basic Education National Exam—Prova Brasil—in 2011, 70.9 percent of students in the 9th grade of public schools had achieved less than a core of 250, considered inadequate for this grade. 3 See Vidal, Costa, Lerche (2007) for information on the past decade’s expansion of primary education in Brazil. 4 This relation was not formally affirmed, but we can see the clear relation with the PAIC program website http://www.idadecerta.seduc.ce.gov.br/ (in Portuguese only). 5 For a descriptive analysis of the program see IPECE (2010).
(U.S. No Child Left Behind Act), and the Early Grades Reading Assessment-EGRA (USAID in Latin America and Africa).6. Reading Recovery was developed in the 1970s as a short-term one-to-one intervention designed for children aged five or six, who are struggling to be literate after their first year of school. Reading First is a new multilayer intervention in kindergarten through third-grade that adds coaches who assist teachers in applying a specific literacy methodology for use in classrooms. The coaches also monitor the literacy achievement of all the children in the program. Teacher coaching is the only strategy not included in the PAIC program. EGRA is an intervention to promote systematically measuring how well children in the early grades of primary school are acquiring reading skills, and, ultimately, to promote more effective efforts to improve reading performance.
Table 1: Comparison of Early Literacy Programs Designs
Early Literacy Programs PAIC in Ceara
PNAIC in Brazil
Reading First in US Reading Recovery in NZ, UK and US
EGRA in Africa, LAC and Asia
Main Goal All students to read at 7 years old
All students to read at 8 years old
All students to read at grade level by the end of 3rd grade
Literacy of at-risk children
-
Areas Reading promotion X X X X Support local strategies X X X X Strength Management X X ECD support X X External evaluation X X X X Activities Teachers and Admin. Training X X X X X Teachers Coaching X Network mobilization X X X X Provision of Materials X X X X Complementary Policies Reward program X Financial support policy X
PAIC’s main innovation has been to provide financial incentives rewarding
municipalities whose students achieve the highest results and gains in a state literacy index.7 The state also rewards schools in which all third grade students achieve a specified adequacy level in a literacy exam. The monetary reward is related to the number of students enrolled in the third grade that participate in the literacy evaluation called SPAECE-alfa.8
Both incentives seem to affect municipal government and school participation in this complex intervention. However, the combination of these complementary actions makes it difficult to disentangle the impact of each intervention. Our analysis therefore estimates the effects these literacy and incentive programs as a whole. We assessed the effect of the entire package of literacy intervention polices and incentives to promote cooperation among municipal and school stakeholders aimed at achieving higher levels of literacy for primary school pupils. PAIC was first tested in a non-random sample of municipalities with an incomplete format in 2006. In 2007, it was implemented in all public schools as a three-year program for the first three grades of primary education. Since the Prova Brazil is only given to 5th and 9th graders, the 2011 fifth grade cohort is the first exposed to the literacy program to be assessed
6 Gamse, Bloom, Kemple, Jacob (2008) describe Reading First, Ashdown (2000) and Schwartz (2010) describe Reading Recovery, and Gove and Wetterberg (2011) discuss many interventions supported by the EGRA. 7 The name of this policy is ICMS Share (Cota Parte do ICMS). It allocates tax revenue within municipality based on a composite index with a 0.75 weight on the achievement of students in literacy exams (http://www.ipece.ce.gov.br/icms/icms ). 8 The name of this program is School Grade 10 (Escola Nota 10) (http://www.paic.seduc.ce.gov.br/index.php/o-paic/premio-escola-nota-10 ).
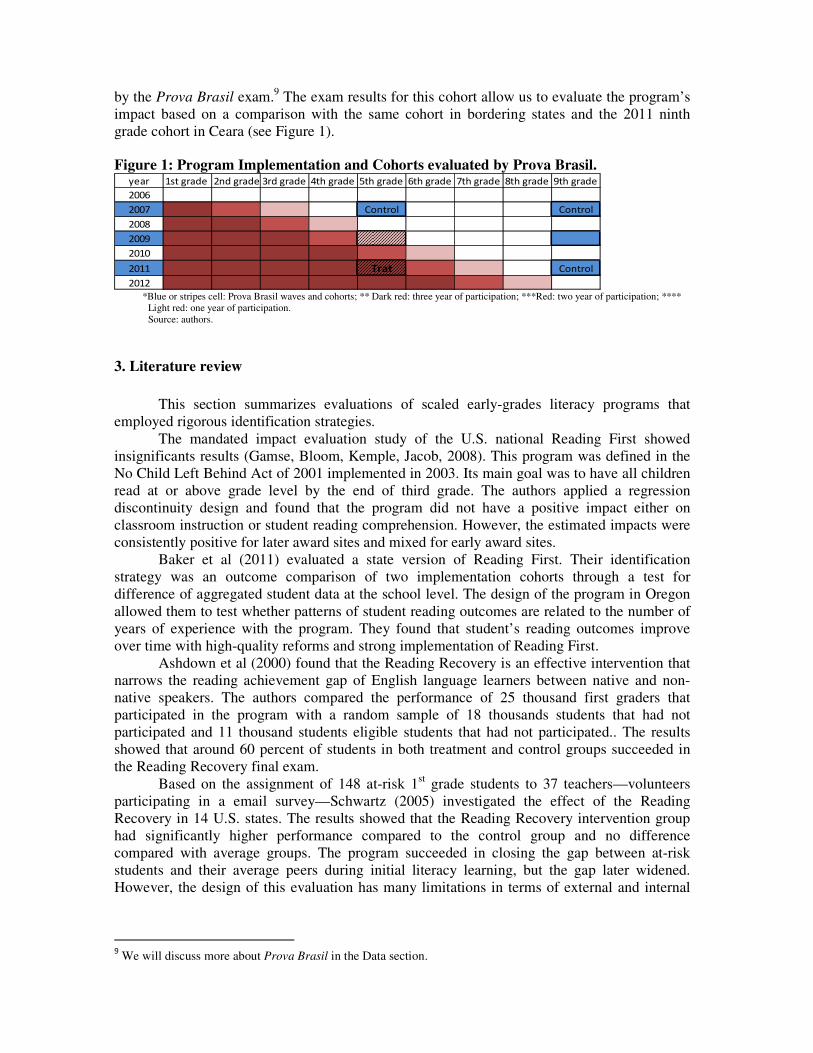
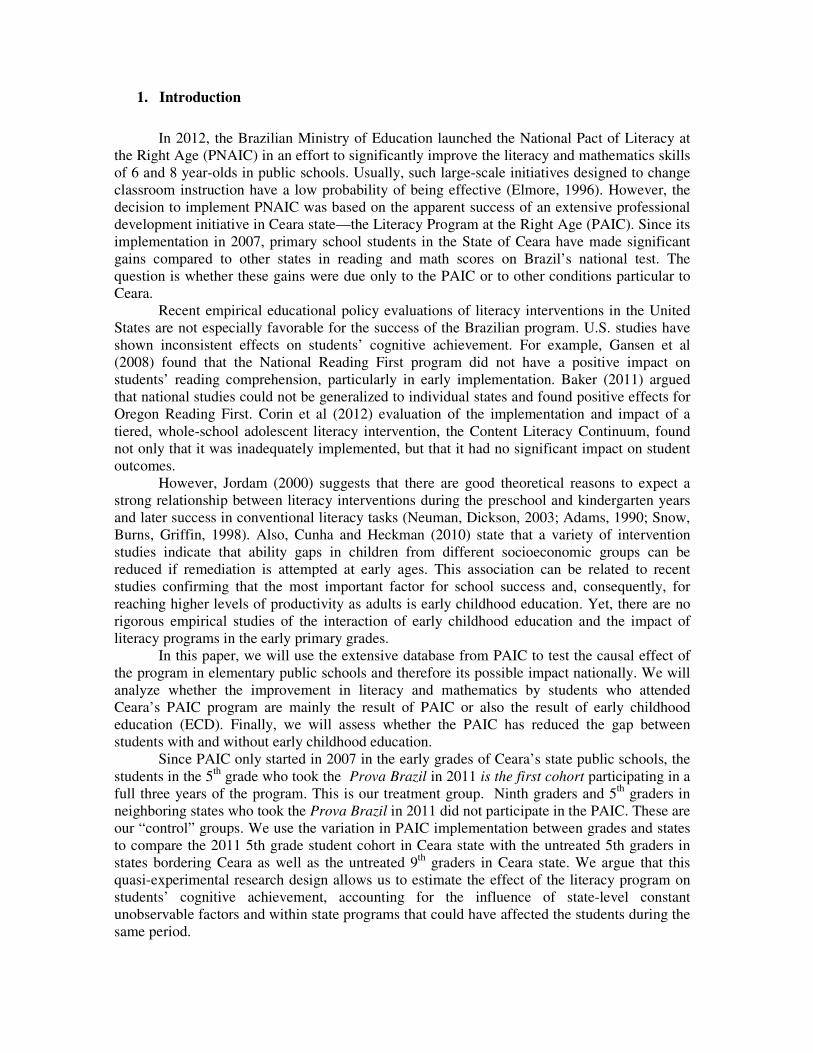
by the Prova Brasil exam.9 The exam results for this cohort allow us to evaluate the program’s impact based on a comparison with the same cohort in bordering states and the 2011 ninth grade cohort in Ceara (see Figure 1). Figure 1: Program Implementation and Cohorts evaluated by Prova Brasil.
*Blue or stripes cell: Prova Brasil waves and cohorts; ** Dark red: three year of participation; ***Red: two year of participation; ****
Light red: one year of participation. Source: authors.
3. Literature review
This section summarizes evaluations of scaled early-grades literacy programs that
employed rigorous identification strategies. The mandated impact evaluation study of the U.S. national Reading First showed
insignificants results (Gamse, Bloom, Kemple, Jacob, 2008). This program was defined in the No Child Left Behind Act of 2001 implemented in 2003. Its main goal was to have all children read at or above grade level by the end of third grade. The authors applied a regression discontinuity design and found that the program did not have a positive impact either on classroom instruction or student reading comprehension. However, the estimated impacts were consistently positive for later award sites and mixed for early award sites.
Baker et al (2011) evaluated a state version of Reading First. Their identification strategy was an outcome comparison of two implementation cohorts through a test for difference of aggregated student data at the school level. The design of the program in Oregon allowed them to test whether patterns of student reading outcomes are related to the number of years of experience with the program. They found that student’s reading outcomes improve over time with high-quality reforms and strong implementation of Reading First.
Ashdown et al (2000) found that the Reading Recovery is an effective intervention that narrows the reading achievement gap of English language learners between native and non-native speakers. The authors compared the performance of 25 thousand first graders that participated in the program with a random sample of 18 thousands students that had not participated and 11 thousand students eligible students that had not participated.. The results showed that around 60 percent of students in both treatment and control groups succeeded in the Reading Recovery final exam.
Based on the assignment of 148 at-risk 1st grade students to 37 teachers—volunteers participating in a email survey—Schwartz (2005) investigated the effect of the Reading Recovery in 14 U.S. states. The results showed that the Reading Recovery intervention group had significantly higher performance compared to the control group and no difference compared with average groups. The program succeeded in closing the gap between at-risk students and their average peers during initial literacy learning, but the gap later widened. However, the design of this evaluation has many limitations in terms of external and internal
9 We will discuss more about Prova Brasil in the Data section.
year 1st grade 2nd grade 3rd grade 4th grade 5th grade 6th grade 7th grade 8th grade 9th grade
2006
2007 Control Control
2008
2009
2010
2011 Trat Control
2012
validity, such as selection bias related with self-selected teachers and measurement error related to the tests applied by students’ own teachers.
There are many other studies that have been carried out to investigate the impact of scaled early grade literacy interventions. These show mixed results. Most have design flaws that invalidate both external and internal validity of the investigation. Here we discuss just two of these studies: Elbaum, Vaughn, Hughes, and Moody (2000) presented a meta-analysis of one-to-one tutoring research and found inconsistent results. However, most of the interventions they examined were able to help average students to catch up in their literacy skills and were not enough to help students with more severe literacy problems; Lyons (1998) undertook a longitudinal cohort study to investigate the effectiveness of the Reading Recovery program and he found that 60 percent of participants achieved the literacy level targeted by the program.
4. Data
The National Evaluation System of Basic Education (SAEB) is composed of two
complementary surveys that aim to evaluate the quality of Brazil’s educational system.10 SAEB’s main survey is the Prova Brasil, which is a biannual school-level assessment of 5th and 9th graders in public schools with a minimum of 20 students per class. It has been carried out since 2005, but it is available as microdata only for 2007, 2009, and 2011. This rich dataset provides information about students’ math and reading (Portuguese) exam scores and the socioeconomic background of students, teachers, and principals. The exams scores are comparable over time and permit comparison of results between grades. That is, we can follow the performance of grade cohorts, schools, networks, and system as a whole (but not of individual students). In 2011, this dataset provided information on 5,201,730 students enrolled in 55,924 schools in 27 states.11
In the 2011 Prova Brasil, 61.8 percent of the schools are administered by municipalities, 38.2 percent by states, and 0.1 percent by the federal government. There were students from the three school classes’ shifts, 55.5 percent morning, 42.4 percent afternoon, and 2.1 percent, night. In order to draw comparable schools that included most of the schools participating in Ceara’s PAIC program, we selected only urban municipal schools and the morning and afternoon shifts in Ceara and the states that border Ceara. Also, we were restricted to schools with 5th and 9th grades that participated in the Prova Brasil in 2007 and 2011, and in which we could identify the teacher’s classroom subject. This resulted in a school-level panel with student and teacher background variables.12 These restrictions produced a sample of 1002 schools and 275,072 students in 5 states (Ceara, Piaui, Pernambuco, Paraiba, and Rio Grande do Norte).
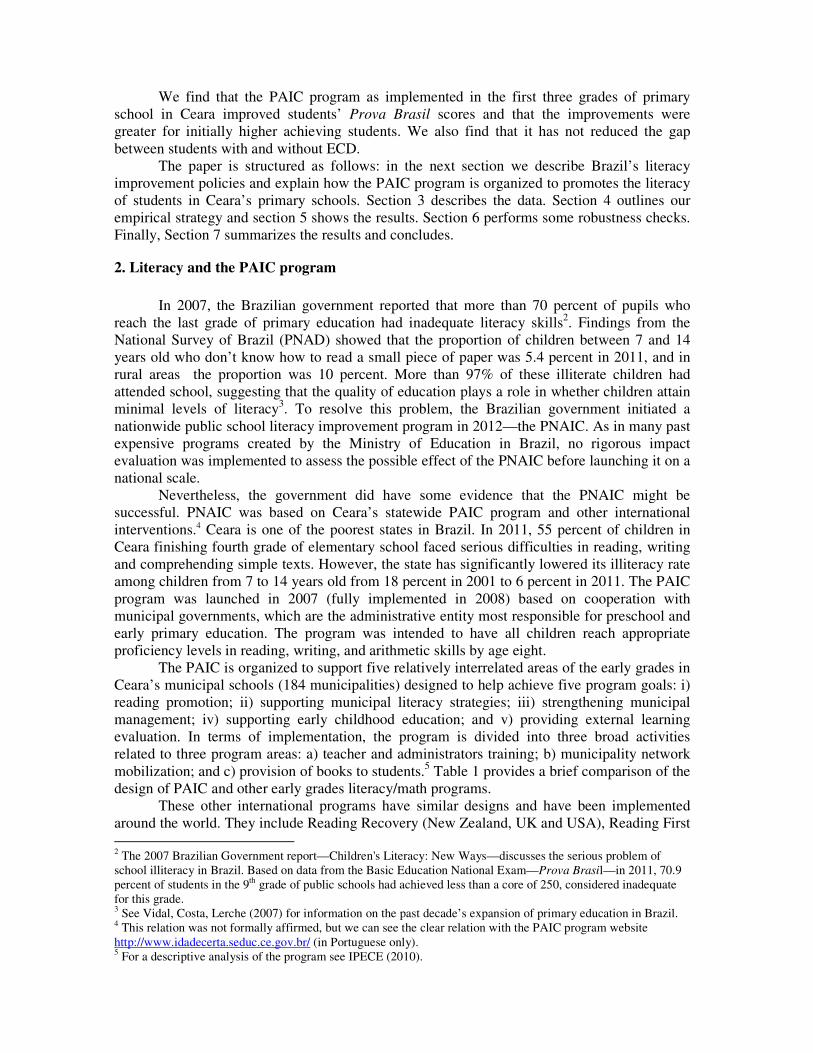
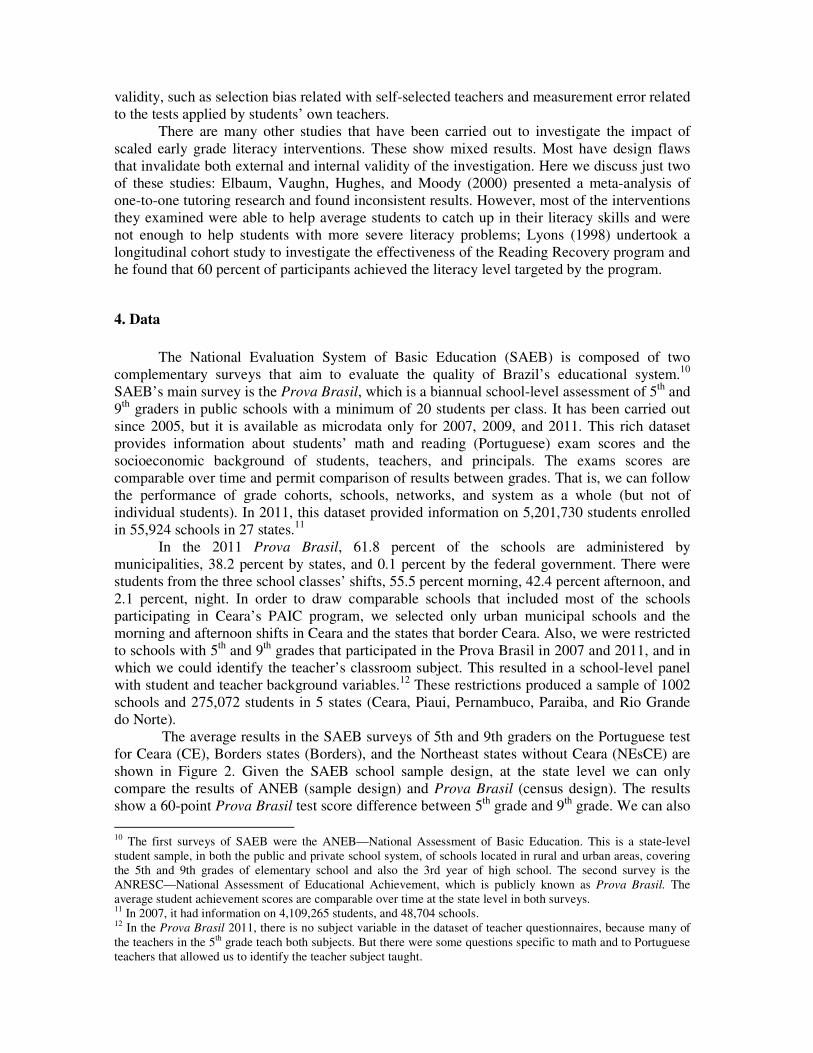
The average results in the SAEB surveys of 5th and 9th graders on the Portuguese test for Ceara (CE), Borders states (Borders), and the Northeast states without Ceara (NEsCE) are shown in Figure 2. Given the SAEB school sample design, at the state level we can only compare the results of ANEB (sample design) and Prova Brasil (census design). The results show a 60-point Prova Brasil test score difference between 5th grade and 9th grade. We can also 10 The first surveys of SAEB were the ANEB—National Assessment of Basic Education. This is a state-level student sample, in both the public and private school system, of schools located in rural and urban areas, covering the 5th and 9th grades of elementary school and also the 3rd year of high school. The second survey is the ANRESC—National Assessment of Educational Achievement, which is publicly known as Prova Brasil. The average student achievement scores are comparable over time at the state level in both surveys. 11 In 2007, it had information on 4,109,265 students, and 48,704 schools. 12 In the Prova Brasil 2011, there is no subject variable in the dataset of teacher questionnaires, because many of the teachers in the 5th grade teach both subjects. But there were some questions specific to math and to Portuguese teachers that allowed us to identify the teacher subject taught.
see a common decline in the test scores in all groups of states, greater for 9th graders, after 1997. Scores reached their lowest level in 2001-2005. This decrease is associated with the universalization of primary education in this period, with a significant increase in the proportion of students attending school from low socioeconomic background (Vidal, Costa, and Lerche, 2007). Scores increased after 2007, and increased more rapidly in Ceara schools. The increase is 10 points for the 9th grade and 15 points for the 5th
grade.13
Figure 2: Average score of 5th and 9th graders of Ceara and Borders States in SAEB and Prova Brasil (PB)
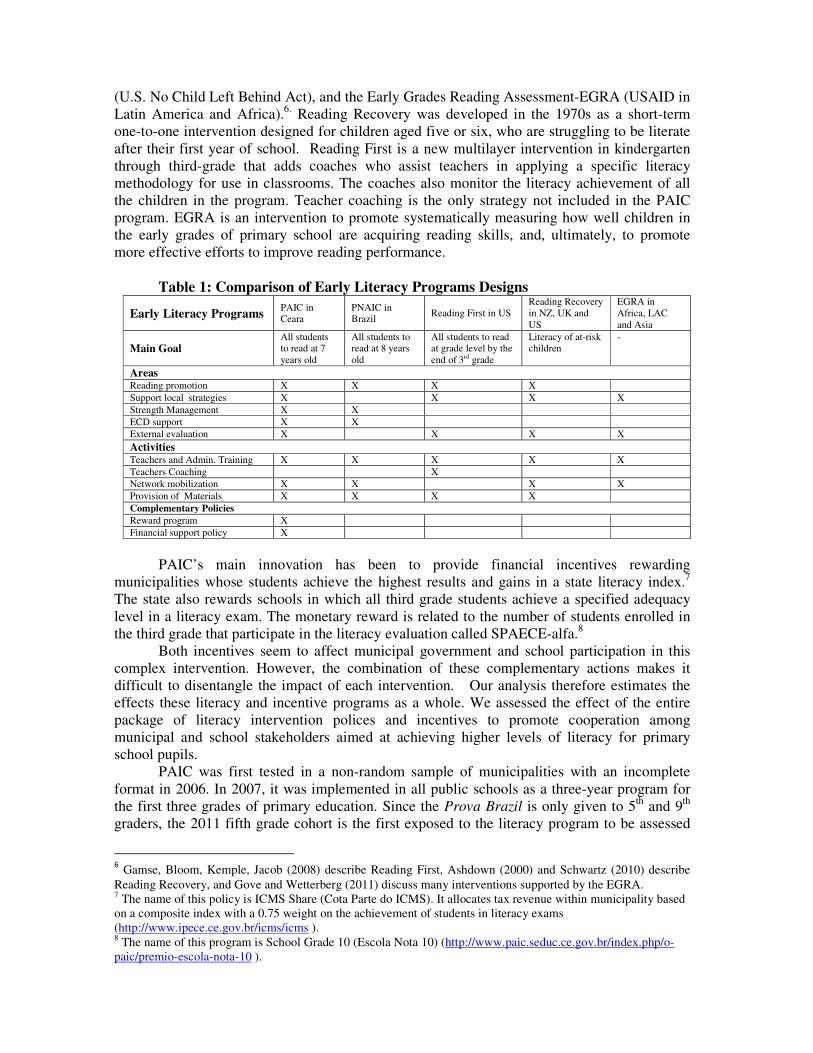
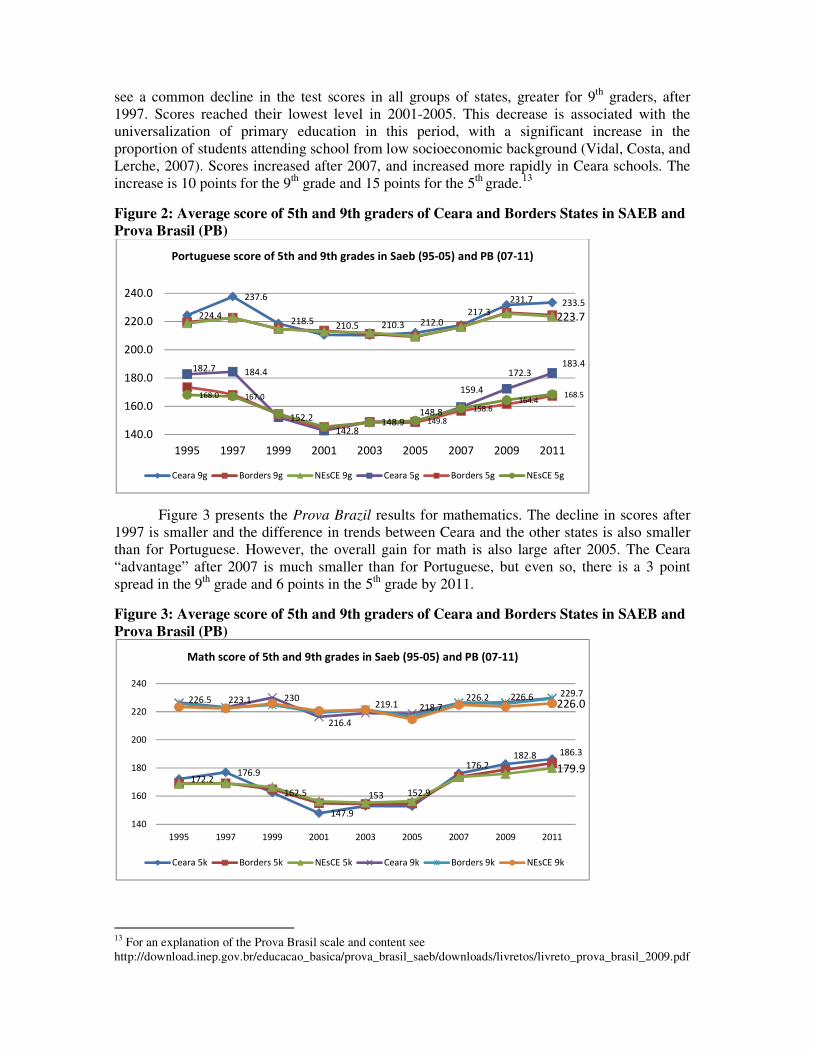
Figure 3 presents the Prova Brazil results for mathematics. The decline in scores after 1997 is smaller and the difference in trends between Ceara and the other states is also smaller than for Portuguese. However, the overall gain for math is also large after 2005. The Ceara “advantage” after 2007 is much smaller than for Portuguese, but even so, there is a 3 point spread in the 9th grade and 6 points in the 5th grade by 2011.
Figure 3: Average score of 5th and 9th graders of Ceara and Borders States in SAEB and Prova Brasil (PB)
13 For an explanation of the Prova Brasil scale and content see http://download.inep.gov.br/educacao_basica/prova_brasil_saeb/downloads/livretos/livreto_prova_brasil_2009.pdf
224.4
237.6
218.5210.5 210.3 212.0
217.3
231.7 233.5
223.7
182.7 184.4
152.2
142.8148.9
148.8
159.4
172.3183.4
168.0 167.0
149.8
158.6164.4
168.5
140.0
160.0
180.0
200.0
220.0
240.0
1995 1997 1999 2001 2003 2005 2007 2009 2011
Portuguese score of 5th and 9th grades in Saeb (95-05) and PB (07-11)
Ceara 9g Borders 9g NEsCE 9g Ceara 5g Borders 5g NEsCE 5g
172.2176.9
162.5
147.9
153 152.9
176.2182.8 186.3
179.9
226.5 223.1 230
216.4
219.1 218.7226.2 226.6 229.7
226.0
140
160
180
200
220
240
1995 1997 1999 2001 2003 2005 2007 2009 2011
Math score of 5th and 9th grades in Saeb (95-05) and PB (07-11)
Ceara 5k Borders 5k NEsCE 5k Ceara 9k Borders 9k NEsCE 9k
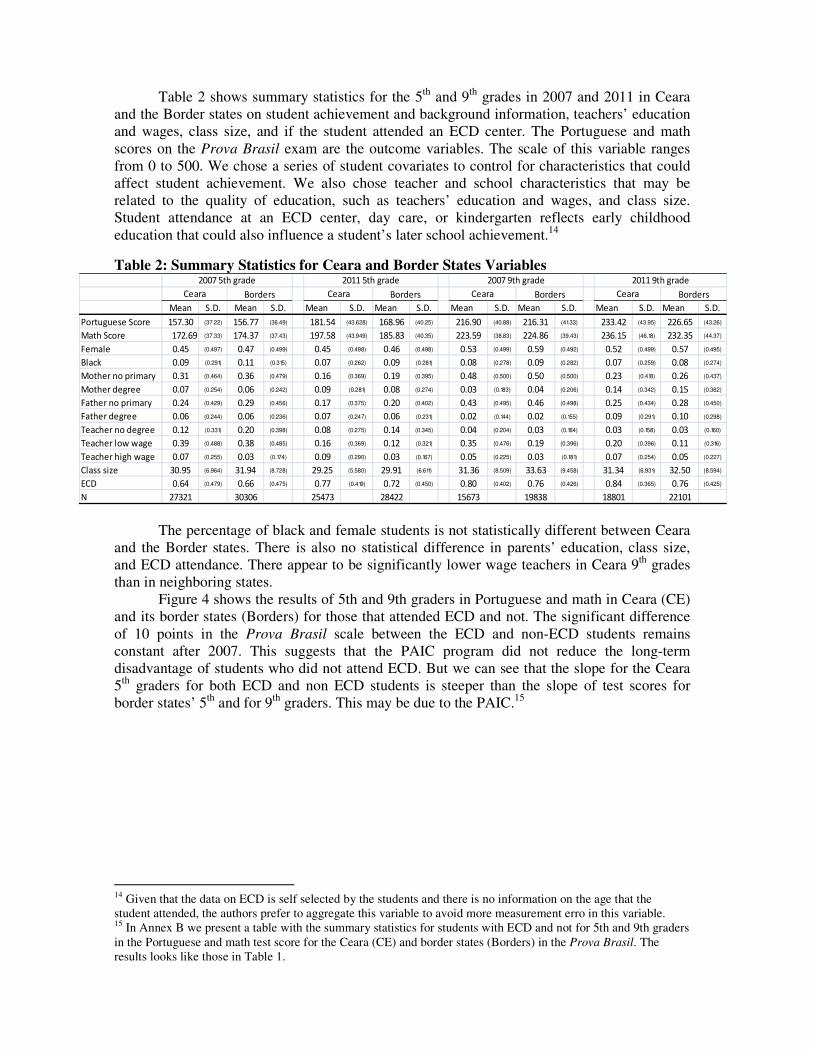
Table 2 shows summary statistics for the 5th and 9th grades in 2007 and 2011 in Ceara and the Border states on student achievement and background information, teachers’ education and wages, class size, and if the student attended an ECD center. The Portuguese and math scores on the Prova Brasil exam are the outcome variables. The scale of this variable ranges from 0 to 500. We chose a series of student covariates to control for characteristics that could affect student achievement. We also chose teacher and school characteristics that may be related to the quality of education, such as teachers’ education and wages, and class size. Student attendance at an ECD center, day care, or kindergarten reflects early childhood education that could also influence a student’s later school achievement.14
Table 2: Summary Statistics for Ceara and Border States Variables
Mean S.D. Mean S.D. Mean S.D. Mean S.D. Mean S.D. Mean S.D. Mean S.D. Mean S.D.
Portuguese Score 157.30 (37.22) 156.77 (36.49) 181.54 (43.628) 168.96 (40.25) 216.90 (40.88) 216.31 (41.33) 233.42 (43.95) 226.65 (43.26)
Math Score 172.69 (37.33) 174.37 (37.43) 197.58 (43.949) 185.83 (40.35) 223.59 (38.83) 224.86 (39.43) 236.15 (46.18) 232.35 (44.37)
Female 0.45 (0.497) 0.47 (0.499) 0.45 (0.498) 0.46 (0.498) 0.53 (0.499) 0.59 (0.492) 0.52 (0.499) 0.57 (0.495)
Black 0.09 (0.291) 0.11 (0.315) 0.07 (0.262) 0.09 (0.281) 0.08 (0.278) 0.09 (0.282) 0.07 (0.259) 0.08 (0.274)
Mother no primary 0.31 (0.464) 0.36 (0.479) 0.16 (0.369) 0.19 (0.395) 0.48 (0.500) 0.50 (0.500) 0.23 (0.418) 0.26 (0.437)
Mother degree 0.07 (0.254) 0.06 (0.242) 0.09 (0.281) 0.08 (0.274) 0.03 (0.183) 0.04 (0.206) 0.14 (0.342) 0.15 (0.362)
Father no primary 0.24 (0.429) 0.29 (0.456) 0.17 (0.375) 0.20 (0.402) 0.43 (0.495) 0.46 (0.498) 0.25 (0.434) 0.28 (0.450)
Father degree 0.06 (0.244) 0.06 (0.236) 0.07 (0.247) 0.06 (0.231) 0.02 (0.144) 0.02 (0.155) 0.09 (0.291) 0.10 (0.298)
Teacher no degree 0.12 (0.331) 0.20 (0.398) 0.08 (0.275) 0.14 (0.345) 0.04 (0.204) 0.03 (0.164) 0.03 (0.158) 0.03 (0.160)
Teacher low wage 0.39 (0.488) 0.38 (0.485) 0.16 (0.369) 0.12 (0.321) 0.35 (0.476) 0.19 (0.396) 0.20 (0.396) 0.11 (0.316)
Teacher high wage 0.07 (0.255) 0.03 (0.174) 0.09 (0.290) 0.03 (0.167) 0.05 (0.225) 0.03 (0.181) 0.07 (0.254) 0.05 (0.227)
Class size 30.95 (6.964) 31.94 (8.728) 29.25 (5.580) 29.91 (6.611) 31.36 (8.509) 33.63 (9.458) 31.34 (6.931) 32.50 (8.594)
ECD 0.64 (0.479) 0.66 (0.475) 0.77 (0.419) 0.72 (0.450) 0.80 (0.402) 0.76 (0.426) 0.84 (0.365) 0.76 (0.425)
N 27321 30306 25473 28422 15673 19838 18801 22101
Ceara Borders
2007 5th grade 2007 9th grade2011 5th grade 2011 9th grade
Ceara Borders Ceara BordersCeara Borders
The percentage of black and female students is not statistically different between Ceara
and the Border states. There is also no statistical difference in parents’ education, class size, and ECD attendance. There appear to be significantly lower wage teachers in Ceara 9th grades than in neighboring states.
Figure 4 shows the results of 5th and 9th graders in Portuguese and math in Ceara (CE) and its border states (Borders) for those that attended ECD and not. The significant difference of 10 points in the Prova Brasil scale between the ECD and non-ECD students remains constant after 2007. This suggests that the PAIC program did not reduce the long-term disadvantage of students who did not attend ECD. But we can see that the slope for the Ceara 5th graders for both ECD and non ECD students is steeper than the slope of test scores for border states’ 5th and for 9th graders. This may be due to the PAIC.15
14 Given that the data on ECD is self selected by the students and there is no information on the age that the student attended, the authors prefer to aggregate this variable to avoid more measurement erro in this variable. 15 In Annex B we present a table with the summary statistics for students with ECD and not for 5th and 9th graders in the Portuguese and math test score for the Ceara (CE) and border states (Borders) in the Prova Brasil. The results looks like those in Table 1.
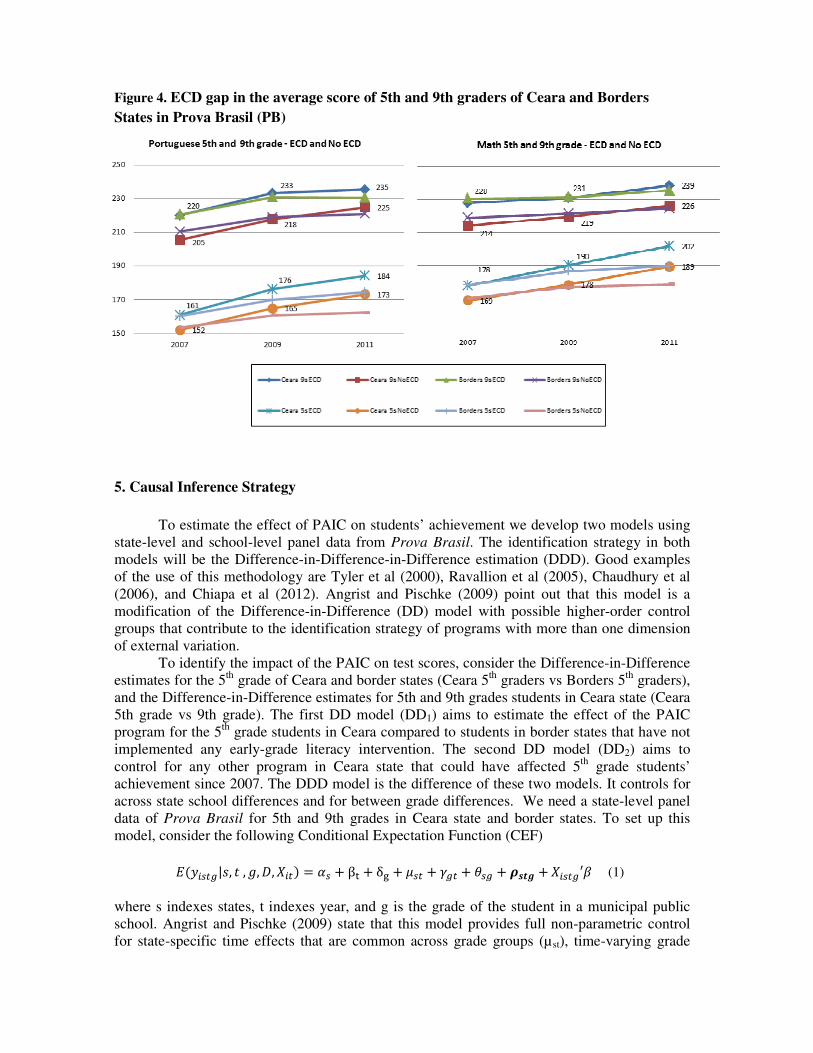
Figure 4. ECD gap in the average score of 5th and 9th graders of Ceara and Borders
States in Prova Brasil (PB)
5. Causal Inference Strategy
To estimate the effect of PAIC on students’ achievement we develop two models using
state-level and school-level panel data from Prova Brasil. The identification strategy in both models will be the Difference-in-Difference-in-Difference estimation (DDD). Good examples of the use of this methodology are Tyler et al (2000), Ravallion et al (2005), Chaudhury et al (2006), and Chiapa et al (2012). Angrist and Pischke (2009) point out that this model is a modification of the Difference-in-Difference (DD) model with possible higher-order control groups that contribute to the identification strategy of programs with more than one dimension of external variation.
To identify the impact of the PAIC on test scores, consider the Difference-in-Difference estimates for the 5th grade of Ceara and border states (Ceara 5th graders vs Borders 5th graders), and the Difference-in-Difference estimates for 5th and 9th grades students in Ceara state (Ceara 5th grade vs 9th grade). The first DD model (DD1) aims to estimate the effect of the PAIC program for the 5th grade students in Ceara compared to students in border states that have not implemented any early-grade literacy intervention. The second DD model (DD2) aims to control for any other program in Ceara state that could have affected 5th grade students’ achievement since 2007. The DDD model is the difference of these two models. It controls for across state school differences and for between grade differences. We need a state-level panel data of Prova Brasil for 5th and 9th grades in Ceara state and border states. To set up this model, consider the following Conditional Expectation Function (CEF)
�(�����|, �, , �, ���� = �� + β� + δ� + ��� + ��� + ��� + ���� +�����′ (1)
where s indexes states, t indexes year, and g is the grade of the student in a municipal public school. Angrist and Pischke (2009) state that this model provides full non-parametric control for state-specific time effects that are common across grade groups (µst), time-varying grade
effects (γgt), and state-specific grade effects (θsg). Also, we control for state-level fixed effects (αs), a time trend (βt), and a dummy for the grade effect (δg).
To estimate the interaction of the PAIC program impact and whether a student participated in ECD, we also stratify our data and results into students that attended ECD centers or not. We would like to fit equation (1) separately for each of these two different literacy background groups. However, we cannot fit the hypothesized DDD model in equation (1) because we do not have longitudinal student-level data on students’ test scores. Fortunately, based on equation (1), the parameter of interest, ρsgt, representing the effect of the PAIC on the achievement of students who attended 5th grade in 2011 as affected by state-of-residence is as follows:
DDD = DD" − DD$ = (∆y'(,)� − ∆y*+,)�� − (∆y'(,,� − ∆y*+,,�� = ρ.�� (2)
In essence, equation (2) permits us to identify the impact of the PAIC program on the
achievement of 5th graders in Ceara (yCE,5g) based on variation across states ((yBO,5g) and between grades (yCE,9g) in two periods. The ∆ represents the difference in time, so each component with ∆ differences out any time fixed-effect of each cohort in Ceara and border states. Where the DD1 differences out any constant effect across states, 5th graders in Ceara, and border states, the DD2 differences out 9th graders constant effects. The DDD differences out the fixed-effect of the 5th and 9th grade cohorts. Such DDD estimators provides a cleaner way of separating out some of the bias from the differential growth effects that arise due to gaps in initial literacy rates of 5th and 9th graders in Ceara and how they react to the same state programs when compared with other states’ students. This triple differencing strategy allows us account for the effects on test scores of other, concurrent, interventions in Ceara (such as incentive programs) in effect across the entire primary public school system in early and later grades with similar objectives (e.g. to improve the Prova Brazil results of 5th and 9th grades).
This can be estimated by using the following regression framework:
y/� =μ. + β2011�� + δ5thgrade/� + αceara/� ∙ 2011/� + γ5thgrade/� ∙ 2011/� +θceara/� ∙ 5thgrade/� + ρceara/� ∙ 5thgrade/� ∙ 2011/� +ε/� (3)
where 2011 is a dummy for the 2011 year (1,0) of the Prova Brasil; 5thgrade is a dummy for the 5th grade students (1,0) in 2007 and 2011 (within state comparison); and ceara is a dummy for Ceara state students (differentiated from students in border states (across state comparison). The DDD effect is measured by estimation of the ρ coefficient, which is obtained by the interaction of the 5th grade dummy, the 2011year dummy and the Ceara state dummy. Finally, µs is the state-level fixed effect. See Annex A for details on how differences identify this effect.
The PAIC effect may differ for students who have attended ECD and those who did not. As a robustness check, we developed a second model that estimates the interaction between the literacy program and the ECD gap of students in the same school and grade. This school ECD gap can be defined as the expected difference in achievement of students at the same school that have attended or not any ECD center. We can represent the school ECD gap as �(�B,CDEF�B,GHCDE|, �, , I, �, ����, where s is a vector of unobservable but fixed school confounders, such as parents’ motivation and ability to enroll their children in ECD centers, and e is the vector of observed previous ECD enrollment. We assume that the school ECD gap is a characteristic correlated with parent’s school choice, based on the assumption that the unobserved variable related to attending ECD centers is likely the same as attending school, and that attendance rate differs due to the supply of ECD centers in the regions. We assume that in Brazilian public schools, besides parents’ motivation and ability, the most important variable
that affects parents’ decisions about enrolling their children in ECD is the supply of ECD centers close to the parents’ home Also, because both the demand for and the supply of ECD has changed, we expect that the ECD gap varies across grades. Thus, the main assumption to identify the interaction of the program impact and the school ECD gap is the inclusion of school fixed-effects that can control for unobserved variables related to the selection bias of ECD gap in each school, i.e. , �(�B,CDEF�B,GHCDE|, �, , I, �, ���� = JB. Using panel data at the school-level, this assumption combined with the external variation across grades and schools yields the interaction between the school ECD gap and participating in the PAIC program at the state level. This means a modification of DDD that includes one additional difference in the school level—the four difference method (4D). The equation below represents this model:
�(��B���K|�, , , I, �, ���� = JB + �� + β� + δ� + ���K + ���K + ���K + ���� +L���M + �����K′ (4)
where JB is the school fixed-effect of school j and the L���M is the interaction of attending ECD and the 5th grade in Ceara state in 2011 (ecd & treatment variable). We model the second difference of students’ ECD status and time difference as ∆BCDE$ = (∆('NyO� − ∆('NyO�F"� = (yO('N(�� − yOPQRST(��� − (yO('N(�F"� − yOPQRST(�F"�� .
ECD(t) represents the students with ECD status in time t and noECD(t) is for students with no ECD status in time t in the same school j. Note that the subscript j is in the school-level fixed effect, JB, and the subscript i is in the dependent variable and the error variable. This means that we intend to examine the gap of ECD inside schools controlling for individual characteristics instead of identifying the individual student effect of ECD on students’ achievement. [See Annex A for the differences calculation.] The new difference method with four differences to obtain the interaction between the school ECD gap and participating in the PAIC program at the state level is as follows:
4D = DDV " − DDV $ = (∆BK
$ y'(,)� − ∆BK$ y*+,)�� − (∆BK
$ y'(,,� − ∆BK$ y*+,,�� = ����M (5)
This can be estimated by using another convenient regression framework:
y/� =JB + μ. + β2011�� + δ5thgrade/� + αceara/� ∙ 2011/� ∙ ecd/� + γ5thgrade/� ∙ 2011/� ∙ ecd/� +θceara/� ∙ 5thgrade/� ∙ ecd/� + ρ2011/� ∙ ceara/� ∙ 5thgrade/� +π2011/� ∙ ceara/� ∙ 5thgrade/� ∙ecd/� + ε/� .
In summary, the DDD relies on two main assumptions: (1) that there is a common trend of treatment and comparison groups and (2) that there are unobserved additive time-invariant confounders that can be differenced out when we consider reliable comparison groups at the state level and in a comparison grade. On the other hand, the 4D method includes a new assumption related to the selection bias of the gap due to the interaction of the program effect with the (ECD) variable. The new assumption is that the unobserved difference of students with and without ECD is time-invariant in the school-level, which can be canceled out with the fourth difference in Equation 5 and the inclusion of the interaction with the ECD school fixed-effect in Equation 6.
There are some possible violations of our causal inference strategy that can threaten the internal validity of our study. For example, if other literacy or improvement programs were launched at the same time in the border states, this could incorrectly include the effect of those programs in the PAIC effect. Also, if other Ceara state-level programs affect the 5th graders more than the 9th graders, we could also be reporting biased results for the PAIC effect. We
can solve this by controlling for grade effect. If there are students in the 5th grade in 2011 that had not attended the three years of the PAIC program implementation because they had migrated or had failed to pass into 5th grade in 2010, this also could bias our results. Another possible violation is that the PAIC program was not implemented in the same way in all municipal schools. Finally, the challenge of selection bias raised by the inclusion of the interaction of ECD and the PAIC can likely not be overcome differencing out the school fixed-effect. This selection bias can be associated to unmotivated parents that do not enroll their children in ECD centers, so the estimated interaction leads to an upper bound estimate of the program impact. A usual challenge raised when we estimate the effect of a program in a classical regression using multi-level data is that the estimate of the standard errors is biased. For instance, the likely heterocedasticity yielded by the school clusters of students’ achievement affect the classical standard error estimate.. In addition, since we are working with information in a panel format we can expect a significant serial correlation. Following the strategy suggested in Angrist et al, 2008, we considered the school clusters to estimate the standard error due to the presumable heterocedasticity and serial correlation. 5. Results
This section presents the results of regression estimates based on the various empirical strategies discussed above. Table 3 shows estimates using the DDD model with state fixed-effect of the impact of the PAIC program in Ceara on 5th grade students’ achievement compared with the achievement of 5th graders in bordering states and 9th graders in the same schools in Ceara. The model also includes students’ and teachers’ covariates. Further, we presented the results for different groups of students that did and did not attend ECD centers before entering primary schools. Quantile regressions estimates are presented in Tables 4 and in Figure 5.
The PAIC program effect is estimated to increase Ceara’s 5th graders’ test scores by approximately 0.09 standard deviations (thereafter SDs) in Portuguese between 2007 and 2011 when using the DDD approach. The estimated effect of PAIC on math is a much higher, 0.17 SDs. The effect is shown by the coefficient of the interaction between the ceara, 5th grade and 2011 variables in Columns 1 and 6 in Table 3. All the estimates of PAIC effects seem to be sensitive to controls for student, and teacher covariates. The specification in columns 2 and 3 controlling for students, and students and teachers covariates produce a slightly smaller estimate for the PAIC effect on Portuguese scores (0.72 SDs). There was a significant decrease in the estimated effect of PAIC on math scores in column 7 and 8, but this effect on math scores remains higher than the effect on Portuguese scores (0.14 SDs). The average program impacts in all these controlled models are statistically significant at the 99 percent confidence level.
Although the impact of the PAIC program may be misestimated using the DDD method even when controlling for important student, teacher, and classroom variables because some students attended ECD before entering primary school and others did not, when we make separate estimates of the PAIC effect on students with ECD and without ECD, the results are similar to those for the total set of students. The 0.08 estimates in columns 4 and 9 for 196 thousand ECD students are similar to those for the 78 thousand No ECD students in columns 5 and 10. This likely means that the PAIC program had a statistically significant positive effect that was not able to reduce the gap between students that attended and did not attend ECD centers.
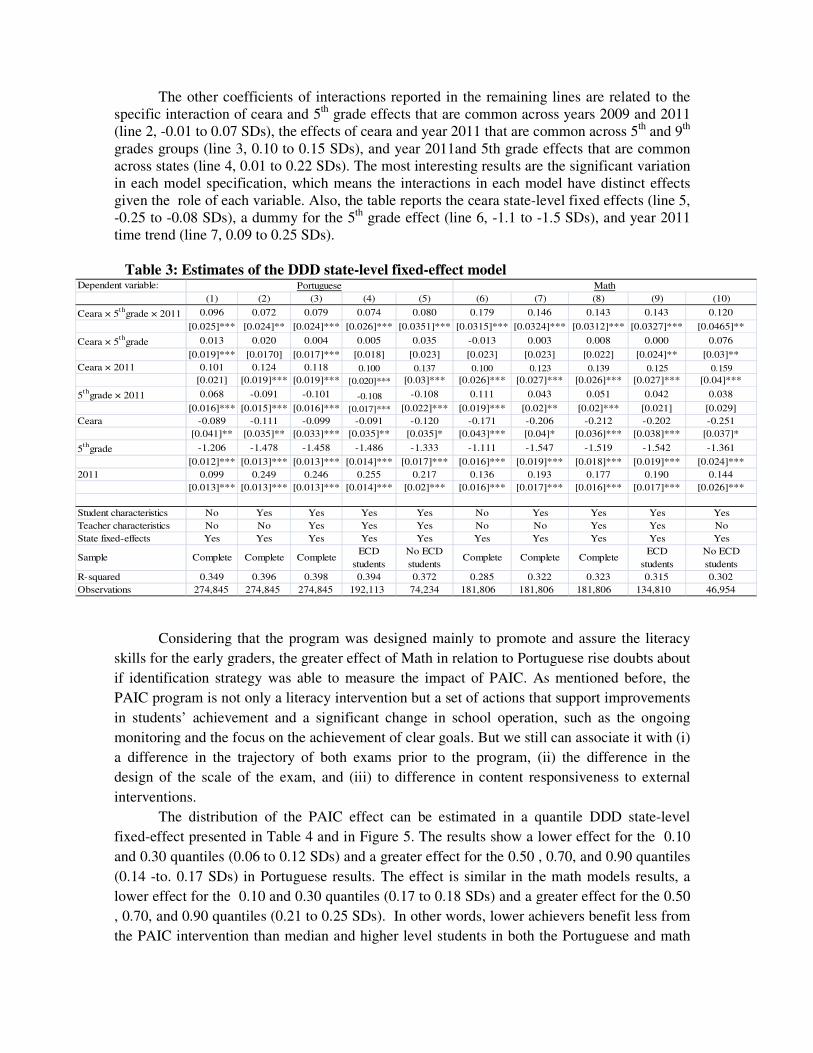
The other coefficients of interactions reported in the remaining lines are related to the specific interaction of ceara and 5th grade effects that are common across years 2009 and 2011 (line 2, -0.01 to 0.07 SDs), the effects of ceara and year 2011 that are common across 5th and 9th grades groups (line 3, 0.10 to 0.15 SDs), and year 2011and 5th grade effects that are common across states (line 4, 0.01 to 0.22 SDs). The most interesting results are the significant variation in each model specification, which means the interactions in each model have distinct effects given the role of each variable. Also, the table reports the ceara state-level fixed effects (line 5, -0.25 to -0.08 SDs), a dummy for the 5th grade effect (line 6, -1.1 to -1.5 SDs), and year 2011 time trend (line 7, 0.09 to 0.25 SDs).
Table 3: Estimates of the DDD state-level fixed-effect model
Considering that the program was designed mainly to promote and assure the literacy skills for the early graders, the greater effect of Math in relation to Portuguese rise doubts about if identification strategy was able to measure the impact of PAIC. As mentioned before, the PAIC program is not only a literacy intervention but a set of actions that support improvements in students’ achievement and a significant change in school operation, such as the ongoing monitoring and the focus on the achievement of clear goals. But we still can associate it with (i) a difference in the trajectory of both exams prior to the program, (ii) the difference in the design of the scale of the exam, and (iii) to difference in content responsiveness to external interventions.
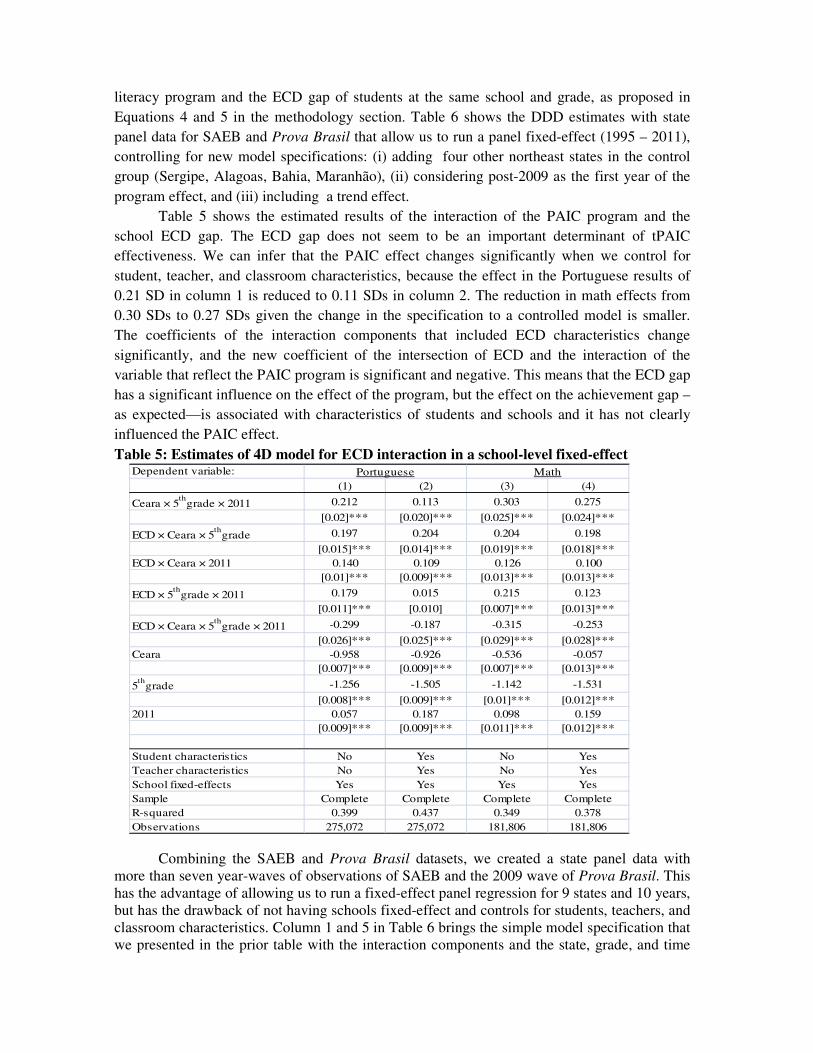
The distribution of the PAIC effect can be estimated in a quantile DDD state-level fixed-effect presented in Table 4 and in Figure 5. The results show a lower effect for the 0.10 and 0.30 quantiles (0.06 to 0.12 SDs) and a greater effect for the 0.50 , 0.70, and 0.90 quantiles (0.14 -to. 0.17 SDs) in Portuguese results. The effect is similar in the math models results, a lower effect for the 0.10 and 0.30 quantiles (0.17 to 0.18 SDs) and a greater effect for the 0.50 , 0.70, and 0.90 quantiles (0.21 to 0.25 SDs). In other words, lower achievers benefit less from the PAIC intervention than median and higher level students in both the Portuguese and math
Dependent variable:(1) (2) (3) (4) (5) (6) (7) (8) (9) (10)
Ceara × 5thgrade × 2011 0.096 0.072 0.079 0.074 0.080 0.179 0.146 0.143 0.143 0.120
[0.025]*** [0.024]** [0.024]*** [0.026]*** [0.0351]*** [0.0315]*** [0.0324]*** [0.0312]*** [0.0327]*** [0.0465]**
Ceara × 5thgrade 0.013 0.020 0.004 0.005 0.035 -0.013 0.003 0.008 0.000 0.076
[0.019]*** [0.0170] [0.017]*** [0.018] [0.023] [0.023] [0.023] [0.022] [0.024]** [0.03]**Ceara × 2011 0.101 0.124 0.118 0.100 0.137 0.100 0.123 0.139 0.125 0.159
[0.021] [0.019]*** [0.019]*** [0.020]*** [0.03]*** [0.026]*** [0.027]*** [0.026]*** [0.027]*** [0.04]***
5thgrade × 2011 0.068 -0.091 -0.101 -0.108 -0.108 0.111 0.043 0.051 0.042 0.038
[0.016]*** [0.015]*** [0.016]*** [0.017]*** [0.022]*** [0.019]*** [0.02]** [0.02]*** [0.021] [0.029]Ceara -0.089 -0.111 -0.099 -0.091 -0.120 -0.171 -0.206 -0.212 -0.202 -0.251
[0.041]** [0.035]** [0.033]*** [0.035]** [0.035]* [0.043]*** [0.04]* [0.036]*** [0.038]*** [0.037]*
5thgrade -1.206 -1.478 -1.458 -1.486 -1.333 -1.111 -1.547 -1.519 -1.542 -1.361
[0.012]*** [0.013]*** [0.013]*** [0.014]*** [0.017]*** [0.016]*** [0.019]*** [0.018]*** [0.019]*** [0.024]***2011 0.099 0.249 0.246 0.255 0.217 0.136 0.193 0.177 0.190 0.144
[0.013]*** [0.013]*** [0.013]*** [0.014]*** [0.02]*** [0.016]*** [0.017]*** [0.016]*** [0.017]*** [0.026]***
Student characteristics No Yes Yes Yes Yes No Yes Yes Yes YesTeacher characteristics No No Yes Yes Yes No No Yes Yes NoState fixed-effects Yes Yes Yes Yes Yes Yes Yes Yes Yes Yes
Sample Complete Complete CompleteECD
studentsNo ECD students
Complete Complete CompleteECD
studentsNo ECD students
R-squared 0.349 0.396 0.398 0.394 0.372 0.285 0.322 0.323 0.315 0.302Observations 274,845 274,845 274,845 192,113 74,234 181,806 181,806 181,806 134,810 46,954
Portuguese Math
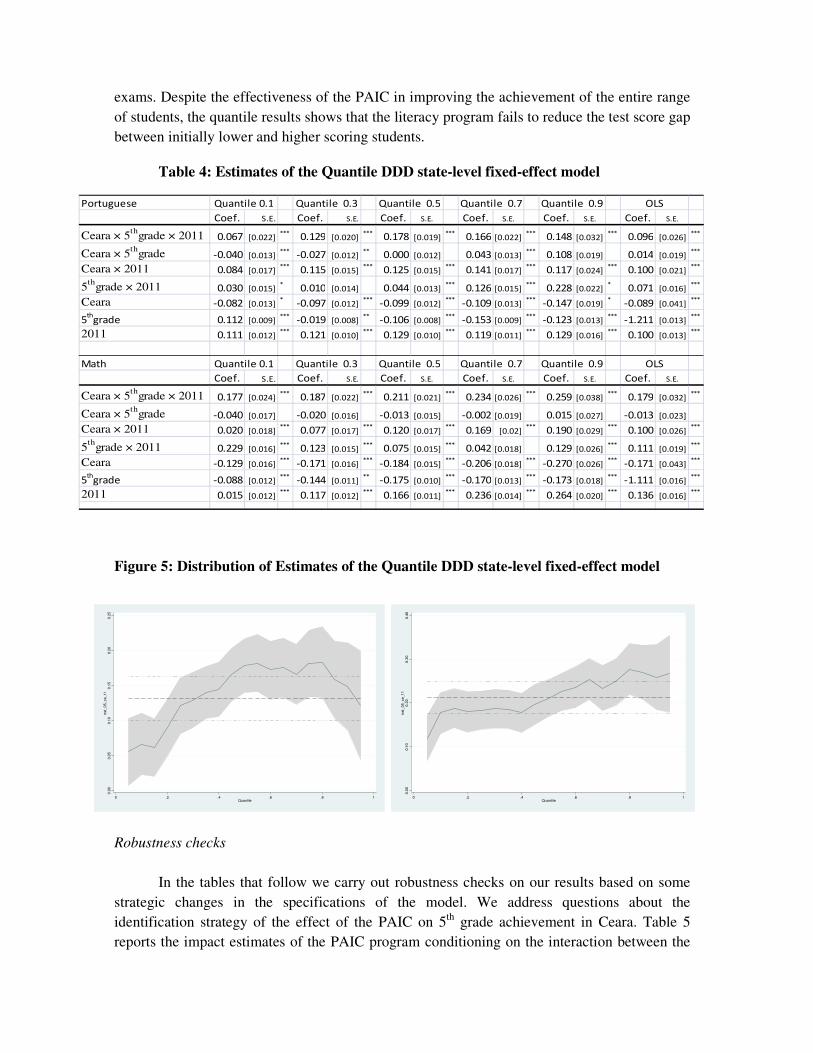
exams. Despite the effectiveness of the PAIC in improving the achievement of the entire range of students, the quantile results shows that the literacy program fails to reduce the test score gap between initially lower and higher scoring students.
Table 4: Estimates of the Quantile DDD state-level fixed-effect model
Figure 5: Distribution of Estimates of the Quantile DDD state-level fixed-effect model
Robustness checks
In the tables that follow we carry out robustness checks on our results based on some
strategic changes in the specifications of the model. We address questions about the identification strategy of the effect of the PAIC on 5th grade achievement in Ceara. Table 5 reports the impact estimates of the PAIC program conditioning on the interaction between the
Portuguese
Coef. S.E. Coef. S.E. Coef. S.E. Coef. S.E. Coef. S.E. Coef. S.E.
Ceara × 5thgrade × 2011 0.067 [0.022]***
0.129 [0.020]***
0.178 [0.019]***
0.166 [0.022]***
0.148 [0.032]***
0.096 [0.026]***
Ceara × 5thgrade -0.040 [0.013]***
-0.027 [0.012]**
0.000 [0.012] 0.043 [0.013]***
0.108 [0.019] 0.014 [0.019]***
Ceara × 2011 0.084 [0.017]***
0.115 [0.015]***
0.125 [0.015]***
0.141 [0.017]***
0.117 [0.024]***
0.100 [0.021]***
5thgrade × 2011 0.030 [0.015]*
0.010 [0.014] 0.044 [0.013]***
0.126 [0.015]***
0.228 [0.022]*
0.071 [0.016]***
Ceara -0.082 [0.013]*
-0.097 [0.012]***
-0.099 [0.012]***
-0.109 [0.013]***
-0.147 [0.019]*
-0.089 [0.041]***
5th
grade 0.112 [0.009]***
-0.019 [0.008]**
-0.106 [0.008]***
-0.153 [0.009]***
-0.123 [0.013]***
-1.211 [0.013]***
2011 0.111 [0.012]***
0.121 [0.010]***
0.129 [0.010]***
0.119 [0.011]***
0.129 [0.016]***
0.100 [0.013]***
Math
Coef. S.E. Coef. S.E. Coef. S.E. Coef. S.E. Coef. S.E. Coef. S.E.
Ceara × 5thgrade × 2011 0.177 [0.024]***
0.187 [0.022]***
0.211 [0.021]***
0.234 [0.026]***
0.259 [0.038]***
0.179 [0.032]***
Ceara × 5thgrade -0.040 [0.017] -0.020 [0.016] -0.013 [0.015] -0.002 [0.019] 0.015 [0.027] -0.013 [0.023]
Ceara × 2011 0.020 [0.018]***
0.077 [0.017]***
0.120 [0.017]***
0.169 [0.02]***
0.190 [0.029]***
0.100 [0.026]***
5thgrade × 2011 0.229 [0.016]***
0.123 [0.015]***
0.075 [0.015]***
0.042 [0.018] 0.129 [0.026]***
0.111 [0.019]***
Ceara -0.129 [0.016]***
-0.171 [0.016]***
-0.184 [0.015]***
-0.206 [0.018]***
-0.270 [0.026]***
-0.171 [0.043]***
5th
grade -0.088 [0.012]***
-0.144 [0.011]**
-0.175 [0.010]***
-0.170 [0.013]***
-0.173 [0.018]***
-1.111 [0.016]***
2011 0.015 [0.012]***
0.117 [0.012]***
0.166 [0.011]***
0.236 [0.014]***
0.264 [0.020]***
0.136 [0.016]***
OLS
Quantile 0.1 Quantile 0.3 Quantile 0.5 Quantile 0.7 Quantile 0.9 OLS
Quantile 0.1 Quantile 0.3 Quantile 0.5 Quantile 0.7 Quantile 0.9
0.0
00
.05
0.1
00
.15
0.2
00
.25
tra
t_0
5_
ce_
11
0 .2 .4 .6 .8 1Quantile
0.0
00.1
00.2
00.3
00.4
0tr
at_
05_ce_11
0 .2 .4 .6 .8 1Quantile
literacy program and the ECD gap of students at the same school and grade, as proposed in Equations 4 and 5 in the methodology section. Table 6 shows the DDD estimates with state panel data for SAEB and Prova Brasil that allow us to run a panel fixed-effect (1995 – 2011), controlling for new model specifications: (i) adding four other northeast states in the control group (Sergipe, Alagoas, Bahia, Maranhão), (ii) considering post-2009 as the first year of the program effect, and (iii) including a trend effect.
Table 5 shows the estimated results of the interaction of the PAIC program and the school ECD gap. The ECD gap does not seem to be an important determinant of tPAIC effectiveness. We can infer that the PAIC effect changes significantly when we control for student, teacher, and classroom characteristics, because the effect in the Portuguese results of 0.21 SD in column 1 is reduced to 0.11 SDs in column 2. The reduction in math effects from 0.30 SDs to 0.27 SDs given the change in the specification to a controlled model is smaller. The coefficients of the interaction components that included ECD characteristics change significantly, and the new coefficient of the intersection of ECD and the interaction of the variable that reflect the PAIC program is significant and negative. This means that the ECD gap has a significant influence on the effect of the program, but the effect on the achievement gap –as expected—is associated with characteristics of students and schools and it has not clearly influenced the PAIC effect. Table 5: Estimates of 4D model for ECD interaction in a school-level fixed-effect
Combining the SAEB and Prova Brasil datasets, we created a state panel data with more than seven year-waves of observations of SAEB and the 2009 wave of Prova Brasil. This has the advantage of allowing us to run a fixed-effect panel regression for 9 states and 10 years, but has the drawback of not having schools fixed-effect and controls for students, teachers, and classroom characteristics. Column 1 and 5 in Table 6 brings the simple model specification that we presented in the prior table with the interaction components and the state, grade, and time
Dependent variable:
(1) (2) (3) (4)
Ceara × 5th
grade × 2011 0.212 0.113 0.303 0.275
[0.02]*** [0.020]*** [0.025]*** [0.024]***
ECD × Ceara × 5th
grade 0.197 0.204 0.204 0.198
[0.015]*** [0.014]*** [0.019]*** [0.018]***ECD × Ceara × 2011 0.140 0.109 0.126 0.100
[0.01]*** [0.009]*** [0.013]*** [0.013]***
ECD × 5th
grade × 2011 0.179 0.015 0.215 0.123
[0.011]*** [0.010] [0.007]*** [0.013]***
ECD × Ceara × 5th
grade × 2011 -0.299 -0.187 -0.315 -0.253
[0.026]*** [0.025]*** [0.029]*** [0.028]***Ceara -0.958 -0.926 -0.536 -0.057
[0.007]*** [0.009]*** [0.007]*** [0.013]***
5th
grade -1.256 -1.505 -1.142 -1.531
[0.008]*** [0.009]*** [0.01]*** [0.012]***2011 0.057 0.187 0.098 0.159
[0.009]*** [0.009]*** [0.011]*** [0.012]***
Student characteristics No Yes No YesTeacher characteristics No Yes No YesSchool fixed-effects Yes Yes Yes YesSample Complete Complete Complete CompleteR-squared 0.399 0.437 0.349 0.378Observations 275,072 275,072 181,806 181,806
Portuguese Math
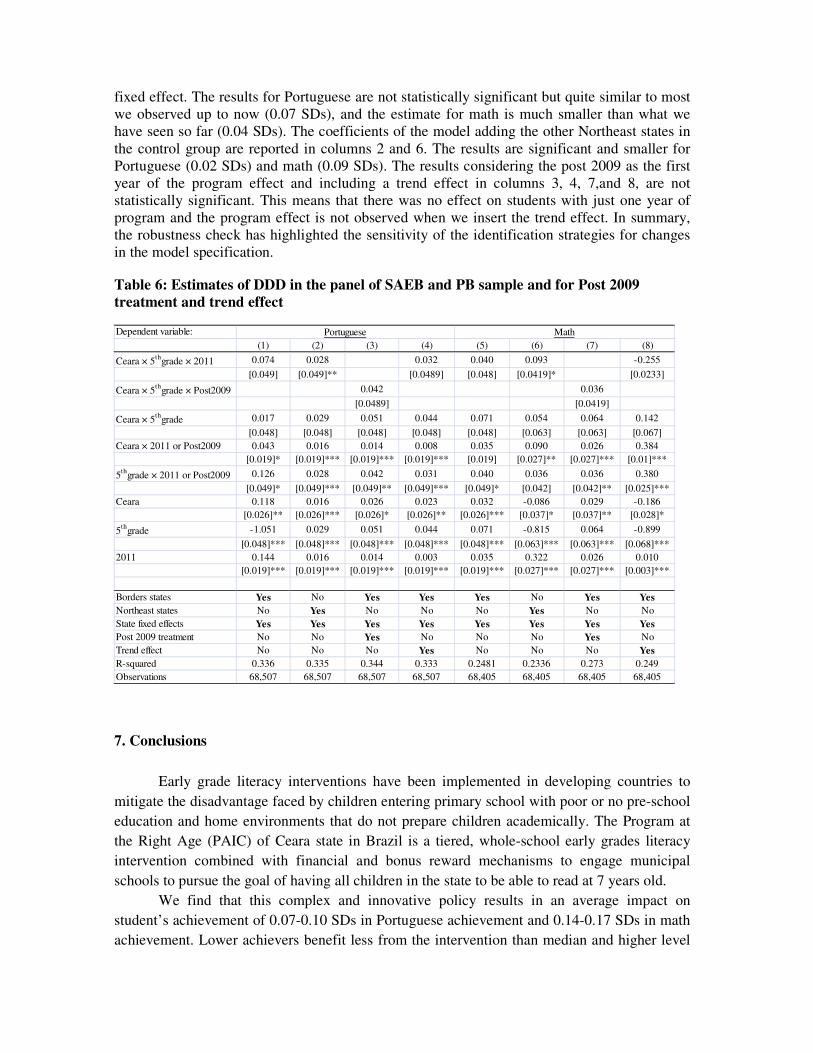
fixed effect. The results for Portuguese are not statistically significant but quite similar to most we observed up to now (0.07 SDs), and the estimate for math is much smaller than what we have seen so far (0.04 SDs). The coefficients of the model adding the other Northeast states in the control group are reported in columns 2 and 6. The results are significant and smaller for Portuguese (0.02 SDs) and math (0.09 SDs). The results considering the post 2009 as the first year of the program effect and including a trend effect in columns 3, 4, 7,and 8, are not statistically significant. This means that there was no effect on students with just one year of program and the program effect is not observed when we insert the trend effect. In summary, the robustness check has highlighted the sensitivity of the identification strategies for changes in the model specification.
Table 6: Estimates of DDD in the panel of SAEB and PB sample and for Post 2009 treatment and trend effect
7. Conclusions
Early grade literacy interventions have been implemented in developing countries to
mitigate the disadvantage faced by children entering primary school with poor or no pre-school education and home environments that do not prepare children academically. The Program at the Right Age (PAIC) of Ceara state in Brazil is a tiered, whole-school early grades literacy intervention combined with financial and bonus reward mechanisms to engage municipal schools to pursue the goal of having all children in the state to be able to read at 7 years old.
We find that this complex and innovative policy results in an average impact on student’s achievement of 0.07-0.10 SDs in Portuguese achievement and 0.14-0.17 SDs in math achievement. Lower achievers benefit less from the intervention than median and higher level
Dependent variable:(1) (2) (3) (4) (5) (6) (7) (8)
Ceara × 5thgrade × 2011 0.074 0.028 0.032 0.040 0.093 -0.255
[0.049] [0.049]** [0.0489] [0.048] [0.0419]* [0.0233]
Ceara × 5thgrade × Post2009 0.042 0.036
[0.0489] [0.0419]
Ceara × 5thgrade 0.017 0.029 0.051 0.044 0.071 0.054 0.064 0.142
[0.048] [0.048] [0.048] [0.048] [0.048] [0.063] [0.063] [0.067]Ceara × 2011 or Post2009 0.043 0.016 0.014 0.008 0.035 0.090 0.026 0.384
[0.019]* [0.019]*** [0.019]*** [0.019]*** [0.019] [0.027]** [0.027]*** [0.01]***
5thgrade × 2011 or Post2009 0.126 0.028 0.042 0.031 0.040 0.036 0.036 0.380
[0.049]* [0.049]*** [0.049]** [0.049]*** [0.049]* [0.042] [0.042]** [0.025]***Ceara 0.118 0.016 0.026 0.023 0.032 -0.086 0.029 -0.186
[0.026]** [0.026]*** [0.026]* [0.026]** [0.026]*** [0.037]* [0.037]** [0.028]*
5thgrade -1.051 0.029 0.051 0.044 0.071 -0.815 0.064 -0.899
[0.048]*** [0.048]*** [0.048]*** [0.048]*** [0.048]*** [0.063]*** [0.063]*** [0.068]***2011 0.144 0.016 0.014 0.003 0.035 0.322 0.026 0.010
[0.019]*** [0.019]*** [0.019]*** [0.019]*** [0.019]*** [0.027]*** [0.027]*** [0.003]***
Borders states Yes No Yes Yes Yes No Yes Yes
Northeast states No Yes No No No Yes No NoState fixed effects Yes Yes Yes Yes Yes Yes Yes Yes
Post 2009 treatment No No Yes No No No Yes NoTrend effect No No No Yes No No No Yes
R-squared 0.336 0.335 0.344 0.333 0.2481 0.2336 0.273 0.249Observations 68,507 68,507 68,507 68,507 68,405 68,405 68,405 68,405
Portuguese Math
students. The interaction of the PAIC program and the school ECD gap seems not to influence the program’s effectiveness.
In summary, this early grade intervention has a large impact on improving the average results of students’ achievement, but it did not succeed in closing the gap between at-risk students before the gap widens. This gap can be correlated with the lack of attending an ECD center, and the student, teacher, and classroom background characteristics that contribute to limit the educational opportunities for many students.
Despite the measured effect of PAIC, the different design and specific scenario of the Ceara program imply that other early grade literacy interventions should be implemented with caution. In order words, to avoid the mistakes made by literacy programs implemented on a large scale in other countries, the Brazilian Education Department should design rigorous impact evaluations for each state to identify the effectiveness of the PNAIC program in different political and social contexts.
REFERENCES
ANGRIST, Joshua D.; PISCHKE, Jörn-Steffen. Mostly harmless econometrics: An empiricist's companion. Princeton University Press, 2008. ASHDOWN, J., & SIMIC, O. (2000). Is early literacy intervention effective for English language learners? Evidence from Reading Recovery. Literacy Teaching and Learning: An International Journal of Early Reading and Writing, 5(1), 27-42.
ALBERNAZ, A. A.; FERREIRA, F. H.G.; FRANCO, C. Qualidade e equidade no ensino fundamental brasileiro. Pesquisa e Planejamento Econômico. Rio de Janeiro: IPEA, v. 32, n.3. p. 453-476, dez/2002.
BAKER, S. K., SMOLKOWSKI, K., SMITH, J. M., FIEN, H., KAME'ENUI, E. J., & THOMAS BECK, C. (2011). The impact of Oregon Reading First on student reading outcomes. Elementary School Journal, 112(2), 307-331.
BARROS, R. P. de; HENRIQUES, R.; MENDONÇA, R. 2002. Pelo fim das décadas perdidas: Educação e desenvolvimento sustentado no Brasil. Rio de Janeiro: IPEA, texto para discussão n° 857.
BERTRAND, M., DUFLO, E., MULLAINATHAN, E.. “How Much Should We Trust Differences-in-Differences Estimates?” Quarterly Journal of Economics 119 (1): 249–75, 2004.
BIONDI, R. L.; FELÍCIO, F de. Atributos escolares e o desempenho dos estudantes: uma análise em painel dos dados do Saeb. Brasília: INEP/MEC p. 19, 2007. (Texto para discussão).
BIONDI, R. L.; VASCONCELLOS, L.; MENEZES-FILHO, N. A. Avaliando o impacto da
Olimpíada Brasileira de Matemática das Escolas Públicas (OBMEP) no desempenho de matemática nas avaliações educacionais. 2009. p.22. Disponível em: <http://www.eesp.fgv.br/_upload/seminario/4aeb3227d49f6.pdf >. Acesso em: 10 de novembro de 2010.
BRASIL, Câmara dos Deputados. Relatório Final do Grupo de Trabalho. Alfabetização Infantil: Novos Caminhos. Brasília, setembro, 2008.
BRASIL. Constituição da Republica Federativa do Brasil de 1988. Disponível em: http://www.planalto.gov.br/ccivil_03/constituicao/constitui%C3%A7ao.htm. Acesso em: 12 de setembro de 2010.
CORRIN, W., LINDSAY, J. SOMERS, M. , MYERS, N., MEYERS, C., CONDON, C., SMITH, J.. "Evaluation of the Content Literacy Continuum: Report on Program Impacts, Program Fidelity, and Contrast." (2013).
CHIAPA, C., GARRIDO, J.L., PRINA, S. (2012). The effect of social programs and exposure to professionals on the educational aspirations of the poor. Economics of Education Review, 31(5),778-798.
COSTA, L. O.; LOUREIRO, A. O.; SALES, R. da S. Uma análise do analfabetismo, fluxo e desempenho dos estudantes do ensino fundamental no estado do Ceará. Fortaleza: IPECE, ago., 2009. (texto para discussão n. 67). Disponível em: <http://www.ipece.ce.gov.br/publicacoes/textos_discussao/TD_67.pdf>. Acesso em: 17 de agosto de 2010.
CHAUDHURY, NAZMUL, AND DILIP PARAJULI. “Conditional Cash Transfers and Female Schooling: The Impact of the Female School Stipend Program on Public School Enrollments in Punjab, Pakistan.” Policy Research Working Paper 4102, World Bank, Washington, DC, 2006.
CUNHA, F., HECKMAN. J.. "Investing in Our Young People," NBER Working Paper 16201.In Childhood Programs and Practices in the First Decade of Life, edited by Arthur J. Reynolds, Arthur J. Rolnick, Michelle M. Englund, Judy A. Temple. New York: Cambridge University Press, 2010.
DAVIDSON, M., & HOBBS, J. (2012). Delivering reading intervention to the poorest children: The case of Liberia and EGRA-Plus, a primary grade reading assessment and intervention. International Journal of Educational Development.
ELMORE, RICHARD. F.. Getting to scale with good educational practice. Harvard Educational Review, 66(1), 1–26, 1996.
HANUSHEK, E. A. WOESSMANN, L. The Role of Cognitive Skills in Economic Development, 2008.
INEP, Ministério da Educação. Mapa do Analfabetismo no Brasil. Brasil, p. 44, 2003, Disponível em: <http://www.inep.gov.br/estatisticas/analfabetismo>. Acesso em: 13 de agosto de 2010.
INEP. Sinopse Estatística da Educação Básica de 2004 a 2008. Mec: Disponível em: http://www.inep.gov.br/basica/censo/escolar/sinopse/ Acesso em: 22/03/2011
IPEA. Efetividade do Direito à educação: inclusão e melhoria da qualidade. Brasil em desenvolvimento: Estado, planejamento e políticas públicas. Brasília: Instituto de Pesquisa Econômica Aplicada, v.3. Cap. 22, p.617- 637, 2009. GAMSE, B.C., BLOOM, H.S., KEMPLE, J.J., JACOB, R.T.. Reading First Impact Study:
Interim Report (NCEE 2008-4016). Washington, DC: National Center for Education Evaluation and Regional Assistance, Institute of Education Sciences, U.S. Department of Education, 2008. GOVE, A. AND P. CVELICH. 2010. Early Reading: Igniting Education for All. A report by the Early Grade Learning Community of Practice. Research Triangle Park, NC: Research Triangle Institute. GOVE, A., WETTERBERG, A.. The Early Grade Reading Assessment: Applications and Interventions to Improve Basic Literacy. USA: RTI Press Book series, 2011.
MENEZES-FILHO, N. VASCONCELLOS, L.; WERLANG S. R. da C.; BIONDI, R. L. Avaliando o impacto da progressão continuada nas taxas de rendimento e desempenho escolar do Brasil. Relatório de avaliação econômica - Itaú social- 2008.
NEUMAN, S. B., & DICKINSON, D. K. (2001). Handbook of early literacy research. New York: Guilford Press.
RAVALLION, MARTIN, EMANUELA GALASSO, TEODORO LAZO, AND ERNESTO PHILIPP. 2005. “What Can Ex-Participants Reveal about a Program’s Impact?” Journal of Human Resources 40 (1): 208–30.
RTI. 2009. Early Grade Reading Assessment Toolkit. Prepared by RTI for The World Bank, Office of Human Development. Available at https://www.eddataglobal.org/documents/index. cfm?fuseaction=pubDetail&ID=149 (accessed August 23, 2010). RTI. 2010. Early Reading Assessment Country Tracker. Available at https:// www.eddataglobal.org/documents/index.cfm?fuseaction=pubDetail&ID=188 (accessed August 23, 2010). STANNARD, H. 2008. Results from a Rapid Reading and Numeracy Test: Assessing Reading and Numeracy Achievement of Community-Based Primary Students in Afghanistan. Prepared for USAID. SCHWARTZ, R. M. (2005). Literacy learning of at-risk first-grade students in the Reading Recovery early intervention. Journal of Educational Psychology, 97(2), 257-267.
SCHWARTZ, R. M., MARIBETH C. SCHMITT, AND MARY K. LOSE. "Effects of Teacher-Student Ratio in Response to Intervention Approaches." Elementary School Journal 112.4 (2012): 547-567.
SHANAHAN, T., BARR, R.. "Reading Recovery: An independent evaluation of the effects of an early instructional intervention for at-risk learners." Reading Research Quarterly : 958-996, 1995.
SCHMITT, M. C., GREGORY, A. E.. "The Impact of an Early Literacy Intervention: Where Are the Children Now?." Literacy 10.1, 2001.
VIEIRA, S. L., VIDAL, E., COSTA, L. O.. Ensino Fundamental: fim de um ciclo expansionista? Estudos Commissioned by the CGEE, 2010.
ANNEX A
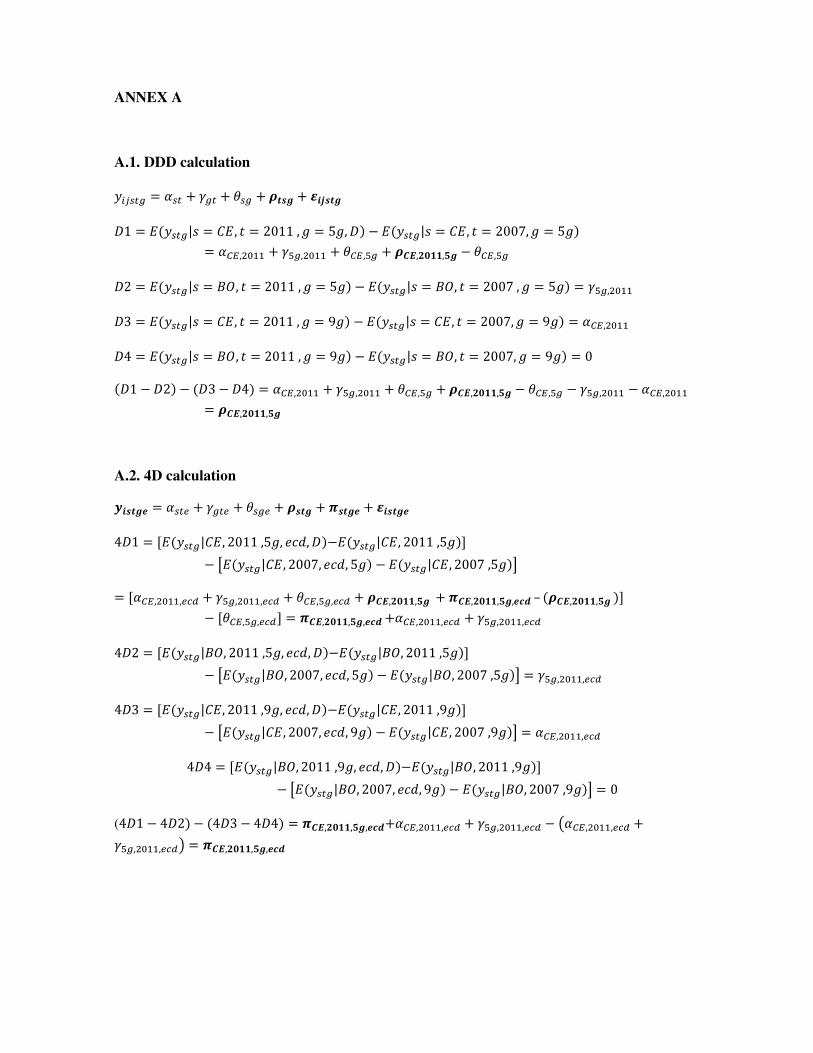
A.1. DDD calculation
��B��� = ��� + ��� + ��� + ���� + XYZ���
�1 = �(����| = [�, � = 2011, = 5 , �� − �(����| = [�, � = 2007, = 5 �= �DC,$]"" + �)�,$]"" + �DC,)� + �^_,`abb,c� − �DC,)�
�2 = �(����| = de, � = 2011, = 5 � − �(����| = de, � = 2007, = 5 � = �)�,$]""
�3 = �(����| = [�, � = 2011, = 9 � − �(����| = [�, � = 2007, = 9 � = �DC,$]""
�4 = �(����| = de, � = 2011, = 9 � − �(����| = de, � = 2007, = 9 � = 0
(�1 − �2� − (�3 − �4� = �DC,$]"" + �)�,$]"" + �DC,)� + �^_,`abb,c� − �DC,)� − �)�,$]"" − �DC,$]""= �^_,`abb,c�
A.2. 4D calculation
hY���M = ���K + ���K + ���K + ���� +L���M + XY���M
4�1 = [�(����|[�, 2011,5 , Ijk, ��−�(����|[�, 2011,5 �]
− m�(����|[�, 2007, Ijk, 5 � − �(����|[�, 2007,5 �n
= [�DC,$]"",Kop + �)�,$]"",Kop + �DC,)�,Kop + �^_,`abb,c� +L^_,`abb,c�,Mqr– (�^_,`abb,c��]− [�DC,)�,Kop] = L^_,`abb,c�,Mqr+�DC,$]"",Kop + �)�,$]"",Kop
4�2 = [�(����|de, 2011,5 , Ijk, ��−�(����|de, 2011,5 �]
− m�(����|de, 2007, Ijk, 5 � − �(����|de, 2007,5 �n = �)�,$]"",Kop
4�3 = [�(����|[�, 2011,9 , Ijk, ��−�(����|[�, 2011,9 �]
− m�(����|[�, 2007, Ijk, 9 � − �(����|[�, 2007,9 �n = �DC,$]"",Kop
4�4 = [�(����|de, 2011,9 , Ijk, ��−�(����|de, 2011,9 �]
− m�(����|de, 2007, Ijk, 9 � − �(����|de, 2007,9 �n = 0
(4�1 − 4�2� − (4�3 − 4�4� = L^_,`abb,c�,Mqr+�DC,$]"",Kop + �)�,$]"",Kop − t�DC,$]"",Kop +
�)�,$]"",Kopu = L^_,`abb,c�,Mqr