the effects of a humorous instructional video on
TRANSCRIPT

Purdue University Purdue University
Purdue e-Pubs Purdue e-Pubs
Open Access Dissertations Theses and Dissertations
Fall 2014
The Effects of a Humorous Instructional Video on Motivation and The Effects of a Humorous Instructional Video on Motivation and
Learning Learning
Hans P. Aagard Purdue University
Follow this and additional works at: https://docs.lib.purdue.edu/open_access_dissertations
Part of the Curriculum and Instruction Commons
Recommended Citation Recommended Citation Aagard, Hans P., "The Effects of a Humorous Instructional Video on Motivation and Learning" (2014). Open Access Dissertations. 217. https://docs.lib.purdue.edu/open_access_dissertations/217
This document has been made available through Purdue e-Pubs, a service of the Purdue University Libraries. Please contact [email protected] for additional information.


i
THE EFFECTS OF A HUMOROUS INSTRUCTIONAL VIDEO
ON MOTIVATION AND LEARNING
A Dissertation
Submitted to the Faculty
of
Purdue University
by
Hans Peter Aagard
In Partial Fulfillment of the
Requirements for the Degree
of
Doctor of Philosophy
December 2014
Purdue University
West Lafayette, Indiana

ii
This of course is dedicated to my wife Mary and our now three children, none of
whom were born when we started this thing. Mary has supported me every time I
turned back to this work and been an ardent defender no matter which way I went. You
rock, Mary. Thank you so so much!
Minnie, Eddie, and Karen – if you work hard and others support and push you
along you can do hard, great things.

iii
ACKNOWLEDGEMENTS
Dr. Tim Newby has been a source of support, encouragement and professional
advice, even at times that were not convenient. For that I’m grateful. It has been a long
journey for both of us through this process and I doubt anyone besides my wife is more
relieved to see this thing get out the door than Tim. He, along with Aggie Ward, who is
poorly described as an administrative assistant and better described as She Who Holds
The Place Together have kept track of me very well and have become friends. Jenn
Richardson was a mentor when I was in West Lafayette and brought me on to projects
that gave me a lot of experience. Aman Yadav and Cheryl Oestreicher agreed to be on
the committee and have provided great feedback and been wonderful committee
members.
Yukiko Namaeda helped bring the dissertation down to earth, was flexible with
my schedule and distance, was available, and gave me lots of very very good ideas about
what to improve about the study. Tad Colver helped me through the stats, calmly and
rationally.
John Campbell for repeatedly warning me against exactly how it ended up and
sharing how his ended up, which made me feel better in the end. Joe Conte and
Donalee Attardo for being supportive through some vacillations about this project.

iv
Deadmau5 for producing the song “The Veldt” (the 8 minute version, in
particular) which I listened to maybe 50 times, whenever I needed a lift.
Mark Jaeger for going above and beyond in helping me get this paper ready
format-wise.
And of course Mary for being supportive emotionally, mentally, and physically,
and in a real sense giving me the opportunity to keep going. THANK YOU. It’s your turn!

v
TABLE OF CONTENTS
Page
LIST OF TABLES .................................................................................................................... xi
LIST OF FIGURES .................................................................................................................. xiv
ABSTRACT ................................................................................................................... xv
CHAPTER 1 INTRODUCTION .......................................................................................... 1
Introduction ............................................................................................................ 1
Background ............................................................................................................ 2
Historical Approaches to Humor..................................................................................... 2
Humor in Education ......................................................................................................... 4
Studying Humor in Education ......................................................................................... 5
Statement of the Problem ................................................................................................... 7
Research Questions ............................................................................................................ 8
Significance of the Study ..................................................................................................... 8
CHAPTER 2 LITERATURE REVIEW .................................................................................. 9
Humor ............................................................................................................ 9
Definition of Humor ......................................................................................................... 9
Humor Theory ............................................................................................................... 11
A Brief History of Humor Theory .............................................................................. 11
Superiority .................................................................................................................. 12
Incongruity Theory .................................................................................................... 14
Relief Theory .............................................................................................................. 17
Humor Theory Summary ............................................................................................... 18
Motivation .......................................................................................................... 18

vi
Page
Definition of Motivation ................................................................................................ 19
Keller’s Macro Model of Motivation and Performance .............................................. 19
Attention .................................................................................................................... 20
Relevance, Confidence, and Satisfaction ................................................................. 23
Measuring Motivation ............................................................................................... 24
Multimedia Instruction ...................................................................................................... 24
Media and Motivation ................................................................................................... 25
Mayer’s Principles of Multimedia Learning ................................................................. 26
Reducing Extraneous Processing .............................................................................. 27
Managing Essential Processing ................................................................................. 28
Fostering Generative Processing .............................................................................. 28
Seductive Text ............................................................................................................... 29
Humor in Education .......................................................................................................... 33
Instructor Evaluations.................................................................................................... 33
Classroom Environment ................................................................................................ 39
Effects of Humor on Learning ....................................................................................... 43
Positive Effects on Learning ...................................................................................... 43
No Effects on Learning .............................................................................................. 51
Negative Effects on Learning .................................................................................... 53
Summary of Effects on Learning ............................................................................... 54
Strategies for Humor in Education ............................................................................... 55
Humor Placement and Amount ................................................................................ 55
Humor Content .......................................................................................................... 55
Humor in Library Instruction ............................................................................................. 56
Conclusion .......................................................................................................... 57
CHAPTER 3 METHODS ................................................................................................. 58
Review of Research Purpose ............................................................................................. 58
Theoretical Framework ..................................................................................................... 59

vii
Page
Pilot Studies .......................................................................................................... 60
Context .......................................................................................................... 60
Pilot Study Context ........................................................................................................ 60
Final Study Context ........................................................................................................ 60
Procedure .......................................................................................................... 62
Recruiting ............................................................................................................... 62
Pilot Study Recruiting ................................................................................................ 62
Final Study Recruiting ................................................................................................ 63
Participants ............................................................................................................... 64
Pilot Studies ............................................................................................................... 64
Final Study .................................................................................................................. 66
Pilot and Final Study Participant Comparison ......................................................... 69
Research Design ............................................................................................................. 69
Pilot Designs ............................................................................................................... 69
Final Study Design...................................................................................................... 69
Sampling ............................................................................................................... 71
Instruments .......................................................................................................... 72
Learning Assessment ..................................................................................................... 72
Demographics ............................................................................................................... 73
Motivation Survey .......................................................................................................... 73
Humor Manipulation Check (HMC) .............................................................................. 75
Open-Ended Questions.................................................................................................. 76
Instructional Intervention ............................................................................................. 77
Pilot Study 1 Video .................................................................................................... 77
Pilot Study 2 Video .................................................................................................... 78
Pilot Study 3 Video .................................................................................................... 79
Humor Placement and Amount ................................................................................ 80
Humor Content .......................................................................................................... 83

viii
Page
Data Analysis .......................................................................................................... 84
Learning Assessment ..................................................................................................... 84
Scoring ........................................................................................................................ 84
Pretest, Posttest, and Second Posttest .................................................................... 86
Humor Manipulation Check (HMC) .............................................................................. 87
Motivation Survey .......................................................................................................... 87
Open-Ended Questions.................................................................................................. 88
Statistical Data ............................................................................................................... 88
CHAPTER 4 RESULTS .................................................................................................... 90
Review of Research Purpose ............................................................................................. 90
Learning Assessment ..................................................................................................... 90
From Pretest to Posttest ........................................................................................... 91
From Pretest to Second Posttest .............................................................................. 98
From Posttest to Second Posttest .......................................................................... 105
Overall Learning Summary .......................................................................................... 111
Humor Manipulation Check (HMC) ................................................................................ 112
Reliability ............................................................................................................. 112
Not Funny - Funny........................................................................................................ 113
Not Humorous - Humorous ......................................................................................... 114
Not Amusing - Amusing ............................................................................................... 116
HMC Overall ............................................................................................................. 117
HMC Summary ............................................................................................................. 119
Motivation Survey ........................................................................................................ 119
IMMS Reliability ........................................................................................................... 119
IMMS Scores ............................................................................................................. 120
Attention .................................................................................................................. 120
Relevance ................................................................................................................. 122

ix
Page
Confidence ............................................................................................................... 123
Satisfaction ............................................................................................................... 125
IMMS Overall ........................................................................................................... 127
IMMS Results Summary .............................................................................................. 128
Open-Ended Items ........................................................................................................ 128
Control Group ............................................................................................................. 129
Experimental Group ..................................................................................................... 130
Experimental – Changes To Be Made..................................................................... 130
Experimental - Humor in the Video ........................................................................ 131
Experimental – Humor in Other Instructional Videos ........................................... 132
Summary ............................................................................................................. 134
Correlations ........................................................................................................ 135
Overall ............................................................................................................. 135
Genders ............................................................................................................. 136
Summary ............................................................................................................. 138
Summary of Results ........................................................................................................ 139
CHAPTER 5 DISCUSSION ............................................................................................141
Learning Assessment and Perception of Humor ........................................................... 141
Motivation ........................................................................................................ 143
Humor Manipulation Check and Instructional Video .................................................... 145
Limitations ........................................................................................................ 147
Research Design and Instruments .............................................................................. 147
Participants ............................................................................................................. 149
Implications ........................................................................................................ 150
Further Research ........................................................................................................ 151
BIBLIOGRAPHY ................................................................................................................ 153

x
Page
APPENDICES
Appendix A Learning Assessment – Pilot 1 .................................................................. 171
Appendix B Learning Assessment – Pilots 2-3, Final Study......................................... 173
Appendix C Demographic Survey ................................................................................. 177
Appendix D Instructional Materials Motivation Survey (IMMS) ................................ 179
Appendix E Humor Manipulation Check (HMC) – Pilots 2,3, and Final Study........... 182
Appendix F Open-Ended Student Perception Questions ........................................... 183
Appendix G Responses to Open-Ended Student Perception Questions .................... 184
Appendix H Final Video Script ....................................................................................... 192
VITA .................................................................................................................196
PUBLICATIONS .................................................................................................................199
xi
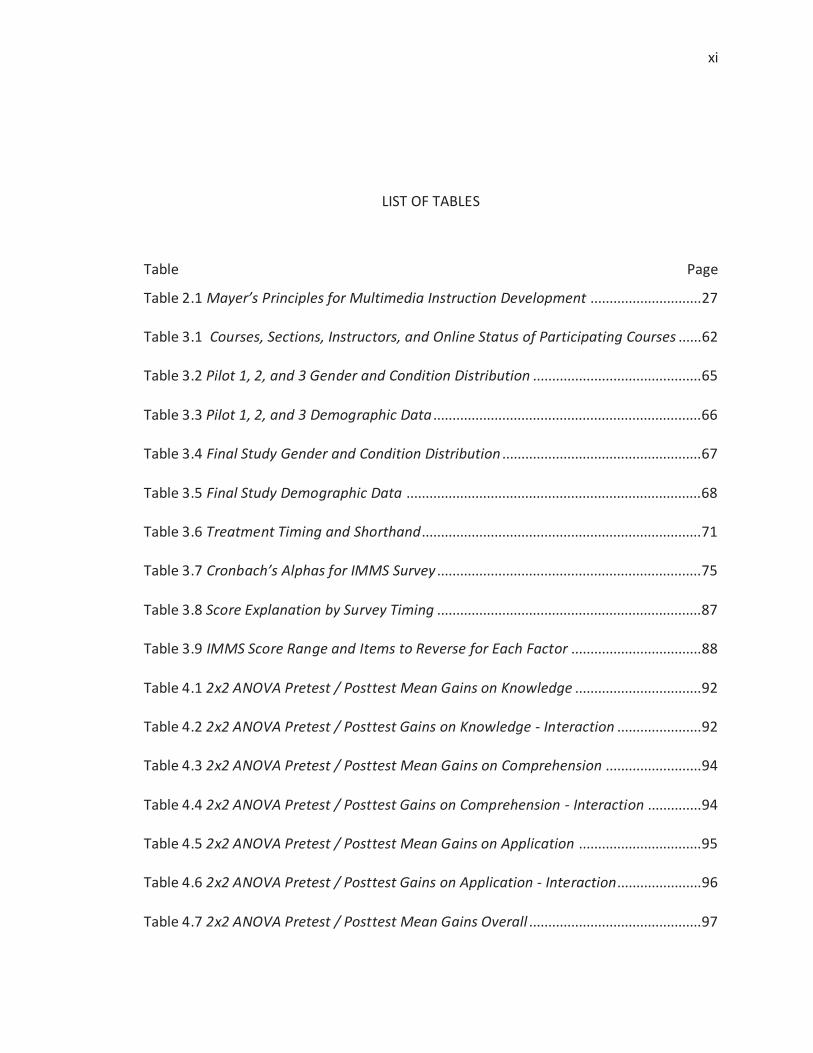
LIST OF TABLES
Table .................................................................................................................................... Page
Table 2.1 Mayer’s Principles for Multimedia Instruction Development ............................. 27
Table 3.1 Courses, Sections, Instructors, and Online Status of Participating Courses ...... 62
Table 3.2 Pilot 1, 2, and 3 Gender and Condition Distribution ............................................ 65
Table 3.3 Pilot 1, 2, and 3 Demographic Data ...................................................................... 66
Table 3.4 Final Study Gender and Condition Distribution .................................................... 67
Table 3.5 Final Study Demographic Data ............................................................................. 68
Table 3.6 Treatment Timing and Shorthand......................................................................... 71
Table 3.7 Cronbach’s Alphas for IMMS Survey ..................................................................... 75
Table 3.8 Score Explanation by Survey Timing ..................................................................... 87
Table 3.9 IMMS Score Range and Items to Reverse for Each Factor .................................. 88
Table 4.1 2x2 ANOVA Pretest / Posttest Mean Gains on Knowledge ................................. 92
Table 4.2 2x2 ANOVA Pretest / Posttest Gains on Knowledge - Interaction ...................... 92
Table 4.3 2x2 ANOVA Pretest / Posttest Mean Gains on Comprehension ......................... 94
Table 4.4 2x2 ANOVA Pretest / Posttest Gains on Comprehension - Interaction .............. 94
Table 4.5 2x2 ANOVA Pretest / Posttest Mean Gains on Application ................................ 95
Table 4.6 2x2 ANOVA Pretest / Posttest Gains on Application - Interaction...................... 96
Table 4.7 2x2 ANOVA Pretest / Posttest Mean Gains Overall ............................................. 97

xii
Table Page
Table 4.8 2x2 ANOVA Pretest / Posttest Gains Overall - Interaction .................................. 98
Table 4.9 2x2 ANOVA Pretest / Second Posttest Mean Gains on Knowledge .................... 99
Table 4.10 2x2 ANOVA Pretest / Second Posttest Gains on Knowledge - Interaction .....100
Table 4.11 2x2 ANOVA Pretest / Second Posttest Mean Gains on Comprehension ........101
Table 4.12 2x2 ANOVA Pretest / Second Posttest Gains on Comprehension - Interaction
...............................................................................................................................................101
Table 4.13 2x2 ANOVA Pretest / Second Posttest Mean Gains on Application ...............102
Table 4.14 2x2 ANOVA Pretest / Second Posttest Gains on Application - Interaction.....103
Table 4.15 2x2 ANOVA Pretest / Second Posttest Mean Gains Overall ............................104
Table 4.16 2x2 ANOVA Pretest / Second Posttest Gains Overall - Interaction .................104
Table 4.17 2x2 ANOVA Posttest / Second Posttest Mean on Knowledge.........................106
Table 4.18 2x2 ANOVA Posttest / Second Posttest Gains on Knowledge - Interaction ...106
Table 4.19 2x2 ANOVA Posttest / Second Posttest Mean on Comprehension .................107
Table 4.20 2x2 ANOVA Posttest / Second Posttest Gains on Comprehension - Interaction
...............................................................................................................................................108
Table 4.21 2x2 ANOVA Posttest / Second Posttest Mean on Application ........................109
Table 4.22 2x2 ANOVA Posttest / Second Posttest Gains on Application - Interaction ...109
Table 4.23 2x2 ANOVA Posttest / Second Posttest Mean Overall ....................................110
Table 4.24 2x2 ANOVA Posttest / Second Posttest Gains Overall - Interaction ...............111
Table 4.25 Cronbach’s Alphas for the Humor Manipulation Check ..................................113
Table 4.26 2x2 ANOVA HMC Score Mean - Funny .............................................................113
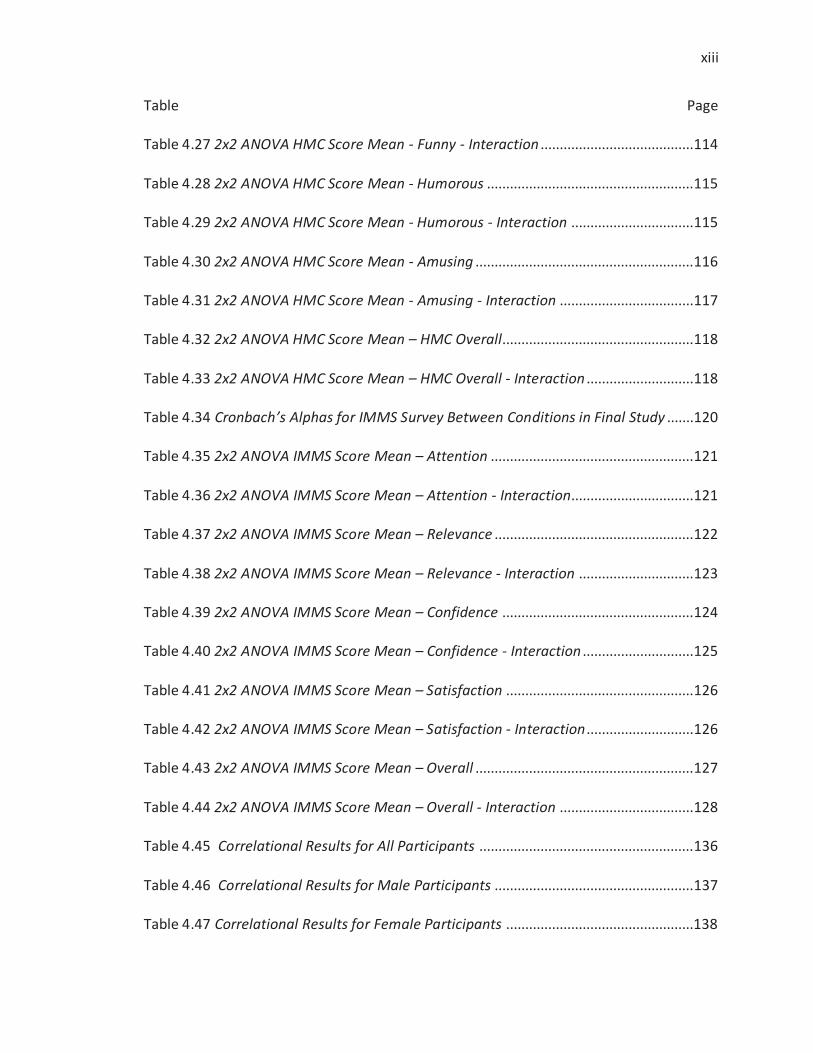
xiii
Table Page
Table 4.27 2x2 ANOVA HMC Score Mean - Funny - Interaction ........................................114
Table 4.28 2x2 ANOVA HMC Score Mean - Humorous ......................................................115
Table 4.29 2x2 ANOVA HMC Score Mean - Humorous - Interaction ................................115
Table 4.30 2x2 ANOVA HMC Score Mean - Amusing .........................................................116
Table 4.31 2x2 ANOVA HMC Score Mean - Amusing - Interaction ...................................117
Table 4.32 2x2 ANOVA HMC Score Mean – HMC Overall..................................................118
Table 4.33 2x2 ANOVA HMC Score Mean – HMC Overall - Interaction ............................118
Table 4.34 Cronbach’s Alphas for IMMS Survey Between Conditions in Final Study .......120
Table 4.35 2x2 ANOVA IMMS Score Mean – Attention .....................................................121
Table 4.36 2x2 ANOVA IMMS Score Mean – Attention - Interaction................................121
Table 4.37 2x2 ANOVA IMMS Score Mean – Relevance ....................................................122
Table 4.38 2x2 ANOVA IMMS Score Mean – Relevance - Interaction ..............................123
Table 4.39 2x2 ANOVA IMMS Score Mean – Confidence ..................................................124
Table 4.40 2x2 ANOVA IMMS Score Mean – Confidence - Interaction .............................125
Table 4.41 2x2 ANOVA IMMS Score Mean – Satisfaction .................................................126
Table 4.42 2x2 ANOVA IMMS Score Mean – Satisfaction - Interaction ............................126
Table 4.43 2x2 ANOVA IMMS Score Mean – Overall .........................................................127
Table 4.44 2x2 ANOVA IMMS Score Mean – Overall - Interaction ...................................128
Table 4.45 Correlational Results for All Participants ........................................................136
Table 4.46 Correlational Results for Male Participants ....................................................137
Table 4.47 Correlational Results for Female Participants .................................................138

xiv
LIST OF FIGURES
Figure................................................................................................................................... Page
Figure 1.1 Screen shot of YouTube video “Behaviourism 101” [sic] by nessymon ............. 1
Figure 2.1 Representation of Macro Model of Motivational Design and Performance ... 20
Figure 3.1 Screenshot of Joe and the teacher, from the instructional instrument ........... 78
Figure 3.2 Screenshot of Sharknado poster, added for humorous effect .......................... 80
Figure 3.3 Outline of humor placement within instructional video. Humorous
interjections are in bold italics. ............................................................................................. 82
Figure 4.1 Pretest / Posttest Gains on Comprehension Scores Condition * Gender .......... 93
Figure 4.2 Pretest / Posttest Gains on Overall Scores Condition * Gender ........................ 97
Figure 4.3, IMMS Scores – Confidence for Condition * Gender Interaction .....................124

xv
ABSTRACT
Aagard, Hans P. Ph.D., Purdue University, December 2014. The Effects of a Humorous Instructional Video on Motivation and Learning. Professor: Timothy Newby.
This study examines the effects of humor within an instructional video on
student learning and motivation. Humor in education has been shown to improve
students’ perception of the instructor and learning environment, with mixed results on
gains in actual learning. Humor has been suggested as a strategy to gain and maintain
attention, improving motivation to learn. With the dramatic increase of online
multimedia instruction, research on the use of humor on multimedia instructional
materials can help us determine if it can be used to improve learning and motivation.
In a pretest-posttest controlled design, students viewed a short multimedia
instructional video. In the control group, students viewed a non-humorous video
explaining three ways to cite sources in a research paper. In the experimental group,
students viewed the same video with four humorous additions unrelated to
instructional content. After watching the video, students in both groups took a learning
and motivational assessment. Learning was assessed with questions related to recall
and application. Motivation was measured using the Instructional Materials Motivation
Survey (IMMS).
xvi
Results on learning assessments found that overall there was no significant
difference between the pretest and posttest between the control and experimental
groups, nor was there a significant difference between the control and experimental
groups on the motivation assessment.
However, gender was added as a factor of comparison, results showed that
males scored higher on knowledge items on the pretest / posttest gain and were more
influenced by humor than females on comprehension and the overall gain scores. In
motivation, males perceived the humorous video as more satisfying and were more
influenced by the humor than females in perception of confidence in the instruction.
Significant correlations were found between perception of humor, learning gains
between the pretest and posttest, and perception of motivation overall and in each
gender.
Previous research on instructional humor has found gender to be an important
factor in the perception of instructional humor. Because the designer and producer of
the instructional video was male, it may be that males who enjoyed the humor were
more motivated by, and learned more from, the humorous instructional video. Care
should be taken in using humor in instruction to ensure the type of humor is received
well by students of either gender in the course.

1
CHAPTER 1 INTRODUCTION
Introduction
A casual search in YouTube for “behaviorism” results in 9,810 results. The first
result, a video called Behaviourism 101 [sic] posted by “nessymon,” is four and half
minutes long, has an upbeat intro song and features an animated avatar in front of a
whiteboard that changes slightly as she describes different concepts (Behaviourism 101,
2012). Next to her, an animated dog sits on a stool and appears to listen and ponder her
lecture, reacting as a student might. The voiceover is varied and carefully paced. The
video has over 43,000 hits since being posted in January of 2012.
Figure 1.1 Screen shot of YouTube video “Behaviourism 101” [sic] by nessymon
2
Instructional multimedia is more easily created and accessible than ever before.
Instructors and students carry cameras built into their phones powerful enough to
record high-resolution video (Dahlstrom, 2012). In this landscape of media proliferation
it is important to develop educational media that is both well designed pedagogically so
it produces the desired learning outcomes, and motivationally appealing to maintain
student interest. Instructional materials are increasingly competing for students’ time,
not only with activities away from the screen, but with other activities on the same
screen.
There is a range of strategies designed to make instructional content more
compelling. Instructional media for children, like Sesame Street and Electric Company,
incorporate humor as a means of getting or keeping attention (Bernat & Mueller, 2013;
Fisch, 2004). The success of these programs leads one to ask if humor can be used in
instructional media for students of other ages: does it both keep students’ attention and
help them learn? The goal of this study will be to answer these questions.
Background
Historical Approaches to Humor
Humor is a complicated topic that has been examined by some of the greatest
thinkers on the planet, including Plato, Aristotle, Freud, and Cicero (Morreall, 1987). It is
a difficult concept to define or achieve, yet is a universal experience in daily life
(Earleywine, 2010), while simultaneously being subjective and highly personal (Garner,
2006). However, upon closer inspection, history shows a theoretical basis for humor, an
examination of which may lead to other discoveries. As Freud points out, humor is
3
strongly connected to other parts of the personality and surely helps us understand
other facets (Freud, 1989).
Humor can be divided into content and structure, i.e. what the joke is about and
the way that it is told (Ruch, 1992). Humor theory began with examining specific content
and slowly broadened out to address different structures.
The first theory of humor focused on put-downs, and is commonly referred to as
the Superiority Theory. The literature on it begins early in our history; thoughts on
humor by Plato, Aristotle, and Hobbes mentioned only aggressive content (Aristotle,
350AD; Cicero, Watson, & Jones, 1875; Plato, 1990). These thinkers suggested that
humor ought to be avoided because it relied on enjoying other people’s pain as a means
of asserting power by diminishing others; their view of humor was as something that
could only be produced and enjoyed by someone with a “momentary anesthesia of the
heart” (Bergson, 1911, p. 5). Ellen DeGeneres, a modern comedian, concedes that this is
still common: “Most comedy is based on getting a laugh at somebody else's expense”
(Rocca, 2012). Superiority Theory’s focus on one type of content is its weakness as a
universal theory.
The next historical theory of humor to develop was the Incongruity Theory,
which marked a shift in focus from content to structure. It states that the core of humor
is something odd or unusual, differing from our normal expectations, with a sense of
playfulness that can prime the cognitive decision to work through the conflict (Cicero,
1875; Martin, 2007). Incongruity Theory has two forms: incongruity-resolution and
nonsense (McGhee, Ruch, & Hehl, 1990; Ruch, 1992; Shultz, 1996). Incongruity-

4
resolution sets up a problem to be solved (Levine, 1969; Rothbart, 1996), and if it is not,
someone didn’t “get the joke.” Nonsense humor begins with an incongruity but provides
no “full” resolution; there may be no solution, a partial solution, or more incongruity
(McGhee et al., 1990).
The next theory of humor to develop, Relief Theory, came from Freud. He
postulated that humor relieves tension from other areas of our lives by taking psychic
energy tied up in sexual or aggressive inhibitions and releasing it through laughter
(Freud, 1989).
Humor in Education
Each of these three theories describes a different part of humor—Superiority
Theory focuses on the content, Incongruity Theory addresses humor structure, and
Relief Theory examines the psychological rationale for the good mood resulting from a
laugh.
But how does humor connect to education? Perhaps this answer can be found
through examining motivation. One model of motivation developed by Keller (2010)
focuses on four personal variables: Attention, Relevance, Confidence, and Satisfaction
(ARCS), with humor used as a strategy to capture and maintain Attention. However,
Keller emphasizes that humor should be used with care to avoid distracting the student
from the educational message (Keller, 2010; Mayer, 2014).
In fact, humor in education has improved factors such as student perception of
the instructor, particularly likeability, without an attendant decrease in credibility
(Gruner, 1967, 1970), although the gender of the instructor may influence perceived
5
credibility (Bryant, Comisky, Crane, & Zillmann, 1980; Tamborini & Zillmann, 1981). For
example, Bryant, et al. found that males lost little credibility with students when using
most humor, but that was not the case with female instructors (1980). This will be
discussed more below in the “Instructor Evaluations” section of Chapter Two. The
classroom environment has also been the focus of research, indicating that humor
increases student interest in the instructional content, makes students more relaxed,
and increases perception of the instructor as approachable, making for a more
comfortable learning environment (Askildson, 2005). From the instructors’ perspective,
humor has been found to help students relax, capture student attention, help the
instructor appear more relatable, and make the classroom environment enjoyable
(Neuliep, 1991). Other studies report less student stress about course content and the
course in general, and improved student perception of the usefulness of course content
(Berk & Nanda, 1998). Humor has similar effects in online environments (Anderson,
2011).
Studying Humor in Education
However, aside from these secondary factors that influence learning, does
humor have a specific and direct effect on learning gains? Most studies that report
learning gains appear to have problematic research designs (Kaplan & Pascoe, 1977;
Kothari, Rana, & Khade, 1993; Ziv, 1988). Additionally, studies with more rigorous
designs seem to show no significant improvements in learning (Gruner, 1967, 1970).
One well-designed study even found a decrease in learning (Fisher, 1997). Yet given the
list of perceived benefits of humor in the classroom, it appears that humor is of value in

6
the learning experience. Additional studies designed with more experimental rigor and
focusing on an examination of the question of learning gains are required in order to
fully answer these questions (Banas, Dunbar, Rodriguez, & Liu, 2011).
Multimedia is an increasingly common distribution mechanism for instruction of
any kind (Houser, Cowan, & West, 2007). A number of the studies described above used
multimedia as the way to deliver a humorous instructional message (Fisher, 1997;
Gruner, 1967, 1970; Tamborini & Zillmann, 1981). The design of multimedia messages is
important. Mayer and others focus on strategies to improve the crafting of multimedia
content (Clark & Mayer, 2003; Mayer, 2009). He defines a multimedia message as “a
presentation involving words and pictures” (2009, p. 3) ranging from a narrated
PowerPoint of static images to a full-motion video with sound. Mayer developed the
Cognitive Theory of Multimedia Learning, building on Dual-Coding Theory (DCT),
Cognitive Load Theory, and Active Learning (Mayer, 2007). DCT suggests that the mind
receives and organizes verbal (words) and nonverbal (images) differently (Mayer, 2009;
Paivio, 2007), and that the visual and auditory input systems are different; thus, we see
and hear information differently (Baddeley, 1992). Cognitive Load Theory suggests the
mind has the capacity for a limited amount of information intake, which must be
carefully managed (Chandler & Sweller, 1991), while Active Learning proposes that the
learner is an active participant in the learning process, taking in information and
connecting it to previous learning (Mayer, 1999).
These foundational theories provide the groundwork for specific strategies to
design multimedia in a way that will improve the likelihood that information will be

7
processed and connected to previous learning. Tension between Mayer's theory and
affective factors like motivation have been mitigated by Moreno’s Cognitive-Affect
Theory of Learning with Media (CATLM) which builds on Mayer’s Cognitive Theory of
Multimedia Learning and includes affective factors (Moreno, 2006). This gives a
framework in which humor can be examined as a variable influencing motivation, which
in turn is an affective factor in learning cognitively from multimedia instruction.
Statement of the Problem
Humor has been shown in some conditions to improve student perception of the
instructor without diminishing their perceived credibility. It has also been shown to
provide a number of benefits, including improving both student and instructor
perceptions of the class environment. Previous studies have shown mixed results in
terms of learning gains, with the most rigorous studies showing no significant difference
between learning environments incorporating humor and those that do not (Fisher,
1997; Gruner, 1967). This study seeks to improve on many of the existing studies by
incorporating a more rigorous experimental approach.
Finally, studies focusing on the effects of humor on learning and motivation have
largely used multimedia as a means of capturing static lecture material. This study
proposes to examine the role of humor in instruction designed for only multimedia
delivery.

8
Research Questions
The purpose of this study is to determine the effects of adding humor to an
instructional video on learning and motivation. The research questions for this study are
as follows:
R1 – Does adding humor to an instructional video influence learning?
H1 – Adding humor to an instructional video will improve learning.
R2 – Does adding humor to an instructional video influence motivation?
H2 – Adding humor to an instructional video will improve motivation.
R3 – Does the gender of the student influence learning or motivation?
H3 – The gender of the student will not influence learning or motivation.
Significance of the Study
The results of this study will add to the existing literature on the use of humor in
instruction, ideally adding rigor to the experimental studies examining the effects on
learning and motivation. In addition, it will contribute to the perspective of humor in
instruction designed for multimedia deployment.

9
CHAPTER 2 LITERATURE REVIEW
This chapter will focus on humor and its effects on learning. It will first address
humor and humor theory, briefly outlining its history and focusing on three humor
theories: Superiority, Incongruity, and Relief. It will then move on to motivation and the
role humor may have in affecting learning motivation. Next, it will examine the role of
humor and its effects on teaching and learning; of particular note will be the effects on
student perception and learning. Finally, it will close by connecting this research to
expanding efforts in examining motivation in multimedia learning.
Humor
To begin, we will define humor, give a brief overview of the history of humor
theory, and then focus on three relevant theories of humor.
Definition of Humor
Mel Brooks wrote, “Tragedy is when I cut my finger. Comedy is when you fall
into an open sewer and die” (Salkin, 1975). The truthfulness of this statement and its
absurdity at face value emphasizes that humor is hard to define, partially due to its
association with individual perception. Funny people are never more uncomfortable
than when explaining how their humor works or how they write it. Some warn us more
deliberately that perhaps we should stay away from analysis, “since it may be that

10
reflection kills laughter” (Dugas, 1902, p. 1 as quoted in Freud, 1989, p. 178). People
argue that they “know what's funny when they see it” but cannot say why (Earleywine,
2010, p. 4). Defining humor, and what is funny, seems analogous to distinguishing
between music and good music: it comes down to personal taste. Humor is “highly
personal, subjective, and contextual and we cannot always predict the way it will be
received. Things that one person might find humorous, ironic, or funny may be viewed
by others as trite” (Garner, 2006, p. 178).
Yet the universality of humor still compels thought and research on the topic.
Great minds like Aristotle, Cicero, and Freud have weighed in on humor. Freud, one of
the most important psychologists of the 20th century, states in his book, Jokes and Their
Relation to the Unconscious:
Is the subject of jokes worth so much trouble? There can, I think, be no
doubt of it…I can appeal to the fact that there is an intimate connection
between all mental happenings—a fact which guarantees that a
psychological discovery even in a remote field will be of an unpredictable
value in other fields” (Freud, 1989, p. 13).
In other words, he argues that learning about humor is valuable, if only because
of its many connections to other parts of our personalities.

11
Humor Theory
A Brief History of Humor Theory
In addition to Freud, some of the greatest minds in documented history have
weighed in on humor. Plato, Aristotle, and other early philosophers appeared to define
humor as aggressive or critical denigration of others; this viewpoint was later labeled
the Superiority Theory of Humor. Possibly because of this definition, their approach was
largely prescriptive. Plato advised against humor, asserting that laughing at others’
misfortunes is a pleasure that comes from malice and is a vice that brings pain (Plato,
1990). Aristotle found more balance, arguing for “tasteful” humor and “tact,” admitting
that it is not hard to find things funny, but advising caution: “the ridiculous side of things
is not far to seek…and most people delight more than they should in amusement and in
jesting” (Aristotle, 350AD Book 4, Ch. 8). Hobbes agreed more with Plato, remarking
that laughter is a grimace, and that those who mock others do so out of insecurity
(Hobbes, 1651).
Focus later shifted from one definition of humor to a broader view that included
structure. Cicero advised against humor about the helpless, but went on at length about
how a playful disposition and “strokes of wit give pleasure to an audience, and are often
of great advantage to the speaker” (Cicero et al., 1875, p. 144). This was perhaps the
first mention of humor as a teaching strategy. Cicero also began to make distinctions
between different kinds of jokes, “one of which is excited by things, the other by words”
(Cicero et al., 1875, p. 151) and gave us a joke structure: “this is the most common kind

12
of joke, when we expect one thing and another is said; in which case our own
disappointed expectation makes us laugh” (Cicero et al., 1875, p. 157). Here we see the
beginning of what was later labeled the Incongruity Theory.
Finally, Freud contributed to humor theory by suggesting the means by which
the pleasure in humor comes. He wrote, “in laughter…the conditions are present under
which a sum of psychical energy which has hitherto been used for cathexis is allowed
free discharge” (Freud, 1989, p. 181). Cathexis refers to unhealthy focus on (largely
societal) mores of restraint; Freud’s work led to what is later labeled the Relief Theory.
Early philosophers’ work on humor gives us the foundation for modern humor analysis
(Morreall, 1987). With an overview of the three theories, we can focus with more intent
on the first, Superiority Theory.
Superiority
As described earlier, Plato, Aristotle, and Hobbes developed the basic tenets of
the Superiority Theory, which positions humor as an act of aggression against another
group or individual as a means of elevating the aggressor. Plato and Aristotle began by
prescribing when it was appropriate to laugh or tell jokes. Plato assumed jokes were
derisive (Plato, 1990), while Aristotle recognized the social aspect of humor but noticed
its emotional effects and warned against boors who used it too much (Aristotle, 350AD).
Hobbes agreed: “Laughter at the defects of others is a signe [sic] of Pusillanimity [lack of
courage]” (Hobbes, 1651). Bergson, another philosopher, argued that comedy is
pernicious and indicates an absence of feeling, “something like a momentary anesthesia

13
of the heart” (Bergson, 1911, p. 5), which might allow people to make fun of something
like a physical deformity. He made a compelling point in explaining that physical
deformities in popular comedic culture are those that can be imitated by those without
deformities. A modern example of this is Gwyneth Paltrow, voted in 2013 to be the
World’s Most Beautiful Woman (Jordan, 2013), who played both herself and an
extremely obese version of herself in the comedy film Shallow Hal (Farrelly & Farrelly,
2001). As someone popularly acknowledged as a standard of beauty, temporarily
donning a physical deformity for comedic effect might be seen as callous. Freud points
out that “hostile” humor tries “to turn the hearer who was indifferent to begin with,
into a co-hater or co-despiser, and creates for the enemy a host of opponents where at
first there was only one” (Freud, 1989, p. 163). The effectiveness of attack humor seems
to rely on the emotional payoff of the audience feeling superior to the target of the joke.
Modern examples of this strategy in media include divisive cable personalities like Bill
O'Reilly and Rachel Maddow, who use humor in derisive political attacks. In stand-up
comedy, Don Rickles personifies this approach with constant verbal ridicule aimed at
audience members (Korobkin, 1988; Morreall, 1987), who feel relief when not targeted
and special attention when it is their turn (Kinde, 2013).
Aggressive jokes can divide people and draw lines around who is in and who is
not: “every joke calls for a public of its own and laughing at the same jokes is evidence
of far-reaching psychical conformity” (Freud, 1989, p. 185). However, Davies argues that
the audience often knows that a joke aimed at another town or country is a form of

14
bonding: “we should not mistake the glee of the winners in this successful piece of
playful aggression for real hostility” (Davies, 1998, p. 13).
As mentioned earlier, the limitation of the Superiority Theory is its narrow
content focus. It can describe the tension between brothers, spouses, parents and in-
laws bickering and jostling for power on a popular sitcom like Everybody Loves Raymond,
but cannot explain the humor in Bill Cosby’s description of a dentist visit in Bill Cosby:
Himself. Its usefulness is limited, leading us to a more expansive approach, Incongruity
Theory.
Incongruity Theory
Incongruity Theory, by avoiding focus on one type of content and instead
describing joke structure, expands into every part of humor, including the aggressive
humor previously described by Superiority Theory. It describes joke structure as a
conflict: “an idea, image, text, or event that is in some sense incongruous, odd, unusual,
unexpected, surprising, or out of the ordinary” (Martin, 2007, p. 6). In this way horror
and humor are closely related—horror also relies on incongruity—but in horror the
incongruity is used to dire effect (Earleywine, 2010; Rothbart, 1996). In humor the
dissonance is meant to be pleasant. The “nonserious or unimportant” tone of the
incongruity gives humor a sense of playfulness, which may prime the cognitive decision
to relax and work through the incongruity (Martin, 2007, p. 6). Others agree; Apter
(1982) divides communication into telic (serious, goal-minded) and paratelic (alongside,
playful) and argues that jokes need to include the playful paratelic side, while Freud,
15
who appeared to have views on every aspect of humor, argued that this playfulness is
necessary to prepare the mind and convince it to participate (Freud, 1989). Thus, part of
humor is a comic, or lighter, frame of mind.
Another part of humor is what is done with the playful state of mind. In
Incongruity Theory there appear to be two structural patterns: incongruity-resolution
and nonsense (McGhee et al., 1990; Ruch, 1992; Shultz, 1996). Incongruity-resolution
creates an incongruity and then resolves it in a unique way. Nonsense creates an
incongruity and then does not fully resolve it.
An example of the incongruity-resolution structure is a joke by Steven Wright:
“Next week I'm going to have an MRI, to find out whether or not I have claustrophobia”
(Wright, 2007). The set-up of the joke, “Next week I'm going to have an MRI,” creates a
serious mood and forces the audience member to think of reasons why he or they might
get an MRI. The success of the joke then depends on the resolution, and how it relates
to our expectations. In Wright's joke, the resolution, “to find out whether or not I have
claustrophobia” presents an incongruity. Claustrophobia is not diagnosed with an MRI
machine. However, it is a diagnosable mental illness. Because phobias are real diseases
and MRI machines are used to diagnose real diseases, the incongruity is resolved when
the connection is made between people being seriously ill and going through a
procedure as part of the diagnosis process (the MRI) that may make them nervous and
potentially more ill. Wright is not going to get an MRI to find out if he is claustrophobic;
he is pointing out that the MRI machine might make anyone feel claustrophobic when
they don’t need any more stress.

16
In this way a joke is characterized as a problem to be solved (Levine, 1969;
Rothbart, 1996), and when it is not solved the listener does not “get the joke.” Research
suggests that resolutions closer to what the listener is expecting are perceived as
funnier (Kenny, 1955; Suls, 1972), though Freud argues that the greater the distance
between the two ideas, the more powerful the effect of the joke (Freud, 1989, p. 147).
Perhaps there is a Zone of Proximal Humor between the familiar and unfamiliar that a
joke must inhabit in order to be perceived as funny.
After incongruity-resolution, nonsense is the second structure in Incongruity
Theory (Ruch, 1992; Shultz, 1996). Nonsense jokes start with the incongruity-resolution
structure but “may 1) provide no resolution at all, 2) provide a partial resolution (leaving
an essential part of the incongruity unresolved), or 3) create new absurdities or
incongruities” (McGhee et al., 1990, p. 124). An example of a joke with a nonsense
structure is: “Q) How did the dinosaur get out of the lake? A) Wet.” The resolution
trades on the dual meaning of the word “how,” where our expectation is a humorous
description of the process of the dinosaur leaving the lake, an adverb. Instead we
receive a description of the state of the dinosaur, an adjective. The incongruity is not
solved, giving “the appearance of making sense out of incongruities without actually
doing so” (Ruch, 1992, p. 32).
Another example of nonsense humor is Curious George (Rey, 1969). In this
popular book and television series an adventurous monkey exhibits characteristics of
both a monkey and a human. This incongruity is never fully resolved—we do not find out
that George is only just a monkey or actually a little boy imagining he is a monkey, or
17
that there is a point to his being a monkey. However, the tension of this oddity helps
maintain interest in what happens. Curious George is wildly popular with young children,
who seem to be fascinated by a monkey having human-like adventures. Children seem
to have a unique appreciation for nonsense humor (Pien & Rothbart, 1976).
Shifting from the structural aspects of Incongruity Theory, Relief Theory tries to
explain the psychological mechanism of humor that gives us pleasure. Why does humor
work?
Relief Theory
The core idea of Relief Theory is that humor gives us relief from tension built up
in other areas of our lives. Freud establishes this concept in his work, building on the
work of Spencer (1911). Freud theorizes that we have psychic energy put into sexual or
aggressive inhibitions that build internal tension, and when someone laughs at a joke
“he laughs this quota off” (Freud, 1989, p. 182). The energy is put to good use; instead
of adding to the existing tension, we feel pleasure when it is released. Laughing is
therapeutic; jokes “come to our help” psychologically (Freud, 1989, p. 121). Freud
compares the mood change that occurs from laughing with that created by alcohol,
arguing that a cheerful mood makes us less inhibited, less critical and more open to
natural pleasures we have suppressed (Freud, 1989, p. 155). The pervasiveness of
humor in every aspect of our lives can be seen as a means of mood control and positive
energy “making accessible once again sources of pleasure which were under the weight
of suppression” (Freud, 1989, p. 155).
18
Humor Theory Summary
These three theories describe different parts of humor. Superiority Theory
describes one type of content—aggressive or denigrating humor. Incongruity Theory
aims more broadly, and describes humor structure: an incongruity, with or without a
resolution, for the audience to solve. Relief Theory suggests a psychoanalytic
explanation of what happens when we enjoy humor: an efficient expenditure of psychic
energy.
Motivation
Motivation, like humor, has a history of thought that can be traced back to early
philosophers like Plato and Aristotle (Schunk, Pintrich, & Meece, 2008). Motivation is
studied in its relation to every conceivable aspect of life, including education. In
teaching and learning several theories of motivation abound; this study will utilize
Keller’s motivational approach for three key reasons. First, Keller gathers research from
a wide range of “concepts, constructs, and theories” and organizes them into an
organized, cohesive framework (Keller, 2010, p. 12). For example, his framework
includes the concepts of intrinsic and extrinsic motivation, state versus trait, and person
versus environmental models. Second, Keller provides an approach that focuses
specifically on the effects on motivation resulting from changes in instruction,
translating the various theories and models into specific strategies to improve
instruction. Finally, Keller provides specific, validated instruments to measure
motivation levels based on the framework (Keller, 1983, 2010).

19
This section will define motivation and then focus on a specific theory, Keller’s
Macro Model of Motivation and Performance, as it relates to the use of humor in
learning.
Definition of Motivation
Motivation comes from the Latin movere—to move. Motivation research focuses
on what makes people move, continue moving, stop, or change direction. Keller defines
motivation as “that which explains the direction and magnitude of behavior” (Keller,
2010, p. 3, emphasis original). For example, if we were to examine motivation for eating
food, we would try to explain what we eat, how much we consume, and when we
consume it.
Keller’s Macro Model of Motivation and Performance
Keller’s Macro Model of Motivation and Performance incorporates theory and
models from a range of sources into a systems model for learning and workplace
performance. It connects the two overarching theoretical approaches to motivation:
variables related to the person and variables related to the environment (Weiner, 1992).
To Keller, the individual brings a combination of factors to the learning situation,
including curiosity, motives, and expectations (Keller, 2010). These individual factors
combine with environmental factors instructors can control (such as motivational design
and management of the learning environment) to produce student performance.
Keller’s theory draws out four personal variables—Attention, Relevance,
Confidence, and Satisfaction (ARCS)—and suggests strategies for changing the
instruction or instructional environment to improve the motivational experience for the

20
learner. His focus is on influencing perception of the personal variables by modifying
environmental variables (Keller, 1983).
Attention
Attention’s nemesis is boredom, and it is the job of both the student and the
instructor to combat this and answer the challenge of “how to stimulate and sustain the
learner’s attention” (Keller, 2010, p. 76). Attention, along with Relevance and
Confidence, can influence the amount of effort a student puts into learning, and can be
modified by the instructor with Motivation Design Management, as can be seen in
Figure 2 below. Keller suggests three overall categories of Motivation Design
Management strategies: perceptual arousal (capture interest), inquiry arousal (stimulate
inquiry), and variability (maintain attention).
Figure 2.1 Representation of Macro Model of Motivational Design and Performance

21
Perceptual arousal is somewhat superficial. It aims to capture people’s attention,
and cannot hold attention for long without other strategies in place. Strategies of
perceptual arousal include referring to specific people, concrete examples, and
presenting with enthusiasm (e.g., voice variation). The key question for perceptual
arousal is “What can I do to capture their interest?” (Keller, 2010, p. 47). Keller suggests
humor in this category—it can “be used to arouse curiosity, but must be used with care.
It can cause distractions rather than increase interest in the subject matter” (Keller,
2010, p. 47). Mayer agrees; while humor may be a means of attracting or keeping
attention (Mayer, 2014), it may be considered an extrinsic motivation for learning.
Extrinsic motivation is external to the student and less stable over the long term,
whereas intrinsic motivation is internal to the student and more stable over time
(Schunk et al., 2008). Instructors should take care to avoid causing a student’s
motivation to shift from an intrinsic motivation, like interest in the topic, to an extrinsic
motivator, such as humor in the classroom (Harp & Mayer, 1998). Students may quickly
adapt to extrinsic motivators (Schunk et al., 2008), requiring the instructor to become
more animated as the semester progresses in order to get the original reaction
(Earleywine, 2010). Thus, humor must be used with care. However, for students without
intrinsic motivation, an extrinsic motivator like humor may increase the amount of
attention students give to instruction. Specific strategies to achieve this balance will be
described later in this chapter.
Inquiry arousal, Keller’s second strategy in Attention, focuses on maintaining
attention through conflict, presenting problems or mysteries to be solved or conflicting
22
statements that need to be reconciled. This is related to the Problem-Based Learning
(PBL) model of instruction that originated and is currently used in medical schools. PBL
frames the class period or course in terms of a problem that needs to be solved through
the application of course content (Neville, 2009). While this strategy is similar to the
incongruity-resolution structure of humor, humor is not included in this category,
perhaps because to be useful the incongruity is prolonged so that the tension created by
cognitive dissonance can focus attention.
The third strategy in Attention is variability. Essentially, Keller suggests using
attention-capturing activities to maintain attention over time. This includes adding
variation in learning materials and learning activities. Variation in learning materials
includes breaking up text with white space or headings; variation in learning activities
includes switching between lecture, discussion, and group work within a class session. It
also includes the use of humor and active presentation styles (Keller, 2010).
While humor affects Attention in Keller’s model, the other three motivational
variables of Relevance, Confidence, and Satisfaction will also be included in this
discussion because learners vary in their motivational preference. The Attention
strategy used in this study, adding humor to instruction, may work for some learners but
not others. There does not appear to be an instrument that reliably measures student
learner motivation in terms of the ARCS framework. Keller suggests that the instructor
complete a motivational analysis based on their knowledge of the students (Keller,
2010). This is not always possible, feasible, nor would it appear to be consistently
accurate, since students may be motivated by different aspects of instruction in ways

23
that cannot be determined by demographic information. However, the effects of one
category of motivation may affect others (Keller, 2010), akin to the way Freud describes
the far-reaching connections of humor to other facts of our minds (Freud, 1989). Thus,
all four categories of motivation will be described and included in this study.
Relevance, Confidence, and Satisfaction
As relevance, confidence, and satisfaction are key terms in Keller’s work, it is of
use to this study to define them here.
Relevance is the perceived value of the instruction for the student: “If the
student has a good feeling about the personal meaningfulness of the material, or
consciously recognizes its importance, then the student will be motivated to learn it”
(Keller, 2010, p. 48). Strategies to make instruction more relevant include determining
student goals and clearly connecting those goals with the content.
Confidence focuses on a student’s sense of control and their belief in their
chances of succeeding in the activity or course. Strategies for confidence include
building positive expectations for success among students and helping them attribute
success in the course to factors they control.
Satisfaction focuses on students’ feelings about their learning experience.
Strategies for improving satisfaction include positive feedback and reinforcement, praise
or rewards, and consistent rules and measurement.

24
Measuring Motivation
Keller created instruments to test student perceptions of instruction. His
Instructional Materials Motivation Survey (IMMS) is used for individual instructional
units (Keller, 2010, p. 277), and will be used in this study to measure student perception
of the instructional intervention. It has been used to diagnose motivation in the use of
varying instructional technology: different media, (Bolliger, Supanakorn, & Boggs, 2010;
Choi & Johnson, 2005; Rodgers & Withrow-Thorton, 2005), computer-assisted
instruction (Galbraith, 2011; Huang, 2006; Song & Keller, 2001; Yang & Chin, 1997),
online medical education (Cook, Beckman, Thomas, & Thompson, 2009; Jang, Hwang,
Park, Kim, & Kim, 2005; Kirkpatrick, 2007; Pittenger, 2010), augmented reality (Di Serio,
Ibáñez, & Kloos, 2013) and others (Allison, 2012).
Multimedia Instruction
In addition to motivation, this study will also examine the importance of the
medium by which instruction is delivered. A number of studies used multimedia as the
delivery mechanism for humorous instruction (Fisher, 1997; Gruner, 1967, 1970;
Tamborini & Zillmann, 1981). Multimedia is an increasingly common distribution
mechanism for instruction of any kind (Houser et al., 2007). For example, Massive Open
Online Courses (MOOCs) offer video lectures from professors at prestigious universities
for a low fee or for free (EDUCAUSE, 2013). Online learning continues to grow in higher
education (Allen & Seaman, 2011, 2013, 2014), and multimedia is easier to produce and
share than ever before. Google reported in January of 2012 that an hour of video was
uploaded to YouTube every second, ten times more than in 2007 (New Scientist, 2012).

25
With the increase in media and the popularity of humorous media, educators would do
well to focus on the role of multimedia in learning.
Media and Motivation
Mayer defines a multimedia message as “a presentation involving words and
pictures” (Mayer, 2009, p. 3), which can range from a narrated PowerPoint of static
images to a full-motion video with sound. Mayer suggests that presenting information in
a multimedia format may be more effective than just hearing information, that words
may be helpful for expressing certain kinds of information while images are more
helpful for others, and that “one picture is not necessarily equivalent to 1,000 words (or
any number of words)” (Mayer, 2009, p. 5). Mayer’s work led him to develop the
Cognitive Theory of Multimedia Learning, which incorporates Dual-Coding Theory (DCT),
Cognitive Load Theory, and Active Learning. DCT suggests that the mind receives and
organizes verbal (words) and nonverbal (images) differently (Mayer, 2009; Paivio, 2007).
In addition, the visual and auditory input systems are different: we may see and hear
information differently (Baddeley, 1992). The mind has the capacity for a limited
amount of information intake, which needs to be carefully managed (Chandler & Sweller,
1991). Finally, the learner is an active participant in the learning process, taking in
information and connecting it to previous learning (Mayer, 1999). With these theoretical
foundations, the theory prescribes specific strategies when designing multimedia
instruction to improve the likelihood that information will be received and connected to
previous learning.
26
Mayer’s Principles of Multimedia Learning
The studies conducted by Mayer and others to build this theory sometimes differ
from traditional lecture-based instruction (Harp & Mayer, 1997, 1998; Mayer &
Anderson, 1991; Mayer, 1989, 2009; Moreno & Mayer, 1999). In a traditional lecture the
focus can be on the instructor; however, in instructional multimedia, the focus tends to
be on the content—the text, images, and sounds of the video—and their combination in
a way that makes the content easier to understand (Clark & Mayer, 2003; Mayer, 2009;
Moreno, 2006).
Mayer posits roughly a dozen principles to guide multimedia instruction
development, bundled in three overall strategies (Mayer, 2009). It should be noted that
Mayer differentiates between measures of retention and transfer, a distinction made in
the current study, where retention is a corollary to knowledge, and transfer is a
corollary to comprehension and application (Mayer, 2002).
Mayer’s multimedia principles are grouped together under different goals
(Mayer, 2009). They will be described along with their attending principles. A summary
can be seen in Table 2.1.

27
Table 2.1
Mayer’s Principles for Multimedia Instruction Development
Reducing Extraneous
Processing
Managing Essential
Processing
Fostering Generative
Processing
Coherence
Signaling
Redundancy
Spatial Contiguity
Temporal Contiguity
Segmenting
Pre-Training
Modality
Multimedia Principle
Personalization Principle
Voice Principle
Reducing Extraneous Processing
The first goal is reducing extraneous processing, which he defines as removing
content that distracts from the lesson. There are five principles that fall under this
umbrella; each suggests that by following the principle, retention or transfer of the
informational content will be improved. The first is coherence, which proposes the
removal of “interesting but irrelevant” words, pictures, and (Mayer, Bove, Bryman, Mars,
& Tapangco, 1996). The next is signaling, which advises highlighting key words and
graphics. Highlights may include organizing words; for example, adding a list with steps
(Harp & Mayer, 1998). Redundancy, the third principle, recommends removing
unnecessary captions from animation with narration; for instance, adding the text of a
narration describing how lightning works (Mayer, Heiser, & Lonn, 2001). Spatial
contiguity suggests putting words next to the graphics to which they are related, such as

28
labeling the parts of a working brake (Mayer, 1989). Lastly, temporal contiguity explains
that learning is improved when words and pictures that are related are presented at the
same time, such as a narration playing simultaneously with on-screen animations versus
before or after (Mayer & Anderson, 1991).
Managing Essential Processing
The next group of principles falls under the heading of managing essential
processing. Segmenting is breaking a multimedia tutorial into pieces whose progression
is under the user’s control, such as a 16-step tutorial that a user controls versus a two-
minute continuous tutorial (Mayer & Chandler, 2001). Pre-training suggests giving an
overall conceptual explanation before digging into details (Mayer & Mathias, 2002),
while modality supports using pictures and spoken words in a presentation rather than
pictures and written words (Mayer & Moreno, 1998).
Fostering Generative Processing
The last group of principles are known collectively as Fostering Generative
Processing (Mayer, 2009). Within this, the Multimedia Principle suggests that we learn
from pictures and words better than words alone (Mayer & Gallini, 1990). The
Personalization Principle suggests using informal instead of formal language (Moreno &
Mayer, 2000). The Voice Principle suggests using vocal cues that improve the sense of
social connection with the learner (Mayer & Sobko, 2003).
Mayer points to a great deal of research to conclude that using these specific
strategies can improve learning by minimizing extra cognitive load, maximizing the use
29
of existing cognitive processes, and improving generative processes in multimedia
presentations (Mayer, 2009).
Seductive Text
Mayer’s focus on content and media instead of a person may be a factor in the
tension between the motivational aspect of humor in instruction and his principles
related to multimedia learning. Most of Mayer's principles, before the more recent
study on Personalization and Voice Principles in 2004, only focused on the cognitive
aspects of learning, leaving out affect and motivation, an area Mayer admits has been
understudied (Mayer, 2014). Mayer may classify humor as an Emotional interest adjunct,
or “added material that is entertaining but irrelevant to explanation” (Harp & Mayer,
1997, p. 95). Borrowing the term seductive text, which describes details slightly or not
related to important information in a text (Garner, Brown, Sanders, & Menke, 1992, p.
242), Harp & Mayer tested seductive text and seductive illustrations in recall and
interest. This is related to Mayer’s principle of coherence (Mayer, 2009). In a 1997 study
conducted with undergraduates, they created four conditions (n=74), one with no
additional material (n=19), one with seductive text (n=17), one with seductive
illustrations (n=18), and one with both seductive text and illustrations (n=10). Seductive
details in this case refer to unimportant details—information students do not need to
understand the concept. These might be called “fun facts.” For example, when
explaining how lightning works, the added seductive text read: “In trying to understand
these processes, scientists sometimes create lightning by launching tiny rockets into
overhead clouds” and the seductive image was an image of a rocket launching base
30
(Harp & Mayer, 1997, p. 94). Students were randomly assigned to conditions. They used
self-reported knowledge of meteorology as a pre-test, and after the instruction
measured interest, recall, and problem solving. Recall was measured with an open-
ended question, “Please write down everything you can remember from the passage”
and problem-solving was measured with four open-ended questions; for example,
“What could you do to decrease the intensity of a lightning storm?” (Harp & Mayer,
1997, p. 96). Recall items were scored with one point for identifying each of eight key
ideas, and problem-solving items were scored with one point for each acceptable
answer.
Results indicated that in recall, the condition with no seductive details
significantly outperformed the other three, and the two conditions with either seductive
text or illustrations significantly outperformed the condition with both. Summarizing in
terms of cognitive load theory, the seductive text and illustrations took up cognitive
space meant for more critical information, and when combined, this effect was
increased. In the problem-solving measure, the condition with no seductive details
significantly outperformed the seductive text-only and seductive text and illustrations
conditions, but not the seductive illustrations-only condition. In short, the seductive
illustrations-only condition did not appear to be as detrimental as the seductive text-
only condition or the combination of both. Interestingly, their measure of interest, a
simple Likert scale, showed no significant difference between conditions, and Harp &
Mayer conclude that “adding seductive detail hurt student learning of a scientific
explanation” (Harp & Mayer, 1997, p. 100).
31
This study has few limitations. The lack of pre-test was made up for by a specific
self-diagnosis survey, and students were randomly selected for groups. Informational
content over which students would be tested was equal in each group. However, in the
seductive text and illustrations condition, the captions under the illustrations repeated
content from the seductive text, perhaps indicating importance to the reader, who was
not tested on that information. In addition, the interest manipulation test failed.
The lack of significant difference in perception of interest was followed up by
another study described in the same article in which students (n=84) assessed the same
materials for “emotional” or “cognitive” interest on four questions (two questions for
emotional and two for cognitive interest) with a 10-point bipolar adjective scale (Harp &
Mayer, 1997). Students rated the base material as significantly more cognitively
interesting and seductive text and illustrations as significantly emotionally interesting.
This second study has two major limitations. First, to separate the seductive
details and explanative illustrations from the base text so they could be rated for
interest, they were highlighted with different colors (seductive text = yellow, seductive
illustrations = orange, explanative illustrations = green). The base text was not
highlighted. Thus a consistent pattern was indicated to students, who could have quickly
determined what was being requested. In addition each category was tested
individually—yellow, orange, and green—which would have helped students confirm the
pattern. A more robust test would have randomly highlighted different sections and
tested them randomly or all at once. This leads to the second limitation: a textual
analysis does not equate with students perceiving content to be more interesting when
32
included in the instruction as a whole. When seductive details appear next to important
details, if they are not somehow labeled as seductive, students may perceive them to be
important or of related importance. Implicit in other studies on seductive detail (see
Garner et al., 1992) is that instruction from which students are to learn isoften poorly
written, with the most important details buried under less important details, suggesting
the need to organize content in a way that emphasizes the most important content.
Unrelated humor may differ from seductive detail because it may be apparent to
the student that it is playful and not disguised as critical (Apter, 1982). If it is perceived
as humor, it may be that students will not identify it as a detail that needs to be recalled
later. Related humor, like humorous examples that help explain the content (Ziv, 1988)
may not fit under the category of seductive detail because of their instructional
importance.
However, in cognitive load terms, humorous content may still take cognitive
space needed by more important information. For example, the idea of attentional
switching suggests that energy spent on humor is a detriment to energy spent on the
central content, particularly in media (Zilmann, Williams, Bryant, Boynton, & Wolf,
1980). Perhaps for this reason it is advised to use humor sparingly (Earleywine, 2010;
Keller, 2010; Mayer, 2014; Ziv, 1988), and Mayer’s model of Multimedia Instruction
does not include affective components. Still, cognitive psychologists argue that affect
has been neglected until very recently (Dai & Sternberg, 2004; Linnenbrink & Pintrich,
2004). Motivation theory states that interest, attention, and other affective components

33
play an important part in motivating people to learn (Hidi, Renninger, & Krapp, 2004;
Keller, 1987, 2010).
A recent theory combines Mayer’s approach with affective components.
Moreno’s Cognitive-Affect Theory of Learning with Media (CATLM) (Moreno, 2006)
includes motivation and affect as potential influences on the learning process, allowing
for the influence of factors outside a strictly cognitive approach. She measures
motivation along with learning outcomes (Moreno, 2009). There is a call for more
research on the topic; after their literature review on humor and education, Banas et al.
suggest that “researchers interested in studying instructional humor may also consider
investigating the role of technology in humor. As online classes and interactive options
increase, there are new opportunities and challenges for integrating humor into
instruction” (Banas et al., 2011, p. 138). This research is one answer to that call.
Humor in Education
We transition now from theory to practice. We will briefly return to theory to
touch on humor and gender, which leads to humor in power dynamics like classroom
instruction. Then we will examine humor in instruction, which has been studied in
different instructional situations, examining factors such as instructor evaluations,
classroom environments, and effects on learning. Results from these studies vary and
sometimes contradict each other. This section will review those studies.
Instructor Evaluations
Humor is appealing as a personality trait. In advertising research, humorous
commercials affect likeability of a brand more reliably than other factors, such as

34
remembering or trusting the brand (Weinberger & Gulas, 1992). Popular leaders with a
sense of humor may appear to be more human or insightful through personal stories
(Jonas, 2004). According to Relief Theory, humor can produce a pleasant feeling akin to
alcohol consumption (Freud, 1989), which may improve perception of the humorist by
association. However, instructors may be concerned that adding humor, even if it
results in increased likeability, may damage their credibility as an authority on a topic.
Several studies have examined this concern.
In a study conducted with students from a professional speaking class, Gruner
(1967) randomized students into two conditions (64 in each) who heard a recorded non-
humorous speech or a version with humorous additions. Gruner determined via a valid,
bipolar adjective scale developed by Smith (1959) that students did perceive the
humorous speech to be more humorous than the non-humorous speech. Speaker traits
were measured with a scale developed by McCroskey (1966). The first trait, character,
used adjectives like pleasant, honest, admirable, and the second trait, authoritativeness,
used adjectives like reliable, qualified, and high status. In the results, students rated the
humorous speaker significantly higher on character, with no difference in ratings of
authoritativeness. In other words, adding humor to the speech improved students’
perception of the speaker’s likeability but did not detract from the speaker’s credibility.
(Gruner, 1967).
This study was well-designed, with one limitation in light of other studies
examining credibility – the instructor was male, and a female counterpart was not
tested. However, this did not appear to be within the scope of the research questions.

35
Gruner did an additional study (1970) with the same speech to focus on the findings
related to perception of interesting content. This time he created four conditions:
humorous-interesting, serious-interesting, humorous-dull, and serious-dull (Gruner,
1970). The original speech from the 1967 study was used for the humorous-interesting
condition, and personalizing information was removed to create the dull conditions.
Gruner added twenty-two humorous items for the humorous conditions. The interesting
speeches were recorded with an enthusiastic voice, the dull speeches in monotone.
Students rated the humorous speeches as significantly more funny, and the
interesting speeches as more interesting, ensuring the treatment was perceived as
intended. Gruner found that the “addition of humor made the ‘dull’ speech more
interesting, but did not make the ‘interesting’ speech more interesting” (Gruner, 1970, p.
164), perhaps indicating a ceiling effect for the perception of interesting content, at
which adding humor could not increase perceived interestingness. Students in both the
humorous and interesting conditions rated speaker character significantly higher, with
the interesting factor having a stronger effect than humor. Students in both the
humorous and interesting conditions rated the speaker significantly higher on
authoritativeness. In other words, both interestingness and humor increased the
perceived likeability and credibility of the speaker. Gruner’s second study (1970) was
limited in participant selection—students were not randomly selected for treatment,
though they were matched for analysis. In addition, the dull speeches were performed
differently than the interesting speeches; thus, another factor in addition to humor was
being measured. Others (Keller, 2010; Mayer, 2009) mention voice modulation as an

36
attention getting and keeping strategy; the use of it here may have confounded the
results.
Bryant and his associates also examined the connection between an instructor’s
use of humor in class and student evaluations (Bryant et al., 1980). Their design was a
qualitative analysis of many instructors’ existing lessons. A single student from each of
70 different pre-selected university courses recorded audio of a lecture and filled a
bipolar adjective scale with 21 measurements per item (numbered from -10 to +10,
including 0 with marks on each integer) on 13 items, labeled extremely ______ on either
end. Extremes included poor-articulate, lethargic-dynamic, boring-entertaining, dry-
funny, unappealing-appealing and others (Bryant et al., 1980, p. 514). Students later
transcribed portions of the recorded lecture meant to be humorous, which were cross-
checked and revised by another student. The researchers categorized humorous parts
based on a framework from a previous study (Bryant, Comisky, & Zillmann, 1979). This
framework included structure (e.g., joke, riddle, funny story), content (e.g., sexual,
sexual hostile, nonsense), and relationship to educational message (related, distracting).
The students recorded and rated 49 male and 21 female instructors. The instructor
evaluations factored statistically into three categories: appeal, competence, and
delivery (Bryant et al., 1980, p. 515).
Results showed interesting divisions along gender lines. Students rated male
instructors higher on competence and significantly higher on effectiveness, appeal, and
delivery when they used humor more frequently. They rated female instructors higher
on appeal and lower on competence when they used humor more frequently. The

37
structure of the jokes mattered: funny stories improved perception of effectiveness,
appeal, and delivery for male instructors, puns decreased perception of competence for
female instructors. Whether or not humor was distracting, male instructors were
perceived as more appealing, whereas female instructors were rated lower on all factors
(effectiveness, appeal, competence, and delivery) with increased use of distracting
humor. Female use of distracting humor was the only significant negative correlation
with competence. The highest positive correlation was male-instructor appeal and their
use of non-distracting humor (humor perceived to be related to course content). In
other words, male instructors could joke on or off topic without affecting their
credibility, but female instructors could not.
Another interesting finding was that students perceived male instructors as
more appealing when using sexual humor, and female instructors were more appealing
when using aggressive and sexually aggressive humor. In discussing the results, the
authors suggest students may stereotype instructors, accepting jokes from male
instructors and perceiving jokes from female instructors as breaking an unwritten rule
about classroom conduct. Further, when female instructors use aggressive humor, it
may push them into a degree of authoritativeness that becomes acceptable again
(Bryant et al., 1980). This latter view connects to the Superiority Theory of humor, as the
aggressor is perceived as more powerful when they use denigrating humor in a
societally accepted way. It appears that the complex social nature of humor makes it
difficult to untangle from social norms. Limitations of this study are few. Because of the

38
nature of the results, it would have been valuable to know the gender of the student
evaluator.
Tamborini and Zillmann (1981) remedied the limitation of knowing the gender of
the student in a follow-up study. The study had four conditions: no humor, sexual
humor, other-disparaging humor, and self-disparaging humor. The study also included
two gender conditions for the instructor, male and female, and student gender was
noted. The treatments were applied to an audiotape introduction to a fictitious lecture.
The three humorous conditions were tested on four males and four females who found
no significant difference in funniness between them. Students (n=100, 50 male, 50
female) were randomly selected for each condition. Students rated the speaker on “23
bipolar adjectival scales,” with three distractors, similar to the bipolar scales in the
Bryant et al. study (1979). Items included repulsive-attractive, nice-nasty, and dull-witty,
etc., which were factored to appeal and intelligence (Tamborini & Zillmann, 1981, p.
429).
Results indicated that students found self-disparaging humor significantly more
appealing if the instructor was their gender, and significantly less appealing if they were
not. The opposite was true for sexual humor—students found instructors of the
opposite gender significantly more appealing when they used sexual humor. Humor did
not affect perception of intelligence—in other words, instructor credibility was not
affected. The authors suggest determining the majority gender in a course before using
either type of humor in order to avoid alienating students. No major limitations were
found in this study. In terms of the Superiority Theory, the study further delineates

39
gender boundaries for acceptable use of aggressive humor by the instructor in the
university context.
Shifting from live instructors, another study looked at humor in textbooks.
Students who read a chapter from an assortment of textbooks reported they found an
increase in humor related to higher enjoyment, but not interest, persuasiveness, or the
desire to read more (Klein, Bryant, & Zillmann, 1982). An increase in unintended humor
and nonsense humor was related to a decrease in perceived credibility of the textbook
author. The researchers suggest, with some surprise, that perhaps humor in textbooks
should be limited in order to avoid a loss of credibility (Klein et al., 1982). This may be
indicative of the difference in medium between a live instructor and book. Since
sections of a book can be skipped, perhaps it’s important to ensure only important
content is included. Since sections of a lecture cannot be skipped, humor may provide
relief within the time constraints of the lecture.
To summarize the studies about perception of instructor humor use, an increase
in humor may improve student perception of likeability. Factors such as type of humor,
humor content, target of humor, gender of instructor, gender of student, and
relatedness to topic may affect perceptions of credibility and appeal. Finally, humor in
textbooks should be used with caution.
Classroom Environment
The classroom environment is another factor that can be affected by humor use.
Ideal learning environments provide a safe, challenging, and engaging place for students
to learn. The Relief Theory dictates that the use of humor should produce a positive
40
feeling, which may improve the general atmosphere of the class. The following studies
examine the effect of humor on the learning environment.
Askildson surveyed students and instructors about linguistic humor in a second-
language learning classroom (Askildson, 2005). He surveyed 236 second-language
students and 11 instructors. A majority of students (72%) reported “use of humor
increased their interest in subject matter (learning a language in this case) from a
noticeable to a considerable degree, while 100% (11) of teacher responses indicated an
identical perception” (Askildson, 2005, p. 54). In other words, all 11 instructors
perceived that their use of humor increased student interest in the instructional content,
and more than 70% of students felt the same. Students and instructors also perceived
that humor made the students more relaxed (students: 78%; instructors: 64%), the
instructor more approachable (students: 80%; instructors: 82%), and created a more
comfortable learning environment (students: 82%; instructors: 100%) (Askildson, 2005).
Limitations of this study include lack of validity or reliability of the survey instrument
and comparative indices to ensure equality among the students, and more importantly,
no measure of current humor usage by the instructor, instructor or student
demographics.
In a different study, Berk & Nanda measured students’ attitude towards course
content (statistics), anxiety towards math, and perceived usefulness of course content
with one undergraduate and two graduate nursing statistics courses (total n=142) (Berk
& Nanda, 1998). They measured these attitudes at the beginning and the end of a
course. The course included humorous strategies like opening jokes, humorous

41
examples, and a Jeopardy!-style review for exams. Results showed all three sections
expressed significantly less stress about math and statistics. Two of the three sections
expressed significantly less stress about statistics, and all three less stress about the
course. One section improved significantly in perception of usefulness of course content.
The authors suggest the humor used in the sections improved attitudes towards course
content and math. Limitations included the lack of a control group and randomization,
particularly when measuring anxiety towards statistics, which may naturally decrease
when taking a statistics course. The authors also admit the reduction in anxiety might
have been due to the open-book exam policy.
From the instructor’s perspective, a survey of high school teachers (n=388)
indicated that they used humor more often as a classroom management tool:
…As a way of putting students at ease, as an attention-getter, as a way of
showing that the teacher is human, as a way to keep the class less formal,
and to make learning more fun, and not as a pedagogical strategy for
increasing student comprehension or learning” (Neuliep, 1991, p. 354).
Using humor to improve the learning environment is a strategy confirmed by
Buckman in her dissertation research. Through interviews with college professors
known for humor in the classroom (n=10) she found they “constructed very student-
centered, positive classroom climates,” were aware of how humor affected their
connection to students, and were careful about the kind of humor they used (Buckman,
2010, p. iv).

42
In an online class, an instructor contributed more humorous content in
discussion groups, links to humorous YouTube videos, and humorous announcements
the second semester she taught a course (Anderson, 2011). When compared to the two
sections from the previous fall semester (n=58), the two humorous sections the
following summer (n=71) had significantly more discussion postings, higher ratings on
course evaluation data related to the online environment, value of content, and
recommendation of the instructor to teach further courses, as well as positive
comments about the instructor’s humor and warmth. This suggests students were more
motivated by a more positive learning environment brought about by the use of humor
(Anderson, 2011). Limitations of the study include lack of randomization, validity of
instruments, and details of humor use.
Perception of the classroom environment may be related to concepts in the
ARCS motivational model. For example, Keller describes Satisfaction as asking, “What
can I do to help the students feel good about their experience and desire to continue
learning?” (Keller, 2010, p. 45). The good feelings and sense of community created by
humor in the classroom may serve as a reward for participating in the course. In
addition, the concept of relevance is related to a student’s sense of connection, not only
to the content, but to the learning environment. In addition, the use of humor,
particularly in the case of Berk and Nanda’s study of statistics, appears to lower anxiety,
which may increase confidence (Berk & Nanda, 1998). Thus, perception of the course
environment can be seen as related to students’ perception of motivation in the ARCS
framework.

43
The studies in this section appear to indicate that humor can improve perception
of the learning environment and course content, and may influence engagement.
However, many educators are more concerned with the effect of humor on
performance in the class. Can jokes help students learn?
Effects of Humor on Learning
In the section on learning of their recent literature review on humor in education,
Banas et al. state: “although the research assessing the impact of humor on actual
learning is rather mixed, there is substantial empirical evidence that humor can enhance
recall and aid learning” (Banas et al., 2011, p. 137).
Positive Effects on Learning
Gibb measured the effect of humor on college freshman in an introductory
speech course. The content was related to biology, and the assessment mechanism was
the state biology exam. Pre-tests required of all incoming freshman were done the
previous semester (Gibb, 1964). Treatments included a recorded audio lecture with
three conditions: no humor (Control 1, n=72), the same lecture with humor (Experiment,
n=131) and the same lecture with additional repeated content to match the length of
the experimental condition (Control 2, n=106). The lecture was about 13 minutes long.
Results indicated that the experimental group outperformed both control 1 and control
2 groups on the recall test immediately after the lecture at the p<.01 significance level.
Three weeks later the same test was given, and the experimental group outperformed
the control 1 group at the p<.05 level and outperformed the control 2 group but not

44
significantly. Thus, in this study humor use in the short lecture appears to have
improved recall in both the short and long term.
Limitations of Gibb’s study include unequal content in treatments. In control 2
points in the lecture were reiterated, which fundamentally changed the content. In
other respects, such as the comparison between the control 1 and the experimental
group, the study is well designed—the humor is relevant but does not help illustrate
content, the study size is large, conditions were alternated throughout the day, and a
pretest was used, although it was administered in the previous semester.
Kaplan and Pascoe examined the effect of humor on comprehension and
retention in an undergraduate psychology course (n=508) (Kaplan & Pascoe, 1977).
Students watched one of four 20-minute videotaped lectures. The lectures taught six
concepts. One video included no humor (serious), one included a humorous example for
each concept (concept), one a humorous example for three of the six concepts and
other non-concept related humor (mixed), and one video included non-concept related
humor (non-concept). Participants took a multiple-choice test with 11 items, half based
on content from the examples (example-based), and half based on other content in the
lecture (non-example based). Students took the test immediately after watching the
video, and again six weeks later (Kaplan & Pascoe, 1977).
In the test immediately after the video (n=477), there was no significant
difference between groups on example-based items. However, the concept group
scored significantly lower on non-example-based items. Interestingly, six weeks later
(n=299), the concept group scored significantly higher on the example-based items, with

45
no significant difference on non-example-based items. In other words, participants in
the concept group did significantly worse in recalling the items not related to the
humorous examples right after the video, but did significantly better remembering
those items six weeks later. Kaplan and Pascoe suggest that the “positive effect of
humorous examples only results when test items are based on those particular
examples” (Kaplan & Pascoe, 1977, p. 65).
Kaplan and Pascoe’s study has a few key limitations. The categorization of
concept-related and non-concept-related humor is unclear. Specifically, the example
given for non-concept-related humor appears to be related to lecture content, and it is
unclear how the examples of concept-related humor are related to lecture content. This
is problematic in using this framework (relation to concept) to delineate between items.
In addition, their treatments are unequal—the concept group received six content-
related humorous examples, the mixed group received three, and the serious and non-
concept groups did not receive any. In other words, the instructional content was not
equal outside of the humor content. The concept group received more instructional
content than the other three, and the mixed group received more instructional content
than the serious and non-concept groups. Finally, assessments were unequal. The
authors state that six of the 11 items were based on the six humorous examples from
the concept version of the video, meaning the mixed group was tested on three items it
had seen before and three it had not, and the serious and non-concept groups were
tested on items they had not seen before. The concept group scored higher on these
items on the test immediately after the video and significantly higher on these items six

46
weeks later, but that would be expected if they were the only group that received all of
that content.
In a study that used humorous educational multimedia, Zillmann et al. created
four short educational segments, each between 2-5 minutes, for kindergarten and first
grade children (n=70) (Zillmann, Williams, Bryant, Boynton, & Wolf, 1980). They tested
the addition of eight 30-second humorous, unrelated clips (“taken from several
televised cartoon and Muppet programs”) at different intervals: roughly every 100
seconds (fast-paced), and roughly every 200 seconds (slow-paced) (Zillmann et al., 1980,
p. 173). They tested for recall of each segment, overall interest and enjoyment,
funniness, and attention to the screen. There were five conditions as follows: A) no
humor (which was shorter, with no humorous segments), B) fast-paced with humorous
inserts, C) slow-paced with humorous inserts, D) fast-paced control with blank screens
in the place of humorous inserts, and E) slow-paced control with blank screens in place
of humorous inserts. Two children at a time were placed in front of a TV with a selected
condition, and aids watched the students' reactions and then verbally gave the
assessment. Results indicated that participants recalled more from both humorous
conditions (B and C) overall. Interestingly, recall for the first segment was slightly higher
for the no humor (A) and fast-paced control (D) conditions, but for later segments the
humorous conditions (B and C) were significantly higher. The fast-paced condition (B)
improved recall with each subsequent segment. The fast-paced condition had
significantly higher enjoyment and interest scores. Their conclusion was that sprinkling

47
in humor for children’s educational programs increases attention and improves learning
(Zillmann et al., 1980). In another study with positive learning gains, Ziv performed two semester-long
controlled experiments, one in statistics and one in psychology (Ziv, 1988). Both
followed the same design, utilizing one control and one experimental section taught by
the same teacher during the same semester. The instructor added three to four
humorous concept-related examples per class in the experimental section. Both sections
took a 50-item multiple-choice exam at the end of the semester. Both courses had
roughly equivalent numbers of participants in the two sections (statistics: control=79,
experimental=82; psychology: control=67, experimental=65). In both courses, the
sections with humorous examples scored significantly higher on the exam, which Ziv
attributed to his strategy for humor inclusion: 1) explain a concept, 2) illustrate the
concept with a humorous example, and 3) review the concept (Ziv, 1988, p. 10).
Ziv’s study has a few limitations. First, it lacks a pre-test, which was feasible in a
study of this length without conditioning students unfairly to the assessment. It also
lacks randomization. Like Kaplan & Pascoe, the treatments were unequal. Without
comparable non-humorous examples, students in the control sections missed three to
four conceptual examples per class that the experimental sections received. Whether or
not the examples were humorous, the experimental sections received more content-
related information, which may explain their higher scores on the assessment.
A similar problem occurs in Kothari, Rana, and Khade’s study of undergraduates
in an international marketing course (1993). Results of the spring term are discussed

48
here (the pair of fall term sections were described as unequal by the authors). In the
spring term, two sections of the same course were taught by the same instructor. The
control section (n=29) used no humor, and the experimental section (n=26) received a
short monologue at the beginning of class using recent events related to course content.
For example, an instructor related a mistranslation of a beer slogan, “Turn It Loose,”
into Spanish, which rendered it to mean “Our beer causes diarrhea,” in order to
exemplify communication problems in marketing (Kothari et al., 1993, p. 39). The
instructor connected the monologue to course content and led a brief discussion about
it. No other interventions were reported. Grades for the humorous section were
significantly higher (81%) than the control group (72%) (Kothari et al., 1993, p. 40).
Limitations of the study include those mentioned earlier in Kaplan & Pascoe and
Ziv’s studies: the experimental group received additional examples, and in this case,
group discussion, giving them an educational advantage unrelated to the variable of
humor. As in Ziv’s study, no pretest was performed, nor were students randomized.
Finally, the use of final grades as assessment measures confounds instructional gains
from only the items to which the humor was applied. Students may have appeared to
perform well in the course regardless of their experience with the instructional
intervention.
The final example of a study with positive learning gains comes from Ghaffari
and Mohamadi (2012), who examined the effectiveness of a humorous context on
Iranian students learning words in English. They filtered down to 77 participants by their
score on a standardized English placement test—students with too low or high a score

49
were removed from the study. In a clever design move, they separated out a pilot group
(n=19) to evaluate humorous materials. The rest of the students were divided into a
humor group (n=24), a non-humor group (n=17), and a comparison group (n=17), all
spread across two or three classes. The pilot group rated humorous texts gathered from
the Internet and texts below a certain threshold were dropped, leaving 20 to use. These
jokes became the instructional content, as the pilot group underlined words they did
not know from the jokes as the central focus of learning. These words were given to the
participants in the other three groups and words known by even one participant in the
other groups were removed, leaving 62 vocabulary items.
For the posttest, 124 questions were developed for the words: 62 receptive-
mode multiple-choice questions and 62 productive-mode fill-in-the-blank items.
Receptive mode can be defined as passive understanding without having to generate
content, whereas productive mode requires the learner to generate answers on their
own (British Council, 2014). The 124 items were given to two similar groups outside the
treatment, with one group receiving the receptive items and the other the productive
items, and items within a range of discrimination and difficulty were included in the final
group of 98 questions.
The punch lines of the 20 humorous texts were changed for the non-humor
group and examined by native English speakers, who thought only three did not appear
to sound natural, thus both groups had almost identical contexts in which the words
were used.
50
These 62 words were used in the instruction during seven sessions (three times a
week for three weeks). The humor group learned the words in the context of the intact
humorous texts, while the non-humor group learned the words in the context of the
modified, non-humorous texts, and both groups practiced the words within their
context for a half hour during each session. Learning sessions were followed by various
assessments like true/false or fill in the blank (Ghaffari & Mohamadi, 2012). In the
session following the treatment, 20 productive assessments were given to all three
groups, followed by 20 receptive assessments. Three weeks later a second posttest was
administered in which they were given assessments for different words, again 20
productive and 20 receptive (Ghaffari & Mohamadi, 2012).
A one-way ANOVA indicated that the humor group significantly outperformed
the non-humor group on receptive assessment at the p=.001 level, and on productive
items at the p=.002 significance level. The second posttest three weeks later followed
the same pattern again on both receptive and productive items, where the humor group
outscored the non-humor group at the p=.001 significance level. Overall, participants
scored higher on the receptive items than the productive items. The comparison group
in the study used no context to practice the vocabulary words, used less time in the
lessons, and, interestingly, outperformed the humor group significantly on all tests, but
was not described in detail because the instructional approach does not fall within the
purview of the current study.
There is much to admire about Ghaffari and Mohamadi’s study. While the
selection process for each group was not clear and the sample size was modest, every

51
other aspect of the study appears to have been well designed: selection of the humor,
design of parallel texts, the test and retest approach. In addition they eliminated
confounding factors such as students with previous knowledge, previously known
content, and overly easy or difficult assessment items. They cleverly avoided the
problem of unequal treatment by making the humor itself the content for one group
and removing the resolution from the incongruity-resolution structure for the other. The
percentage of content the punchline represented was not described, therefore,
depending on its proportion of the total context, unequal treatments could be implied.
An interesting aside is that informal feedback from the participants indicated that
students in the humor group rehearsed the jokes to memorize them, which may have
improved learning (Ghaffari & Mohamadi, 2012). Aside from its brief limitations, the
results from this study indicate a hopeful direction for the use of humor, if only in the
ESL (labelled in their study as “EFL”) classroom. This study represents the only rigorously
designed research found showing improvements in learning gains with humor
incorporated into instruction.
No Effects on Learning
While the studies just described focused on positive outcomes, other studies
show no improvement in learning. For example, in a study done with students in a
professional speaking class, Gruner (1967) randomized students and played them an
audio speech. Two sections of a class were randomized into four groups with the same
two conditions: the control group (n=64) heard the speech without humor, and the

52
experimental group (n=64) heard the speech with additions of selected humor. Gruner
added four humorous items in the introductory paragraph of the speech and three more
in the second paragraph. He added five additional items evenly through the rest of the
speech (the length of the speech was not specified). Gruner measured learning with a
25-item multiple-choice test, whose validity he ensured via a panel. He found no
significant difference in their retention scores (Gruner, 1967).
Gruner’s study was well-designed. He took additional precautions, including
using a panel to determine relatedness of learning assessments, and ensured that the
experimental version of the speech was perceived as more humorous (it was) with a
bipolar instrument developed by Smith (1959). Limitations of the study include the lack
of specificity about the type of humor and its relation to the content.
Gruner did an additional study with the same speech (n=144), this time with four
conditions: humorous-interesting, serious-interesting, humorous-dull, and serious-dull
(Gruner, 1970); interesting was defined by the Flesch Human Interest scale. Twenty-two
humorous items were added to the speech, and the interesting speech was recorded
with an enthusiastic voice, the dull speech with a monotone voice. Students found the
serious-interesting speech the most interesting, and more interesting than the
interesting-humorous speech. Gruner found that learning improved along interest but
not along humor lines (Gruner, 1970). The limitations described in the review of this
study in the Instructor Evaluations section above apply to the learning results as well:
since the dull speeches were performed differently than interesting speeches, this may

53
have created a confounding variable, an idea pointed out by Mayer in the Voice
Principle (Mayer, 2009).
Negative Effects on Learning
One study found that humor negatively affected learning. In a study performed
on visitors to a planetarium, Fisher added a single line of humor to 10 of 20 concepts in
a recorded presentation (Fisher, 1997). Participants (n=495) were visitors to the
planetarium over the age of 18 with a wide demographic background. After a 5-minute
live introduction, he showed humorous and non-humorous versions of a 15-minute pre-
recorded presentation. Humorous additions were added roughly every 90 seconds. For
example, when pointing out Saturn with the planetarium’s pointer, the narrator added,
“You won’t see this arrow in the sky outside. Trust me,” (Fisher, 1997, p. 708). The non-
humorous version had silence in the place of the humorous additions. Immediately after
the presentation participants took a 20-item test based on the non-humorous script of
the presentation. Participants who watched the non-humorous presentation (n=250,
mean=13.6) scored slightly but significantly higher than those who watched the
humorous presentation (n=245, mean=12.8). Fisher postulates that too much humor
may have been added, or at too fast a pace, confusing the audience. This connects to
the ideas of careful use of humor to avoid distraction, as suggested earlier, signifying
that a moderate approach may be most successful (Earleywine, 2010; Keller, 2010;
Mayer, 2014).
54
This study was well designed with few limitations. Fisher categorized the
humorous additions as content-related according to Kaplan & Pascoe’s categorization,
though a review of the humorous content does not confirm that they belong in that
category (Fisher, 1997, p. 707). While Fisher appeared to misunderstand this
designation, it was a strength of the study because the humorous content did not relate
and the informational content was equal between treatment. A helpful addition to the
study, particularly in this context, might have been measuring participants’ perception
of the two versions. A more entertaining community planetarium presentation may
have been a more positive informal educational experience, even at the loss of one
knowledge point.
Summary of Effects on Learning
A persistent limitation in studies related to humor and learning is unequal
treatments between conditions. One of the best practices in humor usage in the
classroom is using examples related to the content (Bryant et al., 1980; Ziv, 1988), which
is very difficult to implement in a study. Unless examples are equal between conditions
(except for the addition of humor), the comparison is not between humor and non-
humor, but two different types of examples, one of which happens to be humorous. As
an instructional strategy humorous examples have value, but the combination of an
interesting, humorous example confounds the examination of humor as its own entity.
It does add to the research on the power of examples in learning (Gruner, 1970).
However, without more studies with positive outcomes and the level of research design

55
rigor displayed by Ghaffari & Mohamadi (2012), it’s difficult to conclude if the literature
indicates that humor improves learning one way or the other, indicating that additional,
rigorously-designed research should be conducted.
Strategies for Humor in Education
Shifting from the question of whether humor can improve learning, we now
focus on the question of how humor can improve learning, discussing specific strategies
for incorporating humor into the classroom.
Humor Placement and Amount
Ziv (1988) suggests using humor three to four times per class period, but not the
same number of jokes in every class, and in some classes no humor at all. Keller
confirms the need for using humor judiciously (Keller, 2010). The beginning of class
appears to be a good time to include humor (Beebe, 2007; Keller, 2010; Kothari et al.,
1993). Tests may not be a suitable place to include humor because they are not a playful
environment (Torok, McMorris, & Lin, 2004); neither is in the middle of problem-solving
because it is not perceived as a playful environment (Rothbart, 1996).
Humor Content
Research suggests that humor content is more effective when related to course
content since humorous examples may help to illustrate points (Earleywine, 2010;
Kaplan & Pascoe, 1977; Keller, 2010; Ziv, 1988). Gilliland and Mauritsen add, “classroom
humor is most effective when it is pertinent to the situation, personable, original, and
contains something of the personality of the teacher or the child” (1971, p. 754).

56
Ziv introduced a simple 3-step process for using jokes related to content in a
classroom (Ziv, 1988). First, teach a concept. Second, share a joke or cartoon that
illustrates the concept. Third, review the concept in light of the humorous example. Ziv
also created a training program for instructors on how to use humor (Ziv, 1988). The
workshop included assignments to find relevant humor for the topic, and instructors
who participated in the workshop (12 out of 60 who applied) were handpicked based on
their responses to a humor styles questionnaire (Ziv, 1988). This suggests two ideas:
humor can be prepared beforehand with careful planning, and not everyone is equally
disposed to use humor regularly to positive effect.
Because of the potentially positive effects of humor on the classroom
environment, it is important that everyone feel safe. Thus, content that targets specific
students, or is sexual and aggressive, including jokes made at the expense of gender,
race, or sexual orientation, may alienate students (Hativa, 2000; Korobkin, 1988;
Wanzer, Frymier, Wojtaszczyk, & Smith, 2006). The case for self-deprecating humor is
less clear. This is a difficult issue for the humor-user, since aggressive humor has been
shown to positively influence credibility but alienates students, while self-deprecating
humor may decrease credibility (Andeweg, Gagestein, de Jong, & Wackers, 2011;
Tamborini & Zillmann, 1981; Zilmann et al., 1980).
Humor in Library Instruction
Humor has been suggested in library instruction as a means of lightening what
may be perceived as dry topics; for example, when searching the online catalog relief
comes through pointing out funny or bizarre titles (Petry, 1998). Library instruction, like
57
other kinds of teaching, may benefit from adding humor strategically (Walker, 2006),
though it may not be considered a key part of being an effective instructor (Arnold,
1998).
Conclusion
This chapter focused on humor’s role in motivation, how it affects instruction,
and how it relates to multimedia instruction. Humor has been shown to improve
perception of the instructor, improve perception of the classroom environment, and
have mixed effects on student learning. The following chapter will describe the
approach of the current study to determine the effect of humor on learning and
motivation.

58
CHAPTER 3 METHODS
Review of Research Purpose
The purpose of this study is to examine the effects of adding humor to an
instructional video on learning and motivation. The research questions for this study are
as follows:
R1 – Does adding humor to an instructional video influence learning?
H1 – Adding humor to an instructional video will improve learning.
R2 – Does adding humor to an instructional video influence motivation?
H2 – Adding humor to an instructional video will improve motivation.
R3 – Does the gender of the student influence learning or motivation?
H3 – The gender of the student will not influence learning or motivation.
Humor has been shown in some conditions to improve perception of the
instructor without diminishing their credibility (Gruner, 1967, 1970). It has also been
shown to improve both student and instructor perception of the class environment
(Anderson, 2011; Askildson, 2005; Berk & Nanda, 1998; Buckman, 2010). Previous
studies have shown mixed results in terms of recall or application, with the most
rigorous studies showing no significant difference in learning (Ghaffari & Mohamadi,
2012; Gibb, 1964; Kaplan & Pascoe, 1977; Kothari et al., 1993; Zillmann et al., 1980; Ziv,
59
1988). Finally, studies have shown that gender may affect perception of humor. This
study seeks to improve on many of the existing studies with a more rigorous
experimental approach.
Theoretical Framework
This study uses a mixed-methods approach in an experimental pretest, posttest,
and second posttest control-group design. Four different data were collected. First,
learning assessments in the form of open-ended test questions were collected as
qualitative data. They were scored and thus converted to quantitative data. Second, a
motivation assessment in the form of a survey (the IMMS) collected quantitative, Likert-
style data. Third, perception of humor was collected as a survey (HMC) with quantitative,
Likert-style data. Fourth, perceptions of the instructional video were collected via open-
ended qualitative questions. Along with the IMMS and HMC, because the learning
assessments were converted to quantitative form and are reported with statistical
analysis, the study may be described as QUAN + qual approach (Johnson & Christensen,
2012), with an emphasis on quantitative data. The rationale for this mixed-methods
approach is triangulation of the largely quantitative data with the brief qualitative data.
This can ensure that all data corroborate, and the study does not miss key variables that
might explain the results (Greene, 2007).
In terms of a theoretical framework, the study connects a motivation theory with
a multimedia theory. Humor is a strategy in the Attention component of Keller’s ARCS
model of motivation (Keller, 1987, 2010), and motivation is a component of Moreno’s

60
CATLM model of multimedia learning (Moreno, 2006). This study traces the effect of
humor, an instructional motivation strategy, on overall motivation, a factor which may
influence short-term and long-term learning.
Pilot Studies
Three pilot studies were conducted before the final study with a significantly
smaller number of students. The studies were conducted to ensure that the learning
assessments, video, and humor manipulation tools were aligned with the research
objectives. They will be referred to as Pilot 1, Pilot 2, and Pilot 3. The pilot studies took
place a few weeks before the final study, during the winter break between the fall 2013
and spring 2014 semesters.
Context
Both the pilot and final studies were conducted with undergraduate students at
Boise State University in 2013-2014.
Pilot Study Context
The pilot study surveyed undergraduate employees of the library, who were
asked to participate voluntarily for a $5 gift card for coffee. They took the surveys
before and after Christmas break in 2013-2014, between semesters.
Final Study Context
Final study participants came from two courses during the spring semester of
2014. The first course, University 106 (U106), was a 1-credit information literacy course
for undergraduates with three to four sections taught by library faculty every semester.

61
It is an eight-week course with two sections the first eight weeks of the semester (Mod1)
and two sections the second eight weeks of the semester (Mod2). Course content
includes determining the validity of research information, searching academic journal
databases, finding articles and books in the library, and writing research questions. The
second course, Communication 302 (COMM 302), was a 3-credit research methods
course for upper level communication undergraduates, with one section. It was taught
by a professor in the Communication Department and focused on “historical, critical,
descriptive, and experimental research methods and tools in communication. Students
design, conduct, report, and evaluate research projects” (“COMM 302,” 2014).
Students in both courses were promised 10 extra credit points in their course for
participating in the study. An alternative assignment was provided for students who
wanted to earn the extra credit but did not want to participate in the study.
Students in U106 received varying amounts of the 10 points depending on how
many of the three surveys they completed. For example, students received two points
for participating in each of the first and third surveys, which took an average of 10
minutes to complete, and six points for participating in the second survey, which took
an average of 30 minutes to complete. In COMM 302 the instructor required students to
complete all three studies to receive the 10 extra credit points.
As mentioned, U106 had multiple sections, including both face-to-face and
online. In Spring 2014, U106 was taught face-to-face in one section and online in three
sections. Students from all four sections were invited to participate in the study. Three
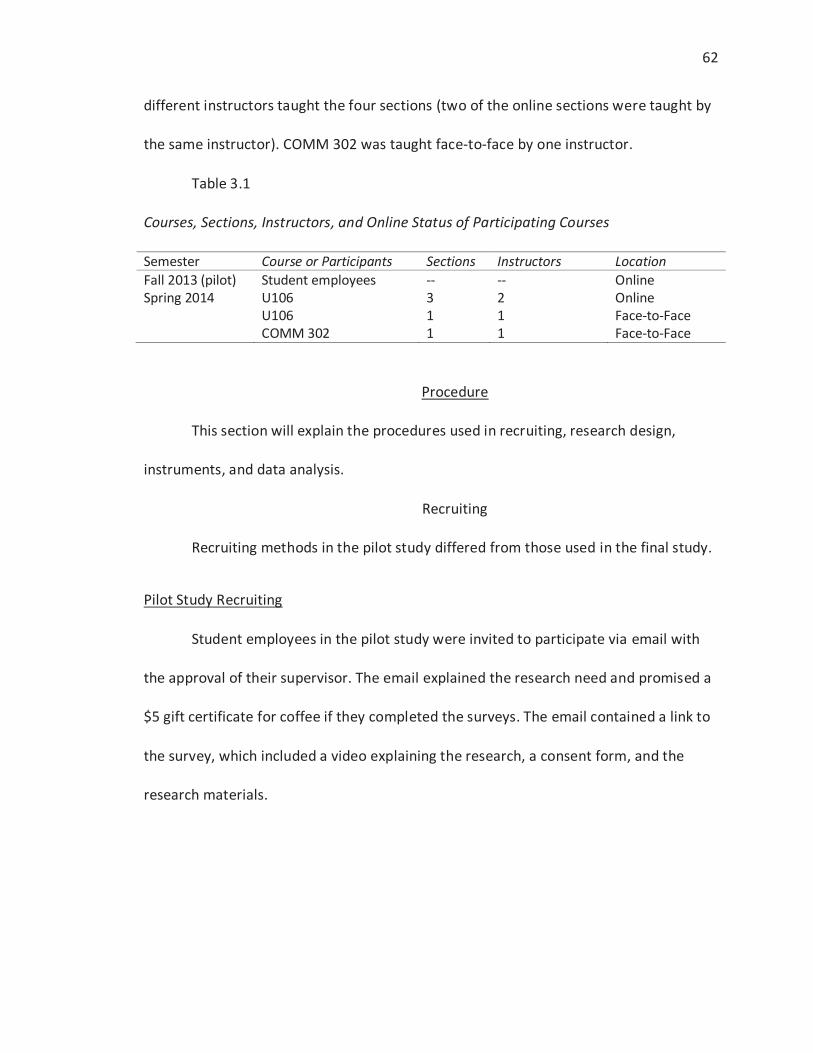
62
different instructors taught the four sections (two of the online sections were taught by
the same instructor). COMM 302 was taught face-to-face by one instructor.
Table 3.1
Courses, Sections, Instructors, and Online Status of Participating Courses
Semester Course or Participants Sections Instructors Location Fall 2013 (pilot) Student employees -- -- Online Spring 2014 U106 3 2 Online U106 1 1 Face-to-Face COMM 302 1 1 Face-to-Face
Procedure
This section will explain the procedures used in recruiting, research design,
instruments, and data analysis.
Recruiting
Recruiting methods in the pilot study differed from those used in the final study.
Pilot Study Recruiting
Student employees in the pilot study were invited to participate via email with
the approval of their supervisor. The email explained the research need and promised a
$5 gift certificate for coffee if they completed the surveys. The email contained a link to
the survey, which included a video explaining the research, a consent form, and the
research materials.

63
Final Study Recruiting
In the final study the manner in which students were contacted depended on
their course and section. U106 online students were notified of the survey with an
announcement on the course homepage. U106 face-to-face students were invited by
the researcher during class, and given a link from the course homepage.
U106 students were asked to participate at different times in the semester.
Mod1 students (one section online, one section face-to-face) were invited to participate
during the second week of class. Students in Mod2 (both online) were invited to
participate halfway through the semester, a preference expressed by the instructors,
one of whom wanted to give students time to adjust to the course and one who was
assigned to teach the course shortly before it started because of an unforeseen
situation.
The COMM 302 students were invited to participate roughly midway through the
semester by their instructor, and received an email and announcement on their
homepage as a reminder.
All recruitment efforts included a brief video of the researcher explaining the
reasons for the study, payment for participating, risks and benefits, and an explanation
of the process.
Although timing between sections and courses differed, every participant went
through the same study with the same surveys and instructional materials. The only
difference in the research experience for any participant was the instructional video:

64
students in the control group saw a video with no humor and students in the
experimental group saw the same video, with humor added.
Participants
Pilot Studies
Students who participated in the pilot studies worked part-time for the Boise
State University Library. Their roles in the library were to check out items to patrons,
including renewing books and collecting fines. Their years in school and majors varied.
Their regular tasks at the library did not include, nor hinge on, special training or
preparation in the content in the tutorial, nor was it part of their job training.
Pilot 1 had four participants, Pilot 2 seven, and Pilot 3 four. Participants were
fairly evenly distributed between the control and experimental conditions in the pilot
studies, and females (n=9) outnumbered males (n=6).

65
Table 3.2
Pilot 1, 2, and 3 Gender and Condition Distribution
Pilot 1 Control Experimental Total Percent Male 0 0 0 - Female 2 2 4 100%
Pilot 1 Total 2 2 4 Pilot 2 Control Experimental Total Percent
Male 2 2 4 57% Female 1 2 3 43%
Pilot 2 Total 3 4 7 Pilot 3 Control Experimental Total Percent
Male 1 1 2 50% Female 1 1 2 50%
Pilot 3 Total 2 2 4 Overall Total 14 16
Demographic data were collected for Pilot 1 and 3, but for Pilot 2 only gender
was collected due to an oversight. Pilot students were somewhat evenly distributed
between genders (40/60, male/female). Half were between the ages of 21-23, with 38%
older than the age of 24. Most (87%) reported studying five or more hours a week.
Majors were distributed somewhat evenly. In terms of year in school, most students
(75%) were a junior or senior.

66
Table 3.3
Pilot 1, 2, and 3 Demographic Data
Pilot 1 Pilot 2 Pilot 3 Total Percent Gender
Male 0 4 2 6 40% Female 4 3 2 9 60%
Age 18-20 0 -- 1 1 13% 21-23 3 -- 1 4 50% 24-25 0 -- 1 1 13% Over 25 1 -- 1 2 25%
Hours of Study/Week 4-5 0 -- 1 1 13% 5 or more 4 -- 3 7 87%
Major Accounting 1 -- 0 1 13% Arts 0 -- 1 1 13% Business 2 -- 0 2 25% English 0 -- 1 1 13% Sciences 0 -- 2 1 13% Sociology 1 -- 0 1 13%
College Year Freshman 1 -- 0 1 13% Sophomore 0 -- 1 1 13% Junior 2 -- 0 2 25% Senior 1 -- 3 4 50% Note: -- represents data not collected for Pilot 2
Final Study
A total of 142 students were invited to participate in the study, 100 from U106
and 46 from COMM 302. As might be expected, not all students opted to participate,
and the number of those who did participate decreased as the study progressed. The
final number of participants who completed enough of the study to be included (at least
the pretest and posttest) from both courses was 55: 20 from all four sections of U106
and 35 from COMM 302.
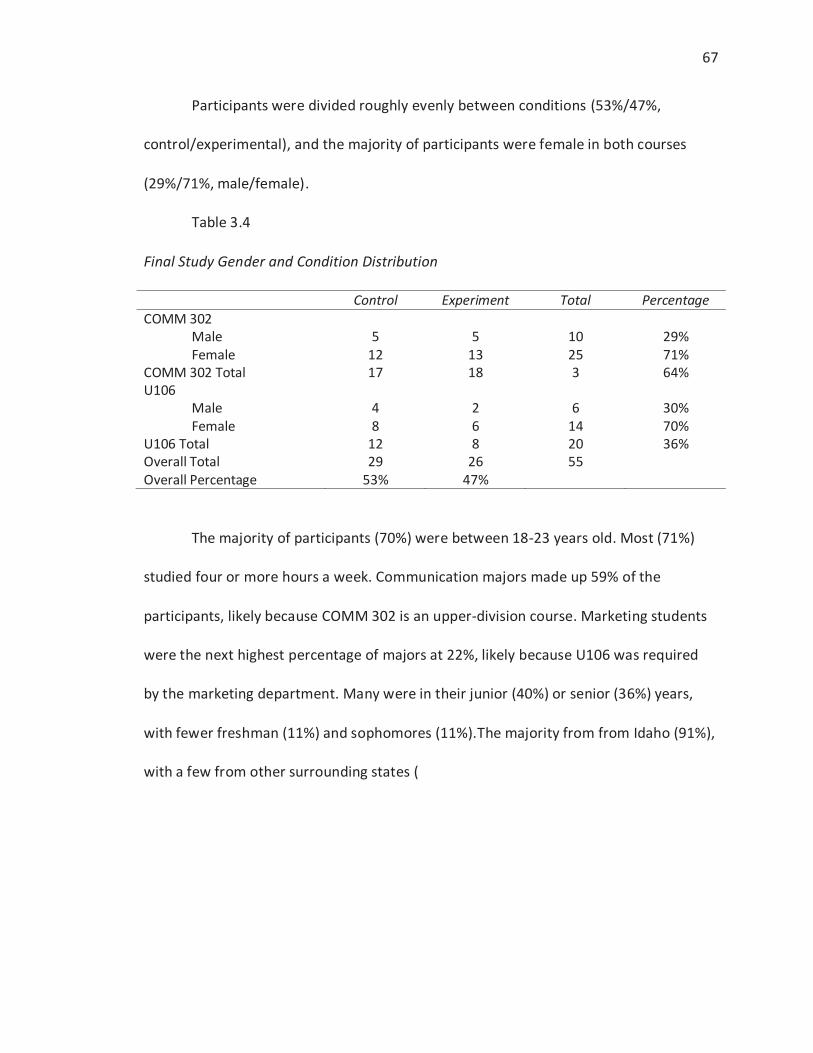
67
Participants were divided roughly evenly between conditions (53%/47%,
control/experimental), and the majority of participants were female in both courses
(29%/71%, male/female).
Table 3.4
Final Study Gender and Condition Distribution
Control Experiment Total Percentage COMM 302
Male 5 5 10 29% Female 12 13 25 71%
COMM 302 Total 17 18 3 64% U106
Male 4 2 6 30% Female 8 6 14 70%
U106 Total 12 8 20 36% Overall Total 29 26 55 Overall Percentage 53% 47%
The majority of participants (70%) were between 18-23 years old. Most (71%)
studied four or more hours a week. Communication majors made up 59% of the
participants, likely because COMM 302 is an upper-division course. Marketing students
were the next highest percentage of majors at 22%, likely because U106 was required
by the marketing department. Many were in their junior (40%) or senior (36%) years,
with fewer freshman (11%) and sophomores (11%).The majority from from Idaho (91%),
with a few from other surrounding states (

68
Table 3.5
Final Study Demographic Data
COMM U106 Total Percent Gender
Male 10 6 16 29% Female 25 14 39 71%
Age 18-20 9 10 19 35% 21-23 12 7 19 35% 24-25 4 0 4 7% Over 25 9 3 12 22%
Hours of Study per Week 0-1 hours per week 0 1 1 2% 1-2 hours per week 2 1 3 5% 2-3 hours per week 3 2 5 9% 3-4 hours per week 5 2 7 13% 4-5 hours per week 11 4 15 27% 5 hours or more per week 14 10 24 44%
Major No Major Given 0 2 2 4% Business 0 2 2 4% Communication 32 0 32 59% Criminal Justice 0 1 1 2% Economics 0 1 1 2% Journalism 1 0 1 2% Marketing 0 12 12 22% Public Relations 2 0 2 4% Respiratory Care 0 1 1 2%
College Year Freshman 0 6 6 11% Sophomore 2 4 6 11% Junior 17 5 22 40% Senior 15 5 20 36% Graduate Student 1 0 1 2%
State of Residence California 5 2 0 4% Idaho 14 16 34 91% Nevada 32 1 0 2% Washington 48 1 1 3%

69
Pilot and Final Study Participant Comparison
The pilot study participants varied from the final study participants in a few ways.
The pilot studies balanced genders more equally, stayed more within the 21-23 year old
range, reported more hours studied, had a wider range of majors, and included more
junior level students. Over 90% of the final study participants were from Idaho.
Research Design
Pilot Designs
In the three pilots there was no pretest or second posttest; students simply
viewed the video and then took the posttest. Students took the surveys online without
ever having direct contact with the researcher. Pilot 1 instruments, including the
instruction and assessment, differed from Pilots 2 and 3. In addition, the order of events
changed. In Pilot 1 students viewed the recruitment video then watched either the
control (no humor) or experimental (humor) video. In Pilots 2 and 3 students indicated
their gender before viewing either video. Participants in all three pilots then completed
the learning assessment, the IMMS, humor manipulation items, and qualitative
questions. Finally, participants in Pilot 1 and 3 filled out a demographic survey.
Final Study Design
The final study used a randomized, experimental pretest-posttest design with a
delayed second posttest. Thus students took the same learning assessment three times,
three weeks apart each time. The first learning assessment was the pretest. Three
weeks later, immediately after the instructional intervention, students took the same
70
assessment, a posttest. They also took additional surveys at this time. Finally, three
weeks later, students took the learning assessment a final time as a second posttest.
The three week delay for the second posttest was an approach used in other studies
(Ghaffari & Mohamadi, 2012; Gibb, 1964; Kothari et al., 1993).

71
Table 3.6
Treatment Timing and Shorthand
Timing Shorthand Treatment Start of study Pretest Learning assessment 3 weeks later Posttest Instructional video, learning assessment, IMMS,
humor manipulation survey, demographic survey, open-ended perception survey
3 weeks later Second posttest Learning assessment
Sampling
This study used a convenience sample of two courses at Boise State University.
Participants were randomly divided into control and experimental groups. However, the
sampling technique changed after Pilot 1. In Pilot Study 1, students were randomly
divided into control and experimental groups. In Pilot Studies 2 and 3 and the Final
Study, a block sampling technique was used. Before students participated in the
instructional intervention they were asked for their gender, which was used to divide
them equally into control and experimental conditions along gender lines. Block
grouping can be used when “the plots are not all reasonably similar” so that “plots
within each block are alike” (Bailey, 2008, p. 53). Studies have indicated that student
gender and instructor gender may influence the perception of humor (Bryant et al.,
1980; Tamborini & Zillmann, 1981). For example, Bryant et al. (1980) found that the
gender of the instructor significantly affected student perception of effectiveness when
humor was used frequently. Tamborini and Zillman (1981) found that the effectiveness
of self-disparaging humor changed depending on the gender of the instructor and
student. In the current study, because the instructor in the instructional video was male,

72
the block sampling technique was used to ensure that an equal number of males and
females were in each condition, so differences in perception by gender could be
examined.
Instruments
This study includes several instruments. They will be described below along with
how they were modified based on pilot data.
Learning Assessment
In Pilot 1 the learning assessment consisted of five knowledge-level multiple-
choice questions and 1 comprehension-level matching question. These items were
created by the researcher and sent to the instructors for the U106 course (content
experts in this area) for review.
The learning assessments changed dramatically starting with Pilot 2, based on
two factors. First, it was felt that the smaller number of data points generated by a small
number of multiple choice questions may not have adequately distinguished between
more subtle degrees of learning. Second, because the study so closely follows the
research design established by Mayer (Mayer & Moreno, 2003) the researcher opted for
similar open-ended questions.
Accordingly, in Pilots 2 and 3 and the Final Study, the learning assessment
removed the five multiple-choice and replaced them with 10 short-answer questions.
Questions were divided into three levels: knowledge (4), comprehension (3) and
application (3), following the taxonomy of learning levels established by Bloom (1956),
and as explained earlier, corrollary to Mayer’s concepts of retenion (knowledge) and
73
transfer (comprehension and application) (Mayer, 2002). Knowledge-level questions
were meant to assess recall; for example, “Explain how to summarize a source.”
Comprehension-level questions were meant to determine if participants could
distinguish between ideas; for instance, “Please explain the difference between
summarizing and paraphrasing.” Finally, application questions aimed at determining if
students could apply the concepts to a novel situation; for example, being given a
sample text and asked to provide a summary.
Initially, learning assessment items were to be eliminated based on the 30-70%
rule described by Seyer & McBeath (1981). However, based on feedback from the pilot
study during the proposal defense, it was decided that all questions could be included.
Assessments were ordered from easiest to most difficult, which enabled the
study to avoid giving students answers which appeared in the text of later questions. For
example, students were asked for three ways to include a source in a paper before they
were asked to give an example of each way of including a source.
Demographics
The demographic survey asked for information such as gender, age, major, and
hours studied per week. It did not change between the pilots and the final study. The
demographic survey can be found in Appendix C.
Motivation Survey
The motivation assessment did not change between the pilots and the final
study. Motivation was measured with the Instructional Materials Motivation Survey
(IMMS), which “was designed to measure reactions to self-directed instructional

74
materials” and can be used for computer-based instruction (Keller, 2010, p. 277). In this
case the instrument was used to determine the motivational effect of the instructional
videos. The IMMS has 36 questions, broken into four subscales, one for each part of
ARCS. Keller suggests that it can be changed to fit specific instruction; for example,
changing the wording in the questions from “this lesson” to “this video,” which was
done for this study. The questions can be found in Appendix D. In a test administered to
90 undergraduates in two undergraduate classes, the internal consistency estimates for
the Attention scale were .89, Relevance .81, Confidence .9, Satisfaction .92, and.96 total,
which are acceptable for this study (Keller, 2010).

75
Table 3.7
Cronbach’s Alphas for IMMS Survey
Category α Number of Items
Attention 0.89 12 Relevance 0.81 9 Confidence 0.90 9 Satisfaction 0.92 6 Overall 0.96 36
Humor Manipulation Check (HMC)
Students were given a survey to determine if they perceived that the video in the
experimental condition was more humorous than the video in the control condition. As
with other instruments, a different tool was used for Pilot 1 than was used in Pilots 2, 3,
and the final study.
Several studies (Bryant et al., 1979; Gruner, 1967, 1970; Kaplan & Pascoe, 1977)
used two items related to seriousness developed by Smith (1959). These items were
designed for live or recorded speakers, and include two 7-point bi-polar scales (serious-
humorous, heavy-light), with the second item reversed. The Pilot 1 instructional video
resembled a lecture with video of an instructor and PowerPoint slides, thus the tool
appeared to be a good fit to measure its humor. However, when the instructional video
was changed in Pilots 2, 3, and the final study, it began to look less like a traditional
lecture and more like an animated conversation. It was decided that a tool used for a
different style of video would be more effective.
76
Pilots 2, 3, and the final study employed a tool used in advertising to determine
if commercials were perceived to be humorous. It consisted of three 7-point bi-polar
scales: “funny/not funny, humorous/not humorous, and amusing/not amusing” (Cho,
1995, p. 192), with the first item reversed. Cho’s study was found to have a coefficient
alpha of .96. The scale can be found in Appendix E.
Open-Ended Questions
The open-ended questions in Pilot 1 were given to both the control and
experimental conditions. They were as follows: “Are there changes that you would
make to the video you watched to make it a better learning experience?” and “Can you
give an example of something you learned from a video online in the past six months?”
Changes were made to the video in Pilot 2 based on the responses to the first
question. However, the second question regarding past learning from instructional
videos did not focus enough on humor to elicit responses that aided in determining the
participants’ perception of humor in instructional videos. For example, one student
wrote, “Love learning from videos…videos are very good for me as I am a visual person.”
While the comment reinforced the use of videos in instruction, it did not help determine
the student’s perception of humor in videos.
In Pilots 2, 3, and the final study, all participants who viewed both the control
and experimental videos were asked one question: “What changes would you make to
the video you watched to make it a better learning experience?” Participants who
viewed the experimental (humor) video were asked three additional questions focused
on the humor of the video, whether it related to the educational content, and their
77
experience with humor in other instructional videos they’d seen. These questions
appeared to be more relevant and were used to drive changes in the instructional
videos. These questions can be found in Appendix F.
Instructional Intervention
The instructional intervention, a brief video, was written and produced by the
researcher. The content focused on three strategies for incorporating sources in a
research paper: summarizing, quoting, and paraphrasing. The instructional video went
through two iterations based on feedback from the pilot studies.
Pilot Study 1 Video
In the first pilot study, the video (Video 1) depicted an instructor giving a lecture
through PowerPoint on the topic, including a webcam video of him at various points.
The humorous version used the premise that the instructor’s child had added content to
the PowerPoint that disrupted its flow and the instructor’s concentration. For example,
requests to go to the store and buy toys were added to the text of the examples,
interrupting the flow of the lecture. The concepts of summary, paraphrasing, and
quoting were explained and then applied to one example, a paragraph from the
Declaration of Independence for the United States of America. The non-humorous
version of this video was five minutes long and the humorous version was over six
minutes. Results from the HMC showed no differences between conditions. The open-
ended questions in Pilot 1 indicated that the humor video was “cheesy” and that the
instructor’s voice was “monotone.”
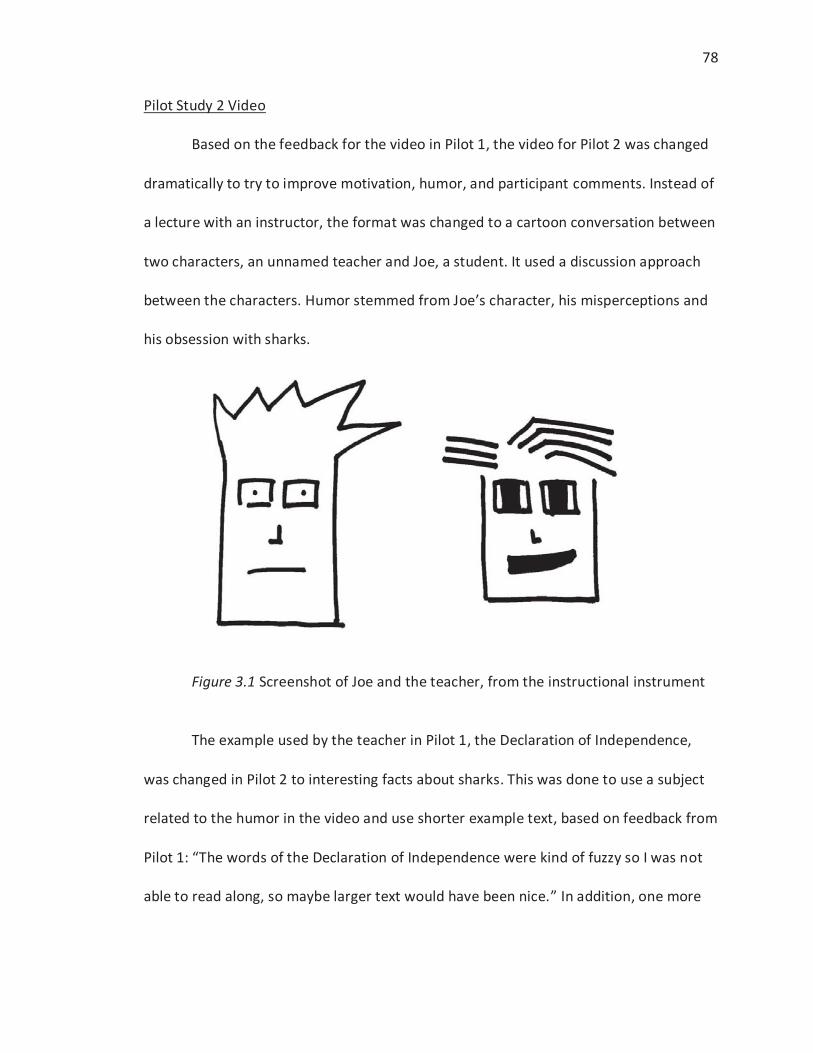
78
Pilot Study 2 Video
Based on the feedback for the video in Pilot 1, the video for Pilot 2 was changed
dramatically to try to improve motivation, humor, and participant comments. Instead of
a lecture with an instructor, the format was changed to a cartoon conversation between
two characters, an unnamed teacher and Joe, a student. It used a discussion approach
between the characters. Humor stemmed from Joe’s character, his misperceptions and
his obsession with sharks.
Figure 3.1 Screenshot of Joe and the teacher, from the instructional instrument
The example used by the teacher in Pilot 1, the Declaration of Independence,
was changed in Pilot 2 to interesting facts about sharks. This was done to use a subject
related to the humor in the video and use shorter example text, based on feedback from
Pilot 1: “The words of the Declaration of Independence were kind of fuzzy so I was not
able to read along, so maybe larger text would have been nice.” In addition, one more

79
example of each concept was given, with Joe applying the concepts he’d learned, using
the Pledge of Allegiance as sample text. This decision was made to make the instruction
more sound, giving students a model of the application questions they would answer in
the learning assessment. The videos were also shortened to three minutes for the non-
humorous version and four and a half minutes for the humorous version. However, even
with these changes, students in the humor group did not find the experimental funnier
than the control video. Feedback from the open-ended questions indicated “just to
enough to make you chuckle without being over the top or seeming like it was forced”
and that “Sharks were used as an example for citing.”
Pilot Study 3 Video
Two changes were made for the third video. First, noting the comment regarding
a connection between the example of sharks and the humor around them, the third
video changed the example to be more generic, with the concern that the interesting
example would confound the effect of humor in the video. Gruner (1970) found that
interesting examples had as strong an effect as humor in perception of the instructor
and interest in the content. The example using facts about sharks was replaced with a
generic sentence, for example, “Here is the main point in my own words (Author, Year).”
In addition, to improve the humor levels, when Joe refers to different concepts related
to his obsession with sharks, images were used to illustrate and emphasize his ideas. For
example, a poster of a movie Joe refers to, Sharknado, is shown on screen as he talks
about it.

80
Figure 3.2 Screenshot of Sharknado poster, added for humorous effect
Participants in the humor group found the video slightly funnier than students in
the control group. The slight change in higher perception of humor of the experimental
video was encouraging, and this video was used in the final study. The video revision
also considered how much humor was used and where it appeared.
Humor Placement and Amount
Humor placement was affected by studies indicating that humor used at the
beginning of class appears to be effective, (Berk & Nanda, 1998; Kothari et al., 1993),
and that starting with a lighthearted tone can suggest to students a more playful state
(Apter, 1982). Humor in the video was added at natural break points in the flow of the
tutorial rather than in the middle of examples or concept explanation where it could
potentially be distracting. Since too much humor may distract students from the content
81
(Fisher, 1997; Keller, 2010; Mayer, 2014), this video followed Ziv’s (1988) suggestion of
three to four jokes per class session and applied it to the video, resulting in four
humorous interludes in the experimental video.
Both the non-humorous video and humorous video contain the same non-
humorous content performed in the same way in an attempt to avoid the potentially
confounding effect of different intonations in different conditions seen in other studies
(Gruner, 1970).
The humorous dialogue occurs in the pattern indicated in the figure below.
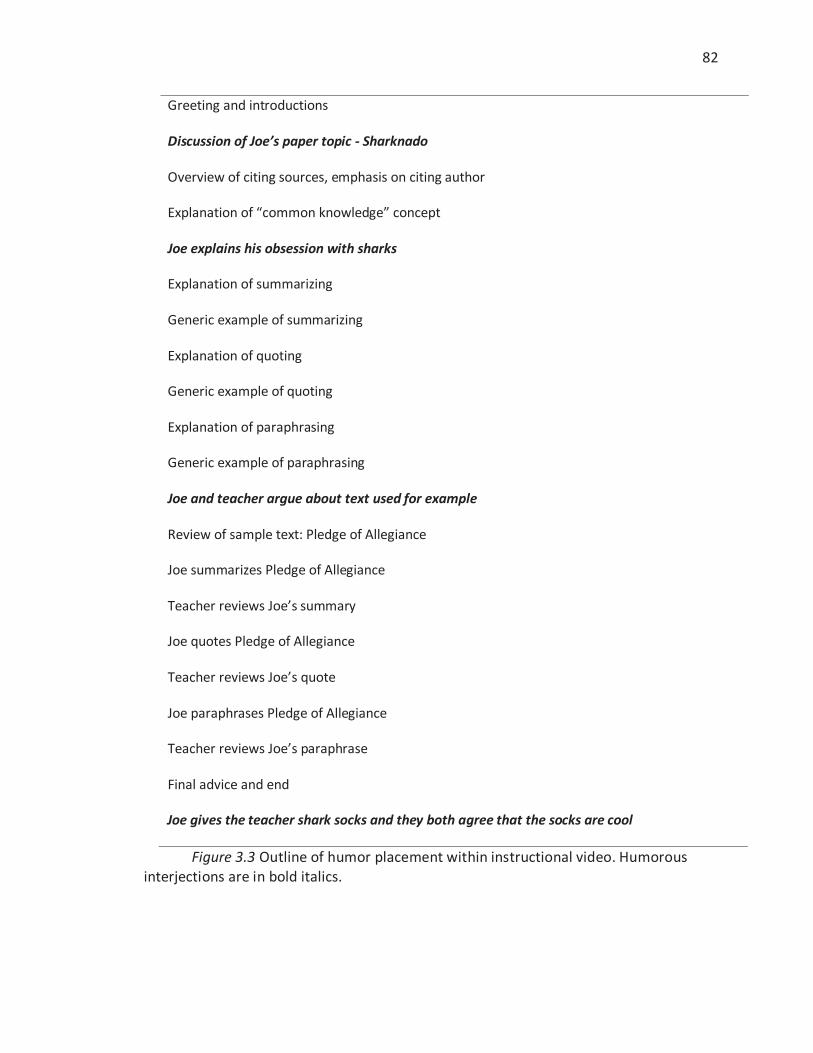
82
Greeting and introductions
Discussion of Joe’s paper topic - Sharknado
Overview of citing sources, emphasis on citing author
Explanation of “common knowledge” concept
Joe explains his obsession with sharks
Explanation of summarizing
Generic example of summarizing
Explanation of quoting
Generic example of quoting
Explanation of paraphrasing
Generic example of paraphrasing
Joe and teacher argue about text used for example
Review of sample text: Pledge of Allegiance
Joe summarizes Pledge of Allegiance
Teacher reviews Joe’s summary
Joe quotes Pledge of Allegiance
Teacher reviews Joe’s quote
Joe paraphrases Pledge of Allegiance
Teacher reviews Joe’s paraphrase
Final advice and end
Joe gives the teacher shark socks and they both agree that the socks are cool
Figure 3.3 Outline of humor placement within instructional video. Humorous interjections are in bold italics.

83
Humor Content
The additional dialogue in the humorous version frames the learning character,
Joe, as a quirky person obsessed with sharks and the made-for-TV horror film Sharknado
(2013), which will be the research topic for his paper. Humor is derived from the
incongruity in Joe’s odd behavior, interests, and misunderstandings of social cues. This
approach falls within the appropriate humor usage categories of “teasing students,”
“creative language,” and “role play” described by Wanzer et al. (2006). The teacher
expresses frustration but never openly criticizes or denigrates Joe, nor does he attack
appearance, religion, gender, race, or other sensitive topics in an attempt to avoid
aggressive or offensive humor (Banas et al., 2011; Wanzer et al., 2006). However, the
depiction of Joe as a sometimes ludicrous character falls within the Superiority Theory
of humor, as viewers are meant to sympathize with Joe but marvel at his oddities. The
Incongruity Theory also plays a part, since his oddities are incongruous with the learning
situation and the typical disposition of a well-rounded college student.
The humor’s relation to the content appears more difficult to define; in Wanzer
et al.’s definition, eight of the nine categories for appropriate humor overlapped with
categories for inappropriate humor (Wanzer et al., 2006). In this study, care was taken
to make the humor superfluous to the instructional content to avoid the confounding
effect that has appeared in other studies (Kaplan & Pascoe, 1977; Kothari et al., 1993;
Ziv, 1988), which appear to use instructional strategies like examples in conjunction with
humor. The goal of this study is to determine if humor, isolated from other instructional
variables, improves learning and motivation.

84
The script for the final video can be found in Appendix H, with the humorous
dialogue italicized.
Data Analysis
Data was collected from two different courses and participants were divided
randomly between males and females. The courses varied in content, length, and
instructor. Learning assessment data was graded and scored. The Humor Manipulation
Check and Instructional Materials Motivation Survey are quantitative instruments that
produced number scores. Qualitative data from responses to the open-ended questions
were coded. Each analysis will be described in more detail below.
Learning Assessment
As described earlier, beginning with Pilot 2, learning assessments consisted of 10
open-ended questions and 1 matching question for a total of 11 questions. Items were
divided into three categories based on Bloom’s taxonomy: knowledge (n=4),
comprehension (n=4), and application (n=3) (Bloom, 1956). Comparisons will be made
between individual totals for each category: knowledge, comprehension, application,
and the collective total of all three categories.
Scoring
Two independent sources graded the test according to a rubric designed by the
researcher. The rubric changed slightly from the pilot studies in that it was formalized
and slight modifications were made after consulting with the graduate students in an
effort to clarify the process and improve fairness.

85
The graduate students received a test bank of questions to practice with to
determine if they appeared capable of grading the questions accurately. After
successfully completing the test bank, they were given anonymous student responses
put in random sequential order (in other words, responses from each of the three
treatments were intermixed to avoid sequential bias). They were given the original
instructional materials, a rubric, and a short explanatory video about how to grade the
responses. After they scored the responses the graders discussed their scores
(independent of the researcher) until they reached 90% agreement on each item (for
example, the first knowledge questions). The grader’s independent inter-rater reliability
was used to minimize researcher influence on the data. The remaining 10% differential
was calculated with an average between the two grader’s scores.
A total of 55 points were possible overall, combining knowledge (27 points),
comprehension (19 points) and application (nine points) questions. As mentioned earlier,
the open-ended approach is modeled after Mayer’s assessment of recall and application
(Mayer & Anderson, 1991, 1992; Mayer, 1989, etc.). Each of the 10 open-ended
questions could be worth two or more points. Students got a point for each part they
included in their answer. For example, when asked “Please explain the difference
between summarizing and paraphrasing,” students received a point for each of the
following for a total of three points:
Summarizing is putting the main point in your own words. (1)
Paraphrasing is putting all of the main points in your own words. (1)
Summarizing is shorter. (1)

86
Each item had a different number of points, based on the content of the
question.
Pretest, Posttest, and Second Posttest
Because the learning assessment items were the same between pretest, posttest,
and second posttest, final assessment scores were determined by differences between
the scores. Three scores were calculated. First, the difference between the pretest and
the posttest (posttest minus pretest) measured the gain from three weeks before the
instructional intervention to immediately after, which will be called the prepost. Second,
the difference between the pretest and the second posttest (second posttest minus
pretest) measured the gain (or loss) from the pretest to second posttest, six weeks later,
which will be called the pre2post. Third, the difference between the second posttest
and the first posttest (second posttest minus posttest) measured the loss (or gain) from
the posttest to the second posttest three weeks later. This last score will be called the
post2post.
The prepost, pre2post, and post2post scores were compared using a 2 (Humor vs
No Humor) x 2 (Male vs Female) ANOVA. This strategy differs slightly from Mayer’s
approach of a one-way ANOVA (Mayer et al., 1996; Mayer & Sims, 1994; Mayer, 1989).
The affective nature of the humor intervention suggests this approach may be more
appropriate in examining the additional influence that gender may have on learning and
motivation (Tamborini & Zillmann, 1981)

87
Table 3.8
Score Explanation by Survey Timing
Score Label Assessment Equation Time Difference Week Difference Prepost Posttest minus pretest 3 weeks Week 1 to 3 Pre2post Second posttest minus pretest 6 weeks Week 1 to 6 Post2post Second posttest minus posttest 3 weeks Week 3 to 6
The specific questions and acceptable answers for each item can be found in
Appendix B.
Humor Manipulation Check (HMC)
For the HMC, each item will be weighted from -3 to 3. For example, selecting the
option closest to “Not Funny” would result in a -3, and selecting the option closest to
“Funny” would result in 3 (Cho, 1995; Flaherty, Weinberger, & Gulas, 2004). The first
item is reversed in the scoring. Means within groups were compared with a 2 (Humor vs
No Humor) x 2 (Male vs Female) ANOVA.
Motivation Survey
The IMMS scores each item from 1-5, with a total range of 36-180 points.
Subscales have different individual ranges, and several items are reversed in scoring.
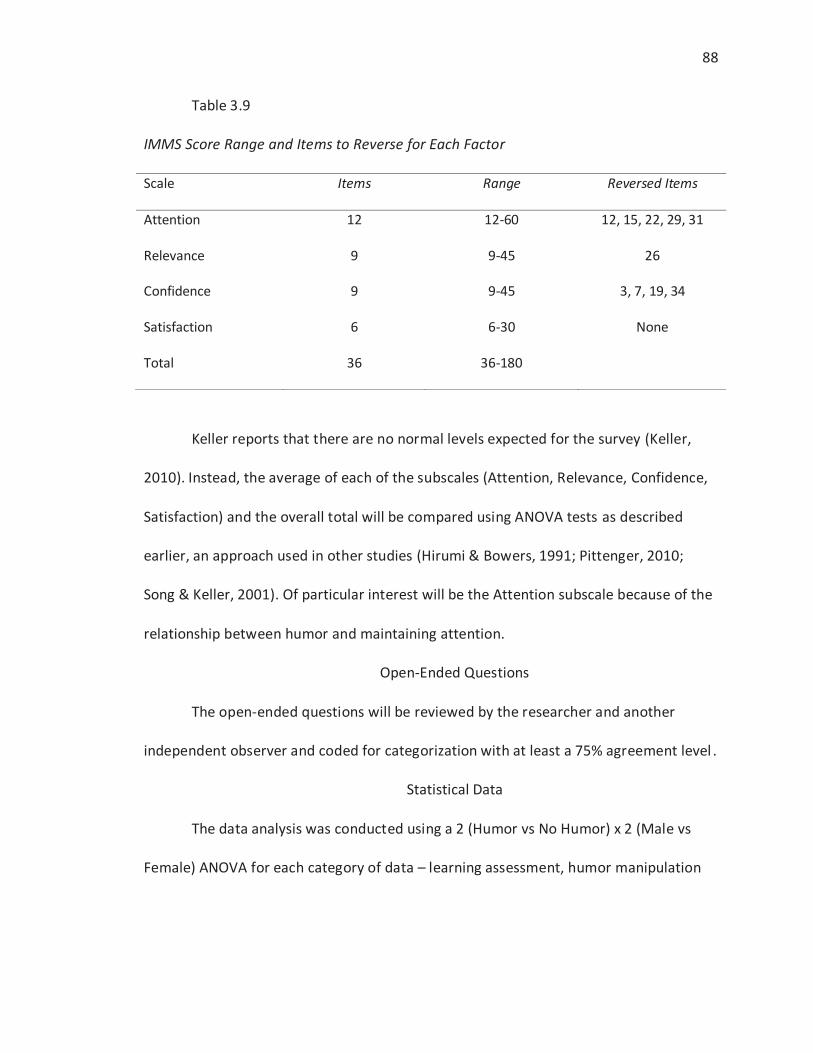
88
Table 3.9
IMMS Score Range and Items to Reverse for Each Factor
Scale Items Range Reversed Items
Attention 12 12-60 12, 15, 22, 29, 31
Relevance 9 9-45 26
Confidence 9 9-45 3, 7, 19, 34
Satisfaction 6 6-30 None
Total 36 36-180
Keller reports that there are no normal levels expected for the survey (Keller,
2010). Instead, the average of each of the subscales (Attention, Relevance, Confidence,
Satisfaction) and the overall total will be compared using ANOVA tests as described
earlier, an approach used in other studies (Hirumi & Bowers, 1991; Pittenger, 2010;
Song & Keller, 2001). Of particular interest will be the Attention subscale because of the
relationship between humor and maintaining attention.
Open-Ended Questions
The open-ended questions will be reviewed by the researcher and another
independent observer and coded for categorization with at least a 75% agreement level .
Statistical Data
The data analysis was conducted using a 2 (Humor vs No Humor) x 2 (Male vs
Female) ANOVA for each category of data – learning assessment, humor manipulation

89
check, and motivation survey. If differences at the p=.05 level or higher were found they
were considered significant.

90
CHAPTER 4 RESULTS
Review of Research Purpose
The purpose of this research was to explore the effects of adding humor to an
instructional video. Specifically, it focuses on the effects of humor on student learning
and student perception of motivation. Research questions for this study are as follows:
does adding humor affect learning or motivation?
R1 – Does adding humor to an instructional video influence learning?
H1 – Adding humor to an instructional video will improve learning.
R2 – Does adding humor to an instructional video influence motivation?
H2 – Adding humor to an instructional video will improve motivation.
R3 – Does the gender of the student influence learning or motivation?
H3 – The gender of the student will not influence learning or motivation.
This section gives the results of the final study, first focusing on the qualitative
learning assessment items, then on the quantitative motivation and humor items.
Learning Assessment
This section will review the results from the learning assessments. Results are
divided into three sections, the difference between the pretest and posttest, the
difference between the pretest and the second posttest, and the difference between

91
the posttest and the second posttest. Gender was indicated to be an important factor in
perception of humor in previous studies (Bryant et al., 1980; Tamborini & Zillmann,
1981), thus will be included, along with the experimental condition, as a factor in the
comparisons of learning in a two-way ANOVA. Scores were compared for each
component of learning assessment (knowledge, comprehension, application) and the
total score of all three components.
From Pretest to Posttest
Pretest / Posttest Gain - Knowledge Items
Gain scores between the pretest and posttest on knowledge items showed no
significant differences between the two conditions, F(1,54) = 0.68, p= 0.41; however,
there were significant differences between genders, F(1,54) = 7.09, p= 0.01. Specifically,
males scored higher than females on knowledge items in the pre-post score. Results
also exhibited a non-significant interaction between the condition and gender, F(1,54) =
0.22, p= 0.64.

92
Table 4.1
2x2 ANOVA Pretest / Posttest Mean Gains on Knowledge
Condition n M SE
Control 29 5.33 0.75
Experiment 26 6.25 0.83
Gender
Male 16 7.28 0.94
Female 39 4.30 0.60
Table 4.2
2x2 ANOVA Pretest / Posttest Gains on Knowledge - Interaction
Source Sum of Squares df Mean Square F Sig.
Corrected Model 104.71a 3 34.90 2.49 0.07
Intercept 1503.59 1 1503.59 107.25 0.00
Condition 9.54 1 9.54 0.68 0.41
Gender 99.46 1 99.46 7.09 0.01*
Condition * Gender 3.06 1 3.06 0.22 0.64
Error 715.02 51 14.02
Total 2270.75 55
Corrected Total 819.73 54
Note: *Significant at the p<.05 level.
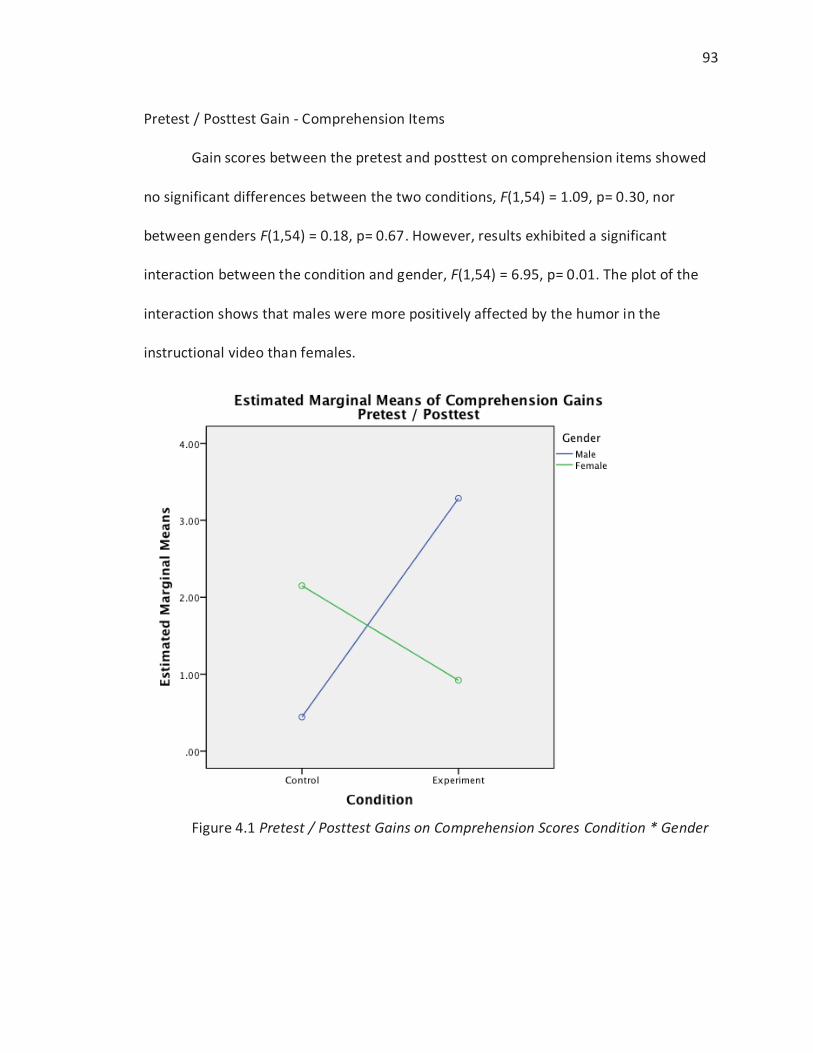
93
Pretest / Posttest Gain - Comprehension Items
Gain scores between the pretest and posttest on comprehension items showed
no significant differences between the two conditions, F(1,54) = 1.09, p= 0.30, nor
between genders F(1,54) = 0.18, p= 0.67. However, results exhibited a significant
interaction between the condition and gender, F(1,54) = 6.95, p= 0.01. The plot of the
interaction shows that males were more positively affected by the humor in the
instructional video than females.
Figure 4.1 Pretest / Posttest Gains on Comprehension Scores Condition * Gender

94
Table 4.3
2x2 ANOVA Pretest / Posttest Mean Gains on Comprehension
Condition n M SE
Control 29 1.30 0.52
Experiment 26 2.10 0.57
Gender
Male 16 1.87 0.65
Female 39 1.54 0.41
Table 4.4
2x2 ANOVA Pretest / Posttest Gains on Comprehension - Interaction
Source Sum of Squares df Mean Square F Sig.
Corrected Model 46.71a 3 15.57 2.33 0.09
Intercept 129.72 1 129.72 19.41 0.00
Condition 7.29 1 7.29 1.09 0.30
Gender 1.22 1 1.22 0.18 0.67
Condition * Gender 46.46 1 46.46 6.95 0.01
Error 340.83 51 6.683
Total 526.75 55
Corrected Total 387.55 54

95
Pretest / Posttest Gain - Application Items
Gain scores between the pretest and posttest on application items showed no
significant differences between the two conditions, F(1,54) = 1.21, p= 0.28, nor between
genders F(1,54) = 0.08, p= 0.78. In addition there was not significant interaction
between the condition and gender, F(1,54) = 3.27, p= 0.08.
Table 4.5
2x2 ANOVA Pretest / Posttest Mean Gains on Application
Condition n M SE
Control 28 0.44 0.57
Experiment 25 1.36 0.62
Gender
Male 16 0.78 0.70
Female 37 1.02 0.46

96
Table 4.6
2x2 ANOVA Pretest / Posttest Gains on Application - Interaction
Source Sum of Squares df Mean Square F Sig.
Corrected Model 28.59a 3 9.53 1.22 0.31
Intercept 35.66 1 35.66 4.57 0.04
Condition 9.46 1 9.46 1.21 0.28
Gender 0.64 1 0.64 0.08 0.78
Condition * Gender 25.48 1 25.48 3.27 0.08
Error 382.44 49 7.80
Total 454.50 53
Corrected Total 411.03 52
Pretest / Posttest Gain - All Items
Gain scores between the pretest and posttest on comprehension items showed
no significant differences between the two conditions, F(1,54) = 2.16, p= 0.15, nor
between genders F(1,54) = 2.03, p= 0.16. However, results exhibited a significant
interaction between the condition and gender, F(1,54) = 4.31, p= 0.04. The plot of the
interaction shows that males were more positively affected by the humor in the
instructional video than females.

97
Figure 4.2 Pretest / Posttest Gains on Overall Scores Condition * Gender
Table 4.7
2x2 ANOVA Pretest / Posttest Mean Gains Overall
Condition n M SE
Control 28 7.17 1.28
Experiment 25 9.96 1.41
Gender
Male 16 9.92 1.59
Female 37 7.21 1.04

98
Table 4.8
2x2 ANOVA Pretest / Posttest Gains Overall - Interaction
Source Sum of Squares df Mean Square F Sig.
Corrected Model 248.16a 3 82.72 2.08 0.12
Intercept 3242.83 1 3242.83 81.46 0.00
Condition 85.96 1 85.96 2.16 0.15
Gender 80.90 1 80.90 2.03 0.16
Condition * Gender 171.49 1 171.49 4.31 0.04*
Error 1950.71 49 39.81
Total 5519.25 53
Corrected Total 2198.87 52
Note: *Significant at the p<.05 level.
Pretest / Posttest Gains Summary
Learning gains between the pretest and posttest were mixed. Males scored
higher on knowledge items, but on comprehension, application, and overall items
neither condition nor gender scored higher. On comprehension items, and on the
overall scores, there was a significant interaction between condition and gender, and in
both cases humor positively affected male scores more than female scores.
From Pretest to Second Posttest
The score difference between the pretest and the second posttest (pre2post)
was compared between conditions. There were fewer overall responses on the second
posttest (37 compared to 55 on the posttest). This was particularly the case in U106,

99
where in one section it was given after the semester was over (extra credit points in that
case were assigned based on the first two surveys).
Pretest / Second Posttest – Knowledge Items
Gain scores between the pretest and second posttest on knowledge items
showed that there were no significant differences between the two conditions, F(1,36) =
0.31, p= 0.58, genders, F(1,36) = 0.43, p= 0.52. Results also exhibited a non-significant
interaction between the condition and gender, F(1,36) = 1.09, p= 0.30.
Table 4.9
2x2 ANOVA Pretest / Second Posttest Mean Gains on Knowledge
Condition n M SE
Control 17 2.77 1.02
Experiment 20 3.53 0.92
Gender
Male 9 3.60 1.20
Female 28 2.70 0.68

100
Table 4.10
2x2 ANOVA Pretest / Second Posttest Gains on Knowledge - Interaction
Source Sum of Squares df Mean Square F Sig.
Corrected Model 21.32a 3 7.11 0.56 0.65
Intercept 267.68 1 267.68 21.02 0.00
Condition 3.93 1 3.93 0.31 0.58
Gender 5.43 1 5.43 0.43 0.52
Condition * Gender 13.89 1 13.89 1.09 0.30
Error 420.26 33 12.74
Total 759.75 37
Corrected Total 441.58 36
Pretest / Second Posttest – Comprehension Items
Gain scores between the pretest and second posttest on comprehension items
showed that there were no significant differences between the two conditions, F(1,38) =
0.00, p= 0.96, genders, F(1,38) = 0.33, p= 0.57. Results also exhibited a non-significant
interaction between the condition and gender, F(1,38) = 0.12, p= 0.73.

101
Table 4.11
2x2 ANOVA Pretest / Second Posttest Mean Gains on Comprehension
Condition n M SE
Control 18 0.81 0.71
Experiment 21 0.86 0.69
Gender
Male 10 0.55 0.85
Female 29 1.12 0.50
Table 4.12
2x2 ANOVA Pretest / Second Posttest Gains on Comprehension - Interaction
Source Sum of Squares df Mean Square F Sig.
Corrected Model 3.88a 3 1.29 0.18 0.91
Intercept 20.63 1 20.63 2.83 0.10
Condition 0.01 1 0.01 0.00 0.96
Gender 2.39 1 2.39 0.33 0.57
Condition * Gender 0.88 1 0.88 0.12 0.73
Error 255.36 35 7.30
Total 297.25 39
Corrected Total 259.24 38

102
Pretest / Second Posttest – Application Items
Gain scores between the pretest and second posttest on application items
showed that there were no significant differences between the two conditions, F(1,34) =
3.91, p= 0.06, or between the genders, F(1,34) = 0.55, p= 0.46. Results also exhibited a
non-significant interaction between the condition and gender, F(1,34) = 0.71, p= 0.40.
Table 4.13
2x2 ANOVA Pretest / Second Posttest Mean Gains on Application
Condition n M SE
Control 16 -0.65 0.57
Experiment 19 0.86 0.51
Gender
Male 9 -0.18 0.66
Female 26 0.39 0.39

103
Table 4.14
2x2 ANOVA Pretest / Second Posttest Gains on Application - Interaction
Source Sum of Squares df Mean Square F Sig.
Corrected Model 16.62a 3 5.54 1.44 0.25
Intercept .31 1 0.31 0.08 0.78
Condition 15.01 1 15.01 3.91 0.06
Gender 2.11 1 2.11 0.55 0.46
Condition * Gender 2.74 1 2.74 0.71 0.40
Error 118.98 31 3.84
Total 138.75 35
Corrected Total 135.60 34
Pretest / Second Posttest – All Items
Gain scores between the pretest and second posttest on all items showed that
there were no significant differences between the two conditions, F(1,34) = 1.56, p=
0.22, genders, F(1,34) = 0.04, p= 0.84. Results also exhibited a non-significant interaction
between the condition and gender, F(F(1,34) = 0.59, p= 0.45.

104
Table 4.15
2x2 ANOVA Pretest / Second Posttest Mean Gains Overall
Condition n M SE
Control 16 3.06 1.43
Experiment 19 5.46 1.29
Gender
Male 9 4.06 1.66
Female 26 4.46 0.97
Table 4.16
2x2 ANOVA Pretest / Second Posttest Gains Overall - Interaction
Source Sum of Squares df Mean Square F Sig.
Corrected Model 39.27a 3 13.09 0.54 0.66
Intercept 480.89 1 480.89 19.69 0.00
Condition 38.15 1 38.15 1.56 0.22
Gender 1.07 1 1.07 0.04 0.84
Condition * Gender 14.36 1 14.36 0.59 0.45
Error 757.12 31 24.42
Total 1487.25 35
Corrected Total 796.39 34

105
Pretest / Second Posttest – Summary
Learning gains between the pretest and second posttest showed no significant
differences between genders or conditions. Additionally there was no significant
interaction between condition and gender.
From Posttest to Second Posttest
The difference between scores on the first posttest and the second posttest
(second posttest minus posttest), or in other words, the loss (in almost every category
by every group) of knowledge three weeks after the instructional intervention was
examined (post2post) with two-way ANOVAs using condition and gender as factors, as
in the previous learning gain comparisons.
Posttest / Second Posttest Gain – Knowledge Items
Gain scores between the posttest and second posttest on knowledge items
showed that there were no significant differences between the two conditions, F(1,36) =
0.73, p= 0.40, genders, F(1,36) = 3.38, p= 0.08. Results also exhibited a non-significant
interaction between the condition and gender, F(1,36) = 1.14, p= 0.29.

106
Table 4.17
2x2 ANOVA Posttest / Second Posttest Mean on Knowledge
Condition n M SE
Control 17 -3.55 0.87
Experiment 20 -2.55 0.79
Gender
Male 9 -4.13 1.02
Female 28 -1.97 0.58
Table 4.18
2x2 ANOVA Posttest / Second Posttest Gains on Knowledge - Interaction
Source Sum of Squares df Mean Square F Sig.
Corrected Model 39.43a 3 13.14 1.42 0.25
Intercept 250.59 1 250.59 27.11 0.00
Condition 6.71 1 6.71 0.73 0.40
Gender 31.21 1 31.21 3.38 0.08
Condition * Gender 10.56 1 10.56 1.14 0.29
Error 305.04 33 9.24
Total 570.75 37
Corrected Total 344.47 36

107
Posttest / Second Posttest Gain – Comprehension Items
Gain scores between the posttest and second posttest on comprehension items
showed that there were no significant differences between the two conditions, F(1,36) =
0.10, p= 0.75, genders, F(1,36) = 0.89, p= 0.35. Results also exhibited a non-significant
interaction between the condition and gender, F(1,36) = 2.14, p= 0.15.
Table 4.19
2x2 ANOVA Posttest / Second Posttest Mean on Comprehension
Condition n M SE
Control 18 -1.09 0.81
Experiment 21 -1.45 0.78
Gender
Male 10 -1.80 0.97
Female 29 -0.74 0.57

108
Table 4.20
2x2 ANOVA Posttest / Second Posttest Gains on Comprehension - Interaction
Source Sum of Squares df Mean Square F Sig.
Corrected Model 31.41a 3 10.47 1.12 0.36
Intercept 47.81 1 47.81 5.10 0.03
Condition 0.93 1 0.93 0.10 0.75
Gender 8.34 1 8.34 0.89 0.35
Condition * Gender 20.08 1 20.08 2.14 0.15
Error 328.29 35 9.38
Total 395.75 39
Corrected Total 359.69 38
Posttest / Second Posttest Gain – Application Items
Gain scores between the posttest and second posttest on application items
showed that there were no significant differences between the two conditions, F(1,36) =
0.63, p= 0.43, genders, F(1,36) = 2.96, p= 0.10. Results also exhibited a non-significant
interaction between the condition and gender, F(1,36) = 0.11, p= 0.74.

109
Table 4.21
2x2 ANOVA Posttest / Second Posttest Mean on Application
Condition n M SE
Control 15 -1.18 0.59
Experiment 19 -0.55 0.53
Gender
Male 9 -1.55 0.68
Female 25 -0.18 0.41
Table 4.22
2x2 ANOVA Posttest / Second Posttest Gains on Application - Interaction
Source Sum of Squares df Mean Square F Sig.
Corrected Model 14.50a 3 4.83 1.17 0.34
Intercept 19.59 1 19.59 4.75 0.04
Condition 2.61 1 2.61 0.63 0.43
Gender 12.23 1 12.23 2.96 0.10
Condition * Gender 0.47 1 0.47 0.11 0.74
Error 123.75 30 4.12
Total 147.25 34
Corrected Total 138.24 33

110
Posttest / Second Posttest Gain – Overall
Gain scores between the posttest and second posttest overall showed that there
were no significant differences between the two conditions, F(1,36) = 0.26, p= 0.61,
genders, F(1,36) = 3.07, p= 0.09. Results also exhibited a non-significant interaction
between the condition and gender, F(1,36) = 0.01, p= 0.94.
Table 4.23
2x2 ANOVA Posttest / Second Posttest Mean Overall
Condition n M SE
Control 15 -5.91 1.86
Experiment 19 -4.63 1.66
Gender
Male 9 -7.45 2.14
Female 25 -3.09 1.28

111
Table 4.24
2x2 ANOVA Posttest / Second Posttest Gains Overall - Interaction
Source Sum of Squares df Mean Square F Sig.
Corrected Model 143.31a 3 47.77 1.18 0.33
Intercept 725.37 1 725.37 17.90 0.00
Condition 10.71 1 10.71 0.26 0.61
Gender 124.31 1 124.31 3.07 0.09
Condition * Gender 0.21 1 0.21 0.01 0.94
Error 1215.55 30 40.518
Total 1947.75 34
Corrected Total 1358.86 33
Posttest / Second Posttest Gain Summary
To summarize the gains from the first posttest to the second posttest: there
were no significant differences between genders or conditions on knowledge,
comprehension, or application individually, nor were there significant differences in the
overall scores. Additionally there was no significant interaction between condition and
gender on any individual pieces or the overall assessment.
Overall Learning Summary
Summarizing gains related to the second posttest (from either the pretest or the
posttest) is straightforward – there were not significant differences in learning gains

112
between experimental conditions or gender, nor significant interactions between
condition and gender.
Gains from the pretest to the posttest (a three week difference) were more
nuanced. Males (from either condition) achieved significantly higher learning gains than
females on knowledge items. Males scores were significantly more affected by humor
than females on comprehension items and overall. These results will be examined in
more detail in chapter 5.
Humor Manipulation Check (HMC)
The HMC was examined by comparing scores for each of the three items and the
overall score between conditions and gender in a two-way ANOVA. A total of 55
participants took the HMC, 20 from U106 and 35 from COMM. The full survey can be
viewed in Appendix E.
Reliability
To determine the reliability of the 3-item HMC in this study, Cronbach’s Alpha
was run. In the control group with 29 participants, it was .89, and in the experimental
group it was .92. This is above .7, thus within satisfactory range for reliability (Kline,
2007).

113
Table 4.25
Cronbach’s Alphas for the Humor Manipulation Check
Condition n α items
Control 29 0.89 3
Experiment 26 0.92 3
Note: n represents the number of participants’ data, while items represent the number of items
on the assessment
Not Funny - Funny
Scores on the HMC scale for the Not Funny – Funny item showed no significant
differences between the two conditions, F(1,54) = 0.11, p= 0.74, or between the genders,
F(1,54) = 0.07, p= 0.80. Results also exhibited a non-significant interaction between the
condition and gender, F(1,54) = 0.00, p= 0.95.
Table 4.26
2x2 ANOVA HMC Score Mean - Funny
Condition n M SE
Control 29 0.95 0.36
Experiment 26 0.77 0.39
Gender
Male 16 0.93 0.45
Female 39 0.79 0.29

114
Table 4.27
2x2 ANOVA HMC Score Mean - Funny - Interaction
Source Sum of Squares df Mean Square F Sig.
Corrected Model .77a 3 .25 .08 .97
Intercept 33.21 1 33.21 10.41 .00
Condition .36 1 .36 .11 .74
Gender .21 1 .21 .07 .80
Condition * Gender .01 1 .01 .00 .95
Error 162.76 51 3.19
Total 202.00 55
Corrected Total 163.53 54
Not Humorous - Humorous
Scores on the HMC scale for the Not Humorous – Humorous item showed no
significant differences between the two conditions, F(1,54) = 0.20, p= 0.66, or between
the genders, F(1,54) = 2.87, p= 0.10, p= 0.80. Results also exhibited a non-significant
interaction between the condition and gender, F(1,54) = 3.02, p= 0.09.
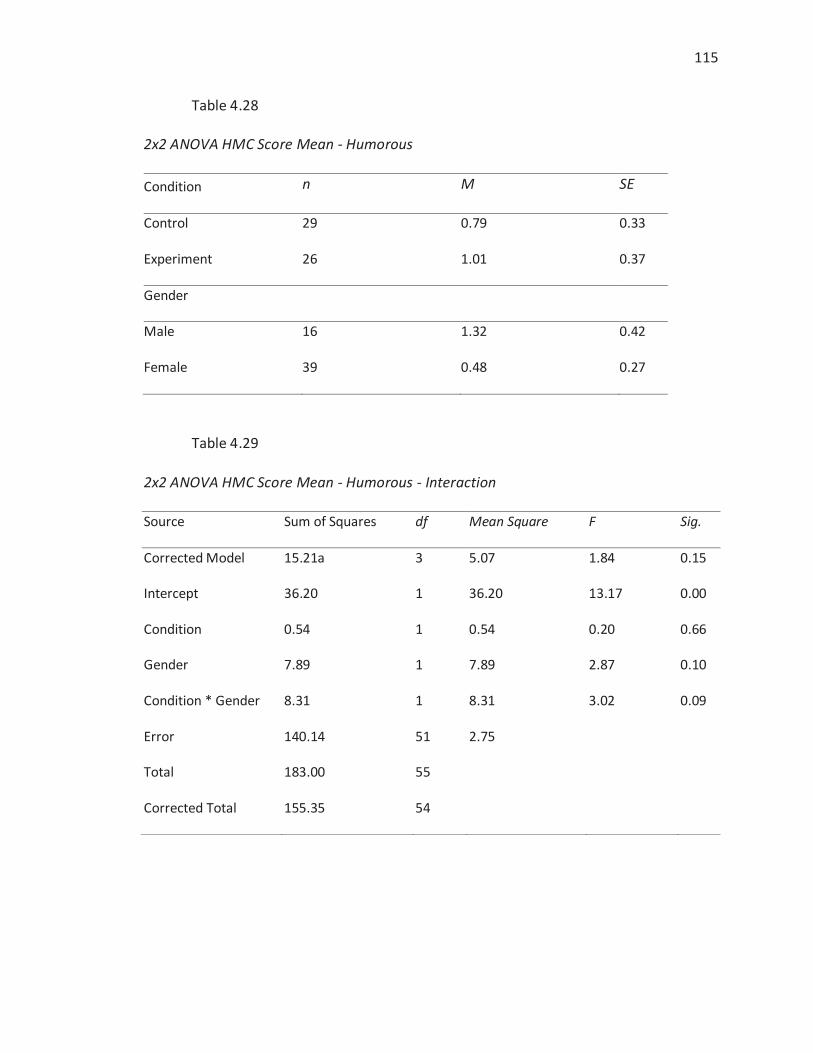
115
Table 4.28
2x2 ANOVA HMC Score Mean - Humorous
Condition n M SE
Control 29 0.79 0.33
Experiment 26 1.01 0.37
Gender
Male 16 1.32 0.42
Female 39 0.48 0.27
Table 4.29
2x2 ANOVA HMC Score Mean - Humorous - Interaction
Source Sum of Squares df Mean Square F Sig.
Corrected Model 15.21a 3 5.07 1.84 0.15
Intercept 36.20 1 36.20 13.17 0.00
Condition 0.54 1 0.54 0.20 0.66
Gender 7.89 1 7.89 2.87 0.10
Condition * Gender 8.31 1 8.31 3.02 0.09
Error 140.14 51 2.75
Total 183.00 55
Corrected Total 155.35 54

116
Not Amusing - Amusing
Scores on the HMC scale for the Not Amusing – Amusing item showed no
significant differences between the two conditions, F(1,54) = 0.13, p= 0.72, or between
the genders, F(1,54) = 0.98, p= 0.33. Results also exhibited a non-significant interaction
between the condition and gender, F(1,54) = 0.24, p= 0.62.
Table 4.30
2x2 ANOVA HMC Score Mean - Amusing
Condition n M SE
Control 29 0.88 0.34
Experiment 26 1.06 0.37
Gender
Male 16 1.21 0.42
Female 39 0.72 0.27
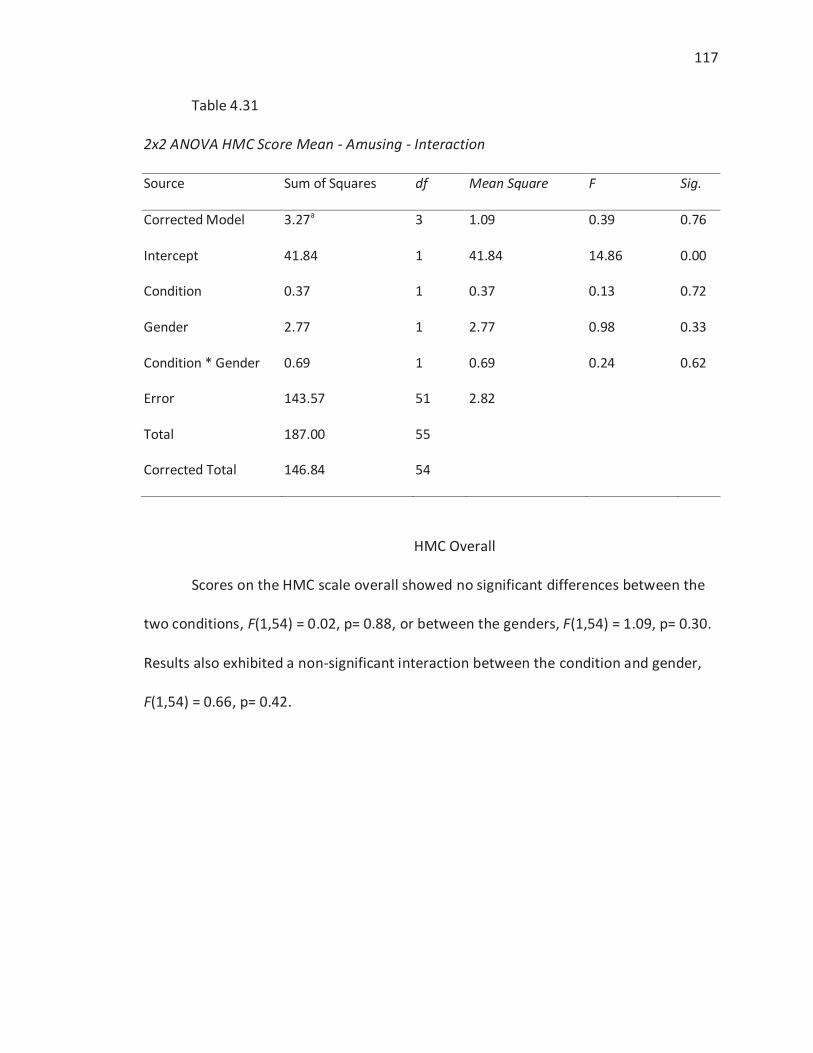
117
Table 4.31
2x2 ANOVA HMC Score Mean - Amusing - Interaction
Source Sum of Squares df Mean Square F Sig.
Corrected Model 3.27a 3 1.09 0.39 0.76
Intercept 41.84 1 41.84 14.86 0.00
Condition 0.37 1 0.37 0.13 0.72
Gender 2.77 1 2.77 0.98 0.33
Condition * Gender 0.69 1 0.69 0.24 0.62
Error 143.57 51 2.82
Total 187.00 55
Corrected Total 146.84 54
HMC Overall
Scores on the HMC scale overall showed no significant differences between the
two conditions, F(1,54) = 0.02, p= 0.88, or between the genders, F(1,54) = 1.09, p= 0.30.
Results also exhibited a non-significant interaction between the condition and gender,
F(1,54) = 0.66, p= 0.42.

118
Table 4.32
2x2 ANOVA HMC Score Mean – HMC Overall
Condition n M SE
Control 29 2.61 0.95
Experiment 26 2.83 1.05
Gender
Male 16 3.46 1.19
Female 39 1.99 0.76
Table 4.33
2x2 ANOVA HMC Score Mean – HMC Overall - Interaction
Source Sum of Squares df Mean Square F Sig.
Corrected Model 37.10a 3 12.37 0.55 0.65
Intercept 332.99 1 332.99 14.87 0.00
Condition 0.55 1 0.55 0.02 0.88
Gender 24.31 1 24.31 1.09 0.30
Condition * Gender 14.69 1 14.69 0.66 0.42
Error 1142.10 51 22.39
Total 1496.00 55
Corrected Total 1179.20 54

119
HMC Summary
Results from the two-way ANOVAs for each item in the HMC and for the overall
HMC score showed no significant differences between conditions or gender. Results also
indicated no significant interactions between the condition and gender factors.
Motivation Survey
The Instructional Materials Motivation Survey (IMMS) developed by Keller (2010)
was given online after the instructional intervention. It came after the video and
learning questions. A total of 55 participants took the IMMS, 20 from U106 and 35 from
COMM. The full survey can be viewed in Appendix D.
IMMS Reliability
Cronbach’s Alpha was performed on the IMMS as a whole, comparing across
conditions.
For the control group (N=29), the overall IMMS score on the 36 questions
was .92. Alpha for the twelve attention items was .92, for the nine relevance items .73,
for the nine confidence items .84, and for the six satisfaction items .78. For the control
group (N=26), the overall IMMS score on 36 questions was .94. Alpha for the twelve
attention items was .91, for the nine relevance items .81, for the nine confidence
items .74, and for the six satisfaction items .84. With scores ranging from .73 individually
to .94 overall, the scale can be considered reasonably reliable according to Kline (2007).

120
Table 4.34
Cronbach’s Alphas for IMMS Survey Between Conditions in Final Study
Category Condition n α items
Attention Control 29 0.86 12 Experiment 26 0.91 12
Relevance Control 29 0.75 9 Experiment 26 0.81 9
Confidence Control 29 0.84 9 Experiment 26 0.74 9
Satisfaction Control 29 0.78 6 Experiment 26 0.84 6
Overall Control 29 0.92 36
Experiment 26 0.94 36
Note: n represents the number of participants’ data; items represents the number of items on
the assessment
IMMS Scores
Categories within the IMMS, and the IMMS overall score were compared with a
two-way ANOVA using experimental condition and gender as factors.
Attention
Scores on the attention items from the IMMS showed no significant differences
between the two conditions, F(1,53) = 0.02, p= 0.88, or between the genders, F(1,53) =
1.00, p= 0.32. Results also exhibited a non-significant interaction between the condition
and gender, F(1,53) = 2.00, p= 0.16.

121
Table 4.35
2x2 ANOVA IMMS Score Mean – Attention
Condition n M SE
Control 28 43.47 1.89
Experiment 26 43.91 2.06
Gender
Male 16 45.09 2.35
Female 38 42.29 1.51
Table 4.36
2x2 ANOVA IMMS Score Mean – Attention - Interaction
Source Sum of Squares df Mean Square F Sig.
Corrected Model 265.9a 3 88.64 1.02 0.39
Intercept 85011.51 1 85011.51 975.35 0.00
Condition 2.11 1 2.11 0.02 0.88
Gender 87.16 1 87.16 1.00 0.32
Condition * Gender 174.75 1 174.75 2.00 0.16
Error 4358.00 50 87.16
Total 104642.00 54
Corrected Total 4623.93 53

122
Relevance
Scores on the relevance items from the IMMS showed no significant differences
between the two conditions, F(1,53) = 0.11, p= 0.74, or between the genders, F(1,53) =
0.25, p= 0.62. Results also exhibited a non-significant interaction between the condition
and gender, F(1,53) = 2.92, p= 0.09.
Table 4.37
2x2 ANOVA IMMS Score Mean – Relevance
Condition n M SE
Control 28 32.94 1.18
Experiment 26 32.35 1.29
Gender
Male 16 33.09 1.47
Female 38 32.21 0.95

123
Table 4.38
2x2 ANOVA IMMS Score Mean – Relevance - Interaction
Source Sum of Squares df Mean Square F Sig.
Corrected Model 150.26a 3 50.08 1.47 0.23
Intercept 47476.99 1 47476.99 1395.60 0.00
Condition 3.89 1 3.89 0.11 0.74
Gender 8.56 1 8.56 0.25 0.62
Condition * Gender 99.41 1 99.41 2.92 0.09
Error 1700.95 50 34.02
Total 58629.00 54
Corrected Total 1851.20 53
Confidence
Scores on the confidence items from the IMMS showed no significant differences
between the two conditions, F(1,53) = 0.59, p= 0.45, or between the genders, F(1,53) =
0.01, p= 0.94. However, results exhibited a significant interaction between the condition
and gender, F(1,53) = 3.91, p= 0.05. A plot of the means indicated that the humor
condition positively influenced males more than it influenced females in perception of
confidence of the instruction.
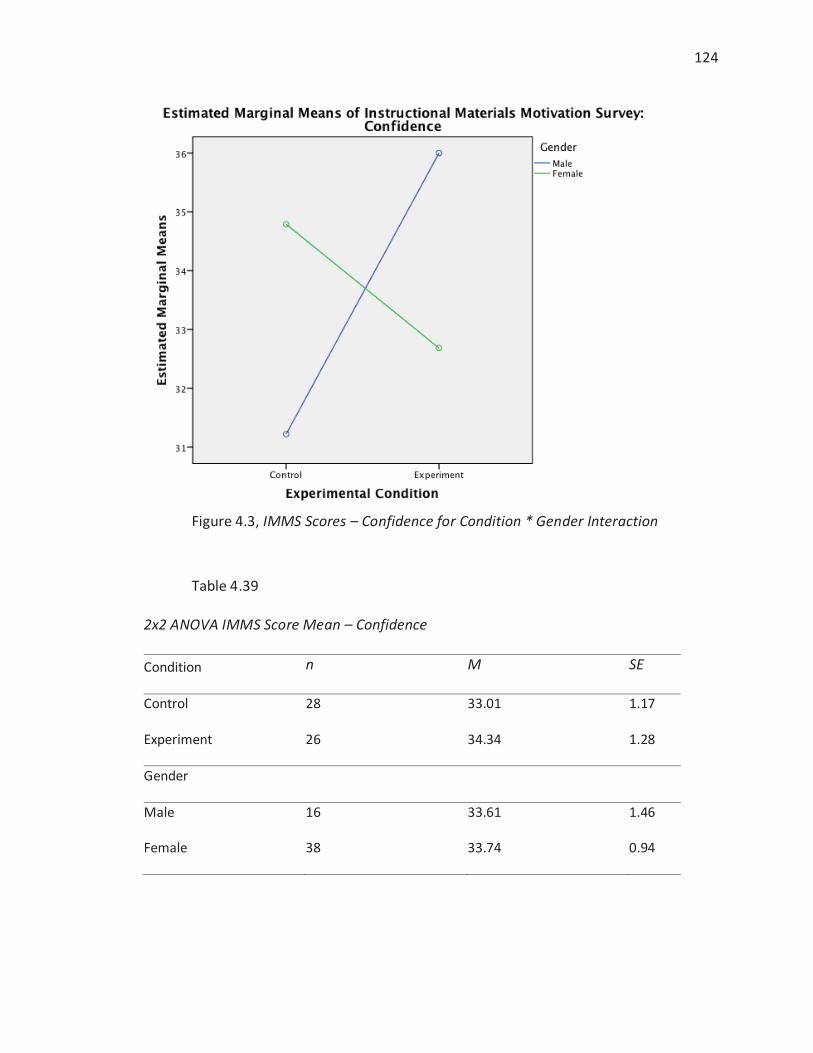
124
Figure 4.3, IMMS Scores – Confidence for Condition * Gender Interaction
Table 4.39
2x2 ANOVA IMMS Score Mean – Confidence
Condition n M SE
Control 28 33.01 1.17
Experiment 26 34.34 1.28
Gender
Male 16 33.61 1.46
Female 38 33.74 0.94

125
Table 4.40
2x2 ANOVA IMMS Score Mean – Confidence - Interaction
Source Sum of Squares df Mean Square F Sig.
Corrected Model 134.02a 3 44.67 1.33 0.28
Intercept 50505.01 1 50505.01 1498.83 0.00
Condition 19.88 1 19.88 0.59 0.45
Gender 0.18 1 0.18 0.01 0.94
Condition * Gender 131.88 1 131.88 3.91 0.05*
Error 1684.82 50 33.70
Total 62823.00 54
Corrected Total 1818.83 53
Note: *Significant at the p=.05 level.
Satisfaction
Scores on the satisfaction items from the IMMS showed no significant
differences between the two conditions, F(1,53) = 0.16, p= 0.69. However, males scored
significantly higher than females, F(1,53) = 4.10, p= 0.05. Results exhibited a non-
significant interaction between the condition and gender, F(1,53) = 1.23, p= 0.27.

126
Table 4.41
2x2 ANOVA IMMS Score Mean – Satisfaction
Condition n M SE
Control 28 19.10 1.00
Experiment 26 19.68 1.09
Gender
Male 16 20.89 1.24
Female 38 17.89 0.80
Table 4.42
2x2 ANOVA IMMS Score Mean – Satisfaction - Interaction
Source Sum of Squares df Mean Square F Sig.
Corrected Model 121.76a 3 40.59 1.67 0.19
Intercept 16748.75 1 16748.75 688.34 0.00
Condition 3.81 1 3.81 0.16 0.69
Gender 99.82 1 99.82 4.10 0.05*
Condition * Gender 29.85 1 29.85 1.23 0.27
Error 1216.61 50 24.33
Total 20304.00 54
Corrected Total 1338.37 53
Note: *Significant at the p=.05 level.

127
IMMS Overall
Scores on the HMC scale overall showed no significant differences between the
two conditions, F(1,53) = 0.12, p= 0.73, or between the genders, F(1,53) = 1.07, p= 0.31.
Results also exhibited a non-significant interaction between the condition and gender,
F(1,53) = 3.62, p= 0.06.
Table 4.43
2x2 ANOVA IMMS Score Mean – Overall
Condition n M SE
Control 28 130.95 4.26
Experiment 26 133.16 4.65
Gender
Male 16 135.33 5.30
Female 38 128.79 3.41

128
Table 4.44
2x2 ANOVA IMMS Score Mean – Overall - Interaction
Source Sum of Squares df Mean Square F Sig.
Corrected Model 2064.26a 3 688.09 1.55 0.21
Intercept 776732.35 1 776732.35 1753.57 0.00
Condition 54.31 1 54.31 0.12 0.73
Gender 475.66 1 475.66 1.07 0.31
Condition * Gender 1602.87 1 1602.87 3.62 0.06
Error 22147.16 50 442.94
Total 943323.00 54
Corrected Total 24211.43 53
IMMS Results Summary
Results from the IMMS showed two significant results, but not on the attention
items where predicted. On confidence items, humor influenced males significantly more
than females in a positive way. Males perceived the instructional videos to be more
satisfying than females.
Open-Ended Items
The control group (n=26) was asked one open-ended question (in addition to the
learning assessments, which were also open-ended). The question asked how the video
could have been improved. The experimental group (n=24) was asked the same

129
question with two additional questions, one asking their thoughts on the humor in the
video and one asking their thoughts about humor in instructional videos generally.
Results from these questions were coded in conjunction with a colleague from
the library. They were categorized and coded very simply with 100% agreement. Only
including two representative comments in each category will be used to preserve the
flow of the study results. All comments can be viewed in Appendix G.
Control Group
In the control group, one response was negative (female), fifteen were neutral
(male=5, female=10), and ten (male=2, female=8) were positive. The one negative
response, from a female, was that “the subject itself was boring… maybe have real
people or something that is more eye grabbing.”
Neutral responses either expressed no strong opinion. From a female: “I cannot
think of any [changes],” or balanced a negative comment with a positive one from a
male, “Its [sic] just a dry topic but the voice over makes it decent.” Four of the
comments focused on the need for more, or better examples, like this one from a
female, “More examples to keep the audience engaged,” and this from a male, “More
varied information and more complicated examples.” These comments are interesting
given that the interesting examples were removed due to concern that they would
confound the effects of humor. As common as the request for more examples was a
request for more color in the video, which was done in black and white. From a male,
“More colors,” and from a female, “Maybe a bit more color?" A few comments were
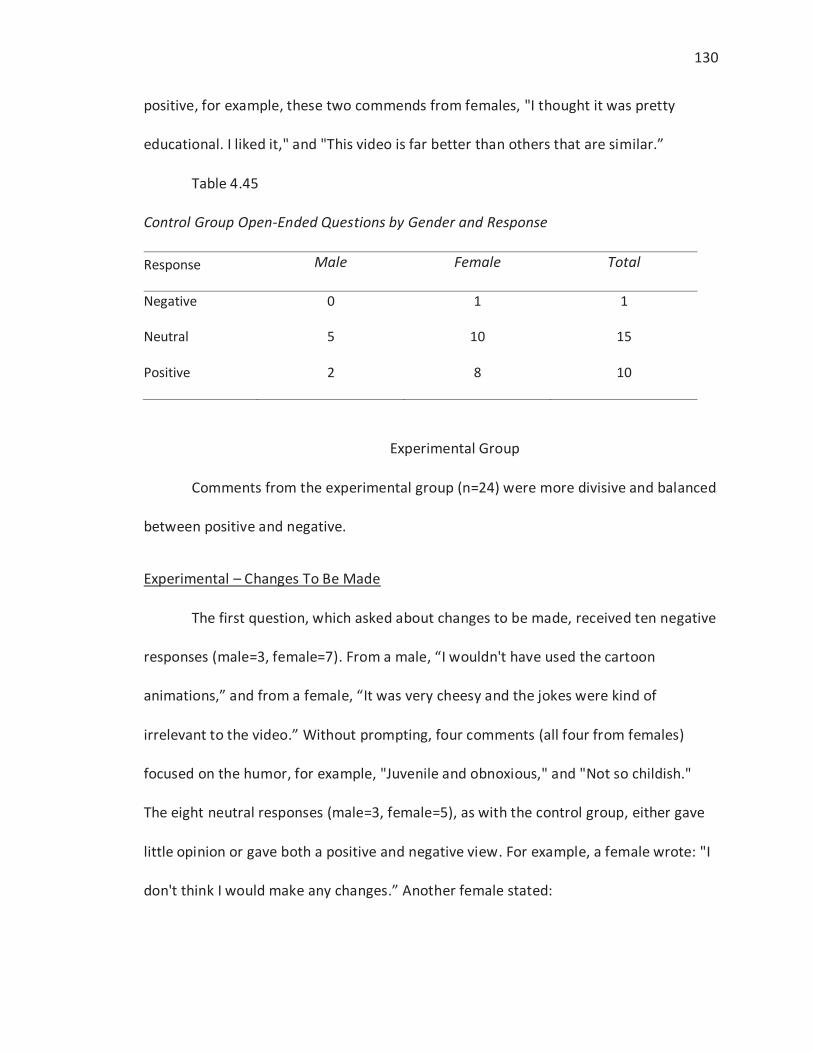
130
positive, for example, these two commends from females, "I thought it was pretty
educational. I liked it," and "This video is far better than others that are similar.”
Table 4.45
Control Group Open-Ended Questions by Gender and Response
Response Male Female Total
Negative 0 1 1
Neutral 5 10 15
Positive 2 8 10
Experimental Group
Comments from the experimental group (n=24) were more divisive and balanced
between positive and negative.
Experimental – Changes To Be Made
The first question, which asked about changes to be made, received ten negative
responses (male=3, female=7). From a male, “I wouldn't have used the cartoon
animations,” and from a female, “It was very cheesy and the jokes were kind of
irrelevant to the video.” Without prompting, four comments (all four from females)
focused on the humor, for example, "Juvenile and obnoxious," and "Not so childish."
The eight neutral responses (male=3, female=5), as with the control group, either gave
little opinion or gave both a positive and negative view. For example, a female wrote: "I
don't think I would make any changes.” Another female stated:

131
I thought sometimes it got to be a little too random and off topic. I think
if I really needed to and wanted to learn about citing sources then I
would just want the informational and skip the funny. However, I really
enjoyed the humor.
Six comments were positive (male=1, female=5). From two females, "I would not
have been able to do this better. Loved it!," and "It's cut e [sic] and to the point." There
were three comments about adding more color.
Table 4.46
Experimental Group Open-Ended Question – Changes to be Made - by Gender and
Response
Response Male Female Total
Negative 3 7 10
Neutral 3 5 8
Positive 1 5 6
Experimental - Humor in the Video
On the question about the humor in the video, there were five negative
comments, all from females: "I'm not a fan of shark-nato [sic] so I didn't get the
references and fast-forwarded through those parts," and "It was not very funny to me. I
was more of laughing at it then with it." There were seven neutral comments (male=3,
female=4), such as this one from a female, "I like the originality but it just wasn't my

132
kind of humor but that doesn't mean it couldn't be someone else's." Another female
wrote, "It was almost annoying, but I chuckled, so I would not say I would complain.”
Finally, there were twelve positive comments (male=4, female=8). A female wrote, "I
thought the humor was a great addition to the video. It made me a little more
interested in learning what it was about. If there was no humor I would probably not
have paid attention to the video.” Another female wrote, "Great. Loved the voices."
Table 4.47
Experimental Group Open-Ended Question – Humor in This Video - by Gender and
Response
Response Male Female Total
Negative 0 5 5
Neutral 3 4 7
Positive 4 8 12
Experimental – Humor in Other Instructional Videos
In the third question, about humor in other instructional videos (n=23), four
comments were negative (male=1, female=3). A female wrote, “Usually not funny - I'd
rather a shorter, more direct video. Reminded me of that one person in class who never
stops interrupting," and from another female, "They were pretty annoying." Seven
comments were neutral (male=3, female=4), for example from a male:

133
I have seen some others that were funny with the way they used real
people in the videos. Others seem to be dry because they are held by
ethics of the university and are not able to branch out to get people
involved.
A female wrote, "If it's relevant to what I am learning about I like it, but if it isn't,
it is kind of pointless." Finally, twelve comments were positive (male=3, female=9). A
female wrote, “I think its [sic] a great addition. For example, Bill Nye the Science Guy
was a great man," and another female wrote, "I always think it helps me learn, relate,
and retain information better."
Table 4.48
Experimental Group Open-Ended Question – Humor in Instructional Videos in General -
by Gender and Response
Response Male Female Total
Negative 1 3 4
Neutral 3 4 7
Positive 3 9 12

134
Summary
Non-Humor Video
Overall comments suggesting changes to the non-humor video were largely
neutral. There were several positive comments spread evenly between genders and one
negative comment from a female.
Humor Video
Comments suggesting changes to the humor video were more divisive, with
slightly more negative comments (42%), followed by neutral (33%), then positive (25%).
Negative comments were fairly even between genders. In proportion to their overall
comments, females (29%) shared more positive comments than males (14%).
On the next question on the humor specific to this study’s experimental video,
there were more positive comments overall (50%), followed by comments that were
neutral (29%) and negative (21%). Interestingly, the negative comments were from only
females.
On the final question about humor in instructional videos in general, more
comments were positive (52%), followed by neutral (30%) and then negative (17%). In
proportion to their total number, females (56%) were slightly more positive than males
(43%).
Thus it appears that the humor in the experimental video drew out a strong
response. Comments about the non-humor video were balanced between males and
females. Comments about the humor in the experimental video were more negative

135
among females, though females did give positive comments about humor in
instructional videos in general. Thus it appears that there may have been a disconnect
between the humor they usually enjoy in instructional videos and the humor in the
experimental video in this study.
Correlations
Correlations were run to determine if there were relationships between the
prepost, pre2post, HMC, and IMMS. These correlations were run within each condition,
overall, within gender, and within courses.
Overall
Overall there were no significant correlations between factors within the non-
humor control group. However, within the humor experimental group, significant
correlations were found between prepost and HMC scores [r = .66, n = 25, p = .00],
prepost and the IMMS [r = .43, n = 25, p = .03], and the HMC and IMMS [r = .79, n = 26,
p = .00]. In addition, a significant positive correlation was found in the humor group
between the prepost and pre2post scores [r = .48, n = 19, p = .04]. In other words, there
was a positive relationship between high scores on the prepost and students’
perceptions of humor and motivation of the video, and a very strong positive
relationship between perception of humor in the video and perception of motivation in
the video. Finally, there was a positive relationship between scores on the prepost and
pre2post scores.

136
Table 4.49
Correlational Results for All Participants
Control Prepost Pre2post HMC IMMS Prepost -- .330 .298 .029 Pre2post -- .392 -.043 HMC -- .041 IMMS --
Experimental Prepost Pre2post HMC IMMS Prepost -- .48* .66** .43* Pre2post -- 0.24 0.14 HMC -- .79** IMMS --
Note: *p<.05, **p<.01
Genders
Correlations were also done within gender groups. Among males, in the non-
humor group there were no significant correlations. In the humor group, there were
significant correlations between scores on the prepost and the HMC [r = .94, n = 7, p
= .00], prepost and IMMS [r = .86, n = 7, p = .01], and HMC and IMMS [r = .76, n = 7, p
= .05]. Thus, there was a very strong positive relationship for males in the humor group
between their prepost scores and perception of the video as funny, their prepost scores
and perception of the video as motivating, and their perception of the video as funny
and perception of the video as motivating.

137
Table 4.50
Correlational Results for Male Participants
Control Prepost Pre2post HMC IMMS Prepost -- -0.49 0.61 -0.15 Pre2post -- 0.51 0.25 HMC -- 0.29 IMMS --
Experimental Prepost Pre2post HMC IMMS Prepost -- 0.31 .94** .86* Pre2post -- 0.08 0.61 HMC -- .76* IMMS --
Note: *p<.05, **p<.01
Among females, in the non-humor group there were no significant correlations.
In the humor group, there were significant correlations between scores on the prepost
and the HMC [r = .50, n = 18, p = .04] and HMC and IMMS [r = .80, n = 19, p = .00]. In
addition there was a significant correlation between prepost and pre2post scores [r
= .58, n = 14, p = .03]. Thus, there was a very strong positive relationship for females in
the humor group between their prepost scores and perception of the video as funny,
and their perception of the video as funny and perception of the video as motivating.
Finally, there was a strong positive relationship between how well females performed
on the first posttest and how they performed on the second posttest.
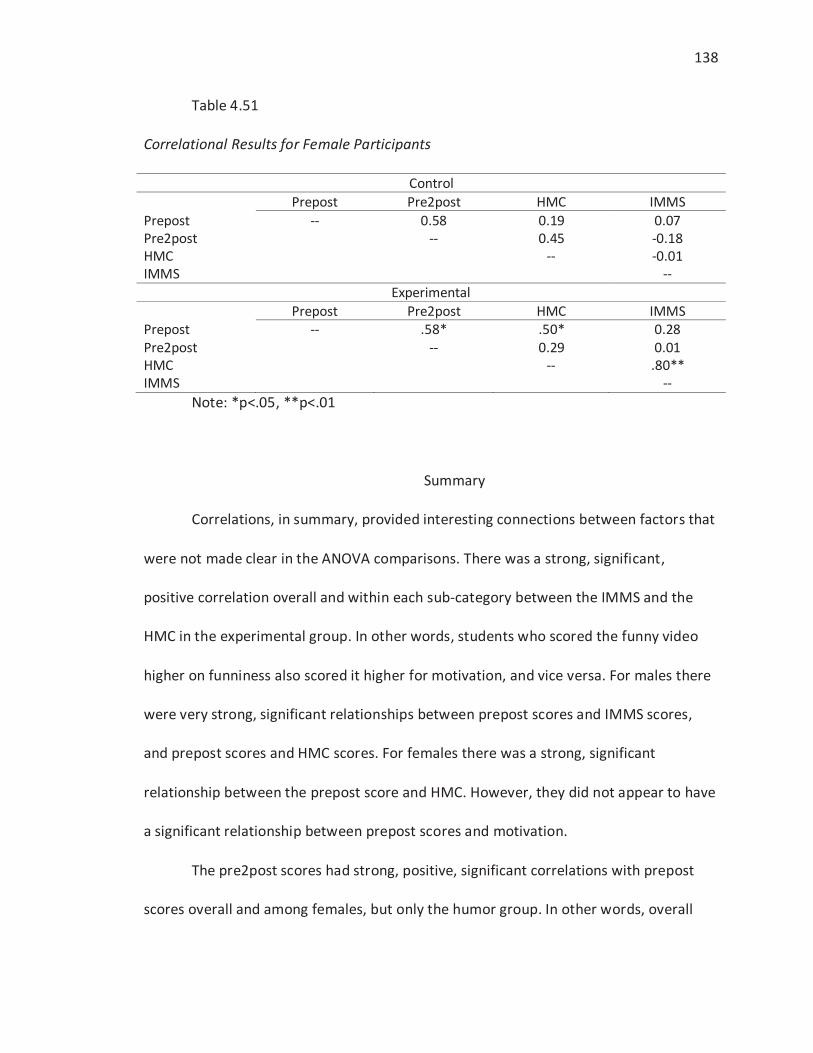
138
Table 4.51
Correlational Results for Female Participants
Control Prepost Pre2post HMC IMMS Prepost -- 0.58 0.19 0.07 Pre2post -- 0.45 -0.18 HMC -- -0.01 IMMS --
Experimental Prepost Pre2post HMC IMMS Prepost -- .58* .50* 0.28 Pre2post -- 0.29 0.01 HMC -- .80** IMMS --
Note: *p<.05, **p<.01
Summary
Correlations, in summary, provided interesting connections between factors that
were not made clear in the ANOVA comparisons. There was a strong, significant,
positive correlation overall and within each sub-category between the IMMS and the
HMC in the experimental group. In other words, students who scored the funny video
higher on funniness also scored it higher for motivation, and vice versa. For males there
were very strong, significant relationships between prepost scores and IMMS scores,
and prepost scores and HMC scores. For females there was a strong, significant
relationship between the prepost score and HMC. However, they did not appear to have
a significant relationship between prepost scores and motivation.
The pre2post scores had strong, positive, significant correlations with prepost
scores overall and among females, but only the humor group. In other words, overall
139
and among females, scores on the second posttest could be predicted by scores on the
first posttest.
Summary of Results
The purpose of this study was to determine the effects of adding humor to an
instructional video on learning and motivation.
The first research question for this study was:
R1 – Does adding humor to an instructional video influence learning?
H1 – Adding humor to an instructional video will improve learning.
Results indicated that overall, students who watched the humorous instructional
video did not score higher at the p<.05 significance level on the learning assessments.
Thus there is not enough evidence to support the hypothesis that adding humor
improved learning. However, results indicate the humor had a stronger affect on
learning for males than on females, overall and on comprehension items.
The second research question was:
R2 – Does adding humor to an instructional video influence motivation?
H2 – Adding humor to an instructional video will improve motivation.
Results indicate no significant difference between those who watched the
humorous video and those who watched the non-humorous video in terms of scores on
motivation assessments. Thus there is not enough evidence to support the hypothesis
that humor improves motivation. One wrinkle in the analysis is that humor influenced
males significantly in a positive way in terms of confidence.
The third research question was:

140
R3 – Does the gender of the student influence learning or motivation?
H3 – The gender of the student will not influence learning or motivation.
Results indicate that gender did influence learning – males overall (from either
condition) scored significantly higher than females on gains from the pretest to the
posttest. In addition, male scores were significantly more affected by the humor in this
instructional video than females on comprehension items and overall.
For motivation, humor influenced males significantly more than females in a
positive way. Also, males perceived the instructional videos to be more satisfying than
females. Thus the hypothesis that gender would not influence learning or motivation is
not supported.
141
CHAPTER 5 DISCUSSION
Learning Assessment and Perception of Humor
Learning assessments indicated that on the whole, neither condition learned
significantly more from the pretest to the posttest or second posttest. However, gender
was added as a factor because of its effects on perception in instruction from previous
studies (Gorham & Christophel, 1990; Tamborini & Zillmann, 1981). In this study, males
had higher learning gains on knowledge items, and were more strongly influenced on
comprehension items and on the overall score by the humor in the experimental
condition. This may indicate that their positive experience of humor in the video
improved their learning of video content. Additionally, the data from the open-ended
questions indicate that while females appreciated the humor in the video, those that did
not may have had a negative experience. These results indicate gender can be an
additional dimension to the use of humor in instruction. The same humor may work
better with one gender or the other, or neither, and should be taken into account when
designing humor.
A few factors may have skewed the humor in this study to favor males. First, the
humor was developed by a male (the researcher), and was gauged by him to be funny.
Without testing the humor in a larger mixed-gender population perception of
humor may have worked for those with homogenous views to the researcher.
Second, both characters in the video were male. In particular, the student
character in the video, with whom the viewers were to relate, was male, which may

142
have alienated female students, who felt they could not identify with him. His
relatability may also have been hurt by being the focus of the humor with his bizarre
antics, giving female students two layers to push through to relate to him.
Third, males may appreciate humor in instruction more in general. Gorham and
Christophel (1990) reported in a study of male and female student perception of humor,
“male students were more affected by teachers’ use of humor than were female
students” (p. 55); their work also indicated that perception of learning, attitude towards
the course, and intent to enroll in another course with the instructor were significantly
positively correlated with the amount of humor in a lecture, where the same factors for
females were significantly correlated.
In terms of the humor itself, it may be most closely compared with self-
disparaging jokes, since Joe, the learner in the video, was designed to be odd, out of
touch, and obsessive. Tamborini and Zillman (1981) reported that male students found
self-disparaging male instructors more appealing than female students did. They suggest
that in a largely female class, a male instructor would “probably benefit from the use of
sexual humor, whereas a female professor would do better to use self-disparaging
humor” (Tamborini & Zillmann, 1981, p. 432).
However, an additional wrinkle here is that the video was not a direct
communication to the student, and the jokes or disparaging remarks were not made
about the instructor, they were made about the student. In essence, the humorous
video was a sketch with the instructor as the “straight man” and the student as the
“comedy”. This approach may be a departure from what students are used to viewing in
143
instructional videos, which tend to be approximations of lectures. It might be best
compared to humorous, educational sketches, like those seen on Sesame Street, which
may not be a format college students interpret as age-appropriate. This may account for
comments in the open-ended surveys like “juvenile”. Both the humor and non-humor
videos were cartoon animations. The humorous video relied partly on visual humor and
partly on verbal humor. One study that tested humorous cartoons found that males
tend to enjoy more visual humor (Mundorff, Bhatia, Zillman, Lester, & Robertson, 2009).
With these limitations in mind, however, it appears that the humor worked for
some of the students. The high, significant correlation between perception of humor
and gains between the pretest and posttest indicate that along with gender, perception
of humor may have been hidden in the general results. In this way perception of humor
may be seen as a third dimension or factor. Overall and within each gender perception
of humor in the experimental group was positively, significantly correlated with the gain
from pretest to posttest, though the correlation was much higher for males (.94). In
other words, to the degree that they thought the experimental video was funny, they
scored more highly on the test. The relationship between those variables could bear
more scrutiny in future studies.
Motivation
Scores on the IMMS were not significantly higher for either the humor or non-
humor group. However, the second dimension, gender, came into play. Males found the
humorous video to be more satisfying, and males were more influenced than females by
the humorous video to feel confident in the instruction. Missing from these significant

144
results is attention, which was perceived to be the category most related to humor by
Keller (Keller, 2010). This is also confusing in light of responses to the open-ended
questions. Four students in the experimental group mentioned attention specifically.
One student indicated, “If there was no humor I would probably not have paid attention
to the video.” Another wrote, “It was just enough to keep my attention but not so corny
and overboard that I stopped paying attention.” While the humor helped maintain
attention for the students who commented, it did not do so overall.
Looking more carefully at Keller’s approach to the satisfaction scale may be
helpful in explaining why males perceived it to be significantly higher. Much of his focus
is on a sense of accomplishment after finishing a task, but it also includes whether or
not the instructional experience was pleasant (Keller, 2010). Of the six questions on the
satisfaction scale on the IMMS, three deal with the sense of accomplishment, and three
deal with a pleasant experience. The three for the pleasant experience are: 14) “I
enjoyed this video so much that I would like to know more about this topic”, 21) “I really
enjoyed watching this video”, and 36) “It was a pleasure to watch such a well-designed
video” (Keller, 2010, pp. 283–284). It may be that males had a more pleasant experience
and thus rated the satisfaction items higher.
For the influence of males on confidence items, it may be that the humor helped
reduce tension in learning the content and thus increase their confidence – Keller
describes one of the roles of building confidence as reducing anxiety (Keller, 2010),
which aligns with research indicating that humor can have that effect (Askildson, 2005).

145
Finally, it should be noted that the data show a significant correlation between
perception of humor and perception of motivation for all students in the experimental
condition (r = .79, p < .01). This speaks to the concept of the third dimension, perception
of humor, which may sometimes be independent of gender. For students of either
gender who found it funny, there was a strong likelihood that they also found it
motivating, with the opposite being true as well.
Humor Manipulation Check and Instructional Video
A key indicator of the validity of the instructional instrument, the video with the
humor, is its perception as a humorous intervention. Various studies have tested the
humor in their instruction to ensure that students perceived it to be humorous (for
example, Ghaffari & Mohamadi, 2012; Kaplan & Pascoe, 1977). In this study the
humorous video was not found funnier than the non-humorous video. This is a key issue
talked about briefly in Chapter 2 in terms of the subjectivity of humor (Garner, 2006). It
has also been discussed in this chapter in terms of a third, hidden dimension in a study
like this.
A key part of any comedian’s life is trying out new material. In a TV special,
popular comedians Louis CK, Chris Rock, Jerry Seinfeld, and Ricky Gervais discuss trying
new ideas or bits and modifying them if they don’t work (Moffitt, 2011). If these
successful entertainers are careful about crafting jokes that are widely accessible and
appreciated, humor in the classroom would be best served by following this same
practice. A limitation of this study was that there were not enough iterations of the

146
humorous content with a large enough population to determine that the humor was
valid.
One factor that may have influenced the perception of humor was the format.
Both videos were animated conversations between friendly cartoon-looking characters.
This varies from traditional educational experiences and even traditional online video
educational experiences. It could be that the animated cartoon format raised the
perceived humor level of both conditions. Positive comments about how to improve the
non-humor video alluded to its unintended entertainment value: “I actually liked it. I
think it was useful and entertaining”; “The content of the video itself was interesting
and creatively done.” In addition, comments in the experimental group alluded to the
animated medium as somewhat adolescent: “I wouldn't have used the cartoon
animations,” and “Not so childish.”
In addition, the humor itself seemed to be only partially effective. One student
commented about changes to be made to the video, “ I thought sometimes it got to be a
little too random and off topic…I would just want the informational and skip the funny.”
This may have been a result of the deliberate decision to use non-content related
humor because it would jeopardize the study design. Some specifically noted that they
recognized the humor but did not enjoy it: “I like the originality but it just wasn't my
kind of humor.” While there were also positive comments about the humor, reporting
that the humor was a valuable addition, the loss of a few students’ attention through
distraction or annoyance is worth keeping in mind in instructional development.

147
Format may have made a difference in another way. A study described earlier
found that humor in textbooks was perceived poorly by students (Klein et al., 1982).
Instructional videos appear to fall somewhere between books and live lecture; like a
textbook, sections of video instruction can be skipped or reviewed. Perhaps lessons
learned from textbooks about avoiding humor and focusing only on content apply to
instructional videos as well.
However, there was some utility in this tool to correlate perception of humor
with learning. Although males in the humor condition did not rate their video
significantly higher on the HMC, those who scored higher on learning items in the
posttest did rate it more highly. This silver lining indicates that while the humor used
was not to all tastes, for those that did find it humorous there was a corresponding level
of motivation.
Limitations
This section will explore the limitations of the current study in terms of research
design, instruments, and participants.
Research Design and Instruments
The current research design, a pretest / posttest / second posttest approach,
was useful in determining change over time. However, a large number of students were
lost between the pretest and the posttest: 43 students from COMM 302 and 51
students from U106, for a total of 94 students, finished the initial survey. If the study
had been designed for a single session, it’s likely that the final number of participants
would have increased dramatically from the final 55 that took all three, giving results

148
more statistical strength. This may be the reason for Mayer’s single-session research
approach.
Giving the survey to students online, without monitoring their experience or
knowing how they came to the answers they did, was another limitation of the current
study. While it appears that almost all students wrote answers in their own words, it is
conceivable that they shared answers with each other or looked them up online.
However, part of the rationale for this approach is the increase in online learning and
the increasing lack of face-to-face interactions, and in these online environments there
are limitations on what can be controlled by the instructor.
As mentioned earlier, the failure of the humorous instructional video to be
perceived as significantly more humorous by the participants is a major limitation. Were
the study to be repeated, two changes related to the humor in the instructional
instrument would be made. First, the instructional style of the video would conform to
traditional approaches, such as a narrator with a PowerPoint, in order to ensure a more
level starting ground. Second, the video would be tested and revised until a comparison
with its non-humorous counterpart was clearly established.
Another limitation of the humor—its lack of relation to the study—was
understood before starting the study. However, it was difficult to construct a design in
which humor related to the topic did not give an educational advantage to the
experimental group. Traditionally, the use of humor in instruction is used within the
context of the content and used to illustrate the topic in a novel way. In this case that
was not possible without violating the integrity of the study, although it appears to have

149
been successfully done in one study (Ghaffari & Mohamadi, 2012). Thus the results
cannot be fully generalized to the way humor is often used in online instruction or in
class, since it may often be used in the service of contextual examples or content-
related material.
While not a limitation, a change for future studies would be the instructional
content. The ideas of summarizing, quoting, and paraphrasing appeared to already be
familiar to students, though the exact definitions and approaches taken by the video did
not appear to be similarly familiar. Specific—perhaps scientific—content may have been
more effective in demonstrating learning over time.
Another area of improvement may have been in scoring. Moreno and Mayer
used a grader unaware of the treatments (Mayer & Moreno, 1998; Moreno & Mayer,
2004). This may have improved the objectivity of the current study, though grading the
content would have been difficult because of the varying definitions of paraphrasing
and summarizing.
Participants
The current study is a mixed-methods approach to determine the effect of
humor in instructional videos on learning and motivation. Limitations that prevent this
study from being widely generalizable include sample size and the convenience of
sample selection. In addition, humor’s contextual nature makes it difficult to replicate in
other content.
The small number of students in each section of U106 led to combining students
from four different instructors into one group, which may have altered the results since

150
each had their own curricula that may have covered the instructional content from this
study.
Care should be taken in generalizing results, particularly since the group with the
strongest significance, males, made up a minority of the total population (n=16).
Implications
Taken at face value, this study appears to indicate that one approach to humor
in an instructional video influences learning among a subset of the participants. In this
case, sketch-like humor delivered in a cartoon format developed by a male with male
characters influenced learning positively for males in two courses. The correlation
between learning scores, perception of humor, and perception of motivation for males
indicates a pattern of receiving the humor well. This agrees with previous research
indicating that reception of instructional humor varies between genders. However,
feedback from students of both genders indicated both positive and negative
experiences with the humor, stating that it either added to their experience and caught
their attention, or distracted them from the educational content.
This leads to another implication of the study: while there appear to be positive
influences of humor described in the literature in face-to-face classrooms, online humor
may be more difficult because of its ability to alienate an audience with self-control over
time spent on these materials and the ability to skip portions of the content. Pilot
research for this project indicated the potential positive impact of interesting examples,
which aligns with a study by Gruner (1970).

151
Specific implications when using humor in the classroom may include the need
to test it out with different audiences to ensure that it works, using humor that is broad
and can reach the largest number of students, and using humor that stays within
traditional instructional roles that most students can relate to. In addition,
representation of students in humor or video instruction should be thought about
carefully since it may alienate students who don’t feel connected to the character.
Further Research
Further research in this area could focus specifically on the effects of the gender
of the instructor in the humorous content. A study including both male and female
instructors in an online instructional video with both male and female students might
help illuminate effective approaches for both genders, or eliminate the possibility of
ever reaching all students with humor.
Another aspect of the instructional video is the animation and sketch-like format.
Comparisons along gender lines could be examined on the effect of an animated and
real-life version of the same instruction to determine if the presentation of the media
changes the perception of the content. Because animation is often felt to be an
adolescent medium, learners may reject the authority of cartoon content. In addition,
comparisons between more direct instruction (for example an instructor looking into a
webcam) and sketch-like or other-structured instructional videos might be examined to
determine if the change in format influences student perception.
Finally, as mentioned above, studies comparing interesting examples with humor,
if they can be designed well, may help determine the effectiveness of each approach in

152
appealing to a wider portion of the audience. The desire for additional or different
examples was mentioned specifically by students in both the control and experimental
groups in their responses to the open-ended questions. While humor appears to have
positive benefits, its appeal can be highly subjective, potentially harming learning
because of its alienating nature. One striking theme throughout humor research is the
power of interesting or humorous examples. Even in studies without rigorous tests of
humor, the addition of humorous examples to instructional material appears to improve
learning (Kothari et al., 1993; Ziv, 1988). This approach alone may be worth examining in
more depth. Perhaps care should be taken in online videos which incorporate humor,
and more effort expended on developing interesting examples that would appeal across
genders.

BIBLIOGRAPHY

153
BIBLIOGRAPHY
Allen, I. E., & Seaman, J. (2011). Going the Distance: Online Education in the United
States, 2011. Babson Survey Research Group. Retrieved from
http://www.onlinelearningsurvey.com/reports/goingthedistance.pdf
Allen, I. E., & Seaman, J. (2013). Changing Course: Ten Years of Tracking Online
Education in the United States. Babson Survey Research Group. Retrieved from
http://www.onlinelearningsurvey.com/reports/changingcourse.pdf
Allen, I. E., & Seaman, J. (2014). Grade Change: Tracking Online Education in the United
States. Babson Survey Research Group. Retrieved from
http://www.onlinelearningsurvey.com/reports/gradechange.pdf
Allison, T. (2012). The Impact of Classroom Performance System-Based Instruction with
Peer Instruction upon Student Achievement and Motivation in Eighth Grade
Math Students. Doctoral Dissertations and Projects. Retrieved from
http://digitalcommons.liberty.edu/doctoral/490
Anderson, D. (2011). Taking the “Distance” out of Distance Education: A Humorous
Approach to Online Learning. Journal of Online Learning and Teaching, 7(1).
Retrieved from http://jolt.merlot.org/vol7no1/anderson_0311.htm

154
Andeweg, B., Gagestein, S., de Jong, J., & Wackers, M. (2011). “Poke fun at yourself”:
the problem of self-deprecating humor. In SEFI conference Global Engineering
Recognition, Sustainability and Mobility.
Apter, M. J. (1982). The experience of motivation: the theory of psychological reversals.
London; New York: Academic Press.
Aristotle. (350AD). Nicomachean Ethics. (W. D. Ross, Trans.) (Vol. IV Chapter 8).
Retrieved from http://classics.mit.edu/Aristotle/nicomachaen.4.iv.html
Arnold, J. M. (1998). “I know it when i see it”: Assessing good teaching. Research
Strategies, 16(1), 1–28. doi:10.1016/S0734-3310(98)90003-9
Askildson, L. (2005). Effects of humor in the language classroom: Humor as a
pedagogical tool in theory and practice. Arizona Working Papers in SLAT, 12, 45–
61.
Baddeley, A. (1992). Working memory. Science, 255(5044), 556–559.
doi:10.1126/science.1736359
Bailey, R. A. (2008). Design of Comparative Experiments. Leiden: Cambridge University
Press. Retrieved from
http://public.eblib.com/EBLPublic/PublicView.do?ptiID=336096
Banas, J. A., Dunbar, N., Rodriguez, D., & Liu, S.-J. (2011). A Review of Humor in
Educational Settings: Four Decades of Research. Communication Education, 60(1),
115–144.
Beebe, B. R. (2007). No laughing matter : student perceptions of instructional use of
humor in the college classroom. Capella University.

155
Behaviourism 101. (2012). Retrieved from
http://www.youtube.com/watch?v=RU0zEGWp56Y&feature=youtube_gdata_pl
ayer
Bergson, H. (1911). Laughter an essay on the meaning of the comic. Authorized
translation by Cloudesley Brereton and Fred Rothwell. New York: Macmillan.
Retrieved from http://www.archive.org/details/laughteressayonm00berguoft/
Berk, R. A., & Nanda, J. P. (1998). Effects of jocular instructional methods on attitudes,
anxiety, and achievement in statistics courses. Humor, 11(4), 383–410.
Bernat, C., & Mueller, R. J. (2013). Individualized Learning with Technology: Meeting the
Needs of High School Students. R&L Education.
Bloom, B. S. (1956). Taxonomy of educational objectives; the classification of
educational goals,. New York: Longmans, Green.
Bolliger, D. U., Supanakorn, S., & Boggs, C. (2010). Impact of podcasting on student
motivation in the online learning environment. Computers & Education, 55(2),
714–722. doi:10.1016/j.compedu.2010.03.004
British Council. (2014). Receptive Skills. Retrieved July 20, 2014, from
http://www.teachingenglish.org.uk/knowledge-database/receptive-skills
Bryant, J., Comisky, P. W., Crane, J. S., & Zillmann, D. (1980). Relationship between
college teachers’ use of humor in the classroom and students’ evaluations of
their teachers. Journal of Educational Psychology Journal of Educational
Psychology, 72, 511–519.

156
Bryant, J., Comisky, P., & Zillmann, D. (1979). Teachers’ Humor in the College Classroom.
Communication Education, 28(2), 110.
Buckman, K. H. (2010). Why Did the Professor Cross the Road? How and Why College
Professors Intentionally Use Humor in Their Teaching. ProQuest LLC.
Chandler, P., & Sweller, J. (1991). Cognitive Load Theory and the Format of Instruction.
Cognition and Instruction, 8(4), 293–332. doi:10.2307/3233596
Cho, H. (1995). Humor Mechanisms, Perceived Humor and Their Relationships to
Various Executional in Advertising. Advances in Consumer Research, 22(1), 191–
197.
Choi, H. J., & Johnson, S. D. (2005). The Effect of Context-Based Video Instruction on
Learning and Motivation in Online Courses. American Journal of Distance
Education, 19(4), 215–227. doi:10.1207/s15389286ajde1904_3
Cicero. (1875). Oratory and Orators. (J. S. Watson, Trans.). New York: Harper and
Brothers Publishing. Retrieved from
https://archive.org/details/ciceroonoratorya00ciceuoft
Cicero, M. T., Watson, J. S. (John S., & Jones, E. (1875). Cicero on oratory and orators.
New York : Harper & Brothers. Retrieved from
http://archive.org/details/ciceroonoratorya00ciceuoft
Clark, R. C., & Mayer, R. E. (2003). E-Learning and the science of instruction: proven
guidelines for consumers and designers of multimedia learning. San Francisco, CA:
Jossey-Bass/Pfeiffer.

157
COMM 302. (2014, June 7). Retrieved from
http://english.boisestate.edu/techcomm/course-offerings/comm-302/
Cook, D. A., Beckman, T. J., Thomas, K. G., & Thompson, W. G. (2009). Measuring
Motivational Characteristics of Courses: Applying Keller’s Instructional Materials
Motivation Survey to a Web-Based Course. Academic Medicine November 2009,
84(11), 1505–1509. doi:10.1097/ACM.0b013e3181baf56d
Dahlstrom, E. (2012). ECAR Study of Undergraduate Students and Information
Technology, 2012 (Research Report). Louisville, CO: EDUCAUSE Center for
Applied Research. Retrieved from http://www.educause/edu/ecar
Dai, D. Y., & Sternberg, R. J. (Eds.). (2004). Motivation, emotion, and cognition:
integrative perspectives on intellectual functioning and development. Mahwah,
N.J.: Lawrence Erlbaum Associates.
Davies, C. (1998). Jokes and their relation to society. Berlin; New York: Mouton de
Gruyter.
Di Serio, Á., Ibáñez, M. B., & Kloos, C. D. (2013). Impact of an augmented reality system
on students’ motivation for a visual art course. Computers & Education, 68, 586–
596. doi:10.1016/j.compedu.2012.03.002
Dugas, L. (1902). Psychologie du rire,. Paris: F. Alcan.
Earleywine, M. (2010). Humor 101. New York: Springer Pub. Co. Retrieved from
http://public.eblib.com/EBLPublic/PublicView.do?ptiID=635515

158
EDUCAUSE. (2013). Massive Open Online Course (MOOC). In EDUCAUSE Library.
Retrieved from http://www.educause.edu/library/massive-open-online-course-
mooc
Farrelly, B., & Farrelly, P. (2001). Shallow Hal. Twentieth Century Fox Film Corporation.
Ferrante, A. C. (2013). Sharknado. Horror.
Fisch, S. M. (2004). Children’s Learning From Educational Television: Sesame Street and
Beyond. Routledge.
Fisher, M. S. (1997). The effect of humor on learning in a planetarium. Science Education,
81(6), 703–713. doi:10.1002/(SICI)1098-237X(199711)81:6<703::AID-
SCE7>3.0.CO;2-M
Flaherty, K., Weinberger, M. G., & Gulas, C. S. (2004). The Impact of Perceived Humor,
Product Type, and Humor Style in Radio Advertising. Journal of Current Issues &
Research in Advertising (CTC Press), 26(1), 25–36.
Freud, S. (1989). Jokes and their relation to the unconscious. (J. Strachey, Trans.). New
York: Norton.
Galbraith, K. J. (2011). The effects of student-sequenced learning objects and student-
selected multimedia formats on motivation and achievement in a family finances
learning unit. Idaho State University.
Garner, R. L. (2006). Humor in Pedagogy: How Ha-Ha Can Lead to Aha! College Teaching,
54(1), 177–180.

159
Garner, R. L., Brown, R., Sanders, S., & Menke, D. J. (1992). “Seductive Details” and
Learning from Text. In K. A. Renninger, S. Hidi, & A. Krapp (Eds.), The Role of
Interest in Learning and Development (pp. 239–254). Hillsdale, N.J.: L. Erlbaum
Associates.
Ghaffari, M., & Mohamadi, R. (2012). The Effect of Context (Humorous vs. Non-
humorous) on Vocabulary Acquisition and Retention of Iranian EFL Learners.
International Journal of Applied Linguistics & English Literature , 1(6).
Gibb, J. (1964, June). An Experimental Comparison of the Humorous Lecture and the Non
Humorous Lecture in Informative Speaking. University of Utah, Salt.
Gilliland, H., & Mauritsen, H. (1971). Humor in the Classroom. The Reading Teacher,
24(8), 753–761.
Gorham, J., & Christophel, D. M. (1990). The Relationship of Teachers’ Use of Humor in
the Classroom to Immediacy and Student Learning. Communication Education,
39, 46.
Greene, J. C. (2007). Mixed methods in social inquiry. San Francisco, CA: Jossey-Bass.
Gruner, C. R. (1967). Effect of Humor on Speaker Ethos and Audience Information Gain.
JCOM Journal of Communication, 17(3), 228–233.
Gruner, C. R. (1970). The effect of humor in dull and interesting informative speeches.
Central States Speech Journal Central States Speech Journal, 21(3), 160–166.

160
Harp, S. F., & Mayer, R. E. (1997). The role of interest in learning from scientific text and
illustrations: On the distinction... Journal of Educational Psychology, 89(1).
Harp, S. F., & Mayer, R. E. (1998). How seductive details do their damage: A theory of
cognitive interest in science learning. Journal of Educational Psychology, 90(3),
414–434. doi:10.1037/0022-0663.90.3.414
Hativa, N. (2000). Teaching for Effective Learning in Higher Education. Springer.
Hidi, S., Renninger, K. A., & Krapp, A. (2004). Interest, a Motivational Variable That
Combines Affective and Cognitive Functioning. In D. Y. Dai & R. J. Sternberg (Eds.),
Motivation, emotion, and cognition: integrative perspectives on intellectual
functioning and development (pp. 57–87). Mahwah, N.J.: Lawrence Erlbaum
Associates.
Hirumi, A., & Bowers, D. R. (1991). Enhancing Motivation and Acquisition of Coordinate
Concepts by Using Concept Trees. The Journal of Educational Research, 84(5),
273–279.
Hobbes, T. (1651). Leviathan. St. Paul’s Churchyard: Green Dragon. Retrieved from
http://www.gutenberg.org/files/3207/3207-h/3207-h.htm
Houser, M. L., Cowan, R. L., & West, D. A. (2007). Investigating a New Education Frontier:
Instructor Communication Behavior in CD-ROM TextsDo Traditionally Positive
Behaviors Translate into This New Environment? Communication Quarterly,
55(1).

161
Huang, W., WenyehDiefes-Dux, HeidiImbrie, Peter K. (2006). A preliminary validation of
Attention, Relevance, Confidence and Satisfaction model-based Instructional
Material Motivational Survey in a computer-based tutorial setting. British Journal
of Educational Technology, 37(2), 243–259. doi:10.1111/j.1467-
8535.2005.00582.x
Jang, K. S., Hwang, S. Y., Park, S. J., Kim, Y. M., & Kim, M. J. (2005). Effects of a Web-
Based Teaching Method on Undergraduate Nursing Students’ Learning of
Electrocardiography. Journal of Nursing Education, 44(1), 35–9.
Johnson, B., & Christensen, L. B. (2012). Educational research: quantitative, qualitative,
and mixed approaches. Thousand Oaks, Calif.: SAGE Publications.
Jonas, P. M. (2004). Secrets of connecting leadership and learning with humor. Lanham,
Md.: ScarecrowEducation.
Jordan, J. (2013, May 6). World’s Most Beautiful Woman: Gwyneth Paltrow! People,
79(18). Retrieved from
http://www.people.com/people/archive/article/0,,20695704,00.html
Kaplan, R. M., & Pascoe, G. C. (1977). Humorous lectures and humorous examples:
Some effects upon comprehension and retention. Journal of Educational
Psychology, 69(1), 61–65.
Keller, J. M. (1983). Use of the ARCS Model of Motivation in Teacher Training. IDD&E
Working Paper No. 10. Syracuse Univ: NY. School of Education.
Keller, J. M. (1987). Development and Use of the ARCS Model of Instructional Design.
Journal of Instructional Development, 10(3), 2–10.
162
Keller, J. M. (2010). Motivational design for learning and performance: the ARCS model
approach. New York; London: Springer. Retrieved from
http://public.eblib.com/EBLPublic/PublicView.do?ptiID=510896
Kenny, D. T. (1955). The contingency of humor appreciation on the stimulus-
confirmation of joke-ending expectations. Journal of abnormal psychology, 51(3),
644–8.
Kinde, J. (2013, March 1). Humor Power Tips -- The Superiority Theory of Humor. Humor
Power Tips, March 2013. Retrieved from
http://archive.aweber.com/humorpowertips/FmRvA/h/Humor_Power_Tips_The
.htm
Kirkpatrick, J. M. (2007). Relation of nursing students’ motivational state and learning
effort to motivational appeal and learning outcomes in the use of an interactive
computer -based multimedia program. ETD Collection for Purdue University, 1–
155.
Klein, D. M., Bryant, J., & Zillmann, D. (1982). Relationship Between Humor In
Introductory Textbooks And Students’ Evaluations Of The Texts’ Appeal And
Effectiveness. Psychological Reports, 50(1), 235–241.
doi:10.2466/pr0.1982.50.1.235
Kline, P. (2007). The handbook of psychological testing. London; New York:
Routledge/Taylor & Francis Group.
Korobkin, D. (1988). Humor in the Classroom: Considerations and Strategies. College
Teaching College Teaching, 36(4), 154–158.

163
Kothari, V., Rana, D. S., & Khade, A. S. (1993). To Be or Not to Be Humorous in Class--
That is the Question. Journal of Marketing Education, 15(1).
Levine, J. (1969). Approaches to Humor Appreciation. In J. Levine (Ed.), Motivation in
humor (pp. 1–27). New York: Atherton Press.
Linnenbrink, E., & Pintrich, P. R. (2004). Role of Affect in Cognitive Processing in
Academic Contexts. In D. Y. Dai & R. J. Sternberg (Eds.), Motivation, emotion, and
cognition: integrative perspectives on intellectual functioning and development
(pp. 57–87). Mahwah, N.J.: Lawrence Erlbaum Associates.
Martin, R. A. (2007). The psychology of humor: an integrative approach. Amsterdam;
Boston: Elsevier Academic Press.
Mayer, R. E. (1989). Systematic thinking fostered by illustrations in scientific text.
Journal of Educational Psychology, 81(2), 240–246. doi:10.1037/0022-
0663.81.2.240
Mayer, R. E. (1999). The promise of educational psychology: learning in the content
areas. Upper Saddle River, N.J.: Merrill.
Mayer, R. E. (2002). Rote versus Meaningful Learning. Theory into Practice, 41(4), 226–
232.
Mayer, R. E. (2007). Research-Based Guidelines for Multimedia Instruction. Reviews of
Human Factors and Ergonomics, 3(1), 127–147. doi:10.1518/155723408X299861
Mayer, R. E. (2009). Multimedia Learning. (2nd ed.). Leiden: Cambridge University Press.
Retrieved from http://public.eblib.com/EBLPublic/PublicView.do?ptiID=424624

164
Mayer, R. E. (2014). Incorporating motivation into multimedia learning. Learning and
Instruction, 29, 171–173. doi:10.1016/j.learninstruc.2013.04.003
Mayer, R. E., & Anderson, R. B. (1991). Animations need narrations: An experimental
test of a dual-coding hypothesis. Journal of Educational Psychology, 83(4), 484–
490. doi:10.1037/0022-0663.83.4.484
Mayer, R. E., & Anderson, R. B. (1992). The instructive animation: Helping students build
connections between words and pictures in multimedia learning. Journal of
Educational Psychology, 84(4), 444–452. doi:10.1037/0022-0663.84.4.444
Mayer, R. E., Bove, W., Bryman, A., Mars, R., & Tapangco, L. (1996). When less is more:
Meaningful learning from visual and verbal summaries of science textbook
lessons. Journal of Educational Psychology, 88(1), 64–73. doi:10.1037/0022-
0663.88.1.64
Mayer, R. E., & Chandler, P. (2001). When Learning Is Just a Click Away: Does Simple
User Interaction Foster Deeper Understanding... Journal of Educational
Psychology, 93(2).
Mayer, R. E., & Gallini, J. K. (1990). When Is an Illustration Worth Ten Thousand Words?
Journal of Educational Psychology, 82(4).
Mayer, R. E., Heiser, J., & Lonn, S. (2001). Cognitive constraints on multimedia learning:
When presenting more material results in less understanding. Journal of
Educational Psychology, 93(1), 187–198. doi:10.1037/0022-0663.93.1.187

165
Mayer, R. E., & Mathias, A., Wetzell, Karen. (2002). Fostering understanding of
multimedia messages through pre-training: Evidence for a two-stage theory of
mental model construction. Journal of Experimental Psychology: Applied Journal
of Experimental Psychology: Applied, 8(3), 147–154.
Mayer, R. E., & Moreno, R. (1998). A split-attention effect in multimedia learning:
Evidence for dual processing systems in working memory. Journal of Educational
Psychology, 90(2), 312–320. doi:10.1037/0022-0663.90.2.312
Mayer, R. E., & Moreno, R. (2003). Nine Ways to Reduce Cognitive Load in Multimedia
Learning. Educational Psychologist, 38(1), 43–52.
Mayer, R. E., & Sims, V. K. (1994). For Whom Is a Picture Worth a Thousand Words?
Extensions of a Dual-Coding Theory of Multimedia Learning. Journal of
Educational Psychology, 86(3), 389–401.
Mayer, R. E., & Sobko, K., Mautone, Patricia D. (2003). Social Cues in Multimedia
Learning: Role of Speaker’s Voice. Journal of Educational Psychology, 95(2), 419–
25.
McCroskey, J. C. (1966). Scales for the measurement of ethos. Speech Monographs,
33(1), 65–72. doi:10.1080/03637756609375482
McGhee, P. E., Ruch, W., & Hehl, F.-J. (1990). A personality-based model of humor
development during adulthood. HUMOR: International Journal of Humor
Research, 3(2), 119–146. doi:10.1515/humr.1990.3.2.119
Moffitt, J. (2011). Talking Funny. Comedy, Talk-Show.

166
Moreno, R. (2006). Does the modality principle hold for different media? A test of the
method-affects-learning hypothesis. Journal of Computer Assisted Learning,
22(3), 149–158. doi:10.1111/j.1365-2729.2006.00170.x
Moreno, R. (2009). Learning from animated classroom exemplars: the case for guiding
student teachers’ observations with metacognitive prompts. Educational
Research and Evaluation, 15(5), 487–501. doi:10.1080/13803610903444592
Moreno, R., & Mayer, R. E. (1999). Cognitive principles of multimedia learning: The role
of modality and contiguity. Journal of Educational Psychology, 91(2), 358–368.
doi:10.1037/0022-0663.91.2.358
Moreno, R., & Mayer, R. E. (2000). Engaging students in active learning: The case for
personalized multimedia messages. Journal of Educational Psychology, 92(4),
724–733. doi:10.1037/0022-0663.92.4.724
Moreno, R., & Mayer, R. E. (2004). Personalized Messages That Promote Science
Learning in Virtual Environments. Journal of Educational Psychology, 96(1), 165–
173. doi:10.1037/0022-0663.96.1.165
Morreall, J. (Ed.). (1987). The Philosophy of laughter and humor. Albany: State University
of New York Press.
Mundorff, N., Bhatia, A., Zillman, D., Lester, P., & Robertson, S. (2009). Gender
differences in humor appreciation. Humor - International Journal of Humor
Research, 1(3), 231–244. doi:10.1515/humr.1988.1.3.231
Neuliep, J. W. (1991). An examination of the content of high school teachers’ humor in
the classroom and the development... Communication Education, 40(4), 343.

167
Neville, A. J. (2009). Problem-Based Learning and Medical Education Forty Years On.
Medical Principles and Practice, 18(1), 1–9. doi:10.1159/000163038
New Scientist. (2012, January 30). Google says one hour of video is now being uploaded
to YouTube every second. Washington Post. Retrieved from
http://articles.washingtonpost.com/2012-01-30/national/35439542_1_youtube-
channels-google-figures-show
Paivio, A. (2007). Mind and its evolution: a dual coding theoretical approach. Mahwah,
N.J.: L. Erlbaum Associates.
Petry, B. L. (1998). Adding Zest to OPAC Instruction. College & Undergraduate
Libraries, 5(2), 75–85. doi:10.1300/J106v05n02_11
Pien, D., & Rothbart, M. K. (1976). Incongruity and Resolution in Children’s Humor: A
Reexamination. Child Development, 47(4), 966–971. doi:10.2307/1128432
Pittenger, A., Aaron. (2010). Influence of motivational design on completion rates in
online self-study pharmacy-content courses. Distance Education, 31(3), 275–293.
doi:10.1080/01587919.2010.513953
Plato. (1990). Euthyphro, Apology, Crito, Phaedo, Phaedrus. (H. N. Fowler, Trans.).
Cambridge, Mass.: Harvard University Press. Retrieved from
http://data.perseus.org/citations/urn:cts:greekLit:tlg0059.tlg010.perseus-
eng1:50a
Rey, H. A. (1969). Curious George. Boston: Houghton Mifflin.
Rodgers, D. L., & Withrow-Thorton, B. J. (2005). The Effect of Instructional Media on
Learner Motivation. International Journal of Instructional Media, 32(4), 333–342.

168
Rothbart, M. K. (1996). Incongruity, Problem-Solving, and Laughter. In A. J. Chapman &
H. C. Foot (Eds.), Humor and laughter: theory, research, and applications (pp. 37–
54). New Brunswick, N.J., U.S.A.: Transaction Publishers.
Ruch, W. (1992). Assessment of appreciation of humor: Studies with the 3WD humor
test. In C. D. Spielberger & J. N. Butcher (Eds.), Advances in Personality
Assessment (pp. 27–75). Psychology Press.
Salkin, L. (1975). The 2000 Year Old Man. Animation, Comedy.
Schunk, D. H., Pintrich, P. R., & Meece, J. L. (2008). Motivation in education: theory,
research, and applications. Upper Saddle River, N.J.: Pearson/Merrill Prentice
Hall.
Seyer, P. C., McBeath, San Jose State University, & Faculty and Instructional
Development Office. (1981). Item analysis: tests and evaluation unit. San Jose,
Calif.: Faculty and Instructional Development Office, San Jose State University.
Shultz, T. R. (1996). A Cognitive-Development Analysis of Humour. In A. J. Chapman & H.
C. Foot (Eds.), Humor and laughter: theory, research, and applications (pp. 11–
36). New Brunswick, N.J., U.S.A.: Transaction Publishers.
Smith, R. (1959). Development of a Semantic Differential for Use with Speech Related
Concepts. Speech Monographs, 26(4), 263.
Song, S. H., & Keller, J. M. (2001). Effectiveness of motivationally adaptive computer-
assisted instruction on the dynamic aspects of motivation. Educational
Technology, Research and Development, 49(2), 5.
Spencer, H. (1911). Essays on education, etc. London; New York: J.M. Dent; E.P. Dutton.

169
Suls, J. M. (1972). A two-stage model for the appreciation of jokes and cartoons. In J. H.
Goldstein & P. E. McGhee (Eds.), The psychology of humor; theoretical
perspectives and empirical issues. (pp. 81–100). New York: Academic Press.
Tamborini, R., & Zillmann, D. (1981). College Students’ Perception of Lecturers Using
Humor. Perceptual and Motor Skills, 52(2), 427–432.
doi:10.2466/pms.1981.52.2.427
Torok, S. E., McMorris, R. F., & Lin, W.-C. (2004). Is Humor an Appreciated Teaching Tool?
Perceptions of Professors’ Teaching Styles and Use of Humor. College Teaching,
52(1), 14–20.
Walker, B. E. (2006). Using humor in library instruction. Reference Services Review, 34(1),
117–128. doi:10.1108/00907320610648806
Wanzer, M. B., Frymier, A. B., Wojtaszczyk, A. M., & Smith, T. (2006). Appropriate and
Inappropriate Uses of Humor by Teachers. Communication Education, 55(2),
178–196. doi:10.1080/03634520600566132
Weinberger, M. G., & Gulas, C. S. (1992). The Impact of Humor in Advertising: A Review.
Journal of Advertising, 21(4), 35–59.
Weiner, B. (1992). Motivation. In M. C. Alkin, M. Linden, J. Noel, & K. Ray (Eds.),
Encyclopedia of Educational Research (Vols. 1-4, Vol. 3, pp. 860–865). New York;
Toronto; New York: Macmillan ; Maxwell Macmillan Canada ; Maxwell Macmillan
International.
Wright, S. (2007). I Still Have a Pony. Comedy Central Rec.

170
Yang, Y.-C., & Chin, W.-K. (1997). Motivational Analyses on the Effects of Type of
Instructional Control on Learning from Computer-Based Instruction. Journal of
Educational Technology Systems, 25(1), 25–35.
Zillmann, D., Williams, B. R., Bryant, J., Boynton, K. R., & Wolf, M. A. (1980). Acquisition
of information from educational television programs as a function of differently
paced humorous inserts. Journal of Educational Psychology, 72(2), 170–180.
doi:10.1037/0022-0663.72.2.170
Zilmann, D., Williams, B. R., Bryant, J., Boynton, K. R., & Wolf, M. A. (1980). Acquisition
of information from educational television programs as a function of differently
paced humorous inserts. Journal of Educational Psychology, 72(2), 170–180.
doi:10.1037/0022-0663.72.2.170
Ziv, A. (1988). Teaching and Learning with Humor: Experiment and Replication. Journal
of Experimental Education, 57(1), 5–15.

APPENDICES
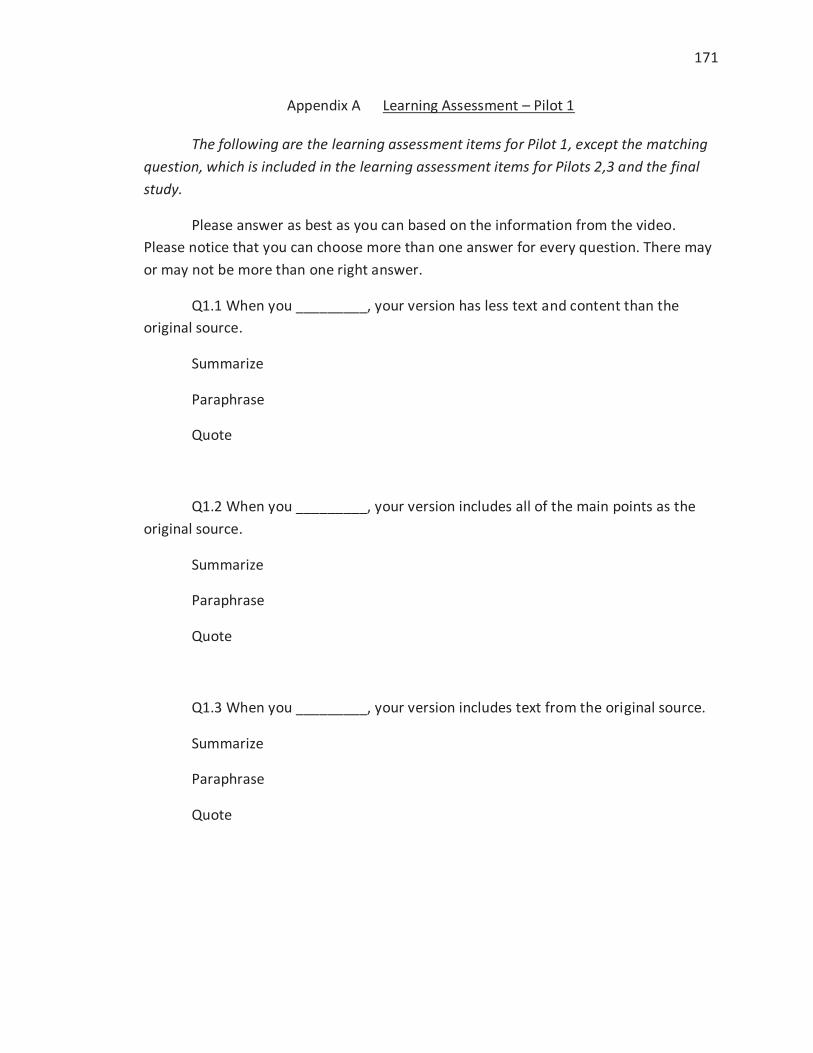
171
Appendix A Learning Assessment – Pilot 1
The following are the learning assessment items for Pilot 1, except the matching question, which is included in the learning assessment items for Pilots 2,3 and the final study.
Please answer as best as you can based on the information from the video. Please notice that you can choose more than one answer for every question. There may or may not be more than one right answer.
Q1.1 When you _________, your version has less text and content than the original source.
Summarize
Paraphrase
Quote
Q1.2 When you _________, your version includes all of the main points as the original source.
Summarize
Paraphrase
Quote
Q1.3 When you _________, your version includes text from the original source.
Summarize
Paraphrase
Quote

172
Q1.4 When you _________, your version uses only your own words.
Summarize
Paraphrase
Quote
Q1.5 When you _________, you cite your source.
Summarize
Paraphrase
Quote

173
Appendix B Learning Assessment – Pilots 2-3, Final Study
Overall – 55 points
Knowledge Questions (27 points)
1. List 3 ways to include a source in your paper, and if each should be cited. (8
points)
Summarizing (1) – yes (1). Paraphrasing (1) – yes (1). Quoting (1) – yes (1).
Common knowledge (1) – no (1).
2. Explain how to summarize a source. (4 points)
Explain only the main point (1), in your own words (1), in less words than
the original text (1), and cite it (1).
3. Explain how to quote a source. (8 points)
Frame the quote in your own words (1), use exact (1) key (1) sentences or
phrases from the source (1) within quote marks (1), and cite (1) with a page number (1).
Don’t quote too much (1).
4. Explain how to paraphrase a source. (7 points)
Explain all of the main points (1) in your own words (1) and with your own
sentence structure (1), and cite it (1). It should be longer than a summary (1), shorter
than the original text (1), and accurate to the source material (1).
Comprehension Questions (19 points – 16 open-ended, 3 matching)
1. Please explain the difference between summarizing and paraphrasing: (3 points)

174
Summarizing is putting the main point in your own words (1) –
paraphrasing is putting all of the main points in your own words (1), and summarizing is
shorter (1).
2. Please explain the difference between common knowledge and other / content:
(6 points)
Common knowledge are things everyone knows (1). Gives an example of
common knowledge (1). Other content needs to be cited (1) because it comes
from another source (1) and is not something everyone knows (1). Gives example
of other content (1).
3. Please explain how often to summarize, paraphrase, and quote: (7 points)
Paraphrase and summarize more, quote less (1). Quote when you can’t
say it better yourself (1). Summarize with the overall point (1). Paraphrase with
more detail (1). Use all three (1), and spread them out in the paper (1). Use these
every time it is not common knowledge (1).
[The following are the three matching questions. Students were given a text and
then asked to identify the paraphrase, quote, and summary version of it. This question is
worth 3 points].
[Below is the original text].
The following text comes from a news article about technology trends:
“Accompanying the hype around Google Glass this year was an undercurrent of
privacy concerns. ‘Since Google Glass wearers can easily photograph or record what
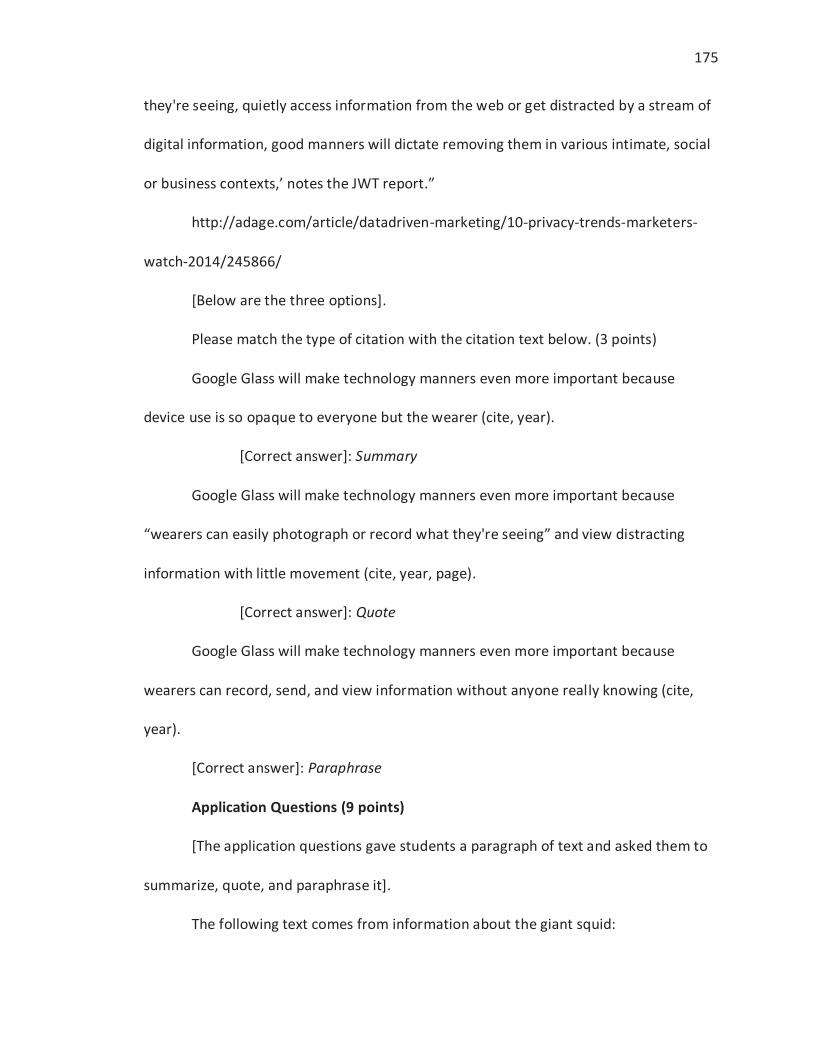
175
they're seeing, quietly access information from the web or get distracted by a stream of
digital information, good manners will dictate removing them in various intimate, social
or business contexts,’ notes the JWT report.”
http://adage.com/article/datadriven-marketing/10-privacy-trends-marketers-
watch-2014/245866/
[Below are the three options].
Please match the type of citation with the citation text below. (3 points)
Google Glass will make technology manners even more important because
device use is so opaque to everyone but the wearer (cite, year).
[Correct answer]: Summary
Google Glass will make technology manners even more important because
“wearers can easily photograph or record what they're seeing” and view distracting
information with little movement (cite, year, page).
[Correct answer]: Quote
Google Glass will make technology manners even more important because
wearers can record, send, and view information without anyone really knowing (cite,
year).
[Correct answer]: Paraphrase
Application Questions (9 points)
[The application questions gave students a paragraph of text and asked them to
summarize, quote, and paraphrase it].
The following text comes from information about the giant squid:
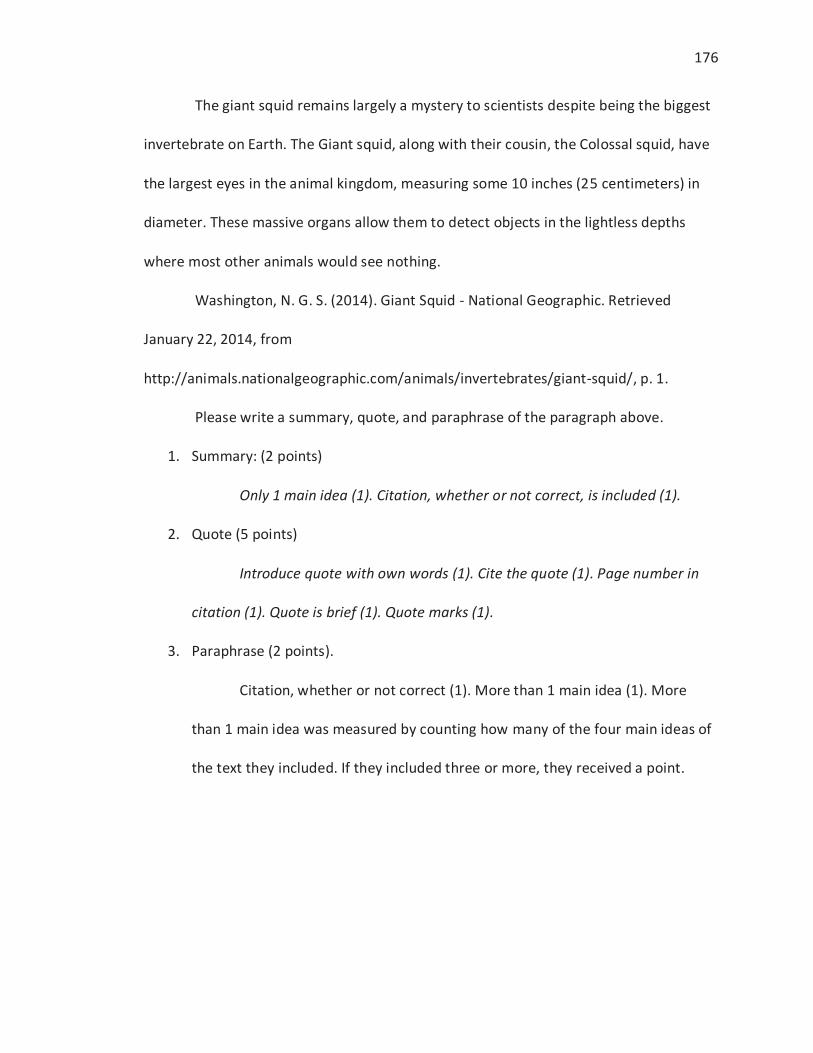
176
The giant squid remains largely a mystery to scientists despite being the biggest
invertebrate on Earth. The Giant squid, along with their cousin, the Colossal squid, have
the largest eyes in the animal kingdom, measuring some 10 inches (25 centimeters) in
diameter. These massive organs allow them to detect objects in the lightless depths
where most other animals would see nothing.
Washington, N. G. S. (2014). Giant Squid - National Geographic. Retrieved
January 22, 2014, from
http://animals.nationalgeographic.com/animals/invertebrates/giant-squid/, p. 1.
Please write a summary, quote, and paraphrase of the paragraph above.
1. Summary: (2 points)
Only 1 main idea (1). Citation, whether or not correct, is included (1).
2. Quote (5 points)
Introduce quote with own words (1). Cite the quote (1). Page number in
citation (1). Quote is brief (1). Quote marks (1).
3. Paraphrase (2 points).
Citation, whether or not correct (1). More than 1 main idea (1). More
than 1 main idea was measured by counting how many of the four main ideas of
the text they included. If they included three or more, they received a point.
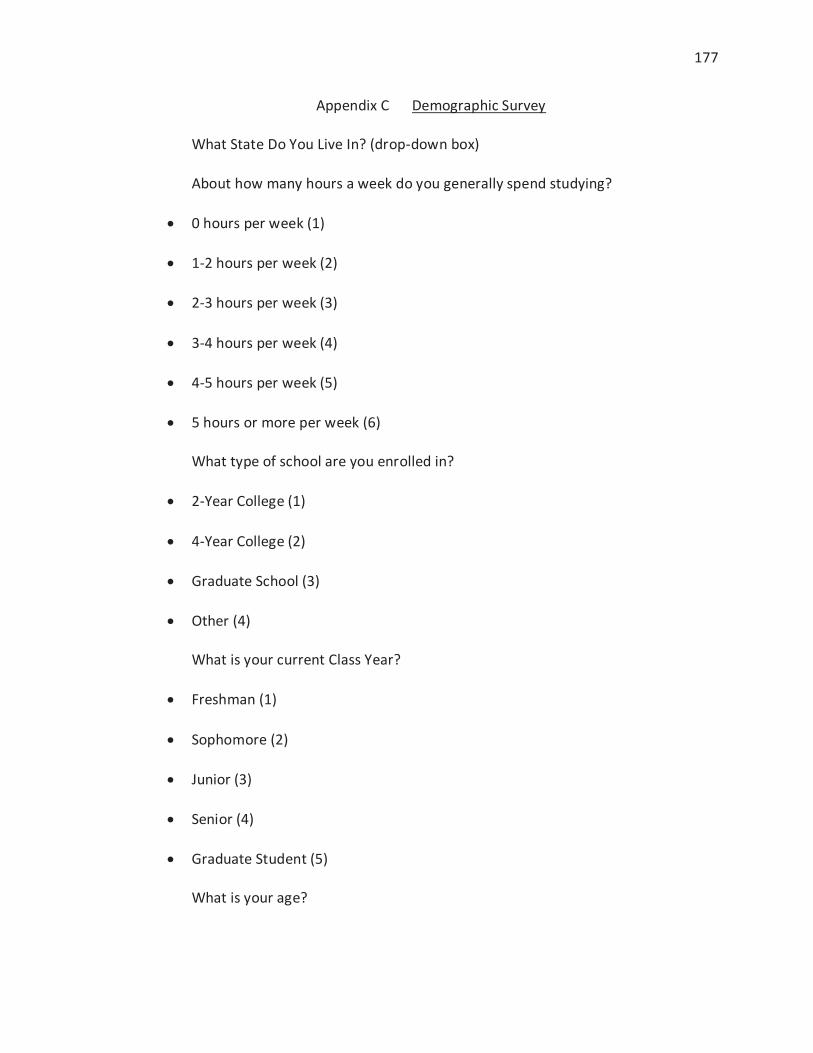
177
Appendix C Demographic Survey
What State Do You Live In? (drop-down box)
About how many hours a week do you generally spend studying?
0 hours per week (1)
1-2 hours per week (2)
2-3 hours per week (3)
3-4 hours per week (4)
4-5 hours per week (5)
5 hours or more per week (6)
What type of school are you enrolled in?
2-Year College (1)
4-Year College (2)
Graduate School (3)
Other (4)
What is your current Class Year?
Freshman (1)
Sophomore (2)
Junior (3)
Senior (4)
Graduate Student (5)
What is your age?

178
Under 18 (1)
18-20 (2)
21-23 (3)
24-25 (4)
Over 25 (5)
What is your gender?
Male (1)
Female (2)
What is your current or intended major?

179
Appendix D Instructional Materials Motivation Survey (IMMS)
Instructions
Instructional Materials Motivation Survey
There are 36 statements in this section. Please think about each statement in
relation to the video you have just watched and indicate how true it is.
Give the answer that truly applies to you, and not what you would like to be true
or what you think others want to hear.
Think about each statement by itself and indicate how true it is. Do not be
influenced by your answers to other statements.
Use the following values to indicate your response to each item.
1 (or A) = Not true
2 (or B) = Slightly true
3 (or C) = Moderately true
4 (or D) = Mostly true
5 (or E) = Very true
1. When I first watched this video, I had the impression that it would be easy for
me.
2. There was something interesting at the beginning of this video that got my
attention.
3. This video was more difficult to understand than I would like for it to be.
4. After watching the introduction, I felt confident that I knew what I was
supposed to learn from this video.

180
5. Completing the questions after the video gave me a satisfying feeling of
accomplishment.
6. It is clear to me how the content of this video is related to things I already
know.
7. Many parts of the video had so much information that it was hard to pick out
and remember the important points.
8. This video was eye-catching.
9. There were stories, pictures, or examples that showed me how this material
could be important to some people.
10. Watching this video and completing the questions successfully was important
to me.
11. The quality of the video helped hold my attention.
12. This video was so abstract that it was hard to keep my attention.
13. As I watched this video, I was confident that I could learn the content.
14. I enjoyed this video so much that I would like to know more about this topic.
15. Sections of this video were dry and unappealing.
16. The content of this video was relevant to my interests.
17. The way the information was arranged in the video helped keep my attention.
18. There were explanations or examples of how people use the knowledge in
this video.
19. The questions after the video were too difficult.
20. This video had things that stimulated my curiosity.

181
21. I really enjoyed watching this video.
22. The amount of repetition in this video caused me to get bored sometimes.
23. The content and style of this video conveyed the impression that its content
is worth knowing.
24. I learned some things that were surprising or unexpected.
25. After watching this video for a while I was confident that I would be able to
pass a test on it.
26. This video was not relevant to my needs because I already knew most of the
information given.
27. The wording of feedback after the questions, or of other comments in this
video, helped me feel rewarded for my effort.
28. The variety in the video helped keep my attention on the lesson.
29. The style of the video was boring.
30. I could relate the content of this video to things I have seen, done, or thought
about in my own life.
31. There were so many words on each screen that it was irritating.
32. It felt good to successfully watch this video and complete the questions.
33. The content of this video will be useful to me.
34. I could not really understand quite a bit of the material in this video.
35. The good organization of the content helped me be confident that I would
learn from this video.
36. It was a pleasure to watch such a well-designed video.

182
Appendix E Humor Manipulation Check (HMC) – Pilots 2,3, and Final Study
How would you rate the video you just watched on the scale below?
1. Funny :____:____:____:____:____:____:____: Not Funny
2. Not Humorous :____:____:____:____:____:____:____: Humorous
3. Not Amusing :____:____:____:____:____:____:____: Amusing

183
Appendix F Open-Ended Student Perception Questions
Both Control and Experimental Conditions:
What changes would make to the video you watched to make it a better learning
experience?
Experimental Condition:
What are your thoughts about the humor in the video you just viewed?
How did the humor in the video you just viewed relate to the educational
content?
What are your thoughts about humor in instructional videos you’ve seen before?
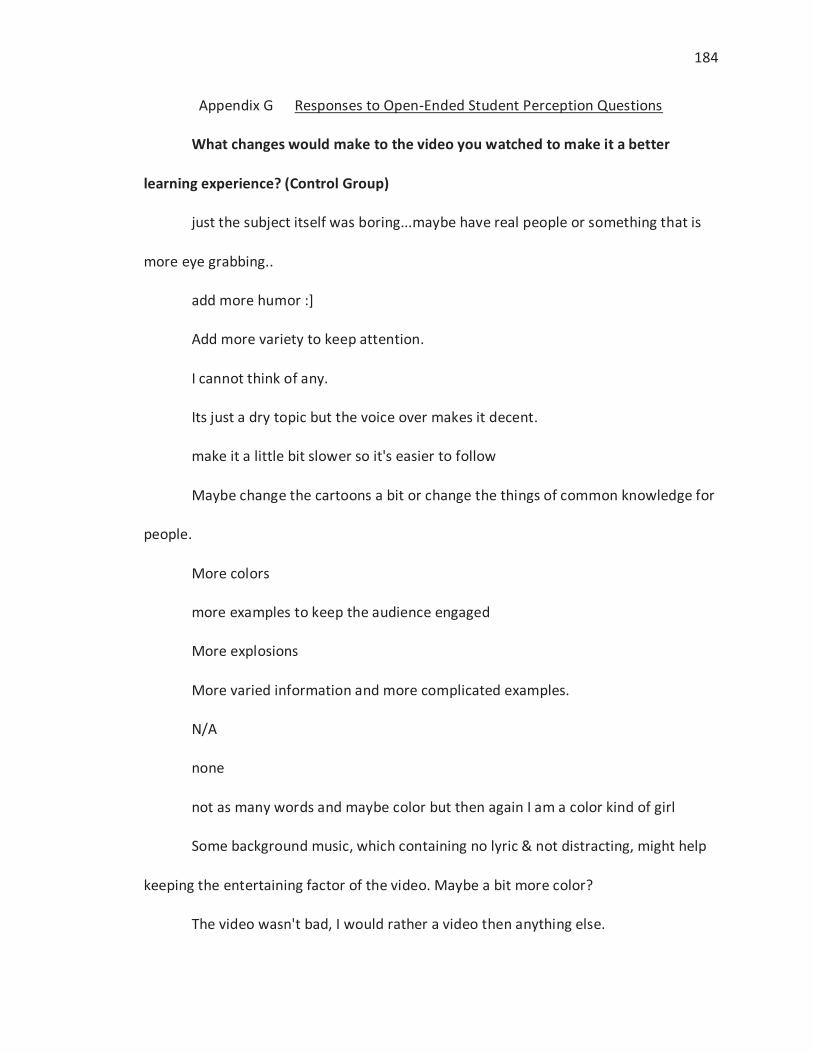
184
Appendix G Responses to Open-Ended Student Perception Questions
What changes would make to the video you watched to make it a better
learning experience? (Control Group)
just the subject itself was boring...maybe have real people or something that is
more eye grabbing..
add more humor :]
Add more variety to keep attention.
I cannot think of any.
Its just a dry topic but the voice over makes it decent.
make it a little bit slower so it's easier to follow
Maybe change the cartoons a bit or change the things of common knowledge for
people.
More colors
more examples to keep the audience engaged
More explosions
More varied information and more complicated examples.
N/A
none
not as many words and maybe color but then again I am a color kind of girl
Some background music, which containing no lyric & not distracting, might help
keeping the entertaining factor of the video. Maybe a bit more color?
The video wasn't bad, I would rather a video then anything else.
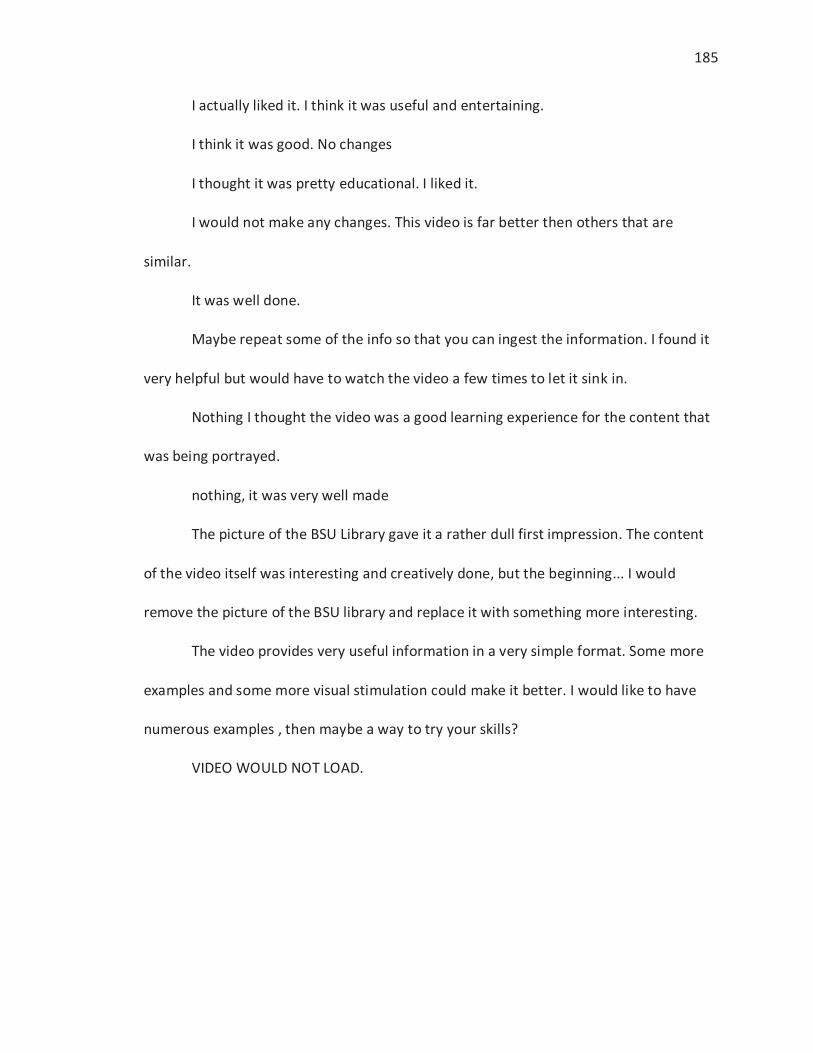
185
I actually liked it. I think it was useful and entertaining.
I think it was good. No changes
I thought it was pretty educational. I liked it.
I would not make any changes. This video is far better then others that are
similar.
It was well done.
Maybe repeat some of the info so that you can ingest the information. I found it
very helpful but would have to watch the video a few times to let it sink in.
Nothing I thought the video was a good learning experience for the content that
was being portrayed.
nothing, it was very well made
The picture of the BSU Library gave it a rather dull first impression. The content
of the video itself was interesting and creatively done, but the beginning... I would
remove the picture of the BSU library and replace it with something more interesting.
The video provides very useful information in a very simple format. Some more
examples and some more visual stimulation could make it better. I would like to have
numerous examples , then maybe a way to try your skills?
VIDEO WOULD NOT LOAD.

186
What changes would make to the video you watched to make it a better
learning experience? (Experimental)
Add more color to it, the white and black objects were a little boring at times.
Cut out the chatting.
Give another example then the Pledge of Allegiance
I think that it would be better if it was a little shorter and more to the point
I wouldn't have used the cartoon animations.
It was very cheesy and the jokes were kind of irrelevant to the video. I like the
ideas of having jokes to keep it light and entertaining but ditch the shark jokes. It lost my
attention after about a minute.
Juvenile and obnoxious
less shark stuff randomly thrown in after the first little bit
Not so childish
Stop asking the same questions.
I don't think I would make any changes.
I thought it was easy to understand and well organized, however, the humor
(sharks, socks, costume, etc.) was a bit distracting.
I thought sometimes it got to be a little too random and off topic. I think if I
really needed to and wanted to learn about citing sources then I would just want the
informational and skip the funny. However, I really enjoyed the humor.
I would catch the eye of the people by showing something everyone knows like a
battle of WWI or something that everyone knows and could relate to. On the other
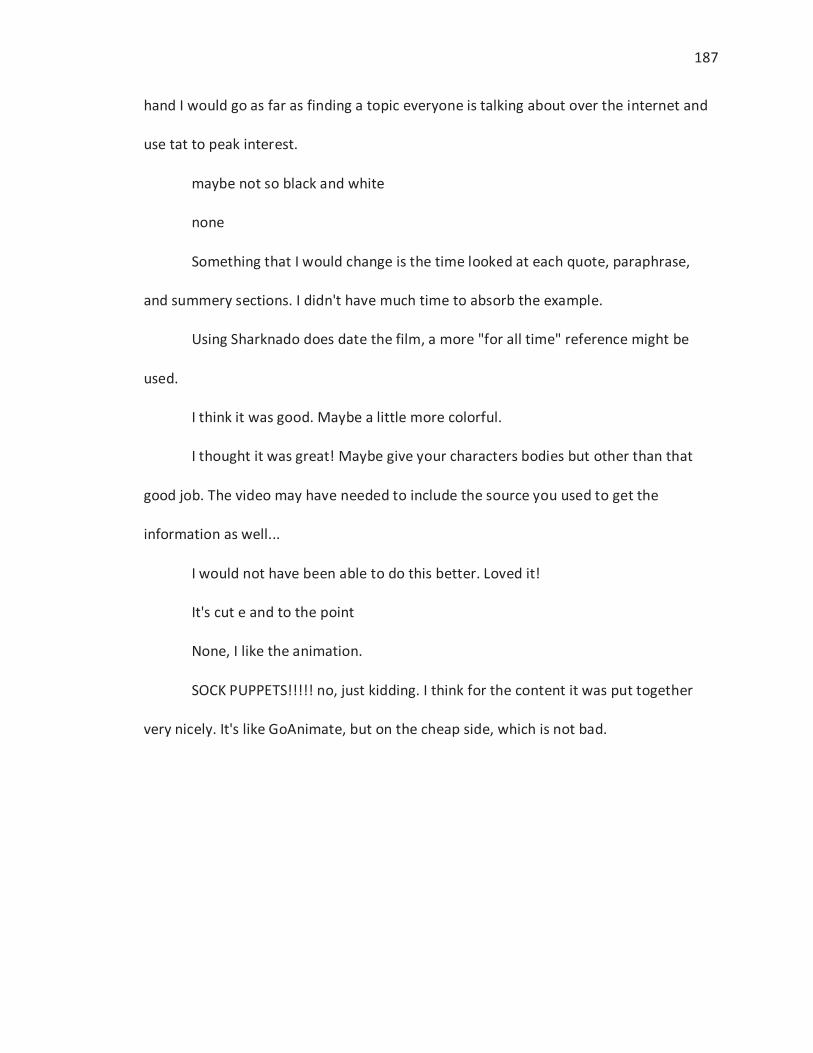
187
hand I would go as far as finding a topic everyone is talking about over the internet and
use tat to peak interest.
maybe not so black and white
none
Something that I would change is the time looked at each quote, paraphrase,
and summery sections. I didn't have much time to absorb the example.
Using Sharknado does date the film, a more "for all time" reference might be
used.
I think it was good. Maybe a little more colorful.
I thought it was great! Maybe give your characters bodies but other than that
good job. The video may have needed to include the source you used to get the
information as well...
I would not have been able to do this better. Loved it!
It's cut e and to the point
None, I like the animation.
SOCK PUPPETS!!!!! no, just kidding. I think for the content it was put together
very nicely. It's like GoAnimate, but on the cheap side, which is not bad.

188
What are your thoughts about the humor in the video you just viewed?
(Experimental)
I'm not a fan of shark-nato so I didn't get the references and fast-forwarded
through those parts.
I did not think it was very humorous
It was not very funny to me. I was more of laughing at it then with it.
Not funny
Overkill
It was okay, not too funny.
It was almost annoying, but I chuckled, so I would not say I would complain.
It wasn't crazy funny or had me laughing but was amusing enough to keep
watching.
I like the originality but it just wasn't my kind of humor but that doesn't mean it
couldn't be someone else's.
a little dry
I didn't find it too humorous, but to another audience I'm sure it would be
hilarious.
Sweety
Liked it. It kept it entertaining.
"I loved the shark joke, it make the video flow with a good plot point.
Sharknado! Nuff said."

189
I thought the humor was a great addition to the video. It made me a little more
interested in learning what it was about. If there was no humor I would probably not
have paid attention to the video.
Kept my attention. Made it more interesting. Actually helped me to learn the
concepts of paraphrasing, quoting, and summarizing better than I did before.
pretty good, good use of current movie titles
it was good dry humor
It was just enough to keep my attention but not so corny and over board that I
stopped paying attention
Great. Loved the voices.
It was cute.
I really liked it. It reminded me of the Brain Pop days in High school.
It was overall entertaining.
Funny and kept my attention.

190
What are your thoughts about humor in instructional videos you’ve seen
before? (Experimental)
I do not remember
Sometimes it is not done well and causes more harm then help.
Usually I find humor kind of dumb, but in this context I think it helped make a
somewhat dull topic easier to pay attention to.
Humor isn't seen as well in instructional videos usually but I thought this was a
good balance.
They make pay attention easier, but some try to hard this video was a good
blend
I have seen some others that were funny with the way they used real people in
the videos. Others seem to be dry because they are held by ethics of the university and
are not able to branch out to get people involved.
If it's relevant to what I am learning about I like it, but if it isn't, it is kind of
pointless.
As I stated above some have been well designed to keep my attention even if the
topic is not my thing, but others have been off on what humor generally is, so it actually
isn't humorous and I lose the ability to want to absorb the content.
Usually not funny - I'd rather a shorter, more direct video. Reminded me of that
one person in class who never stops interrupting.
I think some of the videos have been funny, but more often than not it proves
too difficult to make this content funny.

191
Less educational the way this video was created
They were pretty annoying.
I do like them, they allow me to be amused.
I think that humor could help students pay attention more
Sometimes it can be helpful, especially if it is somewhat boring and loooong. I
didn't not like the humor in this video but I didn't love it.
I think its a great addition. For example, Bill Nye the Science Guy was a great
man.
I always think it helps me learn, relate, and retain information better.
they fit well together
it makes it easier to learn and understand the learning material
I like it - makes it less boring.
I like it
They make the content easier to memorize, especially seeing shark socks, I will
see that in my head when I think about citing now.
Humor is needed in educational videos, because to honest I don't want to go
back to the old film projector days and a want to fall asleep 2 minutes into it. When will
there be more? Where can I access them?
I like the idea of humor in teaching. This is a concept that educational shows like
Sesame Street, The Electric Company, and School House Rock have been using for years
successfully teaching generations of people all kinds of things.

192
Appendix H Final Video Script
[Teacher] Hey, Joe.
[Teacher] Let's talk about how to cite your sources. You have a paper coming up,
right?
[Joe] My paper combines meteorology and biology.
[Teacher] Well that's interesting, like...the effect of rain on frogs, or something?
[Joe] The effect of sharks on tornadoes!
[Teacher] Did you -
[Joe] SHARKNADO!!!
[Joe] Is it a documentary or not,
[Teacher] It's not.
[Joe] that's my paper.
[Teacher] It's not.
[Joe] You can read my paper and then decide. Anyway. Citing sources - I think I
know this, but remind me.
[Teacher] Ok, three ways to include sources are summarizing, quoting, and
paraphrasing.
[Joe] They all sound the same.
[Teacher] Yeah. I'll explain how each one is different and how to use them.
Something to remember. Always cite. With summarizing, quoting, and paraphrasing,
always cite your source. That's how your instructor knows it's a source. If there's no
citation they'll assume you came up with it, or that it's common knowledge.

193
[Joe] Common knowledge?
[Teacher] I don't want to get too much into it, but common knowledge are things
everyone knows. Like there are seven days in a week, slavery was a key issue in the Civil
War, the state bird of Idaho is the Mountain Bluebird.
[Joe] The earth is round.
[Teacher] Everyone knows those things, you don't have to cite them. But more
detailed information, things everyone wouldn't know, you need to cite.
[Joe] I know a lot about sharks.
[Teacher] Impressive.
[Joe] I'm a little....ob....sessed.
[Teacher] So, if we look-
[Joe] If you could see my feet, I'm wearing shark socks. Actually they're not socks
they're shark pajamas with footies. The hood is a mouth so it looks like it's always biting
my head. (Pause). Let's talk about sources.
[Teacher] So first, summarizing. I'd repeat my understanding of the main point. I
wouldn't get into details. Summarizing is just the overall message, in my own words.
[Joe] Just the overall message. Huh!
[Teacher] I'm saying the same thing, but in my own words and in my own way.
That's a summary. Next, quoting. I'd set up the quote in my own words, and I'd use the
words that have the biggest impact. And when you quote, you add a page number to
the citation.
[Joe] Use the parts that have the biggest impact.

194
[Teacher] Avoid quoting too much text. Also avoid quoting all the time.
[Joe] What was the third way?
[Teacher] Paraphrasing. In summarizing, you give one main point, but in
paraphrasing you give all the main points.
[Joe] It's a more detailed summary.
[Teacher] Right. With summarizing and paraphrasing you can change the order.
Be as accurate as possible. Don't misrepresent the source. If you said the source said it,
someone should be able to go to the source and find it. Put it in your own words, and
your own sentence structure. Don't just copy and paste the source then change enough
words to make it look like a paraphrase.
[Joe] Cool.
[Teacher] So, let's look at another example and I want you to give me a summary,
quote, and paraphrase of it.
[Joe] First, a shark is mutated or let into an enclosed space it shouldn't be in, like
SeaWorld. Then, we meet a likeable person who will fight the shark at the end-
[Teacher] How about something else?
[Joe] Oh, like a documentary? Have you seen that one where the shark jumps into
the air-
[Teacher] No sharks.
[Joe] No....sharks? I guess we could do octopuses-
[Teacher] How about the Pledge of Allegiance? Everybody knows the Pledge of
Allegiance.
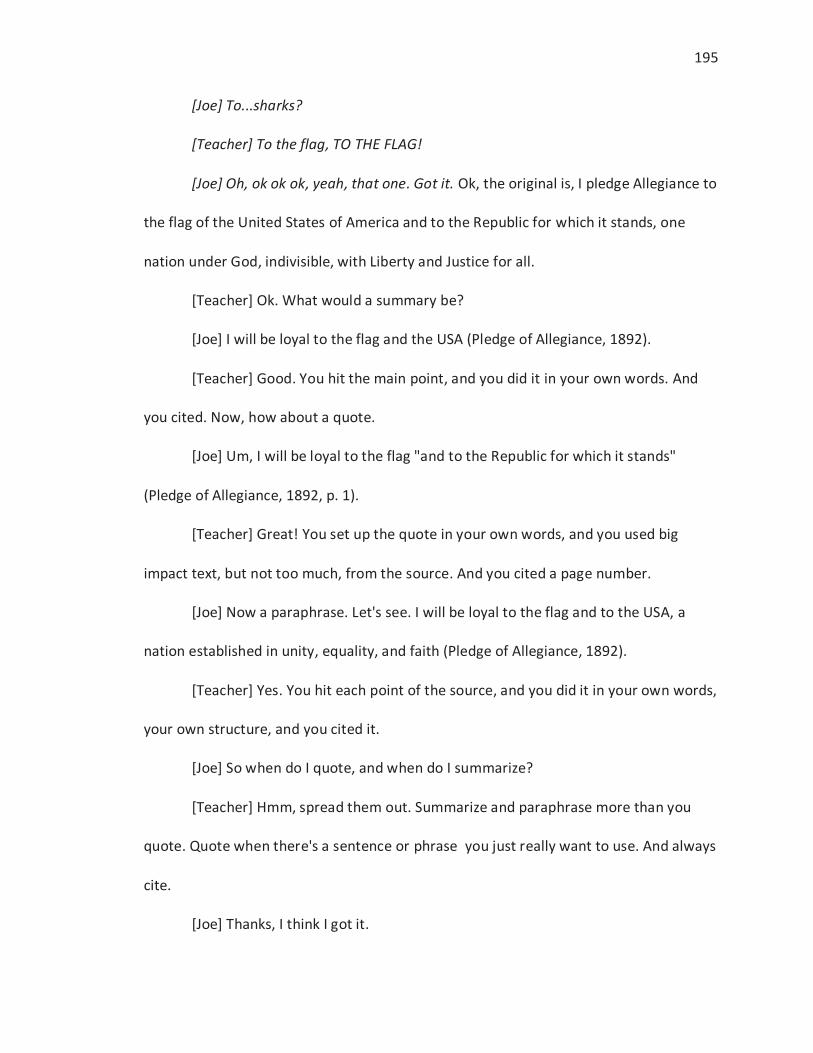
195
[Joe] To...sharks?
[Teacher] To the flag, TO THE FLAG!
[Joe] Oh, ok ok ok, yeah, that one. Got it. Ok, the original is, I pledge Allegiance to
the flag of the United States of America and to the Republic for which it stands, one
nation under God, indivisible, with Liberty and Justice for all.
[Teacher] Ok. What would a summary be?
[Joe] I will be loyal to the flag and the USA (Pledge of Allegiance, 1892).
[Teacher] Good. You hit the main point, and you did it in your own words. And
you cited. Now, how about a quote.
[Joe] Um, I will be loyal to the flag "and to the Republic for which it stands"
(Pledge of Allegiance, 1892, p. 1).
[Teacher] Great! You set up the quote in your own words, and you used big
impact text, but not too much, from the source. And you cited a page number.
[Joe] Now a paraphrase. Let's see. I will be loyal to the flag and to the USA, a
nation established in unity, equality, and faith (Pledge of Allegiance, 1892).
[Teacher] Yes. You hit each point of the source, and you did it in your own words,
your own structure, and you cited it.
[Joe] So when do I quote, and when do I summarize?
[Teacher] Hmm, spread them out. Summarize and paraphrase more than you
quote. Quote when there's a sentence or phrase you just really want to use. And always
cite.
[Joe] Thanks, I think I got it.
196
[Teacher] Cool! Well, good luck on your paper.
[Joe] Thanks for your help. Have some shark socks.
[Teacher] I will not wear those.
[Joe] They make it look like a shark is eating your foot.
[Teacher] Actually that's pretty cool.
[Joe] Yes it is.
[Teacher] Are you really wearing jammies?

VITA

197
VITA
Hans Aagard finished a Bachelor of Arts degree in Linguistics with a minor in
Computers in the Humanities in 2001. He worked for a year in an ESL software company
before returning to school to pursue a Master of Science degree from Purdue University
in Educational Technology, which he completed in 2004. He then started his PhD, taking
time off for a few years to work as an instructional designer and trainer for Purdue, then
Boise State University. He will graduate in December of 2014 with his PhD in Learning
Design and Technology.
Hans’ teaching experience began as a software trainer while an undergraduate
student, teaching web design software to faculty and staff at Brigham Young University.
After graduating he developed online tutorials for an ESL company. When he started
graduate school he became a TA for EDCI 270, then EDCI 271, and co-taught two
graduate-level courses with Dr. Jennifer Richardson. He also became a teaching assistant
for the Center for Instructional Excellence, where he contributed to faculty training and
one-on-one consulting about teaching. Most recently he has developed and facilitated
workshops for faculty at both Purdue and Boise State University on instructional design,
educational technology, and pedagogy. In addition, he currently teaches a handful of
library sessions to undergraduate students every semester.

198
Hans’ publications have focused on educational technology – online learning
tools and online teaching. He has given presentations at several national conferences on
these topics. He has also served as a panel moderator and workshop presenter.

PUBLICATIONS

199
PUBLICATIONS
Aagard, H., Bowen, K., Olesova, L. (2010). Hotseat: Opening the Backchannel in Large
Lectures. EDUCAUSE Quarterly, http://www.educause.edu/ero/article/hotseat-
opening-backchannel-large-lectures.
Richardson, J.C. Ertmer, P., Aagard, H., Ottenbreit-Leftwich, A., Yang, D. & Mack, N.
(Summer, 2007). The Digital Age Literacy Professional Development Initiative:
Factors Influencing Teachers’ Implementation of Skills and Strategies. Teacher
Education & Practice, 20(3), 239-262.
Richardson, J.C., Aagard, H. & Stickman, A. (October, 2006). Guidelines for mentoring
graduate students in best practices for teaching online courses. Annual Meeting
of the Association for Educational Communications and Technology: Dallas, TX.
Huang, D. W., Aagard, H., Diefes-Dux, H. (2004). Impact of Cognitive-based Instructional
Intervention on Learning Motivation: The Implementation of Student-made
Glossary in a Programming-oriented Engineering Problem-solving Course and Its
Impact on Learning Motivation. Paper presented at the AECT Annual Convention,
October, 2004; Chicago, IL.