the effects of a six-week balance training … · balance training protocol on chronic ankle...
TRANSCRIPT
THE EFFECTS OF A SIX-WEEK
BALANCE TRAINING PROTOCOL ON
CHRONIC ANKLE INSTABILITY A COMPARISON BETWEEN AN UNIAXIAL AND MULTIAXIAL
BALANCE BOARD
Mathias Declercq
Stijn Hermans
Supervisors: Prof. Dr. Roel de Ridder, Prof. Dr. Phillip Roosen
A dissertation submitted to Ghent University in partial fulfilment of the requirements for the degree of
Master in Rehabilitation Sciences and Physiotherapy
Academic year: 2016 - 2017

THE EFFECTS OF A SIX-WEEK
BALANCE TRAINING PROTOCOL ON
CHRONIC ANKLE INSTABILITY A COMPARISON BETWEEN AN UNIAXIAL AND A MULTIAXIAL
BALANCE BOARD
Mathias Declercq
Stijn Hermans
Supervisors: Prof. Dr. Roel de Ridder, Prof. Dr. Phillip Roosen
A dissertation submitted to Ghent University in partial fulfilment of the requirements for the degree of
Master in Rehabilitation Sciences and Physiotherapy
Academic year: 2016 - 2017

Expression of gratitude
The authors of this study would like to thank Prof Dr. P. Roosen (Promotor), Dr. R. De Ridder
(Co-promotor), without whom this thesis would not have been possible. We would also like
to express our gratitude to Thomas Rubens and Iman Amiri for helping with the study setup
and data collection. We would also like to thank our girlfriends, parents and friends for their
support during this thesis.
Special thanks goes out to all who participated in this study, and donated a significant
amount of their time to make this thesis possible.

Table of Contents List of figures and tables.......................................................................................................................... 7
List of abbreviations ................................................................................................................................ 8
1. Abstract (Nederlands) ..................................................................................................................... 9
2. Abstract (English) ........................................................................................................................... 10
3. Introduction ................................................................................................................................... 11
3.1. Lateral ankle sprain ............................................................................................................... 11
3.2. Chronic ankle instability ........................................................................................................ 12
3.3. Neuromuscular control ......................................................................................................... 13
3.4. Balance training ..................................................................................................................... 14
4. Methods ........................................................................................................................................ 15
4.1. Study design .......................................................................................................................... 15
4.2. Participants ............................................................................................................................ 15
4.3. Procedure and equipment .................................................................................................... 17
4.4. EMG ....................................................................................................................................... 17
4.4.1. Maximal voluntary contraction (MVC) .......................................................................... 17
4.4.2. Functional jumps ........................................................................................................... 18
4.5. Questionnaires ...................................................................................................................... 18
4.6. Intervention ........................................................................................................................... 19
4.7. Data analysis .......................................................................................................................... 20
4.7.1. MVC ............................................................................................................................... 20
4.7.2. Functional jumps ........................................................................................................... 21
4.7.3. Statistical analysis .......................................................................................................... 21
5. Results ........................................................................................................................................... 22
5.1. Baseline differences pre-intervention ................................................................................... 22
5.2. Intervention ........................................................................................................................... 23
5.2.1. Functional jumps ........................................................................................................... 23
5.2.2. MVC (mean) ................................................................................................................... 25
5.2.3. Subjective parameters ................................................................................................... 25
5.3. Baseline differences post-intervention ................................................................................. 27
6. Discussion ...................................................................................................................................... 27
6.1. Intervention effect ................................................................................................................ 27
6.2. Subjective parameters ........................................................................................................... 29
6.3. Strengths and limitation ........................................................................................................ 30
6.4. Practical implications and conclusion ................................................................................... 31

6.5. Acknowledgements ............................................................................................................... 32
7. References ..................................................................................................................................... 32
8. Abstract in lekentaal ...................................................................................................................... 36
9. Ethical approval ............................................................................................................................. 37
10. Appendix .................................................................................................................................... 39
10.1. Inclusion criteria questionnaire ......................................................................................... 39
10.2. CAIT questionnaire ............................................................................................................ 41
10.3. FADI questionnaire ............................................................................................................ 42
10.4. GROC questionnaire .......................................................................................................... 44
10.5. VAS questionnaire ............................................................................................................. 44
10.6. Varus-click test and anterior drawer test .......................................................................... 45
10.7. Relative muscle activation values: PL, PB and GaMed ...................................................... 46
10.8. Absolute muscle activation values: UNI-group ................................................................. 47
10.9. Absolute muscle activation: MULTI-group ........................................................................ 51
10.10. VAS-scores ......................................................................................................................... 54
10.11. Baseline differences post-intervention ............................................................................. 55
10.12. Linear Mixed Models: Fixed Effects ................................................................................... 56
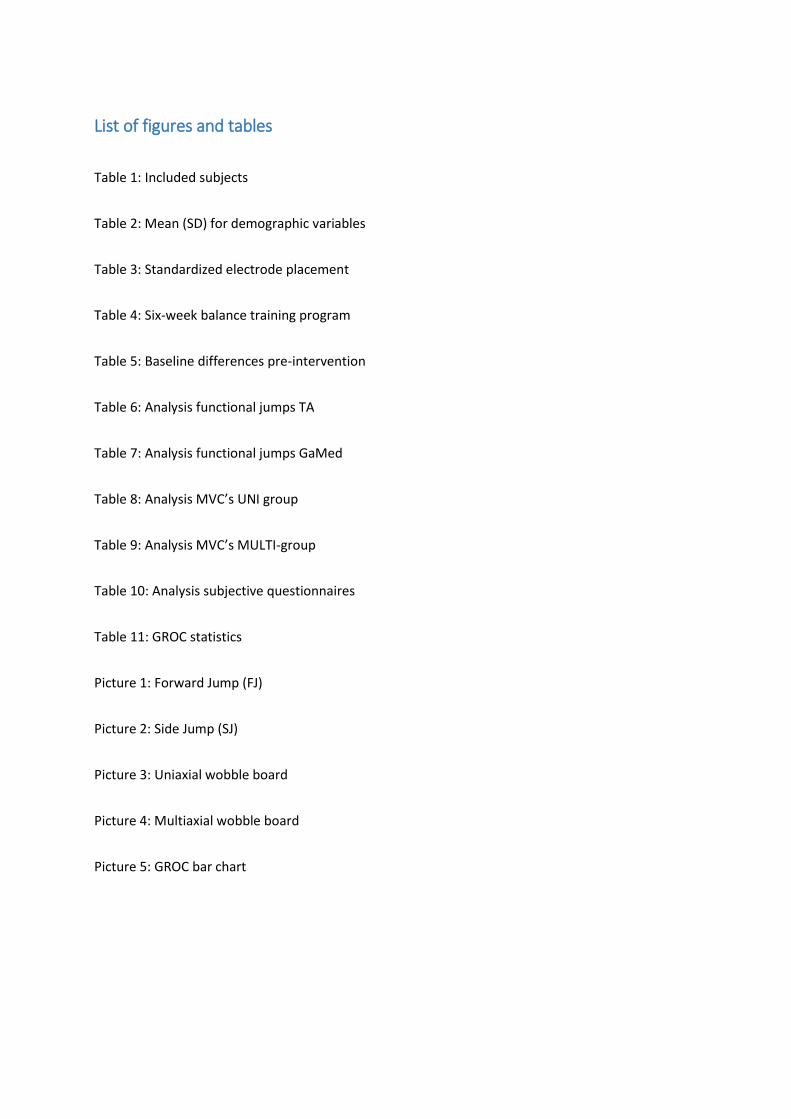
List of figures and tables
Table 1: Included subjects
Table 2: Mean (SD) for demographic variables
Table 3: Standardized electrode placement
Table 4: Six-week balance training program
Table 5: Baseline differences pre-intervention
Table 6: Analysis functional jumps TA
Table 7: Analysis functional jumps GaMed
Table 8: Analysis MVC’s UNI group
Table 9: Analysis MVC’s MULTI-group
Table 10: Analysis subjective questionnaires
Table 11: GROC statistics
Picture 1: Forward Jump (FJ)
Picture 2: Side Jump (SJ)
Picture 3: Uniaxial wobble board
Picture 4: Multiaxial wobble board
Picture 5: GROC bar chart
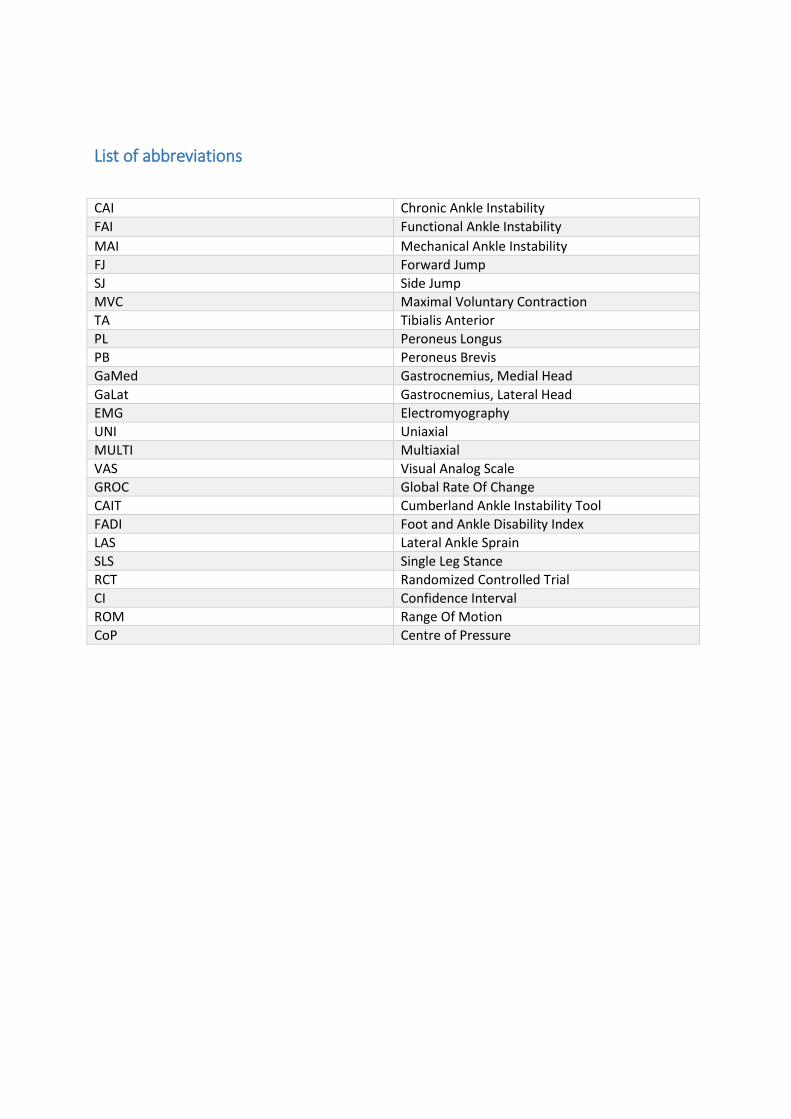
List of abbreviations
CAI Chronic Ankle Instability
FAI Functional Ankle Instability
MAI Mechanical Ankle Instability
FJ Forward Jump
SJ Side Jump
MVC Maximal Voluntary Contraction
TA Tibialis Anterior
PL Peroneus Longus
PB Peroneus Brevis
GaMed Gastrocnemius, Medial Head
GaLat Gastrocnemius, Lateral Head
EMG Electromyography
UNI Uniaxial
MULTI Multiaxial
VAS Visual Analog Scale
GROC Global Rate Of Change
CAIT Cumberland Ankle Instability Tool
FADI Foot and Ankle Disability Index
LAS Lateral Ankle Sprain
SLS Single Leg Stance
RCT Randomized Controlled Trial
CI Confidence Interval
ROM Range Of Motion
CoP Centre of Pressure

9
1. Abstract (Nederlands) Achtergrond: Chronische enkel instabiliteit (CAI) is een frequente lange termijn complicatie volgend
op een enkel inversie trauma. Mede door structurele weefselschade en/of neurale veranderingen
ervaren CAI patiënten vaak aan een verminderd evenwicht. Net daarom wordt heel vaak
balanstraining gebruikt in de revalidatie van CAI. Alleen zijn er nog grote lacunes in de literatuur welk
type balanstraining nu het meest effectief is in het kader van CAI revalidatie.
Doel: Het doel van deze studie is om de effecten na te gaan van een zes weken durende
balanstraining tussen twee groepen: een uniaxiale kantelplank en een multiaxiale oefentol.
Studievorm: gerandomiseerd gecontroleerd onderzoek (RCT)
Methode: 28 patiënten lijdend aan CAI (geselecteerd volgens inclusie criteria geformuleerd in het
Internation Ankle Consortium) voerden een voorwaartse en zijwaartse sprongoefening uit terwijl
spieractiviteit gemeten werd met oppervlakte EMG. Deelnemers werden willekeurig verdeeld in twee
even grote groepen: een UNI- en een MULTI-groep. Allen voerden ze hetzelfde trainingsschema uit
gedurende zes weken. Na het beëindigen van de balanstraining werden dezelfde sprongoefeningen
herhaald en spieractiviteit gemeten. Spieren die werden gebruikt voor analyse waren de TA, PB, PL,
GaLAT en GaMED. Om extra subjectieve data te verzamelen, vulden deelnemers bij beide
testmomenten enkele vragenlijsten in (CAIT, FADI, VAS-schalen en GROC).
Resultaten: Er werden geen baseline verschillen gevonden tussen beide groepen pre- en post-
interventie. Een algemene daling van de relatieve spieractivatie wordt gezien tijdens de
sprongoefeningen. In de UNI-groep zien we een significante daling van de TA en GaMed in beide
sprongvormen, dit zowel pre- als post-impact. Daarboven zien we een significant daling post-impact
van de PB bij de zijwaartse sprongen. In de MULTI-groep zien we een significante daling van de
GaMed post-impact bij de zijwaartse sprongen. In het algemeen zien we een stijging van de MVC
waarden na de interventie. Een duidelijke daling was zichtbaar in de VAS-scores, GROC-resultaten
tonen een duidelijke subjectieve verbetering na interventie in beide groepen.
Conclusie: Beterschap is merkbaar in beide groepen na de balanstraining, al is deze groter in de UNI-
groep. Relatieve spieractivatie is verminderd, wat verklaard kan worden door een toegenomen
spierkracht (MVC) door een beter gesynchroniseerde spiervezel contractie en/of door een
toegenomen stabiliteit. Deze verbetering wordt bevestigd door een combinatie van toegenomen CAIT
en FADI scores, lagere VAS scores en een positieve GROC. Echter, mede door het ontbreken van
baseline verschillen post-interventie tussen beide groepen, kan er geen eenduidige aanbeveling
gemaakt worden in verband met het meest gunstige type kantelplank.
Sleutelwoorden: chronische enkelinstabiliteit, balanstraining, electromyografie, uniaxiale
kantelplank, multiaxiale kantelplank.

10
2. Abstract (English) Background: Chronic Ankle Instability (CAI) is a frequent long-term complication following lateral
ankle sprain. Because of structural tissue damage and/or neural changes in CAI subjects, an impaired
balance is frequently observed. Therefore, balance training is an acclaimed treatment method for CAI.
However, it is still unclear which type of balance exercises are best suited for an optimal treatment.
Goal: The purpose of this study was to compare the effects of a six-week balance training protocol on
muscle activity between two groups: a uniaxial and multiaxial balance board group.
Study design: Randomized controlled trial (RCT)
Methods: 28 patients with CAI (selected with inclusion criteria defined in the International Ankle
Consortium) performed a forward and sideways jumping task whilst researchers measured muscle
activity through surface-EMG. Included subjects were evenly randomized into two groups: a UNI- and
a MULTI-group. All subjects followed an identical balance training scheme for six weeks, with
respectively uniaxial and multiaxial balance boards. Upon conclusion of the training protocol, both
jumping tasks were repeated and also analyzed with surface-EMG. The muscles used for
measurement were TA, PB, PL, GaMed and GaLat. In order to obtain additional subjective parameter
data, subjects filled in some questionnaires on both test moments (CAIT, FADI, VAS-scales and GROC).
Results: No baseline differences were found between both groups pre- and post-intervention. In the
functional jumps, there is a general decrease in relative muscle activation. In the UNI-group, a
significant decrease in TA and GaMed is observed in both jumping tasks, this as well pre- as post-
impact. Additionally, a post-impact significant decrease is seen for the PB in the sideways jumps. In
the MULTI-group a significant decrease is seen in the GaMed in the post-impact time period in the
sideways jumps. In general, all MVC values were increased post-intervention. In the CAIT and FADI
questionnaires, a general increase in score was found post-intervention. In the VAS scores, a general
decrease was seen and GROC results are positive.
Conclusion: Post-intervention improvements are noticeable in both groups, although they appear to
be higher in the UNI-group. Relative muscle activation rates tend to decrease, which may be
explained by an increase in muscle force (MVC) because of a better synchronized muscle fiber
contraction and/or a better stability. Additionally, a combination of higher CAIT and FADI scores,
lower VAS scores and a positive GROC score confirm the subtle overall CAI improvements. However,
mainly because of the lack of post-intervention baseline differences, no clear recommendation can be
made concerning which type of balance board is more beneficial.
Keywords: chronic ankle instability, balance training, electromyography, uniaxial balance board,
multiaxial balance board.

11
3. Introduction The goal of this study is to assess the differences in six-week balance training treatment effects
between an unidirectional and a multidirectional balance board. All subjects performed two different
jumping tasks (forward and sideways), whilst muscle force was measured through surface-EMG
analysis.
3.1. Lateral ankle sprain The foot and ankle-complex can be identified as the link between the human body and the ground.
Its function is crucial for completing daily life activities and is exposed to very high loads from time to
time. Hence ankle injuries are far from rare, with lateral ankle sprains being by far (77-85%) the most
prevailing ankle injury.(1, 2) This occurs when the foot is excessively inverted, hence a well-known
synonym for lateral ankle sprains are inversion traumata. Ankle injuries account for the largest
percentage of self-reported musculoskeletal injuries.(3) Researchers found a prevalence of 1 strain
per 10.000 active people daily in the United States.(4) Keeping in mind that as many as 55% of LAS
sufferers do not seek evaluation or treatment, it can be concluded that ankle sprains may be grossly
underreported.(5)
The symptoms experienced are irregular, often dependable upon the severity of the sprain. At first,
symptoms such as swelling, tenderness, pain and inability to sustain any weight can be observed.(6)
In proportion to the amount and kind of damaged structures around the ankle, more long term
symptoms can be diagnosed.
The pathomechanics of LAS are comparable in many situations: the rearfoot is forced into an
excessive supination. Research has shown that the position of the heel upon ground contact is
essential for the remaining duration of the stance phase. The more the centre of pressure (CoP) upon
heel strike is located laterally to the joint axis of the subtalar joint, the bigger the resulting inversion
moment is at the rearfoot. At a certain point, the inversion moment is too big for the muscles to
neutralize the movement, thus resulting in an ankle sprain. With these kinematic principles in mind,
it is important to acknowledge that wearing shoes can make an individual more vulnerable to LAS as
well. The shoe sole adds width to the foot, thus extending the possible hypersupination moment. The
friction between shoe sole and ground surface also adds a horizontal shear force component,
imposing more torque on the subtalar joint.(7)
An excessive supination in combination with an external rotation of the lower leg may result in a
strain of the lateral talocrural ligaments. Damage occurs when the forced strain exceeds the tensile
strength of the ligaments. The anterior talofibular ligament (ATFL) withstands less maximal load and
12
energy compared to the posterior talofibular (PTFL) and calcaneofibular ligaments (CFL). Because of
this relative weakness, the ATFL is the first ligament to be damaged when the foot is sprained. When
this ligament is ruptured the internal rotation of the rearfoot increases and thus extra stresses the
intact lateral ligaments. This phenomenon is better known as “rotational instability”.(8) This allows
the CFL and the PTFL to be damaged as well.(9)
Many athletes are unwary that an ankle sprain can develop into a more severe, long term condition
called chronic ankle instability (CAI). Growing evidence confirms the relation between a cycle of ankle
sprain re-injury and joint synovitis, loose bodies, cartilage fibrillation and ultimately post-traumatic
osteoarthritis.(4)
3.2. Chronic ankle instability Chronic ankle instability or CAI is characterized by repetitive episodes of giving way or instability of
the ankle and/or the incidence of recurrent symptomatic ankle sprains.(10) Approximately 30-40 %
of acute lateral ankle sprains evolve to CAI, with some reporting percentages up to 70%.(10-12) The
observed posttraumatic changes are the main springboard for LAS evolving into CAI. These changes
can be categorized under functional and mechanical instability. It is believed that these two entities
work together in sustaining CAI.(11, 13)
Mechanical Ankle Instability (MAI) of the ankle complex occurs because of damage to structures
around the ankle joint after acute ankle sprain. The result is an ankle movement beyond the
physiologic limit of the ankle’s range of motion. MAI is often used synonymously with pathological
laxity of the ankle joint. One of the most common phrased causes for MAI is ligamentous damage.
Another possible insufficiency causing mechanical instability can be arthrokinematic impairments,
such as positional faults, hypomobility or hypermobility. The third cause of mechanical instability is
insufficiency caused by synovial and degenerative changes.(4)
Functional Ankle Instability (FAI) includes those deficits associated with ligamentous injury, mostly
proprioceptive, sensorimotor and neuromuscular. Because of those changes, the brain receives less
or false information about the position and muscle strength of the ankle. Thus, FAI results in a
deficiency of the dynamic defense mechanism protecting the rearfoot for hypersupination.(4) In
summary, FAI can be defined as the subjective feeling of ankle instability or recurrent, symptomatic
ankle sprains (or both) due to proprioceptive and neuromuscular deficits.(7) Whereas MAI is a range
of motion (ROM) beyond the physiological limits causing instability, FAI is defined is the instability
within the physiological ROM but beyond voluntary control.(14)

13
3.3. Neuromuscular control It has to be clear that CAI can have far-reaching consequences for one’s daily life activities. As
suggested above, maintaining the foot’s stability during gait and other functional activities is crucial.
Accurate sensorimotor control is therefore vital, a concept comprehending neuromuscular control,
proprioception, postural control and strength.(1) This article focusses on neuromuscular control, a
phenomenon that can be described as a subconscious activation of dynamic control addressed in
preparation for, and in response to, joint motion and loading.(15) For this ability to work properly, a
constant interaction between afferent input and efferent output of the central nervous system is
necessary. It has been proven that impaired neuromuscular control is a risk factor for ankle injury in
previously uninjured football players.(14)
One of the main sources for afferent information are the mechanoreceptors found in ligamentous
and capsular tissue. These receptors are often damaged after LAS, resulting in deafferentiation.(16,
17) Sensory deficits may also be present, caused by joint inflammation and pain. Joint laxity may
induce a diminished ability to detect joint motion and position.
Efferent output may be affected as well, caused by changes in central processing and alpha
motoneuron pool excitability.(18) It has been proven that excitability is altered in muscles crossing
the ankle joint but also in proximal leg muscles in people suffering from CAI.(19, 20) In addition,
bilateral postural control deficits have been observed in patients suffering from acute ankle sprain
and CAI. (11) Due to these findings there is obvious evidence of central neural changes.
Neuromuscular control itself can further be divided into a feedforward and a feedback loop. Both are
equally important in maintaining dynamic balance. The easiest way to define both loops is by stating
that the feedforward loop is responsible for preparing our body for a certain action and that the
feedback loop is the reaction of our body to that action. The majority of the literature about
neuromuscular control is focusses on the feedback loop, only a minor part concentrates on the
feedforward loop. A possible explanation for this difference could be that investigating the feedback
loop is less complicated. Various theories suggest that a wide spectrum of feedforward and feedback
mechanisms may contribute to neuromuscular control deficits in CAI.(11, 21, 22)
Feedforward neuromuscular control can be divided in two facets. The first facet, planning
movements based on sensory information from past experiences, is impossible to measure. The
second facet, preparatory muscle activity, is measurable through EMG-measurement. This
preparatory activity, in advance of an anticipated impact, is essential for accurately positioning the
limb and inducing a dynamic joint stiffness upon landing. It also leads to an improved stretch
sensibility and hence a faster muscle reaction time upon landing.
Feedback neuromuscular control is essential in constantly adjusting muscle activity via reflex
pathways. Therefore, this type of muscle activity is often called reactive. This reflex mediated
14
dynamic stability is related to speed and magnitude of the perturbation. Crucial for this loop is a
proper interaction of afferent and efferent output. Various injuries lead to a decrease in
neuromuscular control, as for CAI a proven setback in neuromuscular feedback has been found.(4,
11, 20-22)
For example, CAI-sufferers exhibit a delayed peroneal muscle reflex compared to healthy subjects,
which is essential in preventing the ankle to move to a hypersupination. These could be attributed to
proprioceptive deficits and/or to spinal level motoneuron alterations.(11, 23) Important is, however,
that this reflex is too slow to prevent hypersupination in healthy subjects as well. As written
previously, an inappropriate positioning of the lower limb before heel strike increases the potential
for injury. Because once the foot reaches the ground, the line of the reaction force is already
determined. If the foot is held in an inverted position when it reaches the ground, an external-
inversion load is placed upon the joint, increasing the likelihood of injury.(7, 24) It is clear that an
adequate position of the rearfoot upon ground contact is crucial, which can only be obtained through
appropriate feedforward neuromuscular control. Further research is needed to elucidate this matter.
3.4. Balance training Various rehabilitation protocols are used for CAI, typically they mainly involve exercises for
enhancing balance and proprioception. Balance training is one of the well-known protocols,
commonly used in CAI. Maintaining balance requires adequate integration of afferent visual,
vestibular and somatosensory inputs to generate an adequate efferent neuromuscular response.(25)
Lower limb injuries, such as ankle sprains, are believed to affect balance capabilities.(26) Because of
the initial injury mechanoreceptors may be damaged, hence leading to a (partial) deafferentation
and in its turn to alterations in muscle spindle sensitivity.(16, 27) These changes might lead to an
impaired balance and functional ankle instability. With balance training, muscle activity levels of
ankle stabilizing muscles are maximally stimulated and this could lead to a normalised neuromuscular
control. There is evidence of an improved postural control because of balance training, hence
implying a curative and a preventive effect.(16, 28, 29) A therapeutic effect has been shown in
subjects who suffered a previous ankle sprain.(18, 30) Furthermore, a preventive effect has been
found as well, as balance training could help prevent lateral ankle sprains.(31, 32) An explanation, as
stated by Asthon-Miller et Al. (2001) could be a higher stimulation of muscle spindles caused by long-
term balance training. This increased stimulation would improve neuromuscular control and thus a
better functional ankle stability.(33)
Until this day, there is no consensus about which type and modalities of balance training are best for
optimal rehabilitation.(18) The higher the muscle activity during balance training, the quicker the
rehabilitation speed and thus the quicker the return to performance.(34) The magnitude of the
15
muscle activity however, depends of the stability of the used device.(35) Therefore two different
balance boards are selected for this article: a uniaxial and a multiaxial type. As already well-known,
the peroneus longus muscle is vital in counteracting the sudden inversion moment at the ankle.(23,
36-41) In the uniaxial balance board, previous research conducted by De Ridder et Al. (2014), has
shown that the biggest peroneus longus activity is present when the balance board axis is aligned
with the frontal plane.(36) For the multiaxial balance board, which has 360 degrees of freedom and
thus less rotational stability, a more generalised muscle activity would be apparent.
The purpose of this study was primarily comparing the effects on muscle activation levels of four
stabilizing ankle muscles, comparing the effects of a six-week balance training protocol on a uniaxial
and on a multiaxial balance board. Two functional jumping activities were used for analysis pre- and
post-intervention. The hypothesis put forward is that the uniaxial group (UNI-), would have a better
trained peroneus longus muscle (as they solemnly train inversion and eversion) compared to the
multiaxial group (MULTI-). And secondly, that the MULTI-group would exhibit a more general training
effect on all measured ankle muscles.
4. Methods
4.1. Study design Randomised controlled trial.
4.2. Participants Subject recruitment was mainly undertaken by e-mailing all UGent physiotherapy students a
questionnaire containing various questions concerning their ankles in light of Gribble’s Position
Statement.(42) Supplementary, multiple advertisements were placed on social media and in various
sport clubs. Inclusion criteria were based on the International Ankle Consortium’s statement. (41)
These criteria suggest that CAI can be defined by: (1) a history of at least one significant ankle sprain,
(2) a history of the previously injured ankle joint giving way, and/or recurrent sprain and/or ‘feelings
of instability’, and (3) a general self-reported foot and ankle function questionnaire. A base level of
sportive activities were also required. Key exclusive criteria were: ligamentous lesions, surgery and
no feeling of instability or giving way. A second questionnaire, the Cumberland Ankle Instability Tool
(CAIT), was sent if criteria were met. (43) Only subjects scoring 24/30 or less were eligible. The ethics
committee of the University of Ghent granted ethical approval, and a written informed consent was
obtained for every patient who enrolled in our study.

16
After the screening, 33 subjects were included in this study, of which 4 subjects dropped out after
the pre-intervention screening. One more subject was lost to follow-up after the intervention,
leaving us with 28 subjects evenly divided over the two groups. (Table 1)
Table 1: Included subjects
All patients were randomised into two groups by an online tool. One group performed the balance
training protocol with the uniaxial wobble board (UNI), the other group did the protocol with a
multiaxial wobble board (MULTI). (Table 2)
Uniaxial Multiaxial Total P-value
Gender 4♂/10♀ 1♂/13♀ 5♂/23♀ P=0.139
Age
Mean (SD)
20.86
(3.718)
21.07
(2.269)
20.96
(3.024) P=0.258
Length (cm)
Mean (SD)
171.36
(8.500)
168.93
(9.482)
170.14
(8.922) P=0.263
Weight (kg)
Mean (SD)
66.3429
(7.51334)
65.6643
(8.19565)
66.0036
(7.7226) P=0.970
Table 2: Mean (SD) for demographic variables.
No significant baseline differences were found: gender (P=0.139), age (P=0.258), length (P=0.263)
and weight (P=0.970). Statistical analysis was performed with a Chi-Square test.

17
4.3. Procedure and equipment All tests were conducted in the week immediately before and after conclusion of the six-week
balance training program. Standardized shoes were used throughout the jumping trials, except for
two subjects whose shoe size were not available. Possible mechanical instability was objectified with
the varus click test and the anterior drawer test.
4.4. EMG Five stabilising ankle joint muscles were analysed with surface EMG (sEMG) (Noraxon TeleMyo): the
tibialis anterior (TA), peroneus longus (PL), peroneus brevis (PB), medial head of the gastrocnemius
(GaMed) and lateral head of the gastrocnemius (GaLat). A telemetric TeleMyo EMG system was used
for measurement (Noraxon U.S.A. Inc, Scottsdale, Arizona 85260, USA). Subjects’ skin was prepared
before electrode application: skin shaving, scrubbing and cleansing with ethanol. Bipolar Ag/AgCl
surface electrodes, 2cm diameter, with conducting gel were placed with an inter-electrode distance
of 2 cm center-to-center and parallel to the muscle fibres according to surface ElectroMyoGraphy for
Non-Invasive Assessment of Muscles (SENIAM) guidelines (www.seniam.org). Muscle motor points
(and hence electrode localisation) were located in a standardized manner (Table 3). All preparations
were carried out by the same researcher to diminish variability.
Table 3: Standardized electrode placement. (2 electrodes/muscle)
4.4.1. Maximal voluntary contraction (MVC) In order to normalize data measured during the jumping activities, a mean MVC was required of
every muscle. All muscles were tested in a standardized, isometric manner. The PL, PB and TA
muscles were tested in a sitting position. A manual resistance towards pronation was given for the PL
and PB muscle, whereas a manual resistance towards dorsiflexion was required for the TA. The
gastrocnemius was tested in a supine position, where the subjects were asked to perform an
isometric plantarflexion, pushing against a wall. For every muscle, 3 different isometric contractions
lasting for 5 seconds each, were required. A marker was placed on the subjective moment of
reaching maximal force. Every assessment of the MVC was made by the same researcher.
Muscle electrode placement
TA 1/3th of the distance between fibula head and medial malleolus (from proximal)
PM 1/4th of the distance between fibula head and lateral malleolus (from proximal)
PL 1/4th of the distance between fibula head and lateral malleolus (from distal)
GaMed Most prominent bulge of the muscle
GaLat Most prominent bulge of the muscle
Reference electrode
Bony fibula head
18
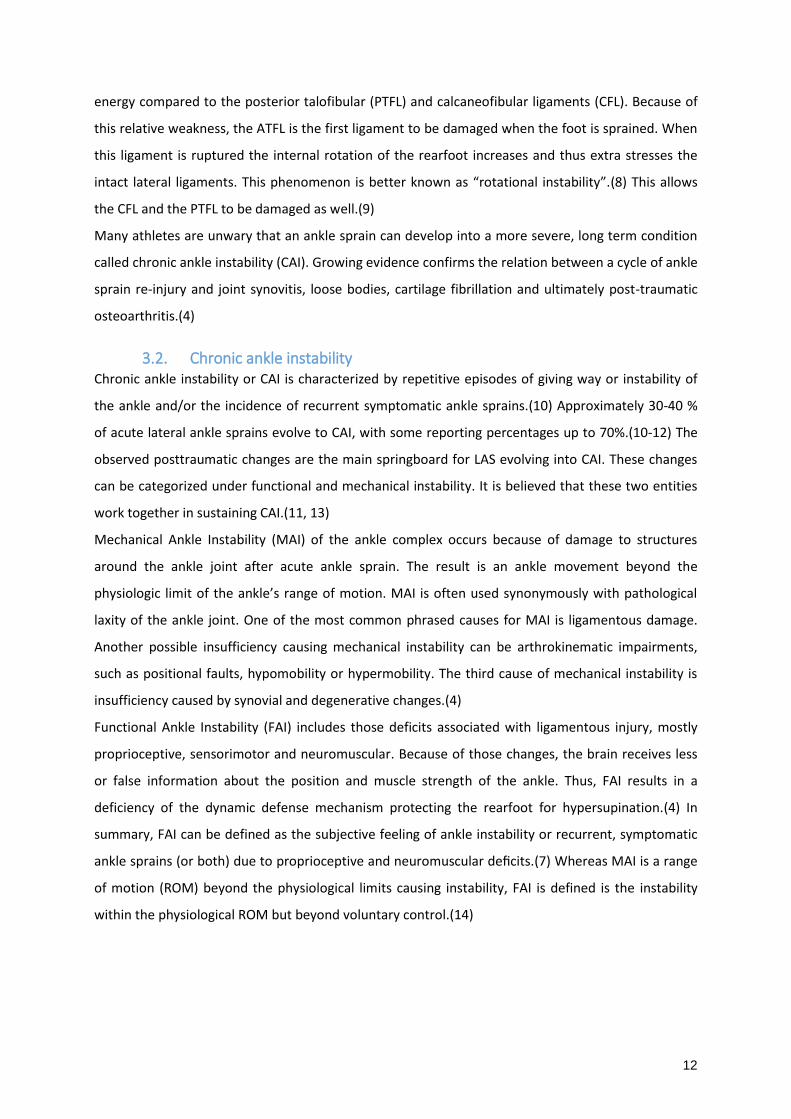
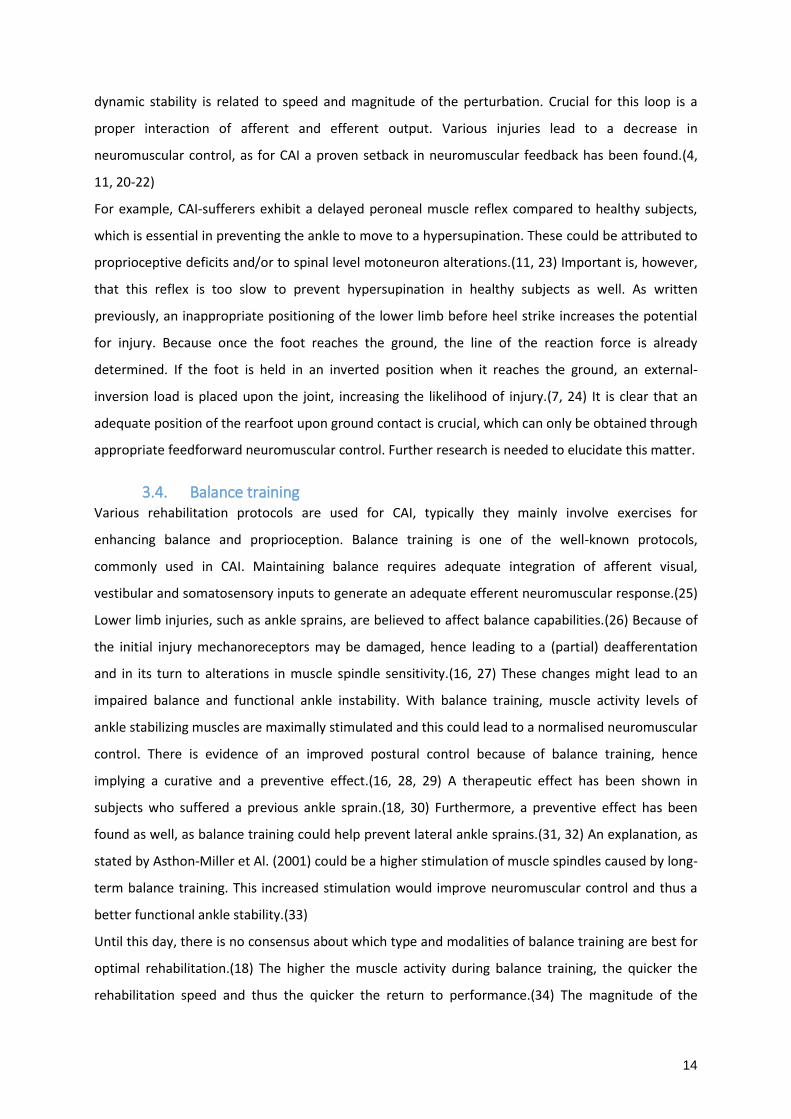
4.4.2. Functional jumps Subsequently subjects were asked to perform 5 valid forward (FJ) and sideways jumps (SJ). In order
to measure landing forces, a force plate (AMTI, Watertown, Massachusetts 02472, USA) measuring at
200Hz was embedded in a walkway. The required jumping distance was calculated individually for
every subject, based upon their body length (FJ = 40% height / SJ = 33% height). A landing zone was
visually marked on the force plate and a 15cm high hurdle was placed halfway, for standardisation of
jump height and distance. An attempt was valid if the subject took off on both legs simultaneously
and landed on their affected side. Upon landing, they had to keep their balance for 5 seconds with
their hands akimbo. Two test trials for each jumping variation were awarded.
Picture 1: Forward Jump (FJ)
Picture 2: Side Jump (SJ)
4.5. Questionnaires Upon initial and final assessment, subjects were requested to fill in some questionnaires. Among
them were a general survey inquiring for their medical history, a CAIT, a Foot and Ankle Disability
Index (FADI) and a series of Visual Analog Scale (VAS) styled questions concerning the jumping
activity. The CAIT questionnaire objectifies ankle instability, subjects had to select a box with the
answer best suited for them in every question, for both feet. A score of <24/30 could be interpreted
as ankle instability.(43) The FADI is divided into two subcategories: a first section focussing on daily
life (FADI A) and a second part highlighting solemnly sportive activities (FADI B). Respectively a score
is awarded on /104 and /32, which are then expressed as percentage scores. For every jumping
activity, 4 questions were proposed to every subject with a VAS-styled answering method. Questions
targeted pain, fatigue, instability and difficulty experienced during and after conclusion the jumps.

19
Subjects’ marks on the 10cm line were measured and noted as a score on /100. A Global Rating Of
Change scale (GROC) was added for the final assessment. The GROC scale is used to measure
subjective improvement (of a certain intervention). A value, corresponding with a certain feeling, is
ticked-off.(Appendix 1-5) Statistic analysis was performed with a paired student’s T-test.
4.6. Intervention The intervention consisted of a 6 week stability training program.(44) Subjects were randomly
divided (using a computer programme) in two groups, both containing 14 subjects. One group
assisted the training with a uniaxial wobble board whilst another group used a multiaxial equivalent.
The axis of the uniaxial wobble board was aligned with the frontal plane, therefore the only possible
movements were pronation and supination. The radius of both wobble board curvatures are
identical: 21cm in width and 6.8cm in height with a diameter of 23cm.
Each subject was urged to perform three trainings a week. Every training session was supervised by
either one of the four researchers, this to ensure maximal quality of the training. Every week, the
training difficulty increased. Single leg stance (SLS) on the affected leg was used as a base exercise. In
between trials a 30” resting period was granted, a 2’ break was given in between exercises. A
summary of the training program is displayed in table 4.
Table 4: A six-week balance training program
Week 1 modalities Eyes Remarks
SLS 3x 20” open Hands on the waist, looking forward
SLS 3x 20” open Hands on the waist, looking forward
Week 2
SLS 3x 30” open Hands on the waist, looking forward
SLS 3x 30” open Hands on the waist, looking forward
Week 3
SLS 3x30” open Hands on the waist, looking forward
SLS 3x30” closed Hands are free
SLS + reach 3x2 in every direction open Hands on the waist, reach = 30cm
Week 4
SLS 3x30” open Hands on the waist, looking forward
SLS 3x30” closed Hands on the waist, looking forward
SLS + reach 3x2 in every direction open Hands on the waist, reach = 30cm
Week 5
SLS 3x30” open Hands on the waist, looking forward
SLS 3x30” closed Hands on the waist, looking forward
SLS + reach 3x2 in every direction open Hands on the waist, reach = 45cm
SLSquat 3x20” open Hands on the waist, looking forward
Week 6
SLS 3x30” open Hands on the waist, looking forward
SLS 3x30” closed Hands on the waist, looking forward
SLS + reach 3x2 in every direction open Hands on the waist, reach = 45cm
SLSquat 3x20” open Hands on the waist, looking forward

20
Because of the difficulty of the SLS, especially for the multiaxial wobble board group, subjects were
allowed to sum up all their combined time balancing on the wobble board to attain their total time
target. For the SLS + reach exercises, the patients had to reach to 4 cones with the non-affected foot
whilst balancing on their affected leg. Cones were arranged in 4 directions: front, left, behind, right.
Distance to the cones was calculated to the centre of the wobble board axis.
Picture 3: uniaxial wobble board
Picture 4: multiaxial wobble board
4.7. Data analysis All EMG data was analysed with Myoresearch 3.4.5. Master edition (Noraxon U.S.A. Inc, Scottsdale,
Arizona 85260, USA).
4.7.1. MVC All raw MVC data was rectified and smoothed (RMS 50ms). Within every trial a 3-second interval
following the manually placed marker was demarcated. Mean values were calculated for every
interval. Subsequently the mean of all three interval means was calculated and used for further
analysis. This was done for both pre- and post-intervention MVC data.

21
4.7.2. Functional jumps This raw data was rectified and smoothed (RMS 50ms) as well. EMG data was paired with the
pressure plate data. For identifying moment of impact a marker was placed on the first pressure
plate value greater than 15N. Around this threshold, a 200ms interval before and after contact was
demarcated for every jump. Mean EMG values of all five muscles in those time periods were noted.
Again, a mean value of those means was calculated for further analysis. In this manner EMG mean
values were obtained for both time periods in both jumping activities. This was done for both pre-
and post-intervention functional jumping data.
For attaining a normalisation of the acquired functional jumping data, these mean recorded voltages
were divided by the mean MVC values. As a result, the jumping data are expressed as a percentage
of the subjects’ ‘maximal force’.
These percentages were used for statistical analysis. Twelve outliers were discarded for analysis.
4.7.3. Statistical analysis Statistical analysis was performed with SPSS 24 (SPSS Inc., Chicago, Illinois, USA). After pairing the
pre- and post-intervention data, a Linear Mixed Model analysis was applied to the newly paired data.
Analysis focussed on time, intervention and a nested term combining both. Consequently we
received information about baseline differences and interaction effects. Interaction effects were
defined for intervention duration, balance board group and a combination of both. Because of the
5% chance of reporting a type I error using Linear Mixed Models, the standard significance level of p
< 0.05 was divided by the amount of used muscles in our analysis (4), generating a significance level
of p < 0.012. MVC’s were also compared to one each other, this was done through a paired samples
T-test.
22
5. Results
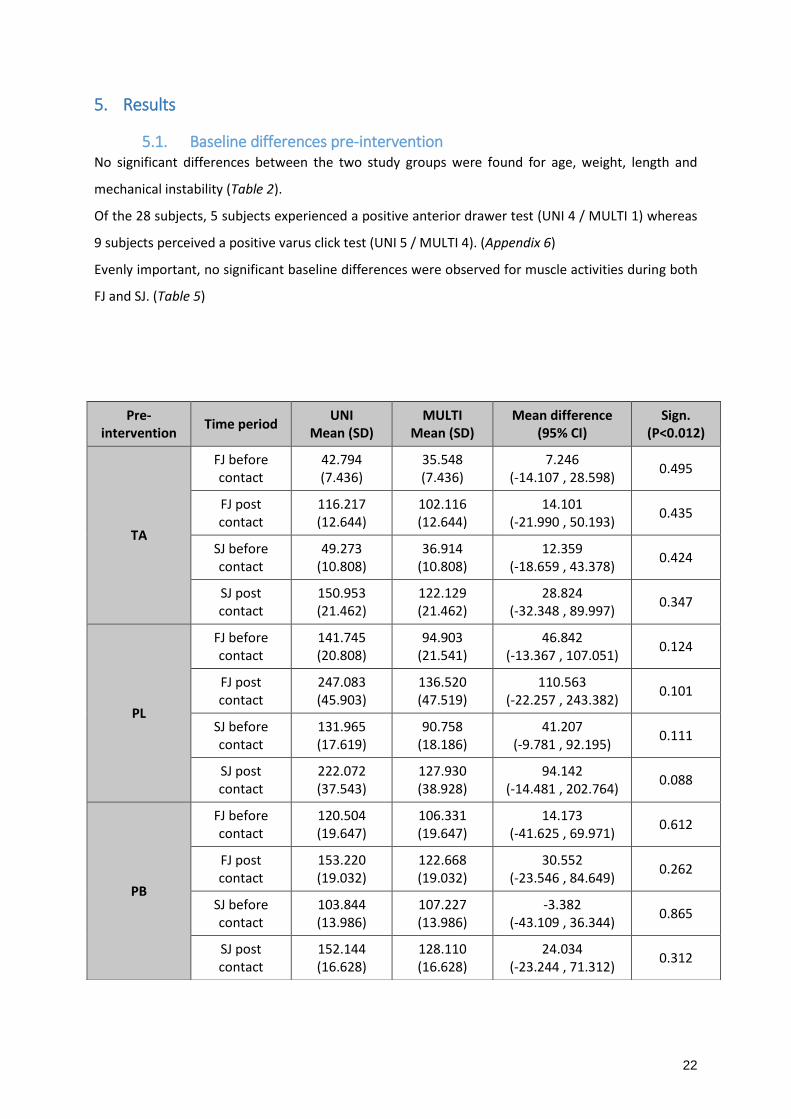
5.1. Baseline differences pre-intervention No significant differences between the two study groups were found for age, weight, length and
mechanical instability (Table 2).
Of the 28 subjects, 5 subjects experienced a positive anterior drawer test (UNI 4 / MULTI 1) whereas
9 subjects perceived a positive varus click test (UNI 5 / MULTI 4). (Appendix 6)
Evenly important, no significant baseline differences were observed for muscle activities during both
FJ and SJ. (Table 5)
Pre- intervention
Time period UNI
Mean (SD) MULTI
Mean (SD) Mean difference
(95% CI) Sign.
(P<0.012)
TA
FJ before contact
42.794 (7.436)
35.548 (7.436)
7.246 (-14.107 , 28.598)
0.495
FJ post contact
116.217 (12.644)
102.116 (12.644)
14.101 (-21.990 , 50.193)
0.435
SJ before contact
49.273 (10.808)
36.914 (10.808)
12.359 (-18.659 , 43.378)
0.424
SJ post contact
150.953 (21.462)
122.129 (21.462)
28.824 (-32.348 , 89.997)
0.347
PL
FJ before contact
141.745 (20.808)
94.903 (21.541)
46.842 (-13.367 , 107.051)
0.124
FJ post contact
247.083 (45.903)
136.520 (47.519)
110.563 (-22.257 , 243.382)
0.101
SJ before contact
131.965 (17.619)
90.758 (18.186)
41.207 (-9.781 , 92.195)
0.111
SJ post contact
222.072 (37.543)
127.930 (38.928)
94.142 (-14.481 , 202.764)
0.088
PB
FJ before contact
120.504 (19.647)
106.331 (19.647)
14.173 (-41.625 , 69.971)
0.612
FJ post contact
153.220 (19.032)
122.668 (19.032)
30.552 (-23.546 , 84.649)
0.262
SJ before contact
103.844 (13.986)
107.227 (13.986)
-3.382 (-43.109 , 36.344)
0.865
SJ post contact
152.144 (16.628)
128.110 (16.628)
24.034 (-23.244 , 71.312)
0.312

23
Table 5: Baseline differences pre-intervention
5.2. Intervention
5.2.1. Functional jumps Within FJ before contact in the UNI-group, a significant lower muscle activation was only found for
the TA (p=0.007) and GaMed (p=0.002) muscles post-intervention. In the MULTI-group, no significant
differences were found for the same interval. A general decline in muscle activity post-intervention
was observed in both groups for this time period. The decline, however, was bigger in the UNI-group
for all muscles except GaLat.
In the SJ exercise, a significant decrease is noted in the UNI-group, again for both the TA (P=0.008)
and GaMed (P=0.008) muscles. All muscles in both groups exhibit a general reduction in post-
intervention muscle activity, the overall drop is greater for the UNI-group in all muscles except PB
and GaLat.
Post-impact in the FJ activity we notice a significant decrease in EMG activation post-intervention for
both TA (P=0.000) and GaMed (P=0.001) muscles in the UNI-group, and in the GaMed (P=0.002)
muscle for the MULTI-group. The other muscles showed a lower activation, but these differences
were not significant. Overall decrease is greater for the UNI-group in all muscles.
For the last observation, we focus on the post-impact SJ exercise. Here a significant lower activation
of the TA (P=0.003), PB (P=0.004) and GaMed (P=0.008) muscles in the UNI-group are noted. For the
MULTI-group a significant decrease is only seen in the GaMed (P=0.004) muscle.
Muscles without significant interventional changes (PL, PB and GaLat) can be found in appendix 7.
GaMed
FJ before contact
188.072 (18.857)
213.441 (18.857)
-25.369 (-78.947 , 28.208)
0.346
FJ post contact
134.596 (17.634)
148.255 (17.634)
-13.660 (-64.064 , 36.745)
0.587
SJ before contact
164.428 (16.402)
181.058 (16.402)
-16.631 (-63.366 , 30.105)
0.477
SJ post contact
134.369 (16.412)
149.651 (16.412)
-15.282 (-62.250 , 31.686)
0.514
GaLat
FJ before contact
265.379 (45.754)
269.272 (45.754)
-3.893 (-133.796 , 126.010)
0.952
FJ post contact
231.410 (41.490)
200.800 (41.490)
30.610 (-87.325 , 148.545)
0.604
SJ before contact
212.507 (45.632)
222.577 (45.632)
-10.070 (-139.715 , 119.575)
0.877
SJ post contact
233.259 (47.408)
219.955 (47.408)
13.304 (-121.623 , 148.231)
0.844
24
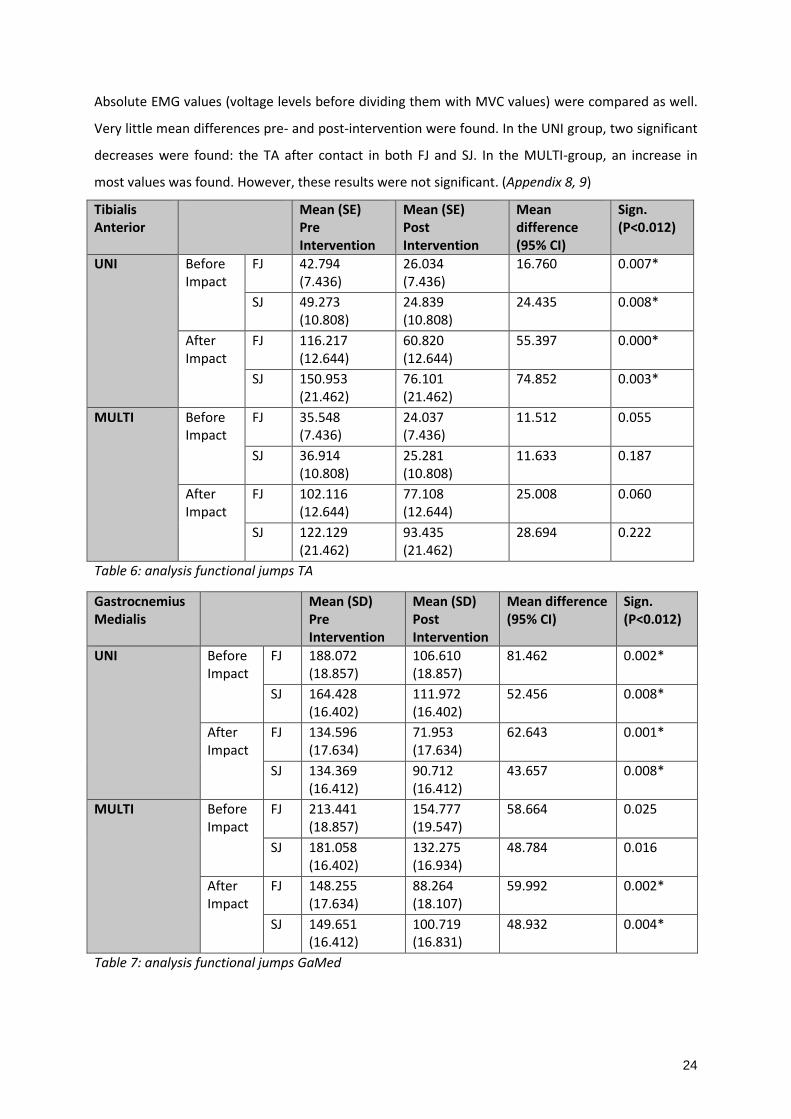
Absolute EMG values (voltage levels before dividing them with MVC values) were compared as well.
Very little mean differences pre- and post-intervention were found. In the UNI group, two significant
decreases were found: the TA after contact in both FJ and SJ. In the MULTI-group, an increase in
most values was found. However, these results were not significant. (Appendix 8, 9)
Tibialis Anterior
Mean (SE) Pre Intervention
Mean (SE) Post Intervention
Mean difference (95% CI)
Sign. (P<0.012)
UNI Before Impact
FJ 42.794 (7.436)
26.034 (7.436)
16.760 0.007*
SJ 49.273 (10.808)
24.839 (10.808)
24.435 0.008*
After Impact
FJ 116.217 (12.644)
60.820 (12.644)
55.397 0.000*
SJ 150.953 (21.462)
76.101 (21.462)
74.852 0.003*
MULTI Before Impact
FJ 35.548 (7.436)
24.037 (7.436)
11.512 0.055
SJ 36.914 (10.808)
25.281 (10.808)
11.633 0.187
After Impact
FJ 102.116 (12.644)
77.108 (12.644)
25.008 0.060
SJ 122.129 (21.462)
93.435 (21.462)
28.694 0.222
Table 6: analysis functional jumps TA
Gastrocnemius Medialis
Mean (SD) Pre Intervention
Mean (SD) Post Intervention
Mean difference (95% CI)
Sign. (P<0.012)
UNI Before Impact
FJ 188.072 (18.857)
106.610 (18.857)
81.462 0.002*
SJ 164.428 (16.402)
111.972 (16.402)
52.456 0.008*
After Impact
FJ 134.596 (17.634)
71.953 (17.634)
62.643 0.001*
SJ 134.369 (16.412)
90.712 (16.412)
43.657 0.008*
MULTI Before Impact
FJ 213.441 (18.857)
154.777 (19.547)
58.664 0.025
SJ 181.058 (16.402)
132.275 (16.934)
48.784 0.016
After Impact
FJ 148.255 (17.634)
88.264 (18.107)
59.992 0.002*
SJ 149.651 (16.412)
100.719 (16.831)
48.932 0.004*
Table 7: analysis functional jumps GaMed

25
5.2.2. MVC (mean) Subsequent results, found in table 7 and 8 were found using a paired samples T-test. In general, we
observe an elevation in post-intervention mean MVC-values. However, the raise is only significant for
the GaLat in the UNI-group (P=0.000). For the MULTI-group, on the other hand, significant increases
are seen in TA (P=0.000), PB (P=0.000), GaMed (P=0.001) and GaLat (P=0.000) muscles’ mean MVC.
Table 8: analysis MVC’s UNI group
Table 9: analysis MVC’s MULTI-group
5.2.3. Subjective parameters
5.2.3.1. CAIT
In both groups a raise in post-intervention scores are observed, the UNI-group improves 4.14%
(significant, P=0.016) whereas the MULTI-group improves 2.71% (not significant, P=0.876). (Table 10)
5.2.3.2. FADI
An overall raise in post-intervention scores are observed, the only significant raise however is seen in
the UNI-group for the A part (P=0.001). Other results are slightly better but not significant. (Table 10)
UNI Pre-intervention
Mean (SD) Post-intervention
Mean (SD) Mean difference
(95% CI) Sign. (2-tailed)
(P<0.05)
TA 383.27
(241.10) 466.17
(112.08) -82.9
(-157.15 , -8.65) 0.030*
PL 227.58
(148.51) 261.31
(164.28) -33.73
(-69.89 , 2.42) 0.066
PB 275.39
(248.47) 356.48
(151.53) -81.09
(-145.85 , -16.33) 0.016*
GaMed 322.84
(306.84) 412.24
(259.51) -89.40
(-185.33 , 6.52) 0.066
GaLat 192.35
(175.98) 313.51
(185.02) -121.16
(-165.60 , -76.71) 0.000*
MULTI Pre-intervention
Mean (SD) Post-intervention
Mean (SD) Mean difference
(95% CI) Sign.
(P<0.05)
TA 335.78
(128.97) 423.26
(136.11) -87.48
(-131.64 , -43.32) 0.000*
PL 253.23
(124.93) 274.47 (95.30)
-21.24 (-68.43 , 25.95)
0.364
PB 233.61 (87.25)
367.62 (103.15)
-134.00 (-168.60 , -99.41)
0.000*
GaMed 181.20 (73.63)
324.69 (207.72)
-143.49 (-219.95 , -67.02)
0.001*
GaLat 116.44 (60.03)
293.63 (191.25)
-177.20 (-256.00 , -98.39)
0.000*

26
Table 10: Analysis subjective questionnaires
5.2.3.3. VAS
Overall a clear decrease in post-intervention values is observed. The only significant result, however,
is a decrease in pain reported during SJ within the UNI-group (p=0.017). All other decreases are not
significant for any group or any jump. (Appendix 10)
5.2.3.4. GROC
The mean value of the MULTI-group (group B) is slightly higher: 4.36 compared to 4.29 for the UNI-
group (group A), but the difference is not significant (P=0.895). (Picture 5) (Table 11)
Picture 5: GROC bar chart (UNI = blue, MULTI = green)
N Mean Std. Deviation Std. Error Mean
UNI 14 4.29 1.069 .286
MULTI 14 4.36 1.692 .452
Table 11: GROC statistics
Pre-intervention
Mean (SD) Post-intervention
Mean (SD) Mean Difference
(95% CI) Sign.
(P<0.05)
UNI
CAIT 15.21
(4.080) 19.36
(4.568) -4.143
(-6.313, -1.972) 0.016*
FADI A 88.324 (8.270)
93.201 (7.978)
-4.876 (-7.921, -1.832)
0.001*
FADI B 73.438
(12.119) 84.375
(12.856) -10.938
(-18.041, -3.834) 0.059
MULTI
CAIT 17.07
(3.222) 19.79
(5.102) -2.714
(-6.269, 0.841) 0.876
FADI A 92.239 (6.928)
93.887 (5.328)
-1.648 (-6.466, 3.169)
0.755
FADI B 75.893
(15.379) 84.152
(11.786) -8.259
(-16.285, -0.233) 0.067
27
5.3. Baseline differences post-intervention There are no significant baseline differences post-intervention. Only the GaMed muscle in the FJ
before contact nears the significance level of p < 0.012. All other muscles are remotely off
significance. (Appendix 11)
6. Discussion The main objective of this study was to compare a six-week balance training programme performed
on a uniaxial or a multiaxial balance board in subjects (N=28) with chronic ankle instability. To
objectively compare both groups, we analysed EMG data of 4 crucial muscles to ankle stability (TA,
PL, PB, GaLat and GaMed) during forward and sideways jumping tasks, this pre- and post-
intervention. A 200ms period pre- and post-landing was identified. Obtained EMG-data was divided
by associated mean MVC values as a manner of normalization. The subjects were asked to fill in a
collection of questionnaires pre- and post-intervention for accurate descriptive statistical analysis.
6.1. Intervention effect The hypothesis of this study was seeing an increased PL activity in the UNI group (because their
training was focused solemnly on inversion and eversion) and a more generalized increase in ankle
stabilising muscle activity in the MULTI-group (as they train in all 360°). Rather than noticing an
increase in muscle activity, an overall decrease for the normalized data was noted. Within the UNI-
group, the downfall was significant for the TA and GaMed in all 4 time periods and for the PB in the
SJ post-impact. In the MULTI-group, significant decreases were apparent for the GaMed in all time
periods.
The mean overall descent is bigger in the UNI-group, with percentages up to 83% less muscle activity
post-intervention. Comparing mean normalized overall muscle activity, decreases tend to be larger in
the FJ (23.73%) than in the SJ (16.93%) and larger post-impact (32.13%) than pre-impact (8.53%).
In search of an explanation for these curious findings, researchers investigated the two components
forming the normalized data as well. When comparing the absolute EMG values pre- and post-
intervention, little differences are discernible. (Appendix 8,9) Within the UNI-group, changes are
subtle as the number of gains and losses in post-intervention mean voltages even each other out.
Two changes are significant: TA muscle activity decreases after contact in both jumping varieties.
Regarding the MULTI-group, a different story is noticeable: in 16 of the 20 defined intervals, the
mean voltage increases. None of these raises, however, are significant.
Inspecting the mean MVC values pre- and post-intervention, an overall increase in activation was
found. In the UNI-group TA, PB and GaLat increase significantly. Equivalent results are apparent for

28
the MULTI-group, with an additional significant increment for the GaMed. The overall gains are larger
for the MULTI-group: 112,64%, this is 31.02% more than the overall gains within the UNI-group.
These results seems to be consistent, hence alluding an increase in the maximal activation rate of the
muscle fibres. Previous studies have found that the axis of the balance board has influence on which
muscles are activated, this can explain the difference between the UNI- and the MULTI-group.(36)
Other research has found evidence of an increase in Hmax/Mmax ratio because of a balance training
protocol.(45) This ratio, describing the maximal H-reflex to maximal M-wave, is a measure of
effectivity of α-motoneuron activation. The better the ratio, the larger relative amount of α-
motoneurons activated by afferent nerve fibres.(45) This could be an explanation for the increase
observed in the MVC’s, since an increase in α-motoneuron activation indicates a greater amount and
a better synchronized muscle fibre activation.(46-48) A six-week training programme is insufficient
for generating a significant muscle hypertrophy, literature has proven that force gains in the first
weeks of training are to be found in central/peripheral neural changes.(49-51) Important
acknowledgment, however, is that this improved Hmax/Mmax ratio was observed in CAI subjects
performing a double-limb stance balance training protocol.(45) Seemingly contradictory, the same
study found a higher presynaptic reflex depression in single-limb stance after balance training in CAI
subjects compared to healthy controls. Presynaptic inhibition is believed to be a short-term response
to injury. A better ability to modulate the size of the reflex can lead to a better balance, as a
dampening of an exaggerated response to perturbation can increase stability. The double-limb
stance, where the Hmax/Mmax ratio changes were found, is an intrinsically more stable position
than the single-limb stance. This may explain why, in this position, there were no changes in
presynaptic reflexes as this position may not need a modulation in presynaptic reflex.(45) These
findings could explain why the MVC’s increase post-intervention. Still, a difference of 31.02% in mean
overall MVC exists between both groups, favouring the MULTI-group. A possible explanation could
be that the MULTI-group trains in a wide variety of degrees, therefore this could result in a bigger
activation of the ankle musculature.(34) Another possible contributing factor is the vast amount of
effort MULTI-group subjects experienced to stay atop their balance boards. They were constantly
challenged in maintaining balance, whilst the UNI-group mastered the exercises relatively fast. The
constant challenge may have extra stimulated α-motoneurons, hence the greater MVC increase.
As previously stated, the normalized data is acquired by dividing the absolute EMG data with the
MVC data. With a significant increase in MVC values (the denominator) and little change in the raw
EMG values (the nominator), the result is a lesser relative muscle activation rate post-intervention.
This can mean that muscle strength is improved because of a better muscle fibre activation
coordination and/or that less effort is needed in maintaining balance. Some studies indeed suggest
that a training protocol can cause changes in the neuromuscular system and the rate of force

29
development (this is a quality needed for active stabilisation of the joints).(52-56) Other, previously
conducted studies combining kinematics and EMG analysis, observe a lower activation of the TA, PL
and GaMed in CAI patients due to altered kinematic positions and reductions in joint
movements.(57) We can however not conclude if the kinematics were changed, because we did not
use this as an outcome parameter.
Also apparent in the performed Linear Mixed Model analysis is that for some muscles a significant
effect of intervention duration is found. (Appendix 12) On the other hand, no significant interaction
effects of intervention duration and balance board type are discernible. This means that some
muscles significantly improve because of a six-week balance training protocol that has been fulfilled,
but what group subjects were assigned to has no clear effect on muscle activity. This finding can be
extended to the baseline differences: pre-intervention no significant differences are observable.
Neither are significant differences post-intervention found, although there are some significant
differences in relative muscle activation rate during the jumping tasks post-intervention. This means
that, despite the slight advantage of the uniaxial balance board, the benefits appear to be too little to
impose a post-interventional change. Supposedly, a collaboration of various causes would be the
reason for these small benefits. It may be possible that the six-week training period is too short to
impose a transfer from the relatively static balance training program to the more dynamic jumping
tasks used as evaluation method, resulting in subtle changes during the post-interventional jumping
tasks.
6.2. Subjective parameters Researchers’ hypothesis is that there would be an overall improvement in subjective parameter
outcome post-intervention. The CAIT and FADI questionnaires are often used in balance training
protocols and have proven their clinical relevance. (4, 58-60) Overall, obvious improvements are
apparent in both groups, alluding that balance training could augment a subjectively reported degree
of functionality. Increments tend to be higher in the UNI-group, in comparison with the MULTI-group
differences of 1.4% (CAIT), 3.3% (FADI A) and 2.6% (FADI B) can be calculated, all favoring the UNI-
group. Significant increases can be found in CAIT and FADI A scores for the UNI-group. The pre-
intervention scores, however, are lower in the UNI-group, thus explaining their significant
differences.
Researchers identified an overall decrease in VAS scores, concerning all 4 questions. One difference
appears to be significant: SJ pain in the UNI-group. A possible explanation for the few significant
differences could be the high standard deviation in the means pre- and post-intervention. (Appendix
10) Nevertheless there are obvious decreases in all subjects’ VAS-scales, but some subjects who
started with a very high VAS score stayed relatively high, and the other way around. The biggest
30
decreases are observed for the questions about difficulty and instability, in the researchers’ opinion
these are the most important questions in this VAS-scale. In the UNI-group there is a post-
intervention overall mean decrease of 17.6mm in the FJ and 22.47mm in the SJ. The mean decrease
within the MULTI-group is 18.97mm FJ and 13.14mm SJ. Therefore, the differences in overall means
imply a minor favour towards the MULTI-group for FJ (1.37mm) and a favour towards the UNI-group
for SJ (9.33mm).
In the GROC questionnaire, rating subjective changes caused by an intervention, an overall
improvement is seen as well. The improvement in both groups is about the same, UNI-group
rapports a 4.29/7 mean score whilst the MULTI-group scores slightly better with a 4.36/7 mean.
Nevertheless, the dispersion within the MULTI-group is larger: one subject scored 0/7, another one
scored 1/7. This means those subjects feel no or only little improvement. Whereas in the UNI-group,
all subjects scored 3/7 or higher, meaning that they all feel at least somewhat better. In conclusion, it
can be said that all but one subject felt better-off afterwards the balance training protocol.
In general, both groups subjectively report a better feel concerning their ankle and it’s functioning.
As in most findings, the improvement appears to be more profound for the UNI-group. A possible
explanation could be that the MULTI-group suffered much more effort when doing the training
program, whereas the UNI-group quickly became familiar with their balance board. Hence, UNI-
group subjects may experience a bigger improvement since they had less effort maintaining balance.
As the MULTI-group kept struggling, those subjects could feel subjectively less trained.
6.3. Strengths and limitation
A first strength is that we were almost certain that subjects who participated in this study suffered
from CAI, because of the strong inclusion criteria.(42) A noticeable drawback of these criteria is that
they led to a small study sample. For future research, larger populations are desirable.
The fact that, on every training occasion, at least one researcher was present for piloting the subjects
is another strength. Some other studies give their subjects a home exercising program, but thereby
there is no certainty of a 100% compliance and correct execution. In this study subjects performed
the exercises with 95% compliance. Also, both the balance boards were custom made: the curvature
of both types is exactly the same. Thus, a possible difficulty difference between the groups can be
excluded.
All tests pre- and post-intervention were performed in the same setting, and by the same
researchers. For example, all varus-click tests and anterior drawer tests were executed by one
researcher, the electrodes were always placed by the same researcher and the manual resistance
during the MVC’s was also given by the same researcher. An important limitation, however, is
working with surface EMG at two different moments (pre- and post-intervention). Although various

31
measures were taken to standardize the electrode locations, a small difference pre- and post-
intervention is inevitable. The EMG system utilised in this research was wired. Therefore, noise
interfering with the signals during movements cannot be excluded.(61) A wireless EMG system could
have been better.
Another limitation is the way of computing our normalized EMG data: division of raw EMG data by
the correspondent mean MVC value. Hence the muscle activity, measured during the jumps, is
expressed as a percentage of the mean MVC value. These mean MVC values are, at their turn,
calculated out of 3 mean MVC’s. These means can be an underestimation of the real maximal
voluntary contraction. This also means that if there are major changes in pre- and post-intervention
mean MVC values, they could mask an alteration of the EMG data. Therefore researchers
investigated both raw EMG data and mean MVC values separately as well.
Lack of kinematic information concerning ankle position immediately pre- and post-contact is
another limitation. Coupling such data to EMG data could clear certain things out, a better
understanding of how balance training influences the ankle in CAI could have been forged. Kinematic
data could further explain the findings found in the EMG data.
No EMG measurements were taken of more proximal muscles, such as knee, hip and trunk
musculature. Because MULTI-group subjects experienced numerous more effort maintaining balance
atop the balance board they subjectively adopted more of a hip strategy, compared to the UNI-group
subjects who easily held their balance and were able to employ more of an ankle strategy in
maintaining balance. Hence, better trained ankle musculature in UNI-group subjects seems evident.
On the other hand, important alterations in muscle activity could have occurred in more proximal
muscles for MULTI-group subjects but no EMG data was gathered on that subject.
Researchers made no use of a control group. Thus no comparison in effects caused by the balance
training program can be made between healthy and CAI subjects.
6.4. Practical implications and conclusion
It is clear that both interventions had an effect on muscle activation. No significant differences were
found between the uniaxial and multiaxial balance board. We thus cannot conclude if one balance
board is better than the other. We can conclude however, that subjects with CAI have benefit with
training on a balance board. In researchers’ opinion, it may be useful starting balance training using
the more simple uniaxial balance board, gradually substituting it with a multiaxial balance board.
Additionally, it can be interesting to evolve from more a more static balance training program to a
more dynamic alternative when progressing the rehabilitation, as this dynamic balance training is
thought to be more functional. For a better understanding which balance board type is ultimately

32
better, we recommend further research with a larger population and/or longer intervention
duration.
6.5. Acknowledgements
The authors of this study would like to thank Prof. Dr. P. Roosen (promotor) and Dr. R. De Ridder (co-
promotor) for their effort and time. Without their help this study would not have been possible. We
also would like to thank the Department of Rehabilitation Sciences and Physiotherapy of Ghent
University for the use of their research laboratories and material.
7. References 1. Holmer P, Sondergaard L, Konradsen L, Nielsen PT, Jorgensen LN. Epidemiology of sprains in
the lateral ankle and foot. Foot Ankle Int. 1994;15(2):72-4.
2. Nelson AJ, Collins CL, Yard EE, Fields SK, Comstock RD. Ankle injuries among United States
high school sports athletes, 2005-2006. J Athl Train. 2007;42(3):381-7.
3. Adams PF, Barnes PM, Vickerie JL. Summary health statistics for the U.S. population: National
Health Interview Survey, 2007. Vital Health Stat 10. 2008(238):1-104.
4. Hertel J. Functional Anatomy, Pathomechanics, and Pathophysiology of Lateral Ankle
Instability. J Athl Train. 2002;37(4):364-75.
5. McKay GD, Goldie PA, Payne WR, Oakes BW. Ankle injuries in basketball: injury rate and risk
factors. Br J Sports Med. 2001;35(2):103-8.
6. Lin CF, Chen CY, Lin CW. Dynamic ankle control in athletes with ankle instability during sports
maneuvers. The American journal of sports medicine. 2011;39(9):2007-15.
7. Tropp H. Commentary: Functional Ankle Instability Revisited. J Athl Train. 2002;37(4):512-5.
8. Hertel J. Functional instability following lateral ankle sprain. Sports Med. 2000;29(5):361-71.
9. Freeman MA. Instability of the foot after injuries to the lateral ligament of the ankle. J Bone
Joint Surg Br. 1965;47(4):669-77.
10. Palmieri-Smith RM, Hopkins JT, Brown TN. Peroneal activation deficits in persons with
functional ankle instability. The American journal of sports medicine. 2009;37(5):982-8.
11. Hertel J. Sensorimotor deficits with ankle sprains and chronic ankle instability. Clin Sports
Med. 2008;27(3):353-70, vii.
12. Yeung MS, Chan KM, So CH, Yuan WY. An epidemiological survey on ankle sprain. Br J Sports
Med. 1994;28(2):112-6.
13. Hubbard TJ, Kramer LC, Denegar CR, Hertel J. Contributing factors to chronic ankle instability.
Foot Ankle Int. 2007;28(3):343-54.

33
14. Tropp H, Ekstrand J, Gillquist J. Stabilometry in functional instability of the ankle and its value
in predicting injury. Med Sci Sports Exerc. 1984;16(1):64-6.
15. Riemann BL. Is there a link between chronic ankle instability and postural instability? Journal
of Athletic Training. 2002;37(4):386-93.
16. Freeman MA, Dean MR, Hanham IW. The etiology and prevention of functional instability of
the foot. J Bone Joint Surg Br. 1965;47(4):678-85.
17. Lephart SM, Pincivero DM, Rozzi SL. Proprioception of the ankle and knee. Sports Med.
1998;25(3):149-55.
18. De Ridder R, Willems T, Vanrenterghem J, Roosen P. Influence of balance surface on ankle
stabilizing muscle activity in subjects with chronic ankle instability. J Rehabil Med. 2015;47(7):632-8.
19. Delahunt E, Monaghan K, Caufield B. Ankle function during hopping in subjects with
functional instability of the ankle joint. Scandinavian Journal of Medicine & Science in Sports.
2007;17(6):641-8.
20. Levin O, Vanwanseele B, Thijsen JR, Helsen WF, Staes FF, Duysens J. Proactive and reactive
neuromuscular control in subjects with chronic ankle instability: evidence from a pilot study on
landing. Gait Posture. 2015;41(1):106-11.
21. Gutierrez GM, Kaminski TW, Douex AT. Neuromuscular control and ankle instability. PM R.
2009;1(4):359-65.
22. Munn J, Sullivan SJ, Schneiders AG. Evidence of sensorimotor deficits in functional ankle
instability: a systematic review with meta-analysis. J Sci Med Sport. 2010;13(1):2-12.
23. Konradsen L, Ravn JB. Prolonged peroneal reaction time in ankle instability. Int J Sports Med.
1991;12(3):290-2.
24. Wright IC, Neptune RR, van den Bogert AJ, Nigg BM. The influence of foot positioning on
ankle sprains. J Biomech. 2000;33(5):513-9.
25. Winter DA. Human balance and posture control during standing and walking. Gait & Posture.
1995;3(4):193-214.
26. Arnold BL, De la Motte S, Linens S, Ross SE. Ankle Instability Is Associated with Balance
Impairments: A Meta-Analysis. Med Sci Sport Exer. 2009;41(5):1048-62.
27. Khin Myo H, Ishii T, Sakane M, Hayashi K. Effect of anesthesia of the sinus tarsi on peroneal
reaction time in patients with functional instability of the ankle. Foot Ankle Int. 1999;20(9):554-9.
28. Hupperets MD, Verhagen EA, van Mechelen W. The 2BFit study: is an unsupervised
proprioceptive balance board training programme, given in addition to usual care, effective in
preventing ankle sprain recurrences? Design of a randomized controlled trial. BMC Musculoskelet
Disord. 2008;9:71.

34
29. Verhagen E, van der Beek A, Twisk J, Bouter L, Bahr R, van Mechelen W. The effect of a
proprioceptive balance board training program for the prevention of ankle sprains: a prospective
controlled trial. The American journal of sports medicine. 2004;32(6):1385-93.
30. Zech A, Hubscher M, Vogt L, Banzer W, Hansel F, Pfeifer K. Balance training for
neuromuscular control and performance enhancement: a systematic review. J Athl Train.
2010;45(4):392-403.
31. McKeon PO, Hertel J. Systematic review of postural control and lateral ankle instability, part
II: is balance training clinically effective? J Athl Train. 2008;43(3):305-15.
32. Olsen OE, Myklebust G, Engebretsen L, Holme I, Bahr R. Exercises to prevent lower limb
injuries in youth sports: cluster randomised controlled trial. BMJ. 2005;330(7489):449.
33. Ashton-Miller JA, Wojtys EM, Huston LJ, Fry-Welch D. Can proprioception really be improved
by exercises? Knee Surg Sports Traumatol Arthrosc. 2001;9(3):128-36.
34. Cordova ML, Jutte LS, Hopkins JT. EMG comparison of selected ankle rehabilitation exercises.
Journal of Sport Rehabilitation. 1999;8(3):209-18.
35. Wahl MJ, Behm DG. Not all instability training devices enhance muscle activation in highly
resistance-trained individuals. J Strength Cond Res. 2008;22(4):1360-70.
36. De Ridder R, Willems T, De Mits S, Vanrenterghem J, Roosen P. Foot orientation affects
muscle activation levels of ankle stabilizers in a single-legged balance board protocol. Hum Mov Sci.
2014;33:419-31.
37. Hoch MC, McKeon PO. Peroneal reaction time after ankle sprain: a systematic review and
meta-analysis. Med Sci Sports Exerc. 2014;46(3):546-56.
38. Hopkins JT, Brown TN, Christensen L, Palmieri-Smith RM. Deficits in peroneal latency and
electromechanical delay in patients with functional ankle instability. J Orthop Res. 2009;27(12):1541-
6.
39. Lofvenberg R, Karrholm J, Sundelin G, Ahlgren O. Prolonged reaction time in patients with
chronic lateral instability of the ankle. The American journal of sports medicine. 1995;23(4):414-7.
40. Munn J, Beard DJ, Refshauge KM, Lee RY. Eccentric muscle strength in functional ankle
instability. Med Sci Sports Exerc. 2003;35(2):245-50.
41. Vaes P, Duquet W, Van Gheluwe B. Peroneal Reaction Times and Eversion Motor Response in
Healthy and Unstable Ankles. J Athl Train. 2002;37(4):475-80.
42. Gribble PA, Delahunt E, Bleakley C, Caulfield B, Docherty C, Fourchet F, et al. Selection criteria
for patients with chronic ankle instability in controlled research: a position statement of the
International Ankle Consortium. Br J Sports Med. 2014;48(13):1014-8.
43. Hiller CE, Refshauge KM, Bundy AC, Herbert RD, Kilbreath SL. The Cumberland ankle
instability tool: a report of validity and reliability testing. Arch Phys Med Rehabil. 2006;87(9):1235-41.

35
44. Moens S, Roosen PpDRRc. The effects of uniaxial and multiaxial balance training on the
muscle activation in patients with chronic ankle instability. 2016.; 2016.
45. Maffiuletti NA, Martin A, Babault N, Pensini M, Lucas B, Schieppati M. Electrical and
mechanical H(max)-to-M(max) ratio in power- and endurance-trained athletes. J Appl Physiol (1985).
2001;90(1):3-9.
46. Duchateau J, Semmler JG, Enoka RM. Training adaptations in the behavior of human motor
units. J Appl Physiol (1985). 2006;101(6):1766-75.
47. Aagaard P, Simonsen EB, Andersen JL, Magnusson P, Dyhre-Poulsen P. Neural adaptation to
resistance training: changes in evoked V-wave and H-reflex responses. J Appl Physiol (1985).
2002;92(6):2309-18.
48. Carroll TJ, Riek S, Carson RG. The sites of neural adaptation induced by resistance training in
humans. J Physiol. 2002;544(Pt 2):641-52.
49. Bourgois JaB, Jan. Basis voor verantwoord trainen. Vrijens JBUaJ, editor. Gent (Sint-
Amandsberg): Publicatiefonds voor Lichamelijke Opvoeding (PVLO); 2011. 35 - 63 p.
50. Hakkinen K. Neuromuscular and hormonal adaptations during strength and power training. A
review. J Sports Med Phys Fitness. 1989;29(1):9-26.
51. Moritani T. Neuromuscular adaptations during the acquisition of muscle strength, power and
motor tasks. J Biomech. 1993;26 Suppl 1:95-107.
52. Aagaard P. Training-induced changes in neural function. Exerc Sport Sci Rev. 2003;31(2):61-7.
53. Gruber M, Gollhofer A. Impact of sensorimotor training on the rate of force development and
neural activation. Eur J Appl Physiol. 2004;92(1-2):98-105.
54. Bruhn S, Kullmann N, Gollhofer A. The effects of a sensorimotor training and a strength
training on postural stabilisation, maximum isometric contraction and jump performance. Int J Sports
Med. 2004;25(1):56-60.
55. Bruhn S, Gollhofer A, Gruber M. Proprioception training for prevention and rehabilitation of
knee joint injuries. Eur J Sport Trauma R. 2001;23(2):82-9.
56. Heitkamp HC, Horstmann T, Mayer F, Weller J, Dickhuth HH. Gain in strength and muscular
balance after balance training. Int J Sports Med. 2001;22(4):285-90.
57. Son SJ, Kim H, Seeley MK, Hopkins JT. Movement Strategies among Groups of Chronic Ankle
Instability, Coper, and Control. Med Sci Sports Exerc. 2017.
58. Han K, Ricard MD. Effects of 4 weeks of elastic-resistance training on ankle-evertor strength
and latency. J Sport Rehabil. 2011;20(2):157-73.
59. Osborne MD, Chou LS, Laskowski ER, Smith J, Kaufman KR. The effect of ankle disk training on
muscle reaction time in subjects with a history of ankle sprain. The American journal of sports
medicine. 2001;29(5):627-32.

36
60. Sefton JM, Yarar C, Hicks-Little CA, Berry JW, Cordova ML. Six weeks of balance training
improves sensorimotor function in individuals with chronic ankle instability. J Orthop Sports Phys
Ther. 2011;41(2):81-9.
61. Rainoldi A, Melchiorri G, Caruso I. A method for positioning electrodes during surface EMG
recordings in lower limb muscles. J Neurosci Methods. 2004;134(1):37-43.
8. Abstract in lekentaal Achtergrond: Balanstraining wordt regelmatig gebruikt in de revalidatie van chronische
enkelinstabiliteit (CAI). Het nut hiervan is de voorbije jaren al uitvoerig onderzocht geweest en
dusdanig bewezen, al zijn er nog veel onzekerheden in verband met welk type balanstraining het
effectiefst is. In deze studie evalueren we spieractiviteit na balanstraining waarbij proefpersonen op
één been stonden op een kantelplank enerzijds (die slechts in twee richtingen kan omslaan; links en
rechts) en een oefentol anderzijds (die in alle 360° kan omslaan).
Doel: Het doel van deze studie is het vergelijken van spieractivatie gedurende twee
sprongoefeningen, voor en na het uitvoeren van een zes-weken durende balanstraining.
Methode: 28 patiënten, allen met CAI klachten, werden gerekruteerd volgens strenge voorwaarden.
Deelnemers werden willekeurig opgedeeld in twee even grote groepen, een groep kantelplank en een
groep oefentol. Voor en na het uitvoeren van de zes weken balanstraining werd spieractiviteit
gemeten tijdens het uitvoeren van een voorwaartse en zijwaartse sprongoefening.
Resultaten: Beide groepen maakten vooruitgang gezien ze relatief minder spierkracht gebruikten
tijdens de sprongoefeningen. In de aangeboden vragenlijsten beschreven ze minder last te hebben
van hun enkelinstabiliteit. De vooruitgang blijkt groter te zijn in de kantelplank groep, erop wijzend
dat de kantelplank een voordeel kan opleveren tegenover de oefentol.

37
9. Ethical approval

38

39
10. Appendix
10.1. Inclusion criteria questionnaire Naam: Geboortedatum:
Emailadres: Lengte:
Telefoonnummer: Gewicht:
Omcirkel wat bij u past en/of vul in
1. Heeft u ooit uw enkel verzwikt (lees verstuikt)?
Links: ja nee
Rechts: ja nee
Indien u nog nooit uw enkel heeft verzwikt, hoeft u de rest van de vragenlijst niet meer in te vullen!
2. Heeft u ooit uw enkel verzwikt waardoor u gedurende ten minste 3 weken klachten (zoals
pijn, zwelling en stijfheid) in uw enkel heeft gehad en waardoor u gedurende dezelfde
periode uw beroep, sport, hobby of andere bewegingsactiviteiten heeft moeten staken?
Links: ja nee
Rechts: ja nee
Indien u hier 2x nee hebt ingevuld, hoeft u de rest van de vragenlijst niet meer in te vullen!
3. Verzwikt u sindsdien herhaald deze enkel?
Links: ja, ongeveer …. per jaar nee
Rechts: ja, ongeveer …. per jaar nee
4. Gaat dit herhaald verzwikken dan gepaard met klachten (pijn, zwelling, stijfheid) achteraf?
Links: ja, altijd ja, soms nooit
Rechts: ja, altijd ja, soms nooit
5. Heeft u een onzeker, instabiel gevoel in uw enkel?
Links: ja nee
Rechts: ja nee
6. Heeft u een gevoel van zwakte rond de enkel?
Links: ja nee
Rechts: ja nee
7. Hoelang wordt u met het herhaald verzwikken van uw enkel geconfronteerd (in maanden
en/of jaren uitgedrukt)?
Links: ongeveer….. jaar en/of ….. maand
Rechts ongeveer….. jaar en/of ….. maand
8. Wanneer hebt u voor het laatst uw enkel verzwikt? ……. maand/jaar geleden

40
9. De kwaliteit in het uitoefenen van mijn sport of hobby is door het frequent verzwikken van
mijn enkel verminderd ten opzichte van de periode van voor mijn enkelprobleem.
waar niet waar
10. De kwaliteit in het uitoefenen van mijn beroep is door het frequent verzwikken van mijn
enkel verminderd ten opzichte van de periode van voor mijn enkelprobleem.
waar niet waar
11. Ik ben van mening dat ik voor mijn enkelprobleem behandeld zou moeten worden
ja nee
12. Oefent u activiteiten uit (m.b.t. sport, hobby) bestaande uit lopen, springen of wandelen?
ja nee
13. Beoefent u sport op professioneel of semiprofessioneel niveau?
ja nee
Zo ja, welke?
14. Beoefent u een sport op competitief niveau?
ja nee
Zo ja, welke?
15. Beoefent u een sport op recreatief niveau?
ja nee
Zo ja, welke?
16. Hoe frequent oefent u uw sport of hobby uit?
o 4 à 7 maal per week o 1 à 3 maal per week o 1 à 3 maal per maand o Ik beoefen geen sport

41
10.2. CAIT questionnaire Naam:
Gelieve bij ELKE vraag ÉÉN stelling aan te duiden die het BEST uw enkels beschrijft.
LINKS RECHTS
1. Ik heb pijn aan mijn enkel
Nooit □ □
Bij het sporten □ □
Bij het lopen op oneffen ondergrond □ □
Bij het lopen op effen ondergrond □ □
Bij het stappen op oneffen ondergrond □ □
Bij het stappen op effen ondergrond □ □
2. Mijn enkel voelt ONSTABIEL aan
Nooit □ □
Soms bij het sporten (niet altijd) □ □
Vaak bij het sporten (elke keer) □ □
Soms bij dagelijkse activiteiten □ □
Vaak bij dagelijkse activiteiten □ □
3. Als ik SCHERPE bochten maak, voelt mijn enkel ONSTABIEL aan
Nooit □ □
Soms bij het lopen □ □
Vaak bij het lopen □ □
Bij het stappen □ □
4. Als ik trappen afdaal, voelt mijn enkel ONSTABIEL aan
Nooit □ □
Als ik snel stap □ □
Af en toe □ □
Altijd □ □
5. Mijn enkel voelt onstabiel aan als ik op ÉÉN been sta
Nooit □ □
Op de bal van mijn voet (tenenstand) □ □
Met mijn voet plat op de grond □ □
6. Mijn enkel voelt ONSTABIEL aan als
Nooit □ □
Ik van de ene kant naar de andere kant huppel □ □
Ik ter plaatse huppel □ □
Als ik spring □ □
7. Mijn enkel voelt ONSTABIEL aan als
Nooit □ □
Ik op oneffen ondergrond loop □ □
Ik jog op oneffen ondergrond □ □
Ik op oneffen ondergrond stap □ □
Ik op een vlakke ondergrond stap □ □

42
LINKS RECHTS
8. NORMAALGEZIEN, als ik mijn enkel begin te verstuiken, kan ik dit ... stoppen
Meteen □ □
Vaak □ □
Soms □ □
Nooit □ □
Ik heb nog nooit mijn enkel verstuikt □ □
9. Na een TYPISCH voorval van het verstuiken van mijn enkel, wordt mijn enkel weer ‘normaal’
Bijna meteen □ □
In minder dan één dag □ □
1–2 dagen □ □
Meer dan 2 dagen □ □
Ik heb nog nooit mijn enkel verstuikt □ □
10.3. FADI questionnaire Naam:
Gelieve elke vraag te beantwoorden met één antwoord dat het best aansluit bij hoe u zich de afgelopen week hebt gevoeld. Als de activiteit in kwestie beperkt wordt door iets anders dan uw voet of enkel, duid dan N/T*aan.
Geen enkel probleem
Niet zo moeilijk
Moeilijk Enorm moeilijk
Onmogelijk
1. Staan
2. Op effen grond wandelen
3. Blootsvoets op effen ondergrond wandelen
4. Helling opwandelen
5. Helling afwandelen
6. Trap opgaan
7. Trap afgaan
8. Op oneffen grond wandelen
9. Stoeprand op- en afgaan
10. Hurken
11. Slapen
12. Op de tenen gaan staan
13. Beginnen te wandelen
14. 5 minuten of minder wandelen

43
15. Ongeveer 10 minuten wandelen
16. 15 minuten of langer wandelen
17. Huishoudelijke taken
18. Dagelijkse activiteiten
19. Persoonlijke verzorging
20. Licht tot gematigd werk (staan, stappen)
21. Zwaar werk (duwen/trekken, klimmen, dragen)
22. Recreatieve activiteiten
GEEN PIJN
MILDE PIJN
GEMATIGDE PIJN
HEVIGE PIJN
ONDRAAGLIJKE PIJN
23. Gemiddeld pijnniveau
24. Pijn in rust
25. Pijn bij normale activiteiten
26. Pijn bij het begin van de dag
Sportmodule (FADI B)
Geen enkel probleem
Niet zo moeilijk
Moeilijk Enorm moeilijk
Onmogelijk
1. Lopen
2. Springen
3. Neerkomen
4. Hurken en plots stoppen
5. Plotseling van richting veranderen, zijwaartse bewegingen
6. Weinig belastende activiteiten
7. Mogelijkheid om activiteit uit te voeren met uw normale techniek
8. Mogelijkheid om aan uw favoriete sport deel te nemen zolang u wil

44
10.4. GROC questionnaire
Thank you for the opportunity to assist in your rehabilitation. The following rating scale allows us to
review the overall outcome of your condition with physical therapy intervention. It allows us to
review your physical therapy outcome, which helps guide our treatment to better serve our patients
in the future. The Global Rating of Change (GROC) has been well documented and extensively used in
research as an outcome measure as well as to compare outcome measures. Please rate the overall
condition of your injured body part or region FROM THE TIME THAT YOU BEGAN TREATMENT UNTIL
NOW (Check only one):
A very great deal worse (-7) About the same (0) A very great deal better (7)
A great deal worse (-6) A great deal better (6)
Quite a bit worse (-5) Quite a bit better (5)
Moderately worse (-4) Moderately better (4)
Somewhat worse (-3) Somewhat better (3)
A little bit worse (-2) A little bit better (2)
A tiny bit worse (-1) A tiny bit better (1)
10.5. VAS questionnaire Naam: Code:
1. Forward Jump
Hebt u pijn tijdens het uitvoeren van de oefening?
Geen pijn _________________________________________________ ondraaglijke pijn
Vindt u deze oefening moeilijk?
Niet moeilijk _________________________________________________ enorm moeilijk
Ervaart u een instabiel gevoel tijdens deze oefening?
Neen _________________________________________________ enorm instabiel
Heb u een vermoeid gevoel tijdens deze oefening?
Neen _________________________________________________ enorm vermoeid

45
2. Side Jump
Hebt u pijn tijdens het uitvoeren van de oefening?
Geen pijn _________________________________________________ ondraaglijke pijn
Vindt u deze oefening moeilijk?
Niet moeilijk _________________________________________________ enorm moeilijk
Ervaart u een instabiel gevoel tijdens deze oefening?
Neen _________________________________________________ enorm instabiel
Heb u een vermoeid gevoel tijdens deze oefening?
Neen _________________________________________________ enorm vermoeid
10.6. Varus-click test and anterior drawer test Anterior Drawer Test: UNI-GROUP MULTI-GROUP TOTAL
Negative Count 10 13 23
% 71,4% 92,9% 82,1%
Positive Count 4 1 5
% 28,6% 7,1% 17,9%
Total Count 14 14 28
% 100,0% 100,0% 100,0%
Varus Click Test: UNI-GROUP MULTI-GROUP TOTAL
Negative Count 8 10 18
% 61,5% 71,4% 66,7%
Positive Count 5 4 9
% 38,5% 28,6% 33,3%
Total Count 13 14 27
% 100,0% 100,0% 100,0%

46
10.7. Relative muscle activation values: PL, PB and GaMed
Peroneus
Longus
Mean (SD)
Pre
Intervention
Mean (SD)
Post
Intervention
Mean
difference
(95% CI)
Sign.
(P<0.012)
UNI Before
Impact
FJ 141.745
(20.808)
85.183
(20.808)
56.561 0.034
SJ 131.965
(17.619)
80.435
(17.619)
51.530 0.014
After
Impact
FJ 247.083
(45.903)
132.302
(45.903)
114.781 0.050
SJ 222.072
(37.543)
119.352
(37.543)
102.719 0.046
MULTI Before
Impact
FJ 94.903
(21.541)
80.582
(20.808)
14.320 0.585
SJ 90.758
(18.186)
75.201
(17.619)
15.557 0.445
After
Impact
FJ 136.520
(47.519)
118.262
(45.903)
18.258 0.752
SJ 127.930
(38.928)
108.920
(37.543)
19.010 0.707
Peroneus Brevis
Mean (SD) Pre
Intervention
Mean (SD) Post
Intervention
Mean difference (95% CI)
Sign. (P<0.012)
UNI Before Impact
FJ 120.504 (19.647)
63.372 (20.379)
57.132 0.042
SJ 103.844 (13.986)
65.300 (14.504)
38.544 0.050
After Impact
FJ 153.220 (19.032)
94.978 (19.717)
58.242 0.025
SJ 152.144 (16.628)
85.744 (17.221)
66.400 0.004*
MULTI Before Impact
FJ 106.331 (19.647)
68.193 (19.647)
38.138 0.157
SJ 107.227 (13.986)
66.872 (13.986)
40.355 0.037
After Impact
FJ 122.668 (19.032)
83.983 (19.032)
38.685 0.117
SJ 128.110 (16.628)
83.539 (16.628)
44.571 0.040

47
Gastrocnemius Lateralis
Mean (SD) Pre
Intervention
Mean (SD) Post
Intervention
Mean difference (95% CI)
Sign. (P<0.012)
UNI Before Impact
FJ 265.379 (45.754)
159.765 (45.754)
105.614 0.109
SJ 212.507 (45.632)
142.053 (45.632)
70.454 0.241
After Impact
FJ 231.410 (41.490)
104.351 (41.490)
127.059 0.021
SJ 233.259 (47.408)
121.671 (47.408)
111.588
0.054
MULTI Before Impact
FJ 269.272 (45.754)
136.928 (47.481)
132.345 0.050
SJ 222.577 (45.632)
120.012 (47.304)
102.566 0.099
After Impact
FJ 200.800 (41.490)
97.157 (42.979)
103.643 0.061
SJ 219.955 (47.408)
110.728 (49.013)
109.228 0.064
10.8. Absolute muscle activation values: UNI-group
Paired Samples Statistics Mean N Std. Deviation Std. Error Mean
Pair 1 FJ_TA_BC 124,2200 14 49,73789 13,29301
FJ_TA_BC_POST 104,7014 14 83,22536 22,24291
Pair 2 FJ_PL_BC 201,3590 14 67,96057 18,16323
FJ_PL_BC_POST 175,5550 14 56,48916 15,09736
Pair 3 FJ_PB_BC 205,050 13 132,8450 36,8446
FJ_PB_BC_POST 208,7954 13 107,38250 29,78255
Pair 4 FJ_GaMED_BC 454,9190 14 257,08184 68,70801
FJ_GaMED_BC_POST 390,0993 14 169,45897 45,28981
Pair 5 FJ_GaLAT_BC 297,1181 14 197,32473 52,73725
FJ_GaLAT_BC_POST 302,3750 14 178,33208 47,66125
Pair 6 FJ_TA_AC 399,5179 14 247,85335 66,24159
FJ_TA_AC_POST 273,3093 14 90,30364 24,13466
Pair 7 FJ_PL_AC 298,0952 14 94,79932 25,33618
FJ_PL_AC_POST 286,0721 14 123,74441 33,07208
Pair 8 FJ_PB_AC 259,8682 13 97,55935 27,05810
FJ_PB_AC_POST 296,2308 13 106,74347 29,60531
Pair 9 FJ_GaMED_AC 275,0138 14 112,86887 30,16548
FJ_GaMED_AC_POST 213,4086 14 82,48199 22,04424
Pair 10 FJ_GaLAT_AC 218,4257 14 109,26680 29,20278
FJ_GaLAT_AC_POST 192,6779 14 71,82953 19,19725
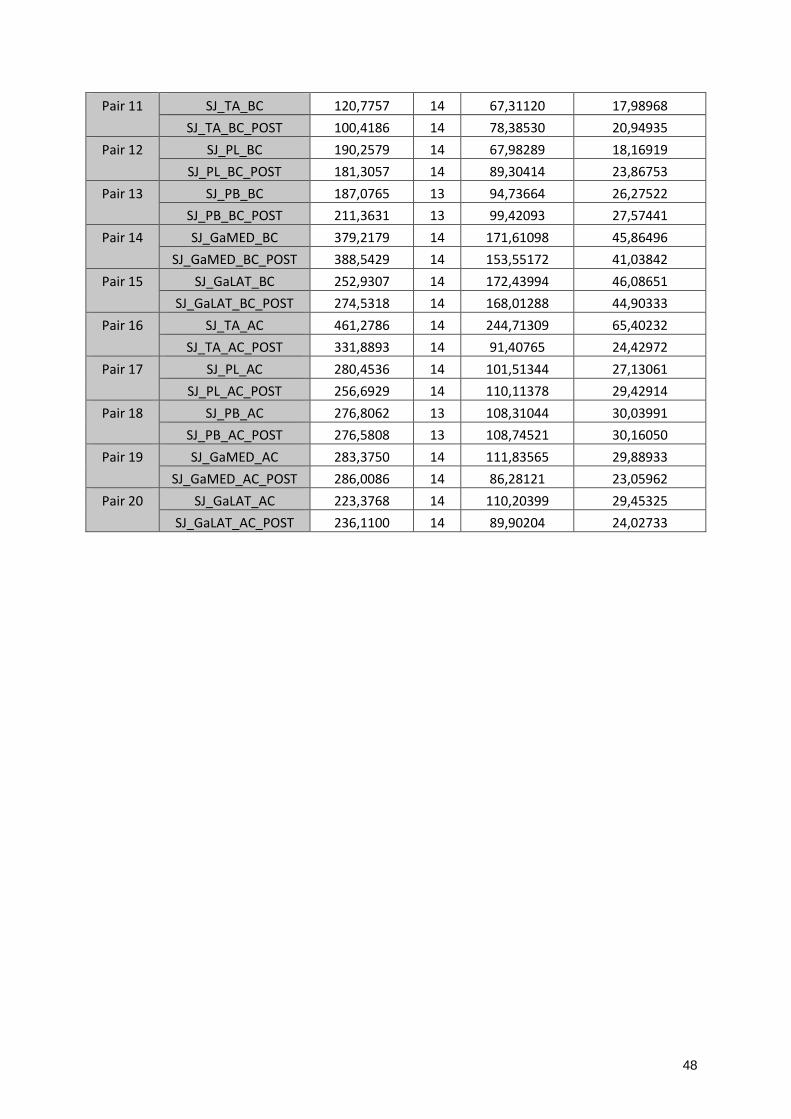
48
Pair 11 SJ_TA_BC 120,7757 14 67,31120 17,98968
SJ_TA_BC_POST 100,4186 14 78,38530 20,94935
Pair 12 SJ_PL_BC 190,2579 14 67,98289 18,16919
SJ_PL_BC_POST 181,3057 14 89,30414 23,86753
Pair 13 SJ_PB_BC 187,0765 13 94,73664 26,27522
SJ_PB_BC_POST 211,3631 13 99,42093 27,57441
Pair 14 SJ_GaMED_BC 379,2179 14 171,61098 45,86496
SJ_GaMED_BC_POST 388,5429 14 153,55172 41,03842
Pair 15 SJ_GaLAT_BC 252,9307 14 172,43994 46,08651
SJ_GaLAT_BC_POST 274,5318 14 168,01288 44,90333
Pair 16 SJ_TA_AC 461,2786 14 244,71309 65,40232
SJ_TA_AC_POST 331,8893 14 91,40765 24,42972
Pair 17 SJ_PL_AC 280,4536 14 101,51344 27,13061
SJ_PL_AC_POST 256,6929 14 110,11378 29,42914
Pair 18 SJ_PB_AC 276,8062 13 108,31044 30,03991
SJ_PB_AC_POST 276,5808 13 108,74521 30,16050
Pair 19 SJ_GaMED_AC 283,3750 14 111,83565 29,88933
SJ_GaMED_AC_POST 286,0086 14 86,28121 23,05962
Pair 20 SJ_GaLAT_AC 223,3768 14 110,20399 29,45325
SJ_GaLAT_AC_POST 236,1100 14 89,90204 24,02733

49
Paired Samples Test: Paired Differences
Mean Std.
Deviation
Std. Error
Mean
95% CI
Lower
Pair 1 FJ_TA_BC -
FJ_TA_BC_POST
19,51857 87,57657 23,40582 -31,04663
Pair 2 FJ_PL_BC -
FJ_PL_BC_POST
25,80405 52,24108 13,96202 -4,35906
Pair 3 FJ_PB_BC -
FJ_PB_BC_POST
-3,74513 126,84343 35,18004 -80,39585
Pair 4 FJ_GaMED_BC -
FJ_GaMED_BC_POST
64,81976 192,43862 51,43139 -46,29099
Pair 5 FJ_GaLAT_BC -
FJ_GaLAT_BC_POST
-5,25690 115,74773 30,93488 -72,08765
Pair 6 FJ_TA_AC -
FJ_TA_AC_POST
126,20857 194,52593 51,98924 13,89265
Pair 7 FJ_PL_AC -
FJ_PL_AC_POST
12,02310 97,13043 25,95920 -44,05835
Pair 8 FJ_PB_AC -
FJ_PB_AC_POST
-36,36256 94,61486 26,24144 -93,53775
Pair 9 FJ_GaMED_AC -
FJ_GaMED_AC_POST
61,60524 108,20993 28,92032 -,87331
Pair 10 FJ_GaLAT_AC -
FJ_GaLAT_AC_POST
25,74786 117,92138 31,51581 -42,33792
Pair 11 SJ_TA_BC -
SJ_TA_BC_POST
20,35714 52,13573 13,93386 -9,74513
Pair 12 SJ_PL_BC -
SJ_PL_BC_POST
8,95214 44,74578 11,95881 -16,88330
Pair 13 SJ_PB_BC -
SJ_PB_BC_POST
-24,28654 109,75116 30,43950 -90,60850
Pair 14 SJ_GaMED_BC -
SJ_GaMED_BC_POST
-9,32500 129,54469 34,62227 -84,12188
Pair 15 SJ_GaLAT_BC -
SJ_GaLAT_BC_POST
-21,60107 121,80682 32,55424 -91,93024
Pair 16 SJ_TA_AC -
SJ_TA_AC_POST
129,38929 207,83075 55,54510 9,39139
Pair 17 SJ_PL_AC -
SJ_PL_AC_POST
23,76071 74,96309 20,03473 -19,52169
Pair 18 SJ_PB_AC -
SJ_PB_AC_POST
,22538 65,83876 18,26039 -39,56058
Pair 19 SJ_GaMED_AC -
SJ_GaMED_AC_POST
-2,63357 86,27138 23,05700 -52,44518
Pair 20 SJ_GaLAT_AC -
SJ_GaLAT_AC_POST
-12,73321 120,13452 32,10730 -82,09682

50
95% CI t df Sig. (2-tailed)
Upper
Pair 1 FJ_TA_BC -
FJ_TA_BC_POST
70,08378 ,834 13 ,419
Pair 2 FJ_PL_BC -
FJ_PL_BC_POST
55,96715 1,848 13 ,087
Pair 3 FJ_PB_BC -
FJ_PB_BC_POST
72,90559 -,106 12 ,917
Pair 4 FJ_GaMED_BC -
FJ_GaMED_BC_POST
175,93051 1,260 13 ,230
Pair 5 FJ_GaLAT_BC -
FJ_GaLAT_BC_POST
61,57384 -,170 13 ,868
Pair 6 FJ_TA_AC -
FJ_TA_AC_POST
238,52450 2,428 13 ,030
Pair 7 FJ_PL_AC -
FJ_PL_AC_POST
68,10454 ,463 13 ,651
Pair 8 FJ_PB_AC -
FJ_PB_AC_POST
20,81262 -1,386 12 ,191
Pair 9 FJ_GaMED_AC -
FJ_GaMED_AC_POST
124,08379 2,130 13 ,053
Pair 10 FJ_GaLAT_AC -
FJ_GaLAT_AC_POST
93,83363 ,817 13 ,429
Pair 11 SJ_TA_BC -
SJ_TA_BC_POST
50,45942 1,461 13 ,168
Pair 12 SJ_PL_BC -
SJ_PL_BC_POST
34,78759 ,749 13 ,467
Pair 13 SJ_PB_BC -
SJ_PB_BC_POST
42,03543 -,798 12 ,440
Pair 14 SJ_GaMED_BC -
SJ_GaMED_BC_POST
65,47188 -,269 13 ,792
Pair 15 SJ_GaLAT_BC -
SJ_GaLAT_BC_POST
48,72809 -,664 13 ,519
Pair 16 SJ_TA_AC -
SJ_TA_AC_POST
249,38719 2,329 13 ,037
Pair 17 SJ_PL_AC -
SJ_PL_AC_POST
67,04312 1,186 13 ,257
Pair 18 SJ_PB_AC -
SJ_PB_AC_POST
40,01135 ,012 12 ,990
Pair 19 SJ_GaMED_AC -
SJ_GaMED_AC_POST
47,17804 -,114 13 ,911
Pair 20 SJ_GaLAT_AC -
SJ_GaLAT_AC_POST
56,63039 -,397 13 ,698

51
10.9. Absolute muscle activation: MULTI-group
Paired Samples Statistics Mean N Std. Deviation Std. Error Mean
Pair 1 FJ_TA_BC 92,7700 14 26,77517 7,15596
FJ_TA_BC_POST 93,5471 14 32,56687 8,70386
Pair 2 FJ_PL_BC 199,8231 13 74,48416 20,65819
FJ_PL_BC_POST 185,0785 13 60,22515 16,70345
Pair 3 FJ_PB_BC 220,681 14 85,9812 22,9794
FJ_PB_BC_POST 240,6814 14 95,40438 25,49789
Pair 4 FJ_GaMED_BC 342,3429 14 132,50859 35,41441
FJ_GaMED_BC_POST 390,1000 14 202,98157 54,24911
Pair 5 FJ_GaLAT_BC 235,8429 14 64,45789 17,22710
FJ_GaLAT_BC_POST 269,6171 14 109,80271 29,34601
Pair 6 FJ_TA_AC 287,9857 14 101,62548 27,16055
FJ_TA_AC_POST 294,3143 14 69,81724 18,65944
Pair 7 FJ_PL_AC 282,8231 13 68,15490 18,90277
FJ_PL_AC_POST 289,8154 13 61,26279 16,99124
Pair 8 FJ_PB_AC 253,2829 14 67,81490 18,12429
FJ_PB_AC_POST 292,0143 14 96,92708 25,90485
Pair 9 FJ_GaMED_AC 227,4714 14 80,43085 21,49605
FJ_GaMED_AC_POST 233,4857 14 103,30907 27,61051
Pair 10 FJ_GaLAT_AC 178,5714 14 55,43792 14,81641
FJ_GaLAT_AC_POST 184,4514 14 44,07473 11,77947
Pair 11 SJ_TA_BC 99,9100 14 36,78138 9,83024
SJ_TA_BC_POST 94,9100 14 38,20545 10,21084
Pair 12 SJ_PL_BC 193,1108 13 59,26324 16,43666
SJ_PL_BC_POST 180,0154 13 46,55094 12,91091
Pair 13 SJ_PB_BC 227,3714 14 94,10037 25,14938
SJ_PB_BC_POST 235,9714 14 88,21250 23,57578
Pair 14 SJ_GaMED_BC 288,8657 14 103,15057 27,56815
SJ_GaMED_BC_POST 338,6857 14 143,66749 38,39675
Pair 15 SJ_GaLAT_BC 207,1857 14 58,03211 15,50973
SJ_GaLAT_BC_POST 236,5571 14 70,47357 18,83485
Pair 16 SJ_TA_AC 342,5857 14 102,20488 27,31540
SJ_TA_AC_POST 362,0729 14 80,96432 21,63862
Pair 17 SJ_PL_AC 267,7846 13 79,06645 21,92909
SJ_PL_AC_POST 264,8000 13 35,29750 9,78976
Pair 18 SJ_PB_AC 263,6143 14 66,18949 17,68989
SJ_PB_AC_POST 291,8857 14 81,84934 21,87516
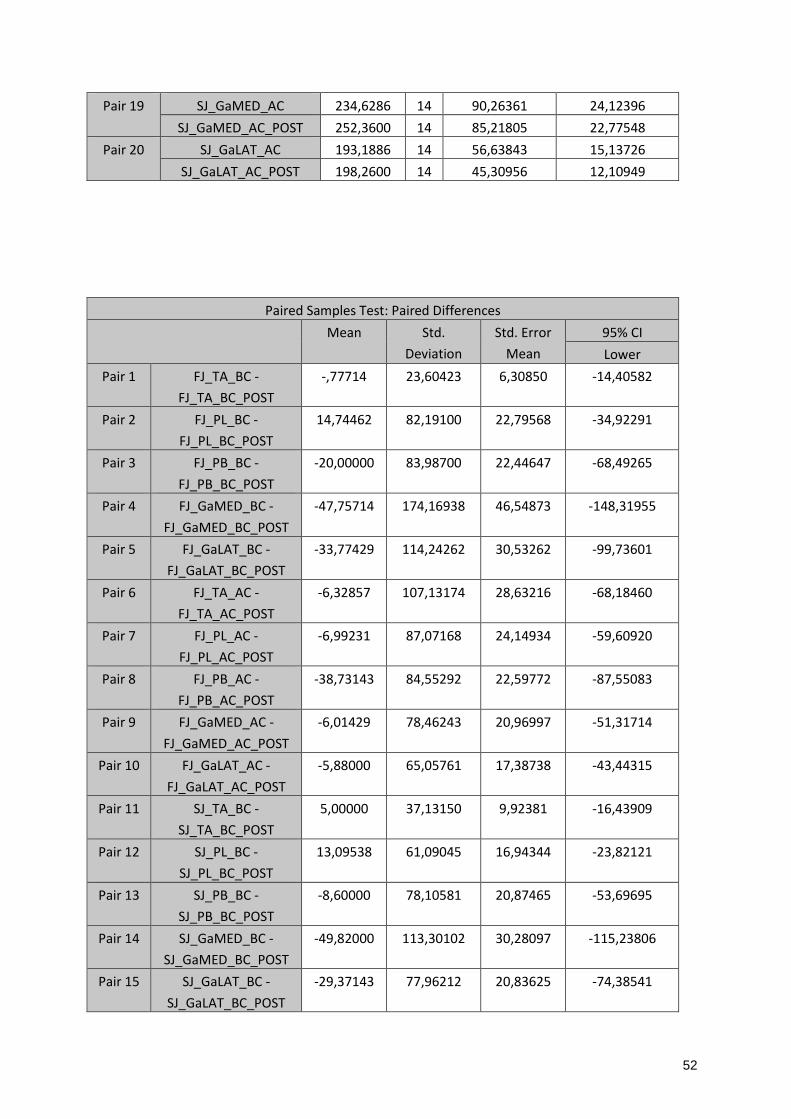
52
Pair 19 SJ_GaMED_AC 234,6286 14 90,26361 24,12396
SJ_GaMED_AC_POST 252,3600 14 85,21805 22,77548
Pair 20 SJ_GaLAT_AC 193,1886 14 56,63843 15,13726
SJ_GaLAT_AC_POST 198,2600 14 45,30956 12,10949
Paired Samples Test: Paired Differences
Mean Std.
Deviation
Std. Error
Mean
95% CI
Lower
Pair 1 FJ_TA_BC -
FJ_TA_BC_POST
-,77714 23,60423 6,30850 -14,40582
Pair 2 FJ_PL_BC -
FJ_PL_BC_POST
14,74462 82,19100 22,79568 -34,92291
Pair 3 FJ_PB_BC -
FJ_PB_BC_POST
-20,00000 83,98700 22,44647 -68,49265
Pair 4 FJ_GaMED_BC -
FJ_GaMED_BC_POST
-47,75714 174,16938 46,54873 -148,31955
Pair 5 FJ_GaLAT_BC -
FJ_GaLAT_BC_POST
-33,77429 114,24262 30,53262 -99,73601
Pair 6 FJ_TA_AC -
FJ_TA_AC_POST
-6,32857 107,13174 28,63216 -68,18460
Pair 7 FJ_PL_AC -
FJ_PL_AC_POST
-6,99231 87,07168 24,14934 -59,60920
Pair 8 FJ_PB_AC -
FJ_PB_AC_POST
-38,73143 84,55292 22,59772 -87,55083
Pair 9 FJ_GaMED_AC -
FJ_GaMED_AC_POST
-6,01429 78,46243 20,96997 -51,31714
Pair 10 FJ_GaLAT_AC -
FJ_GaLAT_AC_POST
-5,88000 65,05761 17,38738 -43,44315
Pair 11 SJ_TA_BC -
SJ_TA_BC_POST
5,00000 37,13150 9,92381 -16,43909
Pair 12 SJ_PL_BC -
SJ_PL_BC_POST
13,09538 61,09045 16,94344 -23,82121
Pair 13 SJ_PB_BC -
SJ_PB_BC_POST
-8,60000 78,10581 20,87465 -53,69695
Pair 14 SJ_GaMED_BC -
SJ_GaMED_BC_POST
-49,82000 113,30102 30,28097 -115,23806
Pair 15 SJ_GaLAT_BC -
SJ_GaLAT_BC_POST
-29,37143 77,96212 20,83625 -74,38541
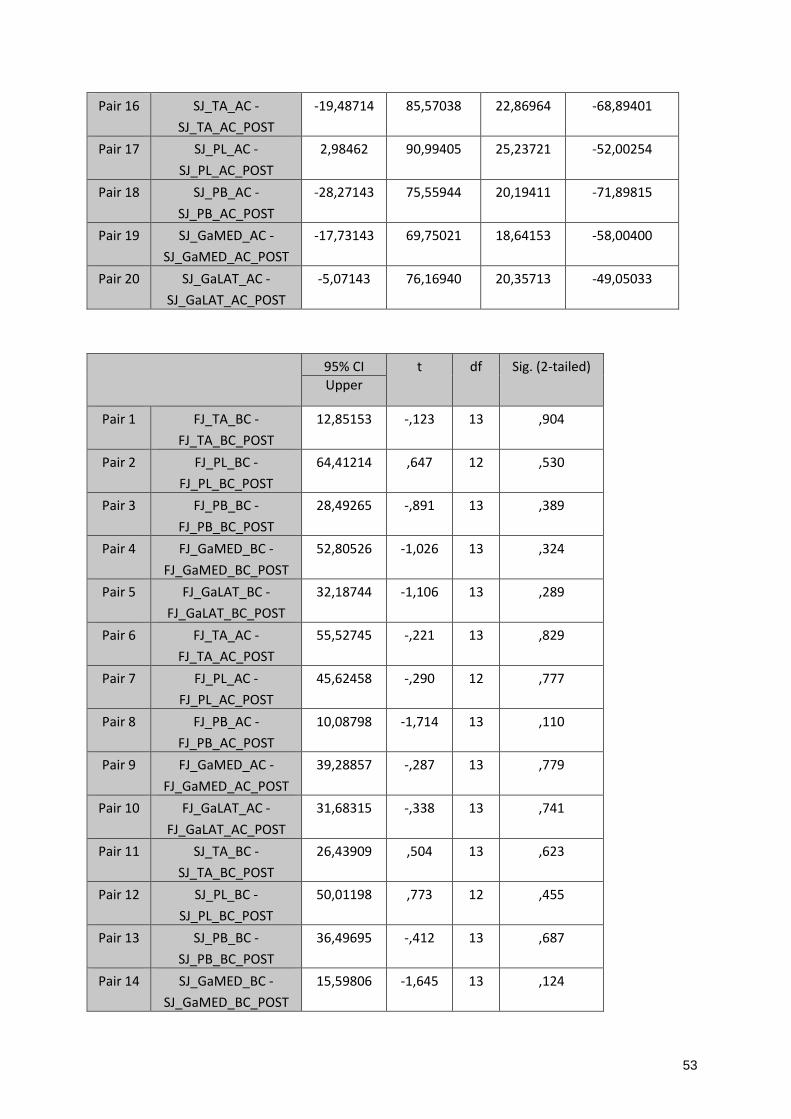
53
Pair 16 SJ_TA_AC -
SJ_TA_AC_POST
-19,48714 85,57038 22,86964 -68,89401
Pair 17 SJ_PL_AC -
SJ_PL_AC_POST
2,98462 90,99405 25,23721 -52,00254
Pair 18 SJ_PB_AC -
SJ_PB_AC_POST
-28,27143 75,55944 20,19411 -71,89815
Pair 19 SJ_GaMED_AC -
SJ_GaMED_AC_POST
-17,73143 69,75021 18,64153 -58,00400
Pair 20 SJ_GaLAT_AC -
SJ_GaLAT_AC_POST
-5,07143 76,16940 20,35713 -49,05033
95% CI t df Sig. (2-tailed)
Upper
Pair 1 FJ_TA_BC -
FJ_TA_BC_POST
12,85153 -,123 13 ,904
Pair 2 FJ_PL_BC -
FJ_PL_BC_POST
64,41214 ,647 12 ,530
Pair 3 FJ_PB_BC -
FJ_PB_BC_POST
28,49265 -,891 13 ,389
Pair 4 FJ_GaMED_BC -
FJ_GaMED_BC_POST
52,80526 -1,026 13 ,324
Pair 5 FJ_GaLAT_BC -
FJ_GaLAT_BC_POST
32,18744 -1,106 13 ,289
Pair 6 FJ_TA_AC -
FJ_TA_AC_POST
55,52745 -,221 13 ,829
Pair 7 FJ_PL_AC -
FJ_PL_AC_POST
45,62458 -,290 12 ,777
Pair 8 FJ_PB_AC -
FJ_PB_AC_POST
10,08798 -1,714 13 ,110
Pair 9 FJ_GaMED_AC -
FJ_GaMED_AC_POST
39,28857 -,287 13 ,779
Pair 10 FJ_GaLAT_AC -
FJ_GaLAT_AC_POST
31,68315 -,338 13 ,741
Pair 11 SJ_TA_BC -
SJ_TA_BC_POST
26,43909 ,504 13 ,623
Pair 12 SJ_PL_BC -
SJ_PL_BC_POST
50,01198 ,773 12 ,455
Pair 13 SJ_PB_BC -
SJ_PB_BC_POST
36,49695 -,412 13 ,687
Pair 14 SJ_GaMED_BC -
SJ_GaMED_BC_POST
15,59806 -1,645 13 ,124

54
Pair 15 SJ_GaLAT_BC -
SJ_GaLAT_BC_POST
15,64256 -1,410 13 ,182
Pair 16 SJ_TA_AC -
SJ_TA_AC_POST
29,91972 -,852 13 ,410
Pair 17 SJ_PL_AC -
SJ_PL_AC_POST
57,97177 ,118 12 ,908
Pair 18 SJ_PB_AC -
SJ_PB_AC_POST
15,35529 -1,400 13 ,185
Pair 19 SJ_GaMED_AC -
SJ_GaMED_AC_POST
22,54114 -,951 13 ,359
Pair 20 SJ_GaLAT_AC -
SJ_GaLAT_AC_POST
38,90747 -,249 13 ,807
10.10. VAS-scores
Pre-intervention Mean (SD)
Post-intervention Mean (SD)
Mean Difference (95% CI)
Sign. (P<0.05)
UNI Pain FJ 16.36 (23.180)
2.86 (3.009)
13.500 (0.519 , 26.481)
0.309
Pain SJ 14.50 (16.883)
1.79 (1.477)
12.714 (3.475, 21.954)
0.017*
Fatigue FJ 18.07 (19.357)
5.79 (8.304)
12.286 (0.662 , 23.910)
0.685
Fatigue SJ 27.14 (23.605)
9.21 (11.342)
17.929 (3.712, 32.145)
0.612
Difficulty FJ 33.21 (24.106)
18.71 (11.180)
14.500 (1.034 , 27.966)
0.296
Difficulty SJ 48.14 (26.628)
24.64 (18.236)
23.500 (4.465 , 42.535)
0.874
Instability FJ
46.64 (19.357)
16.43 (11.992)
30.214 (18.512 , 41.917)
0.076
Instability SJ
51.57 (26.323)
9.21 (11.342)
35.857 (22.101 , 49.614)
0.130

55
MULTI Pain FJ 13.50 (14.737)
5.29 (11.027)
8.214 (-1.440 , 17.868)
0.533
Pain SJ 16.69 (17.632)
11.85 (13.465)
4.846 (-8.095 , 17.788)
0.819
Fatigue FJ 21.00 (24.172)
8.14 (8.655)
12.857 (-2.511, 28.225)
0.689
Fatigue SJ 18.85 (23.745)
10.00 (10.824)
8.846 (-8.363 , 26.055)
0.404
Difficulty FJ 32.86 (23.035)
14.07 (13.731)
18.786 (6.979 , 30.593)
0.086
Difficulty SJ 35.46 (22.769)
20.00 (14.804)
15.462 (2.063 , 28.860)
0.220
Instability FJ
47.79 (17.529)
11.71 (10.410)
36.071 (24.253 , 47.890)
0.975
Instability SJ
42.69 (22.914)
19.38 (13.727)
23.308 (8.029 , 38.586)
0.701
10.11. Baseline differences post-intervention
UNI Mean (Std. Error)
MULTI Mean (Std. Error)
Mean difference (95% CI)
Sign. (P<0.012)
TA FJ before contact 26.034 (7.436)
24.037 (7.436)
1.998 (-19.355 , 23.350)
0.850
FJ post contact 60.820 (12.644)
77.108 (12.644)
-16.288 (-52.379 , 19.804)
0.368
SJ before contact 24.839 (10.808)
25.281 (10.808)
0.442 (-31.461 , 30.576)
0.977
SJ post contact 76.101 (21.462)
93.435 (21.462)
-17.333 (-78.506 , 43.839)
0.571
PL FJ before contact 85.183 (20.808)
80.582 (20.808)
4.601 (-54.570 , 63.772)
0.876
FJ post contact 132.302 (45.903)
118.262 (45.903)
14.040 (-116.489 , 144.569)
0.830
SJ before contact 80.435 (17.619)
75.201 (17.619)
5.235 (-44.960 , 55.430)
0.835
SJ post contact 119.352 (37.543)
108.920 (37.543)
10.433 (-96.212 , 117.077)
0.845

56
PB FJ before contact 63.372 (20.379)
68.193 (19.647)
-4.821 (-61.665 , 52.024)
0.865
FJ post contact 94.978 (19.717)
83.983 (19.032)
10.995 (-44.075 , 66.066)
0.690
SJ before contact 65.300 (14.504)
66.872 (13.986)
-1.572 (-42.038 , 38.895)
0.935
SJ post contact 85.744 (17.221)
83.539 (16.628)
2.204 (-45.915 , 50.324)
0.927
GaMed FJ before contact 106.610 (18.857)
154.777 (19.547)
-48.168 (-102.728 , 6.393)
0.082
FJ post contact 71.953 (17.634)
88.264 (18.107)
-16.311 (-67.361 , 34.738)
0.522
SJ before contact 111.972 (16.402)
132.275 (16.934)
-20.303 (-67.782 , 27.176)
0.394
SJ post contact 90.712 (16.412)
100.719 (16.831)
-10.007 (-57.541 , 37.527)
0.673
GaLat FJ before contact 159.765 (45.754)
136.928 (47.481)
22.837 (-109.540 , 155.215)
0.731
FJ post contact 104.351 (41.490)
97.157 (42.979)
7.194 (-112.857 , 127.244)
0.905
SJ before contact 142.053 (45.632)
120.012 (47.304)
22.042 (-109.987 , 154.070)
0.739
SJ post contact 121.671 (47.408)
110.728 (49.013)
10.944 (-126.242 , 148.129)
0.873
10.12. Linear Mixed Models: Fixed Effects
Intervention * Time (Sig.)
Intervention (Sig). Time (Sig.)
FJ_TA_BC 0.523 0.638 0.002
FJ_PL_BC 0.254 0.284 0.061
FJ_PB_BC 0.616 0.825 0.017
FJ_GaMed_BC 0.516 0.086 0.000
FJ_GaLat_BC 0.773 0.838 0.013
FJ_TA_AC 0.103 0.944 0.000
FJ_PL_AC 0.238 0.241 0.108
FJ_PB_AC 0.571 0.335 0.009
FJ_GaMed_AC 0.914 0.501 0.000
FJ_GaLat_AC 0.754 0.686 0.004
SJ_TA_BC 0.301 0.675 0.006
SJ_PL_BC 0.210 0.276 0.024
SJ_PB_BC 0.946 0.871 0.006
SJ_GaMed_BC 0.890 0.394 0.001
SJ_GaLat_BC 0.705 0.905 0.049
SJ_TA_AC 0.167 0.825 0.004
SJ_PL_AC 0.242 0.209 0.094
SJ_PB_AC 0.465 0.488 0.001
SJ_GaMed_AC 0.811 0.546 0.000
SJ_GaLat_AC 0.976 0.827 0.010

57