the effects of agricultural market liberalization …
TRANSCRIPT

THE EFFECTS OF AGRICULTURAL MARKET LIBERALIZATION AND
COMMERCIALIZATION ON HOUSEHOLD FOOD SECURITY IN RURAL CHINA
BY
LINLIN FAN
THESIS
Submitted in partial fulfillment of the requirements
for the degree of Master of Science in Agricultural and Consumer Economics
in the Graduate College of the
University of Illinois at Urbana-Champaign, 2012
Urbana, Illinois
Master’s Committee:
Assistant Professor Kathy Baylis, Co-Chair
Assistant Professor Lia Nogueira, Co-Chair
Professor Alex Winter-Nelson

ii
ABSTRACT
China underwent tremendous agricultural market reforms in the 1990s prior to its
accession to the WTO, drastically decreasing domestic market distortions. I ask whether these
reforms have led to agricultural commercialization and have improved the welfare of rural
Chinese households measured by household average share of calories from non-staples. I
identify the effect of local market liberalization by calculating the degree to which local
markets reflect world prices. I find that farmers have commercialized in response to market
liberalization and that particularly for food insecure households, commercialization has
increased household nutrition. The commercialization of field crops and horticulture
increases nutrition while the commercialization of livestock does not.

iii
To My Parents

iv
ACKNOWLEDGEMENTS
I would like to thank Professor Kathy Baylis and Professor Lia Nogueira for introducing
me to this research project and giving me tremendous help and advice. I learned a lot from
them through conversations, class, presentations and thesis revisions. Their help laid a solid
foundation for my future research and study in development economics. I also want to thank
my third committee member, Professor Alex Winter-Nelson for his insights and suggestions
which made this thesis more rigorous and compelling. Last but not least, I want to thank my
family and friends, especially my father, for their endless love and support.

v
TABLE OF CONTENTS
CHAPTER 1: INTRODUCTION .............................................................................................. 1
CHAPTER 2: LITERATURE REVIEW ................................................................................... 7
CHAPTER 3: BACKGROUND ON CHINESE TRADE
AND AGRICULTURAL POLICY ................................................................. 12
CHAPTER 4: DATA ............................................................................................................... 24
CHAPTER 5: MARKET LIBERALIZATION ....................................................................... 40
CHAPTER 6: METHODOLOGY ........................................................................................... 49
CHAPTER 7: RESULTS ......................................................................................................... 56
CHAPTER 8: DISCUSSION ................................................................................................... 76
CHAPTER 9: CONCLUSION ................................................................................................ 79
REFERENCES ........................................................................................................................ 84
APPENDIX: REGRESSION RESULTS FOR ROBUSTNESS TESTS ................................ 90
1
CHAPTER 1
INTRODUCTION
China underwent tremendous agricultural market, price and trade reforms in the 1990s
prior to its accession to the WTO, drastically decreasing domestic market distortions (Huang
et al. 2009). One substantial reform included the gradual elimination of China's procurement
and rationing system from 1978 to the early 2000s. Before 1995, this system required farmers
to sell a pre-determined amount (grain quota) to the government at a lower-than-market price
which the government sold to urban consumers at a lower-than-market price, effectively
taxing grains producers. After 1995, grain bureaus started to procure grains at a
higher-than-market price to subsidize grain farmers and China eventually eliminated the grain
quota system in 2004. Along with eliminating quotas, the government decentralized much of
the trading authority, reduced the scope of non-tariff barriers, relaxed real tariff rates at the
border, changed tariff rate quotas and relaxed licensing procedures for some crops (e.g.
moving oil and oil seed imports from state trading firms) (Huang and Chen 1999). From 1992
to 1998, the average agricultural import tariff fell from 42.2% in 1992 to 23.6% in 1998
(MOFTEC 2001). At the same time, massive infrastructure construction took place and
significantly reduced transactions cost in agricultural markets (Luo et al. 2007). In this
research, I ask whether this agricultural market liberalization has increased
commercialization and has improved the welfare of rural Chinese households. I use
household food security as my measure of well-being.
Chinese agricultural policy has shifted from taxing to subsidizing farmers in the 1990s.
Prior to 1995, the grain quota system required farmers to sell a certain amount of grains to
the government at a lower-than-market price. The government then sold the grains at a
lower-than-market price to urban residents through food coupons. In November 1996, China

2
implemented a grain procurement policy that whenever the free market prices fell below the
state-set procurement prices, the grain bureaus would procure quota grain at protective
prices which were higher than free market price. This change in the grain procurement
policy marks historical shift from taxing grain sector to subsidizing grain farmers (Lu 1999).
The role of price scissors, which increased the price of inputs and depressed the prices of
agricultural outputs to tax farmers, diminished with the liberalization of agricultural markets
(Lin and Liu 2007).
National data indicates that producers have commercialized as never before. Rosen,
Huang and Rozelle (2004) find that the number of villages that specialized in the production
a single commodity increased from less than 20% in 1995 to almost 40% in 2004. Based on
data from the China Health and Nutrition Survey (CHNS), I find that the rate of
commercialization, defined as the share of agricultural production value sold, increased
from 51.5% to 70.8% from 1991 to 2000. Specifically, commercialization of field crops
increased from 33.9% to 52.6% and horticulture commercialization rose from 68.4% to 72.8%
from 1991 to 2000. Livestock commercialization increased from 39.1% to 42% from 1991
to 1993, subsequently dropped to 30.6% in 1997 following plunging prices of livestock
products in 1996.
At the same time, Chinese household food security and nutrition increased significantly.
Following the approach by Jensen and Miller (2010) and using the CHNS data, I find that
the share of calories from non-staples (SCNS) for farmers increased from 18.1% to 23.4%
from 1991 to 2000. A SCNS greater than 20% is a reasonable measure of being out of
hunger (Jensen and Miller 2010). That said, nutritional sufficiency varied greatly by region.
While people in the wealthy, coastal regions were shifting their food consumption from
staples to animal products those in poor rural areas often still struggled with inadequate food
for subsistence (Zhu, Hare and Zhong 2010). Based on CHNS data, rural households

3
consumed 21% of calories from non-staples while those in urban areas consumed 27% in
1991.1 In 2000, rural households consumed 26% of calories from non-staples compared to
39% in urban areas. Rural poverty is still a pressing policy concern and improving
accessibility to adequate quantity and diversity of nutrients in rural areas is a major food
security objective for Chinese policy makers (Mangyo 2008; Huang and Rozelle 2009; de
Brauw and Mu 2011). To be able to improve rural household food security, one must first
understand how the dramatic changes to the agricultural market have affected the production
and consumption of Chinese farmers.
Some researchers have attributed the increase in nutrition in China to increased
market liberalization and agricultural commercialization. Wang et al. (2009) argued that the
market reforms have allowed relatively small and poor farmers to participate in emerging
horticulture markets and increase their income through commercialization. Research in
many developing countries has demonstrated that market liberalization and the resulting
agricultural commercialization can be a powerful means to improve agricultural efficiency,
increase rural household income and, therefore, enhance household access to food (Immink
and Alarcon 1991; Bouis and Haddad 1992; Von Braun and Webb 1994; Kennedy and
Haddad 1994). Market-oriented food production can also facilitate access to credit,
technological adoption, diversify production and mitigate production shortfalls (Von Braun
1988; Rubin and Webb 1988; World Bank 2002; DFID 2002; Govereh and Jayne 2003; Ali
and Farooq 2003).
Others have raised concerns that commercialization can harm rural households who
have little access to credit and are constrained from switching production (Paolisso et al.
2002). If market prices are highly volatile then commercialization may cause the household
to face highly variable income which can negatively affect nutrition (Gross and Underwood
1 Rural and urban households are defined as households who identify themselves to be rural and urban residents in the
CHNS.

4
1971; Von Braun and Kennedy 1986; Von Braun, Hotchkiss and Immink, 1989; Bouis et al.
1984; Haaga et al. 1986; Fleuret and Fleuret 1991). Thus, the relation between market
liberalization, agricultural commercialization and household food security is not obvious
ex-ante, while the answer is crucial to be able to predict the effect of agricultural and trade
policy, and the potential need for domestic food assistance.
This research uses the spatial variation in market liberalization to identify its effect on
agricultural production, commercialization and nutrition. I generate a market liberalization
index that measures the divergence of local prices from world prices to approximate how
tightly tied the local market is to the world market and then use these measures to estimate
the localized effect of market liberalization. I then regress this measure against indicators of
community-level transaction costs and find that access to markets and access to
communication facilities increase market liberalization significantly.
I use a three-stage least squares approach to jointly estimate the production decision,
the commercialization decision and nutrition outcomes. While agricultural
commercialization is a function of agricultural production and other variables, I instrument
agricultural production in the commercialization equation using whether the household has a
tractor, irrigation or water pump. Household food security is modeled as a function of
agricultural commercialization and other variables. I instrument agricultural
commercialization in the nutrition equation using grain quota prior to 1995 (the amount of
grains Chinese farmers were required to sell to governments at a lower-than-market price)
and grain quota post 1995 when the government quota procurement price was usually higher
than the free-market price. Another instrument is the number of private enterprises in the
community which is largely affected by central government's policies in liberalizing
domestic market and factor endowments (Lin and Yao 2001).2
2 I control for factor endowments by including county dummies in the regression.

5
One may be concerned that market liberalization and commercialization might affect
poor and better-off farmers differently. To study that, I split the data into high and low
nourished households. I define households who have more than 20% of calories from
non-staples as the nourished group following Jensen and Miller (2010). The counterpart are
undernourished households. I also consider different agricultural production types including
field crops, horticulture and livestock.
I find that market liberalization increases agricultural production and
commercialization. Agricultural commercialization significantly increases nutrition overall,
and especially increases nutrition of the undernourished. I also find that commercialization
of field crops and horticulture increases nutrition.
Because I am using secondary data to identify complex relations, I run several
robustness tests on my definitions of farmer, market liberalization and nutrition and test
different instruments. Overall, I observe largely consistent results. I first test different
definitions of farmers and liberalization index. Then I use food diversity, household average
caloric intake, and household average protein intake to measure nutrition. Last, because
off-farm wage may affect nutrition through change in dietary tastes or dietary location and
grain quota may affect nutrition through other implicit taxes on farmers (Lin and Liu 2007), I
test different specifications of the model by including wage or grain quota in the nutrition
equation.
This research has a number of contributions. To my knowledge, this is the first
evaluation of the effect of agricultural market liberalization and commercialization on
household food security in rural China in the 1990s. Second, I use spatial variation in the
degree of price transmission to identify the effect of market liberalization, which I believe is
a relatively novel approach in this literature. Third, I am able to separately observe farmers’
decisions to commercialize different types of agricultural production, which allows me to

6
explicitly explore how market liberalization in China affects commercialization. Fourth, I
use a relatively novel measure of nutrition, as proposed by Jensen and Miller (2010), to
estimate the effect of agricultural liberalization on household outcomes. I test these
measures against more common measures of nutrition, largely finding that the results are
consistent. I do find, however, that a common measure used, the number of calories
consumed, may mask important information.
The rest of the thesis proceeds as follows. The next two sections review the literature
and Chinese agricultural trade and policy background followed by data and summary
statistics. Next I present the theory, data, empirical methods and regression results of local
market liberalization. I then state the methodology in researching the relation between
agricultural market liberalization, commercialization and household food security. Last, I
discuss the results and conclude.

7
CHAPTER 2
LITERATURE REVIEW
Household food security can be affected by market liberalization through several
mechanisms. In the 1990s, market liberalization in urban China included the abolition of food
coupons, reduction in the money that is paid or subsidized by the state on education, health,
housing and pensions and increased job uncertainty of state-owned enterprises (SOE)
workers. Meng, Gong and Wang (2009) find that despite the increase in income, on average,
urban households’ caloric availability was reduced in 1993 due to urban market liberalization
in the same time. Although caloric availability declined on average in 1993, since 1993 low
income groups have suffered the most as a result of urban market liberalization. The decline
in calories for the wealthy only lasted until the end of 1993, whereas for the low-income
groups the downward trend continued until the end of the 1990s.
As for agricultural market liberalization, commercialization and nutrition in rural areas,
the relation is not obvious ex-ante. Market liberalization and the resulting agricultural
commercialization are seen as a good way to increase income and, thus, access to food
(Immink and Alarcon 1991; Bouis and Haddad 1992; Von Braun and Webb 1994; Kennedy
and Haddad 1994). Although some authors have raised the concern that commercialization
may transfer the control of income to men in the household, which is associated with lower
child nutrition (Kennedy and Cogill 1987; Kennedy 1989; Kurth 1989), the increase in
income can overcome the effect of loss of control over income by women in the household
(Von Braun 1988; Von Braun, Hotchkiss and Immink 1989; Von Braun and Immink 1990).
Market-oriented food production can also facilitate access to credit and technological
adoption, diversify production, and mitigate production shortfalls (Von Braun 1988; Rubin
and Webb 1988; Govereh and Jayne 2003; Ali and Farooq 2003). Farmers' access to key
inputs and a range of services offered by the commercialization scheme can positively

8
influence food productivity; and this improved production supplements household
consumption and leads to better nutritional status (Von Braun 1988; Rubin and Webb 1988;
Govereh and Jayne 2003). Most cash crops tend to be labor-intensive, expanding the demand
for hired labor. This employment effect for households that hire out labor may represent a
significant increase in household income (Masanjala 2006).
Commercialization could also decrease household food security. Some researchers have
raised concerns that trade and commercialization can harm rural households who have little
access to credit or technology, and are constrained from switching production (Paolisso et al.
2002). Farmers who are constrained from switching production tend to be most susceptible to
the fall in price of maize and wheat from increasing imports after China's accession into the
WTO (Huang, Rozelle and Chang 2004).
If market prices are highly volatile and commercialization leads farmers to produce cash
crops, then the household may face highly variable income without the inherent insurance
associated with producing subsistence crops. Several studies have shown this volatility can
negatively affect the nutritional status of children (Gross and Underwood 1971; Von Braun
and Kennedy 1986; Von Braun, Hotchkiss and Immink 1989; Bouis et al. 1984; Haaga et al.
1986).
Some studies suggest that changes in the household allocation of labor, control of
income and expenditure distribution between food and non-food items as a result of
commercialization could offset the income effect on nutrition and health (Kennedy and Cogill
1987; Kennedy 1989; Kurth 1989). Bouis and Haddad (1990) conclude that despite increased
income as a result of commercialization, women spend less time with children and therefore
no change in overall nutritional status is found in the Philippines. The income benefits of
trade and commercialization depend on access to productive assets, government policy, the
household response and transaction costs (Huang, Rozelle and Chang 2004). Land

9
concentration and the displacement of marginal farmers as a result of commercialization can
worsen nutritional status (Dewey 1989) although smallholders who are able to retain access
to land do benefit from increased income (Bouis and Haddad 1990). Kennedy (1989) finds
that the income gains experienced by sugar growing households are in large part dependent
on the government of Kenya’s support of sugar prices above the world market price. Many
farmers have not been able to take advantage of the potentially lucrative income opportunities
provided by commercialization due to the high up-front costs imposed by rigorous food
safety and quality standards required by food processors and retailers, and imperfect or
missing markets (Von Braun 2007).
Unlike evidence from other countries, instead of being hurt by the rise of supermarkets
and the horticulture boom, poor and small farmers appear to have benefited in China (Wang
et al. 2009). In contrast, the richer farmers were found to play a smaller role in horticulture
cultivation. Small traders directly procure from small farmers and substantially decrease their
transaction cost to participate in horticulture commercialization. Supermarkets procurement
agents then procure horticulture products from small traders instead of farmers directly.
Wang et al. (2009) use surveys from Greater Beijing and Shandong Province in 2000 and
2004. The surveys record detailed household, community and wholesale markets information
Based on the data, they use descriptive analysis, ordinary least squares and tobit regressions
to analyze the determinants of horticulture area. They argue that because Chinese farmers'
land holdings are equally small and there are few rural cooperatives, small traders can deal
with smallholders better than supermarkets and other procurement channels. Poor farmers in
China usually live further away from urban centers, have fewer off-farm work opportunities
and, thus, have access to more farm labor and land supply. As a result, poor farmers have
greater labor and land endowments than the richer farmers and, consequently, a comparative
advantage in horticulture.

10
In accordance with Wang et al. (2009), Zhu, Hare and Zhong (2010) argue that instead
of emphasizing grain production and grain self-sufficiency, the income approach which is
achieved by higher commercialization of comparatively advantageous products such as
horticulture and more off-farm work increases household food security. To test this
hypothesis, they run OLS regressions for household grain and food consumption at the
household and provincial level separately for 1996 to 2001 and for 2002 to 2008. The results
for 2002 to 2008 suggest that the higher ratio of grain sown area, as advocated by grain
self-sufficiency policy, significantly decreases grain and food consumption for farmers in
less-favored regions. Income increases food consumption for all rural farmers including those
in disadvantageous areas. The results for 1996-2001 are ambiguous. They conclude that in
the 1996-2001 period the market was not liberalized enough and consequently variables such
as price and income did not predict grain or food consumption as expected.
Along with other nutrition measures, Jensen and Miller (2010) utilize the CHNS data in
1991, 1993, 1997 and 2000 to test the validity of using staple calorie share (SCS) for
assessing whether households have attained a subsistence level of nutrition. They show that
the empirical SCS threshold where households pass subsistence and have lower marginal
utility of additional calories, closely matches what would be estimated from a minimum cost
diet calculation based on economic theory. Therefore, they argue that SCS is advantageous
over measures of nutrition in allowing consistent preferences of food, avoiding
individual-varying and unobservable caloric absorption and caloric threshold. They conclude
that instead of using a standard caloric threshold, policy makers should care more about
helping the consumer reach a point where he surpasses subsistence and the marginal utility of
calorie is low, which is indicated by SCS.
In conclusion, the relation among market liberalization, commercialization and farm
nutrition is not obvious in the literature. Because rural poverty and food security are key

11
public policy issues in China, it is important to understand how the substantial market
reforms of the 1990s affected farmers' welfare and the potential need for domestic food
assistance.

12
CHAPTER 3
BACKGROUND ON CHINESE TRADE AND AGRICULTURAL POLICY
This chapter reviews agricultural trade, price and marketing, taxes and subsidies and
rural industrialization reforms in China from 1978 to 2000. In the last two decades, China has
undergone substantial agricultural market reform, including trade liberalization, domestic
price reform, changes to agricultural tax and subsidy systems and promotion of rural
enterprises. Trade liberalization has helped China respond to signals from world markets and
made sharp adjustments in its production structure to better reflect its comparative advantage
(Huang and Rozelle 2009). The pricing and marketing reform has gradually liberalized
domestic markets. Reform of China’s system of agricultural tax and subsidies helped China
transform from an economy that taxed agriculture into one that subsidized agriculture. Rural
enterprises became one of the major forces behind China's overall sustained growth.
Besides the reforms mentioned above, there are also important agricultural policies and
reforms that affect market liberalization at the same time which I will not discuss in detail.
Land policies have encouraged and freed farmers to allocate resources more efficiently while
lack of land tenure impedes improving agricultural efficiency in rural China. Expansion of
investment in infrastructure and public services, especially agricultural technology has served
to benefit farmers extensively. Finally, rural migration has been a major reflection of
modernization and urbanization in China, improving rural households' income remarkably.
However, poor human capital combined with the Hukou system and the lack of land tenure
hinders some of the poorest households from migration and increasing their income.3
3.1 AGRICULTURAL TRADE POLICY
During the 1980s and early 1990s, there has been significant liberalization in trade
3 The Hukou system is a household registration record system. It officially identifies a person as a resident of urban or rural
area. Usually, urban residents have access to better education, medical services, pension system and other welfares.

13
policy. China initially implemented multiple policies to control imports including tariffs,
grain import and export licenses, tariff rate quotas on grains and oilseeds, state trading and
other traditional non-tariff barriers. Since 1992, China has gradually decreased its import
tariffs on most agricultural products. The average import tariff decreased from 42.2% in 1992
to around 21% in 2001.
Most of the fall in protection came from a reduction in the number of commodities and
the quantity of any single commodity that are controlled by single desk state traders (Huang
and Chen 1999). Central government in China has been using state trading extensively,
majorly through China National Cereals, Oils and Foodstuffs Import and Export Company
(COFCO), in achieving the balance between supply and demand of many agricultural
commodities in domestic markets. Before China's accession to the WTO, COFCO had
exclusive rights to import and export wheat, corn and rice, to a lesser extent, soybean oil,
palm oil, canola oil and sugar. As part of China's WTO Accession Protocol, these exclusive
rights have been reduced with the allocation of some portion of the import tariff rate quotas
(TRQs), introduced in 1996, on rice, wheat, corn, vegetable oils and cotton to non-state firms
(McCorriston and MacLaren 2010). The agreed shares of TRQs to be allocated solely to
COFCO after 2001 were: 90% for wheat, 60-71% for corn, 50% for rice, 70% for sugar,
10-42% for vegetable oils, 33% for cotton and 0% for wool (WTO 2001).
The Chinese government retained some policy safeguards related to agricultural trade.
For example, COFCO still has exclusive rights over rice, corn and soybeans exports with the
use of COFCO in the management of exports for certain strategic commodities. On the
import side, non-state firms needs to meet scale, profitability and bank credit ratings
requirements among others to be eligible to apply for import licenses for grains, palm oil and
cotton. Import and export state trading still persists in many other sectors such as tea, coal,
crude and processed oil, tobacco, rubber and chemical fertilizers. McCorrriston and

14
MacLaren (2010) argue that a State Trading Enterprise (STE) such as COFCO may maximize
a (weighted) social welfare function where the weights reflect the overall bias of government
policy towards domestic producers ⁄consumers. They estimate the effect that COFCO has in
exporting corn to the world market and in importing wheat. They find a ‘mild’ bias towards
wheat consumers and towards producers . In general, they find that the distortion lead by
COFCO will reflect the overall bias in Chinese agricultural policy towards producers and
consumers and the terms-of-trade effects at that time.
After China's accession into the WTO, there were three major transformations in
agricultural trade policy. First, average import tariffs of products declined from 21% in 2001
to 15.8% in 2004 (table 1). In particular, the tariff on soybeans declined from 114% in 2001
to 3% in 2004. Second, quotas were increased for some products with TRQs (table 2). The
TRQs for wheat, rice, corn, cotton and sugar increased gradually from 2001 to 2004. The
TRQs for soybean oil and canola oil were eliminated in 2006. Third, COFCO continues to
relinquish a bigger share of the TRQs to private firms gradually since 2001 (table 3). For
example, COFCO decreased their share of TRQ of corn from 68% to 60% from 2002 to
2004.
Table 1. Tariff Rates for Selected Agricultural Products
Agricultural produce 2001 (%) 2004 (%)
Beef 45 12
Pork 20 12
Poultry 20 12
Soybeans 114 3
Oranges 40 12
Grapes 40 13
Apples 30 10
Almond 30 10

15
Table 1 (cont.)
Agricultural produce 2001 (%) 2004 (%)
Wine 65
Cheese 50 12
Aquatic products 25.3 10.6 (2005)
Wood 10.6 3.8
Source: Qiu, Wang and Yuan 2003
Table 2. TRQs for Selected Agricultural Products, Quota in 1000 metric tons
Source: NDRC, various years
Table 3. Share of TRQ for Selected Agricultural Products Allocated to COFCO, %
Year Wheat Corn Rice Cotton Sugar Soybean oil
2002 90 68 50 33 70 34
2003 90 64 50 33 70 26
2004 90 60 50 33 70 18
2005 90 60 50 33 70 10
2006 90 60 50 33 70 0
Source: NDRC, various years
3.2 PRICE AND MARKETING REFORM
In the era of the planned economy (1949-1978), the government implemented a strict
system of grain quotas and rationing, creating an early regulatory mandate for
Year Wheat Corn Rice Cotton Sugar Soybean oil
2002 8468 5850 3990 819 1764 2518
2003 9052 6525 4655 856 1852 2818
2004 9636 7200 5329 894 1945 3118
2005 9636 7200 5329 894 1945 3587
2006 9636 7200 5329 894 1945 0

16
commercialization. Because all farmers were required to work in government-controlled
village-level agricultural collective teams at that time, local governments knew exactly how
much each team produced. Farmland was also owned by agricultural collective teams instead
of individual farmers.4 Further, only government-owned Supply and Marketing Cooperatives
(SMC) and Grains Bureau could procure and market agricultural products. The production,
sale and allocation of almost all agricultural products were planned and controlled by the
government.
Before 1978, mandatory procurement quotas were imposed on farmers and farmers were
entitled only to residual grain after the state procurement and agricultural tax in kind. The
quantity of grain quota is determined by the central government through a set of rules that
take into account factors such as natural conditions, local history and even political concerns
such as local food sufficiency (Lin and Liu 2007). Grains were then rationed, giving
non-farming rural and urban residents coupons for a fixed quantity of grains each month for
consumption (Zeng et al. 2004).
In 1978 the Chinese government began to reform this policy. Small traders and local
farmers' markets were allowed to exist beside state-owned grain bureaus to procure and
market grains. But, until 1996, farmers were still required to sell a pre-contracted amount of
grains (grain quota) to the government at a price lower than the free market price. Under the
grain quota system, only farmers who fulfilled their quota mandate could sell surplus grain at
market-determined prices through two channels. The first channel is voluntary above-quota
deliveries to the grain bureaus at negotiated prices which were determined by regional,
seasonal and quality factors (Ke 1995; Sicular 1993). The second channel is that farmers can
sell grains directly in free markets including, the periodic rural market fairs and grain
wholesale markets that emerged in the same time.
4 Some farmers were allowed to produce only vegetables and feedstock on a small garden plot (usually less than 0.1 acre)
allocated to them by the village.

17
The government ensured quota delivery by not allowing grain bureau negotiated
transactions and closing free markets until the grain quota was filled (Ke 1995; Wu and
McErlean 2003). While share of market transactions in grain procurement increased from 9%
in 1978 to over 65% in 1998, government negotiated transactions declined from two-thirds in
1992 and about one half between 1993 and 1998 (Huang 2001). As an important player in
market transactions of grain procurement, grain bureaus could monitor the quota fulfillment
of farmers who sold surplus grains to free markets to a large extent. Government negotiated
prices and free market prices generally move closely together (Shea 2010). Shea (2010)
argued that the optimal grain quota procurement price is always at the minimum level
necessary to induce quota fulfillment.
Beginning at the end of 1996, when consecutive years of plentiful harvests in the
mid-1990s resulted in substantial declines in the market price of grain, the quota procurement
price was higher than market price from time to time. In November 1996, China implemented
the price protection policy. Whenever the free market prices fell below the state-set
procurement prices, the grain bureaus will procure within-quota grain at protective prices
while above-quota negotiated prices move together with the free market price (Gale, Lohmar
and Tuan 2004; Shea 2010). Huang et al. (2007) find that the gap between urban and rural
retail prices eventually disappeared in 1995, and that the gap between the rural retail price
and the farm price declined. This reduction may imply that the distortion associated with the
grain quota may decrease over time. As indicated by Lu (1999), the implementation of
protection prices in 1996 signals a historical shift from taxing the grain sector to
subsidizing it.
Government sold urban residents the mandatory grain quota at a lower-than-market
price through food coupons, also called rationing system, before the end of 1993. Before
1993, the average urban retail prices for rice and corn were lower than government

18
procurement prices which were lower than rural retail prices. After 1993, the rationing
system was eliminated which resulted in urban retail prices being slightly higher than rural
retail prices for grains (Huang et al. 2007)
Historically, domestic market distortions played less of a role on other non-grain
agricultural products (Huang et al. 2009). Although some places had procurement delivery
quotas for oilseeds such as soybeans, these quotas were not as widespread as for grain. In
addition, the implicit tax on soybeans imbedded in the soybean quotas was lower than for the
staple grain crops. Compared to free procurement of oilseeds by private traders in the
mid-1990s, the free market procurement of cotton by private traders was not allowed through
the mid-1990s. When cotton market reforms came in the mid-1990s, Chinese government did
not choose a two-tier pricing system, but instead allowed both private traders and
commercialized government cotton procurement stations (Huang et al. 2009). The same is
true for livestock, horticulture, milk and sugar. However, livestock, horticulture, milk and
sugar markets were liberalized in 1992, preceding the changes to grains, oilseeds and cotton.
Huang et al. (2009) measure the degree of market distortion over time in China using the
Nominal Rate of Assistance (NRA), which is the percentage difference between the border
price and the world price. To measure distortions within China, Huang et al. (2009) also use
the Nominal Rate of Assistance at the farm gate (NRAf) for different commodities.
Specifically Huang et al. (2009) measure the domestic market distortion using the difference
between NRA and NRAf. A negative NRA or NRAf indicates that the government is taxing
the farmers of that commodity, while a positive value indicates subsidizing the farmers.
According to their estimates, there is little difference between NRA and NRAf for soybeans,
cotton, horticulture, livestock, milk and sugar in the 1990s. This result indicates that domestic
market distortion is marginal at best for these products due to non-existence of procurement
and rationing system for them. Grains are heavily taxed before 1995, while domestic market

19
distortion is much less after that as a result of the elimination of grain rationing and
equalization of quota and free market prices. I discuss NRA and NRAf in more detail in
chapter 5.
3.3 AGRICULTURAL TAX AND SUBSIDIES
Before 1978, the agricultural tax was 15.5% on a state-defined tax base nationwide.
With the increase in grain production, the actual tax rate declined from 10% of grain
production in 1950s to 5% in the 1970s. However, farmers were much more heavily taxed by
"price scissors" through which governments controlled and depressed agricultural output
prices and increased agricultural input prices to subsidize industrial sectors as with other
planned economies (Dixit 1973; Lipton 1977; Sah and Stiglitz 1987; Lin and Liu 2007). Cui
(1988) and Yan (1988) estimated the implicit tax by price scissors was as much as 280 billion
yuan, amounting to 17% of gross agricultural production between 1953 and 1978,. This
largely exceeds the formal agricultural tax, 89.8 billion yuan in the same period.
Since the Household Responsibility System (HRS) was adopted in 1978, it gave famers
the right to grow crops on a piece of land on their own according to their household size.
Farmers could not sell or rent out the land because this piece of land was contracted to
farmers solely for growing crops from villages and farmers do not possess the ownership of
the land. But HRS gave individual farmers incentives to produce to their comparative
advantage and increase agricultural production by allowing them to be the residual claimants
to their own agricultural production once they have filled quotas and agricultural tax in kind.
But HRS deprived township governments and village level organizations' power in
distributing local income. As a result, local governments had to introduce fees to provide
local public services such as law and order, education and medical care. Besides those fees,
local governments also added a margin on the state grain quota to generate revenues using the

20
price differences between grain quota price and free market price (Lin and Liu 2007).
In the 1990s, as a result of declining grain quota mandate enforced on farmers, township
governments and village organizations have to explicitly levy agricultural tax and fees from
farmers' pocket. Compared to implicit agricultural tax through price scissors and adding a
margin on grain quota, the work of collecting fees explicitly proved to be very costly in terms
of administrative and personnel expenses. In turn, higher fees had to be collected to
compensate the higher cost (Lin and Liu 2007).
The issue of excessive rural taxation occurred mostly in agricultural-based regions and
in the second half of 1990s. The main problem in the rural taxation issue is increased tax on
poor farmers instead of an increase in average agricultural tax (Lin and Liu 2007).
When Chinese president Hu Jintao and premier Wen Jiabao took office in 2003, they
started to remove agricultural tax and fees gradually to address farmers' bitter complaints
about excessive agricultural tax and fees. In 2006, agricultural tax and fees were completely
eliminated. Although the agricultural tax reform aimed at alleviating farmers' tax burden and
bridging the gap between rural and urban income disparity, the effectiveness of the reform is
dubious. Lin and Liu (2007) argue that as a result of the elimination of agricultural tax and
fees, many township governments get revenue solely from transfers from county
governments which may decrease local governments' accountability for local needs further.
Kennedy (2007) finds that there is a dramatic reduction in the autonomy of township
governments and provision of rural public services such as medical care and education as a
consequence.
Along with the gradual elimination of agricultural taxes, fees and grain quotas, China
has started to provide farmers with several types of subsidies. Aimed in part to boost grain
production and in part as a rural income transfer program, the national grain subsidy program
after 2004 is a mix of four programs: (a) a subsidy for farmers in areas that grow grain; (b) a

21
nationwide agricultural seed subsidy program; (c) an input subsidy including payment to
increasing cost of fertilizers; and (d) a lump-sum transfer program (Huang and Rozelle 2009).
3.4 RURAL ENTERPRISES
China's economic development has been facilitated largely by the rapid growth of its
rural industrial sector, which is composed of many rural enterprises (REs) established by
townships, villages and individuals.5 There are two main categories of REs. One is village
and township owned enterprises (TVEs) and the other is the rural private enterprises.
State-owned enterprises are principally located in urban areas. The share of total rural
enterprises in total rural output increased from 24.2% in 1978 to 78.5% in 1997, the share in
rural employment increased from 9.2% to 28.4% and the share in national industrial output
rose from 9.1% to 57.9% for the same period. In 1986, the RE share of total exports was only
9%; by 1997, the figure was 46% (Lin and Yao 2001). The development of REs is found to
help equalize the regional and urban-rural income distribution in China (Lin, Cai and Li,
1997).
Before 1978, China's industrialization principally favored large establishments in heavy
manufacturing industries like Soviet Union. As a result, rural areas were left out of the
industrialization process and mainly served as a source of food and some industrial inputs. In
response to the national campaign of mechanizing Chinese agriculture in the 1970s, many
commune- and brigade-owned factories were built for manufacturing agricultural machinery
and repairing farm tools. During the Cultural Revolution (1966-1976), large urban
state-owned enterprises (SOEs) were paralyzed. As a result, commune and brigade
enterprises took part in the market share that were solely belong to urban SOEs before.
5 Rural enterprises include all the enterprises at or below township level, regardless of their type of ownership. These
enterprises include not only those operating in industrial sectors but also those in construction, transportation, commerce and
food services.

22
Although commune and brigade enterprises only accounted for 24% of the total value of rural
gross output and less than 10% of total rural employment in 1978, the development of these
enterprises laid a solid foundation for RE development in the 1980s (Lin and Yao 2001).
Since 1978 the commune system was abolished and the household responsibility system
(HRS) came into force. The former commune and brigade enterprises were renamed TVEs.
Local governments took the lead in setting up new TVEs to increase tax revenues and public
expenditure and invest in public goods (Mukherjee and Zhang 2007). Due to missing formal
financial markets and lack of private property protection in the early years of the reform,
TVEs thrived with the help of local governments in protecting their property rights and
capital accumulation. TVEs benefited local rural communities by allowing township
governments and village organizations to increase public expenditure, particularly in
infrastructure. Nearly 41% of after-tax profits of TVEs were used for local public expenditure
in 1992.
Although TVEs were important in local government revenue generation and the
investment in rural infrastructure, the majority of REs were still private in the 1980s. In 1984,
there were 6.1 million REs of which about 70% were private. In 1990, about 92% of 17.05
million REs were private (Lin and Yao 2001).
Rural enterprises were tied to SOEs in various ways, including obtaining technology,
equipment, personnel, and market channels from urban enterprises and engaging in head-on
competition with them. From 1978 to mid-1980s, before urban and industry reforms were
initiated in 1985, SOEs were insulated by a planned system where central government
allocated material supplies, credits, and product sales channels. Isolated from competition
with rural private enterprises, technologies were transferred from SOEs to rural private
enterprises. After the urban reforms began in 1985, cooperation with SOEs began to emerge
as the major channel through which rural enterprises obtained new technologies (Lin and Yao

23
2001). Although various SOEs were tied to REs, a lighter industrial structure of SOEs was
more consistent with China's comparative advantage and made the diffusion of technology to
rural enterprises much easier.
In the 1990s, the central government initiated privatization programs nationwide. In the
process of their development, like SOEs, TVEs were increasingly faced with soft financial
budgets and shouldered with employment generating functions (Zhang 1997). As a result,
TVEs operated much less efficient than private firms (Yao 1998). These problems impeded
the privatization programs of TVEs (Zhao 1999). By the end of 1998, over 80% of the TVEs
had been privatized and became rural private enterprises (Zhao1999).
Lin and Yao (2001) argue that the number of local rural enterprises is determined by
initial conditions, local factor endowments, market reforms and interactions with SOEs. They
suggest that the rise of local rural enterprises was mainly induced by comparatively abundant
labor/capital to land endowment and historical massive engagement in commercial activities
which nurtures entrepreneurship. Market reforms facilitated local transportation,
communication and access to both domestic and international markets which boosted the
development of REs.
With close ties with SOEs, the development of REs relates to central governments'
decision on geographical distribution of SOEs. SOEs were allocated geographically by the
central government due to the consideration of balanced development and, more important, of
preparation of war in the planned era before 1978. As a result, most of the heavy industries
formed by SOEs were allocated in the central and west region of China instead of coastal
provinces. Since the reform and opening-up policy was established in 1978, most of the new
REs were initiated in coastal and southeastern provinces where most SOEs are
lighter-industrial based and markets liberalized much earlier than the inland.

24
CHAPTER 4
DATA
I use data from the China Health and Nutrition Survey (CHNS) conducted by the
Population Center at the University of North Carolina at Chapel Hill. The CHNS surveyed
622 communities and 1,194 rural households in nine provinces including Heilongjiang,
Liaoning, Jiangsu, Shandong, Hubei, Hunan, Henan, Guizhou and Guangxi in 1991, 1993
and 1997. In this thesis, I consider only farmers, defined as households having greater than 10%
of income from the value of agricultural production in that year. Around 81% of rural
households are included by this definition. The CHNS recorded detailed data on household
nutrition, agricultural production and community-level economic and retail information.
4.1 AGRICULTURAL PRODUCTION AND COMMERCIALIZATION
I observe household agricultural production in the past year, which consists of
production data for field crops, horticulture, livestock and fishery listed in separate files of
the CHNS. Surveyors record the sale, consumption and cost of field crops, horticulture,
livestock and fishery. The data also contains the value of gifts for livestock and fishery.
Although CHNS was conducted in 1989, 1991, 1993, 1997, 2000, 2004, 2006 and 2009
respectively, the sale and consumption of field crops are not available for 1989. Thus, I
exclude 1989 in my analysis.6
I first merge the agricultural production files with the household income dataset. The
household income dataset has already been cleaned by the survey team. Net income come
from nine sources including business, farming, fishing, gardening, livestock, non-retirement
wages, retirement income, subsidies and other income. The survey team calculates net
household income based on the net value of revenue minus expenses. Data comes from the
6 I also exclude 2004, 2006 and 2009 because I do not have the Chinese Food Composition Table (2002) to calculate the
caloric intake from different food items. I excluded the year of 2000 since the CHNS does not record quota information in
that year.

25
longitudinal files for each income source. Not all households are represented in each file. In
general, if a household was present in one of the files, it was assumed that the household
reported income from that source. When a household was determined to have income from a
source, but the data were incomplete for that household, an attempt was made to impute the
missing data. In order of preference, imputation was based on the household's income from
the previous and subsequent waves, the mean of households in the community, the mean in
the city/county and mean in the province/region. If fewer than three households supplied data
at any of these levels, imputation was not done at that level. After imputation of revenues and
expenses from all nine sources, there are no missing values in the net income variable.
I impute the value of sale, consumption, cost and net income of different agricultural
production types following an equation that the net income equals the sum of the sale and
consumption (sale, consumption and gifts for livestock and fishery) less cost. I replace all the
missing values with zero if all of the other variables in the equation are zeroes and/or missing
because if the household did not record anything for that production type, the household
probably was not involved in that production type. However, if more than one of the
variables in the equation is missing, I drop that observation because I cannot impute both
missing components. The production dataset has 6427 observations in total, in which 1245
observations have imputed values. I drop 1364 observations from the full sample because of
more than one missing or contradictory values in the equation. All sale, gifts, consumption
and cost values are then deflated to 2009 yuan based on the CPI (Consumer Price Index)
provided in the dataset for different years.
Agricultural commercialization in the past year is the ratio of agricultural sale value
divided by the total value of agricultural production. Agricultural production is the sum of
sale and consumption of field crops and horticulture, or the sum of sale, consumption and
gifts for livestock and fishery. I compare the Kernel density estimate of commercialization to

26
a normal distribution over years in the 1990s. From figure 1, the commercialization
distribution is getting more and more left skewed, which means that on average, households
are becoming increasingly commercialized in the 1990s.
Figure 1. Agricultural Commercialization over Time
0
.005
.01
.015
.02
De
nsity
0 20 40 60 80 100
Commercialization 1990
Kernel density estimate
Normal density
Kernel density estimate
0
.005
.01
.015
.02
De
nsity
0 20 40 60 80 100
Commercialization 1992
Kernel density estimate
Normal density
Kernel density estimate
0
.005
.01
.015
.02
De
nsity
0 20 40 60 80 100
Commercialization 1997
Kernel density estimate
Normal density
Kernel density estimate

27
When comparing the Kernel density estimated distributions of commercialization of
different agricultural products, it seems that a large number of households commercialize 20%
to 60% of their field crops in 1990 and the number of households who commercialize this
range of field crops declines over time. This change may reflect the liberalization of the
grains quota system over this period. The distribution becomes more and more bi-modal,
indicating that in the late 1990s, many households either commercialize all or not
commercialize at all for their field crops.
The Kernel density estimate of commercialization of horticulture and livestock are
different, even though both groups exhibit a bi-modal distribution. Most households
commercialize over 60% of their horticulture production in 1990 and people who
commercialize this much grow over time. Livestock commercialization distribution is
becoming increasingly bi-modal over the 1990s. Households who commercialize 0% of their
livestock increase in 1996, possibly due to the price plunge of livestock products in 1996 or
increasing capitalization of the livestock industry (Hsu and Gale 2001).
Figure 2. Commercialization of Field Crops over Time
0
.005
.01
.015
.02
Den
sity
0 20 40 60 80 100
Field Crops Commercialization 1990
Kernel density estimate
Normal density
Kernel density estimate
0
.005
.01
.015
.02
Den
sity
0 20 40 60 80 100
Field Crops Commercialization 1992
Kernel density estimate
Normal density
Kernel density estimate

28
Figure 2 (cont.)
Figure 3. Commercialization of Horticulture over Time
0
.005
.01
.015
.02
Den
sity
0 20 40 60 80 100
Field Crops Commercialization 1996
Kernel density estimate
Normal density
Kernel density estimate
0
.005
.01
.015
.02
Den
sity
0 50 100
Horticulture Commercialization 1990
Kernel density estimate
Normal density
Kernel density estimate
0
.005
.01
.015
.02
Den
sity
0 50 100
Horticulture Commercialization 1992
Kernel density estimate
Normal density
Kernel density estimate

29
Figure 3 (cont.)
Figure 4. Commercialization of Livestock over Time
0
.005
.01
.015
.02
.025
Den
sity
0 50 100
Horticulture Commercialization 1996
Kernel density estimate
Normal density
Kernel density estimate0
.005
.01
.015
.02
Den
sity
0 50 100
Livestock Commercialization 1990
Kernel density estimate
Normal density
Kernel density estimate
0
.005
.01
.015
.02
Den
sity
0 50 100
Livestock Commercialization 1992
Kernel density estimate
Normal density
Kernel density estimate

30
Figure 4 (cont.)
4.2 INCOME
The CHNS survey team has clean constructed net income from business, farming (field
crops), fishing, gardening (horticulture), livestock, non-retirement wages, retirement,
subsidies, and other sources. To calculate business revenues, I sum up the revenue of
different types of business for that household. Agricultural revenues (production) are the sum
of agricultural sale, consumption and gifts value. Gross income is the sum of all gross income
from different sources. The net income of the household is the sum of all net income. All
gross income and net income are then deflated to 2009 yuan based on the CPI provided in the
dataset. Then I downsize the dataset to only farmers who have more than 10% of gross
income from agriculture in that year.
0
.005
.01
.015
.02
Den
sity
0 50 100
Livestock Commercialization 1996
Kernel density estimate
Normal density
Kernel density estimate

31
4.3 NUTRITION
The CHNS records the amount of food eaten on the interview day for each household
member and each food item. The Chinese Food Composition Table (FCT) from the National
Institute of Nutrition and Food Safety, Chinese Center for Disease Control and Prevention
records the calories, protein, fat and categories of each food item. The food items in surveys
of 1991, 1993, 1997 and 2000 are coded according to FCT 1981 and FCT 1991. The food
items in subsequent surveys are based on FCT 2002/2004. However, only FCT 1981 and FCT
1991 are available online, so I only use data from 1991, 1993, 1997 and 2000 to match and
compute the calories of different foods. The FCT also identifies the categories of food, so I
can calculate the share of calories from staples (cereals).
Figure 5. Share of Calories from Different Sources
From figure 5, I find that the share of calories from staples declines while the share of
calories from other sources especially meat increases over time. I also compare share of
calories from non-staples (SCNS) with traditional measures of nutrition such as average
caloric and protein intake or dietary diversity. The correlation between caloric intake or
protein intake and SCNS is weak. The correlation coefficients are 0.0008 and 0.1515
0
10
20
30
40
50
60
70
80
90
100
1991 1993 1997 2000
Cereals
Vegetables
Meat
Dairy and eggs
Other

32
respectively. I find that the average caloric intake declined over years in the 1990s which is
consistent with findings in recent literature (Meng, Gong and Wang 2008; Jensen and Miller
2010). Jensen and Miller (2010) argue that the caloric intake threshold is individual varying
and often associated with absorption issues. However, when observing one switches from
staples to food with higher non nutritional status such as taste, we can tell one has surpassed
subsistence and one's utility of getting additional calories is low. Therefore, I use SCNS as
my measure of nutrition.
4.4 ASSETS
The CHNS asks whether the household owns different types of assets in each year. The
surveyed assets include production tools such as water pump, irrigation and tractor, and
durable goods for consumption such as electronic appliances and houses. However, the
number owned, the amount purchased and cost of assets bought in the past 12 months for all
assets only have between 3% and 4 % non-missing values on average. Therefore, I use
whether the household has a tractor, water pump and irrigation in the analysis instead of
using the amount owned or expenses in the past year on these assets. These possession
variables have 98% non-missing values on average. To deal with the missing values, I
determine that the household has that asset if the household has spent money buying that
asset in the past 12 months. If the household has that asset in the previous year or subsequent
year, the household is also defined as having that asset. After interpolating this way, if the
variable is still missing, I replace it with one if the household has that asset in all other years
or all the other households within the community have that asset. I use these asset variables
as instruments for agricultural production.
For farmland, around 17% of households in the dataset have missing values. To deal
with these missing observations, I assume that land size is zero if the household does not

33
grow field crops or horticulture. I then replace the household's land with the community
average if the land is missing for that household. Then I replace the household's land with
household average over years in the 1990s. If after interpolation the land is still missing, I
drop the observation. In total, 32 observations of households who are defined as farmers are
dropped.
4.5 HOUSEHOLD DEMOGRAPHIC CHARACTERISTICS
The CHNS records detailed information on age, gender and education of each household
member. Almost all, or 99.7%, of the observations are non-missing for age and gender.
Around 2% of the observations do not record education. I therefore drop these observations.
The variable "relationship with household head" provides the information to identify who is
the household head. But 130 observations have no head recorded in the household. I identify
the household member to be the head if the household has no head recorded in that year and
that household member served as household head in other years. Even after this interpolation
114 observations till do not have head information. As a result, I have to drop them.
4.6 HOUSEHOLD GRAIN QUOTA
The Chinese government had mandatory delivery quotas for grain and oilseeds in the
1990s. The mandatory delivery quotas for grain and oilseeds were eliminated gradually from
2001 to 2003 and were completely phased out in 2004. As noted in chapter 3, although some
counties had procurement delivery quotas for oilseeds, this was not as widespread as for grain
(in many counties oilseeds were not procured by the state procurement system) (Huang et al.
2009). I use the quantity of grains sold to governments to identify the size of the grain quota.
Since the government procurement price (quota price and negotiate price) was lower than
free-market -price during the existence of grain quota system before 1995 (Huang, Rozelle

34
and Wang 2006), I assume that farmers do not sell more than the required amount to the
government. After 1995, as a result of the new grain quota procurement protection prices and
consecutive years of bumper harvests, the government procurement quota price is higher than
the free-market price but any-above quota amount sold to the government is sold at a
negotiated price. The negotiated price is lower than the free-market price while the quota
price is higher than the free-market price (Huang, Rozelle and Wang 2006). The grain quota
acted like a form of subsidy to farmers in the late 1990s (Gale, Lohmar and Tuan 2005).
Based on CHNS, 2437, 935 and 830 households sold their grains to governments in 1990,
1992 and 1996, respectively, at a lower than market price with the average market price
premium ranging from 0.3 to 0.45 yuan. While the number of households who sold grains to
governments at a higher than market price increased from 174 in 1990 to 417 in 1996, the
total sample households dropped from 2802 to 1483 in the same period. The survey does not
contain the amount sold to the government starting from 2000. Therefore I am left with the
sample with waves of 1991, 1993 and 1997. The grain quota variable is used as an instrument
for commercialization.
4.7 COMMUNITY CHARACTERISTICS
To calculate the off-farm work opportunities for a household within the community, I
use the share of gross income from off-farm income of other households in the community.
Off-farm income includes non-retirement wage, business income, retirement income,
subsidies and other income.
The modern markets score, communication score, transportation score and population
density of the community, come from Jones-Smith and Popkin (2010). The modern markets
score is calculated based on the number of supermarkets, restaurants and stores within the
community. The communication score depends on the percentage of households with a

35
television, computer or phone, and the availability of newspapers, telephone, postal offices,
cinema within the community. The transportation score is based on the road type, availability
of bus stop or train station and distance to bus or train station within the community.
Population density is calculated based on people per square kilometer. These scores are all
scaled from 0 to 10. The higher the score, the better the modern markets access,
communication, transportation of the community. Similarly, the higher the score of
population density, the more dense the population in the community (Jones-Smith and Popkin
2010).
The number of private enterprises within the community is another instrument for
agricultural commercialization. If the number of enterprises is missing, I replace the variable
with zero. If the variable records negative values or 99, which means "I don't know", I first
calculate the ratio between the number of community rural private enterprises and the number
of provincial rural private enterprises. Then I multiply the ratio by the number of provincial
rural private enterprises in the previous year.
After cleaning the dataset, I find that there are 9.2, 11.5 and 11.8 rural private enterprises
(RPEs) per village on average in 1991, 1993 and 1997 respectively. Comparing this number
in coastal provinces with that in inland provinces, the number in coastal provinces was bigger
than that in non-coastal provinces consistently in the 1990s except 1993 when both region has
around 11 rural private enterprises per village. In 1991, there were 7.7 RPEs per village in
non-coastal provinces and 10.7 RPEs per village in coastal provinces. In 1997, there were
10.4 RPEs and 14.1 RPEs in non-coastal and coastal regions, respectively. There seems to be
a trend of concentration of rural enterprises in the coastal areas compared to the inland
region.
In table 4, I present the summary statistics for all variables in the analysis of the relation
between agricultural market liberalization, commercialization and nutrition. I split the sample

36
by nourishment. I define households who consume over 20% of calories from non staples as
nourished households following Jensen and Miller (2010). The counterpart is the
undernourished. When comparing the two different groups of people, I find that nourished
households have higher agricultural production and commercialization overall. Specifically,
nourished households commercialize more of their horticulture and livestock while
undernourished households commercialize more of their field crops. The average SCNS for
nourished household is 31.3% compared to 10.6% for undernourished households. There is
also higher variation in SCNS of nourished households. There is not much difference in terms
of local market liberalization, or possession of tractors, pump or irrigation. Nourished
household heads are more educated and older than the counterpart. Both groups are found to
be male headed on average. In terms of other community level characteristics, nourished
households have better access to communication facilities while both groups have similar
access to modern markets on average. Nourished household are found to have higher income,
lower grain quota both before and after 1995 and more rural private enterprises in their
community.
As shown in table 5, the consumer price of rice declines from 3.2 yuan/jin to 2.7
yuan/jin and the price of soybean oil declines from 12.8 yuan/jin to 11.5 yuan/jin.7 The price
of vegetables stays relatively constant ranging from 1.1 yuan/jin to 1.3 yuan/jin in this period.
The pork price varies a great deal, rising from 7 yuan/jin in 1991 to 17 yuan/jin in 1997.
Generally, livestock prices follow the same pattern as prices climb continuously from 1991 to
1997. It is clear that with market liberalization and the elimination of implicit taxes on
agricultural products, food prices increase in this period. In the meanwhile, armers' net
income disparity also increases. The standard deviation of household net income increases
from 10326.9 yuan in 1991 to 18785.0 yuan in 1997 while the mean rises from 11706.8 yuan
7 1 jin = 500 gram

37
to 18785 yuan in 1997 (table 5).
Table 4. Summary Statistics
Variables Undernourished Nourished
Dependent Variables
Agricultural value (in 2009 yuan)
Commercialization rate (CR, %)
8579.6
(5877.2)
57.3
(26.1)
8963.9
(6615.3)
61.2
(25.3)
CR of field crops 42.9
(31.5)
33.0
(32.8)
CR of horticulture 60.7
(43.9)
76.5
(35.1)
CR of livestock 34.0
(40.9)
39.3
(41.2)
Share of calories from non-staples (SCNS, %)
10.6
(4.9)
31.3
(10.0)
Explanatory Variables
Local market liberalization index 43.0
(12.9)
43.6
(15.5)
Land (mu) 7.0
(8.4)
5.6
(17.8)
Age of household head 39.5
(10.1)
39.9
(10.2)
Education of household head 4.1
(3.7)
4.7
(3.5)
Gender of the household heads (0= the household
is head by a male and female; 1= only by female;
2= only by male)
2.0
(0.2)
2.0
(0.2)
Whether the household has tractor
(1=Yes, 0 = No)
0.2
(0.4)
0.1
(0.3)
Whether the household has irrigation
1=Yes, 0=No)
0.07
(0.26)
0.02
(0.15)

38
Table 4 (cont.)
Variables Undernourished Nourished
Whether the household has water pump
(1=Yes, 0=No)
0.1
(0.3)
0.1
(0.3)
Off-farm work opportunities 0.2
(0.2)
0.3
(0.2)
Community communication score 3.8
(1.2)
4.1
(1.3)
Community modern market score 3.5
(3.2)
3.5
(2.8)
Household net income (in 2009 yuan) 11276.9
(10164.6)
18086.9
(19862.9)
Quota prior to 1995 (kg) 263.1
(546.3)
141.0
(258.4)
Quota post to 1995 (kg) 288.6
(815.9)
268.0
(929.1)
Number of private enterprises in the community 8.6
(15.1)
10.0
(14.0)
Rice price (in 2009 yuan/500g) 3.0
(1.1)
2.8
(0.6)
Pork price (in 2009 yuan/500g) 16.2
(3.6)
17.2
(3.2)
Vegetables price (in 2009 yuan/500g) 1.2
(0.6)
1.3
(0.6)
Soybeans oil price (in 2009 yuan/500g) 12.2
(2.4)
12.1
(2.5)
Note: Standard deviations are in parenthesis.

39
Table 5. Mean Food Retail Price and Net Income by Year
Variables 1991 1993 1997
Rice price (in 2009 yuan/500g) 3.2
(1.0)
2.8
(0.9)
2.7
(0.8)
Vegetables price (in 2009 yuan/500g) 1.2
(0.6)
1.1
(0.6)
1.3
(0.6)
Soybeans oil price (in 2009 yuan/500g) 12.8
(2.8)
12.5
(2.4)
11.5
(2.0)
Pork price (in 2009 yuan/500g) 7.3
(1.7)
9.3
(2.5)
16.6
(3.2)
Chicken price (in 2009 yuan/500g)
Beef price (in 2009 yuan/500g)
7.5
(2.4)
9.2
(3.3)
12.7
(4.4)
7.3
(2.0)
9.1
(2.4)
14.2
(3.6)
Lamb price (in 2009 yuan/500g) 7.8
(2.7)
10.3
(3.4)
17.7
(5.4)
Net income (in 2009 yuan) 11706.8
(10326.9)
12678.2
(13131.9)
16702.1
(18785.0)
Note: Standard deviations are in parenthesis.

40
CHAPTER 5
MARKET LIBERALIZATION
I am interested in understanding how market liberalization affects agricultural
production, commercialization and nutrition in China. To do that, I need a good measure of
market liberalization. Given that many of the communities in my data are remote, they may
have been affected differently by trade policy changes than those communities that are
already highly linked to the world market. Traditional measures of market liberalization such
as NRAs and tariffs usually do not vary by region. By incorporating differences between
community and provincial prices plus the differences between provincial prices and world
prices, I can capture the market liberalization at community level taking regional
transportation costs into account.
Scholars use various ways to measure market liberalization in a country. Many studies
use reduction of tariffs and import quotas to identify market liberalization (Hertel et al. 2003;
Goldberg and Pavcnik 2004; Hertel et al. 2004). Trade protection, however, has been
increasingly been in the form of non-tariff barriers (NTBs) that are hard to measure. For
example, in China during the 1980s and early 1990s, most of the fall in protection came from
a reduction in the number of commodities and the amount of a single commodity that were
controlled by single desk state traders (Huang and Chen 1999). Further, border and inland
taxes policies are also sources of distortions in China. As shown in Huang and Rozelle (2002),
there has been a 13% to 17% value added tax on China’s agricultural commodity imports
since 1979 that is still in place today. The same domestic commodities are taxed at a rate of
less than 5%. In addition, prior to China’s entry into the WTO, local and central authorities
subsidized the exports of several agricultural commodities such as corn and cotton by export
rebates. Hence, the gains from decreasing NTBs may be as critical as those that can come
from tariff and quota reduction (Huang, Rozelle and Xie 2003).

41
To account for the effects of NTBs, Anderson et al. (2008) and Huang et al. (2009) use
the nominal rate of assistance (NRA) and nominal rate of assistance at the farm gate (NRAf)
to measure border and domestic market distortions. In Huang et al. (2009), NRAs are
calculated based on the percentage price difference between the border and world. To
measure distortion within China, Huang et al. (2009) use the Nominal Rate of Assistance at
the farm gate (NRAf) for different commodities. Specifically they measure the domestic
market distortion using the difference between NRA and NRAf. A negative NRA or NRAf
indicates that the government is taxing the farmers of that commodity, while a positive value
indicates subsidizing the farmers.
One limitation of NRAs is that it only measures a single national level of price distortion
or market liberalization. Further, transaction costs and regional heterogeneity may result in
misleading measures for the NRAf. For example, observing a low ratio of farm gate to port
price of an import-competing product may result from a low level of protection. Conversely,
the relatively low farm-gate price might be a result of high transaction costs of getting the
product to the regional market, where the regional market still is highly protected from
import competition (illustrated in figure 6). As shown in figure 6, for an import competing
product, the border price (Pb) is higher than the world price (Pw) because of import tariffs.
Because of transaction cost (tc1) to ship the good from borders to the provincial city, the
provincial price (Pp) will be even higher than the border price (Pb). Suppose that a local
community of the province has a comparative advantage in the production of that product,
then the local price (Pi) is actually lower than the world price (Pw). However, because of high
transaction cost (tc2) to ship the product to the provincial city, the provincial price (Pp), will
be much higher than the local price (Pi).In this case, the NRAf will indicate low market
distortion and thus high market liberalization locally while actually the local communities are
very much isolated from the world market.

42
Figure 6. Import Competing Good With High Transaction Costs from Farm
As shown in Park et al. (2002), transaction costs from transport bottlenecks and other
constraints actually increased the autarky rate for grains in China from 1988 to 1995. If a
rural area faces sufficiently high transaction costs, it will be protected from imports
regardless of whether the country has restrictive trade policy or not (Milner, Morrissey and
Rudaheranwa 2000; Helble, Shepherd and Wilson 2009). This research builds on the
approach of Anderson et al. (2008) and Huang et al. (2009), and attempts to generate a local
measure of NRAf. I calculate the difference between the local and the regional market price,
and the difference between regional market price and world price to identify which regions
face effective market liberalization and which regions do not. I then utilize the variation in
internal protection generated by regional transaction costs to estimate the effect of market
liberalization.
This research attempts to use the variation in local market isolation to identify the effect
of market reforms. I measure local market integration or local market globalization by
measuring how closely local prices move with international prices. These price differences
incorporate the effects of trade-distorting policies such as export subsidies, import tariffs and

43
domestic market distortions. For example, all else equal, an export subsidy on corn would
cause the local price to be higher than the world price. The price differences also capture
transportation and other transactions costs of moving the product from port cities to inland
markets and then to rural communities. I calculate a market isolation index by summing the
squared differences between local price and provincial price, and the squared differences
between provincial price and world price across crops in the community (equation 1). In
equation (1), I is the market isolation index, Pci is the local community price, Pwi is the world
price and Ppi is the provincial price for product i. Provincial price is represented by the price
of the most urbanized city in the province.8 I use rice, wheat, corn, poultry, pork and
vegetables because they accounted for above 50% of the total value of agricultural output in
China (Huang et al. 2009). I then measure the local market liberalization by taking the
reciprocal of the local market isolation index and multiplying it by 100.
(1) ])||
( )||
[( 22
i
ii
i i
ii
Pw
PwPp
Pp
PpPcI
Because prices differ for the same product based on quality, I chose prices of products
with the most common quality. I included the prices of the most commonly eaten type of rice,
bleached flour, corn flour, soybean oil, most commonly eaten vegetables, pork (fatty and
lean), chicken (cleaned) to calculate the index. To identify the most urbanized city in the
province, I compare the urbanicity index of different cities within that province calculated by
Jones-Smith and Popkin (2010), which is available in the CHNS dataset. The city with the
highest urbanicity index is defined as the provincial city. The world price comes from the
FAO Trade Stat website. It is common to observe China export and import the same
agricultural product at the same time. I compare the value of imports and exports for the same
product to determine whether the good is an import competing product or export product. As
8 Urbanicity of the community is based on Jones-Smith and Popkin (2010). Urbanicity is a weighted average of population
density, economic activity, traditional markets, modern markets, transportation infrastructure, sanitation, communication,
housing, education, diversity, health infrastructure and social services scores.

44
a result, rice milled, pork, vegetables and chicken are export products while wheat flour, corn
flour and soybeans oil are import competing products. After defining their categories, I
calculate the world prices by dividing the total export or import value by the corresponding
quantity.
Following the definition of local market liberalization, I compare NRAfs and NRAs
with the local market liberalization index (tables 6a and 6b). I include two market
liberalization indices, one without soybeans (definition 1) and one with soybeans (definition
2). Because one might be concerned that soybeans are both highly-traded and were being
adopted as a feed over this time, they might distort our measure of local market liberalization.
I will use definition 1 for my primary results. As a robustness test, I provide results using the
local market liberalization index with soybeans in the appendix, table A1.
From table 6a, I observe that the local markets are becoming more and more effectively
liberalized over the time. The market liberalization index including soybeans (definition 2)
fell in 1997 compared to the market liberalization without soybeans (definition 1). This
difference indicates that the major distorted agricultural product in 1997 was soybeans. This
result is consistent with the finding by Huang et al. (2009) who find that the NRA and NRAf
of soybeans increased to 27% and 32.9% from -4.1% and -11.1% respectively. After Deng's
visit to the south in 1992, market liberalization reforms proceeded rapidly. In 1993, the
NRAfs for soybeans and wheat become closer to zero and are negative. Comparing NRAs
with NRAfs (table 6b), I find that most NRAs decline over this time period. In 1993, the
NRAs for rice and corn are more negative than 1991 and the NRA for soybeans even shifted
from positive to negative in 1993. It is likely that with the elimination of food coupons and
the surge in domestic rice, corn and soybeans price, the government started taxing farmers
through export bans and increased imports of rice, corn and soybeans.

45
Table 6a. NRAf (%) for Selected Agricultural Products, and Local Market
Liberalization
Variables 1991 1993 1997 2000
NRAf Export Products
Rice
-33.4 -32.4 -10.7 -9.2
Vegetables
Poultry
Pork
-33.5
-4.5
-22.6
-11.2
-1.5
-7.5
0
0
0
0
0
0
Corn -31.6 -27.3 8.9 7.3
NRAf Import Competing Products
Wheat 25.1 -7.1 25.4 11.5
Soybeans 12.4 -11.1 32.9 17.4
Average Local Market Liberalization
Definition 1 (without soybeans) 40.2 41.6 54.3 53.1
Definition 2 (with soybeans) 12.4 20.0 12.3 32.0
Source: Huang et Al. (2009) and author’s calculations
Table 6b. NRA (%) for Selected Agricultural Products, and Local Market
Liberalization
Variables 1991 1993 1997 2000
NRA Export Products
Rice
-16.0 -28.2 -9.8 4.6
Vegetables
Poultry
Pork
-33.7
-4.5
-2.9
-11.2
-1.5
-1.0
0
0
0
0
0
0
Corn -12.6 -19.9 3.3 3.3
NRA Import Competing Products
Wheat 63.7 38.1 28.2 9.8
Soybeans 8.7 -4.7 27.0 27.7
Average Local Market Liberalization
Definition 1 (without soybeans) 40.2 41.6 54.3 53.1

46
Table 6b (cont.)
Variables 1991 1993 1997 2000
Definition 2 (with soybeans) 12.4 20.0 12.3 32.0
Source: Huang et Al. (2009) and author’s calculations
Because my market liberalization measure is novel and constructed using coarse data, I
test the validity of my measure by exploring what factors are associated with my measure of
local effective market liberalization using equation (2).
(2) X1 μβI
where I-1
is the local market liberalization index, X is a matrix of different variables that
affect local effective market liberalization: transportation score, communication, modern
markets score and population density of the community. The parameter β is a vector of
corresponding coefficients and μ is the error term. The means of the explanatory variables
by years are shown in table 7.
From table 7, I observe that in the sample communities, the transportation,
communication and modern markets score do not change much. But using the full dataset
which includes communities that do not have local retail prices information (thus no local
market liberalization), I find the transportation, communication and access to modern markets
increased significantly this time. Based on the full dataset, the transportation score increased
from 4.26 to 5.72, local communication score increased from 3.92 to 4.85 and local market
score increased from 3.84 to 4.76 from 1991 to 2000 respectively. Luo et al. (2007) show that
on average, each village in China had about one infrastructure project during the late 1990s.

47
Table 7. Means of Explanatory Variables by Year
Variables 1991 1993 1997 2000
Transportation score 5.69
(2.73)
5.60
(2.56)
5.54
(2.59)
5.73
(2.48)
4.85
(1.18)
Communication score 4.38
(1.25)
4.67
(1.24)
4.99
(1.08)
Modern markets score 4.75
(1.24)
5.07
(2.91)
4.61
(3.19)
4.74
(3.34)
Community population density 6.13
(1.38)
6.01
(1.37)
5.60
(1.63)
5.68
(1.61)
Total observations 124 131 152 215
Note: standard deviations are in the parenthesis.
I present the regression results for equation (2) using definition 1 (without soybeans) for
the market liberalization index in table 8. The second column reports the regression results
with year dummies only, the third column reports results with year and province dummies,
and the fourth column reports results with year and county dummies. The regression results
do not change much when using different fixed effects. Communication and availability of
modern markets significantly increases local market liberalization while local transportation
and community population density do not significantly affect local market liberalization.9
Table 8. Local Market Liberalization Regression Results (Definition 1)
Variables Year
Dummies
Year and Province
Dummies
Year and County
Dummies
Transportation -0.522 0.194 -0.286
(0.366) (0.345) (0.359)
Communication 1.507* 1.082 -1.266
(0.827) (0.784) (0.805)
9 We also ran the model including agricultural production in the regression, but the coefficient on agricultural production is
not significant.

48
Table 8 (cont.)
Variables Year
Dummies
Year and Province
Dummies
Year and County
Dummies
Modern market score 0.586** 0.673** 0.818***
(0.297) (0.275) (0.279)
Community population density -0.0638 -0.343 0.676
(0.297) (0.275) (0.279)
Adjusted R2
0.09 0.25 0.36
Observations 622 622 622
Note: *, **, *** indicates significance level 15%, 10% and 5%. Standard errors are in parenthesis.
In summary, this chapter finds that local market liberalization generally increases in the
1990s. Improved access to modern markets and, to a lesser extent, communication are the
main factors that contribute to local market liberalization.

49
CHAPTER 6
METHODOLOGY
To study the relation between market liberalization, agricultural commercialization and
nutrition, I use a three-stage least squares (3SLS) regression method, where agricultural
production, the degree of commercialization and nutritional outcomes are each estimated as
part of a simultaneous system.
A farmer, when deciding how much to produce, will consider her land, labor and capital
endowments, her opportunity costs and the expected value of the production which is affected
by local market liberalization. When deciding whether to commercialize her production, a
farmer will again consider the price she can receive for her production in the market, and the
transaction costs of marketing her produce. The expected market price is affected by local
market liberalization and transaction costs including transportation and information cost and,
because commercialization is often labor intensive, the opportunity cost of labor (Masanjana
2006). Household food security is influenced by agricultural production, agricultural
commercialization, wealth, market liberalization, income, and food prices (Masanjana 2006).
These equations are represented by the following system of simultaneous equations:
(5) ˆˆ
(4) ˆ
(3)
33210
23210
1210
εδPδAδCδN
εβRβYβAβC
εαXαKαA
itititit
itititit
ititit
In equation (3), agricultural production value, Ait for household i at time t is affected by
a vector of variables Kit including farm land, farm labor supply, off-farm work opportunities
and local market liberalization. The instruments (Xit) for agricultural production are variables
representing fixed capital.
The value of agricultural production (Ait) is calculated as the sum of the sale,
consumption and gifts value of field crops, horticulture, livestock and fish produced by the
household. Farm land is the land the household had for cropping last year. Farm labor supply

50
includes the education, age and gender of the household head. Off-farm work opportunities
are proxied by the average share of gross income from non-farm income of other people in
the community. Local market liberalization is measured by the inverse of I multiplied by 100
in equation (1). I use whether the household has a tractor, pump or irrigation to capture the
effects of fixed capital that only affects agricultural commercialization through crop choice
and production. I expect that fixed capital, land and market liberalization will increase
agricultural production while off-farm work opportunities will decrease agricultural
production due to high opportunity cost of agricultural production. The effects of the
household head's age, gender and education are not clear ex-ante. If it is more beneficial to
work in cities, then more educated people will migrate to cities for work and thus decrease
agricultural production and commercialization. On the contrary, if it is more beneficial to
work on farms, then higher educated people will stay on farm, increase their agricultural
production and commercialization. I expect that market liberalization increases agricultural
production through more efficient allocation of inputs, increased agricultural production
efficiency and higher prices of agricultural outputs.
In equation (4), agricultural commercialization, Cit, is modeled as a function of
instrumented agricultural production ( itA ), instruments (Yit) and control variables (Rit).
Instruments, (Yit) are government commercialization policies and local government support
for entrepreneurship. Control variables, (Rit) are labor, land, market liberalization, off-farm
work opportunities, market access and market information. Agricultural commercialization
(Cit) is calculated as the share of agricultural production value sold, which is a continuous
variable.
Government commercialization policies are proxied by the size of the household grain
quota. Prior to 1995, the grain quota procurement price is much lower than the free-market
price, taxing the grain sector heavily (Huang et al. 2009). In November 1996, the Chinese

51
government started to set a protection procurement price for grains. Whenever the free
market prices fall below the state-set procurement prices, the grain bureaus will procure quota
grain at protective prices which are usually higher than free market prices (Gale, Lohmar and
Tuan 2004; Shea 2010). As noted by Lu (1999), the policy signals a historical shift in the role
of China's grain pricing policy from taxing farmers to subsidizing farmers. Huang et al. (2009)
note that with the disappearance of the distortions from the marketing and procurement
system, the distortions of the grain market after the mid-1990s reflect only trade policies and
not domestic agricultural policies. Thus, the effect of quota on commercialization prior and
post to 1995 are probably different. I separate the quota into two variables, quota1 and quota2.
Quota1 denotes the household grain quota in 1991 and 1993 with zero in 1997 while quota2
identifies the quota in 1997 with zero in 1991 and 1993.10
One might be concerned that grain
quota also affects households' nutrition through grain coupons. But I find from the dataset
that the grain coupons barely exist in the 1990s in rural areas. Only 25 households received
food coupons averaging 83.1 yuan per month compared to average monthly net income of
976 yuan for farmers in 1991.
Besides quota, the other instrument is the number of private enterprises in the
community. The number of private enterprises in rural villages is mostly affected by market
reforms, local factor endowments and interaction with local SOEs (Lin and Yao 2001). Lin
and Yao (2001) argue that higher market liberalization and a higher labor/capital to land
endowment ratio promote the development of rural private enterprises. A light industry
formed by SOEs in urban areas also facilitates the development of rural private enterprises
through diffusion of technologies from urban industries to rural enterprises.11
Market liberalization reforms after 1978 are controlled by the central government. The
10 The actual question in the questionnaires asks farmers how much they sold to the government as public grain or at a
leveled price last year. Because the survey was conducted from September to December, and crop year starts in May for
winter wheat, July for spring wheat and August for rice in the survey provinces, it is likely that farmers record their amount
sold to government last crop year which was the calendar year that the survey was conducted. 11 Please refer to section 3.4 in chapter 3 for more details about the development of rural enterprises.

52
geographical distribution of SOEs is also decided by the central government. I argue that by
controlling local land, capital, labor endowments, rural infrastructure (particularly access to
markets), transportation, communication facilities and local market liberalization, the number
of private enterprises in the village is mostly affected by central governments' decision on
distribution of SOEs and support of rural enterprise privatization.
The number of rural private enterprises, therefore, is influenced mainly by the central
government policies with variation in local government implementation. Private enterprises
facilitate agricultural commercialization as many farmers sell their agricultural products
directly to them (Lin and Yao 2001). Thus, the number of private enterprises is treated as
exogenous and serves as an instrument for commercialization. One may be concerned that the
number of private enterprises may affect nutrition through increased income or better rural
infrastructure such as better access to food markets and information. To solve this problem, I
control for household net income, access to food market proxied by the community modern
markets score and information cost represented by communication score in the nutrition
regression.
Agricultural production, market liberalization, the number of private enterprises in the
village, access to markets and communication in the community are expected to increase
commercialization. The signs of the coefficients of off-farm work opportunities, age, gender
and education of household head, land and grain quota on the commercialization are not
obvious ex-ante. On one hand, off-farm work opportunities and better human capital may
drive farmers out of rural villages to take non-farm jobs in cities for higher income and
city-associated benefits. On the other hand, abundant off-farm work opportunities may
indicate a more commercialized rural economy that can hire labor from local markets. If
agricultural commercialization is highly profitable, higher educated labor may stay on farms
to operate the family business or work for other big commercialized farms. For land, it is

53
possible, on one hand, that more land indicate higher total agricultural production and more
commercialization. On the other hand, more land does not suggest higher quality of land and
may suggest that the household is further away from the urban center or urban markets to sell
their agricultural products. Therefore, more land may indicate even lower agricultural
production and less commercialization. The grain quota may increase total agricultural
commercialization by compulsory grains commercialization. However, the grain quota may
distort farmers' behavior by preventing them from producing more comparatively
advantageous products other than grains, and thus decreasing commercialization of other
crops and the overall agricultural commercialization. Although the effects of quota1 and
quota2 on gross commercialization is not clear ex-ante, quota2 (grain quota post 1995) is
expected to have a larger positive effect on grain commercialization compared to quota1
(grain quota prior to 1995) since many government procurement prices are set higher than the
free-market price.
Last, the nutritional outcome (my measure of household food security), Nit, is a function
of instrumented agricultural commercialization (it
C ) or instrumented agricultural production
( itA ) and control variables (Kit) namely income, labor, local market liberalization,
off-farm work opportunities, land, access to market, market information and food prices.12
The nutritional outcome is calculated as the share of calories from non-staples, following
Jensen and Miller (2010). Jensen and Miller argue that using caloric intake is problematic
because individual requirements vary greatly and capture age, activity level and absorption.
There is no consensus on the threshold of calories that determines whether a person is getting
sufficient nutrition. However, people can identify that one has passed the subsistence level
when observing an individual switching from consuming only staples to non-staples. They
12 Off-farm work opportunities are included in the nutrition equation because otherwise this variable will become an
instrument for agricultural commercialization. I test the robustness of using off-farm work opportunities as instrument along
with grain quota and number of private enterprises in the community in tables 23 and 24.

54
show that the empirical SCS threshold where households pass subsistence and have lower
marginal utility of additional calories, closely matches what would be estimated from a
minimum cost diet calculation based on economic theory. Therefore, I use the share of
calories from non-staples to indicate the food security of households. Jensen and Miller
define households who consume over 20% of calories from non-staples as nourished
households based on the CHNS in China. Labor, local market liberalization, off-farm work
opportunities, land, access to market and market information are defined as before, the
household net income come from various sources including agriculture, non-retirement wage,
retirement, business, subsidies and others. Food prices include community retail prices of rice,
soybean oil, vegetables and pork at the time of the interview.
I expect that household net income, local market liberalization, communication and
market access in the community increase household food security while all the food prices
have negative effect on household food security. Given the importance of rice in diet, I
expect that the income effect of an increase in rice price overcomes the substitution effect and
thus the household will consume more rice with the rise of rice increase and decrease their
nutrition. For other non-staple foods, I expect that the substitution effects outweigh income
effects. The increase in price of vegetables, pork and soybean oil will lead households to
substitute away from them and consume more grains, reducing their nutrition. The effect of
land on nutrition is not obvious because more land does not mean better quality of land.
Large quantity of land cannot indicate more wealth of the household and thus better nutrition.
I provide the full list of variables included in the 3SLS regression in table 9. The
variables listed in 1st, 2nd and 3rd columns correspond to equations (3), (4) and (5)
respectively with the first row being dependent variables and the rest explanatory variables.
All three regressions include year and county dummies as explanatory variables as well.

55
Table 9. Full List of Variables Included in 3SLS Regressions
Agricultural (ag) production
equation
Agricultural (ag)
commercialization
equation
Nutrition equation
(Household food security/
SCSN)
Market liberalization Instrumented ag production Instrumented ag production
Land Market liberalization Instrumented ag
commercialization
Household (HH) head age Land Market liberalization
HH head gender HH head age Land
HH head education HH head gender HH head age
Whether the HH has tractor HH head education HH head gender
Whether the HH has irrigation Off-farm opportunity cost HH head education
Whether the HH has water pump Community communication Off-farm opportunity cost
Off-farm opportunity cost Community modern markets Community communication
Year dummies Grain quota prior to 1995
(quota1)
Community modern
markets
County dummies Grain quota post to 1995
(quota 2)
Community rice retail price
Number of private
enterprises in the
community
Community vegetables
retail price
Community pork retail
price
Community soybeans retail
price

56
CHAPTER 7
RESULTS
In this chapter, I estimate equations (3), (4), (5) using a three-stage-least squares
regression. Second, I run the regressions by different agricultural production type and find
that the commercialization of field crops and horticulture significantly increases nutrition
while the commercialization of livestock is not significant. Then I split the sample into
nourished and undernourished households using the consumption of 20% of calories from
non-staples as the cut-off. Results suggest that commercialization increases nutrition overall
and especially for undernourished households. Last, I run several robustness tests of the
definition of farmers, the market liberalization index, using different nutritional measures and
different model specifications. I generally find consistent results that commercialization
increases nutrition overall and that commercialization especially benefits undernourished
households.
7.1 Main Results
Regression results for agricultural production (equation 3) are presented in table 10.
Local market liberalization, land, household head age and possession of tractors and
irrigation increase agricultural production while more off-farm work opportunities decrease
agricultural production. Local market liberalization may promote local agricultural
production because market development allows farmers to produce to their comparative
advantage and, thus, improves agricultural efficiency. More off-farm work opportunities, on
the other hand, may drive farmers from villages to urban areas and, thus, decrease
agricultural production. Land and possession of tractors and irrigation increase agricultural
efficiency and production. The older the household head, the more experienced and
conservative they usually are. It is likely that older household heads tend to be more

57
agriculture-oriented instead of seeking off-farm work opportunities, bearing higher risk of
learning new skills and even life styles in urban cities. The effect of the education of the
household head and their gender on agricultural production is not obvious ex-ante. Neither
variable significantly affects agricultural production. The instruments for agricultural
production (whether the household has a tractor, pump or irrigation) appear to be valid, with
a p-value for Hansen's overidentification test of all instruments of 0.8919.
Table 10. Results for Agricultural Production
Variables Coefficient
Household head age 103.8***
(18.75)
Household head education -40.68
(53.93)
Household head gender
669.9
(752.7)
Land 56.59***
(13.55)
Whether the household has water pump 447.6
(569.8)
Whether the household has tractor 1080.7***
(488.9)
Whether the household has irrigation 3342.3***
(829.8)
Local market liberalization 36.38**
(18.66)
Off-farm work opportunities -2869.8***
(1145.9)
Observations 1194
Note: *, **, *** indicates significance level 15%, 10% and 5%. Standard errors are in parenthesis. County
and year dummies are included.

58
I report the regression results for agricultural commercialization (equation 4) in table 11.
Significant variables that increase agricultural commercialization are instrumented
agricultural production, local market liberalization, the number of private enterprises in the
community and off-farm work opportunities. Market liberalization links farmers to external
markets, increasing the demand for export-oriented agricultural products and thus increasing
agricultural commercialization. Private enterprises are usually found to provide marketing
channels for local agricultural products and, thus, increase agricultural commercialization
(Lin and Yao 2001). Older household heads seem to be less entrepreneurial and thus
commercialize less of their agricultural production. The grain quota before 1995 indicates
heavy taxation on grain farmers, possibly forcing farmers to sacrifice their commercialization
of other agricultural products such as vegetables and fruit. Land decreases agricultural
commercialization possibly because larger land indicates the household lives farther from
urban center or urban markets and the land may be of worse quality. As a result, more land
does not lead to higher commercialization.
Higher off-farm work opportunities may indicate more urban migration or plenty of
local demand. Household head gender and education do not significantly affect
commercialization. Community modern markets score does not significantly affect
commercialization. Surprisingly, local communication score decreases agricultural
commercialization.
Table 11. Results for Agricultural Commercialization
Variables Coefficient
Instrumented agricultural production 0.00192***
Grain quota prior to 1995
(0.000284)
-0.00280***
(0.00140)

59
Table 11 (cont.)
Variables Coefficient
Grain quota post to 1995
Land
-0.00105
(0.000924)
-0.156***
(0.0553)
Household head age -0.283***
Household head education
(0.0804)
0.155
(0.214)
Household head gender
-1.193
(2.995)
Local market liberalization 0.116*
(0.0747)
Number of enterprises in the community 0.223***
Modern markets score of the community
(0.0553)
0.296
(0.310)
Communication score of the community -1.581***
(0.729)
Off-farm work opportunities 14.75***
(4.694)
Observations 1194
Note: *, **, *** indicates significance level at 15%, 10% and 5%. Standard errors are in parenthesis.
County and year dummies are included.
The results for nutritional outcome (measured by the share of calories from non-staples
or SCNS) (equation 5) are presented in table 12. The instruments for agricultural
commercialization (the size of grain quota prior to 1995, grain quota post 1995 and the
number of private enterprises in the community) pass Hansen's exogeneity test and serve as
valid instruments (with p-value of 0.4022). Instrumented agricultural commercialization
significantly increases SCNS (household food security). This result indicates that increased

60
agricultural production efficiency associated with agricultural commercialization may offset
the negative effects of increased price and income volatility or women's loss of control of
cash income. As one might expect, the SCNS increases as the household net income increases
but at a decreasing rate, although this result is not significantly different from zero.
Households are estimated to achieve the maximum SCNS hen their net income is around
407,509 yuan which is higher than maximum (294,092 yuan) of all household net income in
our sample. SCSN declines with an increase in soybean oil price.
Surprisingly, none of demographic variables affect nutrition significantly while literature
suggests that female, higher educated and younger household head increase the household
nutrition (SCNS) (Masanjala, 2006; Kennedy and Cogill 1987; Kennedy 1989; Kurth 1989).
Modern market score and communication score in the community are not significant either
while I expect them to increase nutrition because better access to markets and communication
in the village can reduce household's transactions cost of buying food. While the estimated
coefficients are negative as expected, local rice, pork and vegetables retail prices do not affect
nutrition significantly.
Table 12. Results for Household Nutritional Outcome
Variables Coefficient
Instrumented agricultural commercialization 0.429***
Instrumented agricultural production
(0.160)
-0.000211
Household net income
(0.000274)
0.0000445
(0.0000702)
Household net income square -5.46e-11
(2.78e-10)
Household head age 0.0181
(0.0603)

61
Table 12 (cont.)
Variables Coefficient
Household head education -0.00587
(0.136)
Household head gender
Communication score of the community
1.465
(1.885)
0.757
(0.532)
Modern Markets score of the community 0.0986
(0.202)
Land 0.0575*
(0.0389)
Off-farm work opportunities -1.806
(3.610)
Market liberalization -0.0718
(0.0538)
Local rice retail price -0.444
(0.507)
Local pork retail price -0.117
(0.198)
Local vegetables retail price -0.0908
(0.629)
Local soybeans oil retail price -0.710***
(0.287)
Observations 1149
Note: *, **, *** indicates significance level 15%, 10% and 5%. Standard errors are in parenthesis. County
and year dummies are included.
Given that agricultural commercialization increases nutrition overall, I analyze how the
commercialization of different agricultural production types affects nutrition separately. I run
3SLS regressions for the commercialization of field crops, horticulture and livestock. I find
that market liberalization increases the production of horticulture (but not the
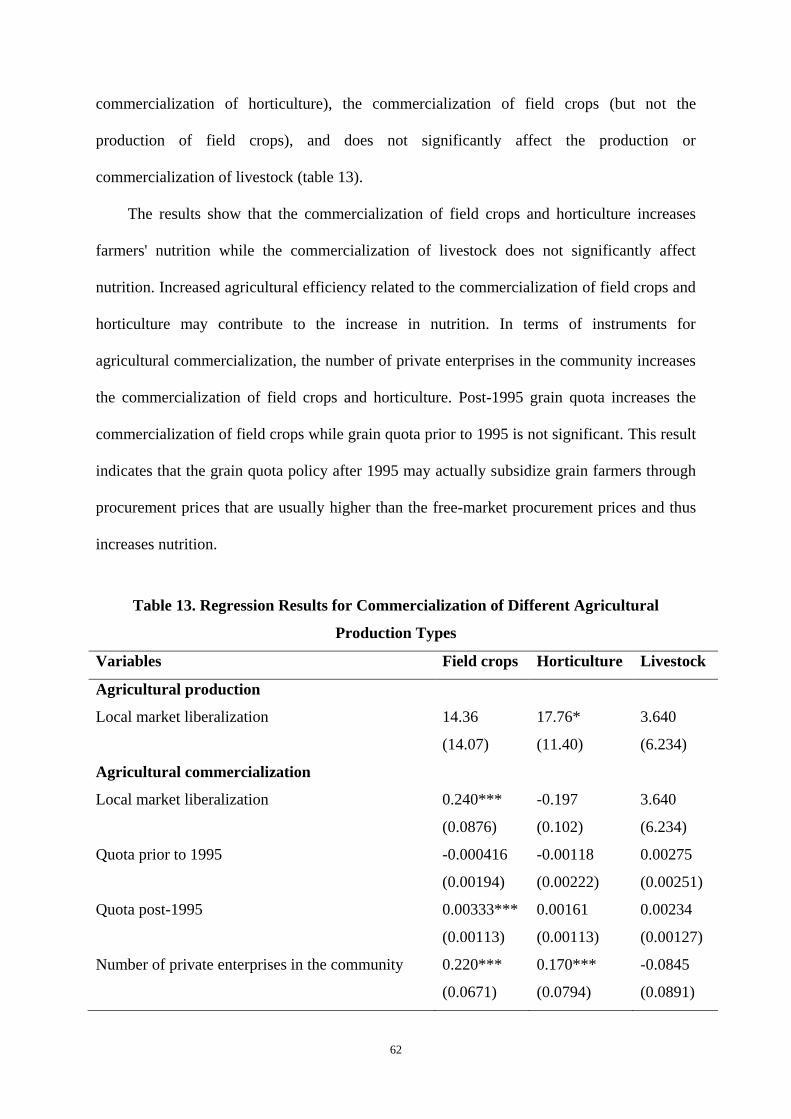
62
commercialization of horticulture), the commercialization of field crops (but not the
production of field crops), and does not significantly affect the production or
commercialization of livestock (table 13).
The results show that the commercialization of field crops and horticulture increases
farmers' nutrition while the commercialization of livestock does not significantly affect
nutrition. Increased agricultural efficiency related to the commercialization of field crops and
horticulture may contribute to the increase in nutrition. In terms of instruments for
agricultural commercialization, the number of private enterprises in the community increases
the commercialization of field crops and horticulture. Post-1995 grain quota increases the
commercialization of field crops while grain quota prior to 1995 is not significant. This result
indicates that the grain quota policy after 1995 may actually subsidize grain farmers through
procurement prices that are usually higher than the free-market procurement prices and thus
increases nutrition.
Table 13. Regression Results for Commercialization of Different Agricultural
Production Types
Variables Field crops Horticulture Livestock
Agricultural production
Local market liberalization 14.36 17.76* 3.640
(14.07) (11.40) (6.234)
Agricultural commercialization
Local market liberalization 0.240*** -0.197 3.640
(0.0876) (0.102) (6.234)
Quota prior to 1995 -0.000416 -0.00118 0.00275
(0.00194) (0.00222) (0.00251)
Quota post-1995 0.00333*** 0.00161 0.00234
(0.00113) (0.00113) (0.00127)
Number of private enterprises in the community 0.220*** 0.170*** -0.0845
(0.0671) (0.0794) (0.0891)

63
Table 13 (cont.)
Variables Field crops Horticulture Livestock
Household food security
Instrumented agricultural commercialization 0.157*** 0.00334*** -0.0379
(0.0695) (0.000422) (0.0955)
Observations 1149 1149 1149
Note: *, **, *** indicates significance level 15%, 10% and 5%. Standard errors are in parenthesis. County
and year dummies are included. The full regression results are in presented in the appendix, table A2.
One might be concerned that it is only the wealthier farmers who benefit from
agricultural liberalization. To test this hypothesis, I split the data into nourished and
undernourished households. I define undernourished households as those who consume less
than 20% of calories from non-staples following Jensen and Miller (2010). While the
counterpart households consume more than 20% of calories from non-staples. The regression
results in table 14 show that local market liberalization increases commercialization for
undernourished households while it does not significantly affect production or
commercialization of nourished households. More importantly, agricultural
commercialization positively affects household food security even after controlling for
income for undernourished households. Agricultural commercialization does not significantly
affect household food security for nourished households.
Table 14. Regression Results for Different Nourished Groups
Variables Undernourished Nourished
Agricultural production
Local market liberalization
16.69
(26.47)
22.57
(28.32)
Agricultural commercialization
Local market liberalization 0.391*** -0.0952

64
Table 14 (cont.)
Variables Undernourished Nourished
Household food security
(0.110) (0.105)
Instrumented agricultural commercialization 0.0806*
(0.0541)
0.100
(0.228)
Observations 687 507
Note: *, **, *** indicates significance level 15%, 10% and 5%. Standard errors are in parenthesis. All
regressions include county and year dummies. Full regression results are included in the appendix table
A3.
7.2 ROBUSTNESS TESTS
In this section, I run several robustness tests of my definition of farmers, my definition
of the market liberalization index, different nutritional measures, controlling changes in taste
and grain quota in the nutrition equation, and alternate model specifications. I find consistent
results that commercialization increases nutrition overall, and that commercialization
especially benefits undernourished households.
Because my definition of famers is arbitrary, I test the robustness of the model under
different definitions of farmers. In table 15, I use definition 2 for farmers who have greater
than 50% instead of 10% of their income from agriculture. Local market liberalization
contributes more to the agricultural commercialization of more agriculture-based farmers
because the coefficient of market liberalization on commercialization is 0.116 overall and
0.391 for undernourished households based on farmers definition 1 compared to 0.209 overall
and 0.428 for undernourished households based on definition 2. Agricultural
commercialization consistently increases the nutrition of households overall especially the
undernourished households. Market liberalization increases agricultural production overall
and for undernourished but not significantly. Market liberalization does not affect
commercialization or production significantly and commercialization does not affect nutrition

65
for nourished households.
Table 15. Robustness Tests of a Different Definition of Farmers13
Variables Overall Undernourished Nourished
Agricultural production
Local market liberalization 24.50 17.31 -8.887
(22.08) (29.41) (36.62)
Agricultural commercialization
Local market liberalization 0.209*** 0.428*** 0.0650
(0.0821) (0.115) (0.123)
Household food security
Instrumented agricultural commercialization 0.565*** 0.160** 0.221
(0.204) (0.0828) (0.297)
Observations 1194 687 507
Note: *, **, *** indicates significance level 15%, 10% and 5%. Standard errors are in parenthesis. All
regressions include county and year dummies. Full regressions can be found in the appendix table A4.
Because soybeans are primarily used as a feed and are highly traded, I test the
robustness of using a different local market liberalization index with soybeans, and again
separate the sample into undernourished and nourished households (table 16). I find
consistent results that agricultural commercialization increases nutrition overall, and
especially for undernourished households. Market liberalization increases agricultural
commercialization for undernourished when including soybeans in market liberalization
index. However, market liberalization does not significantly affect agricultural production
overall, for undernourished or nourished households. Compared to the main results in table
14, market liberalization decreases commercialization of nourished households which are
contrary to expectations and hard to explain.
13 The results for the other factors that affect agricultural production and household food security are similar to those of
3SLS regressions on agricultural production, commercialization and nutrition.

66
Table 16. Robustness Tests of a Different Local Market Liberalization Index14
Variables Overall Undernourished Nourished
Agricultural production
Local market liberalization -24.14 32.58 -139.8
(68.73) (100.4) (106.1)
Agricultural commercialization
Local market liberalization -0.105 1.267*** -1.416***
(0.272) (0.416) (0.391)
Household food security
Instrumented agricultural commercialization 0.425*** 0.0814* 0.174
(0.152) (0.0498) (0.242)
Observations 1194 687 507
Note: *, **, *** indicates significance level 15%, 10% and 5%. Standard errors are in parenthesis. All
regressions include county and year dummies. Full regressions can be found in the appendix table A5.
One may be concerned that the effects of market liberalization and commercialization on
household food security may vary by different nutritional measures. I test the robustness of
different nutritional measures including food diversity, household average caloric and protein
intake (tables 17, 18 and 19, respectively). Food diversity is measured as the number of food
groups consumed by the household on the interview day. There are 12 groups of food defined
by the Chinese Food Composition Table (1991): cereals, legumes, roots and stems,
vegetables, mushrooms, fruits, nuts and seeds, meats, milk, eggs, fish and other. I find
consistent results that market liberalization leads to more agricultural production and
commercialization overall and especially for the undernourished households. However,
commercialization does not increase food diversity for the undernourished. While
commercialization increases food diversity overall, it does not affect caloric or protein intake
significantly. Because there is no consensus on individual caloric intake threshold defining
fulfillment of nutritional needs and the income elasticity of calories sometimes are usaually
14 The results for the other factors that affect agricultural production and household food security are similar to those of
3SLS regressions on agricultural production, commercialization and nutrition.

67
found to be negative (Deaton and Drèze 2008; Zhai et al. 2007; Meng et al. 2008; Jensen and
Miller 2010). Therefore, caloric intake is not a good measure of household food security in
the data.
Table 17. Robustness Tests of Food Diversity
Variables Overall Undernourished Nourished
Agricultural production
Local market liberalization 36.14** 16.77 23.04
(18.65) (26.47) (28.34)
Agricultural commercialization
Local market liberalization 0.122* 0.390*** -0.101
(0.0747) (0.110) (0.105)
Household food security
Instrumented agricultural commercialization 0.0879*** 0.00560 0.0314
(0.0241) (0.0145) (0.0341)
Observations 1194 687 507
Note: *, **, *** indicates significance level 15%, 10% and 5%. Standard errors are in parenthesis. All
regressions include county and year dummies. Full regressions can be found in the appendix table A6.
Table 18. Robustness Tests of Household Average Caloric Intake
Variables Overall Undernourished Nourished
Agricultural production
Local market liberalization 36.62*** 16.72 22.91
(18.66) (26.47) (28.34)
Agricultural commercialization
Local market liberalization 0.118* 0.389*** -0.0950
(0.0747) (0.110) (0.105)
Household food security
Instrumented agricultural commercialization -8.787 2.621 -0.478
(8.778) (7.559) (17.15)
Observations 1194 687 507
Note: *, **, *** indicates significance level 15%, 10% and 5%. Standard errors are in parenthesis. All

68
regressions include county and year dummies. Full regressions can be found in the appendix table A7.
Table 19. Robustness Tests of Household Average Protein Intake
Variables Overall Undernourished Nourished
Agricultural production
Local market liberalization 36.63*** 16.68 22.90
(18.66) (26.47) (28.34)
Agricultural commercialization
Local market liberalization 0.117* 0.391*** -0.0946
(0.0747) (0.110) (0.105)
Household food security
Instrumented agricultural commercialization -0.126 0.282 0.00701
(0.292) (0.240) (0.635)
Observations 1194 687 507
Note: *, **, *** indicates significance level 15%, 10% and 5%. Standard errors are in parenthesis. All
regressions include county and year dummies. Full regressions can be found in the appendix table A8.
After testing different nutritional measures, I analyze if changes in taste and grain quota
will affect nutrition as well. I want to capture part of the change in consumers' taste by
including off-farm wage in the nutrition regression because it is possible that rural migrants
bring more information and knowledge about nutrition to their rural family and thus change
their consumption taste. Grain quotas may reflect general agricultural tax burden on the
household and thus affect nutrition. To address these concerns, I run the regressions
controlling for off-farm wage (table 20) and grain quota in the nutrition equation (table 21).
Both tables 20 and 21 generate consistent regression results that market liberalization
increases agricultural production and commercialization overall and especially the
commercialization of undernourished households. Commercialization increases nutrition
overall and for undernourished households using both specifications although the effect of
commercialization on nutrition is not significant for undernourished households when

69
including grain quotas in the nutrition equation (table 21). Off-farm wage increases nutrition
overall and for undernourished households while grain quotas do not significantly affect
nutrition overall, for undernourished or nourished households. It is likely that grain quotas
can only affect nutrition through commercialization. Therefore, when putting grain quotas in
the nutrition equation explicitly, I find that grain quotas do not significantly affect nutrition
directly.
Table 20. Robustness Tests Controlling Off-farm Wage in the Nutrition Equation
Variables Overall Undernourished Nourished
Agricultural production
Local market liberalization 36.41** 16.68 22.63
(18.66) (26.47) (28.34)
Agricultural commercialization
Local market liberalization 0.122* 0.396*** -0.0987
(0.0745) (0.110) (0.105)
Household food security
Instrumented agricultural commercialization 0.445*** 0.0865* 0.107
(0.159) (0.0537) (0.230)
Off-farm wage 0.286*** 0.106** 0.0715
(0.0946) (0.0583) (0.133)
Observations 1194 687 507
Note: *, **, *** indicates significance level 15%, 10% and 5%. Standard errors are in parenthesis. All
regressions include county and year dummies. Full regressions can be found in the appendix table A9.
Table 21. Robustness Tests Controlling Grain Quota in the Nutrition Equation
Variables Overall Undernourished Nourished
Agricultural production
Local market liberalization 36.29** 16.88 22.35
(18.65) (26.46) (28.33)
Agricultural commercialization
Local market liberalization 0.110* 0.379*** -0.0965

70
Table 21 (cont.)
Variables Overall Undernourished Nourished
(0.0749) (0.111) (0.105)
Household food security
Instrumented agricultural commercialization 0.555*** 0.0798 -0.0710
(0.177) (0.0639) (0.271)
Grain quota prior to 1995 -0.000352 0.0000593 0.000223
(0.00147) (0.000557) (0.00218)
Grain quota post to 1995 0.000861 -0.0000861 -0.00101
(0.00110) (0.000410) (0.00179)
Observations 1194 687 507
Note: *, **, *** indicates significance level 15%, 10% and 5%. Standard errors are in parenthesis. All
regressions include county and year dummies. Full regressions can be found in the appendix table A10.
Because the variables included only in the commercialization equation (equation 4) but
not in the nutrition equation (equation 5) are instruments for commercialization. Therefore, I
have to include off-farm work opportunities and local market liberalization in both the
commercialization and the nutrition equations for off-farm work opportunities and local
market liberalization not to be instruments but explanatory variables for commercialization.
The regression results show that local market liberalization and off-farm work opportunities
do not affect nutrition. As a result, I exclude local market liberalization in the nutrition
equation and treat market liberalization as an additional instrument for commercialization.
This new set of instruments including grain quota prior to 1995, grain quota post 1995,
number of enterprises in the community and local market liberalization seems to be valid,
with p-value of 0.5535 in Hansen's overidentification test. I then analyze the relation between
agricultural production, commercialization and nutrition by nourishment (table 22) and by
different agricultural production type (table 23). Table 22 presents consistent results with the
main results (table 14) that market liberalization increases agricultural production overall and
commercialization of undernourished households. Table 22 also suggests that agricultural

71
commercialization increases nutrition overall and especially for undernourished households.
When analyzing the regression results by different agricultural production types (table 23), I
find that market liberalization increases agricultural production and the commercialization of
field crops and the production of horticulture consistently. The commercialization of field
crops and horticulture increases nutrition. It is likely that compared to livestock production,
which needs a lot of up-front capital investment and many poor Chinese farmers cannot
afford, labor-intensive field crops or horticulture production are to Chinese farmers'
comparative advantage. Therefore, the commercialization of field crops and horticulture
increases agricultural efficiency and thus household's nutrition.
Table 22. Robustness Tests Excluding Market Liberalization in the Nutrition Equation
by Nourishment
Variables Overall Undernourished Nourished
Agricultural production
Local market liberalization 36.23** 16.71 18.71
(18.65) (26.46) (28.00)
Agricultural commercialization
Local market liberalization 0.0636 0.391*** -0.121
(0.0652) (0.105) (0.101)
Household food security
Instrumented agricultural commercialization 0.338*** 0.0816*** 0.182
(0.130) (0.0374) (0.223)
Observations 1194 687 507
Note: *, **, *** indicates significance level 15%, 10% and 5%. Standard errors are in parenthesis. All
regressions include county and year dummies. Full regressions can be found in the appendix table A11.

72
Table 23. Robustness Tests Excluding Market Liberalization in the Nutrition Equation
by Agricultural Production Type
Variables Field crops Horticulture Livestock
Agricultural production
Local market liberalization 13.55 17.66* 3.624
(14.04) (11.40) (6.233)
Agricultural commercialization
Local market liberalization 0.221*** -0.185 0.158
(0.0850) (0.100) (0.112)
Household food security
Instrumented agricultural commercialization 0.127*** 0.121*** -0.0237
(0.0631) (0.0606) (0.0885)
Observations 1194 1194 1194
Note: *, **, *** indicates significance level 15%, 10% and 5%. Standard errors are in parenthesis. All
regressions include county and year dummies. Full regressions can be found in the appendix table A12.
Next, I use off-farm work opportunities in addition to grain quotas and the number of
private enterprises in the community as instruments for commercialization. This new set of
instruments seem to be valid with p-value of 0.3910 for Hansen's overidentification test of all
instruments. I analyze the relation between agricultural production, commercialization and
nutrition by nourishment (table 24) and by agricultural production type (table 25). From table
24, I find consistent results that market liberalization increases agricultural production and
commercialization for overall and undernourished households. Agricultural
commercialization increases nutrition for overall and undernourished households although
the coefficient loses some significance for undernourished households. From table 25, I also
find consistent results that the commercialization of horticulture increases nutrition.

73
Table 24. Robustness Tests Excluding Off-farm Work Opportunities in the Nutrition
Equation by Nourishment
Variables Overall Undernourished Nourished
Agricultural production
Local market liberalization 36.36** 16.69 22.80
(18.66) (26.47) (28.34)
Agricultural commercialization
Local market liberalization 0.114* 0.392*** -0.0939
(0.0746) (0.110) (0.105)
Household food security
Instrumented agricultural commercialization 0.388*** 0.0717 -0.137
(0.134) (0.0512) (0.115)
Observations 1194 687 507
Note: *, **, *** indicates significance level 15%, 10% and 5%. Standard errors are in parenthesis. All
regressions include county and year dummies. Full regressions can be found in the appendix table A13..
Table 25. Robustness Tests Excluding Off-farm Work Opportunities in the Nutrition
Equation by Agricultural Production Type
Variables Field crops Horticulture Livestock
Agricultural production
Local market liberalization 14.46 17.75* 3.664
(14.07) (11.40) (6.233)
Agricultural commercialization
Local market liberalization 0.243*** -0.198 0.166*
(0.0876) (0.112) (0.112)
Household food security
Instrumented agricultural commercialization 0.0735 0.146*** -0.0899
(0.0615) (0.0539) (0.0670)
Observations 1194 1194 1194
Note: *, **, *** indicates significance level 15%, 10% and 5%. Standard errors are in parenthesis. All
regressions include county and year dummies. Full regressions can be found in the appendix table A14.
Last, instead of using county dummies in the regressions, I test the robustness of using

74
provincial dummies by nourishment (tables 26) and by agricultural production type (table 27).
I obtain consistent regression results that market liberalization increases commercialization
for overall and undernourished households. Subsequently, commercialization increases
nutrition overall and undernourished households. When separating the sample into different
agricultural production types, market liberalization increases the commercialization of field
crops and production of horticulture as the main results (table 13). The commercialization of
field crops increase nutrition while that of horticulture loses its significance. Different from
the main results, market liberalization increases agricultural production for nourished
households and market liberalization increases the commercialization of livestock.
Table 26. Robustness Tests Using Provincial Dummies by Nourishment
Variables Overall Undernourished Nourished
Agricultural production
Local market liberalization 11.45 -33.20** 41.60**
(14.47) (18.84) (22.59)
Agricultural commercialization
Local market liberalization 0.130*** 0.383*** -0.0725
(0.0597) (0.0837) (0.0894)
Household food security
Instrumented agricultural commercialization 0.688*** 0.117* 0.0556
(0.226) (0.0742) (0.176)
Observations 1194 687 507
Note: *, **, *** indicates significance level 15%, 10% and 5%. Standard errors are in parenthesis. All
regressions include county and year dummies. Full regressions can be found in the appendix table A15.
Table 27. Robustness Tests Using Provincial Dummies by Agricultural Production Type
Variables Field crops Horticulture Livestock
Agricultural production
Local market liberalization 0.950 13.98* -3.929
(10.81) (8.814) (4.769)

75
Table 27 (cont.)
Variables Field crops Horticulture Livestock
Agricultural commercialization
Local market liberalization 0.182*** -0.0000116 0.178***
(0.0714) (0.0822) (0.0866)
Household food security
Instrumented agricultural commercialization 0.118*** -0.110 -0.0189
(0.0584) (0.0737) (0.113)
Observations 1194 1194 1194
Note: *, **, *** indicates significance level 15%, 10% and 5%. Standard errors are in parenthesis. All
regressions include county and year dummies. Full regressions can be found in the appendix table A16.

76
CHAPTER 8
DISCUSSION
The regression results are informative for poverty alleviation. I find that market
liberalization, and the commercialization of field crops and horticulture may be good ways to
help the rural poor out of poverty in China. Markets allow households to boost their income
by producing agricultural products which provide the highest returns to their resources and
using the income to buy consumption goods. Market liberalization and commercialization
increase nutrition overall and especially for the households who are food insecure. Other
literature provides some reasons why the commercialization of field crops and horticulture
and the commercialization for poor households increases nutrition while the
commercialization of livestock, and the commercialization for nourished households do not.
First, contrary to many developing countries where households experience increased
production and price risks with higher commercialization, production risk of field crops and
horticulture is less likely in China (Huang and Rozelle 2009). A large part of China’s land
(48%) is irrigated (NSBC 2001). Most households (about 78%) have at least one family
member earning income off-farm based on the CHNS data. The main risk for Chinese
farmers comes from non-traditional sources, such as off-farm work wage and policy risks
(Giles 2000). Most Chinese farmers buffer this risk by striking a balance between cash
cropping and complimentary sources of income such as off-farm income, the seasonal cycles
of which are not synchronized with their cropping season. Livestock price risk is much higher
than that of horticulture and field crops because of livestock's longer production cycle and lag
in response to market demand. Based on CHNS data, the price of pork, chicken, beef and
lamb doubled in 1997 compared to 1993 and dropped by one third in 2000 compared to 1997.
Conversely, the price of rice, wheat, corn, soybeans or vegetables remained stable in the same
period.

77
Second, field crops and horticulture production are relatively more labor intensive
compared to livestock production and, thus, the production and the commercialization of field
crops and horticulture suit China's comparative advantage. The technology or capital required
for producing and commercializing field crops and horticulture are less than for livestock. In
the CHNS data, there are 7 mu of land and 4 people in an undernourished household
compared to 5.6 mu of land and 3.5 people in a nourished household, on average. Relatively
more endowed with labor and land than capital, poor farmers are able to produce and
commercialize more of their field crops and horticulture to their own comparative advantage
than richer farmers, increase agricultural production efficiency, and thus, nutrition.
Third, market liberalization reduces transactions cost and enables farmers to
commercialize agricultural products, increase agricultural efficiency and thus nutrition. Most
of the Chinese farmers are relatively equally entitled to a small piece of land (the mean area
of land is 6.4 mu with the maximum of 35.9 mu in the sample) and disorganized (only 0.5%
of community has cooperatives in the sample period), small traders and open markets in the
nearest urban centers are usually the marketing channel of smallholders in China. It is much
more expensive for supermarkets to procure products directly from farmers given their
atomistic sizes and the absence of farmers' organizations. Instead, most of the supermarkets
procure from small traders rather than farmers directly (Wang et al. 2009). Thus, poor
farmers can cut their transactions cost and participate in agricultural commercialization with
the help of small traders.
Fourth, China was a relatively poor country and consumers had a low premium for food
safety in the sample period. In the small trader-dominated system, Wang et al. (2009) found
there is little or no effort made to enforce quality or safety standards directly on producers.
The average household income was 2000 dollars in the 1990s based on the CHNS. Although
there was a rising urban middle class, many of them were increasingly stressed with housing,

78
health care, education and automobiles ownership along with the privatization of SOEs and
the elimination of housing, education and health care welfare associated with SOEs workers
(Meng, Gong and Wang 2008). Therefore, urban consumers had a low premium for food
safety, which allowed poor farmers without knowledge or facilities to enforce food safety to
participate in agricultural commercialization through small traders and increase agricultural
efficiency, income and nutrition.
Last, the concentration of land and land displacement of some poor farmers as a result of
commercialization that occurred in some developing countries (Dewey 1989) were not likely
to happen in China in the 1990s as most farmers were entitled a piece of land by HRS and the
land was owned by the village instead of individual farmers. Thus, farmers did not have the
right to lease, rent, sell or buy the land.
The massive increase in agricultural production and commercialization (agricultural
commercialization rose from 52% to 71% from 1991 to 2000) were caused at least in part by
the substantial market liberalization in the same time period. Agricultural production
increased by 36.38 yuan and commercialization increased by 0.116% when market
liberalization increased by 1 unit.15
Market liberalization links poor farmers with few
resources to the external markets, and leads farmers to produce comparatively advantageous
products for niche markets, thus, increasing agricultural commercialization, efficiency,
income, and access to food, especially for the poor. Based on my regression results, a 10%
increase in commercialization leads to 4.29% increase in share of calories from non-staples
(SCNS), almost the same as the calories from a banana. Specifically, a 10% increase in the
commercialization of field crops and horticulture results in 1.57% and 1.29% increase in
SCNS respectively. A 10 % increase in commercialization leads to 0.806% increase in SCNS
for undernourished households.
15 Market liberalization is defined in equation 1. For simplicity, 1 unit increase in market liberalization means the price
difference either between community and region or between region and world decreases by 1 yuan/kg.

79
CHAPTER 9
CONCLUSION
In this thesis, I explore the relation between agricultural production, commercialization
and nutrition. I first use the sum of squared price differences between the local community
and regional market, and the squared price differences between regional markets and the
border to identify local market liberalization. I find that local access to markets and
communication facilities contribute to local market liberalization. After identifying local
market liberalization, I analyze the relation between agricultural production,
commercialization and nutrition based on a three-stage-least-squares regression. I
consistently find that the market liberalization increases agricultural production and
commercialization. Commercialization increases nutrition overall and especially for the
households who are food insecure to start with. Specifically, the commercialization of field
crops and horticulture increases nutrition while livestock does not.
Based on the concepts of NRA's and NRAf's from Huang et al. (2009), I calculate the
degree of local market liberalization by including both the squared difference between
community price and regional price, and the squared difference between regional price and
world price for 6 different agricultural products. This local market liberalization takes
accounts of regional heterogeneity and transactions cost as well as how much is the local
market integrated with the world market. I then explore what are the factors affecting local
market liberalization. Access to markets and communication facilities in the community are
found to increase local market liberalization significantly.
I find that market liberalization increases agricultural production and commercialization.
During the 1980s and early 1990s, poor marketing and transportation infrastructure were
major constraints affecting food supply in China (Nyberg and Rozelle 1999). My thesis
shows that market liberalization improved significantly since then. Local market

80
liberalization promoted by massive price, market, trade reforms and infrastructure
construction in the 1990s increased agricultural production and commercialization.
Although agricultural commercialization may expose farmers to more price risks and
some of the farmers may be constrained from switching production, these negative effects of
commercialization appear to be largely associated with livestock commercialization in China.
My study shows that the commercialization of field crops and horticulture increases
household food security, particularly for poor farmers. The price risk of livestock production
is found be to be much higher than that of field crops and horticulture production in the
CHNS data in the 1990s due to the longer production cycle of livestock production and lag in
the response to demand. Besides, the production and price risk of field crops and horticulture
is mitigated by vast irrigation systems and off-farm income as an complimentary source of
income in addition to cash cropping in rural China.
Poor farmers are relatively more endowed with labor and/or land for agriculture
compared to richer farmers and thus, have a comparative advantage in producing field crops
and/or horticulture. With the introduction of HRS in 1978, every household in China was
entitled to a relatively equal piece of land. Poor households also have lower off-farm work
opportunities (poor households can supply more farm labor). Therefore, compared to
livestock production which requires a lot of up-front capital investment and knowledge, field
crops and horticulture production have lower entry barriers and reduce the switching cost for
poor farmers from subsistence cropping to cash cropping.
With the development of market liberalization, small traders serve as the main
mechanism to procure products from farmers (Wang et al. 2009). Since 1978, market
liberalization allows small traders to procure agricultural products along with state stores.
Small traders are much more efficient and profit-seeking than state stores. It is more
advantageous for local small traders than big supermarkets to procure directly from local

81
farmers and reduce the poor farmers' transactions cost to commercialize. As a result, the
system of small traders dominated the procurement system of agricultural products. Small
traders help poor farmers to produce and commercialize their agricultural products at a lower
transaction cost, increase agricultural efficiency and nutrition. Although there is barely any
inspection or monitoring on food safety or quality of the procured products by small traders,
low premium of food safety by urban consumers facilitates the commercialization of poor
farmers.
After presenting the main results, I run several robustness tests of my definition of
farmers, my definition of the local market liberalization index, different nutritional measures,
controlling changes in taste and grain quota in the nutrition equation, and different model
specifications. I generally find consistent results. Specifically, when I restrict my definition
of farmers to be those producers who have greater than 50% of their income from
agriculture (instead of 10%), I observe stronger results. Local market liberalization
contributes more to the agricultural commercialization of more agriculture-based farmers.
When I test the robustness of nutritional measures, the effects of agricultural
commercialization on the average household caloric intake is not significant. Because there is
no consensus on individual caloric intake threshold defining fulfillment of nutritional needs
and the income elasticity of calories sometimes are found to be negative (Deaton and Drèze
2008; Meng, Gong and Wang 2008; Jensen and Miller 2010). Therefore, I conclude that
caloric intake is not a good measure of nutrition in the data.
In conclusion, agricultural market liberalization, the commercialization of field crops
and horticulture are good ways to level undernourished rural households from poverty and
increase their household food security in China. Therefore, it is advisable for policy makers
to promote agricultural market liberalization further by increasing access to markets locally
along with massive rural infrastructure investment and more liberalized agriculture policies.

82
More liberalized markets lead to higher agricultural production and commercialization, and
then better nutrition of households.
The regression results suggest that the commercialization of horticulture and field crops
is a good way to alleviate poverty especially for those who have less off-farm income, poor
human capital and lack of credit. It is important to help farmers produce to their comparative
advantage. While poor farmers are endowed with more land and labor generally in the sample
provinces, the situation is different in other provinces, like the grassland areas of Inner
Mongolia, Xinjiang, Qinghai and Tibet, where farmers are more land intensive and there is
little arable land and vast pastures. In these areas, the commercialization of field crops and
horticulture may not be as effective as in other provinces.
Contrary to the common promotion of modern supply chains such as supermarkets,
small traders may be better to fit in Chinese farming characterized by small household land
holdings and lack of rural cooperatives. Small traders may have a crucial role in helping poor
farmers participate in agricultural commercialization and thus improve their nutrition.
As a measure of nutrition or household food security, average household caloric intake
is not as informative as SCNS. SCNS offers several advantages, such as avoiding the problem
of individual-varying and unobservable thresholds, imperfect absorption, and a consistency
with revealed preferences. Compared with food diversity measured by food count, SCNS is
better because it is continuous and more sensitive to capture the change in households'
nutrition.
This thesis has some limitations which may lead to interesting future research. First, so
far I identify the relation between agricultural production, commercialization and nutrition
mostly from the production side. Because there is an increasing trend that farmers consume
more of their food from stores instead of their own harvests (Barrett 2011), it is interesting to
see how the change in market liberalization affects food prices and thus, households’
83
nutrition. Second, my study of agricultural market liberalization only involves output markets
instead of input markets due to data limitation. Future research may study how input market
liberalization including credit, land, and labor markets affect farmers' production and
commercialization decisions and, thus, their welfare. Third, one may be concerned that
specialization associated with commercialization may decrease households' nutrition due to
higher price and income risk. Because the CHNS does not provide specific crops or animals
the household produces, I cannot estimate the effects of specialization on households'
nutrition. It is interesting to see the relation between agricultural production,
commercialization, specialization and nutrition.

84
REFERENCES
Ali, M. and U. Farooq. Diversified Consumption to Boost Rural Labor Productivity Evidence
from Pakistan. Asian Vegetable Research and Development Center, Discussion Paper,
2003.
Anderson, K., M. Kurzweil, W. Martin, D. Sandri, and F. Valenzuela. Measuring Distortions
to Agricultural Incentives, Revisited. World Trade Review, 7(3), 2008.
Barrett, C.. Food Prices and the Poor: the Differential Welfare Effects of Price Levels and
Volatility. Paper presented at International Agricultural Trade Research Consortium
General Meeting, St. Petersburg FL, December 11, 2011.
Bouis, H., K. M. DeWalt, E. Kennedy, P. Pinstrup-Andersen, I. Nieves and J. Von Braun. A
Common Framework for Research on the Income and Nutrition Effects of Increasing
Commercialization of Semi-subsistence Agriculture. International Food Policy Research
Institute, Washington DC, 1984.
Bouis, H. E. and L.J. Haddad. Effects of Agricultural Commercialization on Land Tenure,
Household Resource Allocation and Nutrition in the Philippines. IFPRI Research Report
79. International Food Policy Research Institute, Washington, DC, 1990.
Cui, X.. Unified Procurement, Unified Sales and Industrial Accumulation. Journal of Chinese
Economic History, 4, 1988.
Deaton, A. and J. Drèze. Nutrition in India: Facts and Interpretations, mimeo, Princeton
University, Princeton, NJ, 2008.
de Brauw, A. and R. Mu. Migration and the Overweight and Underweight Status of Children
in Rural China. Food Policy, 36(1), 88-100, 2011.
Dewey, K.. Nutrition and the Commoditization of Food Systems in Latin America and the
Caribbean. Social Science Medicine, 28, 415-424, 1989.
DFID. Better Livelihoods for Poor People: the Role of Agriculture. Department for
International Development, UK, 2002.
Dixit, Avinash, “Models of Dual Economies,” in James Mirrlees and Nicholas Stem, ed.
Models of Economic Growth. New York: Macmillan, 1973.
Fleuret, P. and A. Fleuret. Social Organization, Resource Management and Child Nutrition in
the Taita Hills, Kenya. American Journal of Physical Anthropology, 93, 91-114. 1991.
Gale, F., B. Lohmar and F. Tuan. China's New Farm Subsidies. Washington DC: U.S.
Department of Agriculture, Economic Research Services, WR8-06-01, 2006.
Giles, J.. Risk and Rural Responses in China. Working paper, Dept. of Agr. Econ. Michigan
State University, East Lansing, MI, 2000.
Goldberg K. P. and N. Pavcnik. Trade, Inequality, and Poverty: What Do We Know ?
Evidence from Recent Trade Liberalization Episodes in Developing Countries. NBER
working paper 10593, 2004.

85
Govereh, J. and T.S. Jayne. Cash Cropping and Food Crop Productivity: Synergies or
Trade-offs? Agricultural Economics, 28, 39-50, 2003.
Gross, D. B. and B. Underwood. Technological Change and Calorie Costs: Sisal Agriculture
in Northeastern Brazil. American Journal of Physical Anthropology, 73, 725-740, 1971.
Haaga J.. J. Mason, F. Z. Omoro, V. Quinn, A. Rafferty, K. Test. and L. Wasonga. Child
Malnutrition in Rural Kenya a Geographic and Agricultural Classification. Ecology of
Food and Nutrition, 18, 297 -307, 1986.
Helble, M., B. Shepherd, and J.S. Wilson. Transparency and Regional Integration in the Asia
Pacific. World Economy, 32(3), 479-508, 2009.
Hertel, W. T., M. Ivanic, P.V. Preckel, J. A.L. Cranfield and W. Martin. Short- Versus
Long-Run Implications of Trade Liberalization for Poverty in Three Developing
Countries. American Journal of Agricultural Economics, 85(5), 1299-1306, 2003.
Hertel, W. T., M. Ivanic, P.V. Preckel, and J. A.L. Cranfield. The Earnings Effects of
Multilateral Trade Liberalization: Implications for Poverty. The World Bank Economic
Review, 18(2), 205-236, 2004.
Hsu, H. and F. Gale. Agriculture and Trade Report WRS-01-2. Washington D.C : Market and
Trade Economics Division, Economic Research Services, U.S. Department of
Agriculture, 2001.
Huang, J.. Agricultural Policy and Food Security in China (mimeo). Beijing: Center for
Chinese Agricultural Policy, Chinese Academy of Sciences, 2001.
Huang, J. and C. Chen. Effects of Trade Liberalization on Agriculture in China: Institutional
and Structural Aspects. Bogor, Indonesia: United Nations ESCAP CGPRT Centre, 1999.
Huang J., Y. Liu, W. Martin, and S. Rozelle. Changes in Trade and Domestic Distortions
Affecting China’s Agriculture. Food Policy, 407-416, 2009.
Huang, J. and S. Rozelle. The Nature of Distortions to Agricultural Incentives in China and
Implications of WTO Accession. Working paper, Beijing, China: Center for Chinese
Agricultural Policy, Chinese Academy of Sciences, 2002.
Huang J. and S. Rozelle. Agricultural Development, Nutrition, and the Policies Behind
China's Success. Asian Journal of Agriculture and Development, 7(1), 1-34, 2009.
Huang J., S. Rozelle and M. Chang. Tracking Distortions in Agriculture China and Its
Accession to the World Trade Organization. The World Bank Economic Review, 18(1),
59-84, 2004.
Huang J., S. Rozelle, W. Martin, and Y. Liu. Distortions to Agricultural Incentives in China.
Working paper, Beijing, China: Center for Chinese Agricultural Policy, Chinese
Academy of Sciences, December 2007.
Huang J., S. Rozelle and H. Wang. Fostering or Stripping Rural China: Modernizing
Agricultural and Rural to Urban Capital Flows. The Developing Economics. 24(1), 1-26.
2006.

86
Huang J., S. Rozelle and Y. Xie. Distortions at the Border; Integration Inland: Assessing the
Effect of WTO Accession on China's Agriculture. Journal of Chinese Economic and
Business Studies, 1(1), 97–116, 2003
Immink M. and J. Alarcon. Household Food Security Nutrition and Crop Diversification
among Smallholder Farmers in the Highlands of Guatemala. Ecology of Food and
Nutrition. 15,287-305, 1991.
Jensen T. R. and N. H. Miller. A Revealed Preference Approach to Measuring Hunger and
Undernutrition. NBER working paper 16555, 2010.
Jones-Smith J. C. and B. M. Popkin. Understanding Community Context and Adult Health
Changes in China: Development of an Urbanicity Scale. Social Science & Medicine, 71,
1436-1446, 2010.
Ke, B.. China's Grain Market and Policy (in Chinese). Beijing: China Agricultural Press,
1995.
Kennedy, E.. The Effects of Sugarcane Production on Food Security, Health and Nutrition in
Kenya. Washington, DC: International Food Policy Research Institute, IFPRI Research
Report 78, 1989.
Kennedy, J. J.. From the Tax-for-Fee Reform to the Abolition of Agricultural Taxes: The
Impact on Township Governments in North-west China. The China Quarterly, 189,
43-59, 2007.
Kennedy, E. and B. Cogill. Income and Nutritional Effects of the Commercialization of
Agriculture in Southwest Kenya. Washington DC: International Food Policy Research
Institute, IFPRI Research Report 63, 1987.
Kennedy, E. and L. Haddad. Are Pre-schoolers from Female-headed Households Less
Malnourished? A Comparative Analysis of Results from Ghana and Kenya. Journal of
Development Studies, 30(3), 680 - 695, 1994.
Kurth, A.. Agricultural Development and Nutritional Status in Malawi. Journal of Tropical
Pediatrics, 35(5), 250-254. 1989.
Lin, J. Y., F. Cai, and Z. Li. The Social Outcomes of China’s Economic Reform. Beijing:
China Center for Economic Research, Beijing University, 1997.
Lin, J.Y. and M. Liu. Rural Informal Taxation in China: Historical Evolution and an Analytic
Framework. China & World Economy, 15(3), 1-18, 2007.
Lin, J.Y. and Y. Yao. Chinese Industrialization in the Context of the East Asian Miracle. In
J.E. Stiglitz and S. Yusuf e.d. Rethinking the East Asian Miracle. Washington DC:
World Bank Press, 143-196, 2001.
Lipton, M.. Why Poor People Say Poor: Urban Bias in World Development, London: Temple
Smith, 1977.

87
Lu, F.. Three Grain Surpluses: Evolution of China's Grain Price and Marketing Policies,
1978–1999. Paper presented at the Symposium on China's Agricultural Trade and Policy:
Issues, Analysis and Global Consequences, San Francisco CA, June 25–26, 1999.
Luo, R., C. Liu, L. Zhang, and S. Rozelle. Investing in Rural China: A Report on a Survey of
Public Infrastructure Investment. Working paper, Beijing: Center for Chinese
Agricultural Policy, Institute of Geographical Sciences and Natural Resource Research,
Chinese Academy of Sciences, China, 2007
Masanjala, W.H.. Cash Crop Liberalization and Poverty Alleviation in Africa: Evidence from
Malawi. Agricultural Economics, 35(2), 231–240, 2006.
Mangyo, E.. Who Benefits More from Higher Household Consumption? The Intra-household
Allocation of Nutrients in China. Journal of Development Economics, 86(2), 296-312,
2008.
McCorriston, S. and D. MacLaren. The Trade and Welfare Effects of State Trading in China
with Reference to COFCO. The World Economy, 615-634, 2010.
Meng X., X. Gong and Y. Wang. Impact of Income Growth and Economic Reform on
Nutritional Availability in Urban China: 1986-2000. Economic Development and
Cultural Change, 57(2), 261-295, 2009.
Miller, C., O. Morrissey, N. Rudaheranwa. Policy and Non-Policy Barriers to Trade and
Implicit Taxation of Exports in Uganda. Journal of Development Studies, 37(2), 67-89,
2000.
MOFTEC [Ministry of Foreign Trade and Economic Cooperation], Individual Action Plan on
Trade and Investment Liberalization and Facilitation 1998 of the People’s Republic of
China. Unpublished document, MOFTEC, Beijing, China, 1998.
Mukeherjee, A. and X. Zhang. Rural Industrialization in China and India: Role of Policies
and Institutions. World Development, 35(10), 1621-1634, 2006.
National Development and Reform Commission (NDRC).The Policy Announcements for
Tariff Rate Quotas for Agricultural Products 2000-2011 (in Chinese). Access through
www.sdpc.gov.cn on 05/22/2012.
National Statistical Bureau of China (NSBC). China Statistical Yearbook. Various issues,
1985-2009. Beijing: China Statistical Press.
Nyberg, A. and S. Rozelle. Accelerating China’s Rural Transformation. Washington DC: The
World Bank, 1999.
Paolisso M.J., K. Hallman, L. Haddad, and S. Regmi. Does Cash Crop Adoption Detract
from Child Care Provision? Evidence from Rural Nepal. Economic Development and
Cultural Change 50, 313-317, 2002.
Park A., H. Jin, S. Rozelle, and J. Huang. Market Emergence and Transition: Arbitrage,
Transaction Costs, and Autarky in China's Grain Markets. American Journal of
Agricultural Economics, 84(1), 67-82, 2002.

88
Qiu, M., W. Wang and F. Yuan. The Changes of International Trade Policy of Agricultural
Products after China's Accession to WTO (in Chinese). China Soft Science, 3, 14-19,
2003.
Rosen, D., J. Huang, and S. Rozelle. Roots of Competitiveness: China’s Evolving Agriculture
Interests. Washington DC: Institute for International Economics, Policy Analysis in
International Economics, 72, 2004.
Rubin, D. S. and P. Webb. The Nutrition Effects of Changing Patterns of Cash Cropping in
the Gambia and Kenya: Intrahousehold Processes and the Role of Women. Paper
presented in the Symposium on Cash copping and Nutrition, Annual Meeting of the
United Nations Agency Committee on Coordination: Sub-Committee for Nutrition.
Geneva. February 1988.
Sah, R. and Stightz J.. The taxation and pricing of agricultural and industrial goods in
developing countries, in: D. M. G. Newbery and N. H. Stem, eds, The Theory of
Taxation for Developing Countries, New York: Oxford University Press and World
Bank, 1987.
Shea, E. Y. P.. Understanding China's Grain Procurement Policy from a Perspective of
Optimization. China Economic Review, 21, 639-649,2010.
Sicular, T.. Ten Years of Reform: Progress and Setbacks in Agricultural Planning and Pricing.
In Y. Y. Kueh and R.F. Ash ed. Economic Trends in Chinese Agriculture: the Impact of
Post-Mao Reforms. Oxford: Clarendon Press, 47-96, 1993.
Von Braun J.. Effects of Technological Change in Agriculture on Food Consumption and
Nutrition: Rice in a West African Setting. World Development, 16, 1083-1098, 1988.
Von Braun J.. The World Food Situation: New Driving Forces and Required Actions.
Washington DC: International Food Policy Research Institute, 2007.
Von Braun J., D. Hotchkiss and M. Immink. Non-Traditional Export Crops in Guatemala:
Effects of Production, Income and Nutrition. Washington DC: International Food Policy
Research Institute, IFPRI Research Report 73, 1989.
Von Braun J. and M. Immink. Agriculture-nutrition Linkages When Agriculture Changes
Toward Commercialization: Guatemala in Proceedings of the Agriculture Nutrition
Linkage Workshop. 2, 97-122, Tucson: University of Arizona Office of Arid Land
Studies, 1990.
Von Braun J. and E. Kennedy. Commercialization of Subsistence Agriculture: Income and
Nutritional Effects in Developing Countries. Washington, DC: International Food Policy
Research Institute, 1986.
Von Braun, J. and P. Webb. Famine and food security in Ethiopia: Lessons for Africa.
Oxford: Blackwell Ltd., 1994.
Wang H., X. Dong, S. Rozelle, J. Huang. and T. Reardon. Producing and Procuring
Horticultural Crops with Chinese Characteristics: The Case of Northern China. World
Development, 37(11), 1791–1801, 2009.

89
World Bank. Reaching the Rural Poor: A Rural Development Strategy for the Latin
American and Caribbean Region. Washington, DC., 2002.
WTO. Accession of the People’s Republic of China (Decision of 10 November 2001, WT⁄ L ⁄
432Z). Geneva: World Trade Organization, 2001.
Wu, Z., and S. McErlean. Market Efficiency in the Reformed Chinese Grain Marketing
System. China Economic Review, 14(2), 115−130, 2003.
Yan, R.. A Study on China’s Industrial-agricultural Price Scissors. Beijing: People’s
University Press, 1988.
Yao, Y. Non-state Factors and Technical Efficiency of the Chinese Industry. Economic
Research (in Chinese), (12):29–35, 1998.
Zeng Y., Y. Lu, W. Chen, Y. Zhu, T. Wang, Z. Wang, X. Pang, and L. Zhou. The
Institutional Change in the Distribution System of Agricultural Products in China (in
Chinese). Paper presented at the WTO and East Asia Agriculture Development
Conference, Beijing, 2004.
Zhang, G.. Chinese Rural Enterprises between Plan and Market. Ph.D. dissertation,
Stockholm School of Economics, 1997.
Zhao, X.. Political Competition and Privatization in China. Beijing: China Center for
Economic Research, Beijing University, 1999.
Zhu, J., D. Hare, and F. Zhong. Food Consumption for the Poor: A Supply or an Income
Issue? Evidence from Less-favored Regions in Rural China. Paper presented at AAEA
annual meeting, Denver Colorado, July 25-27, 2010.

90
APPENDIX: REGRESSION RESULTS FOR ROBUSTNESS TESTS
Table A1 presents the results of the market liberalization regression using definition 2
(including soybeans). I find that communication and access to modern markets are the
primary factors that contribute to community local market liberalization by definition 2. This
result is robust to including year dummies, and year and province dummies. When
controlling for county and year fixed effects, access to modern markets still positively affects
local market liberalization but it is not significant. The results are also consistent with
definition 1 (without soybeans), which suggest that access to modern markets and
communication increase local market liberalization.
Table A1. Community Local Market Liberalization Regression Results (Definition 2)
With Year
Dummies
With Year and
Province Dummies
With Year and
County Dummies
Transportation score -0.215* -0.0493 -0.185
(0.141) (0.129) (0.143)
Community communication score 0.580** 0.460* -0.0412
(0.319) (0.292) (0.320)
Community modern markets score 0.166* 0.166* 0.147
(0.115) (0.102) (0.111)
Community population density -0.461*** -0.226 0.299
(0.215) (0.194) (0.245)
Note: *, **, *** indicates significance level 15%, 10% and 5%. Standard errors are in parenthesis.
Table A2 presents the full regression results of different agricultural products. For the
different types of agricultural products, I find that household head age increases and off-farm
work opportunities decreases production of field crops and livestock consistently. While land
increases the production of field crops and decreases the production of horticulture, it does
not significantly affect livestock production. These results are reasonable based on the
different nature of these types of agricultural production. Tractors increase the production of

91
field crops, water pump and irrigation increase the production of horticulture, and irrigation
increases the production of livestock. Agricultural production increases the
commercialization of different agricultural products. For the nutrition equation, income and
access to markets consistently increase nutrition for all types of agricultural production.
Soybean oil price are also found to consistently decrease nutrition. In summary, when
incorporating commercialization of different agricultural products, the factors that contribute
to nutrition are similar to the overall regression results.
Table A2. Regression Results of Different Agricultural Production Types
(1) (2) (3)
Field crops Horticulture Livestock
Agricultural production
Household head age 43.77*** 53.43*** 6.169
(14.14) (11.46) (6.265)
Household head education -91.27*** 60.42** -8.912
(40.68) (32.96) (18.02)
Household head gender 264.3 508.3 -128.0
(0= heads are a female and a male) (567.7) (459.9) (251.5)
Land 74.03*** -19.51*** 2.549
(10.22) (8.283) (4.529)
Whether the household has water pump -489.7 549.7* 222.9
(436.2) (354.0) (193.4)
Whether the household has tractors 1078.5*** -206.8 196.4
(374.3) (303.8) (166.0)
Whether the household has irrigation 657.3 2482.1*** 504.1**
(632.8) (513.4) (280.5)
Local market liberalization 14.36 17.76* 3.640
(14.07) (11.40) (6.234)
Off-farm work opportunities -4517.5*** 2910.5*** -1304.7***
(864.4) (700.3) (382.9)

92
Table A2 (cont.)
(1) (2) (3)
Field crops Horticulture Livestock
Agricultural commercialization
Instrumented agricultural production 0.00126*** 0.00334*** 0.0109***
(0.000278) (0.000422) (0.00120)
Grains quota prior to 1995 -0.000416 -0.00111 0.00275
(0.00194) (0.00224) (0.00251)
Grain quota post to 1995 0.00333*** 0.00161 0.00234**
(0.00113) (0.00113) (0.00127)
Land 0.0527 0.0988 0.0192
(0.0658) (0.0741) (0.0811)
Household head age -0.172** -0.0793 -0.157
(0.0886) (0.105) (0.112)
Household head education 0.0214 -0.123 -0.330
(0.253) (0.295) (0.323)
Household head gender -4.937 2.947 3.700
(3.525) (4.101) (4.503)
Local market liberalization 0.240*** -0.197** 0.160
(0.0876) (0.102) (0.112)
Number of private enterprises in the 0.220*** 0.170*** -0.0845
community (0.0671) (0.0794) (0.0891)
Community modern markets score 1.037*** -0.545 0.723*
(0.370) (0.428) (0.470)
Community communication score -4.186*** -0.868 -2.010**
(0.865) (0.996) (1.109)
Off-farm work opportunities -12.15*** 8.486 -16.15***
(5.604) (6.531) (7.240)
Household food security
Instrumented agricultural
commercialization
0.157***
(0.0695)
0.129***
(0.0615)
-0.0379
(0.0955)
Household net income 0.000108*** 0.0000913*** 0.000100***
(0.0000348) (0.0000361) (0.0000508)
Household net income squared -2.83e-10* -1.93e-10 -2.62e-10
(1.82e-10) (2.00e-10) (2.44e-10)

93
Table A2 (cont.)
(1) (2) (3)
Field crops Horticulture Livestock
Household head age -0.0353 -0.0547* -0.0660*
(0.0399) (0.0362) (0.0413)
Household head education 0.0580 0.0302 0.0298
(0.106) (0.103) (0.110)
Household head gender 2.308* 0.985 1.540
(1.516) (1.456) (1.406)
Community communication score 0.684* 0.168 0.0465
(0.456) (0.370) (0.365)
Community modern markets score 0.165 0.460*** 0.394***
(0.178) (0.153) (0.152)
Land -0.00388 0.0234 0.0208
(0.0277) (0.0259) (0.0254)
Instrumented agricultural production 0.0000189 -0.0000936 0.0000885
(0.0000809) (0.0000823) (0.000162)
Off-farm work opportunities 6.039*** 0.729 2.321
(2.599) (2.629) (3.285)
Market liberalization -0.0381 0.0224 0.0121
(0.0406) (0.0367) (0.0383)
Rice price -0.417 -0.407 -0.239
(0.534) (0.545) (0.512)
Pork price -0.0371 0.00382 -0.0300
(0.175) (0.175) (0.176)
Vegetables price 0.189 -0.197 0.0267
(0.739) (0.617) (0.680)
Soybeans oil price -0.594*** -0.519*** -0.533***
(0.219) (0.211) (0.214)
Note: *, **, *** indicates significance level 15%, 10% and 5%. Standard errors are in parenthesis. All
regressions include county and year dummies.
I report the regression results splitting the sample by nourishment in table A3.
Households with older heads have higher agricultural production consistently. Land,

94
possession of irrigation and tractors are found to increase agricultural production for
undernourished households, while these variables are not significant for nourished
households. Agricultural production increases commercialization consistently and younger
household heads commercialize more. Commercialization increases nutrition of
undernourished households, while does not significantly affect nourished households. While
agricultural production and food prices significantly affect nourished households' nutrition,
they are not significantly related to nutrition for undernourished households.
Table A3. Full Regression Results of Different Nourished Groups
Undernourished Nourished
Agricultural production
Land 215.1*** 15.77
(31.69) (15.72)
Household head age 82.68*** 109.1***
(22.94) (30.93)
Household head education -8.998 -114.0
(65.44) (89.02)
Household head gender 1333.5 662.1
(0= heads are a female and a male) (970.9) (1168.1)
Whether the household has water pump 305.1 524.8
(693.0) (944.5)
Whether the household has tractors 1382.2*** 404.5
(590.7) (839.7)
Whether the household has irrigation 3449.3*** 2296.0
(884.7) (1843.8)
Local market liberalization 16.69 22.57
(26.47) (28.34)
Off-farm work opportunities -1511.3 -2473.5*
(1580.6) (1712.4)

95
Table A3 (cont.)
Undernourished Nourished
Agricultural Commercialization
Instrumented agricultural production 0.00208*** 0.00163***
(0.000299) (0.000524)
Grains quota prior to 1995 -0.00262* 0.00244
(0.00179) (0.00456)
Grain quota post to 1995 0.0000282 -0.00320***
(0.00123) (0.00154)
Land -0.620*** -0.116***
(0.144) (0.0577)
Household head age -0.255*** -0.259***
(0.0985) (0.131)
Household head education -0.222 0.758***
(0.272) (0.328)
Household head gender -9.116*** 6.121*
(4.080) (4.237)
Local market liberalization 0.391*** -0.0952
(0.110) (0.105)
Number of private enterprises in the 0.355*** -0.0194
community (0.0789) (0.0850)
Community modern markets score -0.104 1.273***
(0.413) (0.481)
Community communication score -2.612*** -0.638
(0.969) (1.114)
Off-farm work opportunities 1.832 23.55***
(6.675) (6.608)
Household food security
Instrumented agricultural
commercialization
0.0806* 0.100
(0.0541) (0.228)
Household net income 0.000000137 -0.0000608
(0.0000828) (0.0000579)

96
Table A3 (cont.)
Undernourished Nourished
(9.96e-10) (2.27e-10)
Household head age 0.0224 -0.0768
(0.0230) (0.0595)
Household head education 0.0911* 0.138
(0.0575) (0.192)
Household head gender 2.252*** -1.717
(0.933) (2.584)
Community communication score -0.126 -0.459
(0.263) (0.566)
Community modern markets score -0.0142 0.366
(0.0863) (0.311)
Land 0.0100 0.0237
(0.0423) (0.0327)
Instrumented agricultural production -0.0000134 0.000651***
(0.000135) (0.000262)
Off-farm work opportunities 1.182 -5.752
(1.527) (6.171)
Market liberalization 0.000794 -0.0474
(0.0337) (0.0507)
Rice price -0.189 -2.236***
(0.247) (1.110)
Pork price 0.0164 -0.703***
(0.104) (0.286)
Vegetables price 0.177 -0.646
(0.385) (1.330)
Soybeans oil price -0.109 -0.771**
(0.123) (0.451)
Note: *, **, *** indicates significance level 15%, 10% and 5%. Standard errors are in parenthesis. All
regressions include county and year dummies.
The regression results of different farmers' definitions and market liberalization indices

97
are shown in tables A4 and A5. Consistently, households with older head have more
agricultural production. Possession of tractors and irrigation increase agricultural production
for undernourished but not for nourished households. Younger household heads
commercialize more. Market liberalization increases commercialization of undernourished
households, but not of nourished households. Commercialization increases nutrition for
undernourished not for nourished. Agricultural production and food prices significantly affect
nutrition for nourished households, but not for undernourished households.
Table A4. Full Regression Results of Different Farmers' Definitions
Undernourished Nourished
Agricultural production
Land 197.5*** 3.888
(35.29) (16.82)
Household head age 89.76*** 134.3***
(25.18) (37.90)
Household head education 23.71 -32.51
(71.99) (115.1)
Household head gender 1276.1 -110.9
(0= heads are a female and a male) (1169.7) (1517.7)
Whether the household has water pump 116.0 506.6
(739.4) (1145.7)
Whether the household has tractors 1425.6*** 627.7
(628.2) (1103.4)
Whether the household has irrigation 3385.7*** 1849.2
(925.0) (2068.5)
Local market liberalization 17.31 -8.887
(29.41) (36.62)
Off-farm work opportunities -276.0 -600.4
(1938.5) (2281.9)

98
Table A4 (cont.)
Undernourished Nourished
Agricultural Commercialization
Instrumented agricultural production 0.00184*** 0.00135***
(0.000256) (0.000374)
Grains quota prior to 1995 -0.00187 -0.000264
(0.00164) (0.00484)
Grain quota post to 1995 0.0000709 -0.00268***
(0.00112) (0.00130)
Land -0.628*** -0.0695
(0.145) (0.0558)
Household head age -0.366*** -0.262**
(0.101) (0.137)
Household head education -0.295 0.594*
(0.281) (0.384)
Household head gender -11.25*** 5.959
(4.612) (5.048)
Local market liberalization 0.428*** 0.0650
(0.115) (0.123)
Number of private enterprises in the 0.249*** 0.0125
community (0.0779) (0.0921)
Community modern markets score 0.369 1.348***
(0.433) (0.581)
Community communication score -3.634*** -2.915***
(1.031) (1.430)
Off-farm work opportunities -2.205 9.963
(7.621) (8.050)
Household food security
Instrumented agricultural
commercialization
0.160** 0.221
(0.0828) (0.297)
Household net income -0.0000285 -0.000162
(0.000136) (0.000149)

99
Table A4 (cont.)
Undernourished Nourished
Household head age 0.0610** -0.0925
(0.0354) (0.0806)
Household head education 0.133** -0.101
(0.0714) (0.251)
Household head gender 4.278*** 0.126
(1.383) (3.062)
Community communication score 0.278 0.450
(0.399) (1.225)
Community modern markets score -0.0919 0.253
(0.118) (0.418)
Land 0.0324 0.0289
(0.0551) (0.0326)
Instrumented agricultural production -0.0000809 0.000691***
(0.000172) (0.000341)
Off-farm work opportunities 1.558 -10.20**
(1.924) (5.808)
Market liberalization -0.0400 -0.0554
(0.0493) (0.0649)
Rice price -0.333 -1.357
(0.269) (1.359)
Pork price 0.0422 -0.590**
(0.117) (0.330)
Vegetables price 0.238 -1.257
(0.543) (1.235)
Soybeans oil price -0.0973 -0.841*
(0.133) (0.552)
Note: *, **, *** indicates significance level 15%, 10% and 5%. Standard errors are in parenthesis. All
regressions include county and year dummies.

100
Table A5. Full Regression Results of Different Market Liberalization Definitions
Undernourished Nourished
Agricultural production
Land 215.3*** 16.11
(31.79) (15.71)
Household head age 82.49*** 111.0***
(22.95) (30.88)
Household head education -7.319 -133.1*
(65.39) (89.57)
Household head gender 1338.0 602.3
(0= heads are a female and a male) (974.2) (1167.9)
Whether the household has water pump 351.0 566.5
(692.6) (942.2)
Whether the household has tractors 1404.0*** 288.5
(589.3) (838.7)
Whether the household has irrigation 3464.9*** 2008.6
(887.1) (1843.1)
Local market liberalization 32.58 -139.8
(100.4) (106.1)
Off-farm work opportunities -1632.8 -2237.5
(1576.9) (1722.0)
Agricultural commercialization
Instrumented agricultural production 0.00214*** 0.00125***
(0.000299) (0.000528)
Grains quota prior to 1995 -0.00280* 0.00230
(0.00180) (0.00440)
Grain quota post to 1995 0.000277 -0.00268**
(0.00124) (0.00153)
Land -0.644*** -0.101**
(0.145) (0.0569)
Household head age -0.267*** -0.207*
(0.0989) (0.130)

101
Table A5 (cont.)
Undernourished Nourished
Household head education -0.200 0.579**
(0.273) (0.327)
Household head gender -8.483*** 5.658
(4.108) (4.169)
Local market liberalization 1.267*** -1.416***
(0.416) (0.391)
Number of private enterprises in the 0.373*** -0.00471
community (0.0786) (0.0822)
Community modern markets score -0.165 1.324***
(0.413) (0.473)
Community communication score -2.481*** -0.729
(0.972) (1.085)
Off-farm work opportunities -1.168 25.32***
(6.695) (6.502)
Household food security
Instrumented agricultural
commercialization
0.0814* 0.174
(0.0498) (0.242)
Household net income -0.00000623 -0.0000674
(0.0000799) (0.0000575)
Household net income squared 3.79e-11 2.33e-10
(9.69e-10) (2.32e-10)
Household head age 0.0214 -0.0770
(0.0231) (0.0607)
Household head education 0.0878* 0.134
(0.0572) (0.184)
Household head gender 2.254*** -2.202
(0.918) (2.556)
Community communication score -0.0933 -0.501
(0.246) (0.571)
Community modern markets score -0.0194 0.276
(0.0854) (0.344)

102
Table A5 (cont.)
Undernourished Nourished
Land 0.00765 0.0287
(0.0423) (0.0328)
Instrumented agricultural production -0.00000664 0.000690***
(0.000135) (0.000267)
Off-farm work opportunities 1.101 -7.534
(1.583) (7.031)
Market liberalization 0.0414 0.243
(0.113) (0.398)
Rice price -0.176 -2.177***
(0.246) (1.093)
Pork price 0.0205 -0.742***
(0.104) (0.287)
Vegetables price 0.301 -0.686
(0.366) (1.153)
Soybeans oil price -0.0738 -0.849***
(0.130) (0.433)
Note: *, **, *** indicates significance level 15%, 10% and 5%. Standard errors are in parenthesis. All
regressions include county and year dummies.
Full regression results for robustness tests of food diversity, mean caloric intake and
mean protein intake are shown in tables A6, A7 and A8. Household head age, land,
possession of tractors and irrigation, and market liberalization increases agricultural
production using the different nutritional measures. Market liberalization and number of
private enterprises increase agricultural commercialization, while household age decreases
commercialization. While commercialization increases food diversity overall, it does not
significantly affect household's mean caloric or protein intake.

103
Table A6. Full Regression Results of Food Diversity
Overall Undernourished Nourished
Agricultural production
Land 56.06*** 214.9*** 16.63
(13.55) (31.68) (15.73)
Household head age 103.6*** 82.46*** 107.8***
(18.75) (22.94) (30.94)
Household head education -41.67 -9.485 -112.5
(53.93) (65.44) (89.02)
Household head gender 661.6 1323.1 638.8
(0= heads are a female and a male) (752.7) (970.9) (1168.4)
Whether the household has water pump 716.5 559.8 170.5
(566.4) (679.5) (959.2)
Whether the household has tractors 1070.0*** 1300.3*** 312.6
(485.8) (578.7) (848.9)
Whether the household has irrigation 3387.5*** 3475.0*** 2593.5
(827.3) (870.0) (1858.5)
Local market liberalization 36.14** 16.77 23.04
(18.65) (26.47) (28.34)
Off-farm work opportunities -2857.6*** -1514.0 -2502.6*
(1145.9) (1580.5) (1712.5)
Agricultural commercialization
Instrumented agricultural production 0.00200*** 0.00209*** 0.00172***
(0.000281) (0.000300) (0.000524)
Grains quota prior to 1995 -0.00215** -0.00277* 0.000477
(0.00129) (0.00189) (0.00448)
Grain quota post to 1995 -0.00176*** -0.000000267 -0.00363***
(0.000886) (0.00129) (0.00153)
Land -0.157*** -0.620*** -0.120***
(0.0553) (0.144) (0.0577)
Household head age -0.296*** -0.255*** -0.262***
(0.0802) (0.0985) (0.131)

104
Table A6 (cont.)
Overall Undernourished Nourished
Household head education 0.159 -0.223 0.760***
(0.214) (0.272) (0.328)
Household head gender -1.335 -9.142*** 6.171*
(2.994) (4.083) (4.237)
Local market liberalization 0.122* 0.390*** -0.101
(0.0747) (0.110) (0.105)
Number of private enterprises in the 0.173*** 0.358*** 0.0457
community (0.0538) (0.0802) (0.0834)
Community modern markets score 0.382 -0.112 1.151***
(0.310) (0.413) (0.480)
Community communication score -1.575*** -2.602*** -0.691
(0.728) (0.969) (1.114)
Off-farm work opportunities 15.01*** 1.879 22.51***
(4.692) (6.677) (6.603)
Household food security
Instrumented agricultural
commercialization
0.0879*** 0.00560 0.0314
(0.0241) (0.0145) (0.0341)
Household net income 0.000000569 -0.0000196 0.00000738
(0.0000103) (0.0000225) (0.00000881)
Household net income squared -2.99e-11 1.90e-10 -5.95e-11**
(4.07e-11) (2.76e-10) (3.46e-11)
Household head age 0.0153* 0.00360 0.00299
(0.00935) (0.00615) (0.00906)
Household head education -0.00763 0.0159 -0.0244
(0.0212) (0.0154) (0.0291)
Household head gender 0.156 0.284 -0.406
(0.294) (0.250) (0.390)
Community communication score 0.184*** -0.0466 0.0884
(0.0819) (0.0698) (0.0868)
Community modern markets score -0.0202 0.0237 -0.0298
(0.0313) (0.0228) (0.0471)

105
Table A6 (cont.)
Overall Undernourished Nourished
Land 0.00686 -0.0147 0.000679
(0.00604) (0.0113) (0.00495)
Instrumented agricultural production -0.0000352 0.000113*** -0.0000328
(0.0000424) (0.0000362) (0.0000403)
Off-farm work opportunities -0.628 0.130 -0.611
(0.559) (0.411) (0.927)
Market liberalization -0.00609 0.00598 0.0101
(0.00828) (0.00905) (0.00771)
Rice price -0.0694 -0.0554 0.0264
(0.0698) (0.0703) (0.168)
Pork price -0.0245 -0.0469* -0.0314
(0.0281) (0.0297) (0.0432)
Vegetables price 0.0278 0.0475 -0.101
(0.0870) (0.109) (0.199)
Soybeans oil price -0.0195 0.0575* 0.00160
(0.0406) (0.0351) (0.0678)
Note: *, **, *** indicates significance level 15%, 10% and 5%. Standard errors are in parenthesis. All
regressions include county and year dummies.
Table A7. Full Regression Results of Mean Caloric Intake
Overall Undernourished Nourished
Agricultural production
Land 56.89*** 215.2*** 16.45
(13.55) (31.69) (15.73)
Household head age 103.6*** 82.73*** 107.8***
(18.75) (22.94) (30.94)
Household head education -40.73 -8.854 -113.1
(53.93) (65.44) (89.02)
Household head gender 668.1 1336.5 634.8
(0= heads are a female and a male) (752.7) (970.9) (1168.4)

106
Table A7 (cont.)
Overall Undernourished Nourished
Whether the household has water pump 323.7 260.8 270.7
(574.8) (695.0) (958.3)
Whether the household has tractors 1080.6*** 1380.9*** 300.5
(493.2) (592.6) (848.4)
Whether the household has irrigation 3504.1*** 3434.6*** 2621.4
(834.3) (886.6) (1857.7)
Local market liberalization 36.62*** 16.72 22.91
(18.66) (26.47) (28.34)
Off-farm work opportunities -2873.5*** -1510.5 -2493.1*
(1145.9) (1580.6) (1712.4)
Agricultural commercialization
Instrumented agricultural production 0.00201*** 0.00209*** 0.00164***
(0.000289) (0.000300) (0.000525)
Grains quota prior to 1995 -0.00183 -0.00273* 0.00240
(0.00167) (0.00189) (0.00465)
Grain quota post to 1995 -0.00184** 0.0000672 -0.00321***
(0.000999) (0.00129) (0.00154)
Land -0.158*** -0.621*** -0.116***
(0.0553) (0.144) (0.0578)
Household head age -0.294*** -0.255*** -0.261***
(0.0807) (0.0985) (0.131)
Household head education 0.158 -0.223 0.759***
(0.214) (0.272) (0.328)
Household head gender -1.282 -9.106*** 6.099
(2.997) (4.083) (4.237)
Local market liberalization 0.118* 0.389*** -0.0950
(0.0747) (0.110) (0.105)
Number of private enterprises in the 0.220*** 0.364*** -0.0312
community (0.0582) (0.0802) (0.0866)
Community modern markets score 0.309 -0.121 1.292***
(0.311) (0.413) (0.481)

107
Table A7 (cont.)
Overall Undernourished Nourished
Community communication score -1.570*** -2.602*** -0.627
(0.729) (0.969) (1.114)
Off-farm work opportunities 14.61*** 1.902 23.74***
(4.701) (6.677) (6.613)
Household food security
Instrumented agricultural
commercialization
-8.787 2.621 -0.478
(8.778) (7.559) (17.15)
Household net income -0.00156 -0.00612 -0.000427
(0.00402) (0.0117) (0.00436)
Household net income squared 5.28e-09 -2.98e-08 3.70e-09
(1.62e-08) (0.000000144) (1.71e-08)
Household head age -2.303 -1.795 1.350
(3.158) (3.153) (4.414)
Household head education -7.448 5.359 -20.26
(7.069) (7.866) (14.29)
Household head gender 63.11 126.3 -25.43
(97.78) (127.9) (192.2)
Community communication score -14.91 48.04 -43.98
(28.22) (36.36) (42.42)
Community modern markets score -12.20 -13.44 -18.53
(10.67) (11.87) (23.29)
Land -0.914 1.439 -1.381
(2.019) (5.829) (2.429)
Instrumented agricultural production 0.00912 0.0118 -0.00475
(0.0144) (0.0188) (0.0196)
Off-farm work opportunities 10.80 14.51 -167.7
(189.2) (210.3) (462.0)
Market liberalization 2.226 -1.016 -2.714
(2.859) (4.667) (3.752)
Rice price -23.70 -8.939 -69.82
(33.38) (36.74) (84.27)

108
Table A7 (cont.)
Overall Undernourished Nourished
Pork price 26.90*** 12.68 24.13
(12.46) (15.53) (21.77)
Vegetables price -30.81 -24.93 -50.12
(41.14) (56.90) (100.7)
Soybeans oil price 30.98** 7.386 44.47
(17.94) (18.34) (34.18)
Note: *, **, *** indicates significance level 15%, 10% and 5%. Standard errors are in parenthesis. All
regressions include county and year dummies.
Table A8. Full Regression Results of Mean Protein Intake
Overall Undernourished Nourished
Agricultural production
Land 56.92*** 215.1*** 16.39
(13.55) (31.69) (15.73)
Household head age 103.6*** 82.74*** 108.1***
(18.75) (22.94) (30.94)
Household head education -40.69 -8.947 -113.1
(53.93) (65.44) (89.02)
Household head gender 668.4 1335.6 642.2
(0= heads are a female and a male) (752.7) (970.9) (1168.4)
Whether the household has water pump 309.9 236.0 278.4
(575.7) (695.4) (959.3)
Whether the household has tractors 1079.3*** 1408.1*** 326.9
(494.0) (592.9) (849.0)
Whether the household has irrigation 3505.0*** 3463.1*** 2541.1
(835.3) (887.0) (1858.7)
Local market liberalization 36.63*** 16.68 22.90
(18.66) (26.47) (28.34)
Off-farm work opportunities -2874.1*** -1509.8 -2493.2*
(1146.0) (1580.6) (1712.5)

109
Table A8 (cont.)
Overall Undernourished Nourished
Agricultural Commercialization
Instrumented agricultural production 0.00201*** 0.00207*** 0.00163***
(0.000290) (0.000299) (0.000525)
Grains quota prior to 1995 -0.00196 -0.00262 0.00241
(0.00172) (0.00184) (0.00465)
Grain quota post to 1995 -0.00180** 0.000188 -0.00317***
(0.00101) (0.00126) (0.00154)
Land -0.158*** -0.621*** -0.115***
(0.0554) (0.144) (0.0578)
Household head age -0.294*** -0.254*** -0.261***
(0.0807) (0.0985) (0.131)
Household head education 0.157 -0.222 0.760***
(0.214) (0.272) (0.328)
Household head gender -1.283 -9.058*** 6.085
(2.997) (4.082) (4.237)
Local market liberalization 0.117* 0.391*** -0.0946
(0.0747) (0.110) (0.105)
Number of private enterprises in the 0.221*** 0.352*** -0.0408
community (0.0586) (0.0796) (0.0866)
Community modern markets score 0.305 -0.0988 1.308***
(0.311) (0.413) (0.482)
Community communication score -1.569*** -2.620*** -0.618
(0.729) (0.969) (1.114)
Off-farm work opportunities 14.62*** 1.845 23.88***
(4.703) (6.676) (6.614)
Household food security
Instrumented agricultural
commercialization
-0.126 0.282 0.00701
(0.292) (0.240) (0.635)
Household net income 0.0000822 0.0000210 0.0000422
(0.000135) (0.000370) (0.000162)

110
Table A8 (cont.)
Overall Undernourished Nourished
Household head education 0.0145 0.339 -0.111
(0.233) (0.253) (0.529)
Household head gender 3.063 8.915*** -2.040
(3.226) (4.102) (7.115)
Community communication score -0.778 1.163 -2.005
(0.935) (1.161) (1.571)
Community modern markets score -0.676** -0.961*** -0.802
(0.353) (0.380) (0.862)
Land 0.0102 0.378*** -0.0177
(0.0667) (0.186) (0.0899)
Instrumented agricultural production 0.000172 -0.000456 0.000302
(0.000476) (0.000598) (0.000726)
Off-farm work opportunities 5.787 8.414 -2.357
(6.254) (6.729) (17.10)
Market liberalization 0.0426 -0.0834 -0.0595
(0.0947) (0.149) (0.139)
Rice price -1.291 -0.698 -4.606*
(1.142) (1.134) (3.123)
Pork price 0.793** 0.531 0.210
(0.424) (0.479) (0.807)
Vegetables price 2.343** 1.534 1.555
(1.406) (1.761) (3.730)
Soybeans oil price 1.025** 0.403 1.311
(0.609) (0.566) (1.266)
Note: *, **, *** indicates significance level 15%, 10% and 5%. Standard errors are in parenthesis. All
regressions include county and year dummies.
I report the results with off-farm wage and grain quotas in the nutrition equation in
tables A9 and A10. Consistently, market liberalization and household head age increase
agricultural production. Market liberalization increases commercialization while household

111
head age decreases it. Off-farm wage increases nutrition and food prices decrease nutrition.
Grain quotas do not significantly affect nutrition. Commercialization increases nutrition
overall.
Table A9. Full Regression Results of Off-farm Wage in the Nutrition Equation
Overall Undernourished Nourished
Agricultural production
Land 56.61*** 215.0*** 15.75
(13.55) (31.69) (15.72)
Household head age 103.7*** 82.69*** 109.2***
(18.75) (22.94) (30.93)
Household head education -40.73 -9.069 -114.0
(53.93) (65.44) (89.02)
Household head gender 669.4 1333.3 667.2
(0= heads are a female and a male) (752.7) (970.9) (1168.0)
Whether the household has water pump 437.1 281.0 526.0
(572.1) (695.3) (940.8)
Whether the household has tractors 1088.1*** 1397.6*** 437.5
(490.9) (592.7) (836.4)
Whether the household has irrigation 3371.6*** 3475.9*** 2292.5
(832.5) (887.3) (1838.5)
Local market liberalization 36.41** 16.68 22.63
(18.66) (26.47) (28.34)
Off-farm work opportunities -2870.2*** -1510.1 -2475.5*
(1145.9) (1580.6) (1712.3)
Agricultural commercialization
Instrumented agricultural production 0.00176*** 0.00182*** 0.00181***
(0.000278) (0.000290) (0.000512)
Grains quota prior to 1995 -0.00272** -0.00239 0.00228
(0.00139) (0.00178) (0.00455)

112
Table A9 (cont.)
Overall Undernourished Nourished
Grain quota post to 1995 -0.000890 0.000234 -0.00337***
(0.000914) (0.00122) (0.00152)
Land -0.148*** -0.568*** -0.119***
(0.0551) (0.143) (0.0578)
Household head age -0.266*** -0.232*** -0.280***
(0.0799) (0.0981) (0.130)
Household head education 0.152 -0.219 0.775***
(0.213) (0.271) (0.328)
Household head gender -1.057 -8.660*** 6.010
(2.987) (4.067) (4.247)
Local market liberalization 0.122* 0.396*** -0.0987
(0.0745) (0.110) (0.105)
Number of private enterprises in the 0.218*** 0.347*** -0.0198
community (0.0552) (0.0786) (0.0847)
Community modern markets score 0.310 -0.0657 1.274***
(0.310) (0.412) (0.481)
Community communication score -1.613*** -2.693*** -0.645
(0.728) (0.968) (1.114)
Off-farm work opportunities 14.39*** 1.380 23.92***
(4.682) (6.656) (6.618)
Household food security
Instrumented agricultural
commercialization
0.445*** 0.0865* 0.107
(0.159) (0.0537) (0.230)
Off-farm wage 0.286*** 0.106** 0.0715
(0.0946) (0.0583) (0.133)
Household net income 0.0000151 -0.0000292 -0.0000695
(0.0000730) (0.0000900) (0.0000627)
Household net income squared 6.05e-11 3.46e-10 2.62e-10
(2.91e-10) (1.08e-09) (2.34e-10)
Household head age 0.0111 0.0227 -0.0817
(0.0611) (0.0230) (0.0592)

113
Table A9 (cont.)
Overall Undernourished Nourished
Household head education -0.0497 0.0842* 0.116
(0.136) (0.0581) (0.208)
Household head gender 1.707 2.405*** -1.754
(1.888) (0.926) (2.577)
Community communication score 0.807* -0.105 -0.448
(0.532) (0.264) (0.572)
Community modern markets score 0.0981 -0.0157 0.362
(0.203) (0.0866) (0.310)
Land 0.0643** 0.0146 0.0257
(0.0385) (0.0414) (0.0339)
Instrumented agricultural production -0.000174 0.00000760 0.000660***
(0.000280) (0.000141) (0.000263)
Off-farm work opportunities -2.587 0.935 -5.998
(3.571) (1.530) (6.317)
Market liberalization -0.0787* -0.00659 -0.0467
(0.0538) (0.0334) (0.0511)
Rice price -0.467 -0.186 -2.306***
(0.505) (0.247) (1.126)
Pork price -0.105 0.00689 -0.699***
(0.197) (0.105) (0.284)
Vegetables price -0.160 0.136 -0.665
(0.629) (0.389) (1.344)
Soybeans oil price -0.760*** -0.125 -0.785**
(0.284) (0.123) (0.460)
Note: *, **, *** indicates significance level 15%, 10% and 5%. Standard errors are in parenthesis. All
regressions include county and year dummies.
Table A10. Full Regression Results of Grain Quotas in the Nutrition Equation
Overall Undernourished Nourished
Agricultural production
Land 56.49*** 215.7*** 15.16

114
Table A10 (cont.)
Overall Undernourished Nourished
(13.55) (31.66) (15.71)
Household head age 103.8*** 82.68*** 111.0***
(18.75) (22.94) (30.89)
Household head education -40.62 -7.813 -114.3
(53.93) (65.44) (89.01)
Household head gender 670.6 1342.1 707.4
(0= heads are a female and a male) (752.7) (970.8) (1167.8)
Whether the household has water pump 494.4 499.0 703.1
(563.0) (658.2) (897.5)
Whether the household has tractors 1072.3*** 1193.8*** 577.9
(482.8) (558.0) (829.9)
Whether the household has irrigation 3272.4*** 3091.9*** 1811.7
(830.7) (869.0) (1790.4)
Local market liberalization 36.29** 16.88 22.35
(18.65) (26.46) (28.33)
Off-farm work opportunities -2868.3*** -1524.5 -2463.6
(1145.9) (1580.5) (1712.1)
Agricultural commercialization
Instrumented agricultural production 0.00195*** 0.00205*** 0.00172***
(0.000291) (0.000302) (0.000529)
Grains quota prior to 1995 -0.00216 -0.00296* 0.00234
(0.00173) (0.00190) (0.00465)
Grain quota post to 1995 -0.00157* 0.0000922 -0.00326***
(0.00101) (0.00129) (0.00155)
Log number of private enterprises in the 1.880*** 1.088 0.0766
community (0.786) (1.404) (1.530)
Land -0.156*** -0.605*** -0.117***
(0.0554) (0.146) (0.0578)
Household head age -0.289*** -0.254*** -0.272***
(0.0808) (0.0985) (0.131)

115
Table A10 (cont.)
Overall Undernourished Nourished
Household head education 0.150 -0.232 0.769***
(0.214) (0.272) (0.328)
Household head gender -1.184 -9.001*** 6.033
(3.001) (4.087) (4.242)
Local market liberalization 0.110* 0.379*** -0.0965
(0.0749) (0.111) (0.105)
Number of private enterprises in the 0.0669 0.285*** -0.0435
community (0.0760) (0.123) (0.132)
Community modern markets score 0.356 -0.0913 1.303***
(0.311) (0.413) (0.485)
Community communication score -1.841*** -2.824*** -0.631
(0.738) (1.009) (1.118)
Off-farm work opportunities 15.48*** 2.399 24.04***
(4.709) (6.706) (6.618)
Household food security
Instrumented agricultural
commercialization
0.555***
(0.177)
0.0798
(0.0639)
-0.0710
(0.271)
Grains quota prior to 1995 -0.000352 0.0000593 0.000223
(0.00147) (0.000557) (0.00218)
Grain quota post to 1995 0.000861 -0.0000861 -0.00101
(0.00110) (0.000410) (0.00179)
Household net income 0.0000582 -0.0000275 -0.000101
(0.000108) (0.000125) (0.000113)
Household net income squared -1.03e-10 2.86e-10 4.10e-10
(4.31e-10) (1.36e-09) (4.71e-10)
Household head age 0.0498 0.00158 -0.182*
(0.0817) (0.0272) (0.115)
Household head education -0.0278 0.0912 0.324
(0.151) (0.0660) (0.262)

116
Table A10 (cont.)
Overall Undernourished Nourished
Household head gender 1.652 1.858** -1.167
(2.167) (1.093) (2.640)
Community communication score
0.934* -0.117 -0.644
(0.572) (0.302) (0.628)
Community modern markets score -0.00754 -0.0255 0.580*
(0.220) (0.0962) (0.362)
Land 0.0710* -0.0476 -0.00569
(0.0488) (0.0520) (0.0440)
Instrumented agricultural production -0.000413 0.000254 0.00150**
(0.000590) (0.000224) (0.000887)
Off-farm work opportunities -3.633 1.573 -0.409
(4.520) (1.851) (7.817)
Market liberalization -0.0918* -0.00356 -0.0770
(0.0580) (0.0392) (0.0606)
Rice price -0.284 -0.137 -2.680**
(0.517) (0.268) (1.531)
Pork price -0.174 -0.0239 -0.767***
(0.238) (0.110) (0.325)
Vegetables price -0.0000286 0.0149 -0.498
(0.660) (0.410) (1.312)
Soybeans oil price -0.724*** -0.106 -0.757**
(0.290) (0.131) (0.443)
Note: *, **, *** indicates significance level 15%, 10% and 5%. Standard errors are in parenthesis. All
regressions include county and year dummies.
I present the regression results using local market liberalization as an additional
instrument for commercialization in addition to grain quotas and the number of private
enterprises in the community by nourishment in table A11. I find largely consistent results
with the main results that land, household age, possession of tractors and irrigation, local
market liberalization, and off-farm work opportunities significantly affect agricultural

117
production. When splitting the sample into nourished and undernourished households, local
market liberalization and off-farm work opportunities do not significantly affect production
for undernourished households compared to the overall sample. For the nourished households,
only household head age and off-farm work opportunities significantly affect production.
Local market liberalization does not significantly affect commercialization overall while it
significantly increases commercialization for undernourished households. The number of
private enterprises only increase commercialization overall and for undernourished but not
for nourished households. Surprisingly, local communication score decreases nutrition. In
terms of nutrition, soybean oil prices decreases nutrition overall. Table A12 reports full
regression results excluding market liberalization in the nutrition equation by crops. Overall,
land, household age, possession of tractors and irrigation, local market liberalization, and
off-farm work opportunities significantly affect agricultural production. Interestingly,
possession of tractors increases the production of field crops while possession of irrigation
and water pump increase the production of horticulture. This results is reasonable because
many of the field crops are more land-intensive and drought enduring than horticulture. Grain
quota post 1995 increases commercialization of field crops and livestock. It is possible that
the low price of feed grains facilitated by grain quota post 1995 contributes to the production
and commercialization of livestock. As with the main results, commercialization of field
crops and horticulture increases nutrition.
Table A11. Full Regression Results Excluding Market Liberalization in the Nutrition
Equation by Nourishment
Overall Undernourished Nourished
Agricultural production
Land 56.71*** 215.1*** 15.69
(13.55) (31.69) (15.72)

118
Table A 11 (cont.)
Overall
Undernourished Nourished
Household head education -40.77 -8.999 -114.6
(53.93) (65.44) (89.02)
Household head gender 668.6 1333.6 667.4
(0= heads are a female and a male) (752.7) (970.9) (1168.1)
Whether the household has water pump 399.5 304.5 533.2
(573.6) (693.0) (941.4)
Whether the household has tractors 1087.5*** 1382.2*** 403.3
(492.2) (590.7) (837.6)
Whether the household has irrigation 3427.6*** 3449.0*** 2210.5
(833.2) (884.6) (1840.2)
Local market liberalization 36.23** 16.71 18.71
(18.65) (26.46) (28.00)
Off-farm work opportunities -2872.1*** -1511.2 -2479.4*
(1145.9) (1580.6) (1712.3)
Agricultural commercialization
Instrumented agricultural production 0.00196*** 0.00208*** 0.00162***
(0.000286) (0.000299) (0.000523)
Grains quota prior to 1995 -0.00286** -0.00262* 0.00230
(0.00150) (0.00179) (0.00445)
Grain quota post to 1995 -0.00113 0.0000249 -0.00312***
(0.000954) (0.00122) (0.00153)
Land -0.157*** -0.620*** -0.116***
(0.0553) (0.144) (0.0577)
Household head age -0.285*** -0.255*** -0.255**
(0.0805) (0.0985) (0.131)
Household head education 0.155 -0.222 0.753***
(0.214) (0.272) (0.328)
Household head gender -1.218 -9.116*** 6.154*
(2.996) (4.080) (4.237)
Local market liberalization 0.0636 0.391*** -0.121
(0.0652) (0.105) (0.101)

119
Table A11 (cont.)
Overall
Undernourished
Nourished
Number of private enterprises in the 0.240*** 0.355*** -0.00875
community (0.0551) (0.0768) (0.0828)
Community modern markets score 0.260 -0.103 1.252***
(0.310) (0.411) (0.479)
Community communication score -1.546*** -2.612*** -0.599
(0.728) (0.969) (1.113)
Off-farm work opportunities 14.49*** 1.833 23.28***
(4.693) (6.675) (6.600)
Household food security
Instrumented agricultural
commercialization
0.338***
(0.130)
0.0816***
(0.0374)
0.182
(0.223)
Household net income 0.0000630 -0.000000615 -0.0000684
(0.0000635) (0.0000774) (0.0000589)
Household net income squared -1.34e-10 -4.43e-11 2.37e-10
(2.60e-10) (9.54e-10) (2.29e-10)
Household head age 0.00882 0.0226 -0.0699
(0.0533) (0.0222) (0.0608)
Household head education 0.000988 0.0913* 0.0970
(0.123) (0.0567) (0.195)
Household head gender 1.542 2.258*** -2.336
(1.702) (0.902) (2.604)
Community communication score 0.562 -0.123 -0.490
(0.465) (0.237) (0.580)
Community modern markets score 0.167 -0.0144 0.278
(0.181) (0.0854) (0.312)
Land 0.0530* 0.0103 0.0314
(0.0347) (0.0406) (0.0329)
Instrumented agricultural production -0.000235 -0.0000137 0.000641***
(0.000249) (0.000135) (0.000267)
Off-farm work opportunities -0.757 1.188 -7.395
(3.178) (1.509) (6.122)

120
Table A11 (cont.)
Overall
Undernourished
Nourished
Rice price -0.355 -0.191 -2.226***
(0.500) (0.237) (1.114)
Pork price -0.0915 0.0169 -0.737***
(0.192) (0.103) (0.286)
Vegetables price 0.0103 0.181 -0.733
(0.624) (0.364) (1.329)
Soybeans oil price -0.711*** -0.110 -0.850**
(0.270) (0.121) (0.443)
Note: *, **, *** indicates significance level 15%, 10% and 5%. Standard errors are in parenthesis. All
regressions include county and year dummies.
Table A12. Full Regression Results Excluding Market Liberalization in the Nutrition
Equation by Agricultural Production Type
Field crops Horticulture Livestock
Agricultural production
Land 74.05*** -19.51*** 2.539
(10.22) (8.283) (4.529)
Household head age 43.79*** 53.44*** 6.169
(14.14) (11.46) (6.265)
Household head education -91.24*** 60.42** -8.926
(40.68) (32.96) (18.02)
Household head gender 264.5 508.3 -128.1
(0= heads are a female and a male) (567.7) (459.9) (251.5)
Whether the household has water pump -494.1 548.4* 227.1
(436.3) (354.0) (193.5)
Whether the household has tractors 1080.9*** -207.4 197.6
(374.4) (303.8) (166.0)
Whether the household has irrigation 651.9 2483.5*** 503.6**
(632.9) (513.4) (280.5)
Local market liberalization 13.55 17.66* 3.624
(14.04) (11.40) (6.233)

121
Table A12 (cont.)
Field crops Horticulture Livestock
Off-farm work opportunities -4520.7*** 2910.1*** -1304.6***
(864.4) (700.3) (382.9)
Agricultural commercialization
Instrumented agricultural production 0.00125*** 0.00334*** 0.0109***
(0.000278) (0.000422) (0.00120)
Grains quota prior to 1995 -0.000313 -0.00109 0.00265
(0.00196) (0.00225) (0.00252)
Grain quota post to 1995 0.00343*** 0.00159 0.00238**
(0.00113) (0.00113) (0.00127)
Land 0.0528 0.0986 0.0189
(0.0658) (0.0741) (0.0811)
Household head age -0.172** -0.0797 -0.157
(0.0886) (0.105) (0.112)
Household head education 0.0219 -0.123 -0.330
(0.253) (0.295) (0.323)
Household head gender -4.922 2.945 3.705
(3.525) (4.101) (4.503)
Local market liberalization 0.221*** -0.185 0.158
(0.0850) (0.100) (0.112)
Number of private enterprises in the 0.219*** 0.169*** -0.0767
community (0.0676) (0.0795) (0.0892)
Community modern markets score 1.040*** -0.541 0.708*
(0.370) (0.428) (0.470)
Community communication score -4.177*** -0.874 -2.008**
(0.865) (0.996) (1.109)
Off-farm work opportunities -12.19*** 8.531 -16.19***
(5.604) (6.531) (7.241)
Household food security
Instrumented agricultural
commercialization
0.127***
(0.0631)
0.121***
(0.0606)
-0.0237
(0.0885)

122
Table A12 (cont.)
Field crops Horticulture Livestock
Household net income 0.000109*** 0.0000918*** 0.000102***
(0.0000348) (0.0000361) (0.0000490)
Household net income squared -2.96e-10* -1.95e-10 -2.72e-10
(1.82e-10) (2.00e-10) (2.38e-10)
Household head age -0.0412 -0.0544* -0.0637*
(0.0391) (0.0362) (0.0405)
Household head education 0.0555 0.0322 0.0364
(0.105) (0.103) (0.108)
Household head gender 2.154* 1.019 1.519
(1.495) (1.453) (1.403)
Community communication score 0.547 0.176 0.0656
(0.434) (0.369) (0.364)
Community modern markets score 0.209 0.453*** 0.386***
(0.172) (0.153) (0.151)
Land -0.000499 0.0237 0.0206
(0.0273) (0.0258) (0.0253)
Instrumented agricultural production 0.0000329 -0.0000855 0.0000768
(0.0000782) (0.0000813) (0.000153)
Off-farm work opportunities 5.660*** 0.832 2.688
(2.554) (2.623) (3.187)
Rice price -0.323 -0.423 -0.264
(0.519) (0.545) (0.504)
Pork price -0.0394 0.00549 -0.0310
(0.175) (0.175) (0.175)
Vegetables price 0.142 -0.235 -0.0146
(0.731) (0.614) (0.657)
Soybeans oil price -0.597*** -0.506*** -0.528***
(0.218) (0.210) (0.214)
Note: *, **, *** indicates significance level 15%, 10% and 5%. Standard errors are in parenthesis. All
regressions include county and year dummies.
Consistent with the main results, land, household age, possession of tractors and

123
irrigation, local market liberalization and off-farm work opportunities significantly affect
agricultural production (table A13). Land and household head age decreases
commercialization for overall, undernourished and nourished households. Local market
liberalization only increases commercialization overall and for undernourished households. In
the nutrition equation, commercialization increases nutrition overall and soybeans oil price
consistently decrease nutrition.
Table A14 presents regression results separating the sample into different agricultural
production types. Interestingly, land increases the production of field crops, decreases the
production of horticulture, and does not affect livestock production significantly. It is
possible that large quantity of land does not indicate good quality of land. Thus, land
decreases the production of horticulture while increases the production of field crops which
are land intensive. Market liberalization only increases commercialization of field crops and
horticulture, but not livestock. Last, commercialization of horticulture increases nutrition.
Table A13. Full Regression Results Excluding Off-farm Work Opportunities in the
Nutrition Equation by Nourishment
Overall Undernourished Nourished
Agricultural production
Land 56.58*** 215.1*** 16.19
(13.55) (31.69) (15.73)
Household head age 103.8*** 82.70*** 108.2***
(18.75) (22.94) (30.94)
Household head education -40.67 -9.003 -113.5
(53.93) (65.44) (89.02)
Household head gender 669.8 1334.4 644.6
(0= heads are a female and a male) (752.7) (970.9) (1168.4)
Whether the household has water pump 447.1 274.5 366.4
(569.8) (694.8) (957.9)

124
Table A13 (cont.)
Overall Undernourished Nourished
Whether the household has tractors 1080.9*** 1395.9*** 345.5
(488.9) (592.4) (847.8)
Whether the household has irrigation 3340.2*** 3463.6*** 2541.2
(829.7) (886.4) (1856.2)
Local market liberalization 36.36** 16.69 22.80
(18.66) (26.47) (28.34)
Off-farm work opportunities -2889.5*** -1503.4 -2531.3*
(1145.2) (1580.6) (1711.3)
Agricultural commercialization
Instrumented agricultural production 0.00193*** 0.00208*** 0.00162***
(0.000285) (0.000299) (0.000524)
Grains quota prior to 1995 -0.00290*** -0.00261* 0.00195
(0.00142) (0.00181) (0.00452)
Grain quota post to 1995 -0.00115 0.0000894 -0.00304***
(0.000921) (0.00124) (0.00153)
Land -0.157*** -0.616*** -0.114***
(0.0553) (0.144) (0.0577)
Household head age -0.283*** -0.256*** -0.261***
(0.0804) (0.0985) (0.131)
Household head education 0.154 -0.220 0.760***
(0.214) (0.272) (0.328)
Household head gender -1.214 -9.037*** 6.039
(2.995) (4.079) (4.237)
Local market liberalization 0.114* 0.392*** -0.0939
(0.0746) (0.110) (0.105)
Number of private enterprises in the 0.232*** 0.358*** -0.0604
community (0.0531) (0.0792) (0.0844)
Community modern markets score 0.288 -0.123 1.336***
(0.310) (0.412) (0.480)
Community communication score -1.559*** -2.621*** -0.604
(0.727) (0.969) (1.114)

125
Table A13 (cont.)
Overall Undernourished Nourished
Off-farm work opportunities 13.58*** 3.617 24.70***
(4.026) (6.312) (6.571)
Household food security
Instrumented agricultural
commercialization
0.388*** 0.0717 -0.137
(0.134) (0.0512) (0.115)
Household net income 0.0000415 0.0000152 -0.0000225
(0.0000685) (0.0000766) (0.0000567)
Household net income squared -4.02e-11 -1.93e-10 1.15e-10
(2.65e-10) (9.53e-10) (2.21e-10)
Household head age 0.00554 0.0249 -0.0812*
(0.0538) (0.0224) (0.0553)
Household head education 0.00188 0.0886* 0.256*
(0.130) (0.0560) (0.161)
Household head gender 1.421 2.212*** 0.167
(1.812) (0.905) (2.160)
Community communication score 0.681 -0.142 -0.587
(0.496) (0.256) (0.537)
Community modern markets score 0.118 -0.00606 0.620***
(0.194) (0.0840) (0.252)
Land 0.0517 0.0146 0.00557
(0.0362) (0.0413) (0.0277)
Instrumented agricultural production -0.000132 -0.0000554 0.000505**
(0.000234) (0.000129) (0.000261)
Local market liberalization -0.0652 0.00438 -0.0569
(0.0505) (0.0326) (0.0493)
Rice price -0.433 -0.183 -1.680*
(0.505) (0.246) (1.084)
Pork price -0.110 0.0122 -0.615***
(0.194) (0.103) (0.275)
Vegetables price -0.0925 0.195 -0.293
(0.626) (0.381) (0.999)

126
Table A13 (cont.)
Overall Undernourished Nourished
Soybeans oil price -0.706*** -0.0944 -0.628**
(0.274) (0.120) (0.351)
Note: *, **, *** indicates significance level 15%, 10% and 5%. Standard errors are in parenthesis. All
regressions include county and year dummies.
Table A14. Full Regression Results Excluding Off-farm Work Opportunities in the
Nutrition Equation by Agricultural Production Type
Field crops Horticulture Livestock
Agricultural production
Land 74.13*** -19.53*** 2.607
(10.22) (8.283) (4.529)
Household head age 43.70*** 53.45*** 6.180
(14.14) (11.46) (6.265)
Household head education -91.19*** 60.42** -8.816
(40.68) (32.96) (18.02)
Household head gender 265.8 508.5 -127.7
(0= heads are a female and a male) (567.7) (459.9) (251.5)
Whether the household has water pump -504.9 556.0* 196.3
(436.7) (354.0) (192.6)
Whether the household has tractors 1081.6*** -203.7 187.3
(374.8) (303.8) (165.2)
Whether the household has irrigation 651.5 2473.9*** 504.6**
(633.4) (513.4) (279.3)
Local market liberalization 14.46 17.75* 3.664
(14.07) (11.40) (6.233)
Off-farm work opportunities -4425.5*** 2910.3*** -1315.9***
(863.4) (700.3) (382.2)
Agricultural commercialization
Instrumented agricultural production 0.00124*** 0.00333*** 0.0109***
(0.000279) (0.000421) (0.00120)

127
Table A14 (cont.)
Field crops
Horticulture
Livestock
Grains quota prior to 1995 0.0000173 -0.00119 0.00328
(0.00200) (0.00221) (0.00245)
Grain quota post to 1995 0.00356*** 0.00167* 0.00210**
(0.00114) (0.00112) (0.00124)
Land 0.0535 0.0984 0.0207
(0.0658) (0.0741) (0.0810)
Household head age -0.174*** -0.0786 -0.160
(0.0886) (0.105) (0.112)
Household head education 0.0240 -0.123 -0.328
(0.253) (0.295) (0.323)
Household head gender -4.889 2.960 3.659
(3.525) (4.101) (4.503)
Local market liberalization 0.243*** -0.198** 0.166*
(0.0876) (0.102) (0.112)
Number of private enterprises in the 0.207*** 0.178*** -0.126*
community (0.0690) (0.0784) (0.0870)
Community modern markets score 1.052*** -0.562 0.803**
(0.371) (0.428) (0.469)
Community communication score -4.216*** -0.870 -2.015**
(0.865) (0.996) (1.108)
Off-farm work opportunities -10.26** 8.765 -16.52***
(5.551) (6.354) (7.140)
Household food security
Instrumented agricultural
commercialization
0.0735 0.146*** -0.0899
(0.0615) (0.0539) (0.0670)
Household net income 0.000120*** 0.0000916*** 0.000100***
(0.0000345) (0.0000361) (0.0000457)
Household net income squared -3.59e-10*** -1.96e-10 -2.59e-10
(1.79e-10) (1.99e-10) (2.25e-10)
Household head age -0.0477 -0.0553* -0.0719**
(0.0384) (0.0367) (0.0399)

128
Table 14 (cont.)
Field crops
Horticulture
Livestock
Household head education 0.0517 0.0280 0.00758
(0.102) (0.104) (0.108)
Household head gender 1.855 0.911 1.634
(1.460) (1.469) (1.452)
Community communication score 0.404 0.189 -0.0342
(0.436) (0.372) (0.371)
Community modern markets score 0.307** 0.469*** 0.426***
(0.166) (0.152) (0.151)
Land 0.00569 0.0228 0.0225
(0.0267) (0.0262) (0.0262)
Instrumented agricultural production 0.0000440 -0.000101 0.000109
(0.0000772) (0.0000759) (0.000125)
Local market liberalization -0.0196 0.0243 0.0214
(0.0391) (0.0371) (0.0384)
Rice price -0.359 -0.406 -0.227
(0.530) (0.531) (0.509)
Pork price -0.0964 0.00158 -0.0364
(0.172) (0.172) (0.176)
Vegetables price -0.0542 -0.208 0.0523
(0.710) (0.616) (0.655)
Soybeans oil price -0.538*** -0.522*** -0.542***
(0.215) (0.209) (0.211)
Note: *, **, *** indicates significance level 15%, 10% and 5%. Standard errors are in parenthesis. All
regressions include county and year dummies.
Table A15 presents full robustness tests using provincial dummies instead of county
dummies by nourishment. Market liberalization decreases agricultural production for
undernourished households, while local market liberalization increases commercialization for
the overall sample and undernourished households. However, market liberalization decreases
nutrition for overall and the nourished.

129
From table A16, it seems that higher educated households produce more horticulture
compared to field crops. Off-farm work opportunities increase production and
commercialization of horticulture but decrease the production and commercialization of field
crops. It is interesting to see that the number of enterprises only decreases the
commercialization of livestock. Local market liberalization increases the commercialization
of field crops and livestock but not of horticulture. Regarding the nutrition equation,
household income, education, and off-farm opportunities increase nutrition. Rice price
decreases nutrition while pork price increases nutrition.
Table A15. Full Robustness Tests Using Provincial Dummies by Nourishment
Overall Undernourished Nourished
Agricultural production
Land 85.14*** 216.2*** 49.36***
(13.23) (27.14) (15.63)
Household head age 101.3*** 87.68*** 102.7***
(19.35) (23.44) (32.13)
Household head education -27.29 57.51 -145.9*
(53.53) (63.69) (90.04)
Household head gender -148.1 471.9 -762.8
(0= heads are a female and a male) (778.3) (982.5) (1223.6)
Whether the household has water pump 684.9 260.2 1650.7**
(583.2) (707.4) (972.1)
Whether the household has tractors 1022.0*** 1388.8*** 630.4
(491.8) (580.2) (859.1)
Whether the household has irrigation 2516.4*** 2738.0*** 2445.9
(816.3) (860.0) (1922.8)
Local market liberalization 11.45 -33.20** 41.60**
(14.47) (18.84) (22.59)
Off-farm work opportunities -4692.2*** -2287.3** -6916.9***
(969.2) (1365.1) (1493.1)

130
Table A15 (cont.)
Field crops Horticulture Livestock
Agricultural commercialization
Instrumented agricultural production 0.00146*** 0.00153*** 0.00148***
(0.000285) (0.000311) (0.000544)
Grains quota prior to 1995 -0.00288** -0.00188 -0.00342
(0.00156) (0.00192) (0.00467)
Grain quota post to 1995 0.000922 0.00148 -0.00111
(0.00101) (0.00140) (0.00177)
Land -0.0939* -0.312*** -0.0600
(0.0580) (0.137) (0.0627)
Household head age -0.276*** -0.263*** -0.289***
(0.0854) (0.108) (0.140)
Household head education 0.281 -0.248 0.829***
(0.219) (0.284) (0.341)
Household head gender -1.051 -4.115 1.782
(3.189) (4.398) (4.572)
Local market liberalization 0.130*** 0.383*** -0.0725
(0.0597) (0.0837) (0.0894)
Number of private enterprises in the -0.00390 0.0759 -0.0669
community (0.0463) (0.0692) (0.0867)
Community modern markets score 0.201 0.383 -0.372
(0.293) (0.386) (0.470)
Community communication score -1.357** -2.602*** 0.521
(0.701) (0.936) (1.069)
Off-farm work opportunities 13.83*** 5.135 18.48***
(4.201) (6.102) (6.409)
Household food security
Instrumented agricultural
commercialization
0.688*** 0.117* 0.0556
(0.226) (0.0742) (0.176)
Household net income 0.000188*** 0.000114 -0.00000570
(0.0000699) (0.0000826) (0.0000548)

131
Table A15 (cont.)
Field crops Horticulture Livestock
Household net income squared -5.44e-10** -1.30e-09 1.11e-10
(2.95e-10) (1.04e-09) (2.51e-10)
Household head age 0.136** 0.0350 -0.0188
(0.0752) (0.0273) (0.0672)
Household head education -0.0513 0.150*** 0.212
(0.165) (0.0583) (0.208)
Household head gender 1.701 2.116*** -0.872
(1.982) (0.943) (2.002)
Community communication score 1.514*** 0.336 -0.177
(0.512) (0.254) (0.469)
Community modern markets score 0.00379 -0.0230 0.408**
(0.174) (0.0763) (0.221)
Land 0.0885*** 0.0658** -0.00220
(0.0410) (0.0364) (0.0286)
Instrumented agricultural production -0.00116*** -0.000312*** 0.000313
(0.000362) (0.000139) (0.000286)
Off-farm work opportunities -1.236 3.302*** -3.499
(4.136) (1.590) (4.321)
Market liberalization -0.101*** -0.0326 -0.0778**
(0.0437) (0.0283) (0.0399)
Rice price -1.454*** -0.829*** -0.222
(0.449) (0.208) (0.835)
Pork price 0.610*** 0.103 -0.304
(0.243) (0.0985) (0.224)
Vegetables price 1.066 0.185 -1.600**
(1.009) (0.559) (0.855)
Soybeans oil price 0.0795 0.212** -0.158
(0.237) (0.128) (0.207)
Note: *, **, *** indicates significance level 15%, 10% and 5%. Standard errors are in parenthesis. All
regressions include county and year dummies.

132
Table A16. Full Robustness Tests Using Provincial Dummies by Agricultural
Production Type
Field crops Horticulture Livestock
Agricultural production
Land 104.0*** -16.47*** -1.922
(9.888) (8.059) (4.360)
Household head age 37.00*** 54.20*** 9.985*
(14.46) (11.78) (6.376)
Household head education -125.3*** 102.0*** -2.348
(40.01) (32.60) (17.64)
Household head gender -218.3 335.3 -277.7
(0= heads are a female and a male) (581.6) (474.0) (256.5)
Whether the household has water pump -522.6 729.1*** 334.8**
(436.0) (352.9) (192.0)
Whether the household has tractors 1123.0*** -292.1 147.9
(368.1) (297.8) (162.1)
Whether the household has irrigation 340.0 2226.7*** 29.75
(611.2) (496.8) (268.9)
Local market liberalization 0.950 13.98* -3.929
(10.81) (8.814) (4.769)
Off-farm work opportunities -6308.1*** 2000.7*** -428.3
(724.3) (590.3) (319.4)
Agricultural commercialization
Instrumented agricultural production 0.000990*** 0.00367*** 0.00634***
(0.000294) (0.000441) (0.00123)
Grains quota prior to 1995 0.000583 0.00163 0.00148
(0.00210) (0.00232) (0.00250)
Grain quota post to 1995 0.00559*** -0.000768 0.00144
(0.00123) (0.00120) (0.00129)
Land 0.128** -0.0277 -0.0184
(0.0704) (0.0762) (0.0800)
Household head age -0.258*** -0.0499 -0.0975
(0.0955) (0.112) (0.115)

133
Table A16 (cont.)
Field crops Horticulture Livestock
Household head education -0.165 0.187 -0.156
(0.264) (0.306) (0.319)
Household head gender -3.715 2.669 2.672
(3.819) (4.384) (4.639)
Local market liberalization 0.182*** -0.0000116 0.178***
(0.0714) (0.0822) (0.0866)
Number of private enterprises in the -0.00569 -0.0440 -0.172***
community (0.0653) (0.0745) (0.0805)
Community modern markets score 0.865*** -0.760** 0.975***
(0.358) (0.407) (0.431)
Community communication score -2.694*** -0.446 -3.148***
(0.836) (0.958) (1.012)
Off-farm work opportunities -18.92*** 10.79** -0.916
(5.106) (5.681) (5.974)
Household food security
Instrumented agricultural
commercialization
0.118*** -0.110* -0.0189
(0.0584) (0.0737) (0.113)
Household net income 0.000156*** 0.000157*** 0.000152***
(0.0000377) (0.0000395) (0.0000506)
Household net income squared -3.11e-10* -3.57e-10* -3.12e-10
(2.00e-10) (2.24e-10) (2.68e-10)
Household head age -0.0494 -0.0550 -0.0732**
(0.0428) (0.0395) (0.0404)
Household head education 0.231*** 0.265*** 0.199**
(0.108) (0.117) (0.107)
Household head gender 1.694 1.542 1.105
(1.577) (1.581) (1.513)
Community communication score 1.013*** 0.632** 0.623
(0.378) (0.359) (0.458)
Community modern markets score 0.0107 -0.00480 0.106
(0.144) (0.160) (0.185)

134
Table A16 (cont.)
Field crops Horticulture Livestock
Land -0.0304 -0.00442 0.00444
(0.0299) (0.0305) (0.0296)
Instrumented agricultural production 0.000143** 0.000117 0.000130
(0.0000808) (0.0000960) (0.000156)
Off-farm work opportunities 13.48*** 12.00*** 10.00***
(2.507) (2.747) (2.079)
Market liberalization -0.0437* -0.0160 -0.0213
(0.0300) (0.0298) (0.0313)
Rice price -1.675*** -1.379*** -1.668***
(0.437) (0.501) (0.494)
Pork price 0.409*** 0.359*** 0.360***
(0.150) (0.139) (0.150)
Vegetables price 0.126 -0.0844 -0.164
(0.756) (0.614) (0.634)
Soybeans oil price 0.251* 0.210 0.221
(0.164) (0.183) (0.232)
Note: *, **, *** indicates significance level 15%, 10% and 5%. Standard errors are in parenthesis. All
regressions include county and year dummies.