the effects of computer use in science and mathematics education upon the computer literacy of...
TRANSCRIPT

JOURNAL OF RESEARCH IN SCIENCE TEACHING VOL. 21, NO. 1, PP. 39-46 (1984)
THE EFFECTS OF COMPUTER USE IN SCIENCE AND MATHEMATICS EDUCATION UPON THE COMPUTER LITERACY OF
PRESERVICE ELEMENTARY TEACHERS
MICHAEL T. BATTISTA
Department of Elementary and Secondary Education Kent State University, Kent, Ohio 44242
GERALD H. KROCKOVER
Departments of Education and Geosciences Purdue University, West Lafayette, Indiana 4 790 7
Abstract
This study investigated the effects of computer use upon the computer literacy of pre- service elementary teachers using two methods of instruction: computer assisted instruction in an earth science course and computer programming in a mathematics education course. Com- puter literacy was measured by the Minnesota Computer Literacy and Awareness Assessment (MCLAA). For each component of computer literacy, differences in group posttest scores were compared using an analysis of covariance with pretest scores used as the covariate. Pre- to post- test increases in scores for each group were also examined. The results indicated that the treat- ment given to the computer programming group had little or no effect upon the students’ com- puter literacy, while the treatment given to the computer assisted instruction group had a sig- nificant effect upon the affective subscale of the MCLAA. A positive effect was also indicated on the cognitive subscale of the MCLAA. Thus, it appears that an effective method for improv- ing preservice elementary teachers’ computer literacy is to involve them in computer assisted instruction, possibly through a science course.
Introduction
The widespread use of computers in our society and the low cost of microelectronics has stimulated the demand for microcomputer acquisition by elementary schools. The National Science Foundation (NSF) has estimated that more than 200,000 microcomputers are presently in use in elementary and secondary schools in the United States. The NSF has also predicted that the number of microcomputers utilized in classrooms will increase to over one million by 1985. As a result, leaders in education have become aware of the urgent need for computer literacy on the part of preservice teachers (Battista, 1981 ; Gleason, 1981 ; Zucker, 1982).
Computer literacy may be defined as the knowledge of the nontechnical and low-technical aspects of the capabilities and limitations of computers, and of the social, vocational, and edu- cation implications of computers (Moursund, 1975). Computer literacy is now ranked as one of the 10 basic skills needed in mathematics and science education (National Council of Super-
@ 1984 by the National Association for Research in Science Teaching Published by John Wiley & Sons, Inc. CCC 0022-4308/84/010039-08$01.80
40 BATTISTA AND KROCKOVER
visors of Mathematics, 1978). Johnson, Anderson, Hansen, and Wassen (1 980) have developed a set of objectives and an evaluation assessment for computer literacy. The affective objectives relate to the area of attitude, values, and motivation, while the cognitive objectives relate to the areas of computer hardware, programming and algorithms, applications, and impact. The Minnesota Computer Literacy and Awareness Assessment (MCLAA) is an outgrowth of these objectives.
While it appears to be widely accepted among mathematics and science educators that the development of computer literacy is a worthwhile educational goal for pre- and inservice teachers, there is a paucity of research to indicate the methods that should be used for pre- and inservice teachers to become computer literate. For example, should programming be empha- sized with preservice elementary teachers or is using a microcomputer for computer assisted in- struction sufficient for the establishment of basic computer literacy?
Problem
The purpose of this study was t o compare two methods of instruction for improving the computer literacy of preservice elementary teachers as measured by the MCLAA. One method was to involve the preservice teachers in computer assisted instruction through quizzes and simulations administered by a computer. The other method was to involve the preservice teachers in computer programming by having them write programs, and enter and run pre- written programs in BASIC.
Method
The subjects for the study were 94 preservice elementary teachers enrolled in one of two courses, Earth Science for Elementary Teachers or Teaching Mathematics in the Elementary School. The students were divided into three groups, each group taught by a different instruc- tor. The CAI group consisted of one intact class of students who were enrolled in the Earth Science course and who participated in computer assisted instruction (CAI) during the experi- mental period. The Programming group consisted of one intact class of students who were enrolled in the Teaching Mathematics course and who participated in computer programming activities during the experimental period. The Control group consisted of two intact classes of students who were enrolled in the Teaching Mathematics course and were not exposed to com- puters or computer assisted instruction during the experimental period.
During the experimental period, students in the CAI group took a total of four quizzes administered by a microcomputer. The quiz items were based upon assigned reading and labora- tory experiments, and correct answers to items were given by the microcomputer after a period of interaction. Students also participated in three earth science computer simulation activities. The total time students spent using the microcomputer was approximately four hours. Students in the CAI group were told how to take the quizzes and how to use the simulations on the microcomputer, but were given no other information concerning computers, programming, or educational uses of computers. All quiz and simulation programs were loaded into the com- puter from a cassette recorder or disk by the instructor.
Students in the Programming group were given the university computing center beginner’s document on programming PDP 11/70 computers in BASIC using remote terminals. Two 50- minute class periods of instruction were dedicated to using the terminals and programming in BASIC. Students were given two computer assignments which were to be handed in and graded. The first assignment required students to enter and run several short programs that illustrated various tasks that can be performed by a computer. The second assignment required students to
EFFECTS OF COMPUTER USE 41
choose one of several problems and solve it using the computer. The treatment for the Program- ming group emphasized independent learning by the students through experimentation with the computer. Students in the Control group were given no explicit instruction on computers or computer use. The Programming and Control groups were taught the same material except for the programming topics taught to the Programming group.
The experimental period began with the pretest, given the second week of a 16-week semester, and ended with the posttest, given the fourteenth week of the semester. The MCLAA (Anderson, Hansen, Johnson, & Klassen, 1979a) was used for both the pretest and the posttest. This instrument was used to measure the affective and cognitive knowledge students had con- cerning computers. The total test consisted of 83 items.
The affective subscale of the MCLAA consisted of 30 items. This subscale was designed to measure the attitudes and values subjects had concerning computers. Students responded on a five-point semantic differential scale or on a three-point semantic differential scale. The affec- tive subscale measured the following attitudes and values (Anderson, Klassen, Johnson, & Hansen, 1979b):
0
0
0
0
0
0
Enjoyment measured the amount of pleasure students associated with computers. Anxiety measured the level of stress students attributed to computers. Efficacy measured the level of confidence students exhibited in relation to work- ing with computers. Education measured the attitudes students exhibited toward the use of computers in schools. Social values measured the importance of certain social and personal values to students. Technical values measured the importance of technical values to students.
The cognitive subscale consisted of 53 test items. This subscale was designed to measure the knowledge students possessed about technical areas related to the computer. The cognitive subscale measured knowledge of the following technical areas (Anderson, Klassen, Johnson, & Hansen, 1979b):
0
0
0
Hardware measured students’ understanding of the major components of a com- puter. Software measured students’ understanding of the nature of programming and data processing. Programming measured the ability of students to follow, modify, correct, and develop programs, flowcharts, and algorithms. AppZication measured students’ knowledge of the uses of computers in society. Impact measured students’ awareness of the possible positive and negative effects of computer usage in society.
Anderson, Klassen, Johnson, & Hansen (1979b) reported the overall test reliability of the MCLAA as measured by the Cronbach Alpha to be 0.90. Reliability for subjects in the present study was established based upon pretest scores using the Cronbach Alpha (SPSS: 23: Reli- ability computer program). Reliability for the 94 subjects was 0.83 on the affective section, 0.87 on the cognitive section, and 0.87 for the total test. These reliabilities are consistent with the results reported by Anderson, Klassen, Johnson, and Hansen (1979b).
For each component of computer literacy, differences in the group posttest scores were compared using an analysis of covariance, with the pretest score for the component used as the covariate. Analysis of covariance was used to adjust for a possible source of bias in posttest scores due to differences in group pretest scores.
42 BATl'ISTA AND KROCKOVER
Results
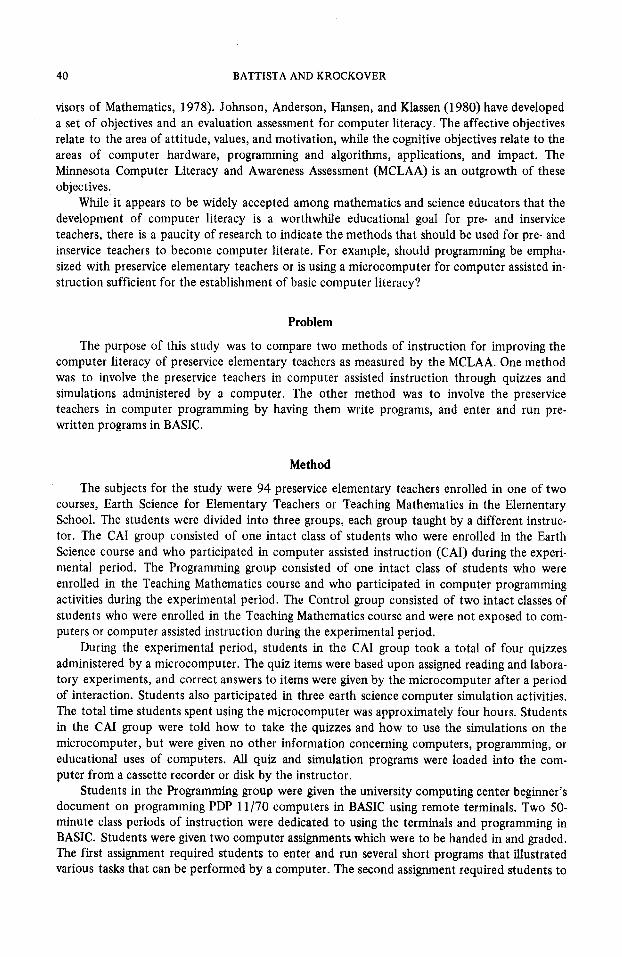
The pre- and posttest means for each group and each component of computer literacy are listed in Table I. The magnitudes of pre- to posttest increases in scores on the affective and cognitive totals should be noted. The increase in the affective total for the CAI group (14.19) was almost seven times the increase for the other two groups (Programming 1.83, Control 2.06). The increase in the cognitive total for the CAI group (6.65) was twice as large as the increase for the other two groups (Programming 2.94, Control 2.79). The increases in the affective and cognitive totals for the Programming and Control groups were almost identical.
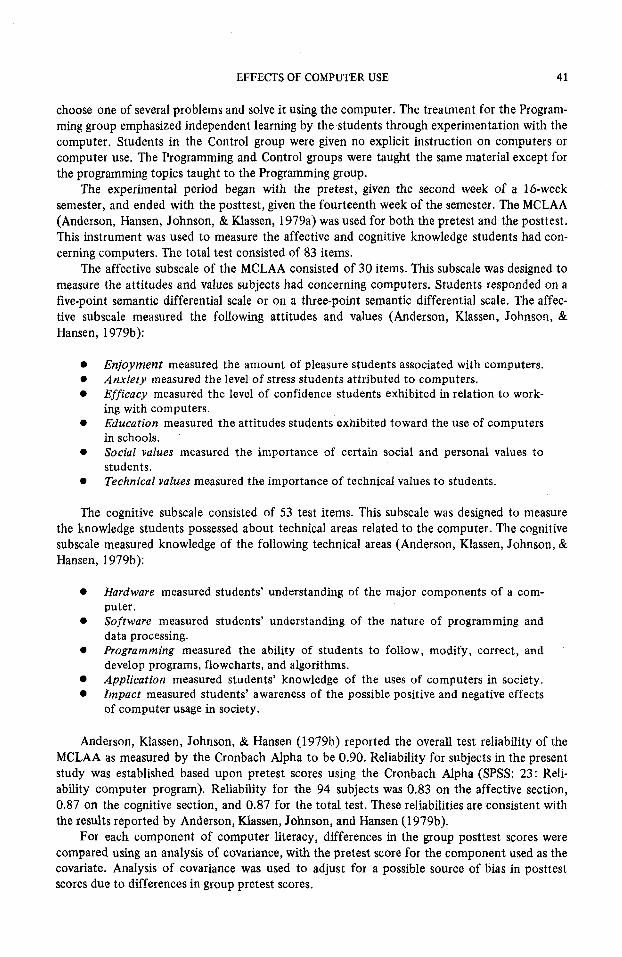
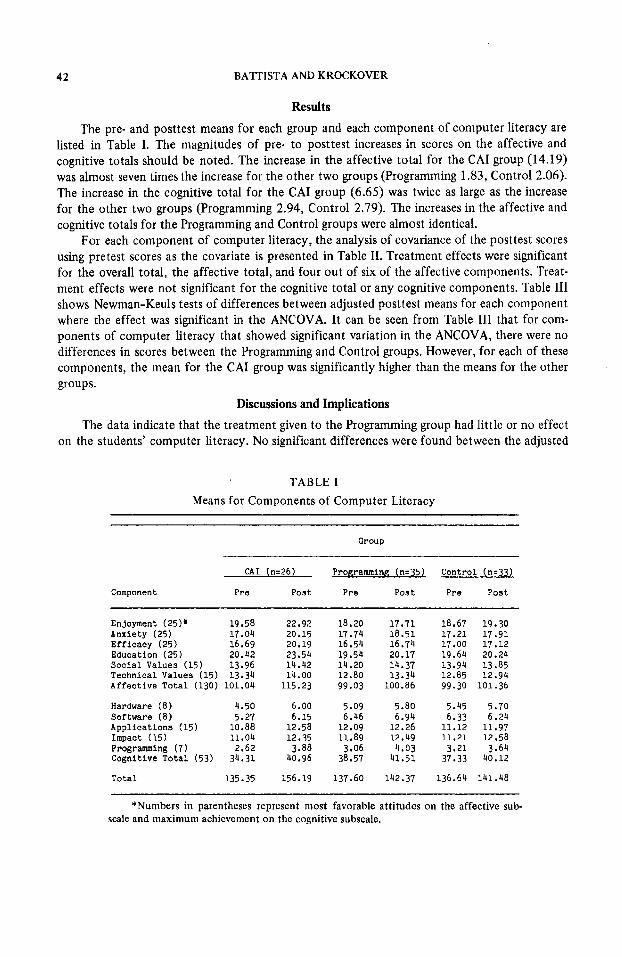
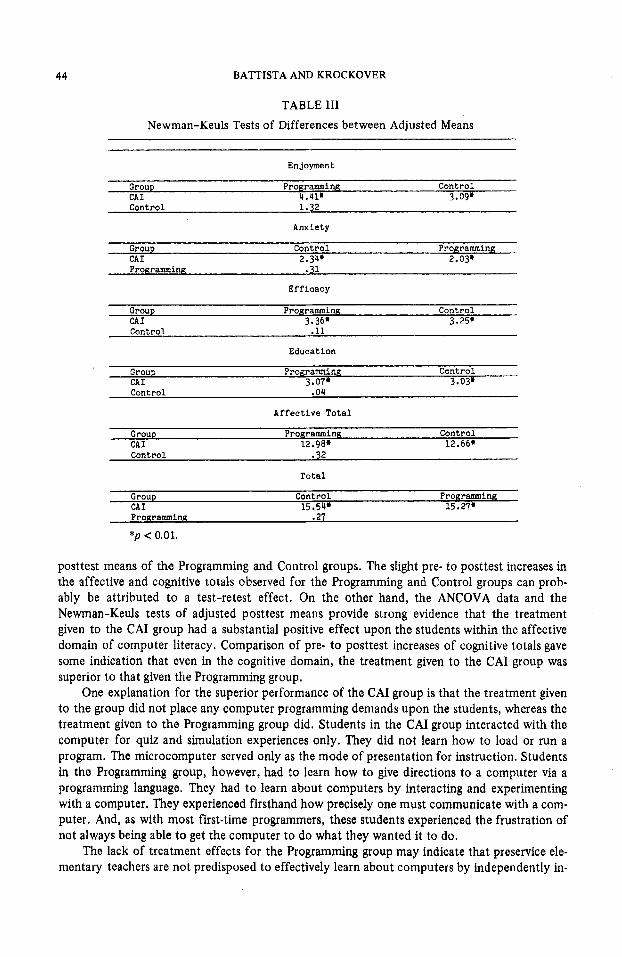
For each component of computer literacy, the analysis of covariance of the posttest scores using pretest scores as the covariate is presented in Table 11. Treatment effects were significant for the overall total, the affective total, and four out of six of the affective components. Treat- ment effects were not significant for the cognitive total or any cognitive components. Table 111 shows Newman-Keuls tests of differences between adjusted posttest means for each component where the effect was significant in the ANCOVA. It can be seen from Table 111 that for com- ponents of computer literacy that showed significant variation in the ANCOVA, there were no differences in scores between the Programming and Control groups. However, for each of these components, the mean for the CAI group was significantly higher than the means for the other groups.
Discussions and Implications The data indicate that the treatment given to the Programming group had little or no effect
on the students' computer literacy. No significant differences were found between the adjusted
TABLE I Means for Components of Computer Literacy
Group
C A I (n.26) Programming (11-35) Control (n-33)
Component Pre Post Pre Post Pre Post
Enjoyment (25)' Anxiety (25) Eff icacy (25) Education (25) Soc ia l Values (15) Technical Values (15) Affect ive To ta l (130)
19.58 17.04 16.69 20.42 13.96 13 - 34
101.04
Hardware (8) 4.50 Software (8) 5.27
Impact (15) 11.04 Programming (7 ) 2.62 Cognitive To ta l (53) 34.31
Total 135.35
Applicat ions (15) 10.88
22.92 20.15 20.19 23.54 14.42 14.00
115.23
6.00 6.15
12.58 12.35
40.96
156.19
3.88
18.20 17.71 18.67 17.74 18.51 17.21 16.54 16.74 17.00 19.54 20.17 19.64 14.20 14.37 13.94 12.80 13.34 12.85 99.03 100.86 99.30
5.09 5.80 5.45 6.46 6.94 6.33
12.09 12.26 11.12 11.89 12.49 11.21
3.06 4.03 3.21 38.57 41.51 37.33
137.60 142.37 136.64
19.30 17.91 17.12 20.24 13.85 12.94
101.36
5.70 6.24
11.97 12.58
3.64 40.12
141.48
*Numbers in parentheses represent most favorable attitudes on the affective sub- scale and maximum achievement on the cognitive subscale.
EFFECTS OF COMPUTER USE
TABLE I1 Analysis of Covariance of Posttests for Components
of Computer Literacy -_ -
Source of variation df Ms F
43
Enjoyment Treatment 2 145.00 17.26" Pretest 1 506.98 60.34.. Error 90 8.40
Treatment 2 45.59 5.20. Anxiety
Pretest 1 330.99 37.83" Error 90 8.75
Treatment 2 103.02 18.73'. Pretest 1 334.10 60.73.. Error 90 5.50
Treatment 2 85.07 12.87.. Pretest 1 102.32 15.34.. Error 90 6.67
Efficacy
Education
-- Social Values
Pretest 1 6.17 4.17 Error 90 1.48
Technical Values Treatment 2 5.41 2.05
Treatment 2 2.89 1.96
Pretest 1 48.17 18.28.. ~~ ....~
Error 90 2.64
Treatment 2 1536.51 26.18" Pretest 1 5097.64 86.85..
Affective Total
Error 90 58.69
Treatment 2 3.11 2.17 Pretest 1 40.62 28.32- Error 90 1.43
Treatment 2 3.63 2.55 Pretest 1 34.08 23.94.'
Hardware
-____ Software -
Error 90 1.42 __ Applications -
Treatment 2 4.09 1.45 Pretest 1 31.13 11.03.' Error 90 2.82
Treatment 2 1.18 .58 Pretest 1 95.28 46.65.' Error 90 2.04
Treatment 2 2.59 1.72 Pretest 1 49.66 33.09.. Error 90 1.50
Treatment 2 34.44 2.08
Impact
Programming
Coanltive Total
Pretest 1 1019.87 61.45'" Error 90 16.60
Treatment 2 2223.38 29.14.. Pretest 1 7445.06 97.56.. Error 90 76.31
Total
* p < 0.01. **p < 0.001.
44 BATTISTA AND KROCKOVER
TABLE 111 Newman-Keuls Tests of Differences between Adjusted Means
Enjoyment
Group Programming Control CAI 4.41' 3-09" Control 1.32
Anxiety
Group Control Programming
Programming .31 CAI 2.34' 2.03.
Efficacy
Group Programming Control CAI 3.36' 3.25' Control .ll
Education
Group Programming Control CAI 3-07. 3.03'
Affective Total
Group Programming Control CAI 12.984 12.66'
Total
Group Control Programming CAI 15.54. 15.27' Programing .27
* p < 0.01.
posttest means of the Programming and Control groups. The slight pre- to posttest increases in the affective and cognitive totals observed for the Programming and Control groups can prob- ably be attributed to a test-retest effect. On the other hand, the ANCOVA data and the Newman-Keuls tests of adjusted posttest means provide strong evidence that the treatment given to the CAI group had a substantial positive effect upon the students within the affective domain of computer literacy. Comparison of pre- to posttest increases of cognitive totals gave some indication that even in the cognitive domain, the treatment given to the CAI group was superior to that given the Programming group,
One explanation for the superior performance of the CAI group is that the treatment given to the group did not place any computer programming demands upon the students, whereas the treatment given to the Programming group did. Students in the CAI group interacted with the computer for quiz and simulation experiences only. They did not learn how to load or run a program. The microcomputer served only as the mode of presentation for instruction. Students in the Programming group, however, had to learn how to give directions to a computer via a programming language. They had to learn about computers by interacting and experimenting with a computer. They experienced firsthand how precisely one must communicate with a com- puter. And, as with most first-time programmers, these students experienced the frustration of not always being able to get the computer to do what they wanted it to do.
The lack of treatment effects for the Programming group may indicate that preservice ele- mentary teachers are not predisposed to effectively learn about computers by independently in-
EFFECTS OF COMPUTER USE 45
teracting and experimenting with a computer. If these students are to learn about computers though programming experiences, a significant amount of guidance and support may be re- quired. Possibly a special computer science course that covers programming and applications of computers in education would be most beneficial (Milner, 1980).
Much more research is needed to determine the most effective methods for improving the computer literacy of preservice elementary teachers. Several limitations of the present study suggest directions for future research. First, the type of computer used was not controlled. The question arises, are there differences in attitudes and knowledge between students who use microcomputers and students who use terminals for computer assisted instruction or computer programming? In the present study, students interacted individually with a microcomputer or with a computer terminal. Most of the students did not know the difference. In fact, to those unfamiliar with computers, there are very few apparent differences between using a micro- computer and being logged on to one of Purdue University’s interactive computer terminals. So there is no reason to believe that computer hardware was a contributing factor in the present study.
A second limitation of the present study is that neither the content of the courses nor the instructars were controlled. The effect that lack of control of instructors had on the results should have been minimized, since both treatments emphasized students working at the com- puters independently. However, the lack of control of course content, together with lack of control of instructors, could have affected the results in that students’ overall feelings about the courses may have affected their feelings about the computer activities. Future studies in this area ahould be designed to detect if the treatment effects found in the present study depend upon course content, instructor, or students’ overall feelings about the courses in which CAI or Programming activities are assigned. Investigating the effects of different types of CAI and Pro- gramming inatructlon would also be worthwhile.
Nevertheless, if we wish to improve the computer literacy of preservice elementary teachers in the affective domain, the results of the present study suggest that one way to accomplish this i s to involve them, as students, in computer assisted instruction in a science content course using microcomputers, In this way, preservice teachers can be exposed to computers without requiring them to learn a great deal of technical material. They can experience firsthand one of the major educational uses of computers-computer assisted instruction, the use they are most likely to utilize when they begin teaching. Furthermore, if this method is successful in improv- ing preservice teachers’ attitudes and feelings towards computers, they may seek to increase their knowledge about computers and they may be more likely to utilize microcomputers in their own clamrooms when they begin teaching.
References
Anderson, R. E., Hanslen, T. P,, Johnson, D. C., & Klassen, D. L. Minnesota computer I/t@mey and marenes8 assessm@n€. St, Paul, MN: Minnesota Educational Computing Consortiurn, 1979a,
AndQmtl, R, E., Klasssn, D. L., Jahnson, €3, C,, & Hansen, T. P. The Minnesota computer lit@rrssy belts: I bechflicral report Qn the MECC computer literacy field study. St. Paul, MN: Minnaaota Educational Computing Consortium, October 1979b. (NSF No. SED 77-1 8658).
Batthta, M, T, Computer Utsracy of fifth grade students and preservice elementary teachers involved in computer programming instruction. 7’he Computing Teacher, 1981, 9,37-39,2,2.
Gleason, G . T, Micracomputars in education: the state of the art. Educational Technology,
Johnson, D, C., Anderson, R. E., Hanson, T. P., & Klassen, D. L. Computer literacy-what 1981, 21,7-18,
is it?Mathematics Teacher, 1980, 73,91-96.
46 BATTISTA AND KROCKOVER
Milner, S. D. Teaching teachers about computers: a necessity for education. Phi Delta
Moursund, D. What is computer literacy? Oregon Council for Computer Education, 1975,
National Council of Supervisors of Mathematics. Position statements on basic skills. Mathe-
Zucker, A. A. The computer in the school: a case study. Phi Delta Kappan, 1982,63,317-
Kappan, 1980,61,544-546.
2,2.
matics Teacher, 1978, 71, 147-152.
319.
Manuscript accepted April 12,1983