the effects of differentiated instruction on …
TRANSCRIPT
THE EFFECTS OF DIFFERENTIATED INSTRUCTION ON UNDERSTANDING
MIDDLE SCHOOL SCIENCE CONCEPTS
by
Robin M. Scardino
A professional paper submitted in partial fulfillment of the requirements for the degree
of
Master of Science
in
Science Education
MONTANA STATE UNIVERSITY Bozeman, Montana
July 2011
ii
STATEMENT OF PERMISSION TO USE
In presenting this professional paper in partial fulfillment of the requirements for
a master’s degree at Montana State University, I agree that the MSSE Program shall
make it available to borrowers under rules of the program.
Robin Michelle Scardino
July 2011

iii
TABLE OF CONTENTS
INTRODUCTION AND BACKGROUND ................................................................................... 1
CONCEPTUAL FRAMEWORK ................................................................................................... 3
METHODOLOGY ......................................................................................................................... 9
DATA AND ANALYSIS ............................................................................................................. 18
INTERPRETATION AND CONCLUSION ................................................................................ 38
VALUE ......................................................................................................................................... 44
REFERENCES CITED ................................................................................................................. 47
APPENDICES .............................................................................................................................. 49
APPENDIX A: Project Consent Forms ........................................................................... 50 APPENDIX B: Nontreatment Lab Worksheet: Wat-ar Densities ................................... 53 APPENDIX C: Preunit and Postunit Test for Treatment and Nontreatment Units ......... 55 APPENDIX D: Student Learning Profile Survey ............................................................ 59 APPENDIX E: Graphic Organizers for States of Matter and Changes of State Textbook Readings from Treatment Unit 2: Boiling Point .................... 62 APPENDIX F: Flinker Scaffolded Laboratory Assignment for Treatment Unit 1: Buoyancy ................................................................................................ 67 APPENDIX G: Time to Boil Laboratory Assignment Scaffolded for Low, Middle, and High-Achieving Students for Treatment Unit 2: Boiling Point ....... 76 APPENDIX H: Rubric for Learning Profile Alternative Products ................................... 83 APPENDIX I: Treatment Unit 1: Tiered Homework Assignment .................................. 88 APPENDIX J: Student Weekly Journal Prompts ............................................................ 90 APPENDIX K: Preunit and Postunit Student Interview Questions .................................. 92 APPENDIX L: Teacher Attitude Survey .......................................................................... 96 APPENDIX M: Teacher Journal Prompts ........................................................................ 98 APPENDIX N: Teacher Planning Log ........................................................................... 100 APPENDIX O: Project Timeline .................................................................................... 102

iv
LIST OF TABLES
1. Triangulation Matrix of Data Sources by Project Question ...................................................... 15
2. Sample Responses from Treatment Unit 2 Categorized by Level of Understanding ............... 19
3. Sample Journal Responses Categorized as Below, On or Above Expected Level ................... 21
4. Sample Pre and Posttest Questions from Treatment Unit 1 Categorized by Cognitive Level . 22
5. Percent Change from Preunit to Postunit Test Categorized by Cognitive Level ...................... 24
6. Percent Change from Preunit to Postunit Interviews Categorized by Cognitive Level ............ 25
7. Sample Journal Responses Categorized by Cognitive Level .................................................... 27
8. Percent Change from Preunit to Postunit Test Categorized by Achievement Level ................ 29
9. Percent Change from Preunit to Postunit Interview Categorized by Achievement Level ........ 31
10. Teacher Journal Responses Regarding Preparation Time Needed ......................................... 34
11. Teacher Journal Responses Regarding Differentiated Teaching Methods ............................. 34
12. Positive Teacher Journal Responses ....................................................................................... 37
13. Negative Teacher Journal Responses ...................................................................................... 38
v
LIST OF FIGURES
1. Average Pretest and Posttest Scores ......................................................................................... 18
2. Average Percentage of Correct Answers from Preunit and Postunit Interviews ...................... 20
3. Average Number of Student Journal Entries Categorized by Understanding .......................... 21
4. Percentage of Correct Posttest Questions Categorized by Cognitive Level ............................. 23
5. Percentage of Correct Postunit Interview Responses Categorized by Cognitive Level ........... 25
6. Number of Students’ Journal Responses Categorized by Cognitive Level .............................. 27
7. Amount of Gain from Pretest to Posttest Categorized by Achievement Level ........................ 28
8. Average Posttest Scores Categorized by Achievement Level .................................................. 29
9. Percent Gained from Preunit to Postunit Interviews Categorized by Achievement Level ....... 30
10. Percentage of Journal Responses Written Below Expected Level ......................................... 31
11. Average Teacher Survey Responses Regarding Preparation Time and Teaching Methods ... 32
12. Reasonableness of Preparation Time for Differentiated and Non-Differentiated Activities .. 33
13. Average Teacher Survey Responses Regarding Attitude, Motivation, and Role ................... 35
14. Comparison of Responses Regarding Motivation to Use Similar Activities .......................... 36

vi
ABSTRACT
Through daily observation, I realize that my traditional classroom environment does not sufficiently meet the learning needs of the wide variety of students in my classes. For example, as students work through daily laboratory experiments and class work, I consistently sense boredom in my high-achieving students alongside of confusion in my low-achieving students. The goal of this project was to better meet my students’ diverse learning needs. This project took place in two sixth-grade general science classes at a large international school in Hong Kong, China. It focused on how implementing differentiated instruction, which is instruction designed with student differences in mind, such as students’ background knowledge, instructional level, interests, and learning styles, affected students’ understanding of introductory chemistry concepts. Lessons implementing four differentiation methods of scaffolding, alternative learning products, tiered homework assignments, and graphic organizers were compared to traditional lessons where all students completed the same assignments and demonstrated their learning in the same format. Data revealing students’ understanding of concepts were collected through pre and postunit assessments, writings, and interviews, which included concept mapping and conceptual questions. Data regarding effects on my own attitude, planning time, and motivation were also collected through writings, surveys, and a time log. The project’s results indicated that differentiated instruction did not have a positive effect on my students’ overall understanding of concepts or cognitive level of understanding. Neither did the differentiated instruction have a positive effect on the understanding of my high, middle, or low-achieving students. My attitude, planning, and motivation yielded both positive and negative results.
1
INTRODUCTION AND BACKGROUND
As I reflect about my teaching, I realize that I strive to have a learning
environment that allows each student to reach his or her full potential. Daily
observation of my students reveals that this is not consistently happening in my
traditional classroom setting. Since there is no ability grouping within the grade level
I teach, my class consists of students classified as gifted as well as those considered to
have learning needs. How can a classroom where all students work on the same
assignments and take the same assessments meet the needs of such a wide spectrum
of students? I consistently sense confusion and stress in my low-achieving students
and annoyance and boredom in my high-achieving students. Classroom lab activities
are one of several situations where this problem is evident.
As the students work through classroom lab activities, the gap between high-
achieving and low-achieving students becomes very apparent. Students are instructed
to complete an experiment and then answer reflection questions. The lab groups
containing high-achieving students usually finish quickly, since these students are
very efficient in their work. These students take charge throughout the experiment
and then answer the questions on their own. Although a brief discussion within the
lab group takes place, others don’t fully understand the explanation or reasoning of
the high-achieving students. Low-achieving students, feeling intimidated, let the
high-achieving students do the majority of the work.
From my reflection, I recognized that teaching to the middle was meeting the
needs of a very limited population. For this reason, I chose differentiation as my
capstone project topic. My desire was to better meet the diverse needs of my students
through using differentiated instruction. Carol Ann Tomlinson, an expert in
2
differentiated instruction, explains that differentiation is “an approach to teaching that
advocates active planning for student differences in classrooms” (Tomlinson, 2003,
p.1).
I teach sixth-grade math and science at Hong Kong International School, a
private international school of about 2500 students located in Hong Kong, China. My
two classes are each comprised of about 20 sixth-grade students from middle to high-
income homes and of a variety of nationalities and cultures. In addition to a variety of
average students with no specially designated needs, these heterogeneously grouped
classes also consist of students with identified learning needs, that are second
language learners, and that have been tagged as gifted. The curriculum with which
my study took place was a nine-week introductory chemistry unit.
The project focus question is, what are the effects of using differentiated
instruction on students’ understanding of sixth-grade introductory chemistry
concepts? The project subquestions are as follows: what are the effects of using
differentiated instruction on high, middle, and low-achieving students’ understanding
of concepts; what are the effects of using differentiated instruction on students’
various cognitive levels of understanding science concepts; and what are the effects of
implementing differentiated instruction on my preparation time, teaching methods,
thoughts about my role in student learning, attitude and motivation to teaching? This
topic is significant to me because I believe that differentiating my instruction will
increase the learning of my low-achieving and high-achieving students. This topic is
significant to my students because, at this time, our sixth-grade science curriculum
does not contain any strategies built in to account for student learning differences.
3
My hope is to put forward successful, usable differentiated activities to my four sixth-
grade science colleagues.
The members of my support team helped me in the planning, analyzing, and
writing of my capstone project and paper. This group consisted of three colleagues
from Hong Kong International School: a fellow math/science teacher, learning
specialist, and language arts teacher. Other members of my support team included
Jewel Reuter, my MSSE capstone advisor, and Lisa Brown, of Montana State
Extended University, my MSU project reader.
CONCEPTUAL FRAMEWORK
In this conceptual framework, the reader should find prior research and
information that promotes the need for differentiated instruction in the classroom.
The reader should see theory behind why implementing differentiated activities can
help students’ understanding of concepts as well as help them to understand concepts
more deeply. The reader should also see how implementing differentiated activities
has affected other teachers’ motivation and preparation. Finally, this section ends
with a look at methods suggested by experts for implementing various differentiated
instruction strategies.
The terms zone of proximal development and moderate challenge are two
learning theories that support the need to differentiate instruction for low, middle, and
high-achieving students. A child’s zone of proximal development refers to a level of
appropriate difficulty in tasks within which the child cannot succeed on their own, but
can be successful, avoid frustration, and grow in understanding due to scaffolding and
teacher support. Similarly, the term moderate challenge says that students should not
work on tasks or with concepts where they are bored due to succeeding too easily.

4
Appropriate tasks should ensure students’ thinking is appropriately challenged
(Tomlinson, Brighton, Hertberg, Callahan, Moon, & Brimijoin, 2003). Put together
as an upper and lower limit, these ideas indicate that there exists a window or range of
content and task difficulty that challenges a learner because it is just above where he
or she can work independently, but, because they are supported by the teacher to
ensure success, below his or her frustration threshold. This window of challenge is
optimal for learners because, if encouraged to work within this range, they are able to
stretch themselves academically while still being successful in their learning tasks.
The negative effects of students not working in this optimal zone, suggests Tomlinson
(1999), are that students who succeed in classroom tasks too easily become
unmotivated to learn, and students who fail consistently become discouraged and shut
down.
These ideas of moderate challenge and zone of proximal development cause a
dilemma for teachers because one academic task is often simultaneously too easy for
one student and too difficult for another. In order to keep each child moderately
challenged, teachers must adapt tasks and instruction according to the level of each
student in the classroom.
To be able to adapt learning tasks to such a wide variety of student levels,
teachers must have an understanding of what makes a learning task more or less
challenging. Bloom’s taxonomy is one tool that can be used to help accomplish this
goal. According to an article by Krathwohl (2002), Benjamin Bloom created six
categories useful for classifying learning tasks and objectives: knowledge,
comprehension, application, analysis, synthesis, and evaluation. These levels, known
as Bloom’s taxonomy, were recently revised to become more modern and applicable
to the twenty-first century classroom (Krathwohl, 2002). The six revised levels are:

5
remembering, understanding, applying, analyzing, evaluating, and creating. The first
and most concrete cognitive level is remembering. After remembering, categories
gradually increase in cognitive difficulty and abstraction, ending with the highest
level: creating. Mastery of a previous lower level is required before moving to the
next more complex level (Krathwohl, 2002). For example, a student who has not
understood the concept of classification could not be expected to apply this concept to
a given set of objects.
These levels can be used to create tasks for students at a level where they are
moderately challenged. In addition to providing appropriate academic challenge,
applying Bloom’s taxonomy can help assess students’ cognitive level of
understanding. By seeing at which level within the taxonomy students can
independently work, teachers can assess their depth of understanding.
In researching differentiated instruction, several studies have been done that
indicate success in increasing the achievement and deepening the levels of
understanding of low, middle, and high-achieving students. One study implemented
differentiation in 13 middle school science classes and found that students scored
higher on unit tests in comparison with students from nontreatment classes. From
follow up surveys, six out of seven of the participating classroom teachers agreed that
differentiated instruction increased their students’ academic performance
(Mastropieria & Scruggs, 2006).
A second study, applied in an inclusive fifth-grade science class, also
promoted differentiated curriculum. In this case, low and middle-achieving students
responded better to questions from the application level of Bloom’s taxonomy than a
class of control students. This study, however, did not find any difference in students’
6
response to identification questions, or questions at the knowledge level of Bloom’s
taxonomy (Simpkins, Mastropieri, & Scruggs, 2008).
Qualitative results from a third study of a differentiated sixth-grade poetry unit
determined that differentiated classroom activities had a “positive impact on
children’s learning” (Avci, Yuksel, Soyer, & Balikcioglu, 2009, p.1069). Lastly,
implementing differentiated instruction with teaching that also focuses on cultural
diversity, Santamaria (2009) found that student achievement improved steadily based
on pre-and postassessment data taken over a five-year period.
Although studies have shown differentiated instruction to be beneficial to
students, teachers do not always adapt their instructional activities and presentation to
provide moderate challenge at individual students’ cognitive levels since it requires
additional planning time and philosophical understanding. According to Grimes and
Stevens (2009), an elementary classroom teacher who conducted differentiation
action research with 20 fourth-grade math students said, “Differentiation is a lot of
work! Taking the time to constantly assess, reassess, and adapt lesson plans to meet
every students’ needs can be time consuming” (p.680).
In addition to the amount of work, a concern repeatedly raised by researchers
and experts in differentiated instruction is that teachers often lack proper training in
the philosophy and strategies of differentiation. Therefore, many teachers, despite
sometimes having good intentions, do not implement differentiation properly due to
misunderstanding or lack of initiative (Hong, Greene, & Higgins, 2006; Hertberg-
Davis, 2009; Sisk, 2009; Tomlinson et al., 2003; Brighton & Hertbergy, 2004).
Another challenge of differentiating instruction is that it requires a deep
understanding of the many aspects of the subject being taught. This deep

7
understanding is difficult for teachers who teach multiple subjects and are stronger in
knowledge of pedagogy than content (Hertberg-Davis, 2009).
Although differentiated instruction can initially be time consuming and
difficult to apply, teachers have found it a rewarding practice. Grimes and Stevens
(2009) states:
Differentiated instruction not only improved test scores for all my students, but it
also increased students’ desire to do math, their desire to improve in math, and
their confidence in their math abilities. Because students benefited from the
differentiated model, I continue to use differentiated instruction in my mathematics
classroom. (p.680)
From the previously mentioned study of implementing differentiation in fifth
grade science classes, teachers and students both reported a high degree of satisfaction
after using differentiated curriculum (Simpkins, Mastropieri, & Scruggs, 2009).
However, a challenge mentioned by middle school science teachers was, since
differentiated activities often take longer than whole-class instruction, it is hard to
find time to implement the strategies and cover the necessary amount of material
required by high-stakes testing (Mastropieri & Scruggs, 2006; Hertberg-Davis, 2009).
If differentiated activities are time consuming and challenging to implement,
what strategies do experts suggest for an efficient and effective implementation? To
begin with, teachers must know which facts, concepts, principles, attitudes, and skills
they want their students to learn. It is only after this foundation is established that
teachers can go about varying the instruction to meet student needs. This ensures that
each task is aligned with the desired learning objectives and differs only in cognitive
difficulty (Tomlinson, 1999).
8
After teachers have established their learning objectives, next they can decide
when and what to modify based on observations regarding students’ readiness,
interest, and learning profile. Students’ readiness looks at students’ prior learning and
skills about a particular idea or concept. Students’ interest takes into account their
likes, dislikes, and passions when designing activities and examples to use in
instruction. Students’ learning profile considers in which environment a student
learns best. For example, would students understand directions most clearly when
given through auditory or visual means, or prefer to work on an assignment
cooperatively or individually (Tomlinson, 1999).
Finally, after considering the needs of their students, teachers are ready to
adapt their instruction. According to Tomlinson (2000), three aspects of teachers’
instruction can be modified: content, process, and products. Modifying content
means adjusting what teachers want their students to learn. Modifying process refers
to varying the activities or work students do to learn the content. Modifying products
means providing different opportunities for students to demonstrate their learning
(Tomlinson, 2000).
Many methods exist that provide opportunities for teachers to adjust for
student readiness, interest, and learning profile. A study of five middle school
teachers of various subjects, categorized as master teachers at using differentiation in
their daily practice, found four commonalities: providing personal scaffolding for
students, having flexible means to reach their desired end, knowing multiple ways to
teach material, and providing a caring classroom (Carolan & Guinn, 2007). The use
of classroom stations, cooperative grouping, student agendas, orbital studies, student
choice menus, and tiered assignments are some practical strategies capable of
transforming a traditional classroom and curriculum into one designed to meet the

9
needs of a variety of learners (Tomlinson, 1999). Preassessing student knowledge
and experience is vital in recognizing students’ readiness and interest with upcoming
content. Also, implementing effective classroom management strategies is of great
importance as many different tasks and activities are taking place in the classroom
simultaneously (Tomlinson 1999).
In conclusion, due to the range of students’ prior knowledge and instructional
levels coupled with the necessity for appropriate learning tasks and new information,
it is important that teachers design their instruction to address this variety. Bloom’s
taxonomy is one opportunity to differentiate the level of content presented to and
expected of students. Although differentiation is a challenging method, it is
rewarding and necessary for quality instruction. Finally, after preplanning regarding
learning objectives and student profiles, various strategies can be applied in a typical
classroom setting to allow for instruction to be differentiated. Many of these
procedures and strategies were applied and analyzed in my personal capstone project
on the implementation of differentiated instruction within a sixth-grade introductory
chemistry unit.
METHODOLOGY
Project Treatment
To determine the effectiveness of my differentiated classroom instruction, I
compared data collected without this intervention (a nontreatment unit) to data
collected with this intervention (treatment units). The research methodology for this
project received an exemption by Montana State University’s Institutional Review
Board, and compliance for working with human subjects was maintained. The form
used to gain consent from the principal of Hong Kong International School and
10
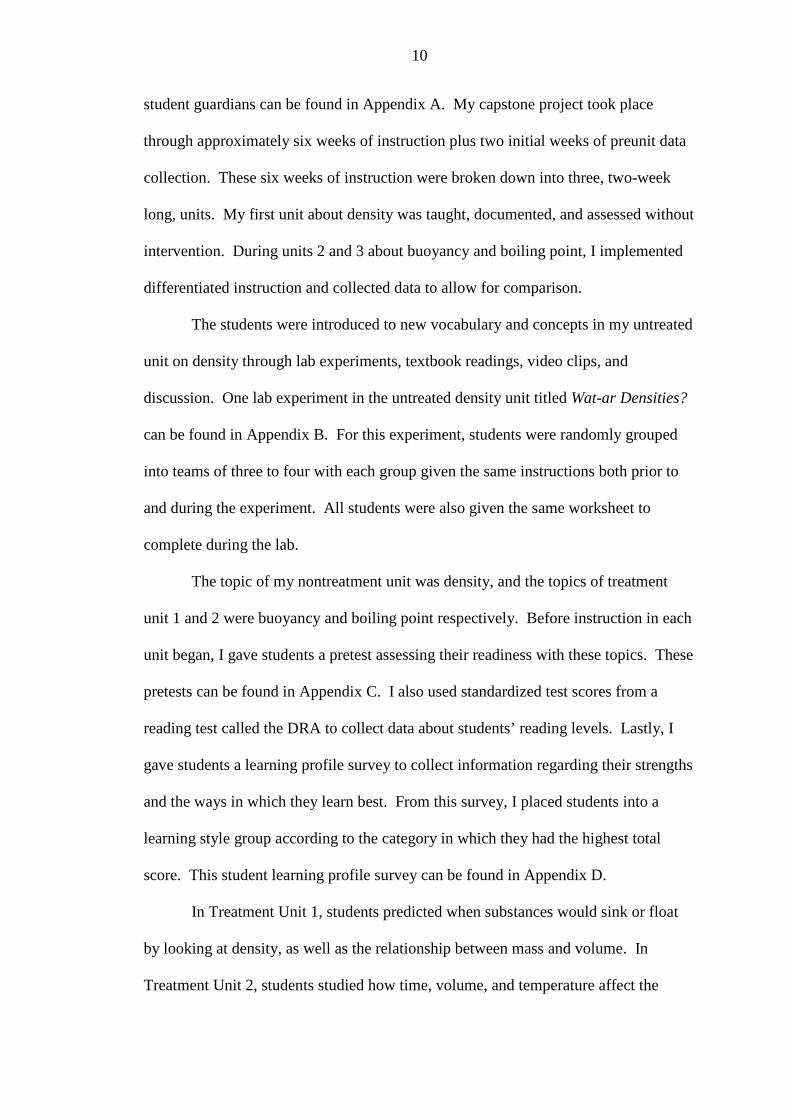
student guardians can be found in Appendix A. My capstone project took place
through approximately six weeks of instruction plus two initial weeks of preunit data
collection. These six weeks of instruction were broken down into three, two-week
long, units. My first unit about density was taught, documented, and assessed without
intervention. During units 2 and 3 about buoyancy and boiling point, I implemented
differentiated instruction and collected data to allow for comparison.
The students were introduced to new vocabulary and concepts in my untreated
unit on density through lab experiments, textbook readings, video clips, and
discussion. One lab experiment in the untreated density unit titled Wat-ar Densities?
can be found in Appendix B. For this experiment, students were randomly grouped
into teams of three to four with each group given the same instructions both prior to
and during the experiment. All students were also given the same worksheet to
complete during the lab.
The topic of my nontreatment unit was density, and the topics of treatment
unit 1 and 2 were buoyancy and boiling point respectively. Before instruction in each
unit began, I gave students a pretest assessing their readiness with these topics. These
pretests can be found in Appendix C. I also used standardized test scores from a
reading test called the DRA to collect data about students’ reading levels. Lastly, I
gave students a learning profile survey to collect information regarding their strengths
and the ways in which they learn best. From this survey, I placed students into a
learning style group according to the category in which they had the highest total
score. This student learning profile survey can be found in Appendix D.
In Treatment Unit 1, students predicted when substances would sink or float
by looking at density, as well as the relationship between mass and volume. In
Treatment Unit 2, students studied how time, volume, and temperature affect the
11
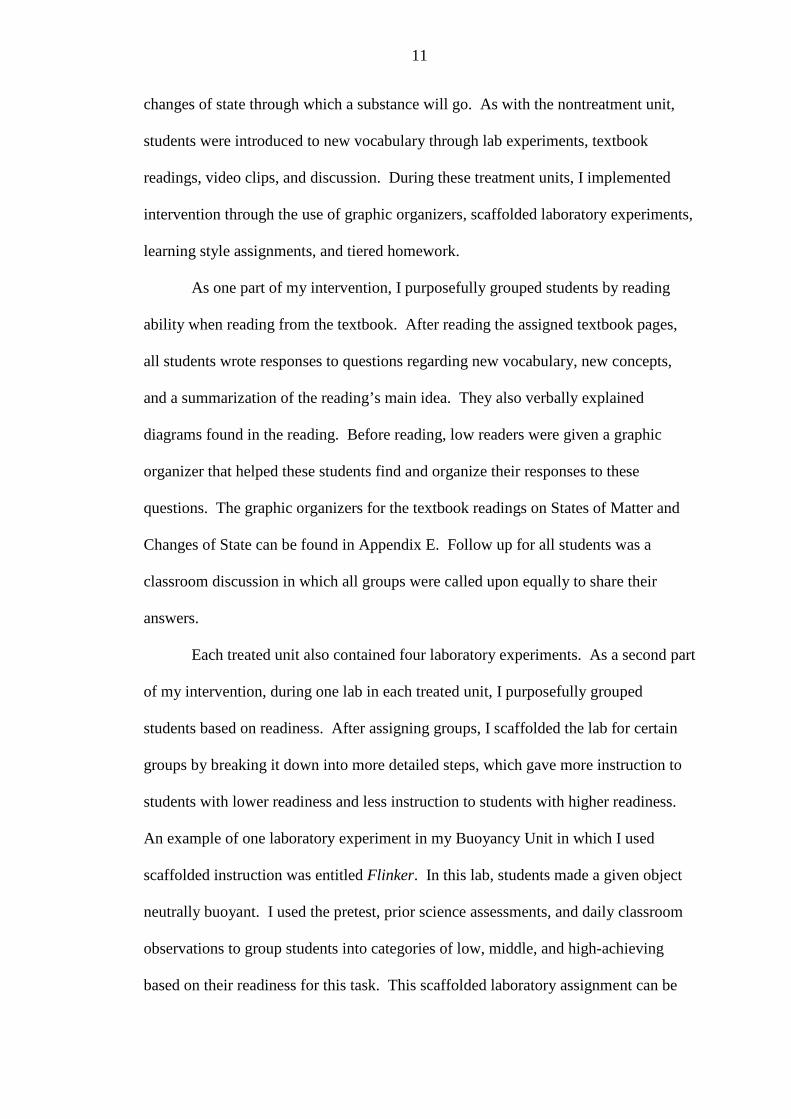
changes of state through which a substance will go. As with the nontreatment unit,
students were introduced to new vocabulary through lab experiments, textbook
readings, video clips, and discussion. During these treatment units, I implemented
intervention through the use of graphic organizers, scaffolded laboratory experiments,
learning style assignments, and tiered homework.
As one part of my intervention, I purposefully grouped students by reading
ability when reading from the textbook. After reading the assigned textbook pages,
all students wrote responses to questions regarding new vocabulary, new concepts,
and a summarization of the reading’s main idea. They also verbally explained
diagrams found in the reading. Before reading, low readers were given a graphic
organizer that helped these students find and organize their responses to these
questions. The graphic organizers for the textbook readings on States of Matter and
Changes of State can be found in Appendix E. Follow up for all students was a
classroom discussion in which all groups were called upon equally to share their
answers.
Each treated unit also contained four laboratory experiments. As a second part
of my intervention, during one lab in each treated unit, I purposefully grouped
students based on readiness. After assigning groups, I scaffolded the lab for certain
groups by breaking it down into more detailed steps, which gave more instruction to
students with lower readiness and less instruction to students with higher readiness.
An example of one laboratory experiment in my Buoyancy Unit in which I used
scaffolded instruction was entitled Flinker. In this lab, students made a given object
neutrally buoyant. I used the pretest, prior science assessments, and daily classroom
observations to group students into categories of low, middle, and high-achieving
based on their readiness for this task. This scaffolded laboratory assignment can be

12
found in Appendix F. A laboratory experiment in my second treatment unit on
boiling point in which I also used scaffolded instructions for students grouped into the
categories of low, middle, and high-achieving was called Time to Boil. For this
assignment, students predicted the effect water’s volume has on its boiling point.
Students completed an experiment, recorded data in a table, and discussed their
conclusions from the experiment. This scaffolded assignment can be found in
Appendix G. I assessed student understanding of both scaffolded experiments by
checking their completed assignment using a rubric.
As a third modification to my instruction, during a different, unscaffolded lab
in each unit, students had the opportunity to demonstrate understanding based on their
learning profile. First, students were randomly assigned to lab groups. Following the
experiment, to demonstrate their understanding of laboratory procedure and learning
objectives, students created one of the following products as part of a group
assignment: song, speech, poster of real-life application, logical analysis and graph,
cartoon strip, or three minute skit. Students were assigned to a particular task due to
their learning profile strength determined from the learning profile survey completed
during the first week of the project’s implementation. To assess this assignment, I
created one rubric that was used for all products. The rubric from these learning
profile demonstrations can be seen in Appendix H. This rubric, which required
students’ products to answer specific questions about new concepts, was given to
students at the beginning of the assignment. After that, students were placed into a
group according to their product and given a specific amount of class time to
complete this assignment. In addition to their final product, each group was also
responsible for submitting a completed form explaining each person’s role or job
within their group assignment. Lastly, each group was responsible for sharing their
13
final product the following class period, where it was assessed using the given rubric.
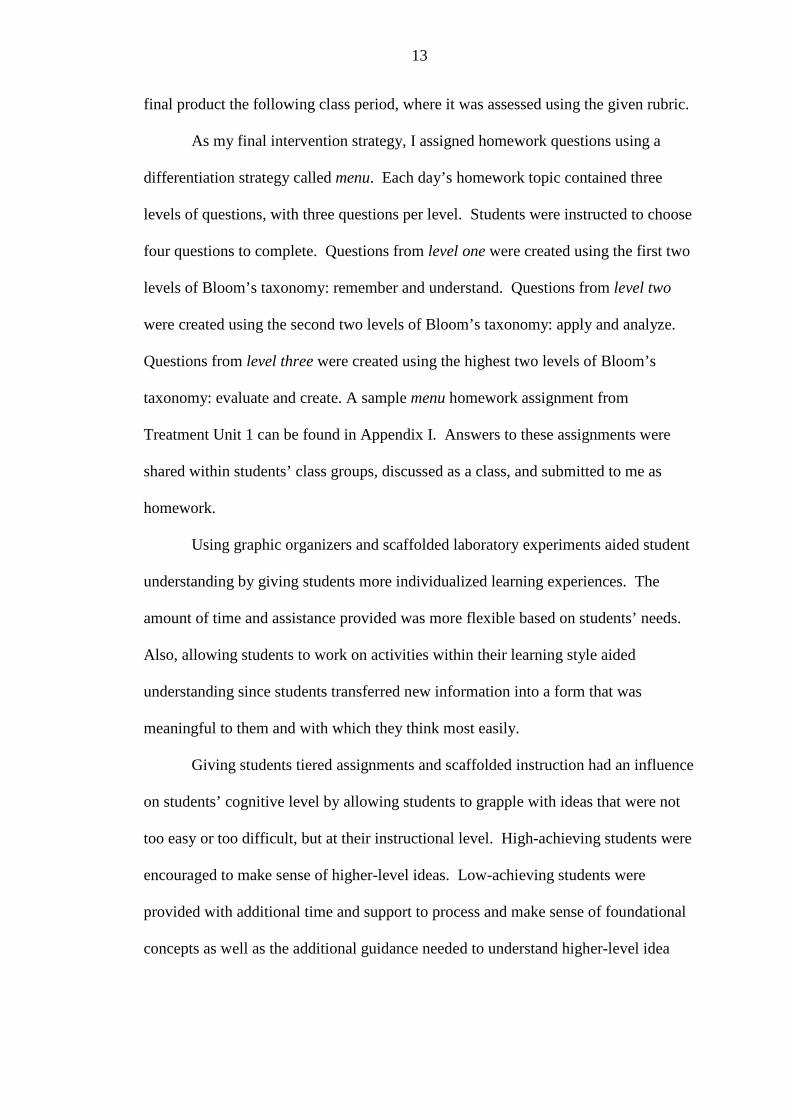
As my final intervention strategy, I assigned homework questions using a
differentiation strategy called menu. Each day’s homework topic contained three
levels of questions, with three questions per level. Students were instructed to choose
four questions to complete. Questions from level one were created using the first two
levels of Bloom’s taxonomy: remember and understand. Questions from level two
were created using the second two levels of Bloom’s taxonomy: apply and analyze.
Questions from level three were created using the highest two levels of Bloom’s
taxonomy: evaluate and create. A sample menu homework assignment from
Treatment Unit 1 can be found in Appendix I. Answers to these assignments were
shared within students’ class groups, discussed as a class, and submitted to me as
homework.
Using graphic organizers and scaffolded laboratory experiments aided student
understanding by giving students more individualized learning experiences. The
amount of time and assistance provided was more flexible based on students’ needs.
Also, allowing students to work on activities within their learning style aided
understanding since students transferred new information into a form that was
meaningful to them and with which they think most easily.
Giving students tiered assignments and scaffolded instruction had an influence
on students’ cognitive level by allowing students to grapple with ideas that were not
too easy or too difficult, but at their instructional level. High-achieving students were
encouraged to make sense of higher-level ideas. Low-achieving students were
provided with additional time and support to process and make sense of foundational
concepts as well as the additional guidance needed to understand higher-level idea

14
assignments.
Data Collection Instruments
At Hong Kong International School, I teach two sections of sixth-grade math
and science to a total of 42 students. Of the 110 minute block I am allotted for each
section, 55 minutes is spent in science instruction and 55 minutes in math instruction.
The students move to a different teacher for Language Arts and Social Studies, as
well as separate teachers for their elective classes. All 42 of my math and science
students received the differentiated activities intervention during science instruction.
Each of these two classes contained several students classified with learning needs
and several students that were indicated as high-achieving. English was not the first
language of about 35% of these students, but most had been in an English medium
environment like Hong Kong International School since primary school and had a
strong command of the English language. No students in my classes were formally
supported as second language learners. Each class contained a balance of boys and
girls of a variety of nationalities and cultures.
I collected data from three sources for each project question to allow for
triangulation. Therefore, no one data collection method was fully responsible for my
conclusions. Table 1 is the data triangulation matrix for this capstone project.

15
Table 1 Triangulation Matrix of Data Sources by Project Question
Project Questions Data Source What are the effects of using differentiated instruction on students’ understanding of sixth grade introductory chemistry concepts?
Preunit and postunit test
Preunit and postunit student journals
Preunit and postunit student
interviews
What are the effects of differentiated instruction on students’ various cognitive levels of understanding science concepts?
Daily student journals with
prompts (through treated and
nontreated units)
Preunit and postunit test
(for treated and nontreated
units)
Preunit and postunit student interviews (for
treated and nontreated units)
What are the effects of using differentiated instruction on high, middle, and low-achieving students’ understanding of concepts?
Daily student journals with
prompts (through treated and
nontreated units)
Preunit and postunit test
(for treated and nontreated
units)
Preunit and postunit student interviews (for
treated and nontreated units)
What are the effects of implementing differentiated instruction on my preparation time and teaching methods
Teacher reflection journal with
prompts (through nontreated and treated units)
Teacher planning time-log (through
nontreated and treated units)
Daily teacher attitude survey
What are the effects of implementing differentiated instruction on my thoughts about my role in student learning, attitude, and motivation to teaching?
Teacher reflection journal with
prompts (through nontreated and treated units)
Teacher planning time log (through
nontreated and treated units)
Daily teacher attitude survey
All 42 students participated in the pre and posttests. Only one class of 22
students participated in the journals. Lastly, I chose seven students, four girls and
three boys, to participate in interviews. The composition of these students was as

16
follows: three low-achieving, two high-achieving, and two middle-achieving students.
I chose this because it seemed like a reasonable representation of my class, would be
a manageable amount of data to analyze, and was a large enough number to account
for outliers. The factors for being classified as low, middle, or high-achieving were
science test scores from previous units and pretests from the capstone project.
My project question investigating students’ understanding of concepts was
assessed through student journals, preunit and postunit tests, and student interviews.
Once a week, students were prompted to explain the day’s learning objective and then
wrote for three to five minutes at the end of a lesson in a journal. Since all students at
my school have laptops in class each day, the journal entries were typed and
submitted in a Googledoc. Student journal prompts can be seen in Appendix J. After
reading the students’ journal entries, I used a rubric to sort the entries into three
categories: basic, on-level, and advanced. Next, I compared the quantitative data of
the class as a whole by counting the number of students whose responses fit into each
category based on students’ ability to understand and apply the new information.
Lastly, I compared qualitative data by typing up statements that were representative of
each basic, on level, or advanced category. Looking at these responses helped me
know students’ readiness for upcoming lessons as well as their current level
understanding. From my second data source, I compared students’ average preunit
and postunit test scores. I used this information to see the amount of progress within
each unit as well as the amount of gain in across the three units. My third data source,
interviews, allowed me to probe deeper for student understanding about each unit than
could be done on the test. I asked students to answer concept questions and to create
a concept map with the unit’s key terms and vocabulary. Afterwards, I compared
students’ responses from their preunit interview to their postunit interview and
17
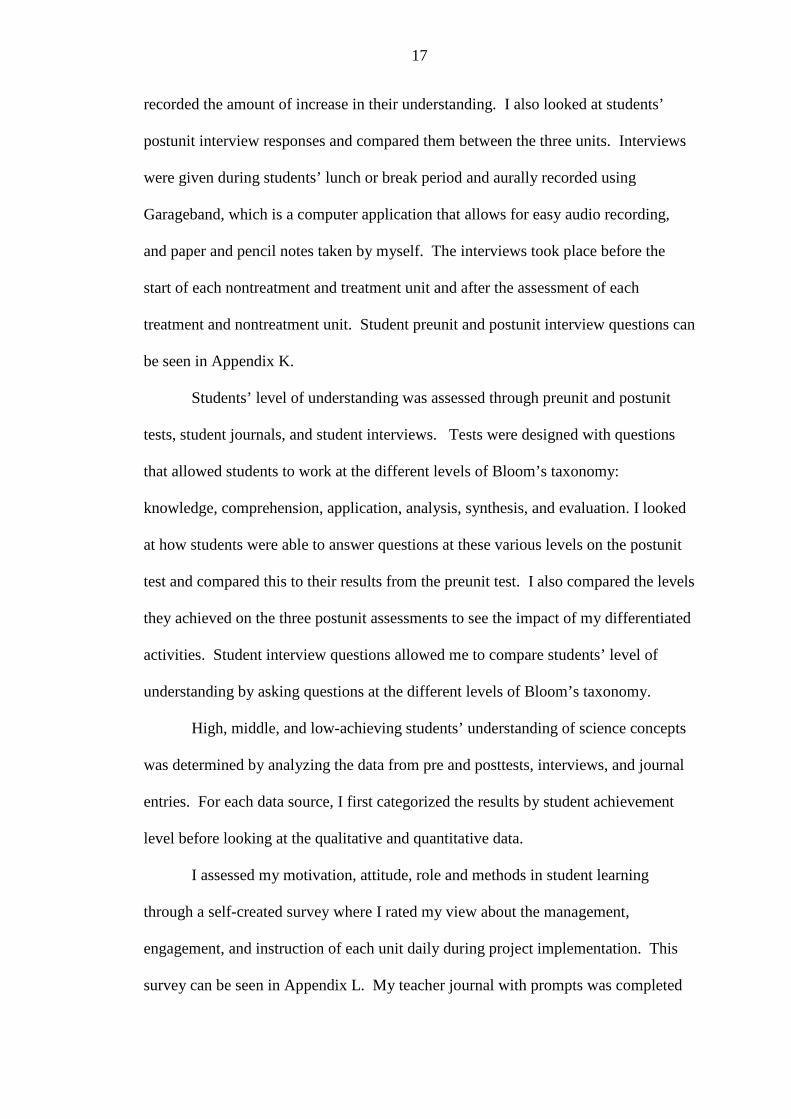
recorded the amount of increase in their understanding. I also looked at students’
postunit interview responses and compared them between the three units. Interviews
were given during students’ lunch or break period and aurally recorded using
Garageband, which is a computer application that allows for easy audio recording,
and paper and pencil notes taken by myself. The interviews took place before the
start of each nontreatment and treatment unit and after the assessment of each
treatment and nontreatment unit. Student preunit and postunit interview questions can
be seen in Appendix K.
Students’ level of understanding was assessed through preunit and postunit
tests, student journals, and student interviews. Tests were designed with questions
that allowed students to work at the different levels of Bloom’s taxonomy:
knowledge, comprehension, application, analysis, synthesis, and evaluation. I looked
at how students were able to answer questions at these various levels on the postunit
test and compared this to their results from the preunit test. I also compared the levels
they achieved on the three postunit assessments to see the impact of my differentiated
activities. Student interview questions allowed me to compare students’ level of
understanding by asking questions at the different levels of Bloom’s taxonomy.
High, middle, and low-achieving students’ understanding of science concepts
was determined by analyzing the data from pre and posttests, interviews, and journal
entries. For each data source, I first categorized the results by student achievement
level before looking at the qualitative and quantitative data.
I assessed my motivation, attitude, role and methods in student learning
through a self-created survey where I rated my view about the management,
engagement, and instruction of each unit daily during project implementation. This
survey can be seen in Appendix L. My teacher journal with prompts was completed

18
daily and also gave me feedback on these areas. These prompts can be seen in
Appendix M. My teacher time-log, seen in Appendix N, gave me information about
my preparation time, which was also documented through the attitude survey and
reflection.
The timeline for my capstone project was about eight weeks. I began
collecting preassessment data and parental and student consent on December 1, 2010,
prior to my study. From January 17-28, 2011 was my nontreatment unit. My
treatment units began February 7, 2011 and continued through March 11, 2011. The
detailed timeline of this project is attached in Appendix O.
DATA AND ANALYSIS
With the data I collected from my various data sources, I attempted to answer
my project’s questions. First, I attempted to see if the differentiated activities
implemented had any effect on students’ understanding of sixth grade introductory
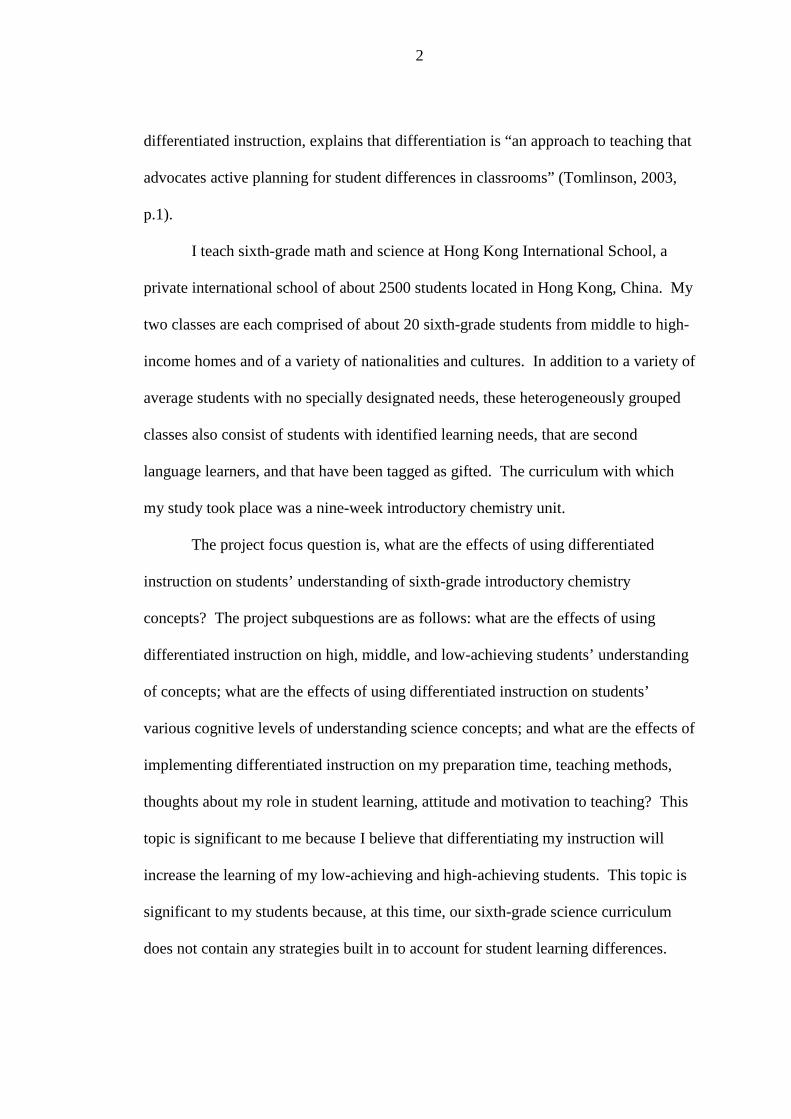
chemistry concepts. Figure 1 illustrates the average class scores calculated from the
pretests and posttests of my nontreatment and treatment units.
Figure 1. Average Pretest and Posttest Scores During Project Phases, (N=42).
These data show that students made the most amount of gain during the nontreatment
unit. Students’ average posttest scores were fairly consistent and varied by only four
points between the three units. Students’ pretest scores showed a greater difference
between units with a variance of 27 points from the nontreatment pretest to the
19
treatment pretest. Despite the increase in the amount of prior knowledge students
possessed as the progressed through the three units, there was not a parallel increase
in their postunit test scores. In contrast, postunit scores were slighlty lower than the
postunit test from the nontreatment unit.
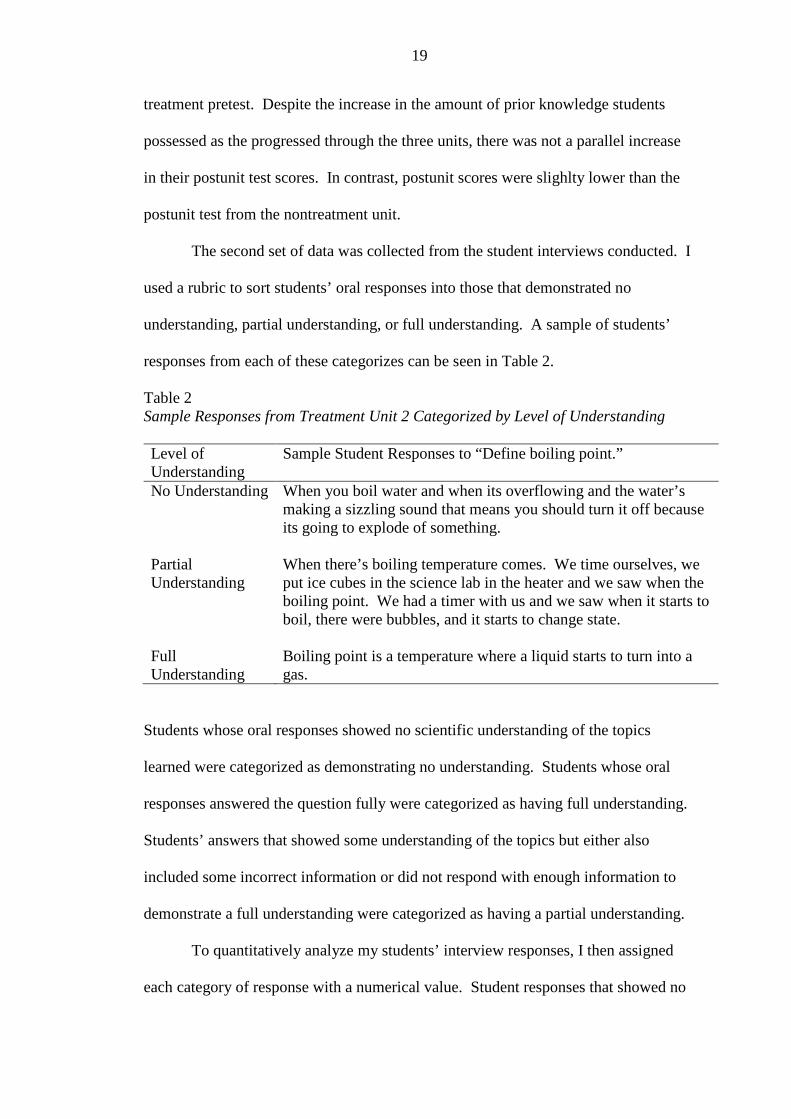
The second set of data was collected from the student interviews conducted. I
used a rubric to sort students’ oral responses into those that demonstrated no
understanding, partial understanding, or full understanding. A sample of students’
responses from each of these categorizes can be seen in Table 2.
Table 2 Sample Responses from Treatment Unit 2 Categorized by Level of Understanding Level of Understanding
Sample Student Responses to “Define boiling point.”
No Understanding When you boil water and when its overflowing and the water’s making a sizzling sound that means you should turn it off because its going to explode of something.
Partial Understanding
When there’s boiling temperature comes. We time ourselves, we put ice cubes in the science lab in the heater and we saw when the boiling point. We had a timer with us and we saw when it starts to boil, there were bubbles, and it starts to change state.
Full Understanding
Boiling point is a temperature where a liquid starts to turn into a gas.
Students whose oral responses showed no scientific understanding of the topics
learned were categorized as demonstrating no understanding. Students whose oral
responses answered the question fully were categorized as having full understanding.
Students’ answers that showed some understanding of the topics but either also
included some incorrect information or did not respond with enough information to
demonstrate a full understanding were categorized as having a partial understanding.
To quantitatively analyze my students’ interview responses, I then assigned
each category of response with a numerical value. Student responses that showed no

20
understanding were assigned zero points, responses the demonstrated partial
understanding were assigned one point, and responses that demonstrated full
understanding were assigned two points. Next, looking at students’ answers to the
three conceptual questions from my interviews, I used these values to determine a
separate preunit and postunit value for each student from each unit. A student with
100% correct would have answered with full understanding on all three questions. A
student with 0% correct would have answered all three questions with no
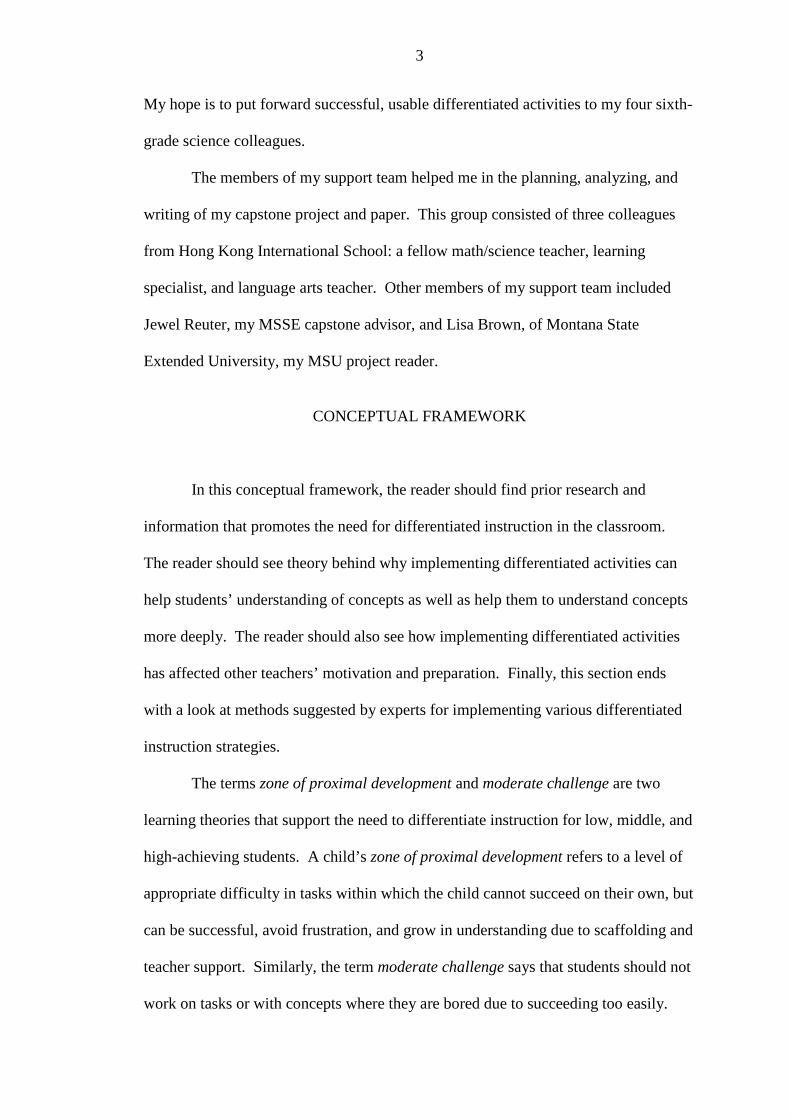
understanding. The percentage from these values can be seen in Figure 2.
Figure 2. Average Percentage of Correct Answers from Preunit and Postunit Interviews During Project Phases, (N=7). Like the pre and posttests, these data also show that there was an increase in
the amount of prior knowledge students possessed as they progressed through the
three units. Strangely, despite this increase in prior knowledge, the posttest results
from treatment unit 1 were much lower than those of both the nontreatment unit and
treatment unit 2. Again, when comparing the gain made on the posttest compared to
the pretest, the most was made during the nontreatment unit.
My last source of data used in assessing students’ understanding of
introductory science concepts was a weekly journal entry from each student. I first
analyzed my students’ responses qualitatively by using a rubric to sort them into three
categories: below level, on level, and above level. A sample student response from
each category can be seen in Table 3.

21
Table 3 Sample Journal Responses Categorized as Below, On, or Above Expected Level
Level of Understanding
Sample Student Responses to the prompt: “What was the major topic of today’s lesson and what did you learn about that topic?”
Below Level Density, I learned different ways to find the density of things.
On Level I learned that mass is different from weight. Mass is a measurement of what an object contains. Weight is the effect gravity has on an object.
Above Level I learned that the bigger mass and the same volume and the bigger volume and the same mass both effect the density and that Archimedes found out the to figure out the way about the density of irregular object. And also the difference between weight and mass. Mass weighs how much matter in an object and weight is mass + gravity.
Students were classified on level if they were able to accurately remember and
understand information that they had learned from class. Students were classified
below level if their answer showed misunderstandings or did not include enough
information to demonstrate an understanding of the new information. Students were
classified as above level if, in their answer, they demonstrated accurate understanding
by recalling but also applying the information learned.
Next, I quantitatively analyzed my journal responses by averaging the number
of student responses that had been classified as above level, at level, or below level in
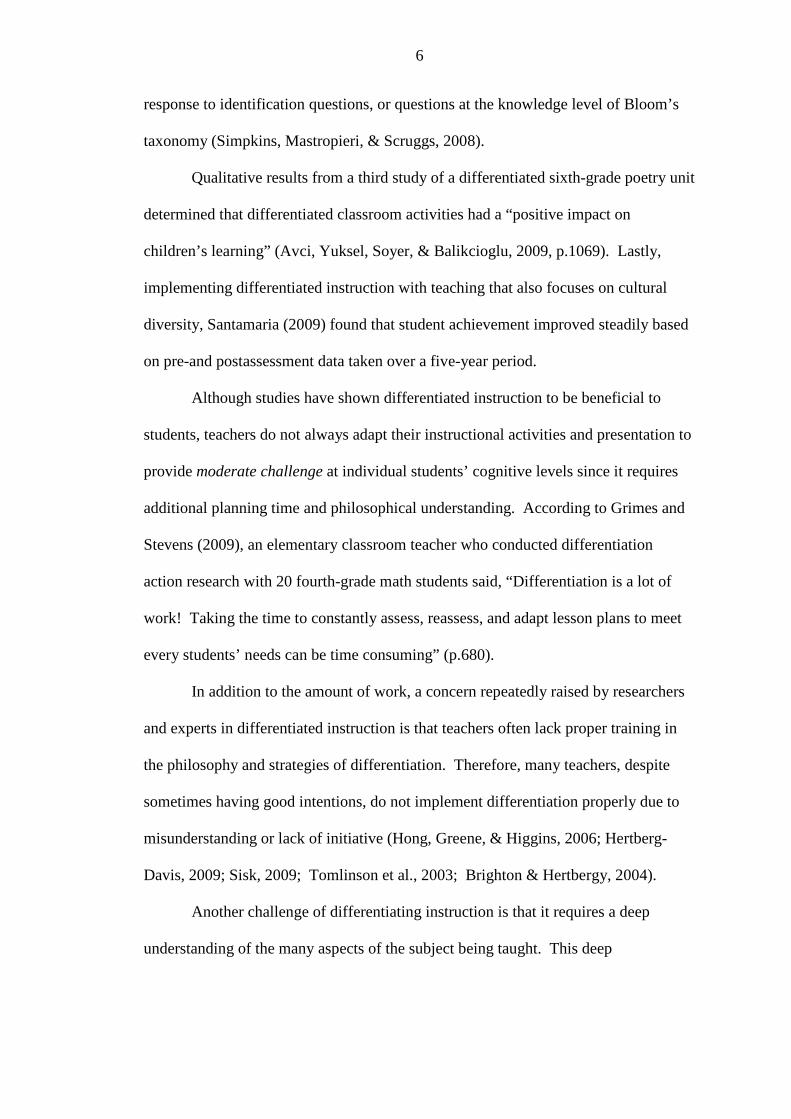
each of the treatment units. The results from this analysis can be seen in Figure 3.
Figure 3. Average Number of Student Journal Entries Categorized by Understanding During Project Phases, (N=22).

22
Results between the three units did not show much variance. The number of on level
students rose slightly from the nontreatment unit through the second treatment unit.
The number of students above level fell slightly from the nontreatment unit to the
treatment units. From this analysis of the three units, it appears that students were
slightly more successful in understanding the second treatment unit about boiling
point as the fewest number of students were below average and the most on level.
Overall, the journal entries data indicate that no apparent positive or negative
difference resulted from the differentiated instruction during the treatment units.
My first subquestion addressed students’ understanding and focused on the
cognitive level to which students understood new concepts. The first collection of
data analyzed in attempt to answer this question came from students’ responses on the
pre and posttests. The pre and posttest questions were written at three different levels
based on Bloom’s Taxonomy: remember and understand, apply and analyze, and
evaluate and synthesize. Sample questions categorized into each of these levels can
be seen in Table 4.
Table 4 Sample Pre and Posttest Questions from Treatment Unit 1 Categorized by Cognitive Level
Cognitive Level Sample Pre and Posttest Questions from Treatment Unit 1
Remember and Understand
An object that sinks in water must have a density that is… A. Less than 1 g/mL B. Equal to 1 g/mL C. Greater than 1 g/mL
Apply and Analyze
An object with a mass of 45g and a volume of 35mL was dropped in water. Predict whether the object will sink or float and explain your reasoning.
Evaluate and Synthesize
Is it possible for a substance with a density of 3g/mL to float? Explain your reasoning. Design an experiment that could prove your answer.

23
After noting which questions on the pre and posttests fell into which cognitive level, I
then tabulated the number of students who correctly answered the posttest questions
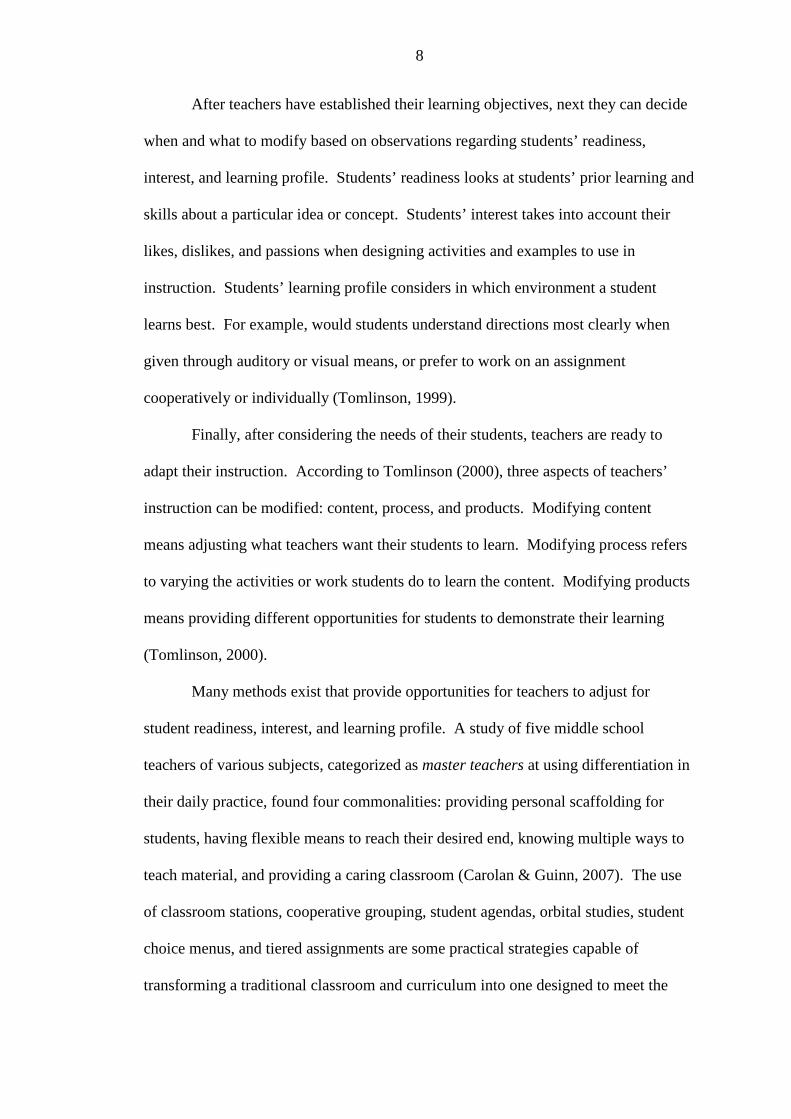
in each of these three levels. These results can be seen in Figure 4.
Figure 4. Percentage of Correct Posttest Questions Categorized by Cognitive Level During Project Phases, (N=42).
According to this analysis, in each of the three units students were more successful
with a different level of cognitive question. In the nontreatment unit, students were
most capable of applying what they’ve learned. This makes sense as the lessons
focused on applying the density formula to various objects and situations. In the first
treatment unit, students were most capable of remembering new information. In the
second treatment unit, students’ strongest area was evaluating and synthesizing. The
second treatment unit shows a decrease in the categories of remembering and
applying new learning, but also shows an increase in evaluating new information
compared with the previous two units.
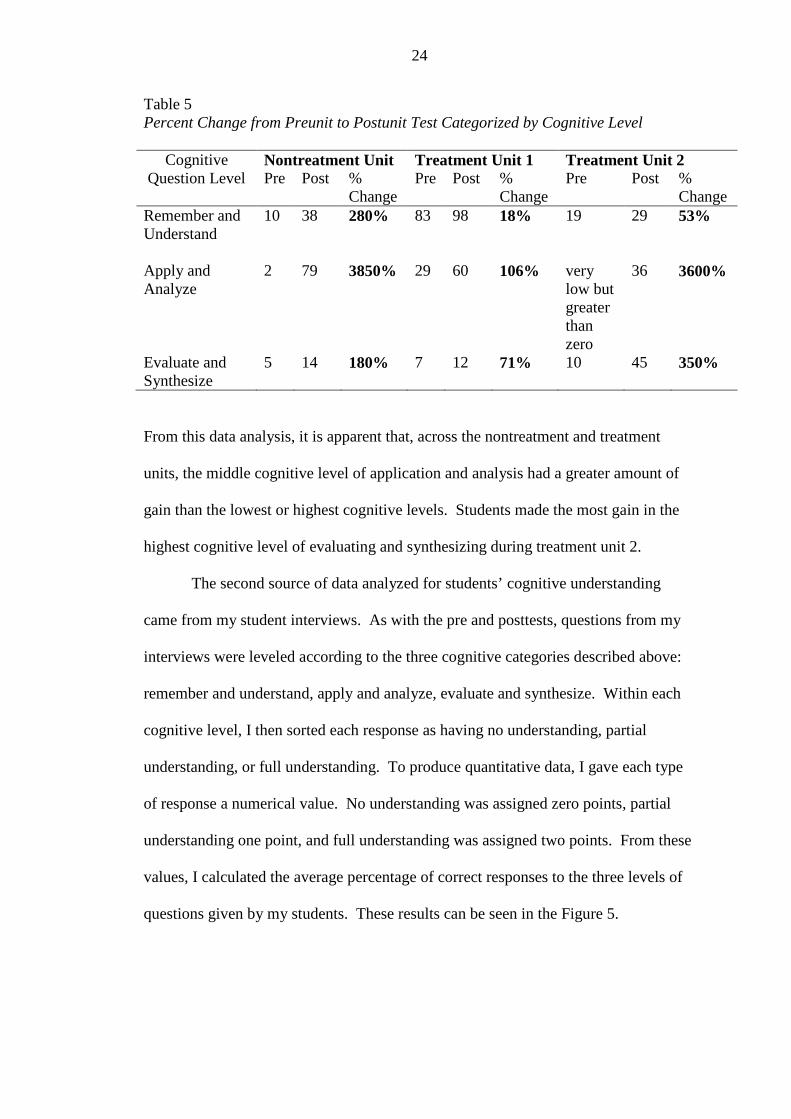
Students preunit and postunit test results categorized by cognitive level were
used to calculate the percent change. These results can be seen in Table 5.
24
Table 5 Percent Change from Preunit to Postunit Test Categorized by Cognitive Level
Cognitive Question Level
Nontreatment Unit Treatment Unit 1 Treatment Unit 2 Pre Post %
Change Pre Post %
Change Pre Post %
Change Remember and Understand
10 38 280% 83 98 18% 19 29 53%
Apply and Analyze
2 79 3850% 29 60 106% very low but greater than zero
36 3600%
Evaluate and Synthesize
5 14 180% 7 12 71% 10 45 350%
From this data analysis, it is apparent that, across the nontreatment and treatment
units, the middle cognitive level of application and analysis had a greater amount of
gain than the lowest or highest cognitive levels. Students made the most gain in the
highest cognitive level of evaluating and synthesizing during treatment unit 2.
The second source of data analyzed for students’ cognitive understanding
came from my student interviews. As with the pre and posttests, questions from my
interviews were leveled according to the three cognitive categories described above:
remember and understand, apply and analyze, evaluate and synthesize. Within each
cognitive level, I then sorted each response as having no understanding, partial
understanding, or full understanding. To produce quantitative data, I gave each type
of response a numerical value. No understanding was assigned zero points, partial
understanding one point, and full understanding was assigned two points. From these
values, I calculated the average percentage of correct responses to the three levels of
questions given by my students. These results can be seen in the Figure 5.

25
Figure 5. Percentage of Correct Postunit Interview Responses Categorized by Cognitive Level During Project Phases, (N=7).
From this presentation, it appears that students’ ability to evaluate and
synthesize the new concepts was slightly more prevalent in treatment unit 2 than in
the first two units; however, this cognitive level score lowest when comparing all
three levels. All three types of congitive thinking were lowest in treatment unit 1.
The most basic cognitive level of knowledge and understanding was strongest
treatment unit 2. In the nontreatment unit, students were most successful with
application questions.
I also analyzed student interview data to find the percent change for each
cognitive question type across the treatment and nontreatment units. This analysis
can be seen in Table 6.
Table 6 Percent Change from Preunit to Postunit Interviews Categorized by Cognitive Level
Nontreatment Unit Treatment Unit 1 Treatment Unit 2 Pre Post %
Change Pre Post %
Change Pre Post %
Change Remember and Understand
very low but greater than 0
10 1000% 2 9 350% 4 12 200%
Apply and Analyze
1 11 1000% 3 7 133% 4 10 150%
Evaluate and Synthesize
2 5 150% 3 4 33% 1 6 500%

26
According to this analysis, the greatest gain in the first two cognitive levels was made
during the nontreatment unit. However, the most gain in the highest cognitive level
of evaluating and synthesizing information was made during the second treatment
unit.
The next data analyzed for students’ cognitive understanding came from
students’ journals. I found it difficult to sort students’ entire journal entries into a
single cognitive level. In a journal response of five sentences, students might
accurately explain information they had learned for four sentences but also explain
ideas in one sentence incorrectly. While I did not feel that the one incorrect sentence
discounted the other accurate sentences, I also did not want to disregard areas where
students had misunderstandings. For this reason, I qualitatively analyzed the entries
by sorting students’ ideas within their writing into four categories. The first category
contained statements that were incorrect in understanding. The second category
contained statements that lacked the information needed to truly assess understanding.
The third category’s entries correctly expressed new information by remembering and
understanding it. The forth category’s entries demonstrated application and/or
synthesis of new information by showing more than basic recall of information. If
one student’s response contained sentences about three different topics, but each topic
was understood at a different cognitive level, that student was recorded three separate
times. Sample responses categorized in this way can be seen in Table 7, with
italicized writing representing the ideas at the indicated level.

27
Table 7 Sample Journal Responses Categorized by Cognitive Level
Cognitive Level Sample Student Responses: “What was the major topic of this lesson and what did you learn about that topic?”
Misunderstanding The major topic for today is the density and the volume. I learned that density can be in different equations such as extending the mass and keeping the volume the same or increasing volume. I learned that as you pass by objects, you want to fit something in a perfect volume, you have to make the volume the same and change mass that will be much easier for yourself to figure out.
Lacks sufficient Information
The major topic for today is the density and the volume. I learned that density can be in different equations such as extending the mass and keeping the volume the same or increasing volume. I learned that as you pass by objects, you want to fit something in a perfect volume, you have to make the volume the same and change mass that will be much easier for yourself to figure out.
Remember and/or Understand
I learned that mass is different from weight. Mass is a measurement of what an object contains. Weight is the effect gravity has on an object.
Application and/or synthesis
The major topic of today’s lesson was density. What I learned about this topic was that there are some things that are dense and not dense for example the dense for and island is when there is a lot of people but if it is not dense for this island then there would not be that many people on that island.
After categorizing student responses, I tabulated the average number of student
responses of each type. This analysis can be seen in Figure 6.
Figure 6. Number of Students’ Written Journal Responses Categorized by Cognitive Level During Project Phases, (N=22).
From this analysis, it appears that the amount of misunderstanding dropped slightly
from the nontreatment unit to the treatment units. The number of students who
28
demonstrated a level of application and/or synthesis in their journal entries also
dropped slightly from the nontreatment unit to the treatment unts. Students were able
to accurately recall and explain the most new information from the lessons in the
second treatment unit.
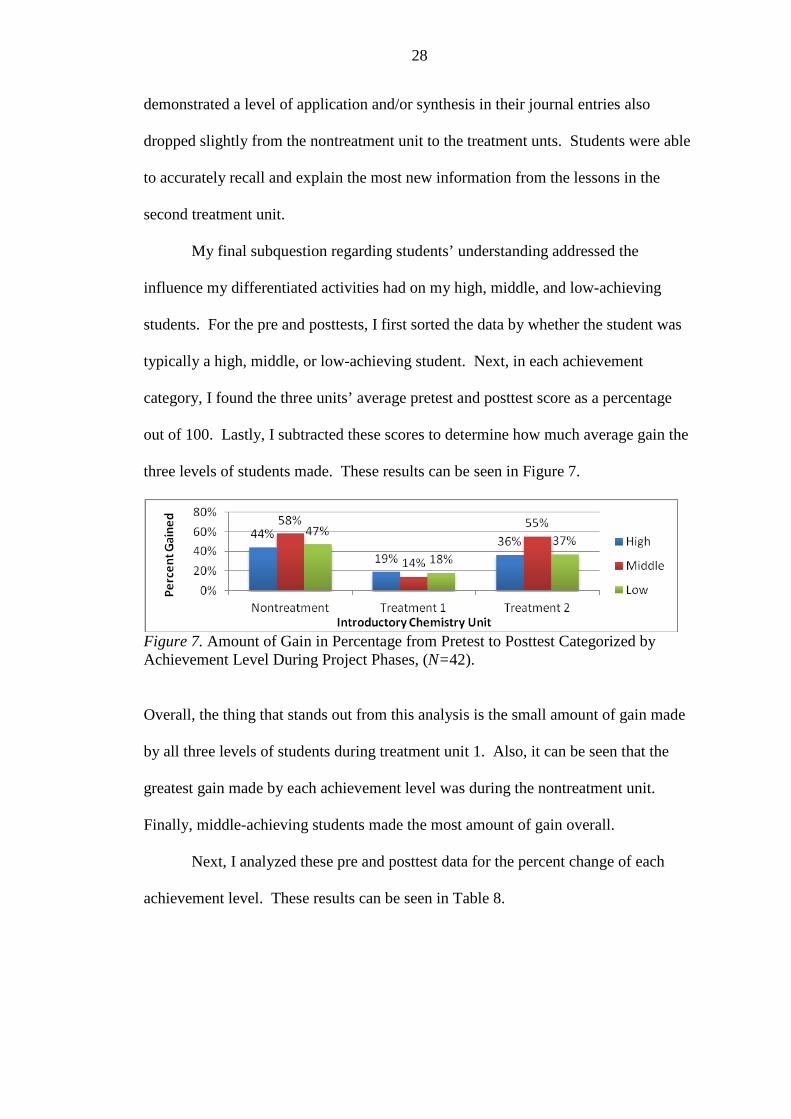
My final subquestion regarding students’ understanding addressed the
influence my differentiated activities had on my high, middle, and low-achieving
students. For the pre and posttests, I first sorted the data by whether the student was
typically a high, middle, or low-achieving student. Next, in each achievement
category, I found the three units’ average pretest and posttest score as a percentage
out of 100. Lastly, I subtracted these scores to determine how much average gain the
three levels of students made. These results can be seen in Figure 7.
Figure 7. Amount of Gain in Percentage from Pretest to Posttest Categorized by Achievement Level During Project Phases, (N=42).
Overall, the thing that stands out from this analysis is the small amount of gain made
by all three levels of students during treatment unit 1. Also, it can be seen that the
greatest gain made by each achievement level was during the nontreatment unit.
Finally, middle-achieving students made the most amount of gain overall.
Next, I analyzed these pre and posttest data for the percent change of each
achievement level. These results can be seen in Table 8.

29
Table 8 Percent Change from Preunit to Posunit Test Categorized by Student Achievement Level
Nontreatment Unit Treatment Unit 1 Treatment Unit 2 Pre Post %
Change Pre Post %
Change Pre Post %
Change High-Achieving
23 66 187% 43 61 42% 26 63 142%
Middle-Achieving
6 64 967% 42 56 33% 10 65 550%
Low-Achieving 2 49 2350% 24 42 75% 6 43 617%
When analyzed in this way, low-achieving students had the greatest amount of gain in
each treatment and nontreatment unit due to their initial limited amount of prior
knowledge demonstrated on the pretest. Once again, all three levels of students made
the most gain during the nontreatment unit.
Without taking prior knowledge into account, viewing only the average
posttest scores, the results of high, middle, and low-achieving students across the
nontreatment and treatment units are more similar. This analysis has been included
in Figure 8.
Figure 8. Average Posttest Scores Categorized by Achievement Level During Project Phases, (N=42).
From this analysis, results of high, middle, and low-achieving students during
treatment units one and two were slightly lower than the nontreatment unit. The
maximum difference between the nontreatment and treatment units was six points,
with the minimum difference being only one point.

30
Next, I looked at the amount of gain by my high, middle, and low-achieving
students as shown from their interviews. From my previous analysis of students’
overall understanding, I had assigned each student’s preunit and postunit interview a
score representing their percentage correct. I now subtracted these values for each
student, sorted them by achievement level, and averaged the values in each level to
see the average amount of gain made by my high, middle, and low-achieving
students. These results can be seen in Figure 9.
Figure 9. Percent Gained from Preunit to Postunit Interviews Categorized by Achievement Level During Project Phases, (N=7).
Like the pre and posttest analysis, interviews also show treatment unit 1
having the least amount of gain and nontreatment unit the most. Treatment unit 1
showed a very low gain for my middle achieving students. This was due to a
particular student whose answers to questions during the preinterview showed a
greater understanding than when she answered during the postunit interview. It
seemed that the activities from treatment unit 1 caused her to become confused and
develop some misunderstandings. Results from this student averaged with the other
interviewed middle-achieving student resulted in an average gain in understanding of
only eight points from the treatment unit 1 preinterview to the postinterview.
Next, I analyzed these pre and postunit interview data for the percent change
of each achievement level. These results can be seen in Table 9.
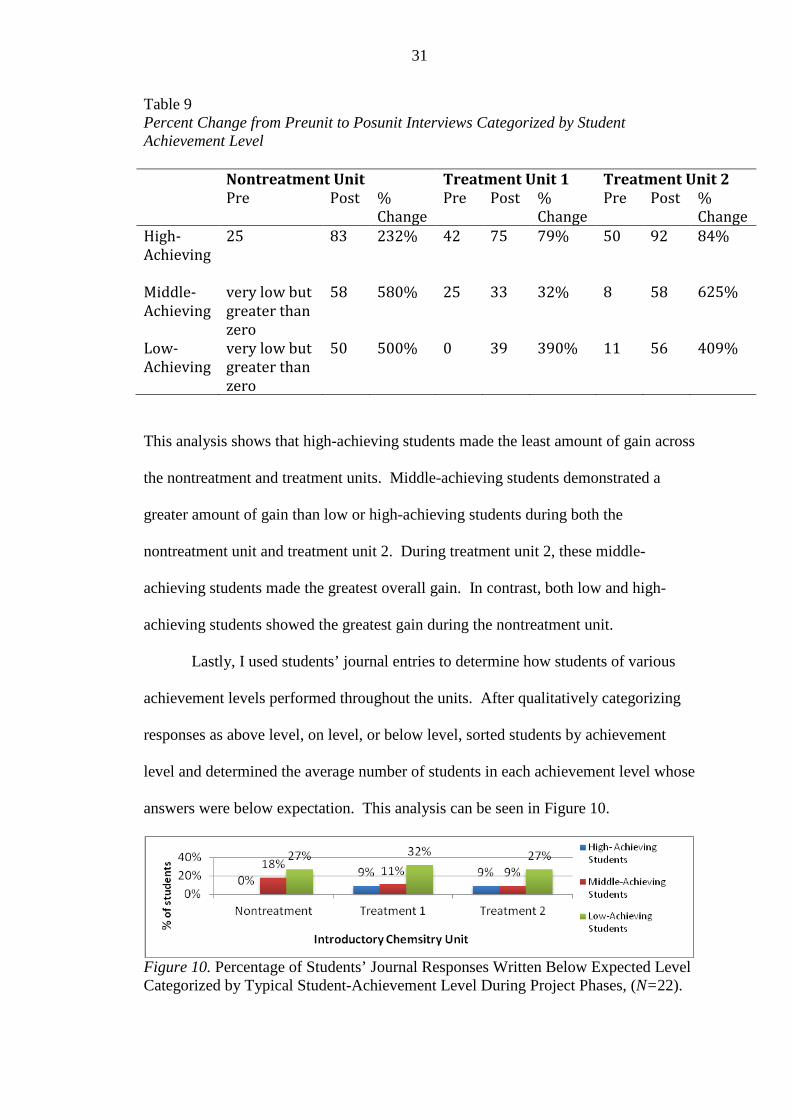
31
Table 9 Percent Change from Preunit to Posunit Interviews Categorized by Student Achievement Level
Nontreatment Unit Treatment Unit 1 Treatment Unit 2 Pre Post %
Change Pre Post %
Change Pre Post %
Change High-Achieving
25 83 232% 42 75 79% 50 92 84%
Middle-Achieving
very low but greater than zero
58 580% 25 33 32% 8 58 625%
Low-Achieving
very low but greater than zero
50 500% 0 39 390% 11 56 409%
This analysis shows that high-achieving students made the least amount of gain across
the nontreatment and treatment units. Middle-achieving students demonstrated a
greater amount of gain than low or high-achieving students during both the
nontreatment unit and treatment unit 2. During treatment unit 2, these middle-
achieving students made the greatest overall gain. In contrast, both low and high-
achieving students showed the greatest gain during the nontreatment unit.
Lastly, I used students’ journal entries to determine how students of various
achievement levels performed throughout the units. After qualitatively categorizing
responses as above level, on level, or below level, sorted students by achievement
level and determined the average number of students in each achievement level whose
answers were below expectation. This analysis can be seen in Figure 10.
Figure 10. Percentage of Students’ Journal Responses Written Below Expected Level Categorized by Typical Student-Achievement Level During Project Phases, (N=22).
32
High-achieving students had more below level responses in both treatment units when
compared to the nontreatment. Middle-achieving students had fewer below level
responses in the treatment units when compared to the nontreatment. Low-achieving
students stayed fairly consistent. Overall, this analysis of journal responses shows
middle-achieving students benefiting from the activities more than high or low-
achieving students.
My next subquestion focused on how implementing differentiated instruction
affected my preparation and teaching methods. From my daily teacher survey, I
averaged together my daily Likert responses to the four questions regarding these
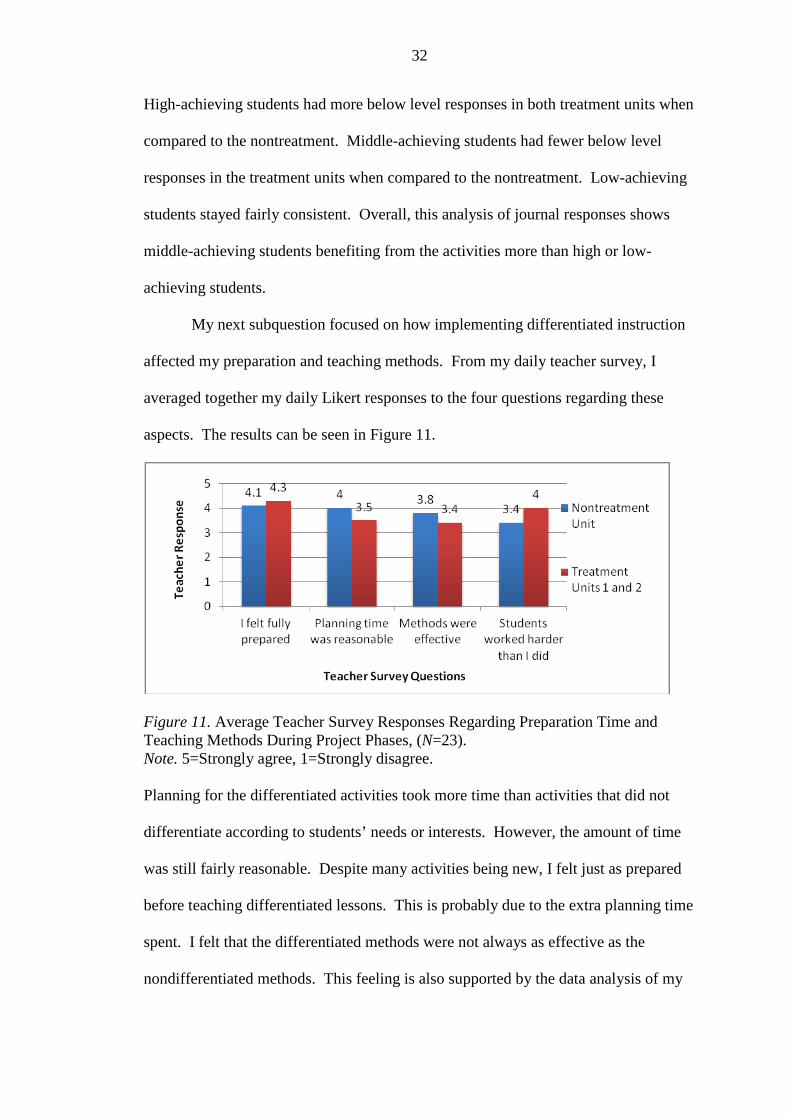
aspects. The results can be seen in Figure 11.
Figure 11. Average Teacher Survey Responses Regarding Preparation Time and Teaching Methods During Project Phases, (N=23). Note. 5=Strongly agree, 1=Strongly disagree. Planning for the differentiated activities took more time than activities that did not
differentiate according to students’ needs or interests. However, the amount of time
was still fairly reasonable. Despite many activities being new, I felt just as prepared
before teaching differentiated lessons. This is probably due to the extra planning time
spent. I felt that the differentiated methods were not always as effective as the
nondifferentiated methods. This feeling is also supported by the data analysis of my
33
project questions. When differentiated methods were used, the students were forced
to work harder than when differentiated methods were not used.
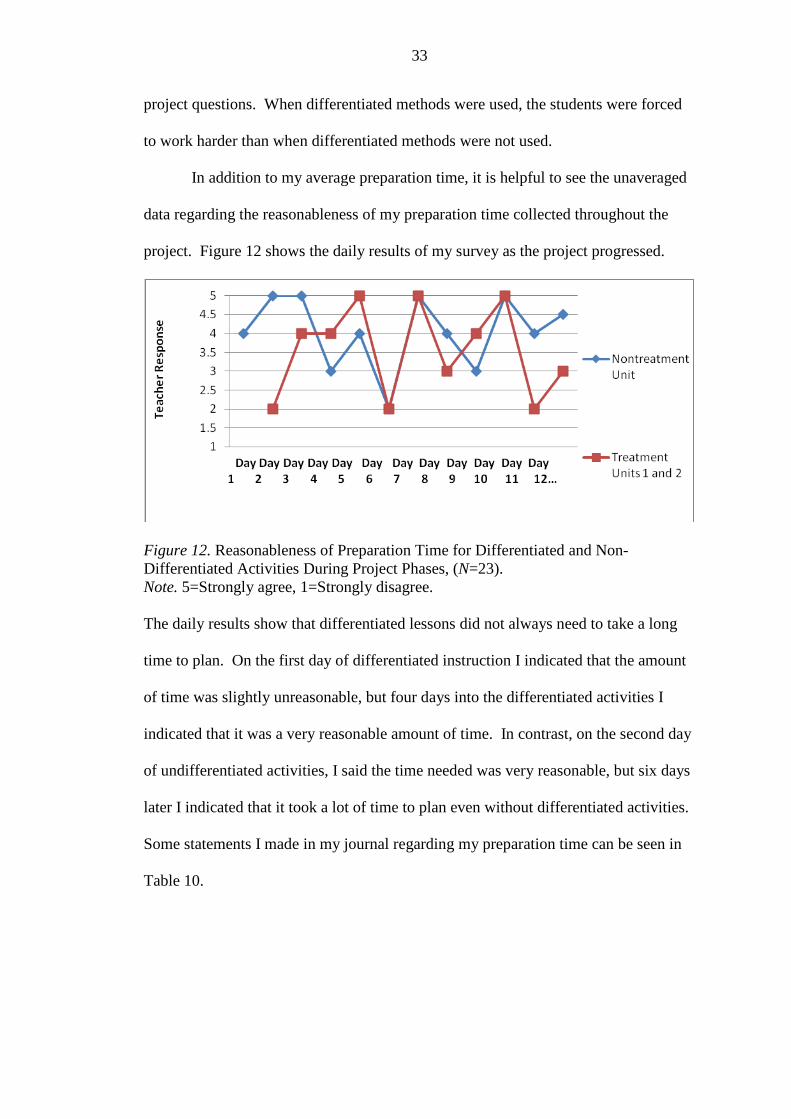
In addition to my average preparation time, it is helpful to see the unaveraged
data regarding the reasonableness of my preparation time collected throughout the
project. Figure 12 shows the daily results of my survey as the project progressed.
Figure 12. Reasonableness of Preparation Time for Differentiated and Non-Differentiated Activities During Project Phases, (N=23). Note. 5=Strongly agree, 1=Strongly disagree. The daily results show that differentiated lessons did not always need to take a long
time to plan. On the first day of differentiated instruction I indicated that the amount
of time was slightly unreasonable, but four days into the differentiated activities I
indicated that it was a very reasonable amount of time. In contrast, on the second day
of undifferentiated activities, I said the time needed was very reasonable, but six days
later I indicated that it took a lot of time to plan even without differentiated activities.
Some statements I made in my journal regarding my preparation time can be seen in
Table 10.
34
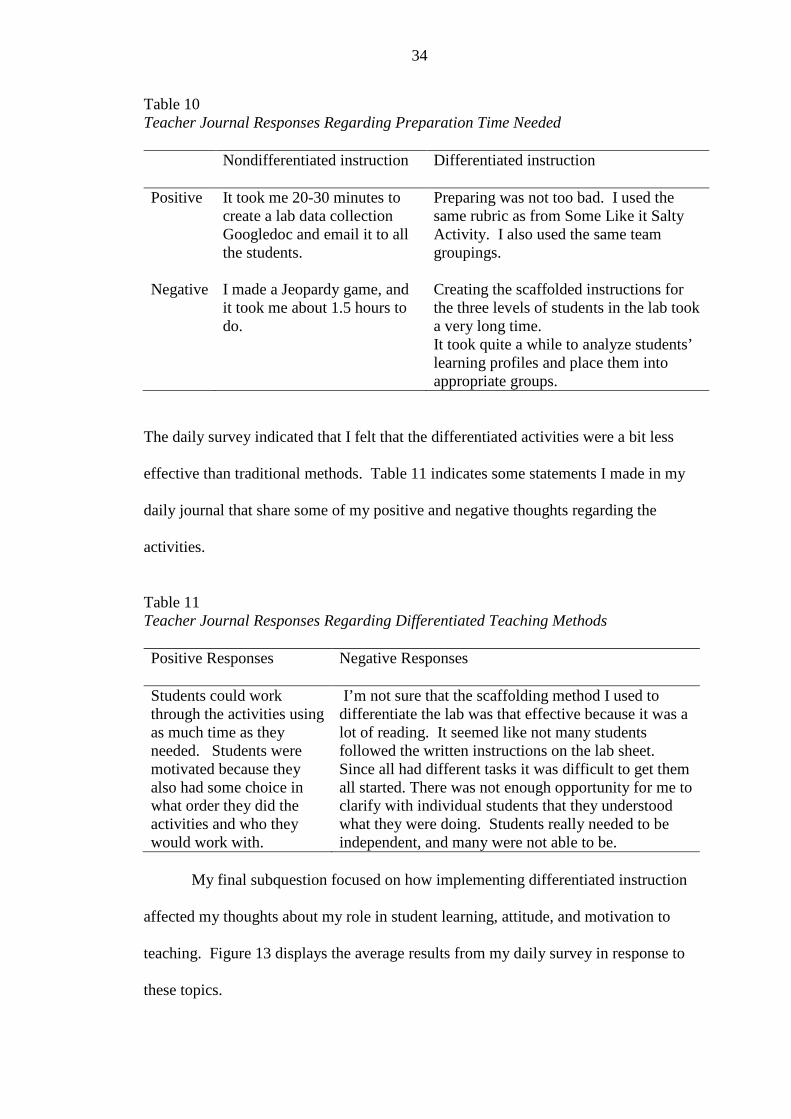
Table 10 Teacher Journal Responses Regarding Preparation Time Needed
Nondifferentiated instruction Differentiated instruction
Positive It took me 20-30 minutes to create a lab data collection Googledoc and email it to all the students.
Preparing was not too bad. I used the same rubric as from Some Like it Salty Activity. I also used the same team groupings.
Negative I made a Jeopardy game, and it took me about 1.5 hours to do.
Creating the scaffolded instructions for the three levels of students in the lab took a very long time. It took quite a while to analyze students’ learning profiles and place them into appropriate groups.
The daily survey indicated that I felt that the differentiated activities were a bit less
effective than traditional methods. Table 11 indicates some statements I made in my
daily journal that share some of my positive and negative thoughts regarding the
activities.
Table 11 Teacher Journal Responses Regarding Differentiated Teaching Methods
Positive Responses Negative Responses
Students could work through the activities using as much time as they needed. Students were motivated because they also had some choice in what order they did the activities and who they would work with.
I’m not sure that the scaffolding method I used to differentiate the lab was that effective because it was a lot of reading. It seemed like not many students followed the written instructions on the lab sheet. Since all had different tasks it was difficult to get them all started. There was not enough opportunity for me to clarify with individual students that they understood what they were doing. Students really needed to be independent, and many were not able to be.
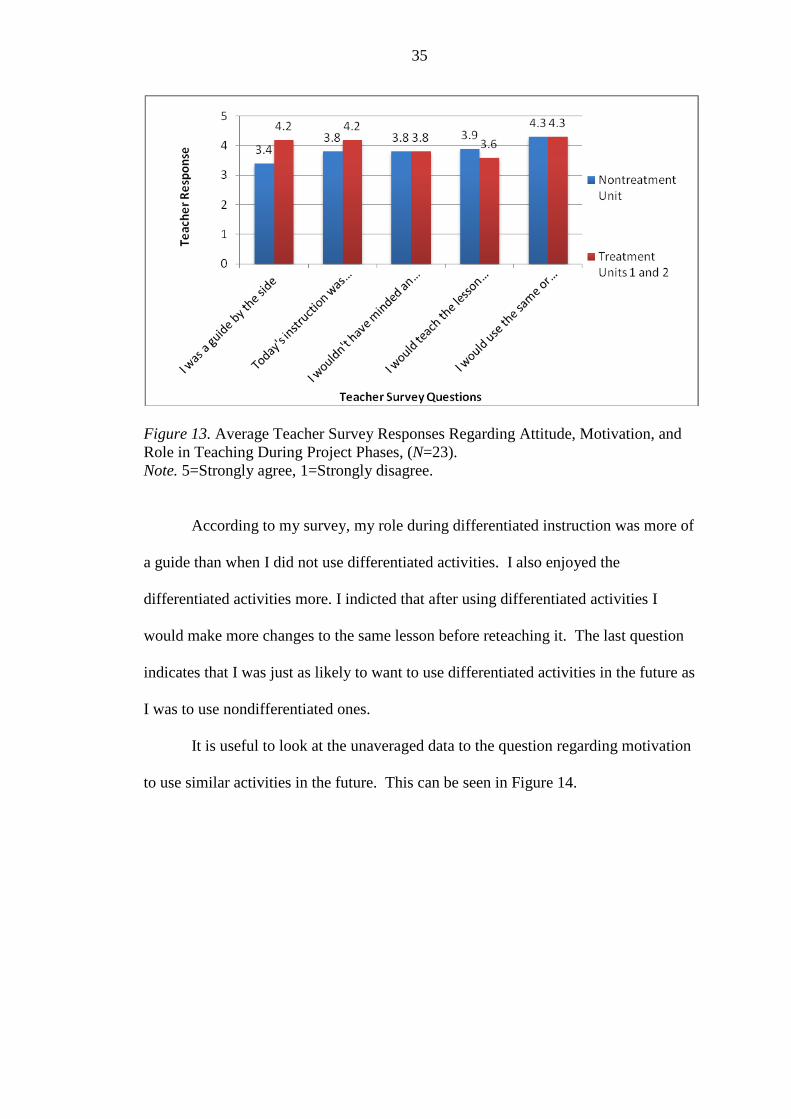
My final subquestion focused on how implementing differentiated instruction
affected my thoughts about my role in student learning, attitude, and motivation to
teaching. Figure 13 displays the average results from my daily survey in response to
these topics.
35
Figure 13. Average Teacher Survey Responses Regarding Attitude, Motivation, and Role in Teaching During Project Phases, (N=23). Note. 5=Strongly agree, 1=Strongly disagree.
According to my survey, my role during differentiated instruction was more of
a guide than when I did not use differentiated activities. I also enjoyed the
differentiated activities more. I indicted that after using differentiated activities I
would make more changes to the same lesson before reteaching it. The last question
indicates that I was just as likely to want to use differentiated activities in the future as
I was to use nondifferentiated ones.
It is useful to look at the unaveraged data to the question regarding motivation
to use similar activities in the future. This can be seen in Figure 14.

36
Figure 14. Comparison of Responses Regarding Motivation to Use Similar Classroom Activities in the Future During Project Phases, (N=23). Note. 5=Strongly agree, 1=Strongly disagree.
Although the average indicates that I am just as likely to use similar differentiated
activities in the future as to use nondifferentiated activities, looking at my daily
responses shows that my feelings regarding this were not as drastic as when I did not
use differentiated activities. On day two during the nontreatment unit, I indicated that
I would definitely use the nondifferentiated activities from that day again. However,
on day three I indicated that I would not be very likely to use those nondifferentiated
activities again. In contrast, after the first day of using differentiated activities during
the treatment units when I was fairly neutral, the days following I bounced back and
forth between being pretty likely to use the activity again and definitely using it again.
My daily journal entries often indicated how much I enjoyed seeing students
work through differentiated activities due to the opportunity to see students’
creativity, strengths, motivation, and chance to work at their own level. Some of my
positive comments can be seen in Table 12.
37
Table 12 Positive Teacher Journal Responses
Subquestion Positive Responses
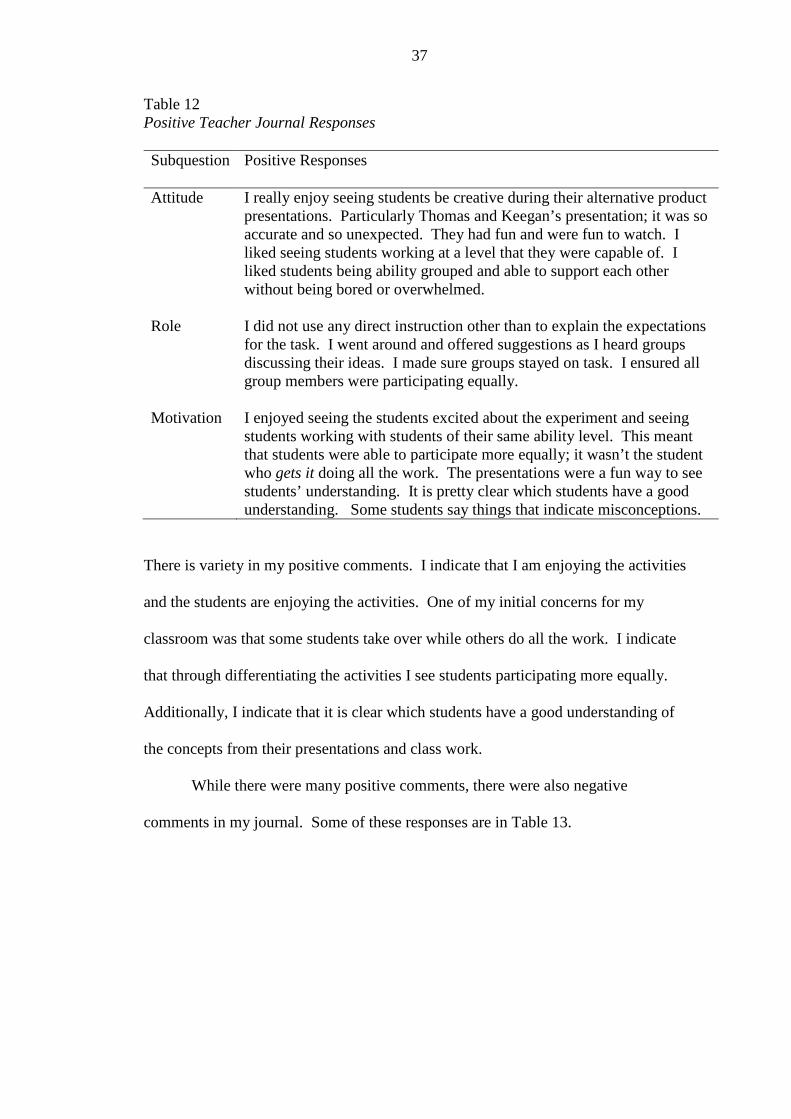
Attitude I really enjoy seeing students be creative during their alternative product presentations. Particularly Thomas and Keegan’s presentation; it was so accurate and so unexpected. They had fun and were fun to watch. I liked seeing students working at a level that they were capable of. I liked students being ability grouped and able to support each other without being bored or overwhelmed.
Role I did not use any direct instruction other than to explain the expectations for the task. I went around and offered suggestions as I heard groups discussing their ideas. I made sure groups stayed on task. I ensured all group members were participating equally.
Motivation I enjoyed seeing the students excited about the experiment and seeing students working with students of their same ability level. This meant that students were able to participate more equally; it wasn’t the student who gets it doing all the work. The presentations were a fun way to see students’ understanding. It is pretty clear which students have a good understanding. Some students say things that indicate misconceptions.
There is variety in my positive comments. I indicate that I am enjoying the activities
and the students are enjoying the activities. One of my initial concerns for my
classroom was that some students take over while others do all the work. I indicate
that through differentiating the activities I see students participating more equally.
Additionally, I indicate that it is clear which students have a good understanding of
the concepts from their presentations and class work.
While there were many positive comments, there were also negative
comments in my journal. Some of these responses are in Table 13.

38
Table 13 Negative Teacher Journal Responses
Negative Comments
When supervising students creating the presentations, I don’t feel like I’m helping enough. Some groups finished before others. Some students went off task. The room was noisy and chaotic. Students came away from the activity with misconceptions. I wonder if what students are learning or solidifying is in balance with the amount of time the task takes. It consistently takes longer than I would like it to for some groups to finish. I was stressed in this lab. Students seemed to be having fun, but some were also off task or not doing things the way I intended. At the end, many students did not fully understand and apply the idea of calculating the density in order to make the density of the film canister 1g/mL. I gave them too much independence.
These negative comments address the management of the differentiated activities and
students’ lack of understanding at the end of the activity.
INTERPRETATION AND CONCLUSION
When comparing my results from the nontreatment and treatment units, I did
not find differentiated activities to have a positive effect on students’ understanding of
science concepts. The number of correct responses from the nontreatment unit’s
posttests and postunit interviews was fairly consistent with the number of correct
responses from the results of the treatment units. This was true despite the fact that
students’ prior knowledge about the topic studied when starting the treatment units
was greater than when starting the nontreatment unit. Therefore, the greatest gain in
understanding on the unit tests occurred during the nontreatment unit. Interview
results were consistent with the results from the unit tests, with a greater amount of
prior knowledge demonstrated during the pretreatment unit interviews and a

39
consequent lesser amount of overall gain. Student journal entries did not favor the
nontreatment unit’s nondifferentiated activities or treatment units’ differentiated
instruction. Comparing the nontreatment unit to treatment unit 1, five percent of the
class dropped from being onlevel to below level. Comparing nontreatment unit to
treatment unit 2, 5% of the class increased from being below level to on or above
level.
No consistent evidence demonstrated that the differentiated activities students
participated in had a positive effect on their cognitive level of understanding concepts.
Several results pointed to the benefit of nondifferentiated activities. For example, the
unit tests demonstrated that, when comparing the three cognitive levels of
remembering, applying, and evaluating, the most gain was made in the application
and analysis questions. The gain in this level was made during both nontreatment and
treatment units alike, but was greatest during the nontreatment unit according to
posttests, postunit interviews, and journal entries. Additionally, all three data sources
showed that the least amount of gain in any of the cognitive levels was made during
treatment unit 1, as students were first getting accustomed to the differentiated
instruction. In contrast, results that pointed to the benefit of differentiated activities
included the unit tests and interviews, which both indicated that students’ level of
evaluating and synthesizing information gained the most during treatment unit 2.
However, this was contradicted by students’ journal entries, where the fewest number
of responses including evidence of evaluating and synthesizing new information
occurred during treatment unit 2. Students’ basic knowing and understanding new
information was, according to interviews and journal entries, strongest in treatment
unit 2. According to posttests, this cognitive level was also strongest in treatment unit
1, but contrastingly low in treatment unit 2.

40
The hope that the needs of my high and low-achieving students would be
better met through differentiated instruction was not supported by my data. Of the
three achievement levels, high-achieving students made the least amount of gain. Of
the gain made by high and low-achieving students, the tests, interviews, and journals
indicated that this was highest during the nontreatment unit. However, data from
interviews and journal entries did indicate that middle-achieving students were overall
most successful in their learning during the second treatment unit. Overall, the data
does not support differentiated instruction as benefiting my students’ understanding of
introductory chemistry science concepts.
The results regarding my personal thoughts about teaching using differentiated
activities contained positive aspects not seen in the data collected from students.
Firstly, although differentiated lessons were slightly more time consuming to plan,
surprisingly, this was not consistently true. I sometimes spent just as long planning
for nondifferentiated activities as differentiated ones. Also, once the activities had
been initially created, I was easily able to adapt them to different concepts, which
lessened my future planning time. Secondly, I enjoyed the differentiated activities
more due to the allowance for student creativity and the opportunity to speak and
work with students on a more individual basis. Thirdly, I found that students
participated more equally when grouped based on common ability levels or interests
than when they were randomly grouped. In this setting, it appeared that students
divided the work more evenly among group members.
A negative aspect of differentiated activities indicated from both my personal
reflection and student data collection was their lack of evident effectiveness. After
reading in-depth about the philosophy behind differentiation, I predicted the effect of
these activities to be more positive. However, the way I implemented my
41
differentiated activities and the way I collected my data may have had negative
influences on my results.
The first reason positive results were not achieved may have been that the
scaffolding provided to students, especially in labs, was solely in written form. This
method was effective for students who were strong readers, but challenging for low
readers. If students were not able to read and follow the information and instructions,
they were not receiving the additional needed scaffolding. To remedy this problem, I
would research other methods of scaffolding such as through diagrams or audio and
multimedia methods and use these to create scaffolded instructions that are more
accessible to all students.
In addition to independence in reading, students also needed to be more
mature and independent in their work habits when participating in differentiated
instruction. Because various activities were happening simultaneously, greater
independence was needed in reading instructions carefully, using rubrics, self-
monitoring understanding, and staying on task. Struggling readers as well as students
with weak motivation and work habits therefore needed more support.
Since various activities were happening simultaneously, this required efficient
classroom management strategies. A huge amount of organization was needed with
giving varied instructions, managing materials, getting students into groupings, and
checking their understanding. Trying to implement this during the midyear meant
students and myself needed to adjust already established classroom routines and
procedures. Many of the negative comments I made in my journal about differentiated
activities dealt with classroom management, which I believe will improve as these
activities are used more.

42
Similar to managing classroom routines, another result of students not always
receiving full class instruction and needing to work more independently meant I
needed to be much more proactive in consistently checking in with students to fill in
gaps in understanding and ensure misunderstandings were not developing as students
worked. Erroneously, more of my effort was spent trying to manage the various
activities I was implementing for the first time rather than helping students summarize
and solidify their understanding. Students needed more individual feedback from me
than they would during whole class, direct instruction. This was particularly lacking
at the initial implementation of treatment unit 1, and might explain why student
results from treatment unit 1 were sometimes lower than both nontreatment unit and
treatment unit 2
Another adjustment that I would make to increase the likelihood of positive
effects from differentiated instruction would be to increase the amount of teaching
days for each unit. For each nontreatment or treatment unit, the number of teaching
days was only eight. Eight days was not much time for students to be exposed to new
information in this new way. It was evident from my journal reflection that
differentiated instruction required more class time than nondifferentiated instruction.
Since high-achieving students had more challenging tasks than usual and low-
achieving students did not have the support of the high-achieving students doing the
work for them, students needed more time to complete class work. Longer amounts
of time for each unit needed to be factored into my planning.
Like the lab experiments needed improvement in my method of scaffolding,
the tiered homework method implemented also needed improvement. High-achieving
students choose to answer higher cognitive-level questions, but classroom instruction
did not always provide these students with the understanding needed to answer the
43
questions accurately. Since various students had completed different homework,
follow-up took a long time and should not have been done in a classroom discussion
format. A good strategy was needed for checking the accurateness and understanding
of all students. These types of questions also provided additional challenge in that
there was not usually a specific correct answer, which meant each student’s responses
needed to be checked for accuracy individually.
Reflecting on the data collection instruments used, several changes might have
yielded more accurate results. Firstly, students wrote the pre and posttests on the
same document. At the beginning of the unit, students completed a written pretest.
At end of the unit, students were given back their original pretest and told to make
corrections. Unfortunately, students were not able to self-correct responses they had
previously written. If students had responded to a question on the pretest, they usually
did not change it on the posttest even if it was fully incorrect. Students were much
more likely to correctly answer questions they had previously left blank. Providing
students with a blank postassessment to complete would have been best.
Additionally, because both the posttest and journal entries were not summative
assessments, many students did not take them seriously and rushed through their
answering. In the future, I would come up with a way of motivating all students to do
their best on each data collection source.
The interview questions used were also lacking. A concept map helped me
assess students’ understanding of concepts. However, the terms in the word bank for
each unit needed to be more carefully considered. The bank for treatment unit 1 was
quite small. The bank for treatment unit 2 was quite large and allowed for many very
similar connections. Concept map data was, therefore, not beneficial in determining

44
students’ understanding and was not used in the analysis. Subsequently, interview
data about understanding of concepts was not as accurate as possible.
VALUE
One realization from this project’s data analysis is not to assume that
strategies researched by others and implemented by me will automatically be
beneficial to my students. According to my data collection and analysis, as well as
my personal reflection, differentiated instruction was not effective for my students.
However, as I reflected on the above, I recognize that time and practice is needed to
develop effective understanding and management in order to design and implement
differentiated instruction effectively. I must be continually reflective and observant
when implementing new strategies to gauge their impact on my students’ learning. I
would like to continue to more closely analyze pre and posttest information, journal
responses, and individual conversations with students to be aware of their learning
progress.
A second implication was the positive aspect of grouping students according
to ability level or interest within the classroom. I found that students were more
comfortable, confident, and motivated when they worked with those they had
commonalities with. In the future, I will put more thought into how I group students
for activities instead of only using random or behavioral groupings.
Lastly, I recognize that for students to learn concepts more deeply with
differentiated instruction, I need to allow more time. Students need more time to
complete differentiated assignments, and I need to spend more time after a
differentiated lesson checking in with them. In the future, I will allow more time for
each activity when I’m implementing differentiated instruction. A positive result
45
found about differentiated activities was that students had the time they needed to
process new information. Students were not forced to leave a task before
understanding because the class was moving on or remain on a task waiting once they
already understood because others in the class did not yet understand.
The audience beyond myself that I was hoping to benefit was my sixth-grade
math/science teaching team. I had hoped to be able to give these colleagues effective
strategies and activities for our introductory chemistry unit to be used in their
classrooms. Unfortunately, at this time, I need more practice and research with
differentiated instruction before recommending to my colleagues the activities used in
this project. However, I think it is still valuable to share with them my strategies,
observations, and results from this project.
My results are generalizable to other classrooms or schools that are similar in
resources and type of students. Differentiated instruction was possible for me to
implement due to the plentiful resources, available support, and small class size. It
would be more challenging for a teacher without a lab technician due to the additional
time needed to scaffold the lab as well as purchase and set up all the lab materials. It
would be more challenging and chaotic for a teacher with a class size larger than 22
students to divide the class into similar leveled groups and have students working on
different assignments. Also, my students are fairly motivated and well behaved.
Since differentiated instruction required students to be more mature and independent,
this might be more challenging in an environment where students are not motivated to
work hard and stay on task with their assignments.
Lastly, this capstone project taught me the process and value of doing an
action research project. Life in the classroom speeds by and often I do not take the
time to stop and be reflective. This project helped me see the importance of
46
collecting data from a variety of sources and sitting down to analyze it and see what is
working in my classroom. I learned that teaching methods that I use and believe are
effective are not always as effective as I perceive them to be.
If I were to continue my capstone project, the next steps in this research
process would be to focus on just one of the four types of differentiated activities I
used and try to perfect its use. I used scaffolded instructions, alternative assessments,
tiered homework, and graphic organizers. Using four separate pieces that I was
unfamiliar with, and only using each piece twice, I was unable to fix any faults. By
choosing one type of activity and doing similar research about its effectiveness, I
could adjust my management and methods to implement it more successfully.
Lastly, another continuation of this project might be to research how ability
grouping students without differentiated instruction influences their understanding
and success. A grouping from this project that appeared beneficial to my students
was separating by reading level during the supported reading and by ability level in
the lab. I would study how much success was from the different instructions and
graphic organizers the groups received in comparison to being with others of their
same ability level.
47
REFERENCES CITED Avci, S., Yuksel, A., Soyer, M., & Balikcioglu, S. (2009). The cognitive and
affective changes caused by the differentiated classroom environment designed for the subject of poetry. Educational Sciences: Theory & Practice, 9(3), 1069-1084.
Brighton, C.M., & Hertberg, H.L. (2004). Reconstructing the vision: Teachers’
Responses to the invitation to change. Research in Middle Level Education Online, 27(2), 1-20.
Carolan, J., & Guinn, A. (2007). Differentiation: Lessons from master teachers.
Educational Leadership, 64(5), 44-47.
Grimes, K., & Stevens, D. (2009). Glass, bug, mud. Phi Delta Kappan, 90(9), 677-680.
Hertberg-Davis, H. (2009). Myth 7: Differentiation in the regular classroom is equivalent to gifted programs and is sufficient. Gifted Child Quarterly, 53(4), 251-253. Holt, Rinehart & Winston. (2007). Holt science and technology: Introduction to matter. Chicago, IL: Holt Rinehart & Winston Publishing. Hong, E., Greene, M.T., & Higgins, K. (2006). Instructional practices of teachers in
general education classrooms and gifted resource rooms: Development and validation of the instructional practice questionnaire. Gifted Child Quarterly, 50(2), 91-103.
Krathwohl, D. (2002). A revision of Bloom’s taxonomy: An overview. Theory Into
Practice, 41(4), 212-264. Mastropieri, M.A., Scruggs, T.E., Norland, J.J., Berkeley, S., McDuffie, K., Tornquist, E.H., et al. (2006). Differentiated curriculum enhancement in inclusive middle school science: Effects on classroom and high-stakes tests. The Journal of Special Education, 40(3), 130-137. McKenzie, W. (1999). Multiple intelligences inventory. Retrieved February 1, 2011 from http://surfaquarium.com/MI/inventory.htm National Science Foundation. (n.d.) OERL: Teacher education instruments. Retrieved March 5, 2011 from http://oerl.sri.com/instruments/te/teachsurv/instr49.html Santamaria, L.J. (2009). Culturally responsive differentiated instruction: Narrowing gaps between best pedagogical practices benefiting all learners. Teachers College Record, 111(1), 214-247.

48
Shelton, L., Heavenridge, P., & Beckerman, C.D. (n.d.) Multiple intelligences for adult literacy and education. Retrieved from February 15, 2011 http://literacyworks.org/mi/assessment/findourstrengths.html Simpkins, P.M., Mastropieri, M.A., & Scruggs, T.E. (2009). Differentiated curriculum enhancements in inclusive fifth-grade science classes. Remedial and Special Education, 30(5), 300-308. Sisk, D. (2009). Myth 13: The regular classroom teacher can “go it alone”. Gifted Child Quarterly, 53(4), 269-271. Tomlinson, C. (1999). The differentiated classroom: Responding to the needs of all learners. Alexandria, VA: Association for Supervision and Curriculum
Development. Tomlinson, C. (2000). Reconcilable differences? Standards-based teaching and differentiation. Educational Leadership, 58(1), 6-10. Tomlinson, C. (2003). Fulfilling the promise of the differentiated classroom. Alexandria, VA: Association for Supervision and Curriculum Development. Tomlinson, C.A., Brighton, C., Hertberg, H., Callahan, C.M., Moon, T.R., Brimijoin, K., et al. (2003). Differentiating instruction in response to student readiness, interest, and learning profile in academically diverse classrooms: A review of literature. Journal for the Education of the Gifted, 27(2), 119-145. Youngs, D., Wiebe, A., Lile, D., Landon, K., McKibban, M., Laidlaw, W., et al. (2004). AIMS floaters and sinkers: Mass, volume, and density. New York, NY: AIMS Education Foundation.

49
APPENDICES

50
APPENDIX A
PROJECT CONSENT FORMS
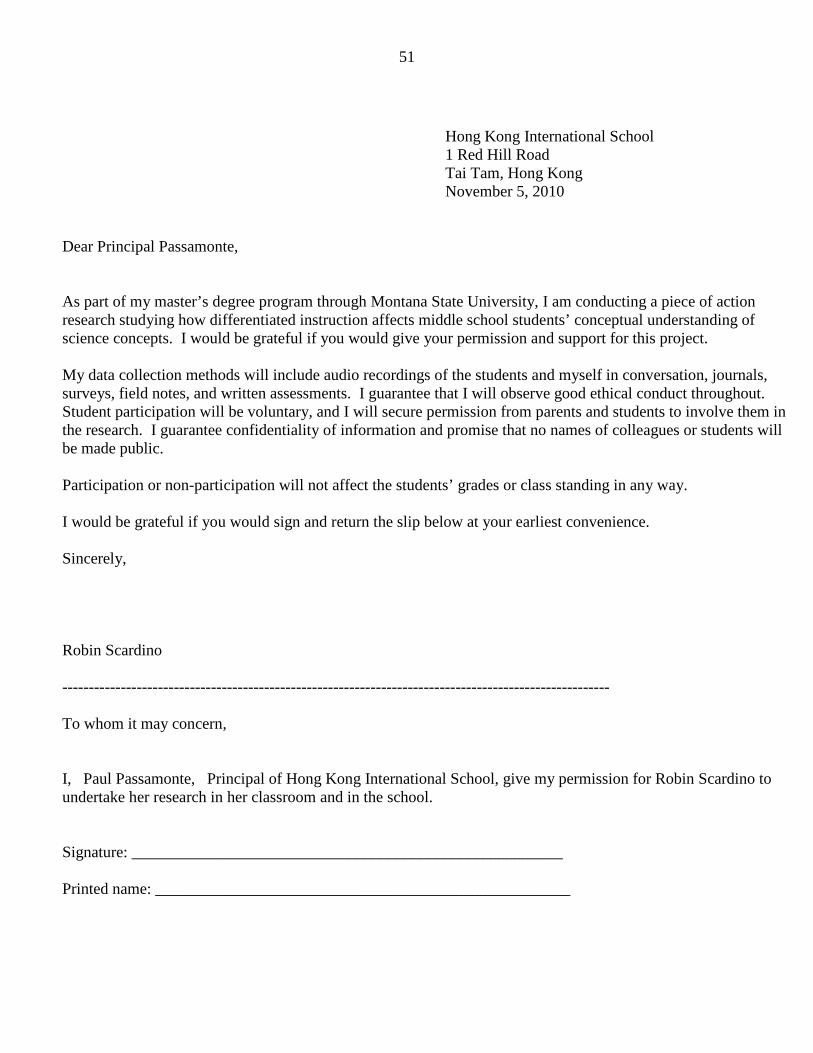
51
Hong Kong International School 1 Red Hill Road Tai Tam, Hong Kong November 5, 2010 Dear Principal Passamonte, As part of my master’s degree program through Montana State University, I am conducting a piece of action research studying how differentiated instruction affects middle school students’ conceptual understanding of science concepts. I would be grateful if you would give your permission and support for this project. My data collection methods will include audio recordings of the students and myself in conversation, journals, surveys, field notes, and written assessments. I guarantee that I will observe good ethical conduct throughout. Student participation will be voluntary, and I will secure permission from parents and students to involve them in the research. I guarantee confidentiality of information and promise that no names of colleagues or students will be made public. Participation or non-participation will not affect the students’ grades or class standing in any way. I would be grateful if you would sign and return the slip below at your earliest convenience. Sincerely, Robin Scardino ------------------------------------------------------------------------------------------------------- To whom it may concern, I, Paul Passamonte, Principal of Hong Kong International School, give my permission for Robin Scardino to undertake her research in her classroom and in the school. Signature: ______________________________________________________ Printed name: ____________________________________________________

52
Hong Kong International School 1 Red Hill Road Tai Tam, Hong Kong November 5, 2010 Dear Parents, As part of my master’s degree program through Montana State University, I am conducting a piece of action research studying how differentiated instruction affects middle school students’ conceptual understanding of science concepts. I would be grateful if you would give your permission for your child to take part in this project. My data collection methods will include audio recordings of the students and myself in conversation as well as written journals, surveys, and assessments. Student participation in the project is voluntary, and I guarantee confidentiality of information and promise that no names of students will be made public. Participation or non-participation will not affect the students’ grades or class standing in any way. I would be grateful if you would sign and return the slip below at your earliest convenience. Yours sincerely, Robin Scardino ------------------------------------------------------------------------------------------------------ To: Robin Scardino, I give my permission for my child, _____________________________, to take part in your research. Parent Signature: ________________________________________ Student Signature: _________________________________________

53
APPENDIX B
NONTREATMENT LAB WORKSHEET: WAT-AR DENSITIES?

54
Volume of water (mL)
Mas
s of w
ater
(g)
0 50 100 150 200 250 300
5
0
10
0
150
2
00
250
Wat-ar Densities?
Key Question: What is the density of water? Learning Goal: Students will determine the density of water Procedure:
1. Record the mass of your empty graduated cylinder on the chart below. 2. Measure 50mL of water into your graduated cylinder. 3. Record the mass of the graduated cylinder with the water in it. 4. Subtract the two masses to find the mass of the water. Record this under the heading Mass of Water. 5. Divide the mass of the water by the volume of the water to find its density and rount to the nearest hundredth. 6. Repeat using the indicated volumes of water. 7. Find the average of the densities.
Volume Mass Empty Mass Filled Mass of Water Density of Water 50mL 100mL 150mL 200mL 250mL
The Standard Density of Water at room temperature is 1g/cm3 (or 1g/mL). How close did you come? Graph your data.
Youngs, D., Wiebe, A., Lile, D., Landon, K., McKibban, M., Laidlaw, W., et al. (2004). AIMS floaters and sinkers: Mass, volume, and density. New York, NY: AIMS Education Foundation.

55
APPENDIX C
PREUNIT AND POSTUNIT TEST FOR TREATMENT AND NONTREATMENT UNITS

56
Name: _______________________________________ Number: _____________
“Properties of Matter” Density Pretest & Posttest
1A) Define density. B) Draw the particle arrangement of a substance that is dense, such as gold, and one that is not dense, such as wood. Gold Wood 2. Calculate the density of an object with a mass of 30g and a volume of 44mL. 3. Design an experiment you could carry out to determine which of two objects had a greater density.

57
Name: _______________________________________ Number: ___________ “Properties of Matter”
Buoyancy Pretest & Posttest 1. An object that sinks in water must have a density that is… A) Less than 1 g/mL B) Equal to 1 g/mL C) Greater than 1 g/mL Explain your choice: 2. An object with a mass of 45g and a volume of 35mL was dropped in water. Predict whether the object will sink or float and explain your reasoning. 3. Is it possible for a substance with a density of 3g/mL to float? Explain your reasoning. Design an experiment that could prove your answer. You may use the list of substances and their densities to help you.
Substance Density Chlorine 0.00321
g/mL Water 1 g/mL Ethanol 0.789
g/mL Mercury 13.55
g/mL
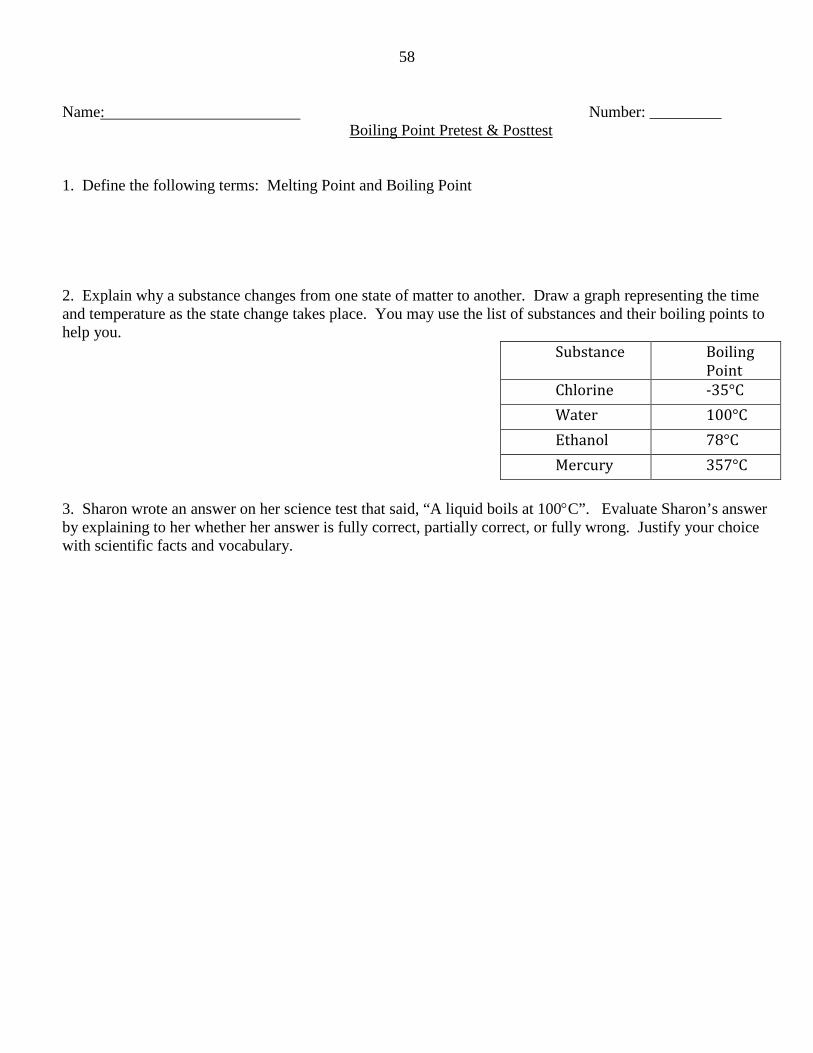
58
Name: Number: _________ Boiling Point Pretest & Posttest 1. Define the following terms: Melting Point and Boiling Point 2. Explain why a substance changes from one state of matter to another. Draw a graph representing the time and temperature as the state change takes place. You may use the list of substances and their boiling points to help you.
Substance Boiling Point
Chlorine -35°C Water 100°C Ethanol 78°C Mercury 357°C
3. Sharon wrote an answer on her science test that said, “A liquid boils at 100°C”. Evaluate Sharon’s answer by explaining to her whether her answer is fully correct, partially correct, or fully wrong. Justify your choice with scientific facts and vocabulary.

59
APPENDIX D
STUDENT LEARNING PROFILE SURVEY
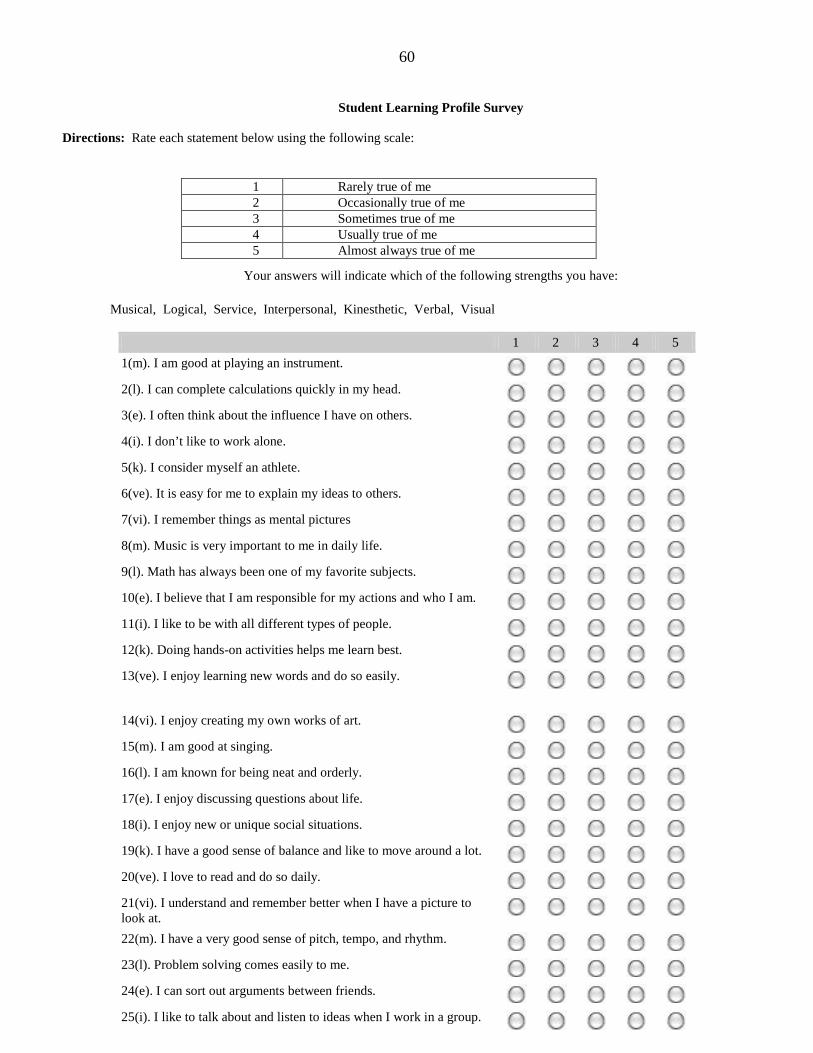
60
Student Learning Profile Survey Directions: Rate each statement below using the following scale:
Your answers will indicate which of the following strengths you have:
Musical, Logical, Service, Interpersonal, Kinesthetic, Verbal, Visual
1 2 3 4 5 1(m). I am good at playing an instrument.
2(l). I can complete calculations quickly in my head.
3(e). I often think about the influence I have on others.
4(i). I don’t like to work alone.
5(k). I consider myself an athlete.
6(ve). It is easy for me to explain my ideas to others.
7(vi). I remember things as mental pictures
8(m). Music is very important to me in daily life.
9(l). Math has always been one of my favorite subjects.
10(e). I believe that I am responsible for my actions and who I am.
11(i). I like to be with all different types of people.
12(k). Doing hands-on activities helps me learn best.
13(ve). I enjoy learning new words and do so easily.
14(vi). I enjoy creating my own works of art.
15(m). I am good at singing.
16(l). I am known for being neat and orderly.
17(e). I enjoy discussing questions about life.
18(i). I enjoy new or unique social situations.
19(k). I have a good sense of balance and like to move around a lot.
20(ve). I love to read and do so daily.
21(vi). I understand and remember better when I have a picture to look at.
22(m). I have a very good sense of pitch, tempo, and rhythm.
23(l). Problem solving comes easily to me.
24(e). I can sort out arguments between friends.
25(i). I like to talk about and listen to ideas when I work in a group.
1 Rarely true of me 2 Occasionally true of me 3 Sometimes true of me 4 Usually true of me 5 Almost always true of me
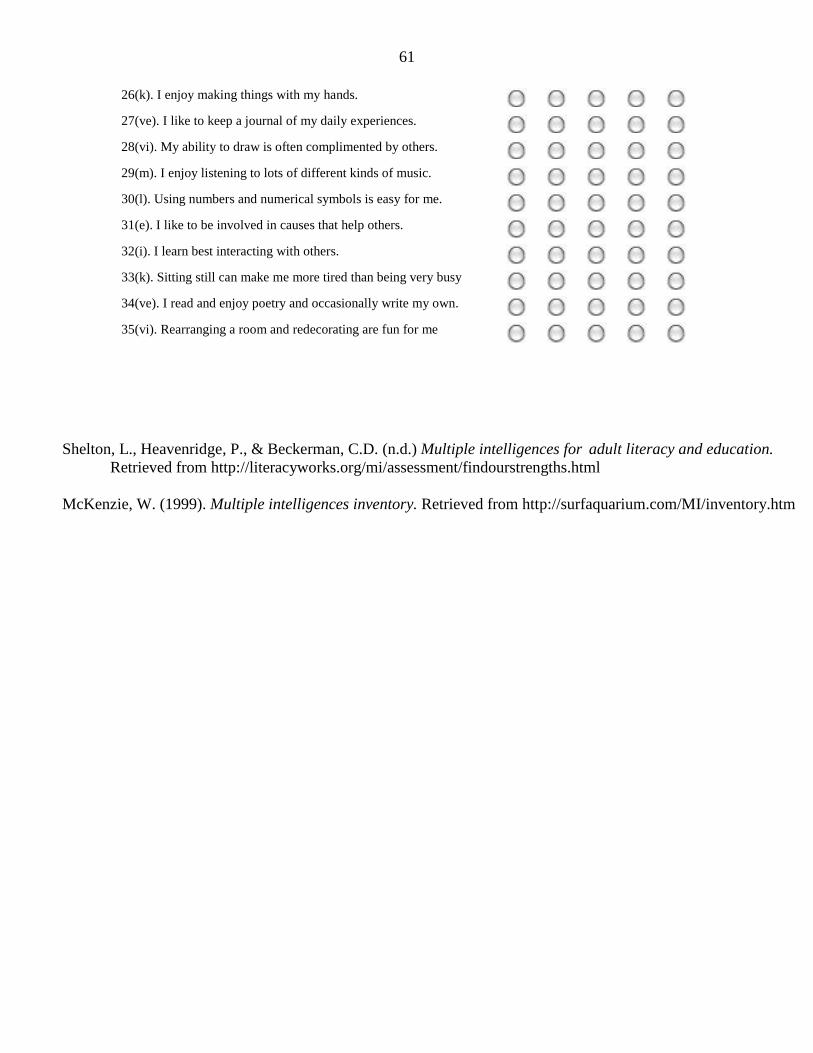
61
26(k). I enjoy making things with my hands.
27(ve). I like to keep a journal of my daily experiences.
28(vi). My ability to draw is often complimented by others.
29(m). I enjoy listening to lots of different kinds of music.
30(l). Using numbers and numerical symbols is easy for me.
31(e). I like to be involved in causes that help others.
32(i). I learn best interacting with others.
33(k). Sitting still can make me more tired than being very busy
34(ve). I read and enjoy poetry and occasionally write my own.
35(vi). Rearranging a room and redecorating are fun for me
Shelton, L., Heavenridge, P., & Beckerman, C.D. (n.d.) Multiple intelligences for adult literacy and education. Retrieved from http://literacyworks.org/mi/assessment/findourstrengths.html McKenzie, W. (1999). Multiple intelligences inventory. Retrieved from http://surfaquarium.com/MI/inventory.htm
62
APPENDIX E
GRAPHIC ORGANIZERS FOR STATES OF MATTER AND CHANGES OF STATE TEXTBOOK READINGS FROM TREATMENT UNIT 2: BOILING POINT

63
Graphic Organizer for textbook pp. 32-35
I am a solid. What are my characteristics? Draw what I look like. I am a liquid. What are my characteristics? Draw what I look like.
Topic:
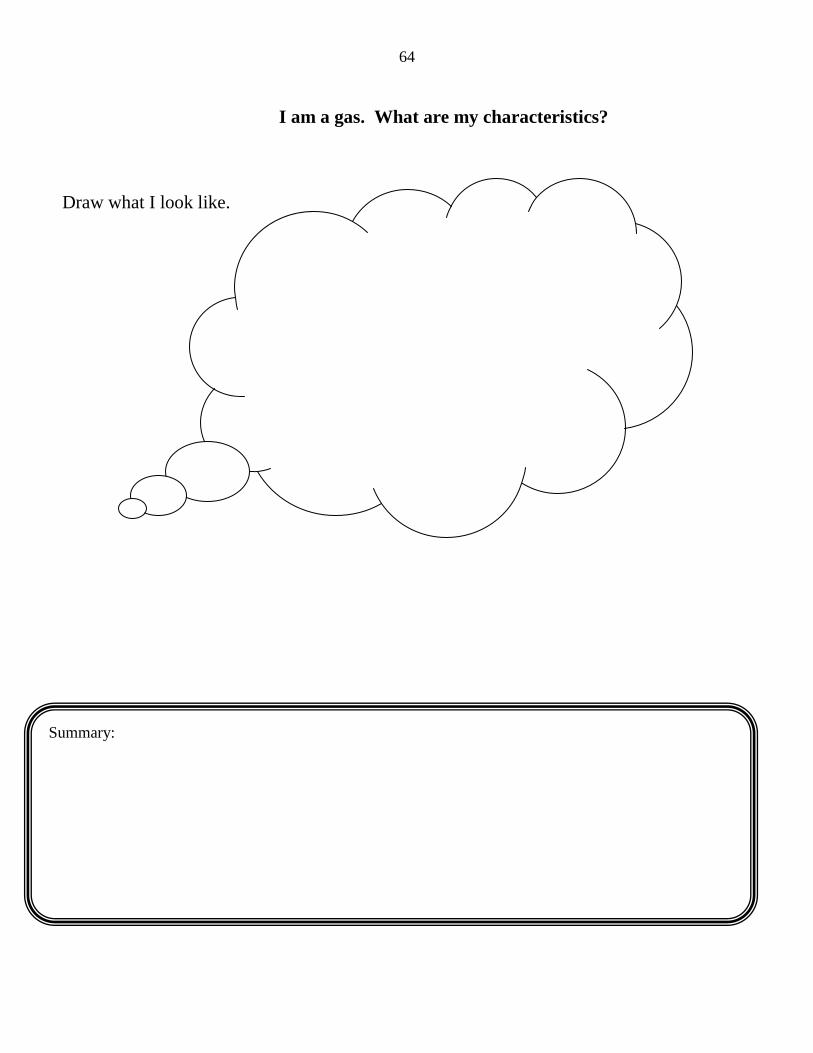
64
I am a gas. What are my characteristics? Draw what I look like.
Summary:
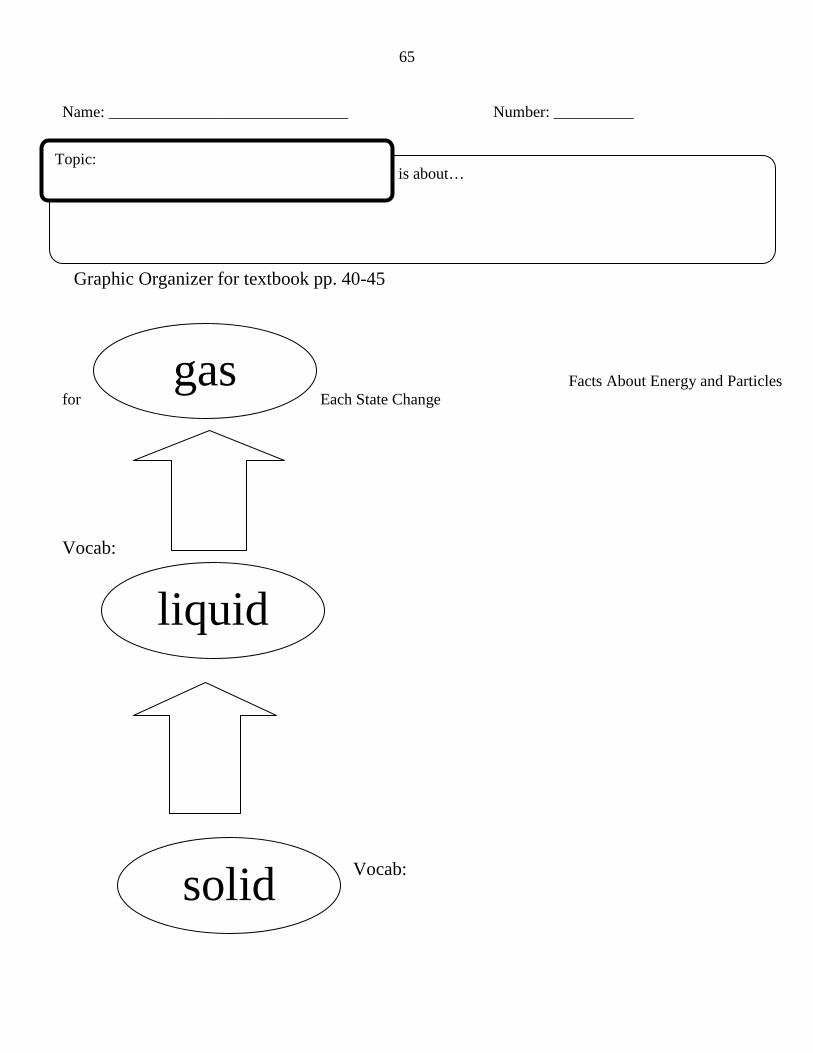
65
Name: ______________________________ Number: __________
Graphic Organizer for textbook pp. 40-45
Facts About Energy and Particles
for Each State Change Vocab:
Vocab:
solid
liquid
gas
is about…
Topic:

66
Facts About Energy & Particles for Each State & Change:
Vocab:
Vocab:
solid
liquid
gas
Summary:
It is important for me to learn about this topic because….

67
APPENDIX F
FLINKER SCAFFOLDED LABORATORY ASSIGNMENT FOR TREATMENT UNIT 1: BUOYANCY

68
Step 2 Written: The materials being used in this experiment are…
Step 2 Photo: Materials being used in this experiment
Group Members’ Names:_________________________________________________________
FLINKER: Making an object NEUTRALLY BOUYANT (SCAFFOLDED FOR LOW-ACHIEVING STUDENTS)
Objectives: Today you will make adjustments to the mass and/or volume of a given object until the object becomes neutrally buoyant. You will collect data using a provided data collection table. Using this document and PhotoBooth, you will also document the steps of your experiment and your reasoning behind these steps through writing and photos. Directions: Step 1: a. What are two ways you know when an object will sink and when it will float?
b. What is the formula for calculating the density of an object? Step 2: In PhotoBooth, take a photo of the materials you will be using in this experiment. Drag and drop your photo into the box on the left. Next, list the materials in your photo in the text box on the right.
Step 3: a) Complete column one in the chart below. You will also use this chart for steps 4-8 to keep track of your tries at making your object neutrally buoyant. b) Take a photo of your group member as he or she finds the mass and the volume of the object. Drop the photos into the boxes below. Also take a photo of just the object.

69
Written: The first change we made to our original object was…. The reason we made this change was…. Our result was…
Step 4 Photo: Trial 1
Original Object
Trial 1
Trial 2
Trial 3
Trial 4
Trial 5
Trial 6
Trial 7 Trial 8
mass (g)
Volume (mL)
Density (g/mL)
Sink or float?
Step 4: Now, decide what your first small change will be towards making your object neutrally buoyant. Explain your change, reasoning, and result in the text box on the left. (Remember to record your results under trial 1 in the data table above.) Next, take a photo of trial 1. Step 5: Most likely, your object is not yet neutrally buoyant. Make another small change and document your change, reasoning, and result with written text, data in the data table, and a photo.
Step 3 Photo: Finding the mass Step 3 Photo: Finding the volume Step 3 Photo: The Original Object

70
Written: The final result of our experiment was…. If we were to continue our experiment, we would…..
Step 7 Photo: Final Result
Step 6: Continue with this same procedure until your object becomes neutrally buoyant. Document your trials as explained in steps 4 & 5 using the table. Remember to record your data in the data collection table on page 2!
Step 7: Record the final result of your experiment. If your team did not get your object to become neutrally buoyant, explain what your next step would have been if you were to continue the experiment.
The change we made was The reason we made this change was
Our result was
Written: The second change we made was…. The reason we made this change was…. Our result was…
Step 5 Photo: Trial 2
71
Step 8: Take a photo of the group members you worked with to complete this experiment. Good job team!
Step 8 Photo: Team Photo!

72
Name:_____________________________________ Number: ______
FLINKER: Making an object NEUTRALLY BOUYANT (SCAFFOLDED FOR MIDDLE-ACHIEVING STUDENTS)
Objectives: Today you will make adjustments to the mass and/or volume of a given object until the object becomes neutrally buoyant. You will collect data using the data collection chart below. Using this document and PhotoBooth, you will document the steps of your experiment and your reasoning behind these steps through writing and photos.
DATA COLLECTION
Original
Object Trial 1 Trial 2 Trial 3 Trial 4 Trial 5 Trial 6 Trial 7 Trial 8
Written/Visual Documentation of Experiment
Write an explanation of what you captured IMMEDIATELY AFTER taking the photo. Justify your step by writing your
reasoning.
Picture 2: Original Object
Picture 1: Materials used in this experiment

73
Write an explanation of what you captured IMMEDIATELY AFTER taking the photo. Justify your step by writing your reasoning
Picture 4: Finding the volume
Picture 5: Trial 1
Picture 3: Finding the mass
Picture 6: 1st Adjustment we made

74
Picture 8: 3rd adjustment we made
Picture 9: 4th adjustment we made
Picture 11: Our Lab Group Picture 10: Final Result
Picture 7: 2nd Adjustment we made

75
Group Members’ Names:________________________________________________________________________ FLINKER: Making an object NEUTRALLY BOUYANT (UNSCAFFOLDED FOR HIGH-
ACHIEVING STUDENTS)
Objectives: Today you will make adjustments to the mass and/or volume of a given object until the object becomes neutrally buoyant. You will collect and record data in a table that you create. You will document the steps of your experiment and your reasoning behind these steps through writing and photos. Written Parts: Photos: 1. A data table that neatly records the data collected 1. All materials used in the experiment 2. Explanations of what is in each photo 2. The original object by itself 3. Explanations of your reasoning for each adjustment 3. Measuring the mass and volume (1-2 photos) 4. Summary of your final results. 4. Each alteration made to the object (4-6 photos)
5. The final result 6. A team photo *Suggestion: Insert a textbox outlined in black. Drop each photo into the textbox.
76
APPENDIX G
TIME TO BOIL LABORATORY ASSIGNMENT SCAFFOLDED FOR LOW, MIDDLE, AND HIGH-ACHIEVING STUDENTS FOR TREATMENT UNIT 2: BOILING POINT

77
Group Members’ Names: ____
Time to Boil: (SCAFFOLDED FOR LOW-ACHIEVING STUDENTS) Objective: Today you will figure out if water’s volume affects its boiling point. You will collect data of the boiling point (temperature boiling begins) for at least 3 different volumes of water. You will collect data of the time it takes to reach the boiling point for at least 3 different volumes of water. Hypothesis/Prediction: Make a prediction by choosing one of the following statements.
I think that the volume of water (having more or less of it) will not affect at what temperature it boils (boiling point)
I think that the volume of water (having more or less of it) will affect at what temperature it boils (boiling point).
Review of Activity One Water changes from liquid gas at ________°C. This is called water’s ____________ _____________ Activity Two: Does volume affect Boiling Point? Step 1- Volume: Today’s experiment will see if a liquid’s volume affects the temperature that it boils (Boiling Point). Reminders:
a) Volume is… ____________________________________________________________. b) Units for volume of a liquid…_________________________. c) Draw and name the measuring tool used to find the volume of a liquid
Step 2- Materials: The materials you will use for this lab are on your table. You will also be bringing your beakers of water to the hot plate watched by Ms. Scardino at the front of the room. Draw the materials you will be using.

78
Step 3- Methods & Procedures: Now you will begin the experiment! Your team will heat different volumes of water in beakers using the hot plate in the front of the room. You will use the stopwatch to time how long it takes each volume of water to reach its boiling point. Your team will use the data table in Step 4 to record the data you collect. Check off each step as it is completed.
a) Use the graduated cylinder to measure 50mL of water from the sink. Carefully pour this water into one of the beakers.
b) Use the graduated cylinder to measure 200mL of water from the sink. Carefully pour this water into the other beaker.
c) Choose a member of your team to be in charge of the stopwatch. This person will be the timer. Write this person’s name here: ___________________________
Please read before continuing: Just like in the previous experiment, the timer will tell your team every time a minute has passed. When each minute is called, you will send one of your team members up to observe the two beakers on the hot plate. This observing team member will report back the temperature of the water and whether or not it is boiling.
d) Carefully bring the two thermometers and the two beakers up to the hot plate, then return to your table. Tell the timer to start the stopwatch.
e) Record the temperature of the water at each minute and highlight whether the water has reached its boiling point
Temperature (°C) / Boiling? (Yes/No)
f) Once you have a free beaker, use the graduated cylinder to measure 150mL of water from the
sink. Carefully pour this water into the free beaker and bring it to the hot plate.
g) Once you have a free beaker, use the graduated cylinder to measure 100mL of water from the sink. Carefully pour this water into the free beaker and bring it to the hot plate

79
Step 4- Data Collection: Use the data table below to summarize your group’s information from above. (Right click on the graph and click “edit data” and input your values to complete the graph)
Step 5- Conclusion: a) At what temperature does water boil? b) How does the data you collected in your experiment support or disprove your original prediction? Was your original prediction correct? c) In your own words, summarize what you learned from today’s experiment. Challenge Questions: * Do you think that volume will or will not have an effect on the boiling point of liquids other than water? Explain. * Are there other factors besides volume that have an effect on the boiling point of a liquid? *What is another variable about boiling you would like to investigate? Explain why you would like to investigate that. Design an experiment that you could do to investigate that variable.
Amount of water
(VOLUME)
Temperature at which water boiled (BOILING POINT)
Time it took to heat the water to the boiling point
(TIME in minutes) 50mL
100mL
150mL
200mL
Time and Temperature of Boiling Water
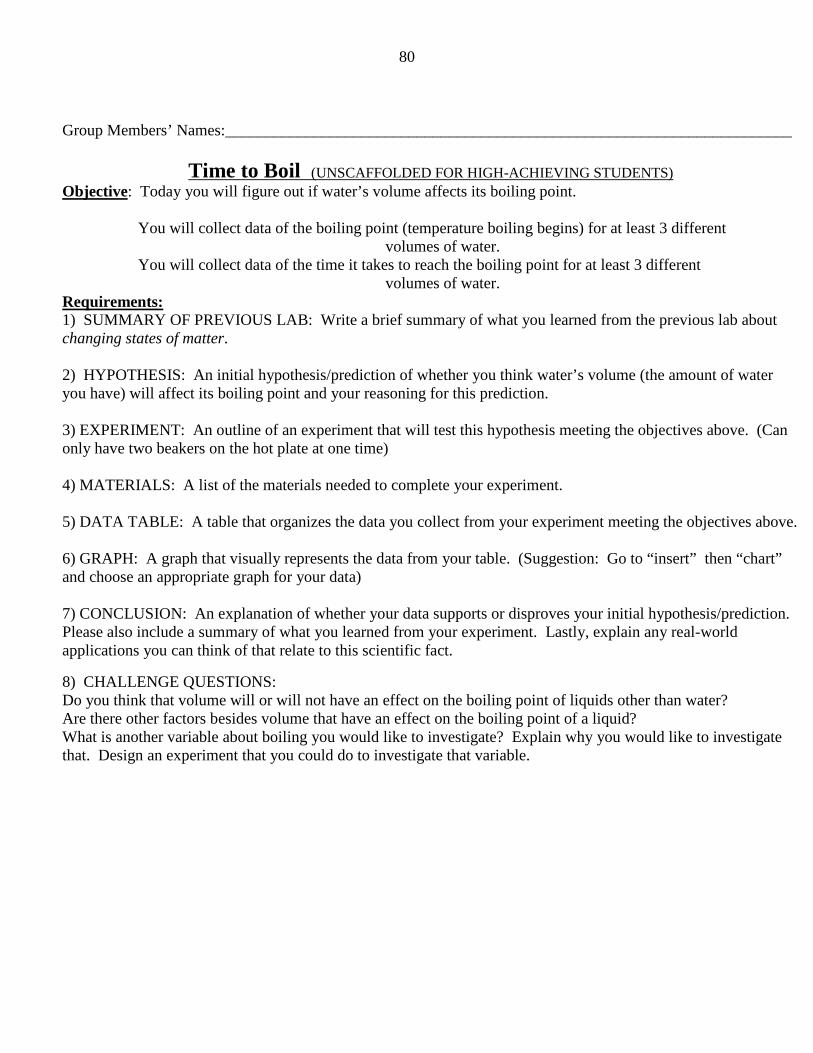
80
Group Members’ Names:_______________________________________________________________________
Time to Boil (UNSCAFFOLDED FOR HIGH-ACHIEVING STUDENTS) Objective: Today you will figure out if water’s volume affects its boiling point. You will collect data of the boiling point (temperature boiling begins) for at least 3 different volumes of water. You will collect data of the time it takes to reach the boiling point for at least 3 different volumes of water. Requirements: 1) SUMMARY OF PREVIOUS LAB: Write a brief summary of what you learned from the previous lab about changing states of matter. 2) HYPOTHESIS: An initial hypothesis/prediction of whether you think water’s volume (the amount of water you have) will affect its boiling point and your reasoning for this prediction. 3) EXPERIMENT: An outline of an experiment that will test this hypothesis meeting the objectives above. (Can only have two beakers on the hot plate at one time) 4) MATERIALS: A list of the materials needed to complete your experiment. 5) DATA TABLE: A table that organizes the data you collect from your experiment meeting the objectives above. 6) GRAPH: A graph that visually represents the data from your table. (Suggestion: Go to “insert” then “chart” and choose an appropriate graph for your data) 7) CONCLUSION: An explanation of whether your data supports or disproves your initial hypothesis/prediction. Please also include a summary of what you learned from your experiment. Lastly, explain any real-world applications you can think of that relate to this scientific fact.
8) CHALLENGE QUESTIONS: Do you think that volume will or will not have an effect on the boiling point of liquids other than water? Are there other factors besides volume that have an effect on the boiling point of a liquid? What is another variable about boiling you would like to investigate? Explain why you would like to investigate that. Design an experiment that you could do to investigate that variable.

81
Group Members’ Names:_______________________________________________________________________
Time to Boil (SCAFFOLDED FOR MIDDLE-ACHIEVING STUDENTS) Objective: Today you will figure out if water’s volume affects its boiling point. You will collect data of the boiling point (temperature boiling begins) for at least 3 different volumes of water. You will collect data of the time it takes to reach the boiling point for at least 3 different volumes of water. Hypothesis/Prediction: Make a prediction by choosing one of the following statements.
I think that the volume of water (having more or less of it) will not affect at what temperature it boils (boiling point) because…
I think that the volume of water (having more or less of it) will affect at what temperature it boils (boiling point) because….
Review a) Define boiling point and explain what you learned about it in the previous lab. b) Define volume and explain what you know about it from previous lessons and experiments. Materials: The materials you will use for this lab are on your table. You will also be using the hot plate watched by Ms. Scardino at the front of the room. Record these materials on the lines below. _______________________________ _________________________________ ________________________________ ________________________________ (1) hot plate _ _ Please read through the methods and data collection sections before beginning your experiment.
Methods: *Your team will heat at least 3 different volumes of water in beakers using the hot plate in the front of the room. (You are only allowed two beakers on the hot plate at the same time.) *You will use the stopwatch to time how long it takes each volume of water to reach its boiling point. *Your team will fill in the data table in Step 4 to record the data you collect. *Just like in the previous experiment, the timer will tell your team every time a minute has passed. When each minute is called, you will send one of your team members up to observe the two beakers on the hot plate. This observing team member will report back the temperature of the water and whether or not it is boiling.
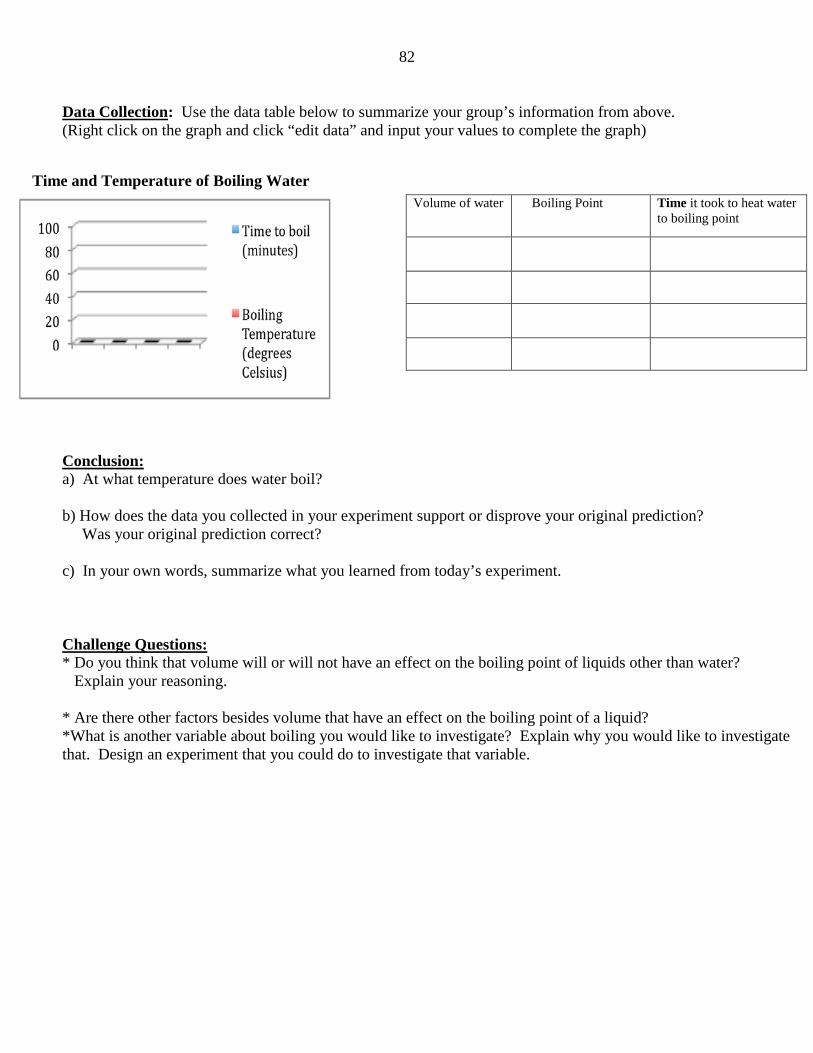
82
Data Collection: Use the data table below to summarize your group’s information from above. (Right click on the graph and click “edit data” and input your values to complete the graph)
Conclusion: a) At what temperature does water boil? b) How does the data you collected in your experiment support or disprove your original prediction? Was your original prediction correct? c) In your own words, summarize what you learned from today’s experiment. Challenge Questions: * Do you think that volume will or will not have an effect on the boiling point of liquids other than water? Explain your reasoning. * Are there other factors besides volume that have an effect on the boiling point of a liquid? *What is another variable about boiling you would like to investigate? Explain why you would like to investigate that. Design an experiment that you could do to investigate that variable.
Volume of water Boiling Point Time it took to heat water to boiling point
Time and Temperature of Boiling Water

83
APPENDIX H
RUBRIC FOR LEARNING PROFILE ALTERNATIVE PRODUCTS
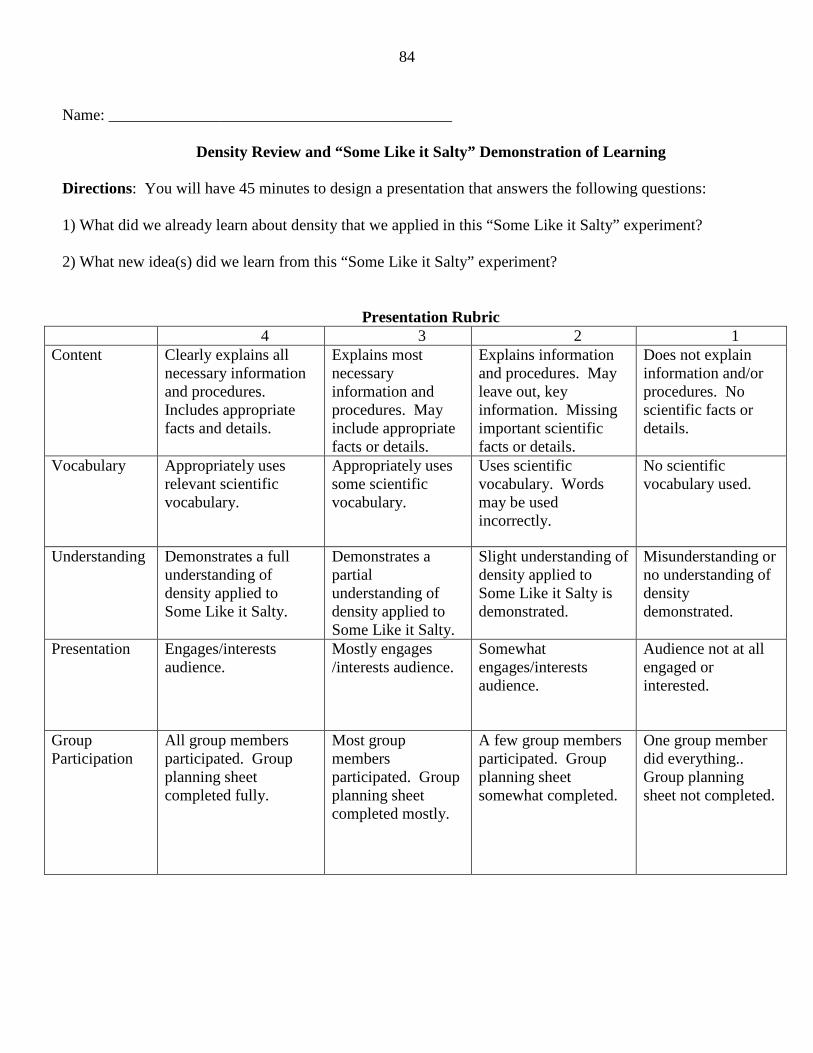
84
Name: ___________________________________________
Density Review and “Some Like it Salty” Demonstration of Learning
Directions: You will have 45 minutes to design a presentation that answers the following questions: 1) What did we already learn about density that we applied in this “Some Like it Salty” experiment? 2) What new idea(s) did we learn from this “Some Like it Salty” experiment?
Presentation Rubric 4 3 2 1
Content Clearly explains all necessary information and procedures. Includes appropriate facts and details.
Explains most necessary information and procedures. May include appropriate facts or details.
Explains information and procedures. May leave out, key information. Missing important scientific facts or details.
Does not explain information and/or procedures. No scientific facts or details.
Vocabulary Appropriately uses relevant scientific vocabulary.
Appropriately uses some scientific vocabulary.
Uses scientific vocabulary. Words may be used incorrectly.
No scientific vocabulary used.
Understanding Demonstrates a full understanding of density applied to Some Like it Salty.
Demonstrates a partial understanding of density applied to Some Like it Salty.
Slight understanding of density applied to Some Like it Salty is demonstrated.
Misunderstanding or no understanding of density demonstrated.
Presentation Engages/interests audience.
Mostly engages /interests audience.
Somewhat engages/interests audience.
Audience not at all engaged or interested.
Group Participation
All group members participated. Group planning sheet completed fully.
Most group members participated. Group planning sheet completed mostly.
A few group members participated. Group planning sheet somewhat completed.
One group member did everything.. Group planning sheet not completed.
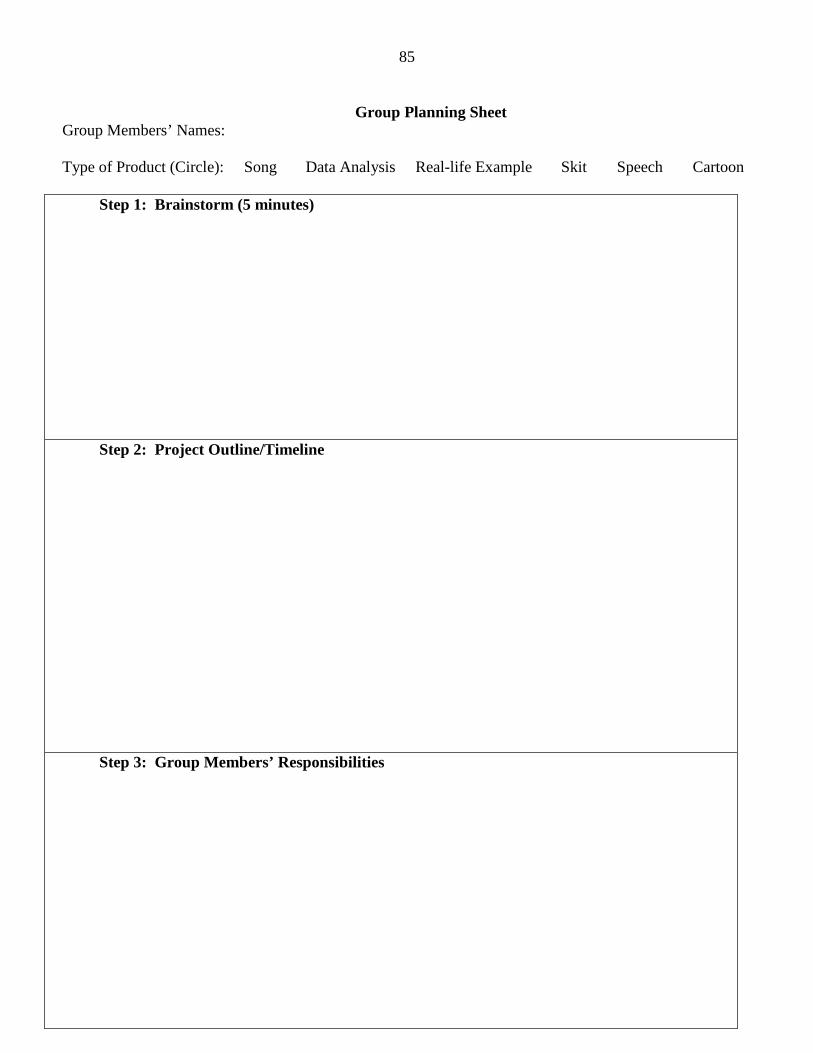
85
Group Planning Sheet
Group Members’ Names: Type of Product (Circle): Song Data Analysis Real-life Example Skit Speech Cartoon
Step 1: Brainstorm (5 minutes)
Step 2: Project Outline/Timeline Step 3: Group Members’ Responsibilities

86
Name: ___________________________________________
“Changing States of Matter Lab” Demonstration of Learning
Directions: You will have 30 minutes to design a presentation that answers the following questions: 1) What did we already know about the properties of solids, liquids, and gases that helps us explain what happened in the lab? 2) What important scientific concepts did we see in this experiment?
Presentation Rubric 4 3 2 1
Content Clearly explains all necessary information and procedures. Includes appropriate facts and details.
Explains most necessary information and procedures. May include appropriate facts or details.
Explains information and procedures. May leave out, key information. Missing important scientific facts or details.
Does not explain information and/or procedures. No scientific facts or details.
Vocabulary Appropriately uses relevant scientific vocabulary.
Appropriately uses some scientific vocabulary.
Uses scientific vocabulary. Words may be used incorrectly.
No scientific vocabulary used.
Understanding Demonstrates a full understanding of changing states of matter applied to Boiling Point Lab.
Demonstrates a partial understanding of changing states of matter applied to Boiling Point Lab.
Slight understanding of changing states of matter applied to Boiling Point Lab is demonstrated.
Misunderstanding or no understanding of changing states of matter demonstrated.
Presentation Engages/interests audience.
Mostly engages /interests audience.
Somewhat engages/interests audience.
Audience not at all engaged or interested.
Group Participation
All group members participated. Group planning sheet completed fully.
Most group members participated. Group planning sheet completed mostly.
A few group members participated. Group planning sheet somewhat completed.
One group member did everything.. Group planning sheet not completed.
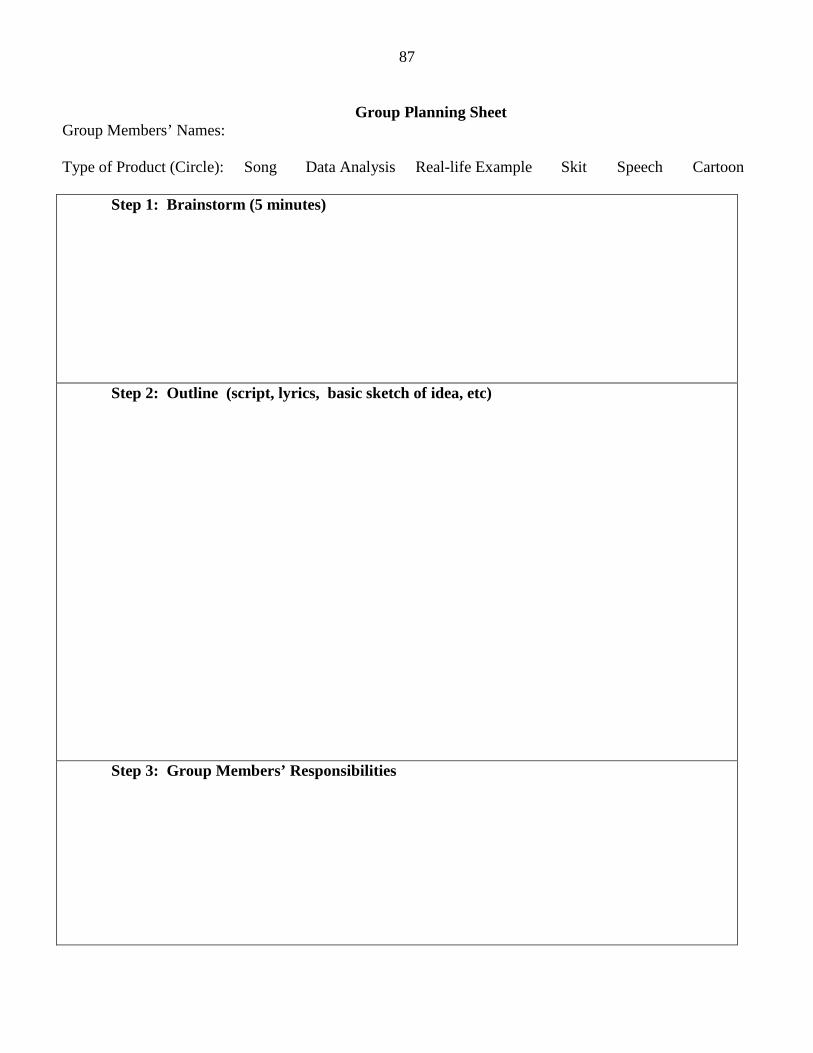
87
Group Planning Sheet
Group Members’ Names: Type of Product (Circle): Song Data Analysis Real-life Example Skit Speech Cartoon
Step 1: Brainstorm (5 minutes)
Step 2: Outline (script, lyrics, basic sketch of idea, etc)
Step 3: Group Members’ Responsibilities

88
APPENDIX I
TREATMENT UNIT 1: TIERED HOMEWORK ASSIGNMENET

89
Name: Date:
Some Like it Salty Questions HW3 Directions: Thinking about what you’ve learned from today’s “Some Like it Salty” Experiment, answer any 4 questions from the list below.
Level 1
1. Describe what happened at the end of today’s experiment. 2. Which of the following statements is true? A. The more salt you add to a beaker of water, the greater the water’s density becomes. B. The more salt you add to a beaker of water, the less the water’s density becomes. 3. What could have happened if a team started with 1000mL of water?
Level 2
4. How was this experiment similar to last week’s “Sink or Float” lab? How was it different? 5. Thinking about what you’ve learned from today’s experiment, what questions would you ask someone who was going scuba diving? 6. Do you know another instance where adding more mass affects the density of a substance?
Level 3
7. Can you create a new and unusual use for what you’ve learned? 8. What would happen if you used another liquid instead of water in this experiment? 9. Is there a better way of making the egg float instead of adding salt?

90
APPENDIX J
STUDENT WEEKLY JOURNAL PROMPTS

91
Student Weekly Journal Prompts
1) What was the major topic of today’s lesson? Explain what you learned about this topic. 2) Which activity or assignment from today’s lesson helped you understand the new information best? Briefly explain why. 3) What is one thing you want to know or don’t understand that relates to today’s topic? Briefly explain why.
92
APPENDIX K
PREUNIT AND POSTUNIT STUDENT INTERVIEW QUESTIONS

93
Nontreatment Pre and Postunit Student Interview Questions
1) Define density.
2) Given the following word bank terms, create a concept map that shows the relationships between the terms. Be
able to explain the reasoning behind the way you connect the terms. You may add extra terms to your map if you
would like.
density, matter, size, volume, mass, grams, milliliters, physical property, characteristic property, weight
3) Give an example of an experiment you could do to demonstrate density to a person who did not understand the
definition.
4) Whys is it important to learn about density?
5) What was the hardest part of the unit? Why?
6) What was the easiest part of the unit? Why?
7) What part of the unit did you find the most meaningful or enjoyable? Why?
8) Is there anything else you’d like to tell me? Is there a question you think I should have asked? If so, what is
the question and answer it please.
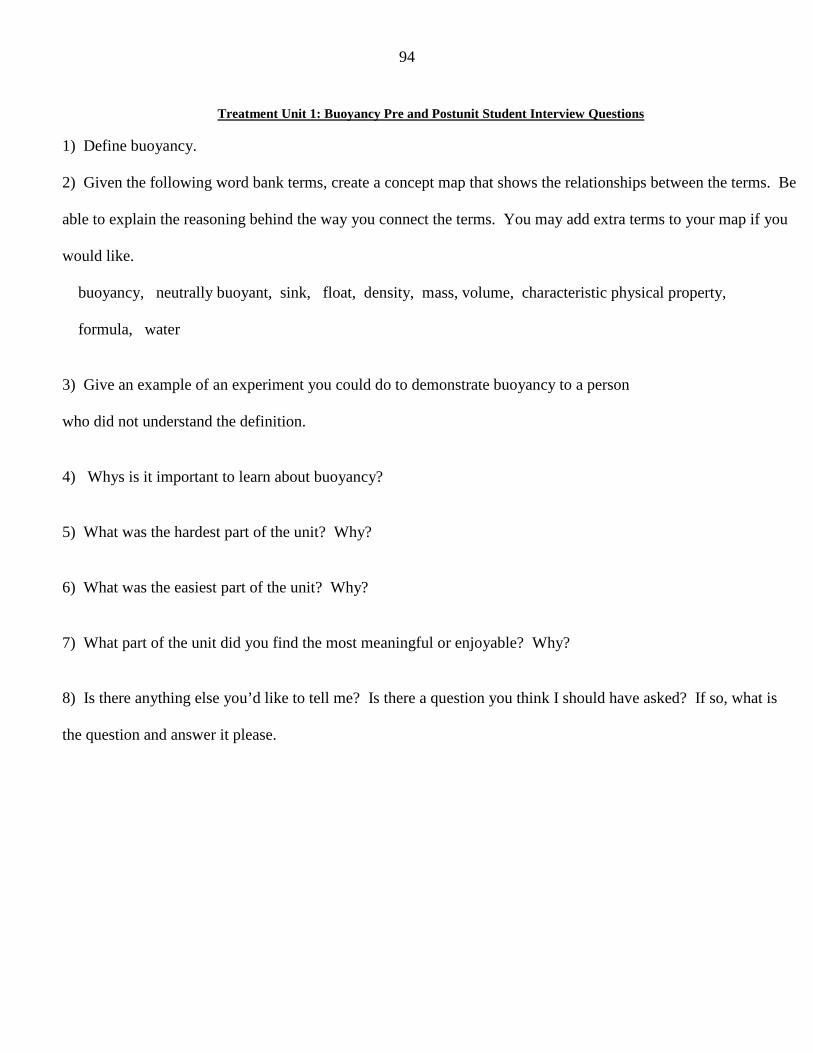
94
Treatment Unit 1: Buoyancy Pre and Postunit Student Interview Questions
1) Define buoyancy.
2) Given the following word bank terms, create a concept map that shows the relationships between the terms. Be
able to explain the reasoning behind the way you connect the terms. You may add extra terms to your map if you
would like.
buoyancy, neutrally buoyant, sink, float, density, mass, volume, characteristic physical property,
formula, water
3) Give an example of an experiment you could do to demonstrate buoyancy to a person
who did not understand the definition.
4) Whys is it important to learn about buoyancy?
5) What was the hardest part of the unit? Why?
6) What was the easiest part of the unit? Why?
7) What part of the unit did you find the most meaningful or enjoyable? Why?
8) Is there anything else you’d like to tell me? Is there a question you think I should have asked? If so, what is
the question and answer it please.

95
Treatment Unit 2: Boiling Point Pre and Postunit Student Interview Questions
1) Define boiling point.
2) Given the following word bank terms, create a concept map that shows the relationships between the terms. Be
able to explain the reasoning behind the way you connect the terms. You may add extra terms to your map if you
would like.
melting point, boiling point, state, solid, liquid, gas, characteristic physical property, evaporation, condensation,
freezing, melt, energy
3) Give an example of an experiment you could do to demonstrate boiling point to a person who did not
understand the definition.
4) Whys is it important to learn about boiling point?
5) What was the hardest part of the unit? Why?
6) What was the easiest part of the unit? Why?
7) What part of the unit did you find the most meaningful or enjoyable? Why?
8) Is there anything else you’d like to tell me? Is there a question you think I should have asked? If so, what is
the question and answer it please.
96
APPENDIX L
TEACHER ATTITUDE SURVEY

97
Teacher Attitude Survey
Survey Instructions: Read each statement carefully. Select a number from 1-5 to indicate the degree to which you agree or disagree with each statement below.
1 2 3 4 5 1. I felt fully prepared for today’s lesson. (Preparation Time)
2. Planning for today’s activities took a reasonable amount of time. (Preparation Time)
3. The students worked harder than I did today. (Teaching Methods)
4. My teaching methods were effective to help students learn new content. (Teaching Methods)
5. I was a sage on the stage. (Role)
6. I was a guide on the side. (Role)
7. Today’s instruction was enjoyable for me. (Attitude)
8. I would not have minded if an administrator or visitor had been present in my room today. (Attitude)
9. I will use the same or similar activities in future lessons as used today. (Motivation)
10. I would teach this lesson over again with minimal to no alterations. (Motivation)
National Science Foundation. (n.d.) OERL: Teacher education instruments. Retrieved from http://oerl.sri.com/instruments/te/teachsurv/instr49.html
1 Strongly disagree 2 Disagree 3 Uncertain 4 Agree 5 Strongly agree

98
APPENDIX M
TEACHER JOURNAL PROMPTS

99
Teacher Journal Prompts
1) (Preparation Time) Planning for today’s activities did/did not take a reasonable amount of time. Explain 2) (Teaching Methods) My teaching methods were/were not effective to help students learn new content. Explain. 3) (Role) One a scale of 1-10 (1= fully sage on the stage and 10= fully guide by your side) indicate my overall role in today’s lesson. Explain. 4) (Attitude) Today’s instruction was/was not enjoyable for me. Explain. 5) (Motivation) I would/would not teach this lesson over again with minimal to no alterations. Explain. 6. Are there any other things that come to mind today?

100
APPENDIX N
TEACHER PLANNING LOG
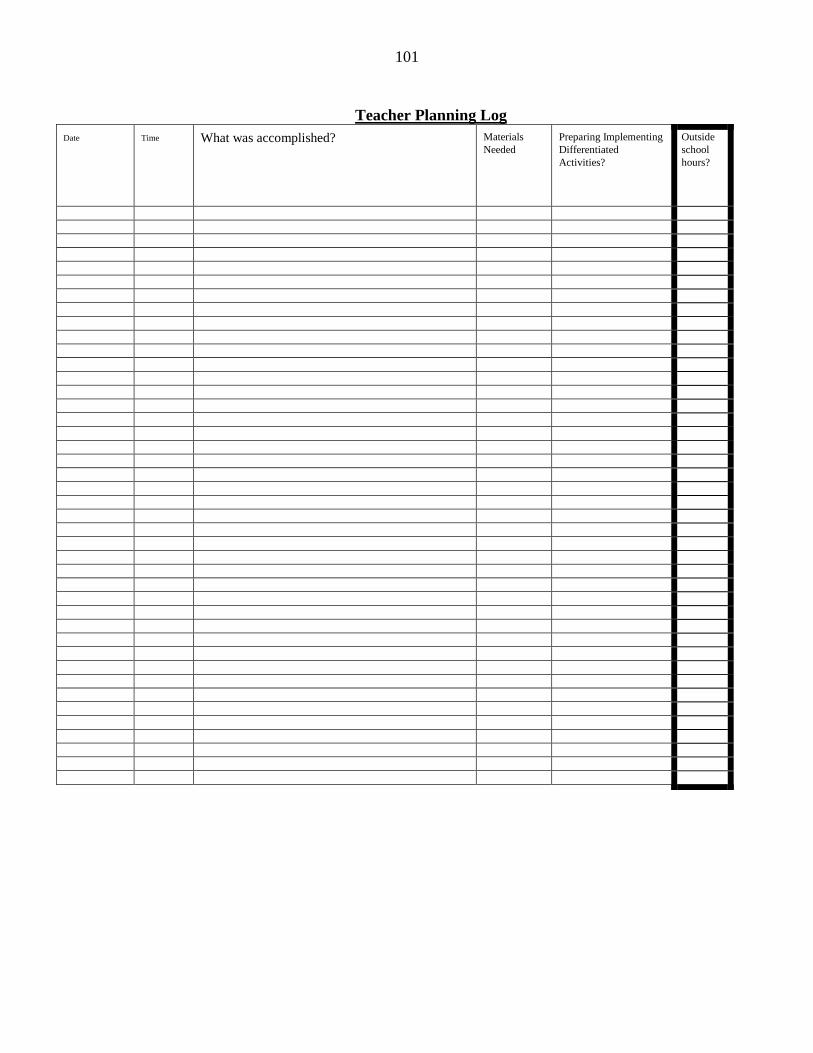
101
Teacher Planning Log
Date Time What was accomplished? Materials Needed
Preparing Implementing Differentiated Activities?
Outside school hours?

102
APPENDIX O
PROJECT TIMELINE
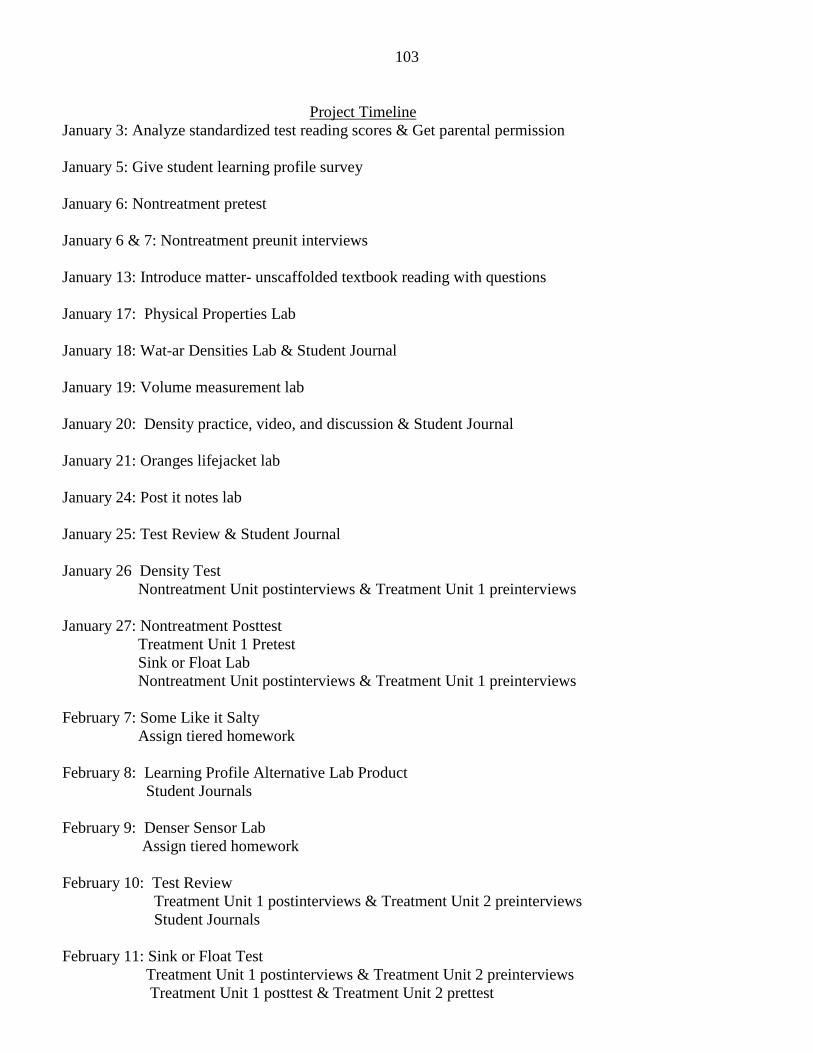
103
Project Timeline January 3: Analyze standardized test reading scores & Get parental permission January 5: Give student learning profile survey January 6: Nontreatment pretest January 6 & 7: Nontreatment preunit interviews January 13: Introduce matter- unscaffolded textbook reading with questions January 17: Physical Properties Lab January 18: Wat-ar Densities Lab & Student Journal January 19: Volume measurement lab January 20: Density practice, video, and discussion & Student Journal January 21: Oranges lifejacket lab January 24: Post it notes lab January 25: Test Review & Student Journal January 26 Density Test Nontreatment Unit postinterviews & Treatment Unit 1 preinterviews January 27: Nontreatment Posttest Treatment Unit 1 Pretest Sink or Float Lab Nontreatment Unit postinterviews & Treatment Unit 1 preinterviews February 7: Some Like it Salty Assign tiered homework February 8: Learning Profile Alternative Lab Product Student Journals February 9: Denser Sensor Lab Assign tiered homework February 10: Test Review Treatment Unit 1 postinterviews & Treatment Unit 2 preinterviews Student Journals February 11: Sink or Float Test Treatment Unit 1 postinterviews & Treatment Unit 2 preinterviews Treatment Unit 1 posttest & Treatment Unit 2 prettest
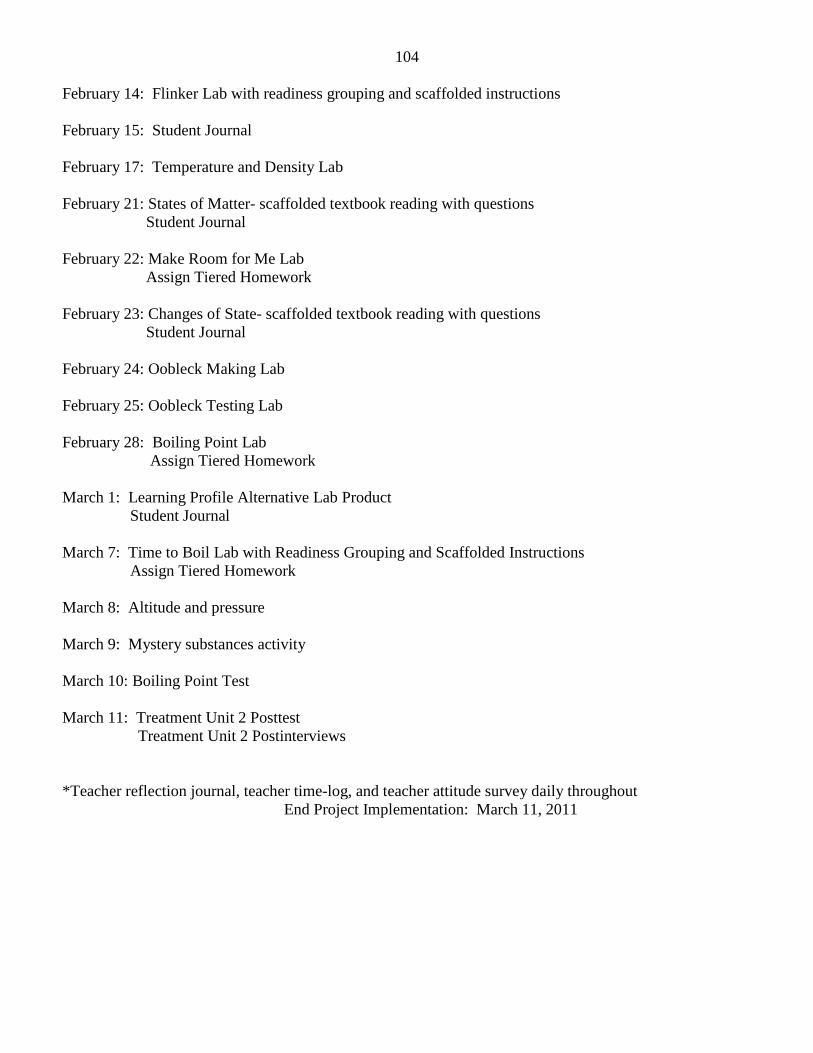
104
February 14: Flinker Lab with readiness grouping and scaffolded instructions February 15: Student Journal February 17: Temperature and Density Lab February 21: States of Matter- scaffolded textbook reading with questions Student Journal February 22: Make Room for Me Lab Assign Tiered Homework February 23: Changes of State- scaffolded textbook reading with questions Student Journal February 24: Oobleck Making Lab February 25: Oobleck Testing Lab February 28: Boiling Point Lab Assign Tiered Homework March 1: Learning Profile Alternative Lab Product Student Journal March 7: Time to Boil Lab with Readiness Grouping and Scaffolded Instructions Assign Tiered Homework March 8: Altitude and pressure March 9: Mystery substances activity March 10: Boiling Point Test March 11: Treatment Unit 2 Posttest Treatment Unit 2 Postinterviews *Teacher reflection journal, teacher time-log, and teacher attitude survey daily throughout
End Project Implementation: March 11, 2011