the effects of dilution and mixed layer depth on deliberate ocean … › ~jkmoore › papers ›...
TRANSCRIPT

Author's personal copy
The effects of dilution and mixed layer depth on deliberate oceaniron fertilization: 1-D simulations of the southern
ocean iron experiment (SOFeX)
Aparna Krishnamurthy a,⁎, J. Keith Moore a, Scott C. Doney b
a Earth System Science Department, University of California, Irvine, CA 92697, USAb Department of Marine Chemistry and Geochemistry, Woods Hole Oceanographic Institution, Woods Hole, MA 02543, USA
Received 14 December 2006; received in revised form 6 July 2007; accepted 12 July 2007Available online 26 July 2007
Abstract
To better understand the role of iron in driving marine ecosystems, the Southern Ocean Iron Experiment (SOFeX) fertilized twosurface water patches with iron north and south of the Antarctic Polar Front Zone (APFZ). Using 1-D coupled biological–physicalsimulations, we examine the biogeochemical dynamics that occurred both inside and outside of the fertilized patches during andshortly after the SOFeX field campaign. We focus, in particular, on three main issues governing the biological response todeliberate iron fertilization: the interaction among phytoplankton, light, macronutrient and iron limitation; dilution and lateralmixing between the fertilized patch and external, unfertilized waters; and the effect of varying mixed layer depth on the light field.At the patch south of the APFZ, sensitivity simulations with no dilution results in the maximum bloom magnitude, whereas dilutionwith external water extends the development of the north patch bloom by relieving silicon limitation. In model sensitivity studiesfor both sites, maximum chlorophyll concentration and dissolved inorganic carbon depletion inside the fertilized patches areinversely related to mixed layer depth, similar to the patterns observed across a number of iron fertilization field experiments. Ourresults suggest that Southern Ocean phytoplankton blooms resulting from natural or deliberate iron fertilization will tend to becomeiron-light co-limited unless the mixed layer depth is quite shallow.© 2007 Elsevier B.V. All rights reserved.
Keywords: SOFeX; Southern Ocean; HNLC; Marine ecosystem model; Nutrient limitation; Light limitation; Mixed layer depth; Phytoplanktoncommunity; Iron fertilization
1. Introduction
Southern Ocean surface waters contain high levels ofmacronutrients but relativelymodest levels of chlorophyll,in most regions. Theories postulated to explain these highnutrient, low chlorophyll (HNLC) waters include deepmixing along with light limitation (Mitchell et al., 1991;
Nelson and Smith, 1991), plankton community structureand strong grazing pressure (Brown and Landry, 2001),and iron limitation (Martin, 1990).Multiple factors impactthe seasonal cycle of phytoplankton growth in these re-gions (Boyd et al., 1999; Abbott et al., 2000; Fennel et al.,2003; Smith and Lancelot, 2004), with light limitationdominating during early spring followed by iron limitationafter the onset of water column stratification. During aus-tral summer diatom growth may become silicon limited,particularly in subantarctic waters. Deep mixed layers can
Available online at www.sciencedirect.com
Journal of Marine Systems 71 (2008) 112–130www.elsevier.com/locate/jmarsys
⁎ Corresponding author. Tel.: +1 949 824 2314; fax: +1 949 824 3874.E-mail address: [email protected] (A. Krishnamurthy).
0924-7963/$ - see front matter © 2007 Elsevier B.V. All rights reserved.doi:10.1016/j.jmarsys.2007.07.002

Author's personal copy
also result in co-limitation by iron and light, as the phyto-plankton cellular requirement for iron increases under lightstress (Sunda and Huntsman, 1997; Boyd, 2002).
Among the factors mentioned above, it is now wellestablished that in HNLC areas the limitation of micro-nutrient iron largely prevents the full consumption ofmacronutrients by phytoplankton. This has been dem-onstrated for Southern Ocean HNLC waters in severalmesoscale iron fertilization experiments, where artificialadditions of iron resulted in increased chlorophyll, pri-mary productivity and phytoplankton biomass (Boydet al., 2000; Smetacek 2001; Coale et al., 2004).
The Southern Ocean Iron Experiment (SOFeX) wasconducted during austral summer of 2002 in the Pacificsector of the Southern Ocean (Coale et al., 2004). Itinvolved fertilizing two patches, one north of the AntarcticPolar Front Zone (APFZ) characterized in austral spring bylow-silicate, high nitrate waters (North Patch) and onesouth of the APFZ characterized by high-silicate, high-nitrate waters (South Patch). These two regions were se-lected such that the hydrography, nutrients and the bio-geochemical provinces could represent larger areas of theSouthernOcean.Apart from testing the iron hypothesis, theexperiment was also intended to test whether low silicate(Si(OH)4) conditions north of the APFZ would diminishthe fertilization response because of diatom Si limitation.
The North Patch was created on 12th January, 2002 at56.23° S, 172° W, and the South Patch was created on24th January, 2002 at 66.45° S, 171.8°W. Successive ironadditions were done by injecting acidified iron sulfate intothe ship's wake such that mixed layer iron concentrationswere raised to 1.2 nM, 1.2 nM, 1.5 nM at the North Patch,and four additions were done at the South Patch such thatiron concentrations were 0.7 nM after each addition.Sulfur hexafluoride (SF6) was added along with ironduring the first infusion to track the patches. The enrichedpatches were studied by three research vessels, R/VRevelle, R/V Melville and R/V Polar Star for a period of40 and 28 days for the north and south sites, respectively(supplemental material, Coale et al., 2004). Particulateorganic carbon (POC), temperature and salinity in theupper 1000 m were measured using three free-profilingLagrangian Carbon Explorers at 55° S and one at 66° Sdeployed from the R/V Revelle (Bishop et al., 2004).These Explorers also estimated carbon export at 100 musing an optically derived carbon flux index.
Satellite remote sensing indicates that the unfertilizedwaters in the region of the SOFeX South Patch sometimesexhibit a natural seasonal chlorophyll bloom, whilenatural blooms are absent for the North Patch region(Moore and Doney, 2006). During the period of SOFeX,background surface chlorophyll levels at the South Patch
were low compared to climatological conditions at thatsite and to nearby locations to the east and west of thestudy location. Moore and Doney (2006) hypothesize thatthese differences could have arisen from variable ironsupply from melting sea ice and icebergs along withincreased stratification at the southern site. Their studyconcluded that there was a delay in the melting of sea-iceduring the growing season of 2001–2002 compared toother years. This led to a delay in the naturally occurringmodest spring bloom from December to January–February in this region.
Our purpose here is to examine, using 1-D coupledbiological–physical numerical simulations, the biogeo-chemical dynamics that occurred both inside and outsideof the fertilized patches during and shortly after theSOFeX field campaign. We focus, in particular, on threemain issues governing the biological response to ironfertilization: the interaction among phytoplankton, light,macronutrient and iron limitation; the effects of dilutionand lateral mixing between the fertilized and unfertilizedwaters; and variations in mixed layer depth and mixedlayer light field.
Like all deliberate ocean fertilization studies, theSOFeX fertilized patches were finite in horizontal extentand underwent lateral mixing with the surrounding un-fertilized waters. The North Patch was located at thesubantarctic frontal zone, a region of fronts that elon-gated the patch from a square into a long, thin filament(∼7 km×340 km) by day 38. The South Patch extendedmore slowly in all directions (Coale et al., 2004; Mooreand Doney, 2006). Dilution rates can be estimated intwo ways. One is to find the amount of physical strain oftracer filament when the patch stretches. During theSouthern Ocean iron release experiment (SOIREE), forexample, the dispersal of the tracer due to dilution wasestimated by locally resolving the tracer flow into purestrain and rotation (Abraham et al., 2000). The extent ofthis stretching can be obtained also from satellite oceancolor observations. During the SOFeX, a dilution rate of0.11 per day at the North Patch and 0.086 per day at theSouth Patch was obtained using this technique (Coaleet al., 2004). A second way is to estimate dilution ratesby calculating the loss of SF6, accounting for out-gassing. Dilution rate estimates during the SOFeX usingthis method were 0.1 per day at the North Patch and 0.03to 0.07 per day at the South Patch (Coale et al., 2004).There was a variation in SF6 derived estimates becauseof inhomonogeneities within the patch and analyticalvariability. Coale et al. (2004) used dilution rates 0.08per day for South Patch and 0.11 per day for North Patchas a best estimate. We adopted these values of dilution inour baseline simulations.
113A. Krishnamurthy et al. / Journal of Marine Systems 71 (2008) 112–130

Author's personal copy
Lateral mixing brings macronutrients into the fertilizedwaters as well as diluting the products of the bloom (Boydet al., 2000; Abraham et al., 2000). For our model simul-ations, a constant dilution rate was applied at each SOFeXsite. Through a suite of sensitivity experiments where weadjust dilution from zero to a reasonable upper bound, wefind that mixing due to dilution was particularly importantat the low-silicate North Patch where the supply of Si(OH)4 rich waters into the fertilized patch (Hiscock andMillero, 2005) relieves Si limitation and extends thebloom.
The biological response to iron fertilization is alsomodulated by mixed layer depth (MLD), a proxy for theaverage light level for phytoplankton growth in the surfacelayer. In the Southern Ocean, shallow MLDs and theassociated elevated light levels most favorable forphytoplankton growth occur during the austral summermonths (Campbell and Aarup, 1989). During this period,mixed layer depth is sensitive to wind driven verticalmixing. In order to qualitatively access the role of changinglight levels on nutrient uptake, biological production andexport, we conducted a second suite of sensitivity ex-periments varying wind forcing and thus MLD.
The remainder of the paper is constructed as follows. InSection 2,we describe the coupled 1-Dbiological–physicalsimulations using the KPP model (Large et al., 1994) andthe marine ecosystem model of Moore et al. (2002, 2004)used to simulate biogeochemical dynamics inside andoutside the fertilized surface water patches at both SOFeXsites. In Section 3.1, we evaluate the 1-D simulations bycomparing model estimates of primary production, nutri-ents, chlorophyll, POC and its export, biogenic silica, andsilicification rate with those obtained during the experi-ment. We also discuss how nutrient and light-limitationmodulates the growth of various phytoplankton groups inthe simulations. Sensitivity experiments on lateral dilution(Section 3.2) and mixed layer depth (Section 3.3) providequalitative estimates of the effects of these physicaldynamics on biological response during deliberate ironfertilization in the Southern Ocean region, with implica-tions for the natural system as well. Carbon and iron bud-gets (Section 3.4) during the 60-day simulations provide asummary of organic carbon and iron partitioned among thevarious pools. The paper concludes with a summary anddiscussion section (Section 4).
2. Methods
2.1. Biogeochemical elemental cycling model
We used a one-dimensional implementation of themarine Biogeochemical Elemental Cycling model (here-
after called BEC), described in Moore et al. (2004). The1-D column model has 150, 1 m thick horizontal levelsthat include the euphotic zone and shallow aphotic zones.The model includes phytoplankton growth limitation bymultiple nutrients (N, P, Fe, and Si) and multiplephytoplankton classes (pico/nano-plankton, diatoms, dia-zotrophs, and coccolithophores). Depending upon nutri-ent availability and physical forcing, the model is robustenough to shift the phytoplankton community structurefrom diatoms, with high production rates and high export,to a small phytoplankton dominated, low-production,low-export system.
Diatoms and small phytoplankton (representing thenano and pico-sized species) are included in the model.Diazotrophs have been modeled based on information onTrichodesmium spp. (Moore et al., 2002). Biomass ofdiazotrophs was always negligible in the simulations forthis region and they are not discussed further here.Coccolithophores are parameterized as a function of smallphytoplankton production, and their biomass changes as afunction of nutrient limitation, temperature and bloomconditions with a constraint that calcification rate notexceed a maximum of 40% of the small phytoplanktongroup primary production. Photoadaptation is calculatedas a variable phytoplankton ratio of chlorophyll to ni-trogen based on Geider et al. (1998). Phytoplanktongrowth is parameterized to include balanced growth andmultiple potentially limiting nutrients. Growth rate can belimited by nitrogen (nitrate, ammonia), phosphorus, iron,silicon (for diatoms), and/or ambient light. As the lightand nutrient levels change, the model incorporates var-iable elemental ratios for C/Fe, C/Si, and C/Chlorophyll.The losses of the four phytoplankton groups occurs viarespiration/natural mortality, zooplankton grazing andphytoplankton aggregation. Detailed description of themodel is available in Moore et al., (2002, 2004).
2.2. Model implementation
Surface forcing values including wind stress, atmo-spheric pressure, and net heat and fresh water fluxes wereobtained fromNCEP reanalysis data (Kalnay et al., 1996),and daily mean surface photosynthetically available ra-diation (PAR) data was obtained from SeaWiFS (McClainet al., 1998, 2004). PAR within each layer was calculatedusing an attenuation coefficient, kPAR=0.03 (m−1 (mgChl)−1 m3)⁎Chl+0.04 m−1). Climatological dust/irondeposition from atmosphere was obtained from Luo et al.(2003). The model was run at each site without fer-tilization to define the “out of patch” temporal history. Forthe fertilized patch cases, these results were used tosimulate dilution from surrounding waters using the Coale
114 A. Krishnamurthy et al. / Journal of Marine Systems 71 (2008) 112–130

Author's personal copy
et al. (2004) estimates of dilution of 0.08 per day at theSouth Patch and 0.11 per day at the North Patch. Thishorizontal dilution of in patch and out of patch waters wasapplied daily at all depths. This is a necessary simplifi-cation of the complex 3D circulation and mixing thatoccurred in situ. It is meant only to capture to 1st order theeffects of lateral patch dilution. Surface boundary layerdynamics were simulated by using the non-local turbulentmixing scheme described by Large et al. (1994). Thisutilizedwind stress, net heat flux, and net freshwater inputto predict the development of surface boundary layer andvertical profiles of temperature, salinity and otherbiological scalars (Doney, 1996).
Meanmixed layer depths were 35m and∼40m at theNorth Patch in the model and observations, respectively,and 32 m and 35–40 m at the South Patch in the modeland observations, respectively. On a few days in oursimulations, the mixed layer shoaled, reducing the meanmixed layer depth values; otherwise simulated valueswere close to observed values. NCEP wind speeds at theSouth Patch were reduced by 15% in the baseline si-mulation to better match the observed mixed layer depth.
Total small phytoplankton, diatom, diazotroph andzooplankton biomass at both patches were set to valuesobtained after an initial (unfertilized) spin-up simulation.Surface nitrate, phosphate, and silicate concentrationswere set similar to those prior to the fertilization ex-periment at both the North and South Patches. The ob-servational dissolved iron data for outside the fertilizedpatches were limited and also as low as 0.06 nM (KennethCoale per. communications), significantly lower than thebiological half-saturation coefficients used in the ecosys-tem model. Thus, they were not sufficient in initial si-mulations for the model to reproduce the unfertilizedpatch conditions. Rather than adjust the model coeffi-cients, we set the initial iron profiles at the South Patch to auniform value of 0.15 nM to a depth of 50 m increasinglinearly to 0.3 nM at 150 m and at the North Patch from0.1 nM to a depth of 50 m increasing linearly to 0.2 nM at150 m. These values were obtained for this region fromthe global simulations of the model (Moore et al., 2004).
Model outputs of nutrients, chlorophyll, POC and C/Chl ratios were averaged over the upper 20 m at bothpatches and were compared with mixed layer observa-tions from SOFeX. Integrated values of biogenic silicawere obtained for the upper 50 m of the water column,and sinking POC export was calculated at 50 m. Primaryproduction and silicification were integrated over theentire 150 m of water column. These were comparedwith experimental observations at corresponding depths.
Sensitivity studies were performed at both the Northand South Patches to estimate the effect of varying
dilution rates and mixed layer depths. Scenarios weresimulated with no dilution, and 0.5 and 1.5 times theCoale et al. (2004) estimates. Using these dilution rates,lateral dilution of all biogeochemical tracers betweenfertilized and unfertilized simulations was computeddaily over all depths in our 150 m domain. Mixed layerdepth sensitivity simulations were conducted by varyingthe baseline adjusted NCEP wind forcing by factors of0.7, 1.3 and 1.6. The simulations with modified mixedlayer depths and dilution rates had the same initialbiogeochemical profiles as the standard simulations.
2.3. Ecosystem parameter changes
The ecosystem model parameters used byMoore et al.(2004) were optimized for the global domain. It is notsurprising, then, that application to a particular regionmayrequire some parameter adjustments. Parameters weremodified so that the simulations provided a better matchto the data for the South Patch, where field observationsprovided better constraints; this modified parameter setwas used for both patches. The original Moore et al.(2004) parameter set resulted in a South Patch diatombloom that was much smaller than the observed bloom.Several parameters were tuned to better simulate theobservations. The maximum zooplankton grazing ratewhen feeding on diatoms was decreased from 2.07 to 1.7per day. The coefficient used in the quadratic terms inaggregation mortality for small phytoplankton anddiatomswas also lowered from0.009 to 0.006 (decreasingaggregation losses). The half saturation constant (Ks) forsilica uptake at the North Patch was estimated at 0.63 μMby Brzezinski et al. (2005) during the SOFeX. Wechanged from our standard value of 1.0 μM to 0.63 μM
Fig. 1. Geographical map of the region where the SOFeX fertilizationsoccurred (white dots) over a map of mean chlorophyll concentrationfor January 2001 from the SeaWiFS sensor.
115A. Krishnamurthy et al. / Journal of Marine Systems 71 (2008) 112–130

Author's personal copy
only for North Patch (silicate concentrations were alwayshigh and non-limiting at the South Patch).
The initial slope of the irradiance vs. productioncurve, α (mmol C m2/mg Chl W day), was reduced from0.3 to 0.25 at both patches. This value is close to thatobserved during SOFeX (0.12 and 0.22) in theunfertilized and fertilized surface waters respectively(Hiscock, 2004). The mean value of α obtained fromother cruises in the Southern Ocean region were 0.23(Dehairs et al., 2000), 0.19 (Gervais et al., 2002), 0.2(Helbling et al., 1995), and 0.21 (Hiscock, 2004). Themaximum cellular chlorophyll to nitrogen ratios weremodified from 2.3 and 3.0, to 2.25 and 4.5 mg Chl/mmol N for small phytoplankton and diatoms, respec-tively. These changes brought the model into better
agreement with the culture observations of Geider et al.(1998) for diatom vs. non-diatoms, giving the diatomsan enhanced ability to adapt to low light levels.
The temperature dependent growth rate factor, q10,was reduced from a doubling to a multiple of 1.65 and1.75 for every 10° C rise of temperature at the South andNorth Patch respectively. This improved the timing of theblooms, but it does not necessarily mean that the modifiedq10 value applies to this region as the temperature range ofeach simulation is too small to evaluate q10 robustly; asimilar effect would have resulted from increasing themodel maximum growth and grazing rates at the referencetemperature.
The partitioning of organic carbon into sinking POCexport and DOC were modified such that the simulated
Fig. 2. Results obtained from simulations for the South Patch. The simulated results of unfertilized waters and iron fertilized patch are depicted bylight and dark lines, respectively. The experimental observations from SOFeX for outside and inside the iron fertilized patch are depicted by asterisksand triangles, respectively.
116 A. Krishnamurthy et al. / Journal of Marine Systems 71 (2008) 112–130

Author's personal copy
export of sinking POC was closer to observationalestimates during the SOFeX. This change decreased thefraction of grazed material going to sinking POM andincreased the fraction going to DOM by 50% for boththe diatom and small phytoplankton groups.
3. Results
3.1. Model-data comparisons
Model simulations for North Patch started on January7th, 2002 and ended 60 days later on March 7th, 2002.The geographical location (in white dots) where thesimulations were performed is shown in Fig. 1. Note thelow (b0.2 mg/m3) ambient chlorophyll concentrations
in the region. The last field observations at the NorthPatch were made on February 22nd, 2002. The SouthPatch simulations started on January 21st, 2002 andended 60 days later on March 21st, 2002. The last fieldobservations at the South Patch were made on February21st, 2002. In our series of model-data time series plots,the thin line represents simulated unfertilized, outsidepatch conditions and the thick line represents fertilized,inside patch simulations. The asterisk and trianglerepresent the unfertilized and fertilized patch observa-tions, respectively.
The temporal trends in nutrient drawdown at theSouth Patch compared well with the observationsreported by Hiscock and Millero (2005) (Fig. 2). Notethe strong drawdown and export of silicic acid in the
Fig. 3. Results obtained from simulations for the North Patch. The simulated results of unfertilized waters and iron fertilized patch are depicted bylight and dark lines, respectively. The experimental observations from SOFeX for outside and inside the iron fertilized patch are depicted by asterisksand triangles, respectively.
117A. Krishnamurthy et al. / Journal of Marine Systems 71 (2008) 112–130
Author's personal copy
simulations following the end of the field campaign.Seasonal diatom blooms are characteristic for this regionof the Southern Ocean, with preferential drawdown and
export of Si accounting for the observed high nitrate,low silicic acid conditions at the North Patch. At theunfertilized surface waters (thin line), simulated chlo-rophyll and total POC are underestimated whereasprimary productivity is within the range of the obser-vational dataset. Simulated values of chlorophyll andprimary productivity inside the fertilized patch corre-spond well with the high-end observations (those closerto the patch center, Fig. 2). Peak values of simulatedtotal POC are somewhat overestimated (Coale et al.,2004; POC data from Mark Altabet (UM, Dartmouth) &Craig Hunter (MLML), and primary productivity fromLance et al., 2007).
At the North Patch, simulated phosphate, nitrate andsilicate in the fertilized surface waters were lower than theobservations (Hiscock and Millero, 2005) (Fig. 3). Theobservational data for the macronutrient concentrationsshow very little variability at both unfertilized andfertilized surface waters suggesting dominance of nutriententrainment from ambient waters. Model predictions ofchlorophyll and total POCwere in general agreement with
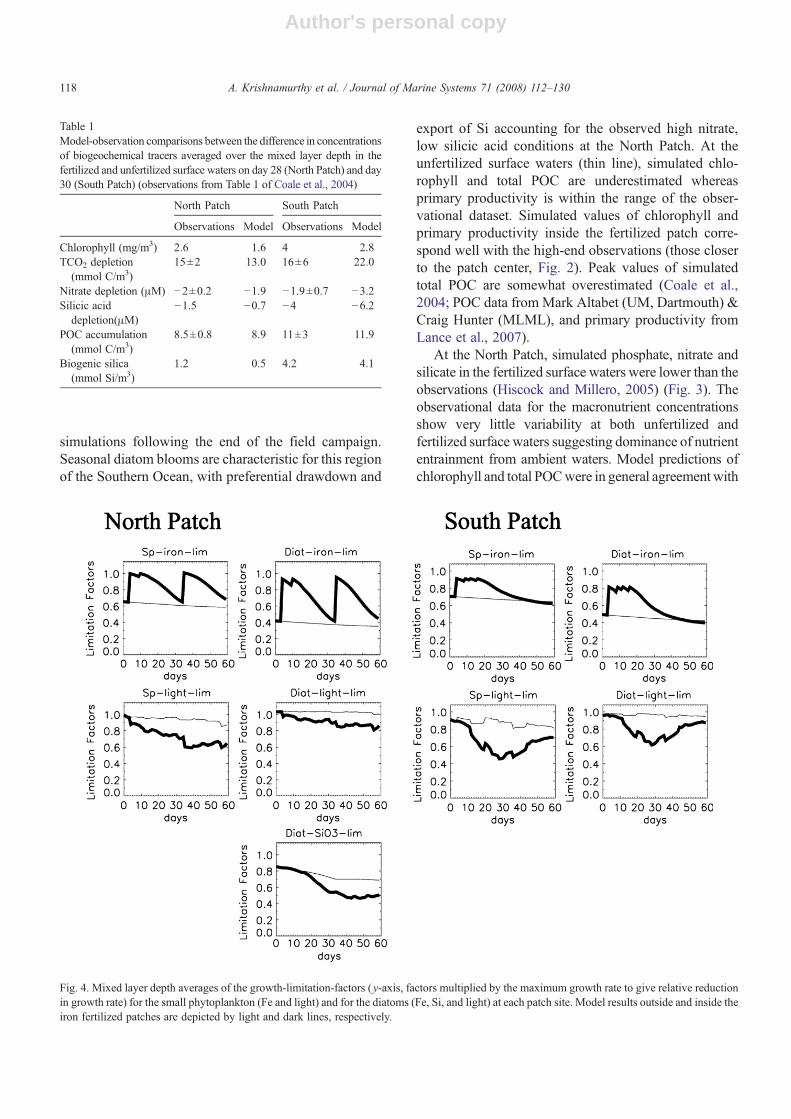
Fig. 4. Mixed layer depth averages of the growth-limitation-factors (y-axis, factors multiplied by the maximum growth rate to give relative reductionin growth rate) for the small phytoplankton (Fe and light) and for the diatoms (Fe, Si, and light) at each patch site. Model results outside and inside theiron fertilized patches are depicted by light and dark lines, respectively.
Table 1Model-observation comparisons between the difference in concentrationsof biogeochemical tracers averaged over the mixed layer depth in thefertilized and unfertilized surface waters on day 28 (North Patch) and day30 (South Patch) (observations from Table 1 of Coale et al., 2004)
North Patch South Patch
Observations Model Observations Model
Chlorophyll (mg/m3) 2.6 1.6 4 2.8TCO2 depletion(mmol C/m3)
15±2 13.0 16±6 22.0
Nitrate depletion (μM) −2±0.2 −1.9 −1.9±0.7 −3.2Silicic aciddepletion(μM)
−1.5 −0.7 −4 −6.2
POC accumulation(mmol C/m3)
8.5±0.8 8.9 11±3 11.9
Biogenic silica(mmol Si/m3)
1.2 0.5 4.2 4.1
118 A. Krishnamurthy et al. / Journal of Marine Systems 71 (2008) 112–130

Author's personal copy
the observations in the unfertilized simulation (Coaleet al., 2004; POC data from Altabet & Hunter). Simulatedchlorophyll and total POC in the fertilized patch alsocorrespond well with the observed maximum values.The observed maximum integrated primary productivityover the euphotic zone compares well with that obtainedfrom simulations for both the control and fertilizedpatches (Lance et al., 2007), though the model bloomdevelops somewhat earlier than that in the data for thefertilized case.
The South Patch POC export was measured at 25 m,50 m and 100 m with thorium isotopes; it increased from2–5 mmol C/m2/day in unfertilized waters to 2–11 mmol C/m2/day in the fertilized patch (Buesseler
et al., 2005). Our simulation overestimates sinking POCexport inside the South Patch compared to these ob-servations (Fig. 2). The North Patch sinking POC exportin the fertilized waters was estimated bio-optically fromprofiling floats as described in Bishop et al. (2004).Using two indirect POC flux measurement techniques,they obtained values of 20 to 190 mmol C/m2 and 760 to1170 mmol C/m2 between days 39 and 55 of theexperiment. This wide range brackets our simulation atthe North Patch.
During the SOFeX, biogenic silica and silicaproduction rates were estimated by Brzezinski et al.(2005). At the South Patch, the model lags the observedrise in silica production in the fertilized case by about a
Fig. 5. Results obtained from simulations for the iron fertilized South Patch with varying dilution rates. Solid lines with increasing thickness depict thesimulations with no dilution, 0.5⁎Coale et al. (2004) dilution, Coale et al. (2004) dilution, and 1.5⁎Coale et al. (2004) dilution, respectively. Dashedline depicts the simulated unfertilized surface waters.
119A. Krishnamurthy et al. / Journal of Marine Systems 71 (2008) 112–130

Author's personal copy
week (Fig. 2). Silica production at the North Patch didnot compare well with the limited observations. At theSouth Patch, the simulated biogenic silica values arewithin the maximum observational estimates of biogenicsilica (for bday 30). After this period, there are noobservational estimates for making comparisons. At theNorth Patch, the simulated diatom bloom occurs tooearly; elevated rates and build-up of biogenic silica in theobservations only appear after day 30 following the thirdiron injection (Fig. 3). Brzezinski et al. (2005) stated thatthe biogenic silica values obtained from the samplingregions were diluted by surrounding waters. Thisresulted in the lowering of biogenic silica at the Southand North Patches.
The South Patch bloom was terminated in oursimulation when iron returned to background levelsshortly after the field campaign ended. At the NorthPatch chlorophyll and POC remain elevated throughoutour simulations, at somewhat higher than observedconcentrations. As the bloom developed the simulateddiatom carbon to chlorophyll ratios decreased at boththe patches because when the diatoms become lightstressed they synthesize more chlorophyll per unitcarbon (Figs. 2 and 3). This light stress was alwaysstronger for the inside patch simulations compared tothat at the outside patch simulations, due to self-shadingby the bloom. The integrated DOC production at bothpatches was also estimated from simulations, but field
Fig. 6. Results obtained from simulations for the iron fertilized North Patch with varying dilution rates. Solid lines with increasing thickness depict thesimulations with no dilution, 0.5⁎Coale et al. (2004) dilution, Coale et al. (2004) dilution, and 1.5⁎Coale et al. (2004) dilution, respectively. Dashedline depicts the simulated unfertilized surface waters.
120 A. Krishnamurthy et al. / Journal of Marine Systems 71 (2008) 112–130

Author's personal copy
observations for DOC were unavailable for comparison.The difference in observed dissolved inorganic carbon(DIC) concentrations between the inside and outside
patches was 15±2 mmol C/m3 on day 28 and 16±6 mmol C/m3 on day 30 at the North and South Patchrespectively (Table 1, Coale et al., 2004). These compared
Table 2Simulated depth integrated (0–150 m) carbon budgets for outside and inside the iron fertilized South Patch as well as for the iron fertilized dilutionand wind speed/mixed layer sensitivity experiments. Column 2 and 3 give the mean MLD (m) and the associated wind speeds (m/s)
South Patch MeanMLD
Windspeed
Primaryprod
DOC POCprod
Lossterms
SinkingPOC
Exp1 Exp 2 TotalPOC
Outside patch 33 10 1990 671 262 1214 119 0.07 0.08 167No dilution 33 10 7761 1363 3337 2790 1212 0.16 0.15 595In/Coale et al. (2004) dilution 33 10 5614 1115 1310 2150 516 0.10 0.12 3090.5⁎Coale et al., 2004 dilution 33 10 6609 1226 2111 2441 800 0.13 0.14 4361.5⁎Coale et al. (2004) dilution 33 10 4549 1010 775 1879 317 0.07 0.11 189Wind speed⁎0.7(out) 19 7 1992 670 263 1217 157 0.11 0.13 167Wind speed⁎1.3(out) 48 13 1916 651 250 1175 151 0.11 0.13 165Wind speed⁎1.6(out) 70 16 1831 626 234 1129 144 0.10 0.12 167Wind speed⁎0.7(in) 19 7 5641 1067 1563 2070 802 0.22 0.32 268Wind speed⁎1.3(in) 48 13 4624 1081 798 2013 436 0.13 0.16 234Wind speed⁎1.6(in) 70 16 3072 895 397 1591 231 0.09 0.13 172
Columns 4, 5, 6, 7 and 8 give the cumulative (day 0–60) depth integrated primary production, semi-labile DOC production, net POC production,phytoplanktonmortality and grazing loss and the net sinkingPOC export at the depth of 150m (all inmmol C/m2). Columns 9 and 10 summarize themeanexport ratios calculated at 50m (Sinking POC export /primary production) for days 1 to 30 and from days 31 to 60 of the simulations respectively. Column11 gives the total water column POC inventory (mmol C/m2) on the last day (60th day) of the simulations.
Fig. 7. Mixed layer depth averages of the growth-limitation-factors (y-axis, factors multiplied by the maximum growth rate to give relative reductionin growth rate) for the small phytoplankton (Fe and light) and for the diatoms (Fe, Si, and light) at each patch site. Lines with increasing thicknessdepict the simulations with no dilution, 0.5⁎Coale et al. (2004) dilution, Coale et al. (2004) dilution, and 1.5⁎Coale et al. (2004) dilution,respectively. Dashed line depicts the simulated unfertilized surface waters.
121A. Krishnamurthy et al. / Journal of Marine Systems 71 (2008) 112–130

Author's personal copy
well with those obtained in our simulations (11 mmolC/m3 and 23 mmol C/m3 at the North and South Patch,respectively). This implies that our model partitions toomuch of the net community production into sinkingparticle export and not enough carbon into the semi-labile DOC pool. Comparisons between observationson day 28 (North Patch) and day 30 (South Patch) withthose obtained from same days of simulations (Table 1)were also reasonable except for the silica drawdownand biogenic silica accumulation at the simulatedNorth Patch. The simulated TCO2 values in the tablewere obtained by calculating the mean depletion(difference between unfertilized and fertilized waters)over the mixed layer depth.
Model phytoplankton growth rates depend on am-bient temperature. A temperature function is used to
modify the growth rates. These “temperature-specific”maximum growth rates are then multiplied by the lightand nutrient limitation terms (Moore et al., 2002). Themost limiting nutrient is determined from the nutrientwith the lowest concentration relative to the uptake half-saturation constant. Small phytoplankton growth can belimited by N, P, Fe and light and diatom growth by N, P,Fe, Si and light. The light and nutrient terms aremultiplicative allowing for co-limitation (Moore et al.,2002, 2004).
At both sites, simulated diatom and small phyto-plankton growth were iron-limited for the unfertilizedcontrol throughout the simulations (Fig. 4). In the fer-tilized patches at both sites, the iron infusions initiallyrelieved iron stress; as the blooms progressed, both smallphytoplankton and diatoms reverted to iron-stressed
Fig. 8. Results obtained from simulations for the iron fertilized South Patch with varying wind speeds and mixed layer depths (Table 2, column 2).Lines with increasing thickness depict the simulated runs with NCEP wind forcing multiplied by 0.7, 1, 1.3 and 1.6.
122 A. Krishnamurthy et al. / Journal of Marine Systems 71 (2008) 112–130

Author's personal copy
conditions. At the North Patch (Fig. 4) diatoms were ironand silicon limited to about the same degree close to theend of the simulations. The observations indicate amixed community of several species (N5μmdiameter) atthe North Patch (Buesseler et al., 2005), whereas in themodel, diatoms dominated the bloom, leading tostronger depletion of silica and macronutrients than inthe observations. In our simulations, light limitation inunfertilized waters was minimal at both sites such thatlight limitation reduced maximum growth rate by∼10%at both sites. At the fertilized North Patch, light limitationplayed a significant role in the bloom development,reducing small phytoplankton growth rates by almost40% and diatom growth rates by about 20% at the end ofthe bloom. Thus, self-shading was significant as thebloom developed. In the fertilized South Patch (Fig. 4),
at peak bloom, light limitation reduced the smallphytoplankton and diatom growth rates by 60% and40% respectively. This light-limitation decreased as thebloom declined. Nutrients not depicted in Fig. 4 werenever growth limiting.
Diatoms dominated the bloom at the North and SouthPatches in the model. In the field experiment as describedin the previous paragraph the community structure at theNorth Patch consisted of a mixture of phytoplankton(N5 μm diameter) which included diatoms (Buesseleret al., 2005) but the diatoms never dominated the bloom.The South Patch bloom was diatom-dominated (Coaleet al., 2004). In part because of the way grazing isparameterized, it is difficult for the BEC to have a mixedbloom (both small phytoplankton and diatoms). Thetendency is for either small phytoplankton or diatoms to
Fig. 9. Results obtained from simulations for the iron fertilized North Patch with varying wind speeds and mixed layer depths (Table 3, column 2).Lines with increasing thickness depict the simulated runs with NCEP wind forcing multiplied by 0.7, 1, 1.3 and 1.6.
123A. Krishnamurthy et al. / Journal of Marine Systems 71 (2008) 112–130

Author's personal copy
bloom. This leads to the model bias at the North Patchsimulations with strong diatom dominance of the bloom.We acknowledge this flaw in the model and hope toaddress it in future work. Despite the inherent biases in themodel, the simulations were to a large extent able torecreate the prominent biogeochemical dynamics of thefertilized and unfertilized surface waters at the North andSouth Patches during the SOFeX. As a next step, thefollowing two sections summarize the effects of dilutionand varying mixed layer depths on bloom development.
3.2. Effects of patch dilution
Dilution acts to reduce elevated phytoplanktonbiomass, lower iron concentrations, and mix in macro-nutrients from outside the iron fertilized patches. Theresponse of a case with no dilution would be indicativeof the response to large-scale fertilization. In the dilutionsensitivity plots (Figs. 5–7), the line thickness increasesfrom the no dilution case through 0.5, 1.0 and 1.5 timesthe Coale et al. (2004) dilution estimates, and dashed
lines represent the unfertilized surface waters. Peakbloom magnitude at each site was inversely correlatedwith dilution rate. At the highest dilution rate, the NorthPatch and South Patch blooms were depressed (max.Chl. at North Patch b1 mg/m3; max. Chl. at South Patchb3 mg/m3) but they were still higher than that in theunfertilized surface waters. Peak blooms at the SouthPatch for the different dilution rates occur at similartimes but the magnitude during bloom termination werehigher under lower dilution rates (Fig. 5). Themacronutrient drawdown was stronger than in ourstandard simulations, particularly in the no dilutioncase. At the North Patch (Fig. 6), intermediate dilutionrates resulted in an extended bloom, relative to the highand no dilution cases.
In all of the dilution cases (Fig. 7), phytoplanktoniron limitation eased initially after the iron infusions butredeveloped as the bloom progressed, with the limita-tion increasing sooner with higher dilution rates (as ironwas lost laterally from the patch). For the two highestdilution cases (1.0 and 1.5 times Coale et al.'s (2004)
Fig. 10. Mixed layer depth averages of the growth-limitation-factors (y-axis, factors multiplied by the maximum growth rate to give relative reductionin growth rate) for the small phytoplankton (Fe and light) and for the diatoms (Fe, Si, and light) at each patch site. Lines with increasing thicknessdepict the simulations with NCEP wind forcing multiplied by 0.7, 1, 1.3 and 1.6.
124 A. Krishnamurthy et al. / Journal of Marine Systems 71 (2008) 112–130

Author's personal copy
estimates), post-bloom iron limitation levels approachedthat of the unfertilized control cases. Light limitationexhibited the opposite pattern increasing right after theiron injections and then easing following the bloom,though with considerably more short-term variabilitydue to MLD fluctuations. The large range in themagnitudes of the South Patch bloom led to a cor-responding large variation in the degree to which smallphytoplankton and diatom growth were limited by light(Fig. 7). Higher chlorophyll concentrations increasedlight limitation due to self-shading of the blooms. In-creasing diatom Si limitation occurred as dilution ratewas lowered at the North Patch, and silicon limitationreplaced iron limitation as the major nutrient factorgoverning diatom growth at the lower dilution rates. Ineffect, the amount of iron added by the injectionsexceeded the amount of available Si(OH)4 at the com-munity Si/Fe uptake ratio without some external Sisource via lateral mixing. This pattern was also observedin the field data by Hiscock and Millero, (2005).Nutrients not depicted in Fig. 7 were never growthlimiting.
3.3. Effects of changing mixed layer depths
Mixed layer depths shoal under reduced wind speedsand deepen under greater wind speeds (Tables 1 and 2).In the MLD sensitivity plots (Figs. 8–10), the linethickness increases from the 0.7, 1.0, 1.3 and 1.6 timesthe baseline adjusted NCEP wind forcing. Maximumbloom conditions were observed for the simulation withthe shallowest MLD at both patches. The bloom at theSouth Patch exhibited a uniform trend such that itdecreased with increased MLD. The nutrient uptakereflected this such that there was very little drawdownfor the simulations with deeper mixed layers (Fig. 8). Atthe North Patch there were two peaks in the bloomcorresponding to lowest wind speed forcing (Fig. 9, seechlorophyll and silicate drawdown). The second bloomcorresponded to an increase in the silicate concentrationaround day 30 of the simulations, indicating a shift froma diatom to a small phytoplankton dominated bloom.This change in phytoplankton community resulted in anincrease in sinking POC (Fig. 9, panel 8). The bloomsfor deeper mixed layer simulations at the North Patch(Fig. 9, panel 5) were muted (max. Chl. ∼1 to 2 mg/m3)despite considerable nutrient drawdown, especiallysilicate.
Simulated small phytoplankton and diatom ironlimitation curves were not sensitive to wind speed andmixed layer depth except at the shallowest MLD case,where extreme iron limitation was observed in North
Patch simulation following the large blooms (Fig. 10).Deepening the MLD affects the phytoplankton lightlimitation levels directly by decreasing the average lightlevel over the deeper mixed depth because of theexponential light attenuation curve and indirectly byreducing the size of the bloom and the plankton self-shading. The depth attenuation term dominated, andlight limitation was inversely related to wind speed andmixing. At the North Patch, the strongest silicon lim-itation occurred for low and intermediate MLD levels,though Si limitation did not replace Fe limitation as thedominant nutrient term except for the baseline NCEPforcing case, where diatom growth was reduced due toSi limitation by almost 60% between days 40 to 50. Atthe South Patch, small phytoplankton and diatomsmaximum growth rates were reduced due to lightlimitation by ∼40% and ∼20% for the shallowest MLD
Fig. 11. Variations in simulated maximum chlorophyll (top panel) anddissolved inorganic carbon (DIC) drawdown (bottom panel) plottedagainst mixed layer depth (MLD) from the wind speed sensitivityexperiments. DIC drawdown is defined as the initial surface DICconcentration minus the minimum surface DIC concentration over the60 day model simulations. Dashed and dotted lines represent the Northand South Patch data from varying MLD simulations and solid line isbased on the trend line from Fig. 12 of de Baar et al. (2005).
125A. Krishnamurthy et al. / Journal of Marine Systems 71 (2008) 112–130

Author's personal copy
simulation, with larger reductions with deeper mixedlayers (Fig. 10).
In a study synthesizing eight iron fertilizationexperiments, de Baar et al. (2005) suggested that mixingof surface waters due to wind forcing has a stronginfluence on the amount of light received by phyto-plankton for growth resulting in an inverse relationshipbetween maximum observed chlorophyll under bloomconditions and mixed layer depth. We found a similarinverse relationship in our wind speed/MLD sensitivityexperiments (Fig. 11). They also proposed that chloro-phyll is not the most suitable measure of biomassbecause phytoplankton under iron replete conditionssynthesizes more chlorophyll leading to lower carbon tochlorophyll ratios. Hence, they recommended using netdrawdown of DIC as a gauge for net biomass, where netDIC drawdown is the difference between maximumDIC drawdown under bloom conditions relative to DIC
values in the profile before iron additions. Our modelresults are consistent with the inverse relationshipbetween MLD and DIC drawdown found by de Baaret al. (2005) across the various iron fertilizationexperiments such that the strongest blooms occurredin conditions with shallow mixed layers (Fig. 12 of deBaar et al., 2005; Fig. 11).
3.4. Simulated carbon and iron budgets
Depth-integrated, carbon budgets for all model casesat the South and North patches are presented in Tables 2and 3, respectively. The SOFeX iron additions in themodel led to an increase in net primary production(NPP) at both sites. The export ratios increased in thefertilized patch simulation relevant to ambient watersat the South Patch (Table 2, column 9 and 10, rows 1 and3 (0.07 to 0.1 for days 1–30 and 0.08 to 0.12 for days
Table 4Simulated depth integrated (0–150 m) iron budgets for outside and inside the iron fertilized South Patch as well as for the iron fertilized dilution andwind speed/mixed layer sensitivity experiments
South Patch Biouptake
Scavenging Sinkingexport
Particulateiron
Ironadded
Dissolved iron(day 60)
Dissolved iron(day 0–day 60)
Outside patch 9 0.7 0.01 1.0 0 28 2.4No dilution 46 1.8 0.11 19.8 42 41 −11.0In/Coale et al. (2004) dilution 25 0.9 0.01 5.8 42 28 2.40.5⁎Coale et al. (2004) dilution 32 1.1 0.03 10.3 42 30 0.81.5⁎Coale et al. (2004) dilution 20 0.8 0.01 3.3 42 28 2.4Wind speed⁎0.7 (out) 9 0.7 0.01 1.0 0 28 2.5Wind speed⁎1.3 (out) 8 0.7 0.01 1.0 0 28 2.4Wind speed⁎1.6 (out) 8 0.7 0.01 0.9 0 28 2.3Wind speed⁎0.7 (in) 24 0.9 0.01 6.5 41 28 2.5Wind speed⁎1.3 (in) 21 0.9 0.01 3.6 46 28 2.2Wind speed⁎1.6 (in) 16 0.8 0.01 1.9 52 29 1.7
Columns 2, 3 and 4 give the cumulative (days 0–60) depth integrated iron uptake by biology, amount of iron scavenged and the sinking particulateiron export of iron at 150 m, respectively (all in μmol Fe/m2). Column 5, 7 and 8 give the depth integrated particulate iron and dissolved ironinventories on the last day of simulation and the difference in dissolved iron inventories between day 0 and day 60 (μmol Fe/m2). Column 6 gives theamount of iron (μmol Fe/m2) added during the iron infusions to the water column.
Table 3North Patch carbon budgets (refer Table 2 for details)
North Patch MeanMLD
Windspeed
Primaryprod
DOC POCprod
Lossterms
SinkingPOC
Exp1 Exp2 TotalPOC
Outside patch 35 11 2088 704 264 1286 151 0.11 0.12 159No dilution 35 11 5230 1489 1108 2714 551 0.17 0.30 244In/Coale et al. (2004) dilution 35 11 6080 1335 981 2446 486 0.11 0.10 3570.5⁎Coale et al. (2004) dilution 35 11 6018 1437 1180 2649 578 0.14 0.16 3501.5⁎Coale et al. (2004) dilution 35 11 4384 894 855 2107 234 0.10 0.14 163Wind speed⁎0.7 (out) 19 8 2133 714 273 1311 155 0.11 0.12 160Wind speed⁎1.3 (out) 57 15 1985 677 246 1230 145 0.10 0.11 157Wind speed⁎1.6 (out) 84 18 1891 647 225 1175 138 0.09 0.09 168Wind speed⁎0.7 (in) 19 8 9634 1635 2727 3165 1398 0.14 0.10 399Wind speed⁎1.3 (in) 57 15 3860 1108 467 1931 259 0.09 0.11 191Wind speed⁎1.6 (in) 84 18 3113 926 365 1634 214 0.08 0.10 183
126 A. Krishnamurthy et al. / Journal of Marine Systems 71 (2008) 112–130

Author's personal copy
31–60)). At the North Patch, iron additions did notincrease export ratios between days 1 to 30 (Table 3,column 9, rows 1 and 3 (0.11 in both simulations)).Export ratios decreased slightly in the iron fertilizedcase between days 31 to 60 (Table 3, column 10, rows 1and 3 (0.12 to 0.1)) Buesseler et al. (2005) observed adecrease in export ratios, suggesting that possibly thediatom-dominated bloom is more buoyant underreduced iron stress. Higher export ratios at the simulatedSouth Patch were due to higher sinking POC exportassociated with the elevated diatom production.
Simulated export flux decreased with increasingdilution rate and mixed layer depth in both the ironfertilized patches. In the case of dilution, loss of iron dueto lateral mixing out of the patch prevented phytoplank-ton growth, resulting in decreased export. Similarly,higher wind speeds reduced primary production andsinking POC export due to elevated light limitationwithin the deeper mixed layers. At the fertilized NorthPatch, the simulation with the deepest mixed layer depthhad a marginal increase in export ratio from days 31 to60 due to the second bloom (Table 3, column 10; Fig. 9).
Depth and time-integrated iron budgets for all of themodel cases are presented in Tables 4 and 5. Comparingthe base fertilized and unfertilized simulations, thepercentage of added iron that was taken up by biology(Tables 4 and 5, column 2), and sinking particulate ironexport (Tables 4 and 5, column 4) were similar at boththe North and South Patches. The percentage of addediron that was lost to scavenging (Tables 4 and 5, column3) were also similar at both patches. Iron scavenging rateis parameterized based on a non-linear function of themodel iron concentration, a higher concentration leadsto higher scavenging rates. The iron budgets for ashorter duration (example, 5 days) immediately follow-ing iron infusions at both the North and South Patchessuggested a higher percentage of iron being scavenged
compared to that going to biological uptake and export.This was due to an increase in model iron concentrationfollowing iron additions.
Iron budgets for the sensitivity studies with varyingdilution scenarios at the both the fertilized north andsouth sites demonstrate a decrease in iron uptake bybiology with increased dilution. This was becausedilution aided the loss of iron from the patch, makingless iron available for phytoplankton. In reality much ofthe laterally exported iron would be consumed byphytoplankton, just not in the core of the fertilized patch.The dissolved iron concentration at the end of simula-tions (Tables 4 and 5, column 7) was highest for the nodilution case at both North and South Patches. Thesensitivity studies with modified mixed layer depthsresulted in increased iron uptake at both the fertilizedpatches at shallower MLD.
4. Summary and discussion
Our 1-D coupled biological–physical simulationsreproduce the SOFeX observations to a large extentwith a few caveats discussed below. The iron-fertilizedbloom in our simulations was dominated by diatoms atboth the patches, resulting in excessive silicate drawdownin the North Patch. The simulated sinking POC fluxeswere also higher than those observed during the SOFeXexperiment, in part due to the diatom dominance at theNorth Patch. Another reason for this could be that themodel was partitioning too much carbon into sinkingPOC rather than DOC. de la Rocha (2003) suggested thatthe reduction in carbon export out of the euphotic zoneduring natural blooms could be due to increased flow ofcarbon through the microbial loop by microzooplanktonand bacteria resulting in the regeneration of CO2 andnutrients within the euphotic zone. Boyd et al. (2000) andStrass (2002) found that there was an increase in
Table 5North Patch iron budgets (refer Table 4 for details)
North Patch Biouptake
Scavenging Sinkingexport
Particulateiron
Ironadded
Dissolved iron(day 60)
Dissolved iron(day 0–day 60)
Outside patch 8 0.6 0.01 0.9 0 19 1.3No dilution 31 2.0 0.01 8.1 125 73 −53.0In/Coale et al. (2004) dilution 30 0.9 0.02 4.9 125 21 −0.80.5⁎Coale et al. (2004) dilution 35 1.2 0.04 7.1 125 31 −111.5⁎Coale et al. (2004) dilution 18 0.7 0.01 2.2 125 19 0.8Wind speed⁎0.7 (out) 8 0.7 0.01 0.9 0 19 1.4Wind speed⁎1.3 (out) 8 0.6 0.01 0.8 0 19 1.3Wind speed⁎1.6 (out) 8 0.6 0.01 0.8 0 19 1.4Wind speed⁎0.7 (in) 47 1.0 0.04 13.8 126 20 0Wind speed⁎1.3 (in) 20 0.8 0.01 2.4 125 22 −1.7Wind speed⁎1.6 (in) 17 0.8 0.01 1.9 127 22 −1.8
127A. Krishnamurthy et al. / Journal of Marine Systems 71 (2008) 112–130

Author's personal copy
microzooplankton and bacteria biomass after mesoscaleiron-addition experiments such that some carbon fixedafter iron addition was routed into the microbial loop andDOC pool instead of being exported to deeper waters.DOC observations were not available to directly addressthis possibility. The export estimates of Buesseler et al.(2005) in conjunction with the production estimates fromLance et al. (2007) imply very low export ratios for thediatom-dominated bloom at the South Patch. Export ratiosvaried from 0.06 to 0.11 during the first 3 weeks after thefirst iron fertilization (Buesseler et al., 2005). High-latitude diatom blooms often have much higher exportefficiencies (Buesseler 1998; Dunne et al., 2005). Thus,the observations may underestimate export, or the exportefficiency was unusually low during SOFeX.
The mixed layer depth sensitivity experiments sug-gested that shallow mixed layers enhance the biologicalresponse to iron fertilization, in particular the peak chlo-rophyll bloom magnitude. The results of our sensitivitystudy varying MLD were consistent with de Baar et al.'s(2005) study across different fertilization experiments. Inour simulations, the maximum chlorophyll yield at thelowest mixed layer depth was limited by the quadraticphytoplankton aggregation losses which become signif-icant under bloom conditions. The DIC drawdown valuesobtained from our simulations were within the range ofobservations used by de Baar et al. (2005). In their study,de Baar et al. (2005) compared iron fertilization ex-periments that were done at different regional as well asseasonal conditions that include different wind forcings,ambient temperatures, macronutrients, ocean biology andlight climate. These experiments also differed in thelengths of field campaign and hence, the available ob-servational data also varied. The amounts of iron addedduring each of these iron fertilization experiments werealso different. The trend line based on their study, hence,incorporates these wide differences in its estimates of therelationship between mixed layer depth and maximumchlorophyll and DIC drawdown. Given that we comparethese relationships at a particular region, the plots matchreasonably well. Our results in conjunction with theSOFeX field observations and the de Baar et al. (2005)synthesis suggest that blooms in the Southern Ocean willtend to become light-limited or iron-light co-limited inmost cases, except when mixed layer depths are quiteshallow. This self-shading effect may explain thepersistence of the SOIREE bloom, which was stillapparent in satellite data almost 40 days after the initialfertilization (Boyd and Law, 2001). Reduced growth ratesdue to self-shading slow the depletion of nutrientsallowing high biomass to persist for a longer period oftime. These lowered growth rates are still sufficient to
offset losses to grazing and other processes. Fitch andMoore (2007) recently found an inverse correlation be-tween bloom occurrence and wind speed in the SouthernOcean marginal ice zone.
At the North Patch the simulations both outside andinside the iron fertilized patches clearly indicated co-limitation by light, iron and silicate. The South Patchwas, however, only limited by iron and light as silicateconcentrations are higher south of the ACC. Thesensitivity experiments with different dilution ratessuggested that increasing dilution at the North Patchreduced the silicate limitation due to addition of silicatefrom surrounding waters into the patch, consistent withfield observations (Hiscock and Millero, 2005). At theNorth Patch, the diatom response involves a trade-offbetween iron loss and silicate gain via lateral mixing.The South Patch no dilution simulation had a maxi-mum nutrient drawdown, resulting in higher net pri-mary productivity and chlorophyll peak, because theiron remained within patch and macronutrients werenot depleted.
Deliberate iron enrichment increases the total DICloss from surface waters such that the ratio between netDIC losses to amount of iron added via enrichment canbe used as a measure for the efficiency of DIC removalfrom surface waters. These were estimated by de Baaret al. (2005) for eight mesoscale iron fertilizationexperiments done so far. Dilution of the patch is anuncertainty that prevents accurate measurements of netDIC losses as the observed DIC drawdown does notequal the actual net community production (de Baaret al., 2005). Hence, only approximate estimates of netDIC loss during iron fertilization experiments can bemade. The amount of iron taken up by phytoplankton isnot accurately known as scavenging and other lossesduring the experiment prevent complete uptake of addediron. The DIC/Fe efficiency estimated by de Baar et al.(2005) was based on the average DIC removal over themixed layer and the total amount of iron added duringthe experiment. The ratio was 4624 (mol C/mol Fe) and7330 (mol C/mol Fe) on day 39 and day 20 at thefertilized North and South Patch respectively during theSOFeX. The DIC/Fe efficiency from our simulations onthe same days were 8697 (mol C/mol Fe) and 7200 (molC/mol Fe) at the fertilized North and South Patchrespectively. The close agreement between this DIC/Feratio in our South Patch simulation and the observations,again suggests the model is removing the correctamount of DIC, but perhaps portioning too much ofthis into sinking POC and not enough into DOC. Thesimulated diatom dominated bloom resulted in thehigher DIC/Fe efficiencies at the North Patch. The DIC/
128 A. Krishnamurthy et al. / Journal of Marine Systems 71 (2008) 112–130

Author's personal copy
Fe efficiencies for the six other mesoscale ironfertilization experiments were between 1668 (mol C/mol Fe) to 16887 (mol C/mol Fe) (de Baar et al., 2005).
SOFeX was designed such that the observing periodof fertilized waters was longer than in previous in situiron fertilization studies. Observations of the SouthPatch captured almost the complete cycle of bloomformation and termination, with the tail end of thebloom shortly after the completion of the field obser-vations. But at the North Patch, the bloom appears tohave persisted for a longer period. Our simulation re-sults indicate that the North Patch bloom continued to besignificant even on the 60th day of the simulation.Shipboard observations ended on day ∼45 of our simu-lations. Continuing profiling float measurements alsosuggested relatively higher export at day ∼55 (Bishopet al., 2004). Field campaigns for a longer period,though difficult logistically could be useful to estimatethe prolonged affects of dilution, which results in in-creased mixing and supply of macronutrients fromunfertilized waters. Future iron fertilization experimentscould also be performed over a larger region as thiswould minimize the effects of dilution. Alternatively,natural iron sources such as the Kerguelen Islands (Blainet al., 2001; Bucciarelli et al., 2001) can also be used tostudy iron fertilization where distance from the ironsource is a proxy for time since iron addition. Thesemore steady state systems would eliminate the logisticalproblems presented by an extended Southern Oceanpatch field experiment of several months.
Acknowledgments
We would like to thank the crew and all supportpersonnel on the R/V Revelle, the Melville, and thePolar Star and all the investigators of the SOFeX project.Thanks to Kenneth Coale, Ken Johnson, Ken Buesseler,Jodi Brewster, Veronica Lance, William T. Hiscock,Mark Altabet and Craig Hunter for generously sharingtheir data during the course of this work. This work wassupported by NASA grant NAG5-12520 from theNASA Ocean Biogeochemistry Program.
References
Abbott, M.R., Richman, J.G., Letelier, R.M., Bartlett, J.S., 2000. Thespring bloom in the Antarctic Polar Frontal Zone as observed froma mesoscale array of bio-optical sensors. Deep-Sea Res., Part II 47(707), 3285–3314.
Abraham, E.R., Law, C.S., Boyd, P.W., Lavender, S.J., Maldonado,M.T., Bowie, A.R., 2000. Importance of stirring in the devel-opment of an iron-fertilized phytoplankton bloom. Nature 407(6805), 727–730.
Bishop, J.K.B., Wood, T.J., Davis, R.E., Sherman, J.T., 2004. Roboticobservations of enhanced carbon biomass and export at 55°Sduring SOFeX. Science 304 (5669), 417–420.
Blain, S., Treguer, P., Belviso, S., Bucciarelli, E., Denis, M., Desabre,S., Fiala, M., Martin, J.V., Le Fevre, J., Mayzaud, P., Marty, J.C.,Razouls, S., 2001. A biogeochemical study of the island masseffect in the context of the iron hypothesis: Kerguelen Islands,Southern Ocean. Deep-Sea Res., Part I 48 (1), 163–187.
Boyd, P.W., 2002. Environmental factors controlling phytoplanktonprocesses in the Southern Ocean. J. Phycol. 38, 844–861.
Boyd, P.W., Law, C.S., 2001. The Southern Ocean Iron ReleaseExperiment (SOIREE)—introduction and summary. Deep-SeaRes., Part 2, Top. Stud. Oceanogr. 48 (11–12), 2425–2438.
Boyd, P.W., LaRoche, J., Gall, M., Frew, R., McKay, R.M.L., 1999.Role of iron, light, and silicate in controlling algal biomass insubantarctic waters SE of New Zealand. J. Geophys. Res. 104(C6), 13395–13408.
Boyd, P.W.,Watson, A.J., Law, C.S., Abraham, E.R., Trull, T.,Murdoch,R., Bakker, D.C., Bowie, A.R., Buesseler, K.O., Chang, H., Charette,M., Croot, P., Downing, K., Frew, R., Gall, M., Hadfield, M., Hall, J.,Harvey, M., Jameson, G., LaRoche, J., Liddicoat, M., Ling, R.,Maldonado, M.T., McKay, R.M., Nodder, S., Pickmere, S.,Pridmore, R., Rintoul, S., Safi, K., Sutton, P., Strzepek, R.,Tanneberger, K., Turner, S., Waite, A., Zeldis, J., 2000. A mesoscalephytoplankton bloom in the polar Southern Ocean stimulated by ironfertilization. Nature 407, 695–702.
Brown, S.L., Landry, M.R., 2001. Mesoscale variability in biologicalcommunity structure and biomass in the Antarctic Polar Frontregion at 170 W during austral spring 1997. J. Geophys. Res. 106,13917–13930.
Brzezinski, M.A., Jones, J.L., Demarest, M.S., 2005. Control of silicaproduction by iron and silicic acid during the Southern Ocean IronExperiment (SOFeX). Limnol. Oceanogr. 50 (3), 810–824.
Buesseler, K.O., 1998. The decoupling of production and particulateexport in the surface ocean. Glob. Biogeochem. Cycles 12 (2),297–310.
Buesseler, K.O., Andrews, J.E., Pike, S., Charette, M.A., Goldson, L.E.,Brzezinski, M.A., Lance, V.P., 2005. Particle export during theSouthern Ocean Iron Experiment (SOFeX). Limnol. Oceanogr. 50(1), 311–327.
Bucciarelli, E., Blain, S., Treguer, P., 2001. Iron and manganese in thewake of the Kerguelen Islands (Southern Ocean). Mar. Chem. 73(1), 21–36.
Campbell, J.W., Aarup, T., 1989. Photosynthetically availableradiation at high-latitudes. Limnol. Oceanogr. 34 (8), 1490–1499.
Coale, K.H., Johnson, K.S., Chavez, F.P., Buesseler, K.O., Barber, R.T.,Brzezinski,M.A., Cochlan,W.P.,Millero, F.J., Falkowski, P.G., Bauer,J.E., Wanninkhof, R.H., Kudela, R.M., Altabet, M.A., Hales, B.E.,Takahashi, T., Landry, M.R., Bidigare, R.R., Wang, X., Chase, Z.,Strutton, P.G., Friederich, G.E., Gorbunov, M.Y., Lance, V.P., Hilting,A.K., Hiscock, M.R., Demarest, M., Hiscock, W.T., Sullivan, K.F.,Tanner, S.J., Gordon, R.M., Hunter, C.N., Elrod, V.A., Fitzwater, S.E.,Jones, J.L., Tozzi, S., Koblizek, M., Roberts, A.E., Herndon, J.,Brewster, J., Ladizinsky, N., Smith, G., Cooper, D., Timothy, D.,Brown, S.L., Selph,K.E., Sheridan, C.C., Twining, B.S., Johnson, Z.I.,2004. Southern ocean iron enrichment experiment: carbon cycling inhigh-and low-Si waters. Science 304, 408–414.
de Baar, H.J., Boyd, P.W., Coale, K.H., Landry, M.R., Tsuda, A.,Assmy, P., Dorothee, C.E.B., Bozec, Y., Barber, R.T., Brzezinski,M.A., Buesseler, K.O., Boye, M., Croot, P.L., Gervais, F.,Gorbunov, M.Y., Harrison, P.J., Hiscock, W.T., Laan, P., Lancelot,C., Law, C.S., Levasseur, M., Marchetti, A., Millero, F.J.,
129A. Krishnamurthy et al. / Journal of Marine Systems 71 (2008) 112–130

Author's personal copy
Nishioka, J., Nojiri, Y., van Oijen, T., Riebesell, U., Micha, J.A.R.,Saito, H., Takeda, S., Timmermans, K.R., Marcel, J.W.V., Waite,A.M., Wong, C.S., 2005. Synthesis of iron fertilization experi-ments: from the iron age in the age of enlightenment. J. Geophys.Res. 110, C09S16. doi:10.1029/2004JC002601.
Dehairs, F., Lancelot, C., André, L., Frankignoulle, M., Deleersnijder,E., Becquevort, S., Cardinal, D., Cattaldo, T., Delille, B., Elskens,M., Fagel, N., Goosse, H., Hannon, E., Navez, J., Probst, G.,Schoemann, V., Kopczynska, E., Kostianoy, A., 2000. AnIntegrated Approach to Assess Carbon Dynamics in the SouthernOcean, Final Scientific Report, A4/DD/B11 — B14. available atwww.co2.ulg.ac.be/objects/Belcanto_Final_Report.pdf.
de la Rocha, C.L., 2003. The biological pump. In: Holland, H.D.,Turekian, K.K. (Eds.), Treatise on Geochemistry. Pergamon,Oxford, pp. 83–111.
Doney, S.C., 1996. A synoptic atmospheric surface forcing data setand physical upper ocean model for the U.S. JGOFS BermudaAtlantic Time-Series Study (BATS) site. J. Geophys. Res., Oceans101, 25,615–25,634.
Dunne, J.P., Armstrong, R.A., Gnanadesikan, A., Sarmiento, J.L.,2005. Empirical and mechanistic models for the particle exportratio. Glob. Biogeochem. Cycles. doi:10.1029/2004GB002390.
Fennel, K., Abbott, M.R., Spitz, Y.R., Richman, J.G., Nelson, D.M.,2003. Modeling controls of phytoplankton production in thesouthwest Pacific sector of the Southern Ocean. Deep-Sea Res.,Part 2, Top. Stud. Oceanogr. 50 (3–4), 769–798.
Fitch, D.T., Moore, J.K., 2007. Wind speed influence on phytoplank-ton bloom dynamics in the Southern Ocean Marginal Ice Zone. J.Geophys. Res. 112, C08006. doi:10.1029/2006JC004061.
Geider, R.J., MacIntyre, H.L., Kana, T.M., 1998. A dynamicregulatory model of phytoplankton acclimation to light, nutrients,and temperature. Limnol. Oceanogr. 43, 679–694.
Gervais, F., Riebesell, U., Gorbunov, M.Y., 2002. Changes in primaryproductivity and chlorophyll a in response to iron fertilization inthe Southern Polar Frontal Zone. Limnol. Oceanogr. 47,1324–1335.
Helbling, E.W., Villafane, V.E., Holmhansen, O., 1995. Variability ofphytoplankton distribution and primary production around Ele-phant Island, Antarctica, during 1990–1993. Polar Biol. 15 (4),233–246.
Hiscock, M.R., The regulation of primary productivity in the SouthernOcean, 2004. PhD thesis, Nicholas School of the Environment andEarth Sciences, Duke University.
Hiscock, W.T., Millero, F.J., 2005. Nutrient and carbon parametersduring the SOFeX. Deep-Sea Res. I 52, 2086–2108.
Kalnay, E., Kanamitsu, M., Kistler, R., Collins, W., Deaven, D.,Gandin, L., Iredell, M., Saha, S., White, G., Woollen, J., Zhu, Y.,Chelliah, M., Ebisuzaki, W., Higgins, W., Janowiak, J., Mo, K.C.,Ropelewski, C., Leetmaa, A., Reynolds, R., Jenne, R., 1996. The
NCEP/NCAR reanalysis project. Bull. Am. Meteorol. Soc. 77,437–471.
Lance, V.P., Hiscock, M.R., Hilting, A.K., Stuebe, D.A., Bidigare, R.R.,Smith Jr.,W.O., Barber, R.T., 2007. Primary productivity, differentialsize fraction and pigment composition responses in two SouthernOcean in situ iron enrichments. Deep-Sea Res. I 54 (5), 747–773.doi:10.1016/j.dsr.2007.02.008.
Large, W.G., McWilliams, J.C., Doney, S.C., 1994. Oceanic verticalmixing: a review and a model with a non-local boundary layerparameterization. Rev. Geophys. 32, 363–403.
Luo, C., Mahowald, N., del Corral, J., 2003. Sensitivity study ofmeteorological parameters on mineral aerosol mobilization,transport and distribution. J. Geophys. Res. 108 (D15), 4447.doi:10.1029/2003JD0003483.
Martin, J.H., 1990. Glacial-interglacial CO2 change: the iron hypothesis.Paleoceanography 5, 1–13.
McClain, C.R., Cleave, M.L., Feldman, G.C., Gregg, W.W., Hooker,S.B., Kuring, N., 1998. Science quality SeaWiFS data for globalbiosphere research. Sea Technology September, 10–16.
McClain, C.R., Feldman, G.C., Hooker, S.B., 2004. An overview ofthe SeaWiFS project and strategies for producing a climateresearch quality global ocean bio-optical time series. Deep SeaRes., Part II 51, 5–42.
Mitchell, B.G., Brody, E.A., Holm-Hansen, O., McClain, C., Bishop,J., 1991. Light limitation of phytoplankton growth in Antarcticwaters. Glob. Biogeochem. Cycles 4, 5–12.
Moore, J.K., Doney, S.C., 2006. Remote sensing observations of oceanphysical and biological properties in the region of the SouthernOcean Iron Experiment (SOFeX). J. Geophys. Res 111, C06026.doi:10.1029/2005JC003289.
Moore, J.K., Doney, S.C., Kleypas, J.A., Glover, D.M., Fung, I.Y.,2002. An intermediate complexity marine ecosystem model for theglobal domain. Deep-Sea Res., II 49, 403–462.
Moore, J.K., Doney, S.C., Keith, L., 2004. Upper ocean ecosystemdynamics and iron cycling in a global three-dimensional model. Glob.Biogeochem. Cycles 18, GB4028. doi:10.1029/2004GB002220.
Nelson, D.M., Smith Jr., W.O., 1991. Sverdrup revisited: criticaldepths, maximum chlorophyll levels, and the control of southernocean productivity by irradiance mixing regime. Limnol. Ocea-nogr. 36, 1650–1661.
Smetacek, V., 2001. EisenEx: international team conducts ironexperiment in Southern Ocean. U.S. JGOFS News 11 (1), 11–14.
Smith, W.O., Lancelot, S., 2004. Bottom-up versus top-down control inphytoplankton of the Southern Ocean. Antarct. Sci. 16 (4), 531–539.
Strass, V.H., 2002. EisenEx-1: test of the iron hypothesis in a SouthernOcean eddy. EOS: Trans., AGU Abstracts of 2002 Ocean SciencesMeeting.
Sunda, W.G., Huntsman, S.A., 1997. Interrelated influence of iron, lightand cell size onmarine phytoplankton growth. Nature 390, 389–392.
130 A. Krishnamurthy et al. / Journal of Marine Systems 71 (2008) 112–130