the effects of economic value added on managerial …
TRANSCRIPT
i
By
Christian Pauly
May 4, 2015
THE EFFECTS OF ECONOMIC VALUE ADDED ON
MANAGERIAL DECISION-MAKING AND
CORPORATE PROFITABILITY
Submitted in partial fulfillment of the requirements for
Departmental Honors in
the Department of Accounting
Texas Christian University
Fort Worth, Texas

ii
Project Approved:
Supervising Professor: Mary Stanford, Ph.D.
Department of Accounting
Robert Vigeland, Ph.D.
Department of Accounting
Stacy Landreth Grau, Ph.D.
Department of Marketing
THE EFFECTS OF ECONOMIC VALUE ADDED ON
MANAGERIAL DECISION-MAKING AND
CORPORATE PROFITABILITY
iii
ABSTRACT
Many financial and accounting experts have questioned traditional tools that
measure economic profit. The result of these questions led to the development of
Economic Value Added (EVA), which by many is considered to give a more accurate
picture of a company’s financial performance. EVA is essentially an adaption of the
Residual Income Measure. The term, Economic Valued Added, was coined by the
consulting firm Stern Stewart in the mid 1980’s and has been employed by some of the
largest corporations in the world including Coca-Cola, General Electric, and, Briggs &
Stratton.
Peter Drucker, a leader in development of management education, once said,
“until a business returns a profit that is greater than its cost of capital, it operates at a loss.
Never mind that it pays taxes as if it had a genuine profit. The enterprise still returns less
to the economy that it devours in resources…it does not create wealth; it destroys it.”
Economic value added effectively addresses Drucker’s comment by adjusting the GAAP
financial statements to more accurately reflect how the company allocates it’s capital.
These adjustments, combined with a calculation of the cost of capital through debt and
equity, can provide management with better information before deciding to take on
certain projects.
My thesis will attempt answer the questions of whether EVA truly affects
managerial decision-making as well as whether it increase firm profitability, otherwise
commonly addressed as firm value. By analyzing various case studies, it’s my hope that I
can provide readers with a solid explanation of these questions.
iv
TABLE OF CONTENTS
INTRODCUTION………………………………………………………………………1
EVA: HOW IT WORKS………………………………………………………...….…..2
CONCEPT & DIFFERENCES BETWEEN OTHER PERFORMANCE METRICS.....5
EMPERICAL STUDIES ON EVA AND FIRM VALUE……………………………...7
EVA MEASUREMENT CHALLENGES & IMPLEMENTATION…………….…....10
Implementing EVA in an Organization…………………………....….…...…..13
COMMON CHALLENGES…………………….……………………………….…….16
.
Results…………………………………………………………………….……18
EVA BASED INCENTIVES & PERFORMANCE……………………………….…..19
MANAGERIAL DECISION-MAKING EMPERICAL STUDIES…………….……..21
CONCLUSION…………………………………………………………………..….…22
EVA in 2015…………………………………………………………………...24
LIST OF REFERENCES……………………………………………………………....26
1
Introduction
Briggs & Stratton is a publicly traded outdoor power equipment producer located
in Milwaukee, Wisconsin. Their production of engines and power products, such as
generators and power washers, are key products to American consumers who strive to
keep their outdoor properties pristine and well groomed. They compete against well-
known companies such as Honda, Deere & Co., and Toro Company. As a public
company, the foremost goal of the management team is to increase value for their
shareholders. Between 1980 and 1990, Briggs & Stratton’s stock price fell stagnant
between a range of $25 and $30. Their operating capital more than tripled without a
commensurate increase in cash flow (Shiely, J., 2010). Briggs & Stratton fell victim to
their own success, and their stock price failed to grow. Briggs’ mission: “to be all things
to all people in the outdoor power equipment industry” caused them to over-extend
themselves (Shiely, J., 2010). Investments in large amounts of capital, in low volume,
high priced engine lines were becoming inconsistent with their traditional, cost leadership
dominance. This line of sight was quickly lost, namely due to the fact that managers
began to think that capital was free.
Their solution consisted of three separate facets: a new, improved strategic focus,
organizational change, and capital discipline. The company’s retooling led them to focus
on cash flow management (Shiely, J., 2010). New management that came to the company
believed that cash flow generation was more indicative of firm value, rather than
accounting earnings, and management placed emphasis on measuring the cost of capital
and ensuring that it was deployed efficiently. To implement this strategy the new CEO
and CFO were committed to a focus on economic value added (EVA). Economic Value

2
Added is a financial measurement based on residual wealth. EVA’s quantitative value is a
company’s net operating profit after tax reduced by the cost of debt and equity capital.
The major caveat is that EVA makes certain, specific adjustments to the income
statement, which changes values on the income statement and balance sheet.
Briggs’ implementation included an EVA incentive compensation plan, EVA
training programs, as well as commitment in systems to support the EVA performance
measurement (Shiely, J., 2010). The implementation of EVA had astounding results.
Between 1990 and 1994, their stock price almost tripled. A stock split in 1990 placed
their stock price at $15 a share. By 1994, their stock price nearly hit $40 a share, and
earnings adjusted after tax topped over $100 million (Shiely, J., 2010).
Management’s focus on implanting EVA throughout all firm projects was
instrumental to their recovery and growth in shareholder value. Briggs & Stratton’s
implementation of EVA has been a widely studied case for many who are interested in
alternative ways to build firm value. In my study, I examine the key features in the
successful implantation of EVA throughout an organization. Various studies of firms that
use EVA will be referenced throughout, along with examples from the Briggs & Stratton
case. It is my hope that their case reference will aid in insight as to the steps an individual
company must take in order to successfully implement EVA in an organization.
EVA: How it Works
Many financial and accounting experts have questioned traditional tools that
measure economic profit. The result of these questions led to the development of
Economic Value Added (EVA), which by many is considered to give a more accurate
picture of a company’s performance. EVA is essentially an adaption of the Residual

3
Income Measure. The term, Economic Value Added, was coined by the consulting firm
Stern Stewart in the mid 1980’s and has been employed by some of the largest
corporations in the world including Coca-Cola, General Electric, and of course, Briggs &
Stratton (Dunbar, 2013).
As seen in Briggs & Stratton, the importance of valuing firm projects is
imperative to the continued success and shareholder growth of any company. According
to those who champion the rules of EVA, project management begins with a strategic
vision that creates an initial investment (Desai, M.A., 2006) Before undertaking a project
or investment, there is an establishment of some sort of value measure or even multiple
measures, which gives insight to management whether the project will likely increase
firm value. A project that is aligned with a company’s mission should encompass the
entire organization and at every level, from C-Suite executives all the way down to
workers on the manufacturing floor. It should aim to deliver value until the product or
services are rendered to another party (Desai, M.A., 2006). Managers have to understand
the overall cost that the company will undertake before the project is selected. They must
also realize the key verse in the EVA Bible – managing costs and maximizing cash flow
from a project is imperative to an investments success (Fu, R., Leong, K., & Zaima, J.,
2011).
A positive EVA indicates if a firm’s potential project will generate profits in
excess of the amount required to repay investors (at market rates) for the capital they
have invested in (Desai, M.A., 2006). If the firm has paid its operating and capital costs,
it has created additional wealth. On the other hand, a negative value would instead
4
suggest that the firm or project devours resources, without a return in capital provided by
investors and/or debt holders (Desai, M.A., 2006).
EVA proponents’ main argument is that traditional accounting earnings metrics
fail to include costs of invested capital. EVA addresses this issue and makes strategic,
more accurate allocations of assets and expenses that U.S. GAAP does not permit.
Specifically, EVA starts with GAAP and makes adjustments to modify GAAP in order to
better reflect management performance – modifications include over 160 GAAP
adjustments, some including changes in deferred income taxes, bad debt expense, and
goodwill amortization, just to name a few of the more common adjustments (Rappaport,
A. 1986). Even despite these common adjustments, manager’s usually only choose to
modify five to seven GAAP assets and expenses. The result is that the company’s EVA
metric is more closely associated with value as interpreted by the market than any other
metric (Rappaport, A. 1986). The five to seven metrics selected are often ones that are
most widespread throughout a firm. For example, a company that has not acquired and
does not plan to acquire another company in the future would likely not choose goodwill
amortization as an EVA adjustment (Rappaport, A. 1986).
This paper will delve into the effects of using EVA as opposed to the traditional
accounting measures of profit as well as how it affects managerial behavior and incentive
plans. In the following section a literature review will be addressed to answer the main
research questions:
1. Does the use of Economic Value Added directly affect managerial decision-
making?
2. How does Economic Value Added affect corporate profits?
5
The literature review will also answer two sub-questions:
1. What are the other common performance measures and how does EVA
differ?
2. What are the common adjustments to earnings and implementation
challenges to using EVA?
The final section will outline the results of the literature review and be used to
answer the main research questions. Conclusions will be drawn from the findings in each
section to close the discussion.
Concept & Differences Between Other Performance Metrics
Peter Drucker, a leader in development of management education, once said,
“until a business returns a profit that is greater than its cost of capital, it operates at a loss.
Never mind that it pays taxes as if it had a genuine profit. The enterprise still returns less
to the economy than it devours in resources…it does not create wealth; it destroys it.”
Economic value added effectively addresses Drucker’s concern by adjusting the GAAP
financial statements to more accurately reflect how the company allocates it’s capital and
whether individual projects provide a return on invested capital. These adjustments,
combined with changes to the cost of debt and equity capital, can provide management
with better information for evaluating new and existing projects. EVA also gives
management insight into whether a project will truly create or destroy wealth.
Additionally, EVA can be used as a tool to measure firm-wide value. This
valuation approach is more complex than a simple valuation of a single project that is
being considered. When valuing the entire firm using EVA, the company must take into
account: capital invested in assets already in place, plus the present value of EVA from
6
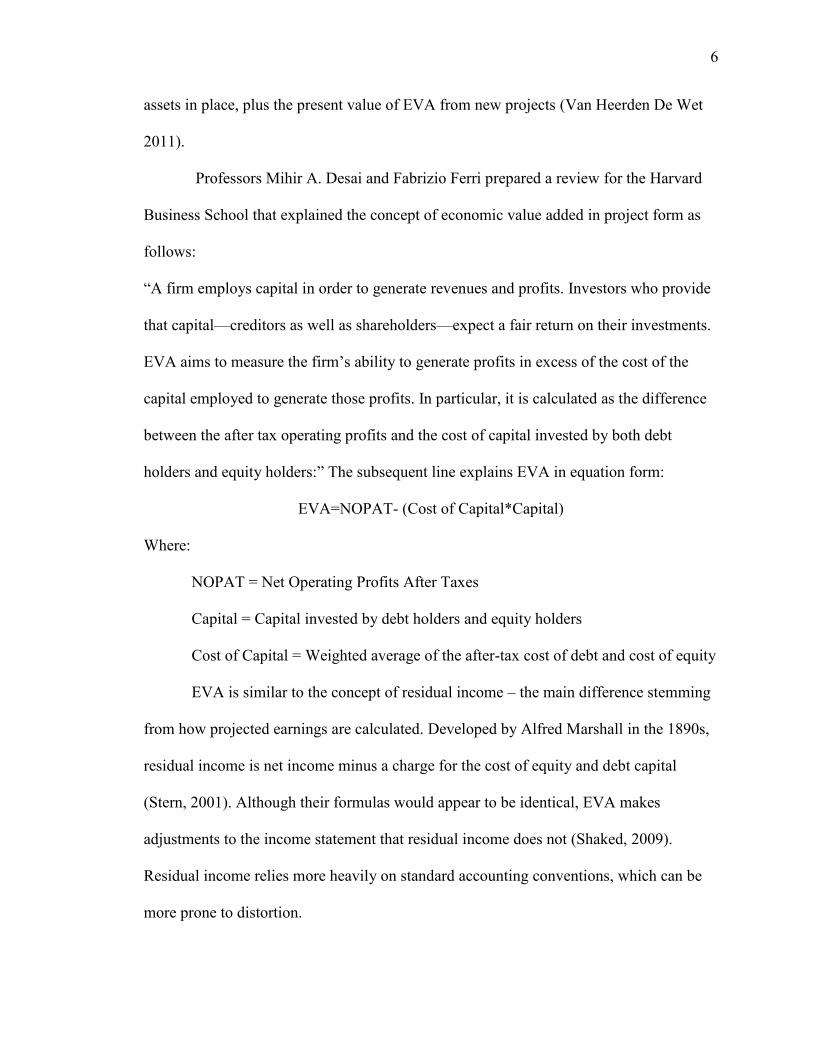
assets in place, plus the present value of EVA from new projects (Van Heerden De Wet
2011).
Professors Mihir A. Desai and Fabrizio Ferri prepared a review for the Harvard
Business School that explained the concept of economic value added in project form as
follows:
“A firm employs capital in order to generate revenues and profits. Investors who provide
that capital—creditors as well as shareholders—expect a fair return on their investments.
EVA aims to measure the firm’s ability to generate profits in excess of the cost of the
capital employed to generate those profits. In particular, it is calculated as the difference
between the after tax operating profits and the cost of capital invested by both debt
holders and equity holders:” The subsequent line explains EVA in equation form:
EVA=NOPAT- (Cost of Capital*Capital)
Where:
NOPAT = Net Operating Profits After Taxes
Capital = Capital invested by debt holders and equity holders
Cost of Capital = Weighted average of the after-tax cost of debt and cost of equity
EVA is similar to the concept of residual income – the main difference stemming
from how projected earnings are calculated. Developed by Alfred Marshall in the 1890s,
residual income is net income minus a charge for the cost of equity and debt capital
(Stern, 2001). Although their formulas would appear to be identical, EVA makes
adjustments to the income statement that residual income does not (Shaked, 2009).
Residual income relies more heavily on standard accounting conventions, which can be
more prone to distortion.
7
Additionally, EVA can be used as a way for the mangers and proponents of EVA
to measure project investment performance or likelihood of successful project
performance (Shaked, 2009). Companies that use EVA simply as a measuring tool will
never reap the full benefits that it can provide. If only used as a measuring tool to gauge
value, the company will only increase or decrease this number based on unmonitored
capital engagement, failing to take any meaningful action to increase firm value. In order
to successfully affect managerial decision making, performance factors, incentive and
bonus plans, and top-down implementation into the organization must take place. (Shiely,
2014).
Essentially, EVA raises the bar and makes managers more aware of all of the
costs of the capital employed, which therefore promotes more efficient allocation of
capital (Stern, 2001). The key feature of EVA is that it includes a charge for the use of
both debt and equity capital. On the contrary, accounting earnings and residual income
valuation models only deduct the after-tax cost of debt capital. This difference is critical
when it comes to motivating managerial behavior. Firms focused on earnings growth,
which is nearly all publicly traded companies, may invest in any projects yielding a
return greater than the after-tax cost of debt, rather than investing only in projects with
returns greater than the overall cost of both debt and equity capital.
Empirical Studies on EVA and Firm Value
Proponents of EVA and make two primary claims – the first claim is that EVA
better explains stock returns and firm values than GAAP accounting metrics. Stern
Stewart provides evidence on this subject by examining firms over the periods of 1984-
1993 and asks the question, “does EVA and/or residual income (RI) dominate net income

8
(NI) and operating cash flow (CFO) in explaining contemporaneous annual stock
returns?” A second question asked is, “Does EVA dominate earnings in explaining firm
value?” To answer this question, a study authored by Stephen O’Bryne, former Stern
Stewart vice-president, was replicated and extended by three professors who are
employed at the University of Washington Business School as well as the Graduate
School of Management ad the University of California, Irvine (Economic). The results
from each study are fascinating.
The three professors used a test of association, also known as a goodness of fit
test, and adjusted R-square from a regression of stock market returns on each
performance metric. The performance metrics included EVA, residual income, current
period accounting earnings, and operating cash flow (CFO). The results on the first
question do not support the claim that EVA dominates earnings in association with
returns. The findings suggest that accounting earnings is “significantly more highly
associated with market-adjusted annual returns with an R-square of 13% followed by
residual income with an R-square of 7%, EVA with an R-square of 6% and CFO with an
R-square of 3%. The results support the exact opposite conclusion that net income and
earnings outperform EVA on average.
Next, the professors replicated a study performed by former Stern Stewart vice
president Stephen O’Byrne. Again, firm value was regressed onto EVA and earnings
measured as NOPAT. O’Byrne reported an adjusted R-square of 31% for EVA regression
and 33% for NOPAT regression. He then went on to make adjustments to the EVA
regression by: “1) allowing separate coefficients for positive and negative values of EVA,
2) including the natural log of capital in attempt to capture market differences in firms of
9
different size, and 3) included 57 industry dummy variables in order to capture potential
industry affects.” All said and done, O’Byrne was then able to capture an adjusted R-
sqaured of 56% for EVA regression and 33% for NOPAT. Notice, however, that O’Byrne
did not make the same adjustments to the NOPAT regression. The three professors took
this study and made identical adjustments to NOPAT in order to “level the playing field.”
The result from this analysis, like the first, does not support the claim that EVA
dominates earnings in explaining firm value. With the applied adjustments EVA
regression had an R-squared of 49% and NOPAT regression had a R-squared of 50%. By
contrast to claims by Stern Stewart, their evidence suggests that earnings dominate EVA
in total value of the firm.
With this evidence in light, we notice that realized earnings are a more useful
predictor of future EVA than realized EVA itself. The study goes onto explain that the
key difference between earnings and residual income is the cost of equity capital, and the
key difference between residual income and EVA are the accounting adjustments made.
“Earnings could dominate EVA if Stern Stewart’s accounting adjustments have the effect
of ‘undoing’ discretionary accruals that market participants use to infer firms’ future
prospects.” The study goes on to conclude, “Alternatively, the market may make a set of
accounting adjustments different from those applied by Stern Stewart. Even if the market
adjustments are similar to Stern Stewart’s, they may contain little news. If earnings
already conveys essential economic news (e.g., unexpected revenues and costs) – and the
market provides its own cost of capital estimate, there may be little left to glean from
EVA and residual income.”
10
Overall, evidence is mixed when interpreting whether EVA better explains stock
returns and firm values than GAAP accounting metrics. There are many reasons why
EVA does not dominate earnings in association with stock returns and firm value. First,
the valuation method used in the study was specified in terms of discounted future EVA –
not including past or current realizations. It is also possible that for the time period in
which the study was conducted, the market had yet to realize critical information
contained in EVA and residual income numbers, meaning certain stocks may have been
mispriced.
EVA Measurement Challenges & Implementation
Firms often run into challenges when implementing EVA throughout the
organization. There are two primary issues when it comes to implementation: first, a
firm’s profits may have to be adjusted to provide the best economic measure of a profit.
Second, EVA should, in theory, be based on the market value of assets in place, which
may also require adjustments to a firm’s Balance Sheet. The following documentation
provides detailed documentation of these adjustments (Desai, M.A., 2006).
Under existing accounting standards, not all assets and liabilities are placed on the
balance sheet. For example, under U.S. GAAP, specific types of leases only affect the
income statement because under terms of the contract the leased assets cannot be viewed
as being “owned” by the firm (Desai, M.A., 2006). However, according to those firms
that employ EVA, the leased asset is effectively part of the capital employed by the firm
and should be taken into account for performance evaluation. In addition, various long-
term investments, such as research and development, do not fit the accounting definition
of an asset.
11
U.S. GAAP generally requires research and development, as well as advertising
and marketing costs, to be expensed when they are incurred, rather than capitalized and
amortized over the expected useful life. Prior to 1975, corporations in the U.S. were able
to capitalize certain expenditures such as R&D. Accounting rule Statement of Financial
Accounting Standards 2 (SFAS), requires that all R&D be expensed in the period
incurred. The rational behind this is the belief that, “the benefits are uncertain, and occur
only when the research leads to a commercial product.” Thus, these capital investments
are riskier and qualify for expensing since they have no liquidation value and future cash
flows are uncertain (SFAS).
However, in order to better reflect economic reality, EVA proponents advise
capitalizing all research and development expenditures, including those other
expenditures with long-term benefits, such as creation of new products which create
value, and amortizing these costs over their expected life. Ultimately, this gives a much
more accurate allocation between the costs and benefits of an investment. The idea is that
this type of adjustment helps management to hone in on more effective long-term
business objectives instead of focusing on short-term results. It also holds management
more accountable for their decisions when deciding to account for expenses, such as
research and development, as an asset on the balance sheet.
The second issue has to do with current assets in place that are generally reported
at historical cost. Under EVA, “to represent true economic profit, the estimate of capital
employed should reflect the market value of assets in place, not their book value. This is
because investors bear an opportunity cost in allowing a firms’ assets to be dedicated to
operating the business” (Ivanov, 2014),

12
Even after assets are measured based on market value and distortions are
removed, a fundamental conceptual problem remains. The problem stems from investors
expecting return on total market value of their investment. They expect a return on both
value of assets in place and the value of future growth (Burksaitiene, 2009). EVA only
measures a firm’s ability to deliver a return on the assets in place. This means that a
positive EVA may not guarantee that investors are obtaining a fair return on the total
market value of the investment. Since EVA does not provide information about future
growth of a project or the company in its entirety, investors with equity in the business
argue that EVA based valuation of the company may be lower than what it really should
be.
Another weakness of EVA can be the complexity of the implementation. Because
public companies cannot depart from U.S. GAAP when reporting to shareholders and
debtholders, companies who employ EVA must have operating systems that can record
transactions under GAAP reporting standards as well as internal corporate EVA
reporting. Maintaining dual recording systems can come at an unwanted, steep cost
(Shiely, 2014).
As Shiely explained, many proponents recommend using a maximum of 5 to 15
adjustments. They should be chosen based on their materiality, incentive effects and ease
of communication. Those who are implementing EVA into their organization must
understand that the computation in each industry will be individually unique, and an in-
depth knowledge of economics of the business is strategic to a successful
implementation.

13
Implementing EVA In An Organization
Many EVA experts argue that organizations benefit more from the use of EVA
when it is completely implemented in an organization – including everything from
evaluating and rewarding performance at a divisional level and for non-executive
employees (Shiely, 2014). In massive, multi-divisional organizations, performance of a
single business unit or lower-level managers has a low likelihood of affecting the
organizations stock price directly. After all, the simple goal of increasing the stock price
does not provide much structure in how day-to-day operations are run (Athanassakos,
2007). EVA is a strategic operating performance measure that gives all employees a
sense of direction, while, in theory, preserving and creating shareholder and firm value.
Specifically, EVA can identify “financial value drivers.” These drivers include financial
ratios such as asset turnover, and profit margin, and can be paired with non-EVA
indicators such as customer satisfaction (Zimmerman, 2010).
Implementing EVA at a divisional level involves much thought and organization.
When implementing EVA, according to J.L. Zimmerman in his article “EVA and
Divisional Performance Measurement: Capturing Synergies and Other Issues” published
in the Journal of Applied Corporate Finance, the key issues are:
1) Defining overhead allocations in the presence of shared facilities
2) Setting transfer prices for intercompany transactions and
3) Ensuring that the performance metric is aligned with the decision rights allocated
to the unit
First, divisional performance measures must break down the company’s performance
into separate divisions. Most companies will break down profit according to divisions, if
14
they have them. When the EVA system breaks down and allocates costs by division, they
effectively operate as separate entities. This prevents managers from using a company-
wide performance measure(s) so that they do not “free-ride” on the performance of other
divisions (Zimmerman, 2010). Second, the transfer price is essentially the forgone profits
or opportunity cost of the resource in its next, more opportune use. By rewarding
managers at a divisional level, they have greater incentive to improve divisional
performance.
Proponents claim that these implementation issues are not unique to EVA, rather all
large firms experience these issues to a certain extent regardless of what performance
metrics they utilize. The following are four solutions that Zimmerman offers to those
issues posed by the implementation of EVA (Zimmerman, 2010):
1) Implement activity based costing as a way to improve overhead costs and asset
allocations
2) Link a portion of the EVA bonus for a given division to the performance of the
divisions it interacts with
3) Group together EVA divisions with significant interactions and measure
performance at the group level, and
4) Evaluate and reward performance based on EVA value drivers as mentioned
above, rather than on EVA alone.
It is important to understand, however, that these solutions have pros and cons and
can be costly to implement. For example, breaking down EVA performance based on
divisional performance may lead to “behavior that, while increasing divisional profits,
reduces performance and value of the entire company” (Zimmerman, 2010). Clearly,
15
though, breaking down companies by division and creating separate targets for incentives
across the divisions will make managers more aware of their duties and will aid in their
attention to their portion of the company.
Lastly, EVA goes one step further than being a measuring tool. The EVA-based
managerial bonus plan awards a target bonus for meeting and exceeding expectations
(Desai, M.A., 2006). Expectations can consist of various metrics or even share price. The
amount of the bonus that can be earned is capped. The cap controls the cost of the bonus.
Once the target is achieved, there is no further incentive to increase performance above a
certain level (Desai, M.A., 2006). A bonus bank is then created in order to account for
targets that are both achieved and not met. With this bank, portions of bonuses are paid
out over multiple years if exceeding the target (Quigg, 2014). This means that managers
must sustain these results over a longer period and deters short-term decision-making.
When targets are not met, the bonus bank will decline (Desai, M.A., 2006). It will not
cease to exist if the target or targets were met in prior years. Ultimately, this helps in
retention of managers’ as bonuses will continue even if there are a couple of bad annual
results.
There are issues that can stem from implementing the EVA bonus system in an
organization. The main issue is the complexity of the plan. According to Robert Ferguson
and Dean Leistikow’s article, “Search for the Best Financial Performance Measure:
Basics are Better” published in the Financial Analysts Journal, the EVA bonus plan
requires much communication and training for both managers and subordinates. Usually
organizations that adopt EVA gradually implement it throughout their organization, and
limit it initially to senior management and then let it trickle down to lower level

16
managers. A technical issue concerns the setting of targets at the divisional level, where a
firm’s stock price is not available. The targets can be incorrectly allocated throughout the
firm and significant tension can arise in the organization because of this. To combat this
technical issue, Ferguson and Leistikow suggest estimating the market value of each
division separately based upon market values of publically traded firms, which are
comparable. From there, targets can be allocated separately relative to the market value
of each division.
Common Challenges
EVA is much more than an accounting measuring tool. It reaches all the way
down to every day management decision making and is a crucial guide how an
organization functions. Former President and CEO of Briggs & Stratton, and champion of
EVA implementation at the corporation, John Shiely aided me with some insight into this
implementation. Shiely served as chairman and CEO from January 2003 and held the
position of president until September 2008. As discussed in the introduction, Shiely was
part of the new management team that came in and implemented EVA throughout the
organization. The former CEO started with Briggs in 1986 as general counsel and later
held positions of executive vice president of administration before becoming president
and CEO in 2001. Shiely’s expertise in accounting stemmed from his days at Arthur
Andersen as a senior tax accountant before moving on as an associate lawyer with
Hughers Hubbard & Reed law firm (Driving, 2009).
Under Shiely’s tenure, he helped implement EVA throughout the organization
and increased the company’s stock price from a little over $17/share to just over $44/per
share as CEO (Driving, 2009). Like many companies that have implemented EVA in the

17
past or have considered it, Shiely believed that there was a better way to measure the
value of an organization and also encouraged employees to maximize return on invested
capital.
Shiely was asked why all companies do not implement EVA. His response:
“Because it’s hard.” He went on to explain, “In many cases, regulators are working
against you. Institutionalized employees and the union can work against you. In some
cases, even financial people who are totally committed to GAAP are working against
you.” Ultimately, if employees don’t buy into the EVA system and compensation plans,
people will not allocate capital in accordance with the highest possible return. An
example he provided involved employees in a plant who requested new computers. When
asked by management why new computers were needed, they responded that their current
ones were outdated and ran slower than the newest models. Since the manufacturing
facility employees failed to prove that new computers could add value, their request was
denied. Had employees been able to prove that new hardware would increase efficiency
or cut costs, giving the project a greater return than the overall cost, they would’ve had a
better chance at obtaining their desired equipment.
Shiely also spoke about the importance of a compensation plan paired with using
the EVA system. “The only way to get management on board is if you provide them
incentives. If someone wants you to work harder and look more closely at how you spend
the company’s money, they’re going to have to compensate you for it. If they don’t, the
company runs the risk of employees not adhering to EVA policies.” Shiely spoke about
companies like Coca-Cola, who only implemented EVA in certain portions of the
corporation. Some levels of the organization were making as many as 15 adjustments. It

18
wasn’t until 1995, when the entire company began implementing the system, and the
calculation was greatly simplified. From that point on, “only a few adjustments were
made to remove items over which managers had no control.”
Results
Implementing EVA, in itself, is clearly a challenge. More than half of the battle
rests in convincing other managers, the board, and lower level employees that EVA
works (Shiely, 2014). Additionally, determining the performance targets, incentive/bonus
plan packages, and adjustments can be difficult and time-consuming. Companies that
only go through the motions or make increasingly complex adjustments, such as Coca-
Cola prior to 1995, will not see positive outcomes from implementing EVA. It is not easy
to use it as a measuring tool if done well as well as making it an ideology of all
managers. Even companies, like Briggs & Stratton, that fully implemented EVA will go
through some growing pains during implementation. When managers are used to hearing
“yes” when they ask for new capital such as more up-to-date technology for lower level
employees, getting the response of “no” can be quite a shock.
Ultimately, full EVA implementation forces managers to think about how much
new capital invested is needed to increase the bottom line. At Briggs & Stratton,
managers recognized that its return on capital was declining. With operational changes
and the adoption of EVA, the firm then created a benchmark for equipment purchases,
supplier arrangements, quality initiatives and process improvements. Additionally, EVA
aided Coca-Cola in identifying businesses that failed to meet their cost of capital. Quaker
Oats utilized EVA to account for large dollar amounts tied up in finished goods and
packaging materials, while Morrison Restaurants used EVA to focus on how they
19
manage receivables. Dow Chemical has used EVA to understand what it cost to run its
businesses and return a positive economic profit.
EVA Based Incentives & Performance
A key piece of implementing EVA throughout an organization is providing
incentives for management. A typical bonus plan uses performance measurements based
on financial milestones or individual characteristics. It is most common for bonuses to
only be paid out at the executive levels, with quantifiable elements that include financial
performance such as sales growth, EPS growth and return on capital, to name a few
(Quigg, 2014). Bonuses are usually delivered in cash on an annual basis. Some
companies will pay portion of the bonus in the form of company stock, as well.
Incentives, if done right, guide management decision-making. They effectively
provide “motivation” to management to get their decision-making in line with the key
figures that increases EVA value (Shiely, 2014). The EVA bonus-plan attempts to
balance a number of objectives. G. Bennett Stewart III outlines these objectives in a 1995
Fortune article titled, “EVA Works – But Not If You Make These Common Mistakes”.
The objectives he mentions are aligning the interests of managers and owners, providing
managers with enough incentive (leverage), limiting retention risk, and limiting
shareholder costs associated with the compensation plan. Before delving into what an
EVA bonus plan looks like, it is important to understand a basic, conventional bonus
plan.
With a typical bonus plan, a bonus is paid upon the successful achievement of a
performance target. This target usually has a limit on the upside, often referred to as a
cap, and a downside, referred to as a floor. The purpose of a floor is to avoid a “negative”
20
bonus. A floor greatly reduces retention risk, while a cap’s purpose is to suppress
shareholder cost (Desai, M.A., 2006). The cap becomes important when managers hit
their target performance, yet the stock price is not doing well. In shareholders’ eyes,
managers should only be compensated to a certain extent when the stock price of a
corporation is underperforming.
The conventional bonus plan has its limitations, however. To begin, caps and
floors limit overall performance (Quigg, 2014). Caps reduce incentive when there is
exceptional performance and likewise with floors when limiting penalizing managers for
mediocre or sub-par performance. Second, thresholds along with targets incentivize
managers to short-term game the bonus system. For example, if managers are greatly
exceeding the cap, they have an incentive to defer any additional opportunity for profit
until the following period. They simply aren’t rewarded for it and may have a tougher
time reaching the target next period if the target is raised. Again, managers will have an
incentive to report even lower performance with a floor, since they won’t be penalized
past the floor for it. If they report low enough performance, they may even be rewarded
through lower targets in subsequent periods.
In contrast to a conventional bonus plan, the EVA bonus-plan attempts to mitigate
the faults described above in a conventional bonus plan. EVA proponents advise
eliminating caps and floors. They also recommend using targets just like a conventional
bonus plan, except it should not be linked with the budget negotiation process and the
target should also not be reset on a yearly basis based on prior years’ performance.
Essentially, the goal of an EVA bonus plan is to closely align its features with that of
equity-based compensation. Equity based compensation is the same exact type of
21
compensation a shareholder is either rewarded or penalized with. There is unlimited
upside and downside on incentives. This bonus plan has extremely high correlation with
shareholder value, and essentially eliminates the distortions that are built in with basic
bonus plans.
While EVA attempts to align employee compensation with investor returns, in
practice it can place too much risk on employees. In turn, this can result in heightened
retention problems. An example given in the Harvard Business Review of Understanding
Economic Value Added, a recent EVA adopter, Eli Lilly & Co. stated in its 2003 annual
report that, “after two successive years without paying cash bonuses, the company
decided to grant one-time discretionary bonuses to ‘maintain the overall competitiveness
of our compensation programs to attract, retain, and motivate management and technical
talent’” (Eli Lilly and Company, 2003 Annual Report). To try and offset this issue,
companies can calibrate performance targets to reduce the likelihood of a zero payout
bonus. A second problem arises from the very fact that EVA tries to maximize
improvement in a given period. When bonuses are linked to multi-year performance
targets, managers are conflicted with how to allocate their performance. The overall goal
is to maximize EVA, or the present value of future EVAs. This contrasts with behavior
that would be consistent with overall shareholder value creation for the long run, not just
the present day. To reduce managers’ incentives to focus on current period performance
at the expense of future performance, EVA advocators attempt to combat this problem by
using what’s known as the “bonus bank system” (Desai, M.A., 2006). The very basic idea
of the bonus bank system is that managers receive part of the bonus earned during the

22
current period, while the rest of the bonus is deferred to later years. The deferral is only
paid out if the performance is sustained.
Managerial Decision-Making Empirical Studies
In a paper from the Journal of Accounting & Economics titled “Adopting
Residual-Income-Based Compensation Plans: Do You Get What You Pay For?” by
James Wallace, he examines what preconditions in a company (bonus incentives) create
wealth for shareholders and how managers change their operating, investing and
financing decisions in response to EVA and residual income incentives.
Evidence suggests that the that pre-existing incentives do not necessarily prove
that EVA or residual income create shareholder wealth, but it does provide the
meaningful first step by demonstrating EVA based compensation plans are effective in
altering management decision-making. The study investigates two questions by
comparing forty firms that adopted EVA income-based compensation plans to forty other
firms (controls) that adopted EVA, but didn’t implement compensation schemes.
The first questions asks whether asset turnover increased for firms adopting EVA
income-based compensation plans relative to non-adopters of compensation schemes.
Total asset turnover increased by an average of 14 percent for firms that adopted EVA
income-based compensation plans relative to those control firms. Investing decisions that
would also increase EVA suggests that management attempts to shift capital away from
activities that earn less than their cost of capital towards investments that earn more. The
compensation plan increases awareness of the high hurdle rate for investments.
The next questions addressed asset disposition and asset acquisition and whether
or not they increase or decrease with adoption of income-based incentive plans. The

23
study observed increased asset divestitures and decreased new investments for those that
adopted EVA income-based compensation plans. Asset dispositions increased an
astounding 100 percent and new acquisitions decreased 21 percent after the income-based
adoption compared to those control firms. In fact, the income-based firms were investing
more relative to the control firms before the adoption period. The interpretation of this
can be somewhat difficult to understand. The study cannot distinguish whether or not
managers are reducing positive net present value (NPV) projects or just slashing those
projects that earn below their cost of capital. However, critics of EVA based
compensation plans claim that the incentives only provides management an excuse to
under invest in positive NPV projects. Proponents of EVA income-based incentives claim
otherwise.
Conclusion
It’s quite clear that the EVA based compensation system alters decision-making
for the majority of managers. Whether the bonus system actually increases EVA as well
as shareholder value is still up for debate, but from the empirical study it is clear that
managers will make decisions based on their compensation plans.
Ultimately, the evidence indicates that compensation plans do not directly
correlate to increases in EVA or shareholder profitability. The compensation plan is one
of the board’s primary means of influencing manager’s decision making in ways that they
only hope will positively impact EVA and firm value. If EVA is implemented throughout
a corporation, a bonus plan ought to be interconnected so as to make sure that all
management is on board with the corporation’s objectives.
24
As I have further thought about these results, I continue to ponder a critical point,
which may greatly impact this study, as well as all of the studies looked at in regards to
EVA performance. The question that remains in my mind is as follows: are companies
that implement EVA doing this as a means to solve already occurring financial instability
within the organization? To put it simply – is an EVA system born into a company as a
viable form of increasing value from the get-go, or are troubled companies making a last
ditch effort, trying almost anything in the book, to increase shareholder earnings? The
“poster child” of this thesis, as well as many other EVA studies, has included Briggs &
Stratton. It may have worked very well at their organization because their problem was
exactly what EVA intends to address – inefficiencies in allocation of capital and poor
management decision making when it comes to this allocation. As for the other
companies that implemented EVA in their organization, that question remains to be seen.
Throughout all of the research articles gathered, there is a failure to mention exactly why
EVA was implemented in the first place. So, for a company that has many underlying
issues, such as failures in sales, collecting on accounts receivables, etc. – none of which
having to do allocation of income – EVA will not solve those problems, let alone increase
value in the organization. In fact, it may even expose a lesser value in the organization,
depending on the overall health of the company.
EVA in 2015
The reality of EVA being implemented in publicly traded company in 2015 is
bleak. Corporate fraud such as the Enron scandal as well as the Bernie Madoff ponzie
scheme has forced the SEC and FASB to come down hard on reporting principles for
publically traded companies. Making “adjustments” to GAAP is difficult, if not

25
impossible for many companies. However, the idea of economic value added, is
something that all managers ought to keep in mind.
Although the empirical evidence on the value of EVA is mixed, we should take
away what EVA has shown to accomplish. The implementation of EVA throughout a
company’s organization has clearly been shown to affect managerial decision-making.
When adjustments are identified, targets are set, and bonus plans are in place, managers
will most definitely adopt to the EVA strategy. When a strategy is in place and managers
adhere to it, there is a good chance that the allocation of capital is efficient, as seen in the
direct case of Briggs & Stratton. Whether allocation of capital will solve corporate
problems and increase income will always remain to be seen, and only a case by case
basis of individual companies can truly explain why or why not EVA correlates to an
increase in corporate value.
26
LIST OF REFERENCES
Athanassakos, G. (2007). Value-based management, EVA and stock price performance in
Canada. Management Decision, 45(9), 1397-1411.
doi:10.1108/00251740710828663
Burksaitiene, D. (2009). MEASUREMENT OF VALUE CREATION: ECONOMIC
VALUE ADDED AND NET PRESENT VALUE. Economics & Management.
Desai, M. A., & Ferri, F. (2006). Understanding Economic Value Added. Harvard
Business Review, 9(206), 016th ser.
Driving Ongoing Profitability With EVA at Briggs and Stratton - Financial and
Investment Advisor | Investment Company. (n.d.). Retrieved from
http://valuealigned.com/driving-ongoing-profitability-eva-briggs-stratton/
Dunbar, K. (2013). Economic Value Added (EVA TM): A Thematic- Bibliography.
Journal of New Business Trends & Ideas, 11(1).
Economic value added and its alternatives. (2014, September 23). Retrieved from
http://www.accaglobal.com/us/en/student/acca-qual-student-journey/qual-
resource/acca-qualification/p4/technical-articles/economic-value-added.html
Fu, R., Leong, K., & Zaima, J. (2011, November 4). Negative EVA and Value. Retrieved
from
http%3A%2F%2Fdc380.4shared.com%2Fdoc%2Fao8ajGN9%2Fpreview.html
Ivanov, S., Leong, K., & Zaima, J. (2014). AN EMPIRICAL EXAMINATION OF
NEGATIVE ECONOMIC VALUE ADDED FIRMS. The International
Journal of Business and Finance Research, 8(1).

27
John Shiely & The Implementation of EVA [Interview by J. Shiely]. (2014, August 1).
Sand Bay, Wisconsin.
Leepsa, N., & Mishra, C. S. (2013). Wealth Creation Through Acquisitions. Decision,
40(3).
Lin, C., Wang, S., & Qiao, Z. (2013). Product Profitability Analysis Based on EVA and
ABC. International Journal of Business and Management, 8(12).
doi:10.5539/ijbm.v8n12p73
Quigg, B. (n.d.). PayScale and Cloud Compensation Software. Retrieved from
http://www.payscale.com/compensation-today/2011/06/bonus-plan
Rappaport, A. (1986). Creating shareholder value: The new standard for business
performance. New York: Free Press.
Shaked, I., Michael, A., & Leroy, P. (n.d.). Creating Value Through E.V.A.- Myth or
Reality? Retrieved from http://www.strategy-
business.com/article/12756?gko=05fdd
Shiely, J. (2010, February 25). EVA Presentation. Lecture presented in Harvard Law
School, Cambridge, Mass.
Sirbu, A. (2012). EVA Approach in Russia. Review of International Comparative
Management, 13(2).
Stern, J. M., Shiely, J. S., & Ross, I. (2001). The EVA challenge: Implementing value-
added change in an organization. New York: Wiley.
Thorndike, W. (2012). The outsiders: Eight unconventional CEOs and their radically
rational blueprint for success. Boston, MA: Harvard Business Review Press.