the effects of financial innovations on checkable deposits
TRANSCRIPT
John A. Tatom
John A. Tatom is an assistant vice president at the FederalReserve Bank of St. Louis. Kevin L. Kilesen provided researchassistance.
The Effects of FinancialInnovations on CheckableDeposits, Ml and M2
IL? URING THE EARLY 1980s, several newtypes of financial assets were authorized byCongress and included in the definitions ofvarious monetary aggregates. The principalnew accounts were NOW accounts, whichwere authorized nationwide in January 1981,and money-market deposit and super-NOW ac-counts, which became available in Uecember1982 and January 1983, respectively. Theirgrowth and inclusion in monetary aggregatesgave rise to increased uncertainty in explainingmovements in the monetary aggregates andquestions about the relationship of the mone-
1These uncertainties have been a continuing source of con-cern for the Federal Open Market Committee (FOMC).This concern has focused primarily on Ml - See Hafer(1986) and Nuetzel (1987) for discussions of uncertaintiesassociated with Ml. In 1981, when the authority to offerinterest-bearing checkable deposits was extended nation-wide, the FOMC announced targets for the old MI-typemeasure that excluded such new deposits and for anMl-type measure that added these so-called othercheckable deposits. See Tatom (1982) and Thornton(1982) for an analysis of the 1981 developments and theireffects on monetary policy; the latter article discusses theevolution of the current MI measure following the 1980redefinitions discussed in Hater (1980). ln 1983, the FOMCrefrained from targeting on Ml and indicated a greaterreliance on M2. See Hafer (1985) for a discussion of theeffects of 1983 innovations on policy deliberations.
Mascaro and Marlow (1989), Friedman (1988), Haraf(1986), Hetzel (1989), Hetzel and Mehra (1989), Judd andTrehan (1987), Judd, Motley and Trehan (1988), Keeleyand Zimmerman (1986), Kopcke (1987), Porter and Offen-bacher (1984), Mehra (1989), Roth (1987), Siegel (1986),Simpson (1984) and Wenninger (1986). In short, this viewis widespread. Earlier studies disputing these claims in-clude Cook and Rowe (1986), Gavin (1987), Hem (1982),Jordan (1984) and Tatom (1982, 1983a, 1983b). Thesestudies follow an earlier theoretical and empirical traditionwhich suggested the ineffectiveness of deposit rate regula-tions. This literature includes such works as Barro andSantomero (1972), Bradley and Jansen (1988), Cox (1986),Frodin and Startz (1982), Kareken (1967), Benjamin Klein(1970, 1974), Michael Klein (1974), Saving (1971, 1977,and 1979), Santomero (1974). Startz (1979) and Tatom(1971).
tary aggregates to various measures of econom-ic performance.1
The widely accepted view is that these finan-cial innovations have rendered Ml less useful,or even useless, as a monetary policy target.2
The related view—that the broader aggregateM2 has been unaffected by these innovationsand therefore remains a useful target—is almostas widely shared. While an apparent change inthe linkage between Ml and economic perfor-mance in the 1980s has buttressed the impres-sion that financial innovations distorted Ml and
2Some examples are: Hater (1984), Barnett (1982), Spindt(1985), Morris (l982), Ccx and Rosenblum (1989), Darby,
impaired its usefulness) few quantitative studieshave assessed the actual effects of financial in-novations on the monetary aggregates.
This paper first describes the financial innova-tions hypothesis that Ml, but not M2, has beensignificantly affected by the introduction andgrowth of these new assets. It then assesses thevalidity of this hypothesis by examining whetherthe turnover rate for checkable deposits, cur-rency preferences, and Ml and M2 demand(velocity) have been affected as the hypothesissuggests.’
%:.)~~:)~/)~,).,,
~ :t.’~ ./~t:Lt.f
Table 1 shows the components of Ml and M2in 1989. Ml consists of currency in the handsof the public, demand deposits, other checkabledeposits and travelers checks. Other checkabledeposits include accounts on which financial in-stitutions can make explicit interest payments.During the 1970s, a few states authorized in-terest-paying negotiable order of withdrawal(NOW) accounts. In 1978, checkable accountswith automatic transfer from interest-payingsavings accounts (ATS) were authorized by theFederal Reserve System.
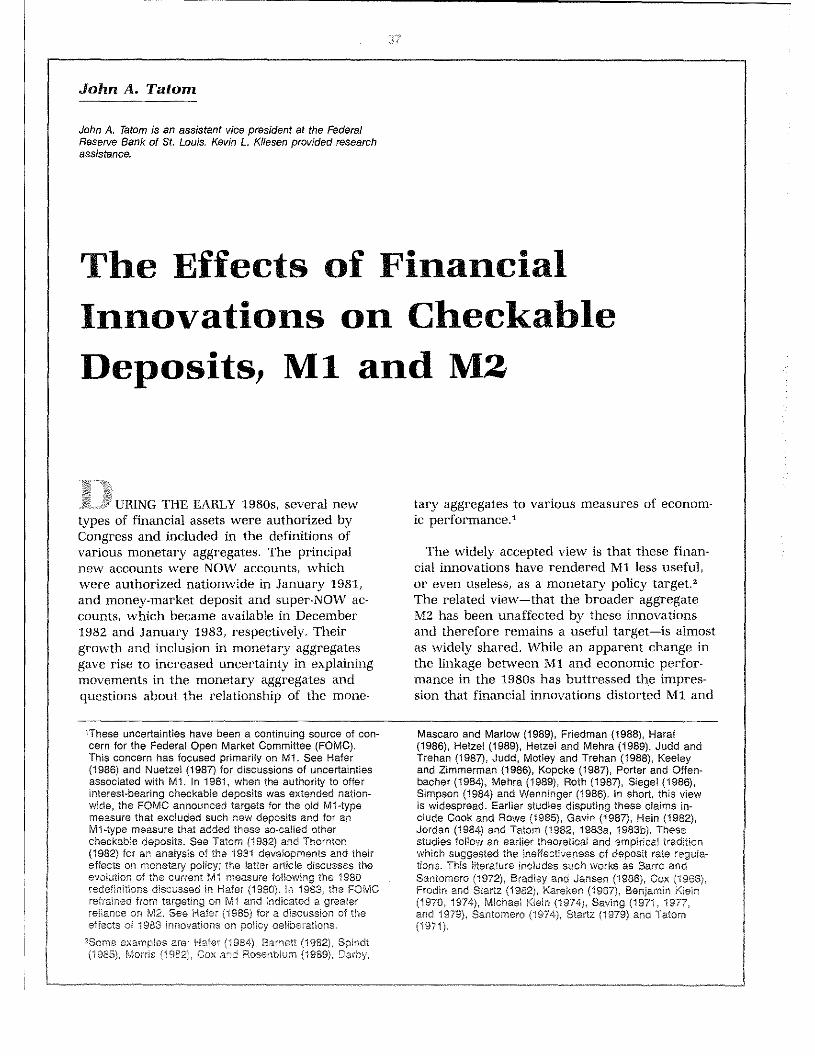
As figure 1 shows, the share of other check-able deposits in total checkable deposits (demandand other checkable deposits) rose from about10 percent in late 1980 to more than 25 percentby the end of 1981, the first year that nation-wide NOW accounts were authorized. This sharecontinued to rise, in part because of the intro-duction of super-NOW accounts (interest-bearingother checkable deposits with unregulated inter-est rates) in early 1983. By 1989, other check-able deposits had risen to $278.5 billion, nearlyhalf of total checkable deposits and about 36
percent of Ml.
M2 is the sum of Ml, saving and small timedeposits at all financial institutions, overnight(and continuing contract) repurchase agreementsissued by all commercial banks, overnight Eurodol-lars issued to U.S. residents by foreign branchesof U.S. banks and money market accounts (MM),
Table 1
Ml and M2 in 1989 (billions of dollars)
components Arnotint
currency S2~7.5Demand deposits 280.4Other cneckablo doposils 278 5T’avolers checxs 73
Ml 8783.7
Money market mutualfunds component S276 3
Money market aepcs’taccounl balances 475 0
SavingsSmall t,me 1105.5Overn:gn; Eurodollars’ and
repurchase agreements
M2 53.1295’
‘Geneal purpose and b~okor.deaIerfunds.‘Eurodollar aoposils issued to U S. residents by tore’qnoranches of U.S. oarlks.
3Componerts 00 -lot add 10 total because o’ round-ng.
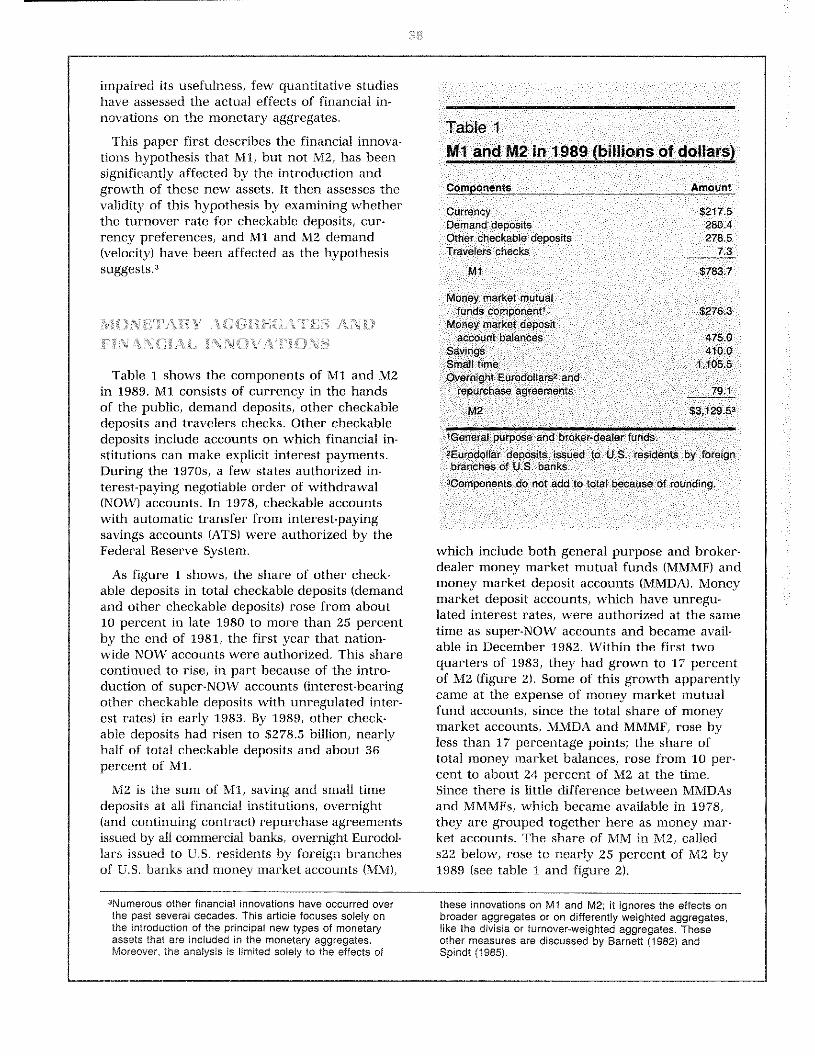
which include both general 1~tposeand broker-dealer money market mutual funds (MMMF) andmoney market deposit accounts (MMDA). Moneymarket deposit accounts, which have unregu-lated interest rates, were authorized at the sametime as supei-NOW accounts and became avail-able in December 1982. Within the first twoquarters of 1983, they had grown to 17 percentof M2 (figure 2). Some of this growth apparentlycame at the expense of money market mutualfund accounts, since the total share of moneymarket accounts, MMDA and MMMF, rose byless than 17 percentage points; the share oftotal money market balances, rose from 10 per-cent to about 24 percent of M2 at the time.Since there is little difference between MMDAsand MMMFs, which became available in 1978,they are grouped together here as money mar-ket accounts. The share of I~1Min M2, calleds22 below, rose to nearly 25 percent of M2 by1989 (see table 1 and figure 2).
‘Numerous other financial innovations have occurred overthe past several decades. This article focuses solely onthe introduction of the principal new types of monetaryassets that are included in the monetary aggregates.Moreover, the analysis is limited solely to the effects of
these innovations on Ml and M2; it ignores the effects onbroader aggregates or on differently weighted aggregates,like the divisia or turnover-weighted aggregates. Theseother measures are discussed by Barnett (1982) andSpindt (1985).
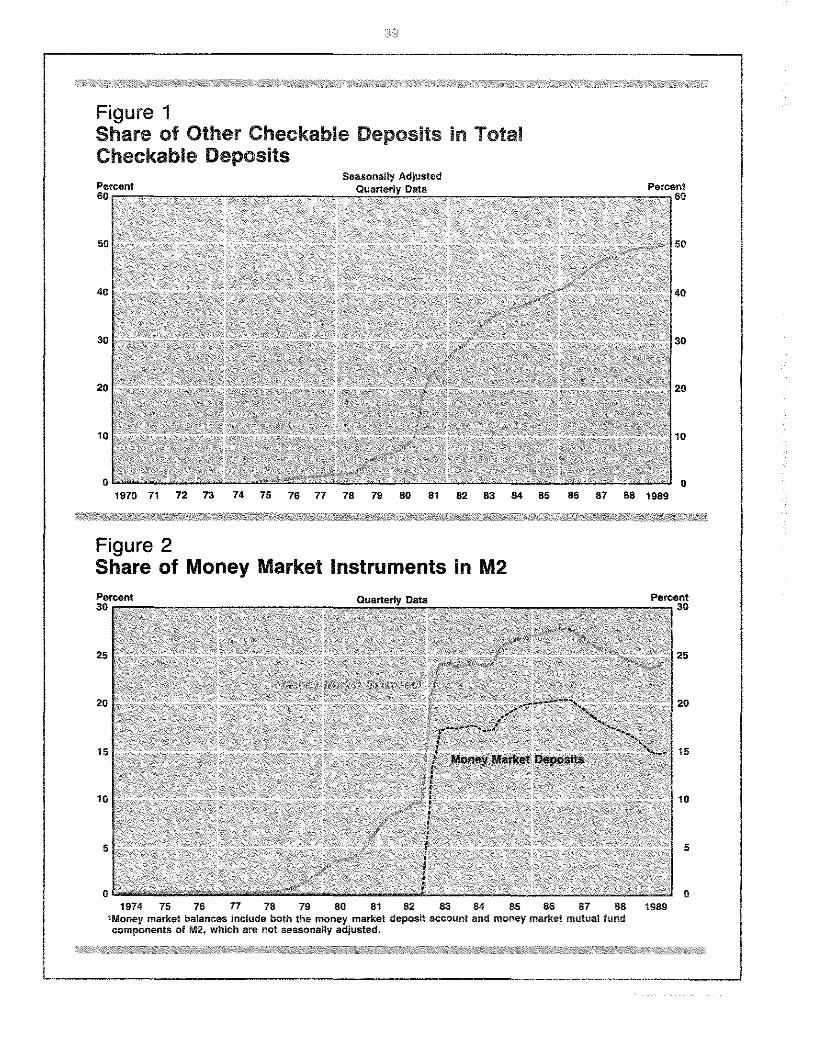
Figure 1Share of Other Checkable Deposfts ~nTotalCheckable Deposits
Seasonally Adjusted
50
40
30
20
10
0
Figure 2Share of Money Market Instruments in M2
25
20
15
10
5
01974 75 76 77 78 79 80 81 82 83 84 85 85 87 88
‘Money market balances include both the meney market depesit account and money market mutual fundcomponents of M2, which are not seasenally adjusted.
25
20
15
10
5
0
Percent60
1970 71 72 73 74 75 76 77 78 79 80 81 82 83 84 85 86 87 88 1989
Percent30
Percent30
1989
The financial innovations hypothesis describedhere focuses primarily on the effects of thegrowth of these new assets on Ml. According tothis hypothesis, the introduction of interest-bearing checking accounts made depositorsmore willing to hold savings balances in theirchecking instead of their savings accounts.Thus, the growth of other checkable deposits,especially nationwide NOW accounts in 1981and super-NOW accounts in 1983, was expectedto boost total checkable deposits and Ml andraise the interest elasticities of their demand&’
In addition, movements of funds from savingsto checkable deposits were expected to takeplace among components of M2, so that thetotal demand for M2 was unaffected by shifts toother checkable deposits. Similarly, the shift offunds into MMDAs was expected to flow fromother components of M2, especially MMMFs;thus, the expansion of MMDAs was not ex-pected to boost M2’ One implication of thishypothesis is that the growth of MMDAs, or ofMMMFs earlier, did not affect the demand forMl, its use or its coinposition.~If these assetsprovide transaction services that are substitutesfor total checkable deposits, however, thenshifts to these balances should reduce the de-mand for total checkable deposits relative tocurrency holdings, or raise the currency ratio.Such shifts would also reduce the overall de-mand for Ml. Whethet- money market innova-tions had any significant effects is also testedbelow.
The surge in the share of MMs in M2 in early1983 %vas associated with a sharp rise in M2
growth from a 9.1 percent rise in the fourquarters of 1982 to a 16.6 percent annual ratein the first half of 1983. While this movementran counter to the financial innovations hypo-thesis, many thought that it was transitory andcarried little implication for future economicperformance.~
In this article, the financial innovations hypo-thesis is tested by examining whether these newassets have influenced the use, composition ordemand for total checkable deposits, Mi andM2 as predicted. If total checkable deposits andMl are boosted by inflows of savings into othercheckable deposits, then the total checkabledeposit turnover rate—the ratio of debits ontotal checkable deposits to total checkable de-posits—should be inversely related to the shareof other checkable deposits in total checkabledeposits (Si = OCD/TCD). Similarly, the desiredratio of the currency component of Ml to thetotal checkable deposit component also shouldbe inversely related to si.8
When the effects of other checkable depositson Ml and M2 are investigated, the innovationsmeasures used are their ratios to Ml (sli =
OCD/M1) and to M2 (s12 OCD/M2), respectively.If Ml is increased by an inflow of savings intoother checkable deposits, then the demand forMl, given its other determinants, must be posi-tively related to si 1- According to the financialinnovations hypothesis, the impact of moneymarket balances, measured relative to Ml (s21 =
MM/MI), on Ml demand is zero. Similarly, if thehypothesis is correct, the demand for M2 should
4Rasche (1 988a) cites several studies which argue thatfinancial innovations lowered the interest elasticity ofmoney demand. More recent proponents of a financial in-novations effect argue for an increase in this elasticity.Rasche (1987, 1988a and l988b) has provided evidencefor a rise in the interest elasticity of Ml demand, but hedoes not link this to financial innovations. Friedman (1988),Moore, Porter and Small (1988), Carlson (1989), Mehra(19891 and Poole (1988~also have pointed to the rise inthe interest elasticity of Ml demand, although for differentreasons. The first four studies suggest that this effectarose from financial innovations, while Poole suggests thatit is not a recent development; instead, only its recognitionis recent.
5See Thornton (1983). In late 1982, the FOMC anticipatedthat maturing all-savers certificates and the impending in-troduction of MMDAS would temporarily boost Ml and, toa iesser extent, M2. The FOMC decided in October 1982to set no short-run objective for MI, but to place greater
weight on M2. There was no indication that M2 would riserelative to Ml, especially by as much as it did.
6Some analysts, however, point to the similarities betweensuper-NOW and money market accounts; the latter offerlimited checking services and unregulated interest rates.They suggest that money market balances are closesubstitutes for Ml. See Cox and Flosenblum (1989) andMotley (1988), for example.
7For example, the FOMC’s initial target range for M2 an-nounced in February 1983 called for M2 growth in the7-to-lO-percent range from the February-March average tothe fourth quarter of 1983. This range was viewed as com-parable to the 1982 range of 6 to 9 percent, allowing for afurther boost to M2 due to new MMDAs. Hafer (1985)discusses these developments and their effects on theFOMC deliberations in detail.
5The appendix to this article presents a more formal discus-sion of the tests of the effects of financial innovations,
41
be unrelated both to other checkable deposits,measured by s12, and to money market bal-ances, measured by s22.
Testing ‘01’ a Sh.i/’t I the .hiterestBate Blast jeit
The effect of other checkable deposits on theinterest elasticity of each relationship also is ex-amined. The financial innovations hypothesis in-dicates that the weighted average cost of holdSing total checkable deposits and Mi and the in-terest elasticity of various monetary linkages arefunctions of the relative size of other checkabledeposit balances. The implication is that therelevant interest elasticity rose, on average, afterthe introduction of other checkable deposits.Under the financial innovations hypothesis, therise in the interest elasticity is a function of si,the relative size of other checkable deposits.Thus, if /3, is the interest elasticity before theintroduction of other checkable deposits (that is,when si is zero), then following this innovationthe interest elasticity becomes /3* =J3~+j3,si.
In the log-linear relationships estimated below,the interest elasticity foliowing the advent ofother checkable deposits is found from the /3coefficients in the expression: fi~Ini + j31(sl InO;the interest elasticity is /3~plus /3 weighted(multiplied) by the average value of si. In afirst-difference equation, the appropriate expres-sion is: /3~Alni + /3, A(sl Ini). Whether the in-terest elasticity has increased as a result of thisfinancial innovation is indicated by the sign andstatistical significance of ~
In summary, in this study the financial in-novations hypothesis is rejected if: (1) measuresof other checkable deposit innovations have nosignificant effect on the Mi-related variablesand their interest elasticities, (2) these samemeasures have a significant effect on the size orinterest elasticity of M2 demand, or (3) mea-sures of money market innovations have anysignificant effect on the use, composition or de-mand for Mi or the demand for M2. These re-lationships are examined below.
•FII’JANC1AL INNoVATIONS. ‘INI)
THE DEPOSIT TURNOVER. RATE
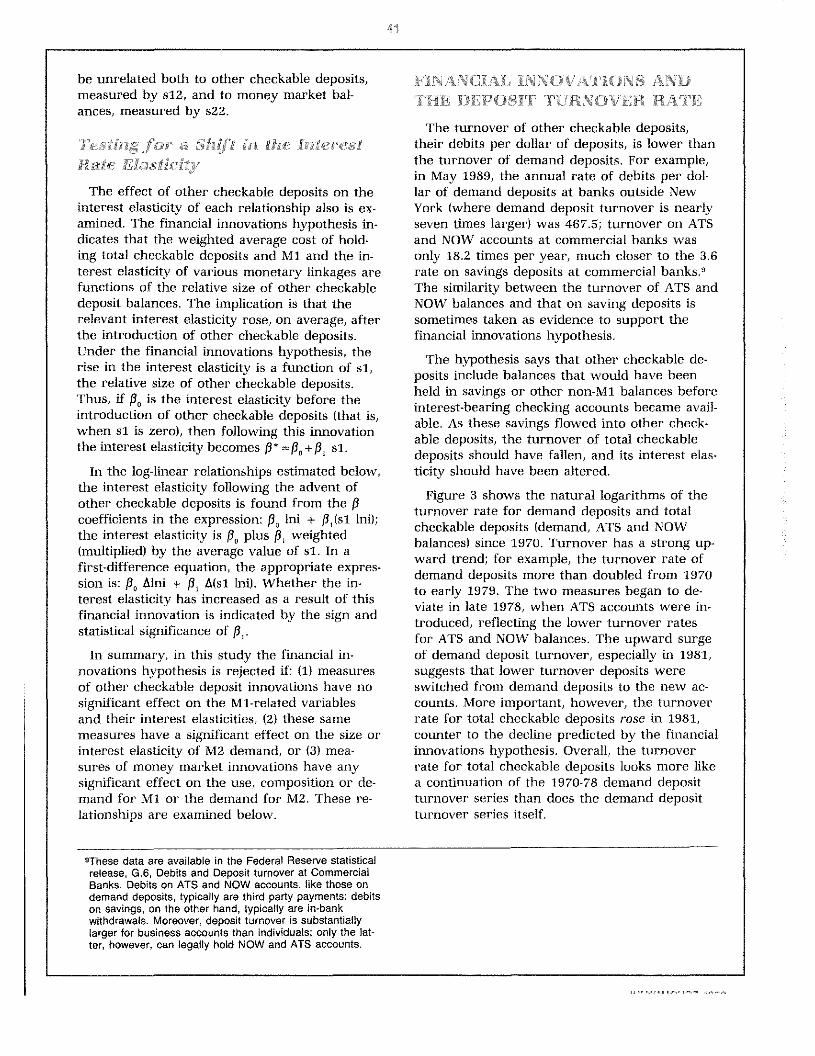
The turnover of other checkable deposits,their debits per dollar of deposits, is lower thanthe turnover of demand deposits. For example,in May 1989, the annual rate of debits per dol-lar of demand deposits at banks outside NewYork (where demand deposit turnover is nearlyseven times larger) was 467.5; turnover on ATSand NOW accounts at commercial banks wasonly 18.2 times per year, much closer to the 3.6rate on savings deposits at commercial banks.9
The similarity between the turnover of ATS andNOW balances and that on saving deposits issometimes taken as evidence to support thefinancial innovations hypothesis.
The hypothesis says that other checkable de-posits include balances that would have beenheld in savings or other non-Mi balances beforeinterest-bearing checking accounts became avail-able. As these savings flowed into other check-able deposits, the turnover of total checkabledeposits should have fallen, and its interest elas~ticity should have been altered.
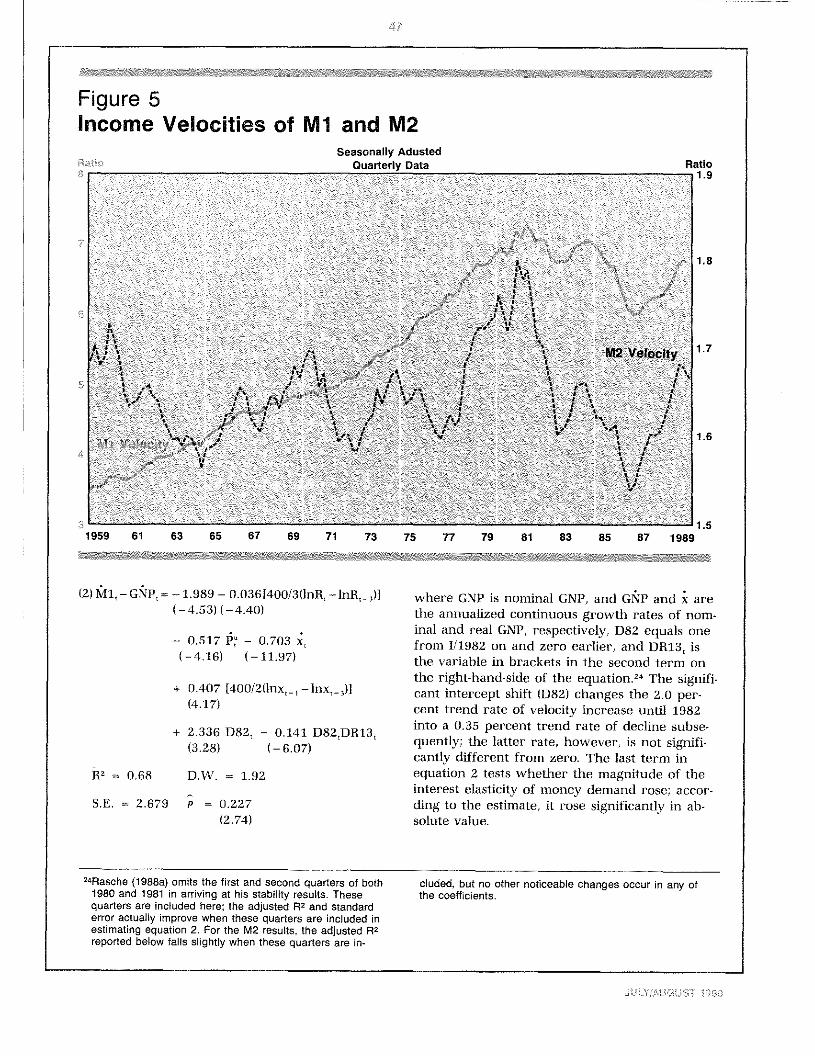
Figure 3 shows the natural logarithms of theturnover rate for demand deposits and totalcheckable deposits (demand, ATS and NOWbalances) since 1970. Turnover has a strong up-ward trend; for example, the turnover rate ofdemand deposits more than doubled from 1970to early 1979. The two measures began to de-viate in late 1978, when ATS accounts were in-troduced, reflecting the lower turnover ratesfor ATS and NOW balances. The upward surgeof demand deposit turnover, especially in 1981,suggests that lower turnover deposits wereswitched from demand deposits to the new ac-counts. More important, however, the turnoverrate for total checkable deposits rose in 1981,counter to the decline predicted by the financialinnovations hypothesis. Overall, the turnoverrate for total checkable deposits looks more likea continuation of the 1970-78 demand depositturnover series than does the demand depositturnover series itself.
~Thesedata are available in the Federal Reserve statisticalrelease, 0.6, Debits and Deposit turnover at CommercialBanks. Debits on ATS and NOW accounts, like those ondemand deposits, typically are third party payments; debitson savings, on the other hand, typically are in-bankwithdrawals, Moreover, deposit turnover is substantiallylarger for business accounts than individuals; only the lat-ter, however, can legally hold NOW and ATS accounts.
4)
Figure 3Demand Deposit and Total Checkable Deposit Turnover
Seasonally Adjusted
Logarithm
7.0
6.5
6.0
5.5
5.0
4.5
4.01970 71 72 73 74 75 76 77 78 79 80 81 82 83 84 85 86 87 88 1989
4.5
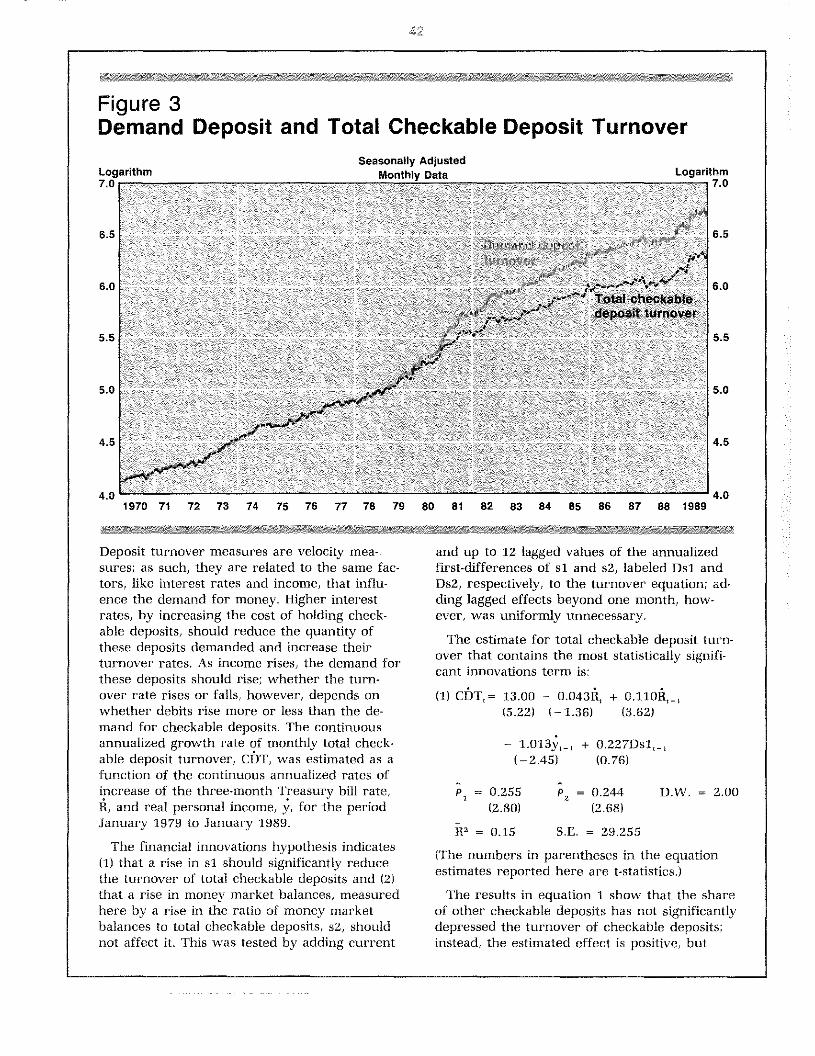
Deposit turnover measures are velocity mea-sures; as such, they are related to the same fac-tors, like interest rates and income, that influ-ence the demand for money. Higher interestrates, by increasing the cost of holding check-able deposits, should reduce the quantity ofthese deposits demanded and increase theirturnover rates. As income rises, the demand forthese deposits should rise; whether the turn-over rate rises or falls, however, depends onwhether debits rise more or less than the de-mand for checkable deposits. The continuousannualized growth rate of monthly total check-able deposit turnover, CDT, was estimated as afunction of the continuous annualized rates ofincrease of the three-month Treasury bill rate,H, and real personal income, y, for the periodJanuary 1979 to January 1989.
The financial innovations hypothesis indicates(1) that a rise in sl should significantly reducethe turnover of total checkable deposits and (2)that a rise in money market balances, measuredhere by a rise in the ratio of money marketbalances to total checkable deposits, s2, shouldnot affect it. This was tested by adding current
and up to 12 lagged values of the annualizedfirst~differencesof si and s2, labeled Dsl andDs2, respectively, to the turnover equation; ad-ding lagged effects beyond one month, how-ever, was uniformly unnecessary.
Tt’he estimate for total checkable deposit turn-over that contains the most statistically signifi-cant innovations term is:
(1) CDT,= 13.00 — 0.043R, + 0.1l0n,~,(5.22) (—1.36) (3.62)
— 1.013y,_ + 0.227Dsi,,(—2.45) (0.76)
= 0.255 p5
= 0.244 D.W. = 2.00(2.80) (2.68)
fl2 = 0.15 SE. = 29.255
(‘rhe numbers in parentheses in the equationestimates reported here are t-statistics.)
The results in equation 1 show that the shareof other checkable deposits has not significantlydepressed the turnover of checkable deposits;instead, the estimated effect is positive, but
Logarithm
7.0
6.5
6.0
5.0
4.0
43
statisticaliy insignificant.’°This result is counterto the financial innovations hypothesis.
If financial innovations increased the interestelasticity of total checkable deposits turnover,then the coefficients on the interest rate terms(H,, H,.,) in equation 1 should be related to si.To test whether these coefficients have increas-ed with the rise of the share of other checkabledeposits in total checkable deposits, the an-nualized change in the product (SI lnR) for thecurrent and past month are added to equation 1.The sum of these coefficients is positive, 0.03, butit provides no significant explanatory power tothe equation. The F-statistic for testing whetherthese coefficients are zero is F,,,,, = 0.04, wellbelow the critical value (5 percent) of 3.08.Thus, financial innovations, as defined here,have had no significant effect on the interestelasticity of total checkable deposit turnover.Again, this result is counter to the financial in-novations hypothesis.
I~INANCIAL INNOVATIONS BAlDpisIi~ CURRENCY-DEPOSH’ H .3rv’~•(
The currency ratio, the ratio of currency heldby the public to its total checkable deposits, is aprincipal determinant of the money multiplier(the ratio of a monetary aggregate to the ad-justed monetary base). Moreover, it is the prin-cipal channel through which financial innova-
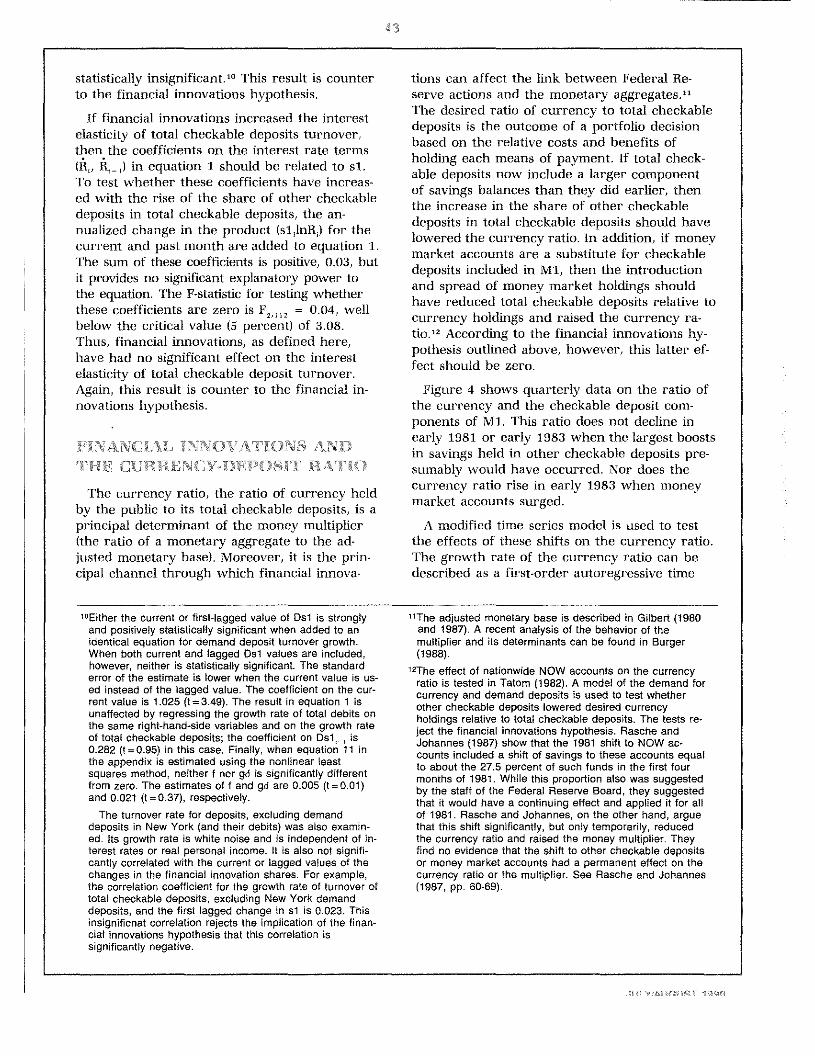
tions can affect the link between Federal He-serve actions and the monetary aggregates.”The desired ratio of currency to total checkabledeposits is the outcome of a portfolio decisionbased on the relative costs and benefits ofholding each means of payment. If total check-able deposits now include a larger componentof savings balances than they did earlier, thenthe increase in the share of other checkabledeposits in total checkable deposits should havelowered the currency ratio. In addition, if moneymarket accounts are a substitute for checkabledeposits included in Ml, then the introductionand spread of money market holdings shouldhave reduced total checkable deposits relative tocurrency holdings and raised the currency ra-tth.’~According to the financial innovations hy-pothesis outlined above, however, this latter ef-fect should be zero.
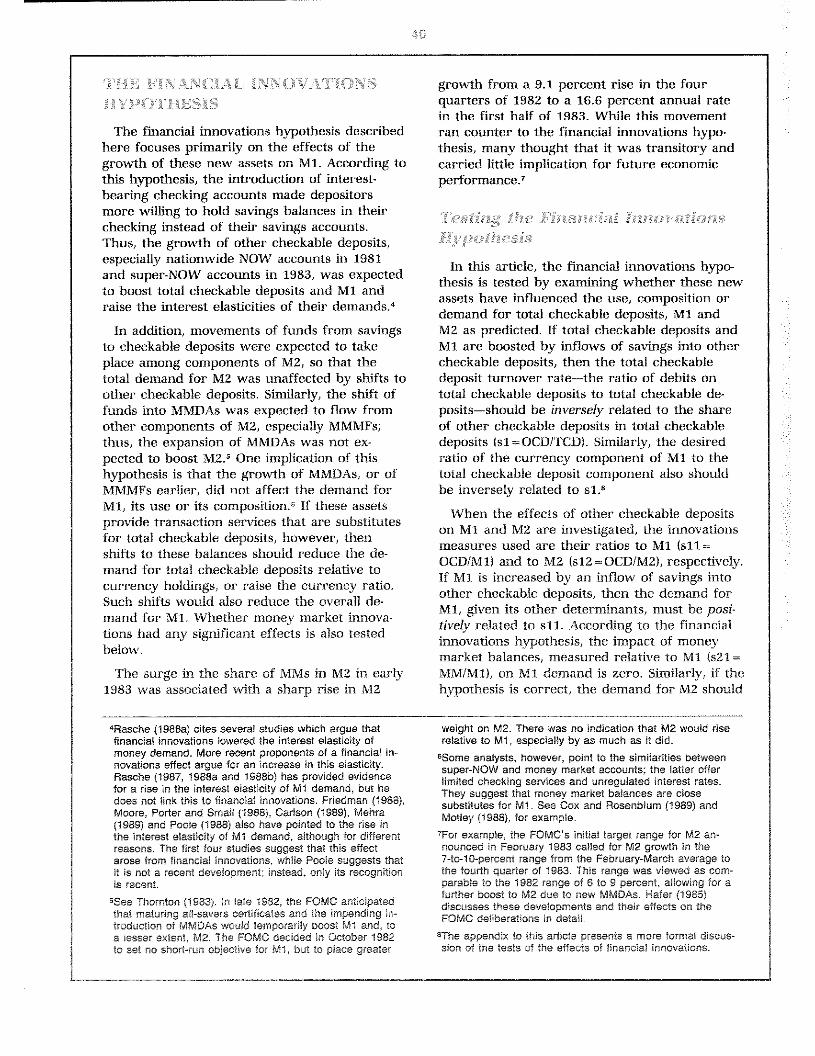
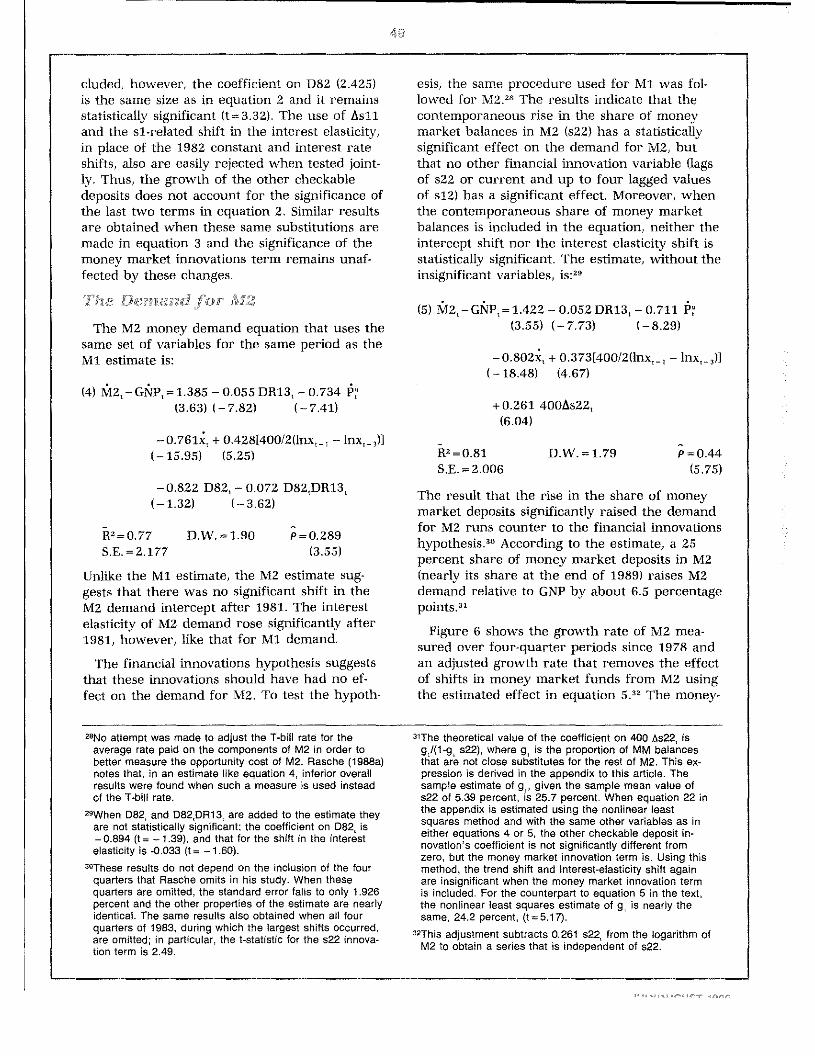
Figure 4 shows quarterly data on the ratio ofthe currency and the checkable deposit com-ponents of Ml - This ratio does not decline inearly 1981 or early 1983 when the largest boostsin savings held in other checkable deposits pre-sumably would have occurred. Nor does thecurrency ratio rise in early 1983 when moneymarket accounts surged.
A modified time series model is used to testthe effects of these shifts on the currency ratio.The growth rate of the currency ratio can bedescribed as a first-order autoregressive time
10Either the current or first-lagged value of Dsl is stronglyand positively statistically significant when added to anidentical equation for demand deposit turnover growth.When both current and lagged Dsl values are included,however, neither is statistically significant. The standarderror of the estimate is lower when the current value is us-ed instead of the lagged value. The coefficient on the cur-rent value is 1.025 (t=3.49). The result in equation 1 isunaffected by regressing the growth rate of total debits onthe same right-hand-side variables and on the growth rateof total checkable deposits; the coefficient on Dsl,, is0.282 (t=0.95) in this case. Finally, when equation 11 inthe appendix is estimated using the nonlinear leastsquares method, neither f nor gd is significantly differentfrom zero. The estimates off and gO are 0.005 (t’~0.0i)and 0.021 (t=0.37), respectively.The turnover rate for deposits, excluding demand
deposits in New York (and their debits) was also examin-ed, Its growth rate is white noise and is independent of in-terest rates or real personal income. It is also not signifi-cantly correlated with the current or lagged values of thechanges in the financial innovation shares. For example,the correlation coefficient for the growth rate of turnover oftotal checkable deposits, excluding New York demanddeposits, and the first lagged change in sl is 0.023. Thisinsignificnat correlation rejects the implication of the finan-cial innovations hypothesis that this correlation issignificantly negative.
11The adjusted monetary base is described in Gilbert (1980and 1987). A recent analysis of lhe behavior of themultiplier and its determinants can be found in Burger(1988).
l2The effect of nationwide NOW accounts on the currencyratio is tested in Tatom (1982). A model of the demand forcurrency and demand deposits is used to test whetherother checkable deposits lowered desired currencyholdings relative to total checkable deposits. The tests re-ject the financial innovations hypothesis. Rasche andJohannes (1987) show that the 1981 shift to NOW ac-counts included a shift of savings to these accounts equalto about the 27.5 percent of such funds in the first fourmonths of 1981. While this proportion also was suggestedby the staff of the Federal Reserve Board, they suggestedthat it would have a continuing effect and applied it for allof 1981. Rasche and Johannes, on the other hand, arguethat this shift significantly, but only temporarily, reducedthe currency ratio and raised the money multiplier. Theyfind no evidence that the shift to other checkable depositsor money market accounts had a permanent effect on thecurrency ratio or the multiplier. See Rasche and Johannes(1987, pp. 80-69).
1000
4-‘4
Figure 4Currency/Deposit Ratio’
Seasonally AdjustedQuarterly Data
40
35
30
25
201959 61 63 65 67 69 71 73 75 77 79 81 83 85 87 19891Ratio of Currency Component to Checkable Deposit Component of Ml
series process; two other factors also have hada major impact on the currency ratio over thepast 15 years and they are controlled for in thefollowing estimates.’3 The first factor is energyprices, which rose sharply in 1973-74 and in1979-81 and fell sharply in 1986. A rise in ener-gy prices raises expenditures that use currencyrelatively more than it raises expenditures thatrely more heavily on checkable deposits. Thus,the currency ratio rises when energy prices in~crease.’4 The second factor is the transitory ef-fect of the credit control program in 1980,which temporarily boosted currency demandrelative to checkable deposits in the second
quarter of the year. Credit limitations increasethe use of currency, especially in transactionsthat would otherwise be facilitated by retailcredit.’~Finally, the current and past quarter’sthree.month T-bill rates are included to examinethe interest rate elasticity of the currency ratio;longer lags for the interest rate variables arenot statistically significant.
The model of the currency ratio, k, estimatedfor the period 111/1959 to IV/1989 is shown inthe first column of table 2. The dependent vari-able, k,, is the annualized continuous rate ofgrowth of the currency ratio. The annualized
“Rasche and Johannes (1987) argue for the superiority of atime series model over a structural approach like that usedin Tatom (1982); the modifications here are made to in-clude the sizable known effects of the two energy priceshocks and to test whether the currency ratio’s interestelasticity was affected.
‘4Tatom (1985) provides evidence that money demand is af-fected by energy price increases. The currency-ratio effectmay arise, at least in part, through gasoline purchasesthat affect currency demand more than the demand for
checkable deposits. A related argument is that a changein the mix of personal consumption expenditures towardnondurable purchases raises the currency ratio. SeeDotsey (1988).
‘5The effect of the credit control program on the moneystock is discussed in Tatom (1982) and Hem (1982). Alsosee Wallace (1980) for an analysis of the effects of creditcontrols on currency demand.
Percent45
Percent45
4~ ,,corn,,r 04 nO
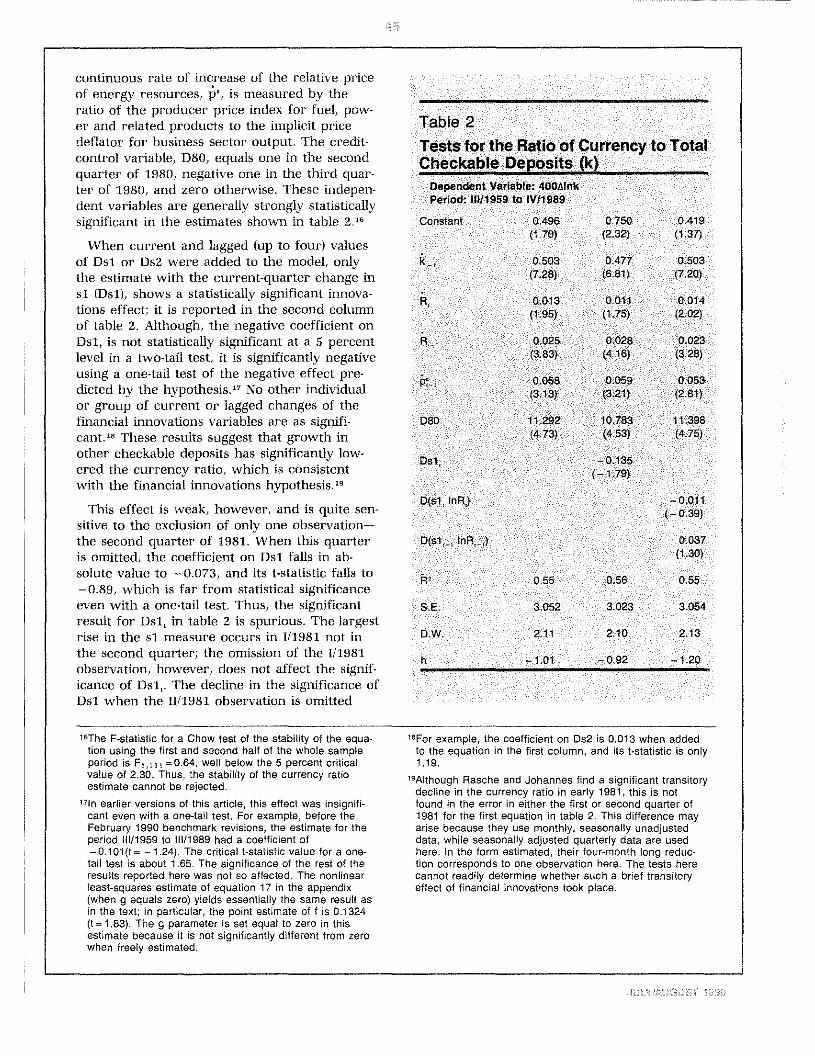
continuous rate of increase of the relative priceof energy resources, is’, is measured by theratio of the producer price index for fuel, pow-er and related products to the implicit pricedeflator for business sector output. The credit-control variable, D80, equals one in the secondquarter of 1980, negative one in the third quar-ter of 1980, and zero otherwise. These indepen-dent variables are generally strongly statisticallysignificant in the estimates shown in table 2.16
When current and lagged (up to four) valuesof Dsl or Ds2 were added to the model, onlythe estimate with the current-quarter change insI (Dsl), shows a statistically significant innova-tions effect; it is reported in the second columnof table 2. Although, the negative coefficient onDsl, is not statistically significant at a 5 percentlevel in a two-tail test, it is significantly negativeusing a one-tail test of the negative effect pre-dicted by the hypothesis.’~No other individualor group of current or lagged changes of thefinancial innovations variables are as signifi-cant.’8 These results suggest that growth inother checkable deposits has significantly low.ered the currency ratio, which is consistentwith the financial innovations hypothesis.’~
This effect is weak, however, and is quite sen-sitive to the exclusion of only one observation—the second quarter of 1981. When this quarteris omitted, the coefficient on Dsl falls in ab-solute value to —0.073, and its t~statisticfalls to—0.89, which is far from statistical significanceeven with a one-tail test. Thus, the significantresult for Dsl, in table 2 is spurious. The largestrise in the si measure occurs in 1/1981 not inthe second quarter; the omission of the 1/1981observation, however, does not affect the signif-icance of D51. The decline in the significance ofDsl when the 11/1981 observation is omitted
Table 2Tests for the Ratio of Currency to TotalCheckable Deposits (k)
Dependent Variable: 400Alnk
Period: 111/1959 to tV/1989Constant 0.496 0.750 0.419
(‘I 70) (2.321 (1.37)
0 503 0 477 0.503(7.28~ ~6.81) ~7201
R 0.013 0.011 0.014
(195) (175) (202)
FR 0025 0028 002313.831 (4.16) 13.28)
0.058 0.059 0.053(3.13) (3.21) (281)
D80 11.297 10.783 11.398(4.75)
Dsl —0.135(— 1 79~
D(sl lnR) —0.0111—0.39)
D(sl lnR~ ) 0.037
(1 30)
R 055 056 0.55
SE 3052 3023 3054
D.W 2.11 2.10 2.13
h -101 —092 —1.20
‘°TheF-statistic for a Chow test of the stability of the equa-tion using the first and second half of the whole sampleperiod is F,,,
1= 0.64, well below the 5 percent critical
value of 2.30. Thus, the stability of the currency ratioestimate cannot be rejected.
17In earlier versions of this article, this effect was insignifi-cant even with a one-tail test. For example, before theFebruary 1990 benchmark revisions, the estimate for theperiod lll/1959 to 111/1989 had a coefficient of— 0.101 (t = —1.24). The critical t-statistic value for a one-tail test is about 1.65. The significance of the rest of theresults reported here was not so affected. The nonlinearleast-squares estimate of equation 17 in the appendix(when g equals zero) yields essentially the same result asin the text; in particular, the point estimate off is 0.1324(t = 1.83). The g parameter is set equal to zero in thisestimate because it is not significantly different from zero
‘8For example, the coefficient on Ds2 is 0.013 when addedto the equation in the first column, and its t-statistic is only1.19.
‘9Although Rasche and Johannes find a significant transitorydecline in the currency ratio in early 1981, this is notfound in the error in either the first or second quarter of1981 for the first equation in table 2. This difference mayarise because they use monthly, seasonally unadjusteddata, while seasonally adjusted quarterly data are usedhere. In the form estimated, their four-month long reduc-tion corresponds to one observation here, The tests herecannot readily determine whether such a brief transitoryeffect of financial innovations took place.
when freely estimated.
does not occur from a decline in the variance ofDsl; the standard deviation of Psi rises from0.076 to 0.082 when the 11/1981 observation isomitted. The significant result in table 2 arisesfrom a spurious decline in the currency ratio in11/1981, when sl growth was relatively large.
The third column in table 2 examines whetherthe interest elasticity of the desired currencyratio increased in absolute value as a result offinancial innovations. The results show a posi-tive, but statistically insignificant, change in theinterest elasticity. Neither interaction term is in-dividually statistically significant, and the teststatistic that they are jointly zero, F,,, ,~= 0.91,is not statistically significant. Therefore, thehypothesis that financial innovations raised theinterest elasticity of the currency ratio isrejected.
~ J I ~I (~j1T;% r,
/~4i)j%,lIi~YIJEN.EitN1l)
The evidence above on financial innovationsinfluence on total checkable deposit turnoverand the currency ratio rejects the financial in-novation hypothesis. These results do not ad-dress the more familiar literature on Ml de-mand or the velocity problem; nor do they ex-amine the implications of the financial innova-tion hypothesis for M2.
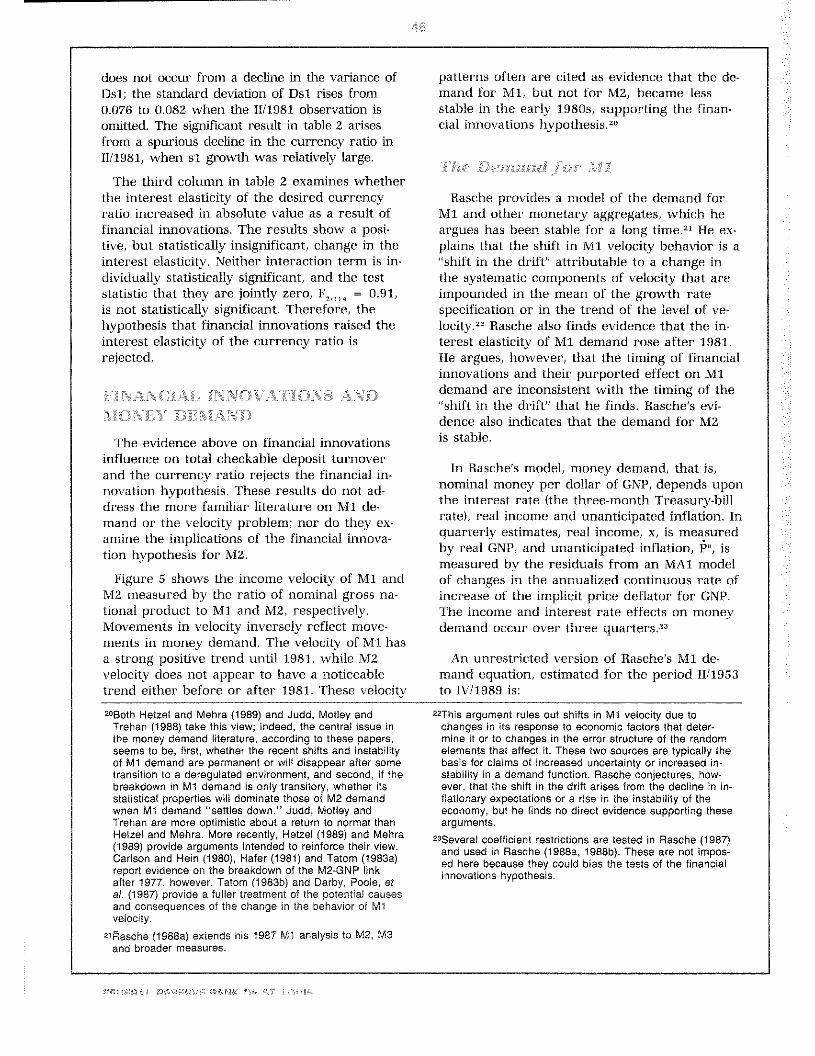
Figure 5 shows the income velocity of Ml andM2 measured by the ratio of nominal gross na-tional product to Mi and M2, respectively.Movements in velocity inversely reflect move-ments in money demand. The velocity of Ml hasa strong positive trend until 1981, while M2velocity does not appear to have a noticeabletrend either before or after 1981. These velocity
‘°BothHetzel and Mehra (1989) and Judd, Motley andTrehan (1988) take this view; indeed, the central issue inthe money demand literature, according to these papers,seems to be, first, whether the recent shifts and instabilityof Ml demand are permanent or will disappear after sometransition to a deregulated environment, and second, if thebreakdown in Ml demand is only transitory, whether itsstatistical properties will dominate those of M2 demandwhen Ml demand “settles down.” Judd, Motley andTrehan are more optimistic about a return to normal thanHetzel and Mehra. More recently, Hetzel (1989) and Mehra(1989) provide arguments intended to reinforce their view.Carlson and Hem (1980), Hafer (1981) and Tatom (1983a)report evidence on the breakdown of the M2-GNP linkafter 1977. however, Tatom (1983b) and Darby, Poole, ofa!, (1987) provide a fuller treatment of the potential causesand consequences of the change in the behavior of Mlvelocity.
2lkasche (1988a) extends his 1987 Ml analysis to M2, M3and broader measures.
patterns often are cited as evidence that the de-mand for Ml, but not for M2, became lessstable in the early 1980s, supporting the finan-cial innovations hypothesis.~~
Rasche provides a model of the demand forMl and other monetary aggregates, which heargues has been stable for a long time.” He ex-plains that the shift in Ml velocity behavior is a“shift in the drift” attributable to a change inthe systematic components of velocity that areimpounded in the mean of the growth ratespecification or in the trend of the level of ye-locity.22 Rasche also finds evidence that the in-terest elasticity of Ml demand rose after 1981.
He argues, however, that the timing of financialinnovations and their purported effect on Midemand are inconsistent with the timing of the“shift in the drift” that he finds. Rasche’s evi-dence also indicates that the demand for M2is stable.
In Rasche’s model, money demand, that is,nominal money per dollar of GNP, depends uponthe interest rate (the three-month Treasury-billrate), real income and unanticipated inflation. Inquarterly estimates, real income, x, is measuredby real GNP, and unanticipated inflation, 1”, ismeasured by the residuals from an MA1 modelof changes in the annualized continuous rate ofincrease of the implicit price deflator for GNP.The income and interest rate effects on moneydemand occur over three quarters.”
An unrestricted version of Rasche’s Ml de-mand equation, estimated for the period 11/1953to IV/1989 is:
22This argument rules out shifts in Ml velocity due tochanges in its response to economic factors that deter-mine it or to changes in the error structure of the randomelements that affect it. These two sources are typically thebasis for claims of increased uncertainty or increased in-stability in a demand function, Rasche conjectures, how-ever, that the shift in the drift arises from the decline in in-flationary expectations or a rise in the instability of theeconomy, but he finds no direct evidence supporting thesearguments.
23Several coefficient restrictions are tested in Rasche (1987)and used in Rasche (1988a, 1988b). These are not impos-ed here because they could bias the tests of the financialinnovations hypothesis.
t~r1.~p4~000IZPVO I”4’44 <IT
-‘to
to-0
—
c°o
,g
=a
5~g
~to
~,
~a—
-‘to
~-iii
‘.~
.
a~
C0
ST~
~-
~
92.N
)e
a~
.
0
I~
1c
0~
C)~
~a—
cg
c;~
,o)D
~a
0,to
eD
~o~
~~
~0’
E91
-~
~=
0to
a~
°~
a~
,to
;~
-..a
0
0=a
oto
0~
~~
~0
= to 0 C,
to 0’ to 0 = 0’ lb to 0 0 0 0 = 0’ ‘C 0
i~i
I;. t ‘~
Co
t+
+.1
~3N
~P~P
~io
-E
’2~
-_~
a-
C,,
Cji~
30
~Co ~
—0
0C
~‘b
-.1”
-iac.~
,—
o~$
~!~
~-
~C
a‘-I—
I~<
‘t
C ccx
-
7I
-~
~ -~ , ~
~~
~
~—
—5
toto
E~
-C~
Q,~
J~
c~
~ ~
~0~
20~
-~
a0
’~
oE
~~!
fl~L
~v-~
(<~
P0
<-C
0~
Ov~
Cot-
~_,
~,c
t_o,
<~
‘t~
~!a~
a~
~~ ~
•-0
~rD
~~
~ —.C
2 3.ç,j
~
~
b~t
<I t~. I I ~ t ;~. N- 4,t ~ I I V4 4~ <S h ~A
,//J I 1 f~ ~ I /4 ~<
f,.:5/ 5’ 54 I <>4 PR i~ I j ~
o, /4 p: pp PR I -1 I 4j I I
—
5, II0
(0 oc
mc”
CD 0 0 U,
0 -I
0) OW
0’ ‘C a C (0 0 a.
(-I
CD 01 CD a, a) C’, a) a a) —I
a, to —I
—I
C’,
-4 a -J -.4 ~1
(0 a) -s a) C’3
I N’ 5141 41<4 I 44 I #4 N 44< U 1-44 <S 41: 44 El I *41 I N’ 5. .4114 4144 El S 144<4: -5, .4 4414 44 414 II N II 444,4 44,
a)
~1
-5 (0 a) (0
in-5
Coo

“44
To test whether the rise in sli has raised Mldemand, the variable 400 Asll is added to theequation. The financial innovations hypothesispredicts that its coefficient should be significant-ly positive. When this variable is added to equa-tion 2, however, its coefficient is negative, butstatistically insignificant, —0.063 (t= —0.58). Thisresult refutes the financial innovations hypothe-sis about the effect of the growth of othercheckable deposits on Ml demand.”
To test whether the rise in money marketdeposits influenced Ml demand, which the fi-nancial innovations hypothesis denies, the moneymarket innovation measure, 400 As21, is addedto the Mi demand equation; the result is:
(3)I~1i,—GNP,=— 1.918 — 0.035[400/3(lnR,—lnR,,)](—4.45) (—4.35)
— 0.533 P~— 0.699 x,(—4.34) (—12.10)
+ 0.392 [400/2Unx,,—lnx,_,)](4.08)
+ 2.432 P82, — 0.161 D82,PR13,(3.49) (—6.63)
— 0.034 400As21,(—2.36)
B’ = 0.70 P.W. = 1.91
SE. = 2.636 1’ 0.22(2.67)
The money market innovations term is signifi-cantly negative; the introduction and growth ofmoney market balances has statistically signifi.cantly reduced Ml demand. The coefficient onthe innovations term is small, however; the risein s21 to 1, about its level currently, has re-duced the demand for Ml by 3.4 percent.
The proportion of MM that are transactionbalances can be estimated from the coefficienton the innovations variable. The latter coeffi-cient equals —g/(l +gs2l), where g is the shareof transaction balances in MM, according to thederivation in the appendix to this article (eq.20). Since the mean level of s21 is 21.85 percentduring the sample period, the estimated averagevalue of g is 3.4 percent.’6
A skeptic might argue that the significance ofthe last two terms in equation 2 actually demon-strates the validity of the financial innovationshypothesis. After all, the demand for Mi roseand its interest elasticity increased, just as thehypothesis predicted. Rasche’s timing argumentindicates this is a spurious relationship, but moreformal tests are possible. A test of whether therise in the interest elasticity is related to the growthof other checkable deposits rejects this skepticalview. The term (sl,lnR,—sl,_,lnR,_,) 400/3 re-lates the shift in the interest elasticity systemati-cally to the share of other checkable depositsfollowing the financial innovations hypothesis.When this innovations-related shift in the in-terest elasticity is used in place of the post-1981shift variable P82D1113 in equation 2, its t-stat~istic is still significant, but lower (—3.44 vs.—6.07); moreover, the equation’s standard errorrises (2.80 vs. 2.88). When both variables are in-cluded in equation 2, however, the t-statisticfor the innovations-related shift variable falls to—1.43, while the t-statistic for D82DR13 re-mains strongly significant (t= 4.83).”
Similarly, the hypothesis that P82 is a proxyvariable for the sharp rise in other checkabledeposits in the early 1980s is tested by compar-ing the effect of Ash on equations 2 and 3 withand without P82. When this is done for equa-tion 2, the t-statistic for 400 Ash, is —0.10when P82 is omitted and, as indicated above,—0.58 when P82 is included. When both are in-
“The absence of an effect of sil on Ml demand impliesthat the growth of other checkable deposits is offset, dollarfor dollar, by reductions in M1A (Mi less other checkabledeposits). A similar test of whether no other checkabledeposits should be added to M1A to obtain a stable de~mand is easily rejected. The proportion of other checkabledeposits that must be added to M1A to obtain an ag-gregate whose demand is invariant to shifts in othercheckable deposits is not significantly different from 100percent. This rejects the usefulness of M1A, or at least thehypothesis that its demand is invariant to financialinnovations.
26When equation 20 in the appendix is estimated with thesame non-innovation variables as in equation 2, the esti-mate of f, 0.014, is not significantly different from zero
(t=0.l5). The estimate for g, 0.037, however, is statistical~ly significant (t=2.40).
21These tests were also conducted using equation 3 insteadof equation 2. When both measures are included in theequation, the shift in the interest elasticity in 1982 remainsstrongly significant (t= —5.36), while the si-related interestelasticity shift is not (t = —1.00). The coefficient (— 0.031)on the money market innovations term, 400 As2l,, remainssignificant in this case (t= —2.12).
‘4111
cluded, however, the coefficient on P82 (2.425)is the same size as in equation 2 and it remainsstatistically significant (t=3.32). The use of Ashand the si-related shift in the interest elasticity,in place of the i982 constant and interest rateshifts, also are easily rejected when tested joint-ly. Thus, the growth of the other checkabledeposits does not account for the significance ofthe last two terms in equation 2. Similar resultsare obtained when these same substitutions aremade in equation 3 and the significance of themoney market innovations term remains unaf-fected by these changes.
The Demand for ;%12
The M2 money demand equation that uses thesame set of variables for the same period as theMi estimate is:
(4) M2,—GNP,= 1.385 — 0.055 PR13, — 0.734(3.63) (—7.82) (—7.41)
—0.76ix, + 0.428[400/2(lnx,_, — lnx,_,)I(—15.95) (5.25)
—0.822 P82, — 0.072 P82,PR13,(—h.32) (—3.62)
tI’=0.77 P.W.=l.90 P=0.289S.E.=2.177 (3.55)
Unlike the Mi estimate, the M2 estimate sug-gests that there was no significant shift in theM2 demand intercept after 198i. The interestelasticity of M2 demand rose significantly after1981, however, like that for Ml demand.
The financial innovations hypothesis suggeststhat these innovations should have had no ef-fect on the demand for M2. To test the hypoth-
esis, the same procedure used for Mi was fol-lowed for M2.” The results indicate that thecontemporaneous rise in the share of moneymarket balances in M2 (s22) has a statisticallysignificant effect on the demand for M2, butthat no other financial innovation variable (lagsof s22 or current and up to four lagged valuesof s12) has a significant effect. Moreover, whenthe contemporaneous share of money marketbalances is included in the equation, neither theintercept shift nor the interest elasticity shift isstatistically significant. The estimate, without theinsignificant variables, is:”
(5) M2,—GNP,=l.422 — 0.052PRh3, — 0,711 P~(3.55) (—7.73) (—8.29)
—0.802x, + 0.373[400/2Unx,_, — lnx,.,)](—18.48) (4.67)
+ 0.261 400As22,(6.04)
R’=O.Si P.W.=h.79S,E. = 2.006
The result that the rise in the share of moneymarket deposits significantly raised the demandfor M2 runs counter to the financial innovationshypothesis.’°According to the estimate, a 25percent share of money market deposits in M2(nearly its share at the end of 1989) raises M2demand relative to GNP by about 6.5 percentagepoints.31
Figure 6 shows the growth rate of M2 mea-sured over four-quarter periods since 1978 andan adjusted growth rate that removes the effectof shifts in money market funds from M2 usingthe estimated effect in equation 532 The money-
25No attempt was made to adjust the T-bill ratd for theaverage rate paid on the components of M2 in order tobetter measure the opportunity cost of M2. Rasche (l988a)notes that, in an estimate like equation 4, inferior overallresults were found when such a measure is used insteadof the T-bill rate.
“When D82, and D82,DR13, are added to the estimate theyare not statistically significant; the coefficient on 082, is— 0.894 (t = —1.39), and that for the shift in the interestelasticity is -0.033 (t = —1.60).
‘°These results do not depend on the inclusion of the fourquarters that Rasche omits in his study. When thesequarters are omitted, the standard error falls to only 1.926percent and the other properties of the estimate are nearlyidentical. The same results also obtained when all fourquarters of 1983, during which the largest shifts occurred,are omitted; in particular, the t-statistic for the s22 innova-tion term is 2.49.
“The theoretical value of the coefficient on 400 As22, isg,i(l-g, s22), where g, is the proportion of MM balancesthat are not close substitutes for the rest of M2. This ex-pression is derived in the appendix to this article. Thesample estimate of g,, given the sample mean value ofs22 of 5.39 percent, is 25.7 percent. When equation 22 inthe appendix is estimated using the nonlinear leastsquares method and with the same other variables as ineither equations 4 or 5, the other checkable deposit in-novation’s coefficient is not significantly different fromzero, but the money market innovation term is. Using thismethod, the trend shift and interest-elasticity shift againare insignificant when the money market innovation termis included. For the counterpart to equation 5 in the text,the nonlinear least squares estimate of g, is nearly thesame, 24.2 percent, (t=5.i7).
~‘Thisadjustment subtracts 0.261 s22, from the logarithm ofM2 to obtain a series that is independent of s22.
p = 0.44(5-75)
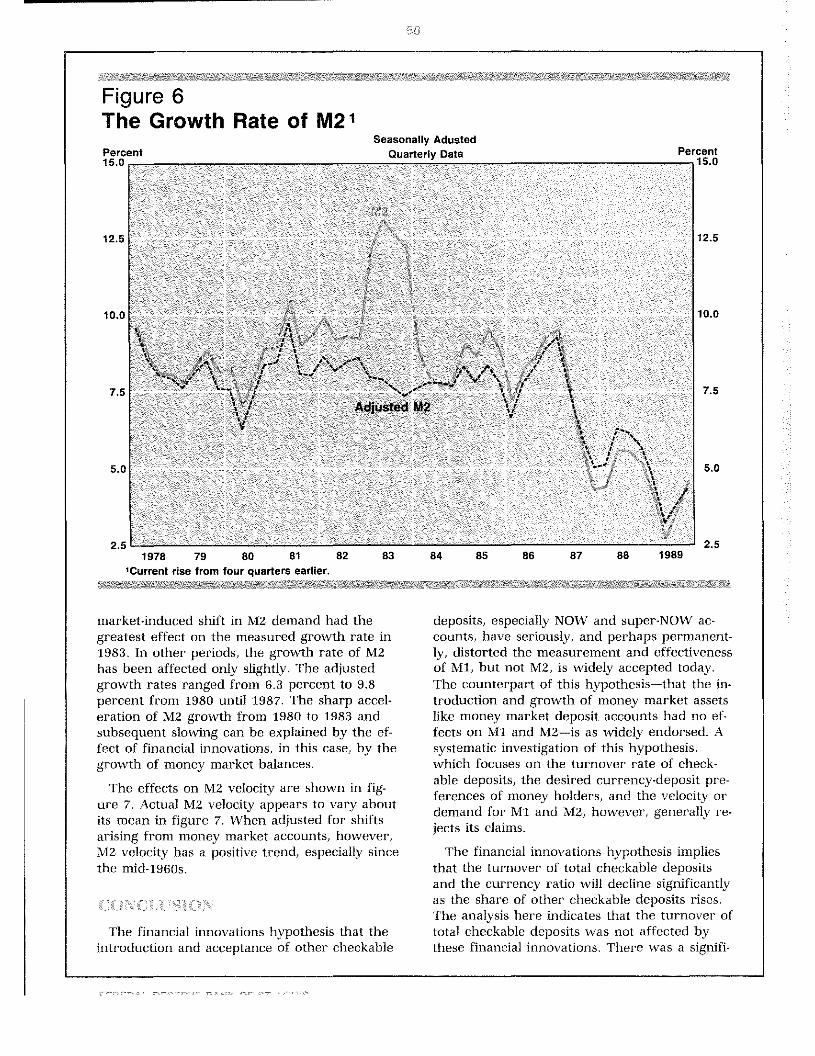
Figure 6The Growth Rate of M21
Seasonally Adusted
Percent
15.0
12.5
10.0
7-5
5.0
2.5
market-induced shift in M2 demand had thegreatest effect on the measured growth rate in1983. In other periods, the growth rate of M2has been affected only slightly. The adjustedgrowth rates ranged from 6.3 percent to 9.8percent from 1980 until 1987. The sharp accel-eration of M2 growth from 1980 to 1983 andsubsequent slowing can be explained by the ef-fect of financial innovations, in this case, by thegrowth of money market balances.
The effects on M2 velocity are shown in fig-ure 7. Actual M2 velocity appears to vary aboutits mean in figure 7. When adjusted for shiftsarising from money market accounts, however,M2 velocity has a positive trend, especially sincethe mid-1960s.
The financial innovations hypothesis that theintroduction and acceptance of other checkable
deposits, especially NOW and super-N-OW ac-counts, have seriously, and perhaps permanent-ly, distorted the measurement and effectivenessof Ml, but not M2, is widely accepted today.The counterpart of this hypothesis—that the in-troduction and growth of money market assetslike money market deposit accounts had no ef-fects on Mi and M2—is as widely endorsed. Asystematic investigation of this hypothesis,which focuses on the turnover rate of check-able deposits, the desired currency-deposit pre-ferences of money holders, and the velocity ordemand for Mi and M2, however, generally re-jects its claims.
The financial innovations hypothesis impliesthat the turnover of total checkable depositsand the currency ratio will decline significantlyas the share of other checkable deposits rises.The analysis here indicates that the turnover oftotal checkable deposits was not affected bythese financial innovations. There was a signifi-
1978 79 80 81 82 83 84 85 86 87 88 1989‘Current rise from four quarters earlier.
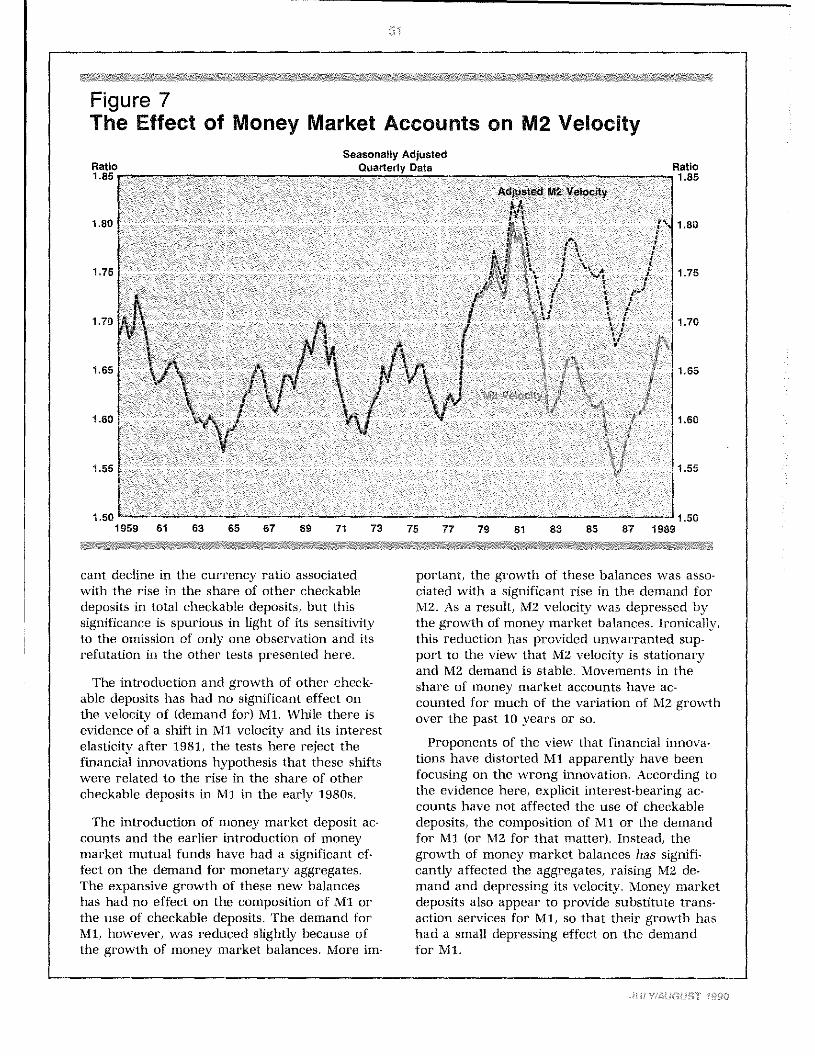
Figure 7The Effect of Money Market Accounts on M2 V&ocfty
Seasonally AdjustedQuarterly Data
Ratio
1.85
1.80
1.75
1.70
1.65
1.50
1.55
1.50
cant decline in the currency ratio associatedwith the rise in the share of other checkabledeposits in total checkable deposits, but thissignificance is spurious in light of its sensitivityto the omission of only one observation and itsrefutation in the other tests presented here.
The introduction and growth of other check-able deposits has had no significant effect onthe velocity of (demand for) Ml. While there isevidence of a shift in Ml velocity and its interestelasticity after 1981, the tests here reject thefinancial innovations hypothesis that these shiftswere related to the rise in the share of othercheckable deposits in Ml in the early 1980s.
The introduction of money market deposit ac-counts and the earlier introduction of moneymarket mutual funds have had a significant ef-fect on the demand for monetary aggregates.The expansive growth of these new balanceshas had no effect on the composition of Ml orthe use of checkable deposits. The demand forMi, however, was reduced slightly because ofthe growth of money market balances. More im-
portant, the growth of these balances was asso-ciated with a significant rise in the demand forM2. As a result, M2 velocity was depressed bythe growth of money market balances. Ironically,this reduction has provided unwarranted sup-port to the view that MZ velocity is stationaryand M2 demand is stable. Movements in theshare of money market accounts have ac-counted for much of the variation of M2 growthover the past 10 years or so.
Proponents of the view that financial innova-tions have distorted Ml apparently have beenfocusing on the wrong innovation. According tothe evidence here, explicit interest-bearing ac-counts have not affected the use of checkabledeposits, the composition of Ml or the demandfor Mi (or M2 for that matter). Instead, thegrowth of money market balances has signifi-cantly affected the aggregates, raising M2 de-mand and depressing its velocity. Money marketdeposits also appear to provide substitute trans-action services for Ml, so that their growth hashad a small depressing effect on the demandfor Mi,
Ratio
1.85
1.80
1.75
1.70
1.65
1.60
1.55
1.501959 61 63 65 67 89 71 73 75 77 79 81 83 85 87 1989
_______ - “The Money-GNP Link: Assessing Alternative
Barnett, William A. “The Optimal Level of Monetary Aggrega-tion,” Journal of Money, Credit and Banking (November1982), pp. 687-710.
Barro, Robert J., and Anthony M. Santomero. “HouseholdMoney Holdings and the Demand Deposit Rate,” Journal ofMoney Credit and Banking (May 1972), pp. 397-413.
Bradley, Michael 0., and Dennis W. Jansen. “Deposit MarketDeregulation and Interest Rates,” Southern Economic Jour-nal (October 1986), pp. 478-89.
Burger, Albert E. “The Puzzling Growth of the Monetary Ag-gregates in the l980s,” this Review (SeptemberlOctober1988), pp. 46-60.
Carlson, John B. “The Stability of Money Demand, Its In-terest Sensitivity, and Some Implications for Money as aPolicy Guide,” Federal Reserve Bank of ClevelandEconomic Review (Quarter 3, 1989) pp. 2-13.
Carlson, Keith M., and Scott E. Hem. “Monetary Aggregatesas Economic Indicators:’ this Review (November 1980), pp.12-21.
Cook, Timothy 0., and Timothy D. Rowe- “Are NOWs BeingUsed as Savings Accounts?” Federal Reserve Bank ofRichmond Economic Review (MaylJune 1985), pp. 3-13.
Cox, Albert H., Jr. Regulation of Interest Rates on BankDeposits (University of Michigan, 1966).
Cox, W. Michael, and Harvey Rosenblum. “Money and Infla-tion in a Deregulated Financial Environment: An Overview,”Federal Reserve Bank of Dallas Economic Review (May1989), pp. 1-la
Darby, Michael R., Angelo R. Mascaro and Michael L.Marlow. “The Empirical Reliability of Monetary Aggregatesas Indicators, 1983-87’ Ecomonic Inquiry (October 1989),pp. 555-85.
Darby, Michael R., William Poole, David B. Lindsey, MiltonFriedman. and Michael J. Bazdarich. “Recent Behavior ofthe Velocity of Money:’ Contemporary Policy Issues(January 1987), pp. 1-33.
Dotsey, Michael. “The Demand for Currency in the UnitedStates’ Journal of Money Credit and Banking (February1988), pp. 22-40.
Friedman, Benjamin M. “Lessons on Monetary Policy fromthe l980s,” Journal of Economic Perspectives (Summer1988), pp. 51-72.
Frodin, Joanna H., and Richard Startz. “The NOW AccountExperiment and the Demand for Money,” Journal of Bank-ing and Finance (June 1982), pp. 179-93.
Gavin, William. “MlA—M.l.A.?” Federal Reserve Bank ofCleveland Economic Commentary (July 1, 1987).
Gilbert, R. Alton. “A Revision in the Monetary Base,” thisReview (August/September 1987), pp. 24-29.
_______ • “Revision of the St. Louis Federal Reserve’s Ad-justed Monetary Base:’ this Review (December 1980),pp- 3-10.
Hider, R.W. “The FOMC in 1985: Reacting to Declining MlVelocity,” this Review (February 1986), pp. 5-21.
_______ • “The FOMC in 1983-84: Setting Policy in anUncertain World,” this Review (April 1985), pp. 15-37.
Transaction Measures:’ this Review (March 1984),pp. 19-27.
_______ “Much Ado About M2,” this Review (October1981), pp. 3-18.
“The New Monetary Aggregates,” this Review(February 1980), pp. 25-32.
Haraf, William S. “Monetary Velocity and Monetary Rules:’The Cato Journal (Fall 1986), pp. 641-62.
Hem, Scott B. “Short-Run Money Growth Volatility: Evidenceof Misbehaving Money Demand?” this Review (JunelJuly1982), pp. 27-36.
Hetzel, Robert L. “M2 and Monetary Policy:’ FederalReserve Bank of Richmond Economic Review(September/October 1989), pp. 14-29.
Hetzel, Robert L., and Yash P. Mehra. “The Behavior ofMoney Demand in the 198os:’ Journal of Money Creditand Banking (November 1989), pp. 455-63.
Jordan, Jerry. “Financial Innovation and Monetary Policy:’in Financial Innovations: Their Impact on Monetary Policyand Financial Markets, Proceedings of a Conference heldat the Federal Reserve Bank of St. Louis. October 1 and 2,1982 (Kluwer Nijhoff, 1984), pp. 135-50.
Judd, John R, and Bharat Trehan. “Portfolio Substitutionand the Reliability of Ml, M2 and M3 as Monetary PolicyIndicators[ Federal Reserve Bank of San FranciscoEconomic Review (Summer 1987), pp. 5-29.
Judd, John P., Brian Motley and Bharat Trehan. “The De-mand for Money: Where Do We Stand?” unpublishedpaper presented at the Western Economics AssociationMeetings, Los Angeles, June 1988.
Kareken, John H. “Commercial Banks and the Supply ofMoney: A Market Determined Demand Deposit Rate,”Federal Reserve Bulletin (October 1967), pp. 1699-712.
Keeley, Michael C., and Gary C. Zimmerman. “Deposit RateDeregulation and the Demand for Transactions Media,”Federal Reserve Bank of San Francisco Economic Review(Summer 1986), pp. 47~62.
Ktein, Benjamin. “Competitive Interest Payments on BankDeposits and the Long-Run Demand for Money,” AmericanEconomic Review (December 1974), pp. 931-49.
_______ “The Payment of Interest on Commercial BankDeposits and the Price of Money: A Study of the Demandfor Money:’ unpublished Ph.D. dissertation, University ofChicago, 1970.
Klein, Michael A. “Deposit Interest Prohibition, TransactionsCosts, and Payments Patterns: A Theoretical Analysis,”Metroeccnomica (November/December 1974), pp. 144-52.
Kopcke, Richard W. “Financial Assets, Interest Rates andMoney Growth,” New England Economic Review(MarchhAprit 1987), pp. 17-30.
Mehra, Yash P. “Some Further Results on the Source ofShift in Ml Demand in the lgaos:’ Federal Reserve Bankof Richmond Economic Review (SeptemberlOctober 1989),pp. 3-13.
Moore, George R., Richard D. Porter and David H. Small.“Modeling the Disaggregated Demands for M2 and Ml inthe l980s: The U.S. Experience:’ in Financial Sectors andOpen Economies: Empirical Analysis and Policy Issues, Pro-
ceedings of a May 1988 Conference of the Board of Gover-nors of the Federal Reserve System, forthcoming.
Motley, Brian. “Should M2 be Redefined?” Federal ReserveBank of San Francisco Economic Review (Winter 1988),pp. 33-51.
Morris, Frank E. “Do the Monetary Aggregates Have aFuture as Targets of Federal Reserve Policy?” NewEngland Economic Review (MarchlApril 1982), pp. 5-14.
Nuetzel, Philip A. “The FOMC in 1986: Flexible Policy forUncertain Times[ this Review (February 1987), pp. 15-29.
Poole, William. “Monetary Policy Lessons of Recent Inflationand Disinflation:’ Journal of Economic Perspectives (Sum-mer 1988), pp. 73-100.
Porter, Richard D., and Edward K. Offenbacher. “FinancialInnovations and Measurement of Monetary Aggregates:’ inFinancial Innovations: Their Impact on Monetary Policy andFinancial Markets, Proceedings of a Conference held at theFederal Reserve Bank of St. Louis, October 1 and 2, 1982(Kluwer Nijhotf, 1984), pp. 49-98.
Rasche, Robert H. “Demand Functions for U.S. Money andCredit Measures,” Paper 8718, Department of Economics,Michigan State University (May 1988a) to be reprinted inFinancial Sectors and Open Economies: Empirical Analysisand Policy Issues (Board of Governors of the FederalReserve System, forthcoming).
_______ - “Monetary Policy and Financial Deregulation inthe United States,” Kredit und Kapital (Heft 3, 1988b),pp. 451-68.
______ “Ml Velocity and Money Demand Functions: DoStable Relationships Exist?” in Karl Brunner and Allan H.Meltzer, eds., Empirical Studies of Velocity, Real ExchangeRates, Unemployment and Productivity, Carnegie-RochesterSeries on Public Policy (North Holland, Autumn 1987), pp.9-88.
Rasche, Robert H., and James M. Johannes. Controlling theGrowth of the Monetary Aggregates (Kluwer, 1987).
Roth, Howard L. “Has Deregulation Ruined Ml as a PolicyGuide?” Federal Reserve Bank of Kansas City EconomicReview (June 1987), pp. 24-37.
Santomero, Anthony M. “A Model of the Demand for Moneyby Households:’ Journal of Finance (March 1974), pp. 89-102.
Saving, Thomas R. “Money Supply Theory with Competitive-ly Determined Deposit Rates and Activity Charges,” Journalof Money Credit, and Banking (February 1979), pp. 22-31.
_______ - “A Theory of The Money Supply With CompetitiveBanking,” Journal of Monetary Economics (July 1977), pp.289-303.
_______ - “Transactions Costs and The Demand forMoney[ American Economic Review (June 1971),pp. 407-20.
Siegel, Diane F. “The Relationship of Money and Income:The Breakdowns in the 70s and SOs,” Federal ReserveBank of Chicago Economic Perspectives (JulylAugust 1986),pp. 3-15.
Simpson, Thomas D. “Changes in the Financial System:implications for Monetary Policy:’ Brookings Papers onEconomic Activity (1: 1984), pp. 249-65.
Spindt, Paul A. “Money is What Money Does: Monetary Ag-gregation and the Equation of Exchange,” Journal ofPolitical Economy (February 1985), pp. 175-204.
Startz, Richard. “Implicit Interest on Demand Deposits,”Journal of Monetary Economics (October 1979), pp. 515-34.
Tatom, John A. “Interest Rate Variability and EconomicPerformance: Further Evidence,” Journal of PoliticalEconomy (October 1985), pp. 1008-18.
“Money Market Deposit Accounts, Super NOWsand Monetary Policy,” this Review (March 1983a),pp. 5-16.
_______ - “Alternative Explanations of the 1982-83 Declinein Velocity:’ in Monetary Targeting and Velocity, FederalReserve Bank of San Francisco, Conference Proceedings,December 4-6, 1983b, pp. 22-56.
________ - “Recent Financial Innovations: Have They Dis-orted the Meaning of Ml?” this Review (April 1982), pp.23-35.
_______ • “Transactions Cost and the Supply of RealAverage Demand Deposits,” unpublished Ph.D. disserta-tion, Texas A&M University, 1971.
Thornton, Daniel L. “The FOMC in 1982: DeemphasizingMl,” this Review (June/July 1983), pp. 26-35.
______ • “The FOMC in 1981: Monetary Control in aChanging Financial Environment,” this Review (April 1982),pp. 3-22.
Wallace, Neil. “Integrating Micro and Macroeconomics: AnApplication to Credit Controls,” Federal Reserve Bank ofMinneapolis Quarterly Review (Fall 1980), pp. 16-29.
Wenninge~John. “Responsiveness of Interest Rate Spreadsand Deposit Flows to Changes in Market Rates:’ FederalReserve Bank of New York Quarterly Review (Autumn1986), pp. 1-10,
f~/~v’:H~>~i::~ /U~ N z~
The financial innovations hypothesis, aspresented and tested in this paper, states thatthe introduction and growth of other checkabledeposits, OCD, distorted the measurement ofboth total checkable deposits and Ml, but leftthe overall demand for Ma unaffected. More-over, according to this hypothesis, the introduc-tion and growth of money market balances (MM)had no effect on M2. Instead) the growth ofthese balances came at the expense of othernon-MI funds within Ma, so that it had no ef-fect on total checkable deposits, Ml demand, orthe composition of Ml.
The hypothesis suggests that some fraction, f,of other checkable deposits is not held as totalcheckable transaction balances and that moneymarket deposit balances do not yield transactionservices or are not held as part of total check-able transaction balances. Thus, the amount oftotal checkable deposits. TCLJ, that are “truly”transaction balances equals (1-fsl) TCD, wheresi is the share of other checkable deposits intotal checkable deposits. If some proportion, g,of MM are also transaction balances, then thetotal MM component of transaction balances canbe written as gs2, where sZ is the ratio of MMto TCD. Total transaction balances, TTB, can bedefined as:
(1) TTB e(i—fsi+gsz) TCD.
In this framework, the financial innovationshypothesis is that i f>O and g=o.
Prior to financial innovations, si and s2 werezero and nfl equaled TCD. The effective quan-tity of Ml was C + TCD, where C is the curren-cy component of Ml. The effective quantity ofMi, designated MV, when si and sZ are notzero, is C+TTI3, or Mi-fOCD+gMM. If sii isdefined to be the ratio (OCD/M1) and s21 is de-fined to be the ratio (MM/Mi), then
(2) M1* M1(i —fsii +gs2i).
Since Mi equals (1 +k) TCD, where k is theratio of currency to total checkable deposits,sli equals si/(1+k) and s21 equals s2/(l+k).
An effective quantity of Ma, called Ma *, canbe defined similarly. Whether or not certainproportions of OCD and MM balances are ap-propriately considered part of flB and MV,they are definitionally part of Ma. This is thecentral reason that the hypothesis claims that~2 is unaffected by these innovations. If, how-ever, some fraction of these new deposits arenot close substitutes for M2, then the effectivequantity of M2, M2*, should exclude these frac-tions of the new deposits.
In particular, if some fractions, f, of othercheckable deposits and g, of MM balances, areheld for non.M2*~relatedreasons, then shifts inholdings of these funds will boost M2 relative toM2*, that is,
(3) M2~= M2(i —f.s12 —g1s22),
where si2 is the ratio of other checkable depos-its to Ma and s22 is the share of money marketbalances in M2. According to the financial in-novations hypothesis, the growth of other check-able deposits or MM involves substitutions withinM2 and does not affect its total; therefore, M2equals M2 and g, and f, equal zero.’
The hypothesis is tested below using the rela-tionships in equations 1-3. In particular, two im-portant economic variables, the turnover ratefor total checkable deposits and the currencyratio, relate debits and currency holdings,respectively, to desired holdings of checkabletransaction balances. Movements in other check-able deposits or money market deposits havepredictable or systematic effects on the ratio ofcheckable transaction balances to observed totalcheckable deposits and, therefore on debits orcurrency holdings relative to total checkabledeposits. Similarly, growth in these new assetsaffects the relationship of Mi and M2* to theirobserved counterparts and, therefore, systemati-cally affect the relationship of the observed ag-gregates, Mi and Ma, to the factors that influ-ence the demands for Ml * and Ma *, respectively.The hypothesis also suggests that the interestelasticity of demand for transaction balances,
1Since M2 = (1 ÷k+t)TCD, where t is the ratio of the non-Ml components of M2 to M2, the ratios s12 and s22 aresimply (1 +k+t)’ times sl and s2, respectively.
Mi and M~have been affected by financial in-novations. The specific form of the hypothesesand tests are derived below.
/Hff.I/~ ~ I:/:%rrli;2:
The turnover rate for total checkable transac-tion deposits is the ratio of debits, D, on thesedeposits to their total, TTI’B. If v, the turnoverrate of deposits held for transaction purposes isa function of a vector of variables, z0, then
(4) D = v(z,,)TTB.
Substitution of equation 1 in equation 4 yields:
(5) D = v(z) (1 — fsl + gsa) TCD.
The left-hand side of equation 5 includes anythird-party debits on MM balances held forthird-party payment, i.e., as checkable transac-tion balances, (gMM). For simplicity, assume thatdebits include only third-party payments andthus exclude cash-withdrawal debits on bothTCD and MM balances. If debits on moneymarket balances, Dm~are also a function ofgMM and the vector z0 above, or
W) Dm = vm(z0) gsa TCD,
then the debits measured against total checkabledeposits U,, are
(7) U, = = v(z0) [i—fsi+gsad] TCD,
where d = (i-v,,/v) and the turnover ratio fortotal checkable deposits is
(8) d = U,/TCU = v(z0)Ei — fsi + gsaoi.
A rise in si reduces the turnover ratio for totalcheckable deposits; if f is zero, however, thenmovements in si have no effect on v. If g andvm are not zero, movements of funds into MM
balances (relative to lCD) will affect the turn-over of total checkable deposits. The sign of thiseffect depends on whether 6 is positive, zero ornegative, or whether transaction balances inMM have relatively low, the same or high turn-over compared with the weighted average turn-over of total transaction balances, v.
A log-linear specification of v(z0) is used,where z0 includes the current and past interestrate (i, i,,) and real personal income, y,, or
(9) lnv, = /3~+ /3, Ini, + /~2 Ini,.., + /3~Iny,.
The log-linear specification of equation 8 is
(iO) Ind, = /3, + /3, Ini, + ~ lni,_, + /33 Iny,
+ ln(i—fsi + gdsa),
where vm/v is assumed constant. When equation10 is differenced, the result is:
(ii) AInd, /3 Alni, + /33 Alni,, + /33 Alny,
+ Aln(i —fsi +gdsZ).
The last variable in equation ii is unknownbecause f, g and 6 are unknown. This problemis addressed indirectly in the paper.2 1ff, g and6 are constants, then
(ia) Aln(1 — fsi + gdsa) = — _____________ dsii—fsi+gdsa
+ gd dsa.i—fsi+gdsa
The difference in the logarithm in the last termin equation ii can be approximated using thetotal differential of the expression in paren-theses and replacing dsl and dsa with Asi and
Thus, equation ii can be written as:
(13) AInd, /3~+ /3, Alni, + /3, Alni,., + /33 Alny,
+ /34 Asi, + /35 Asa,,
2All the estimates in this article contain a term likeAln(1 —fsl +gds2) in equation 11. Estimating the constantslike f and (gO) directly by non-linear least-squares yields nodifferences from the result reported in the text for thefinancial innovations hypothesis. If f is correlated withmovements in si or its counterpart measures below, theestimated coefficient on the share variables would be bias-ed; if the correlation is positive, as proponents of thefinancial innovations might argue, this biases up the coeffi-cient and biases the tests in favor of the financial innova-tion hypothesis. The same argument applies to g. The op-posite bias would arise if f and the other checkabledeposit share were negatively correlated, but this iscounterintuitive. There is no a priori reason to expect f org (or f, and g, below) to change, especially to changesystematically with movements in the shares, however.
3The coefficients on Asl and 6s2 involve sl and s2. Thesecoefficients are estimated as constants and are evaluatedat the sample period average values for f, go, sl and s2.Note that gO is estimated from the s2 coefficient; conse-quently, the hypothesis that g equals zero cannot betested. If 6 equals zero (the turnover of transactionbalances held in MM is the same as for the rest of suchbalances), then the coefficient on s2 will be zero; however,this does not imply that g is necessarily zero.

where /3, is an intercept which should have a trol dummy variable, c. The first-difference ofvalue of zero, unless a significant time trend hasbeen omitted from equation 10. Tinder the finan-cial innovations hypothesis, /34< 0 and /35 = 0.
Ihe hIterest .iiastieitv o the~Itn’nover Hate
The financial innovations hypothesis tested inthe text implies that the interest elasticity ofmoney demand rose as a result of financial in-novations. Since turnover is a velocity measure,a test is conducted of whether the interestelasticity of the turnover rate of total checkabledeposits rose in proportion to the growth of si.In equations 9 and iO, this elasticity is constantand equals (/3, +fl,). If /3, and /3, are functions ofsi, for example, /3, fl~+fl,si, and /~2=(~2’
+ /~2’ si,_,, then the terms (/3, mi, + /~2 lni,_,)in equations 9 and iO must be replaced with
(fi Ini, + /3,’ si, + fi lni,, + /3,’ si,1lni,,). Inequation i3, /3,’ replaces /3k, /~2’replaces fi,and the additional terms /3,’ A(si,lni,) and
/32’ A(si,,,,lni,.,) must be included. Whether theinterest elasticity rose depends on whether /3,’,/3,’ and (/3,’+/32’) are statistically significantlypositive.
r~vfjJ/ C’URIU~E/NCYRATIO
The currency ratio is the ratio of currency tototal checkable transaction balances. Currencydemand relative to total checkable transactionbalances is
(14) C = k(z1) TTB,
where z, is a vector of the determinants of thedesired ratio. With the advent of OCD and MMbalances, currency holding competes with allother transaction-related balances, or TTB. Sub-stitution of equation 1 in equation 14 yields
(15) C = k(z,) (i —fsi + gsa) TCD.
When si rises, currency demand declines, givenTCD, z,, f and g, if 0<f l. Changes in s2 haveno effect on the currency ratio under the hy-pothesis that g=o.
The variables in z, that determine the desiredcurrency ratio, and are controlled for in testingthe financial innovations hypothesis, include theautoregressive component, a first lag of the cur-rency ratio, the current (i,) and past (i,_,) in-
the log-linear form of equation is, with the ap-propriate substitutions for z,, is:
(16) Aln(C/TCD), = 6, + 6, Alni, + 62 Alni,,
where D80 equals Ac.
+ 63 Alnp7 + 64 D80
+ 63 Aln(C/TCD),,
+ Aln(i — fsi + gsa),
The last term on the right-hand-side can beapproximated using the same argument usedabove for equations ii and 12 sincedln(i — fsi + gsa) equals V f/(i — fsi +gsz)]dsl+Eg/(i — fsi + gsa)]dsa. Thus, equation 16 can bewritten as:
(17) Aln(C/TCD), = + 6, Alni, + 6,Alni,.,
+ 6,Alnp~+ 64 D80
+ [—f/(i—fsi + gsa)] Asi,
+ [g/(i — fsi + gsa)] Asa,.
The financial innovations hypothesis, 0< ~ 1, istested by whether Asi, has a significant negativecoefficient. The hypothesis g = 0 is tested bywhether As2, has a significant coefficient.
Whether the interest elasticity of the currencyratio is affected by the growth of si is alsotested. The sum (6+6,) in equation 16 or 17 isthe interest elasticity of the currency ratio. Ifeach of these components is a function of si,then the interest components in k(z,) can bewritten as (6 + 6,’si) Ini, + (62’ + 62’ si) lni,_,,and [6~’+o;+ 6j si, + 62 si,~,]is the interestelasticity of currency demand in this case. Inthe first-difference form given in equation 17,the interest rate components are replaced with
6 Alni, + 6,’ Alni,_, + 6,’ A(si, lni,)+ 62’ A(si,_,lni,_,). If financial innovations affectthe interest elasticity, then 6,’ and/or 62’ aresignificantly different from zero. Since 6, and 6,are negative, for the interest elasticity tobecome larger in absolute value requires that,6,’, 6,’ O and (6,’+62’)<0.
~~“i”’
Suppose “true” or effective Ml demand, Mi’,is a function of a vector of variables z,. Substi-tuting equation a yields:
(18) (1— fsii + gsai)Mi = D(z2).
In log-linear form, this equation can be re-terest rate, energy prices, p’, and a credit con- arranged as

(19) lnMi = ln[D(z,)] — ln(i — fstl + gsai).
When this is flrst-differenced and a similarsubstitution is made for the last term as wasmade in equation 13 and 17, the result is:
(20) AlnMi = Aln[D(z)] + 66 Ash,
where
+ 6, Asai,,
66 = f/(i —fsli +gsai), and67 = —g/(i—fslh+gsai).
For M2 demand, the same set of tests are con-ducted. In particular, if “true” M2 demand, Ma4
in equation 3, is a function of variables z,, E(z,),then substituting this in equation 3 yields
(21) (1 —f,siz —g.saa) Ma = E(z,).
In the text, the z, vector includes the same setof other money demand variables as Mi, that is,z, equals z,. In differenced log-linear form andusing the exact differential to derive thediscrete Aln(i—f,siag,saa), equation 21 becomes
1ff is zero, then 6~equals 0. If 0<f i,however, then 66 is positive; that is, a rise insli should raise Mi demand, given the variablesin z,. If g equals 0, then 6, equals 0; if g ispositive, then 6, is less than zero.
The variables included in z, are the interestrate, income and unanticipated inflation. Thespecification of ln[D(z,)] also includes a shift inthe interest rate elasticity of money demandand a shift in the level of Mi demand, whereboth shifts occur in 1982. Therefore, tests areconducted to determine if these two com-ponents of z, arise from financial innovations.
(22) AInMa, = AIn E(z,) + 6, Asaa, + 69 AsIa,
where
69 = Eg,/(i—f,sia—g,saa)] and
6, = [f,/(1—f,sla—g,saa)].
Under the financial innovations hypothesis, f,,g,, 6, and 6, are all zero. The coefficients 69and 6, are positive if the proportions g, of MMor f, of OCD are positive; this result would in-dicate that these proportions are not a closesubstitute, given z,, for the rest of Ma.