the effects of harsh environments on solar cells laura bruce, brian dawes, james horner, krupa...
TRANSCRIPT

THE EFFECTS OF HARSH ENVIRONMENTS
ON SOLAR CELLS
Laura Bruce, Brian Dawes, James Horner, Krupa Patel, Ronak Patel, Nicholas Porto,
Steven Scarfone, Olivia Shabash, Priyanka Shah, Daphne Sun, Jisoo Yoon
Advisor: Dr. Paul V. Quinn Sr.
Teaching Assistant: Sally J. Warner

NASA Strives for Efficient Solar Cells
NASA interested in decay of cells

Solar Cells in Space
Variables tested include: Light intensity Wavelength Environmental factors such as radiation, heat, and freezing
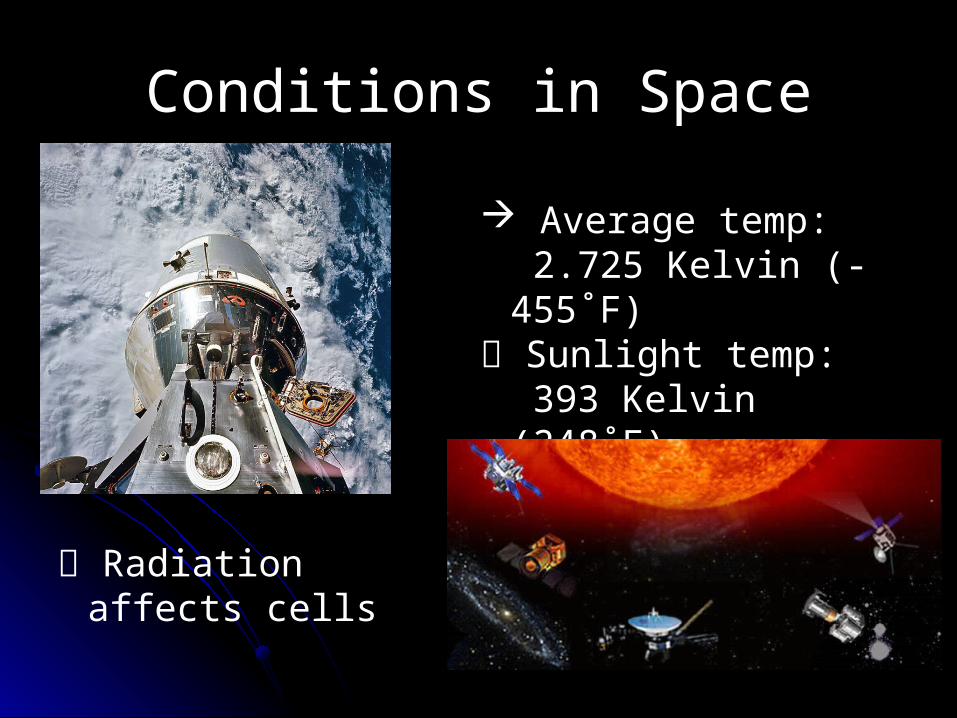
Conditions in Space
Average temp: 2.725 Kelvin (-455˚F)
Sunlight temp: 393 Kelvin (248˚F)
Radiation affects cells

The Photoelectric Effect Generates current
Increasing light
frequency increases electron energy
Increasing electron energy increases current
h = Planck’s constantf = frequency Eph = photon energyK = electron energyφ = work function
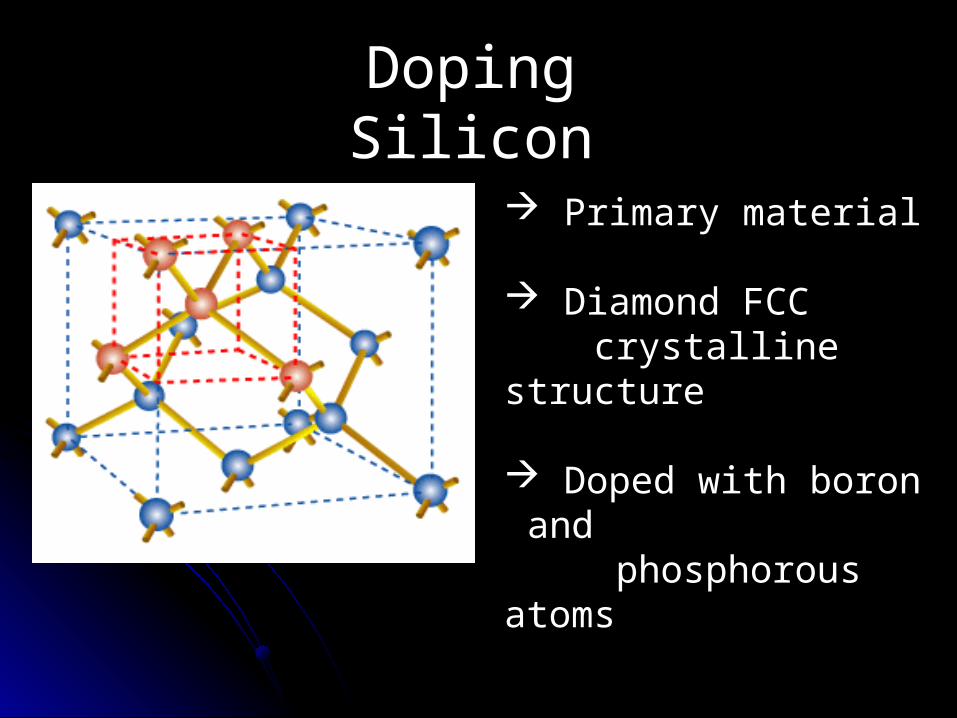
Doping Silicon
Primary material
Diamond FCC crystalline structure
Doped with boron and
phosphorous atoms

Doping Silicon
N-Type P-Type

How Solar Cells Work
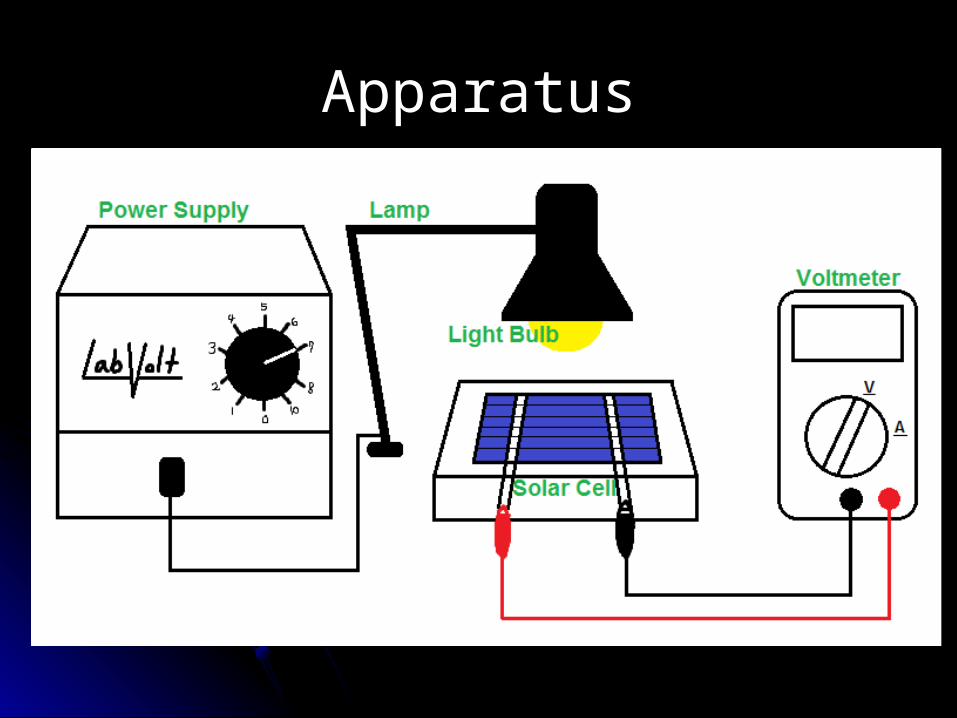
Apparatus

BaselineSix light bulbs used to create baseline:
65 Watts

Comparing Wavelengths of Light
0
0.5
1
1.5
2
2.5
3
3.5
0 0.2 0.4 0.6 0.8 1
Volt
age
(mV)
Percent Intensity
Voltage vs. Intensity
Blue Bulb 50 W
White Bulb 25 W
Clear Bulb 75 W
Yellow Bulb 25 W
0
0.2
0.4
0.6
0.8
1
1.2
1.4
1.6
0 1 2 3 4
Curr
ent (
mA
)
Voltage (mV)
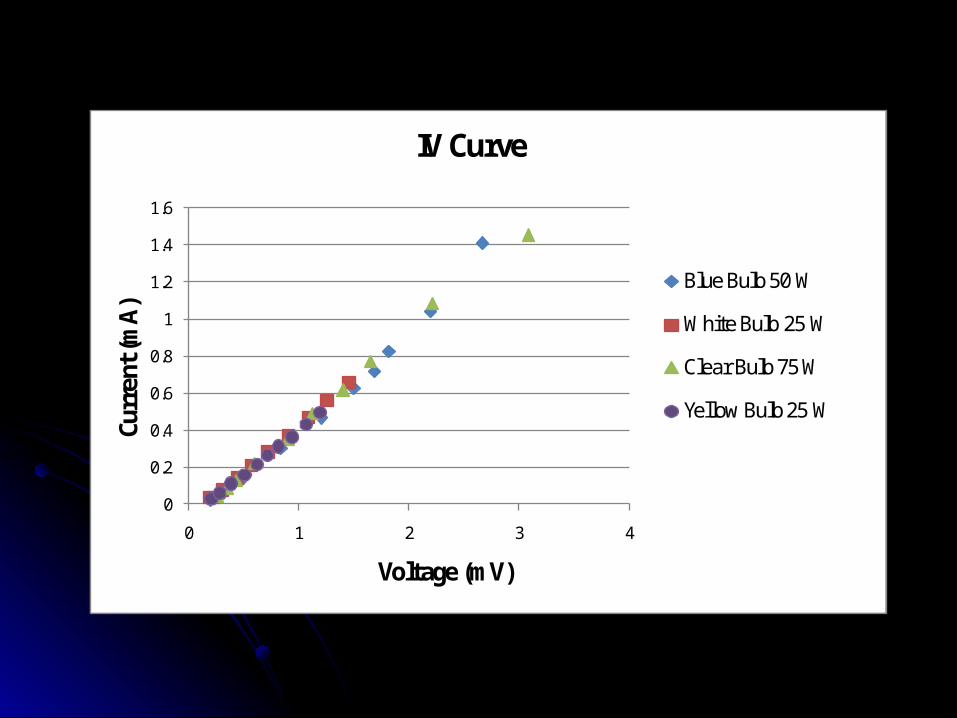
IV Curve
Blue Bulb 50 W
White Bulb 25 W
Clear Bulb 75 W
Yellow Bulb 25 W

Comparing Different Intensities
00.5
11.5
22.5
33.5
44.5
0 0.2 0.4 0.6 0.8 1
Volta
ge (m
V)
Percent Intensity
Voltage vs. Intensity
Blue Bulb 50 W
Blue Bulb 65 W
Blue Bulb 150 W

0
0.5
1
1.5
2
2.5
0 1 2 3 4 5
Curr
ent (
mA)
Voltage (mV)
IV Curve
Blue Bulb 50 W
Blue Bulb 65 W
Blue Bulb 150 W
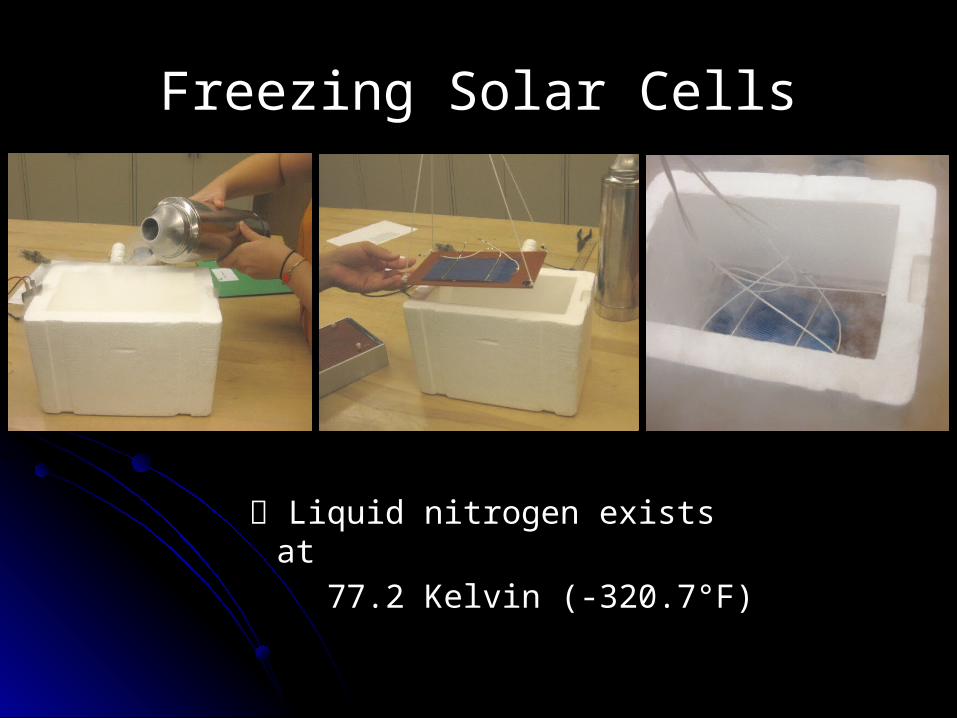
Liquid nitrogen exists at
77.2 Kelvin (-320.7°F)
Freezing Solar Cells

Effects of Freezing
0
1
2
3
4
5
6
7
8
9
0 0.2 0.4 0.6 0.8 1
Volt
age
(mV)
Percent Intensity
Voltage vs. Intensity (Cell A)
Baseline
1st freezing
2nd freezing
3rd freezing
4th freezing

Effects of Freezing
0
1
2
3
4
5
6
7
0 0.2 0.4 0.6 0.8 1
Volt
age
(mV)
Percent Intensity
Voltage vs. Intensity (Cell B)
Baseline
1st Freezing
2nd Freezing
3rd Freezing

Heating Solar Cells
Avg. temp. of object in sunlight: 248°F
Highest temp. metals reach in space: 500°F

Effects of Heating

Testing Radiation
100 microcurie strontium-90 placed on
solar cell
Cells exposed to beta decay (electrons)
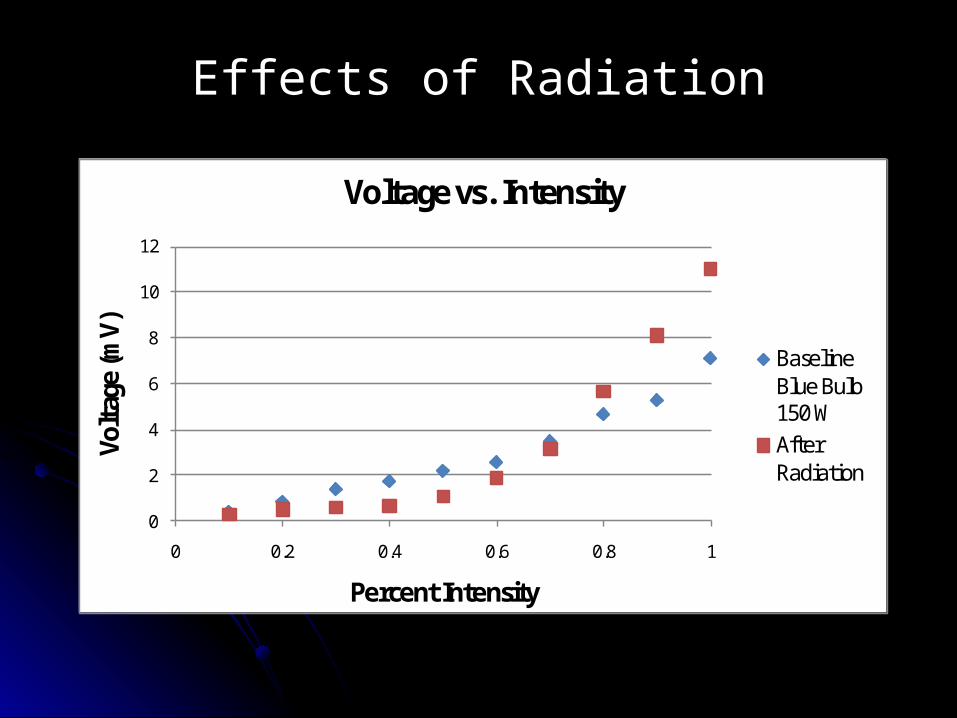
Effects of Radiation
0
2
4
6
8
10
12
0 0.2 0.4 0.6 0.8 1
Volt
age
(mV)
Percent Intensity
Voltage vs. Intensity
Baseline Blue Bulb 150 WAfter Radiation

0
1
2
3
4
5
6
7
8
0 2 4 6 8 10 12
Curr
ent (
mA)
Voltage (mV)
IV Curve
Baseline Blue Bulb 150 WAfter Radiation

Normal solar cell
SEM Imaging
Frozen solar cell

Heated solar cell
SEM Imaging
Normal solar cell

Factors that Affect Outcome
Resistance of voltmeters
Extraneous light sources
Overheating Other damage

Conclusion
Blue Light optimum source 150 W optimum intensity Heating destroys cells Freezing may improve
performance Radiation alters cell
performance Framework for future
experimentation

Acknowledgments
Advisors Dr. Paul Quinn Sally Warner
Liquid Nitrogen Supplier Dr. Ryan Z. Hinrichs
Directors Dr. Miyamoto Dr. Surace

AcknowledgmentsThank you to all of our sponsors!
John and Laura OverdeckThe Ena Zucchi Trust Johnson and Johnson Jewish Communal Fund Bristol-Myers Squibb Bayer HealthCare The Crimmins Family Charitable Foundation Novartis The Edward W. and Stella C. Van Houten Memorial Fund Roche Independent College Fund of New Jersey Corporate Matching Gifts: Alliance Bernstein, AT&T Foundation,
Direct Edge, Goldman, Sachs, and Company, Met Life, Microsoft Corporation, Network for Good
NJGSS Alumnae and Parents 1984 - 2009

Questions?