the effects of inlet water temperature on condensing film
TRANSCRIPT
Rochester Institute of Technology Rochester Institute of Technology
RIT Scholar Works RIT Scholar Works
Theses
6-1-1995
The Effects of inlet water temperature on condensing film The Effects of inlet water temperature on condensing film
coefficiencts coefficiencts
Alan Smith
Follow this and additional works at: https://scholarworks.rit.edu/theses
Recommended Citation Recommended Citation Smith, Alan, "The Effects of inlet water temperature on condensing film coefficiencts" (1995). Thesis. Rochester Institute of Technology. Accessed from
This Thesis is brought to you for free and open access by RIT Scholar Works. It has been accepted for inclusion in Theses by an authorized administrator of RIT Scholar Works. For more information, please contact [email protected].
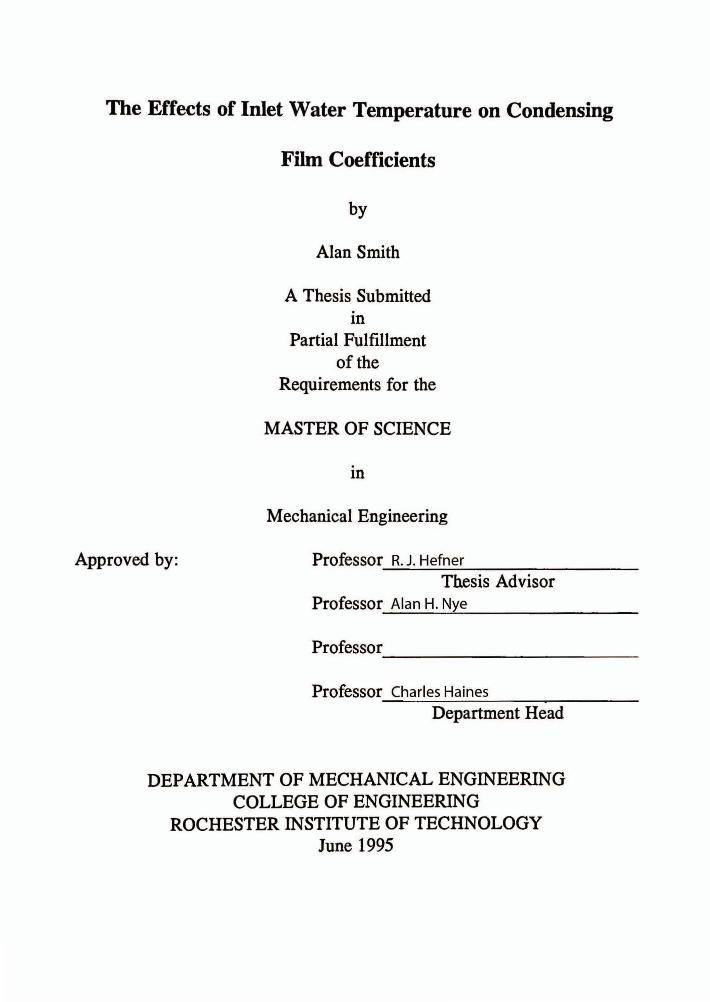
The Effects of Inlet Water Temperature on Condensing
Film Coefficients
Approved by:
by
Alan Smith
A Thesis Submitted m
Partial Fulfillment of the
Requirements for the
MASTER OF SCIENCE
m
Mechanical Engineering
Professor R. J. Hefner
Thesis Ad visor Professor Alan H. Nye
Professor -----------Professor Charles Haines
Department Head
DEPARTMENT OF MECHANICAL ENGINEERING COLLEGE OF ENGINEERING
ROCHESTER INSTITUTE OF TECHNOLOGY June 1995
I, Alan Smith, hereby grant permission to the Wallace Memorial Library of the Rochester Institute of Technology to reproduce my thesis entitled The Effects of Inlet Water Temperature on Condensing Film Coefficients in whole or in part. Any reproduction will not be for commercial use or profit.
June 1995
Alan Smith
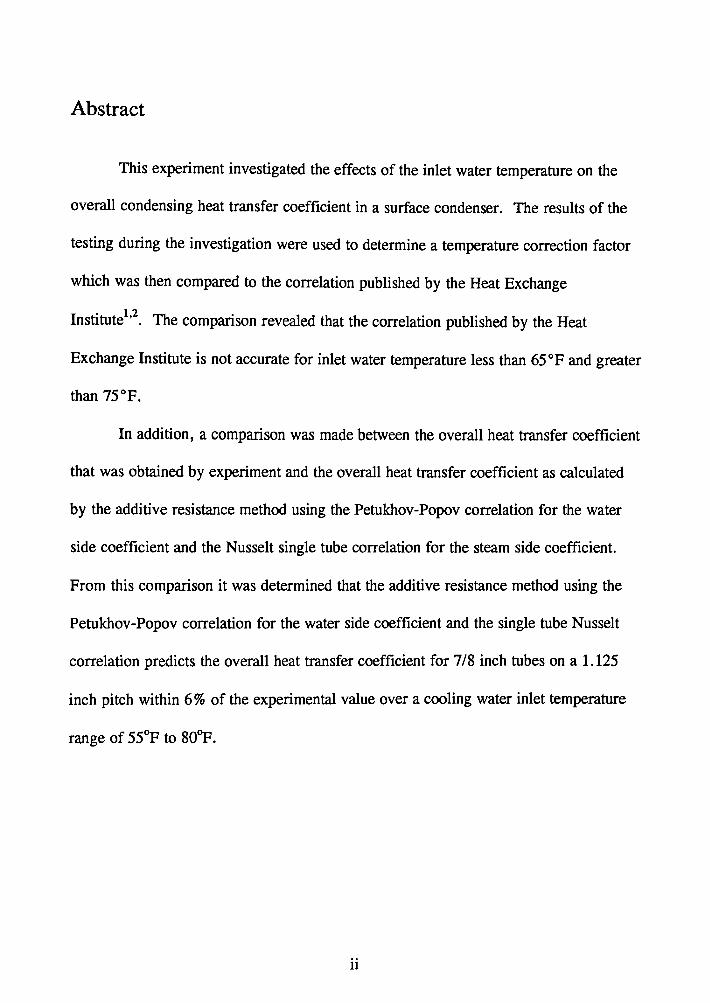
Abstract
This experiment investigated the effects of the inlet water temperature on the
overall condensing heat transfer coefficient in a surface condenser. The results of the
testing during the investigation were used to determine a temperature correction factor
which was then compared to the correlation published by the Heat Exchange
Institute1'2
. The comparison revealed that the correlation published by the Heat
Exchange Institute is not accurate for inlet water temperature less than 65 °F and greater
than 75°F.
In addition, a comparison was made between the overall heat transfer coefficient
that was obtained by experiment and the overall heat transfer coefficient as calculated
by the additive resistance method using the Petukhov-Popov correlation for the water
side coefficient and the Nusselt single tube correlation for the steam side coefficient.
From this comparison it was determined that the additive resistance method using the
Petukhov-Popov correlation for the water side coefficient and the single tube Nusselt
correlation predicts the overall heat transfer coefficient for 7 /8 inch tubes on a 1.125
inch pitch within 6 % of the experimental value over a cooling water inlet temperature
range of 55°F to 80°F.
ii
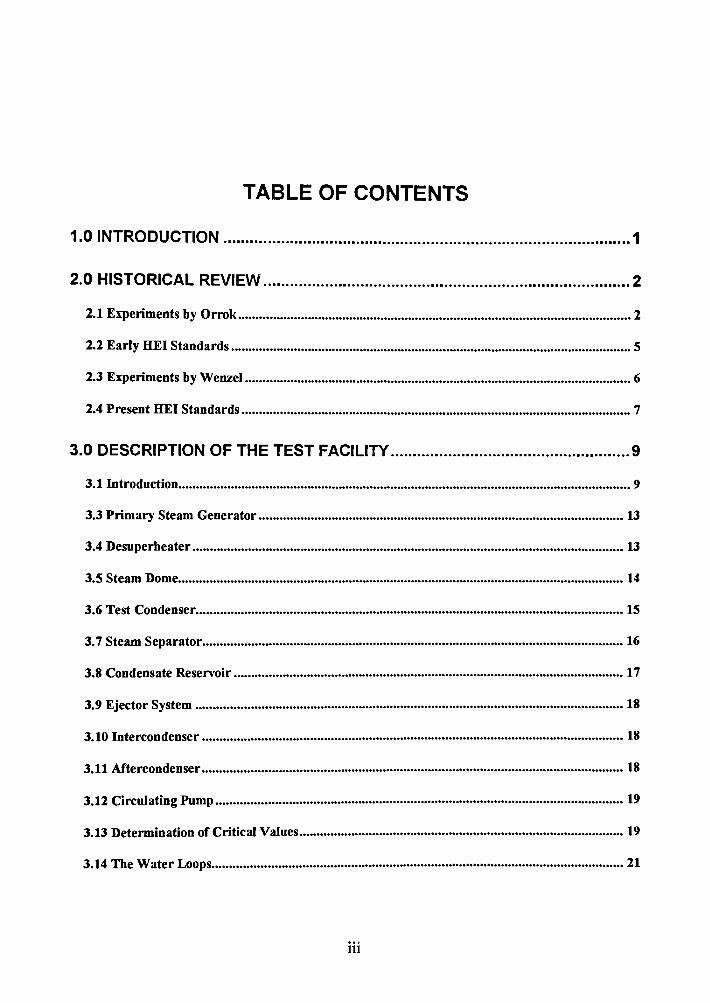
TABLE OF CONTENTS
1.0 INTRODUCTION ............................................................................................ 1
2.0 HISTORICAL REVIEW ................................................................................... 2
2.1 Experiments by Orrok ••••••••••••••••••••••••••••••••••••••••••••••••••••••••••••••••••••••••••••••••••••••••••••••••••••••••••••••••• 2
2.2 Early HEI Standards .••••••••••••••••••••••••••••••••••••••••••.••••••••••••••••••••••••••••••••••••••••••••••••••••••••••••••••••••••• 5
2.3 Experiments by Wenzel ••••••••••••••••••••••••••••••••••••••••••••••••••••••••••••••••••••••••••••••••••••••••••••••••••••••••••••••• 6
2.4 Present HEI Standards •••••••••••••••••••••••••••••••••••••••••••••••••••••••••••••••••••••••••••••••••••••••••••••••••••••••••••••••• 7
3.0 DESCRIPTION OF THE TEST FACILITY ...................................................... 9
3.1 Introduction •••••••••••••••••••••••••••••••••••••••••••••••••••••••••••••••••••••••••••••••••••••••••••••••••••••••••••••••••••••••••••••••••• 9
3.3 Primary Steam Generator ••••••••••••••••••••••••••••••••••••••••••••••••••••••••••••••••••••••••••••••••••••••••••••••••••••••••• 13
3.4 Desuperheater •••••••••••••••••••••••••••••••••••••••••••••••••••••••••••••••••••••••••••••••••••••••••••••••••••••••••••••••••••••••••••• 13
3.5 Steam Dome •••••••••••••••••••••••••••••••••••••••••••••••••••••••••••••••••••••••••••••••••••••••••••••••••••••••••••••••••••••••••••••••• 14
3.6 Test Condenser ••••••••••••••••••••••••••••••••••••••••••••••••••••••••••••••••••••••••••••••••••••••••••••••••••••••••••••••••••••••••••• 15
3. 7 Steam Separator ••••••••••••••••••••••••••••••••••••••••••••••••••••••••••••••••••••••••••••••••••••••••••••••••••••••••••••••••••••••••• 16
3.8 Condensate Reservoir •••••••••••••••••••••••••••••••••••••••••••••••••••••••••••••••••••••••••••••••••••••••••••••••••••••••••••••••• 17
3.9 Ejector System ••••••••••••••••••••••••••••••••••••••••••••••••••••••••••••••••••••••••••••••••••••••••••••••••••••••••••••••••••••••••••• 18
3.10 Intercondenser ••••••••••••••••••••••••••••••••••••••••••••••••••••••••••••••••••••••••••••••••••••••••••••••••••••••••••••••••••••••••• 18
3.11 Mtercondenser ••••••••••••••••••••••••••••••••••••••••••••••••••••••••••••••••••••••••••••••••••••••••••••••••••••••••••••••••••••••••• 18
3.12 Circulating Pump ••••••••••••••••••••••••••••••••••••••••••••••••••••••••••••••••••••••••••••••••••••••••••••••••••••••••••••••••••••• 19
3.13 Determination of Critical Values ••••••••••••••••••••••••••••••••••••••••••••••••••••••••••••••••••••••••••••••••••••••••••••• 19
3.14 The Water Loops •••••••••••••••••••••••••••••••••••••••••••••••••••••••••••••••••••••••••••••••••••••••••••••••••••••••••••••••••••••• 21
iii
3.14.1 Main Reservoir and Cooling Tower Loop ........................................................................... 21 3.14.2 Condenser Cooling Water Loops ........................................................................................ 23 3.14.3 Test Condenser Cooling Water Loop .................................................................................. 23 3.14.4 Water Treatment System .................................................................................................... 24 3 .14. 5 Intercondenser and Aftercondenser Cooling Water Loops ................................................... 24 3.14.6 Desuperheater Cooling Water Loops ................................................................................... 24
3.15 Determination of Critical Values ............................................................................................. 25
3.16 Data Acquisition and Analysis System ..................................................................................... 25
4.0 TEST PROCEDURE AND DATA REDUCTION ........................................... 28
4.1 Test Procedure ........................................................................................................................... 28
4.2 Data Reduction ........................................................................................................................... 32
5.0 RESULTS ..................................................................................................... 39
6.0 DISCUSSION ................................................................................................ 50
7.0 CONCLUSIONS ........................................................................................... 52
REFERENCES ................................................................................................... 54
APPENDIX A ...................................................................................................... 55
APPENDIX 8 ...................................................................................................... 56
B.1 Data Reduction Methodology and Error Analysis ................................................................... 56
B.2 Cooling Water Measurements ................................................................................................... 58
B.3 Steam Measurements ................................................................................................................ 59
B.4 Determination of Heat Duties ................................................................................................... 61
B.5 Determination of Overall Heat Transfer Coefficients .............................................................. 63
B.6 Determination of Condensing Heat Transfer Coefficients ....................................................... 64
APPENDIX C ...................................................................................................... 66
iv
TABLE OF FIGURES
Figure Page
2-0 Orrok's Inlet Water Temperature Correction Factor ................................ .5
2-1 HEI's Inlet Water Temperature Correction Factor ................................... 8
3-0 Steam Loop Schematic .................................................................. 11
3-1 Three Dimensional Steam Loop Model. .............................................. 12
3-2 Cross Section of Desuperheater ........................................................ 14
3-3 Cross Section of Test Condenser ...................................................... 16
3-4 Water Loop Schematic .................................................................. 22
5-0 Overall Heat Transfer Coefficient From Test Runs ................................ .41
5-1 Predicted Overall Heat Transfer Coefficient ........................................ .44
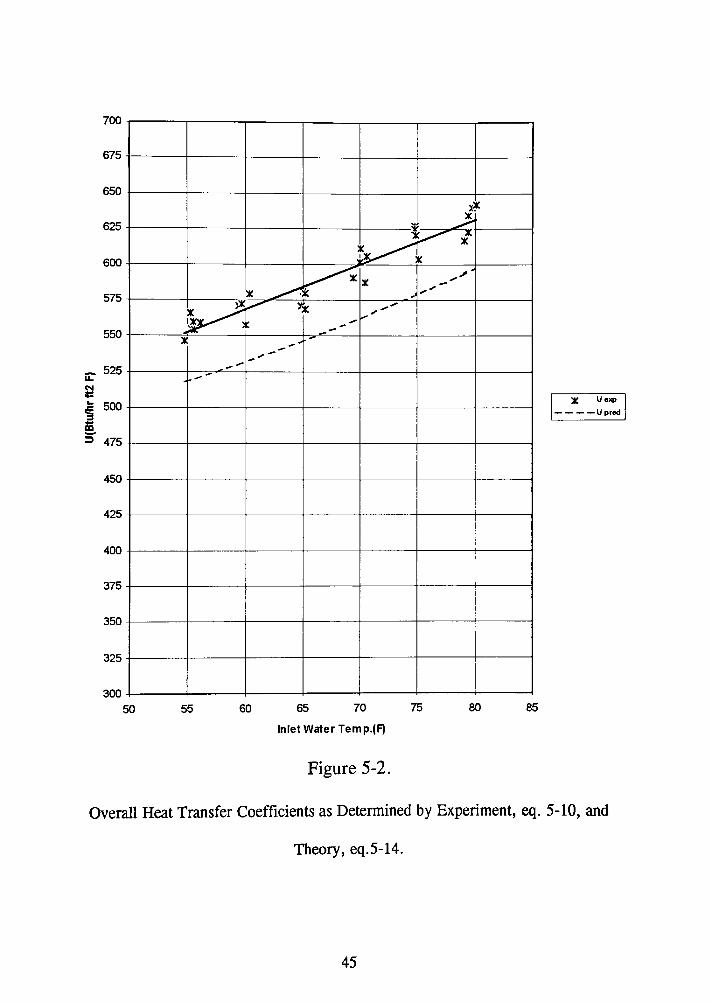
5-2 Overall Heat Transfer Coefficients as Determined by Experiment
and Theory ................................................................................ 45
5-3 Comparison of Overall Heat Transfer Coefficient ................................. .47
5-4 Condensing Heat Transfer Coefficient. .............................................. .48
5-5 Inlet Water Temperature Correction Factor ......................................... .49
V
LIST OF TABLES
Table Page
4-1 Test Stability Analysis .................................................................. 34
4-2 Typical Test Run Output. .............................................................. 38
vi
A Cp D p
f g H h k LMTD M Nu Pr Q R Re T u V w µ p
Subscripts A C
CL I 1 0
s
LIST OF SYMBOLS
condenser surface area, ft2
specific heat, Btu/lb 0 P tube diameter, ft correction factor friction factor gravity , ft/hr2
heat transfer coefficient, Btu/hr ft2 0 P heat transfer coefficient, Btu/hr ft2 0 P thermal conductivity, Btu/hr ft 0 P log mean temperature difference, 0 P mass flow rate, lb/hr Nusselt number Prandtl number heat duty, Btu/hr tube wall resistance, [Btu/hr ft2 0 Pr1
Reynolds number temperature, 0 P overall Heat Transfer Coefficient, Btu/hr ft2 0 P velocity, ft/sec wetted diameter, ft dynamic viscosity, lb/ft hr density, lb/ft3
air concentration condensing side under clean conditions inside diameter liquid outside diameter refers to steam side
vii

sat saturated condition si steam inlet t refers to tube w refers to water side wall refers to tube wall wi water inlet WO water outlet
viii
1.0 INTRODUCTION
The Heat Exchange lnstitute1'2
, HEI, has developed and published an empirical
method for sizing and rating steam surface condensers. HEI's method of calculating
the overall condensing heat transfer coefficient is widely accepted and has been used by
the electric power industry for over fifty years.
The overall condensing heat transfer coefficient, as calculated by HEI, is
proportional to the square root of the cooling water velocity. To determine the overall
coefficient the HEI method multiplies the square root of the velocity by several
constants. The constants attempt to account for the effects of the tube diameter, tube
material, the cleanliness of the condenser, and the inlet water temperature.
The two men primarily responsible for developing the empirical formula for
HEI were Orrok3 and Wenzel4. Orrok conducted his experiments in 1910 and
Wenzel's research was sponsored by HEI from 1956 to 1962. Both of these men
conducted hundreds of tests. However, all of their experiments were based on a single
tube and both were limited by the technology of their day.
The primary objective of this project is to experimentally evaluate the effects of
the inlet water temperature on the condensing and overall film coefficients for a 54 tube
steam surface condenser. Next, the experimental results will be compared to
theoretical methods. Finally, the experimental results will be used to evaluate HEI's
inlet water temperature correction factor.
1
2.0 HISTORICAL REVIEW
The equation for predicting the overall heat transfer coefficient, U, in the
condensing regime is given by the following additive resistance equation:
2-1
where only the convective heat transfer coefficient of the water on the inside of the
tubes, hi, and the tube wall resistance, Rw, can be predicted with confidence. The
resistance on the inside tube wall due to fouling, Rr, can only be estimated by
experience. The term he represents the overall shell side condensing coefficient. The
local values of the condensing coefficient are very high at the steam inlet of a surface
condenser due to vapor shear and then decreases due to condensate loading and an
increase in the percentage of non-condensibles.
2.1 Experiments by Orrok
The following quotes from Orrok's 1910 paper3 represent the information of the
time on heat transfer in steam surface condensers.
1. The quantity of heat transmitted by a unit of surface in unit time is proportional to the temperature difference (Joule, Rankine ... ) or to the square of the temperature difference (Werner, Grashof and Weiss) between the media on the different sides of the tube.
2. The quantity of heat transmitted is proportional to some power • 1/3 d 1/2 b of the water velocity (V w by Joule an Ser, V w y Hagemann
and Josse, Vw1 by Stanton).
3. The quantity of heat transmitted is proportional to some power of the steam velocity or mass flow (Vs
112 by Hausbrand and Ser,
mass flow by Jordan).
2
4. The quantity of heat transmitted is greatly affected by the amount of non-condensible vapors on the steam side of the tube (Bourne, Smith Weighton, Morison, McBride).
The first documented data taken with steam condensing under vacuum on the
outside of a horizontal tube was done by Orrok. His tests were conducted with exactly
one square foot of condensing surface using a one inch tube in an annulus. He
produced hundreds of data points over various ranges of water velocities, inlet
temperatures, and steam flow rates. The tube materials that were tested varied from
copper to high alloy steels. From his extensive test data Orrok derived the following
empirical formula:
2-2
where U is the overall heat transfer coefficient in BTU/hr ft2 °F, C is a correlation
constant with the units BTU sec1 .s /3600 n2·5 °F, and V is the cooling water velocity in
ft/sec. FcL, FTM, FA, are correction factors that account for the cleanliness of the
condenser, the tube material, and the air concentration in the condenser respectively.
The above formula may seem simplistic, however, it is interesting to note that
Orrok's work predated Nusselt's film condensation analysis and occurred before any
correlations for the convective heat transfer coefficients for water flow inside tubes
were known.
To test the effects of the inlet water temperature Orrok bled steam through a 1/2
inch line into his main water line. This allowed him to vary the temperature from 40 to
3
110°F. The only tube material that was used for these tests was admiralty that he
cleaned after every 10 to 12 tests. Therefore, the accuracy of his results are
questionable due to the fact that copper bearing alloys are now known to exhibit
dropwise condensation characteristics when they are new and clean. This fact was not
known at the time of Orrok's experiments; however, he did mention in his paper that
he noticed that there was approximately a twenty percent decrease in the heat transfer
coefficient after 10 to 12 tests.
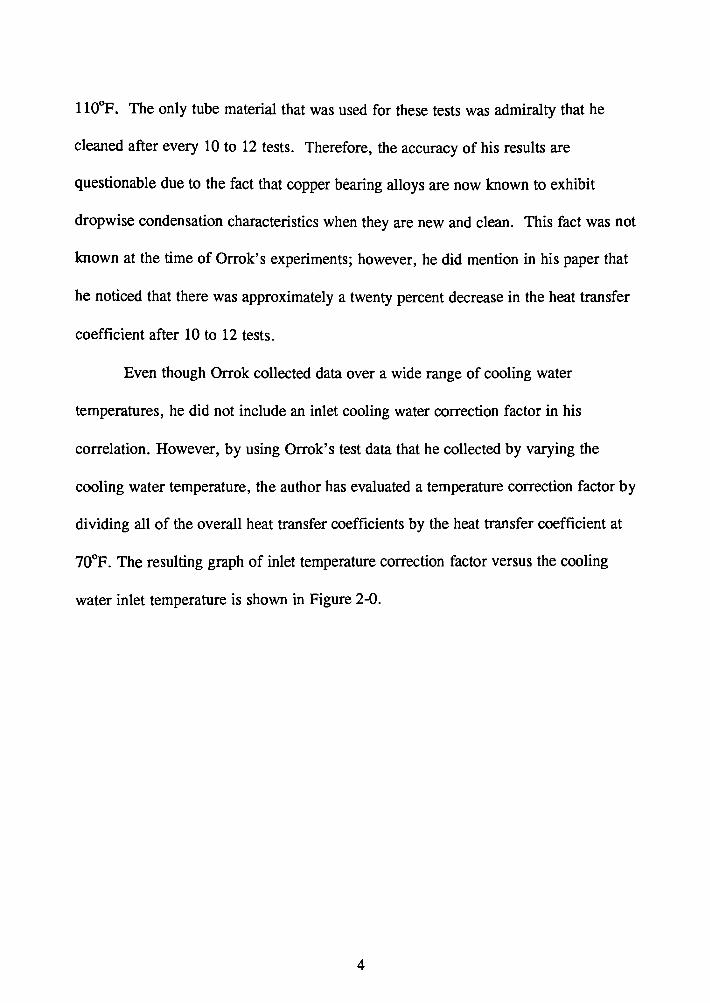
Even though Orrok collected data over a wide range of cooling water
temperatures, he did not include an inlet cooling water correction factor in his
correlation. However, by using Orrok's test data that he collected by varying the
cooling water temperature, the author has evaluated a temperature correction factor by
dividing all of the overall heat transfer coefficients by the heat transfer coefficient at
70°F. The resulting graph of inlet temperature correction factor versus the cooling
water inlet temperature is shown in Figure 2-0.
4
1.6
1.5 lK
1.4 lw
.. ~ 1.3
" II. ..: 1.2 0 c., a. E 1.1 ~
.... , ii-
~ lK lK
lK
V:l·lK .lK' lK -
;~~ ::IC"'
~ .... ~ xl
-~'ii
~ ...
0.9 ~~
lK
0.8 40 50 60 70 80 90 100 110 120
Inlet Water Temp. (F)
Figure 2-0.
Orrok's Inlet Water Temperature Correction Factor
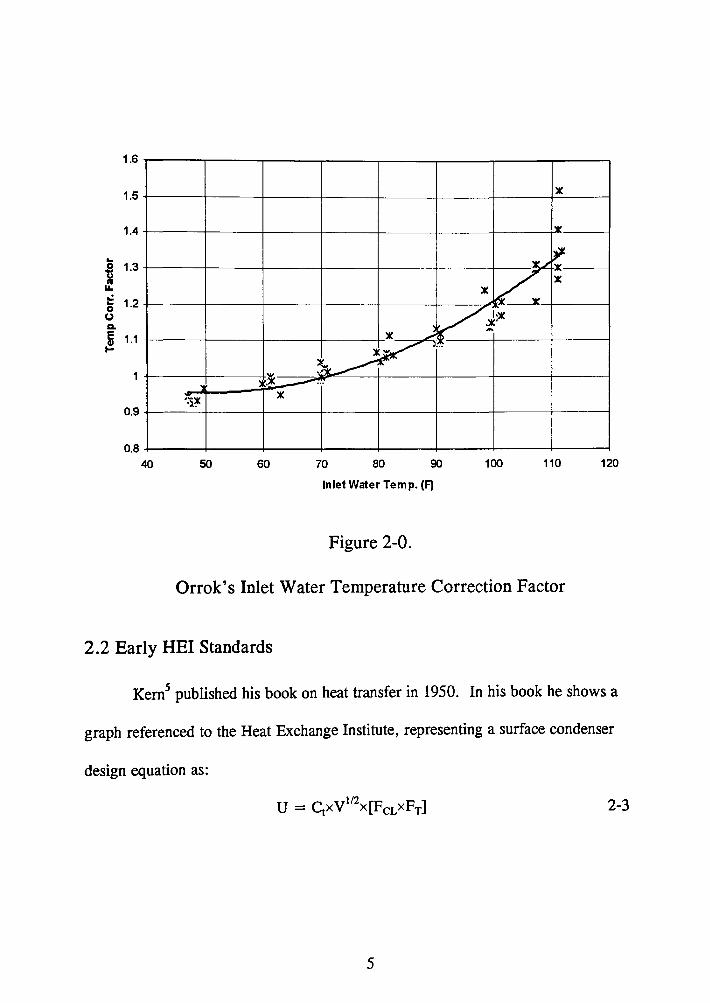
2.2 Early HEI Standards
Kern5 published his book on heat transfer in 1950. In his book he shows a
graph referenced to the Heat Exchange Institute, representing a surface condenser
design equation as:
2-3
5
In using the above formula REI was maintaining the basic form of Orrok's equation
with only a few modifications. Ct, a correlation constant, includes a tube diameter
effect on the overall heat transfer coefficient. The values for this constant are still the
same today. The factor FA which accounted for the effects of air was removed. Also
removed was the FTM factor which accounted for the effects of tube material. A
correction factor, FT, was added to HEI's equation so that the effect of the cooling
water inlet temperature could be represented.
It is interesting to note that HEI' s equation is an exact duplication of a method
presented in an article in the journal "Power"6 from 1932, credited as being authored
by "leading US surface condenser manufacturers."
2.3 Experiments by Wenzel
HEI sponsored a proprietary project with LeHigh University in 1941. Initially
the experiments were to be conducted by Professors Stuart and Jackson of the
University's Mechanical Engineering Department. However, with the beginning of
World War II the research was delayed. In 1946 the testing began again and in 1956
Prof. Wenzel of Lehigh University headed the project.
Wenzel used a well instrumented single tube test apparatus. The major concern
of his research was to examine the effects of tube material on the overall heat transfer
coefficient. The results of his testing yielded over 2000 sets of data taken on nearly
200 specimens. It also included a number of other parameters such as outside tube
6
diameter, wall thickness, wall finning and fluting, surface plating, inlet water
temperature and water flow rates. The results of his work were in an open literature
publication4. However, in this report Wenzel did not publish any information in
regards to the inlet water temperature correction factor.
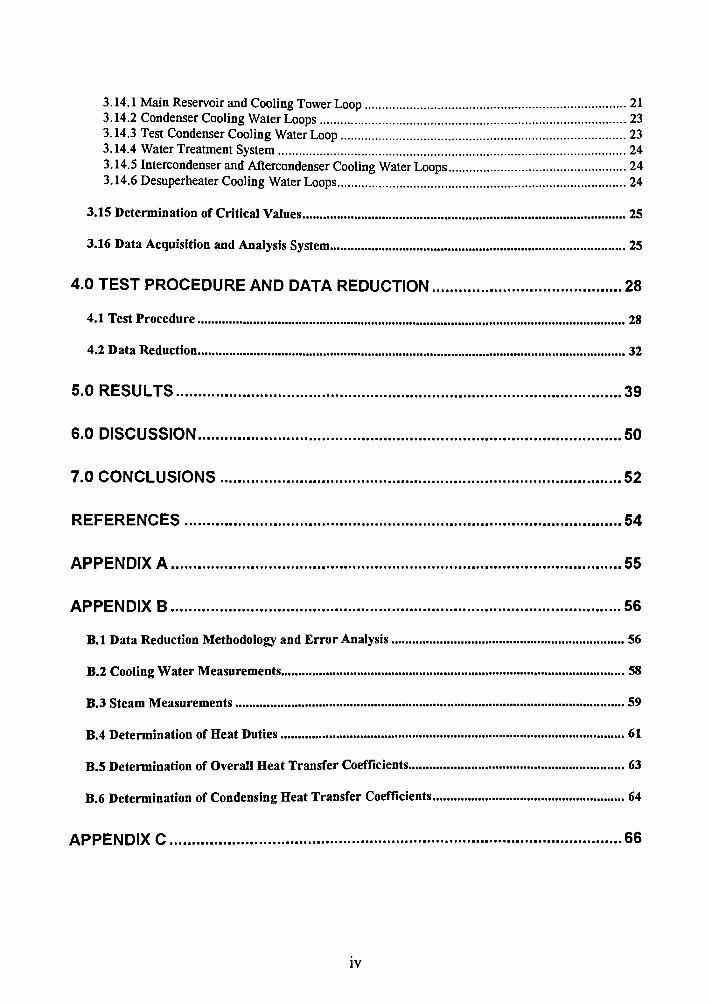
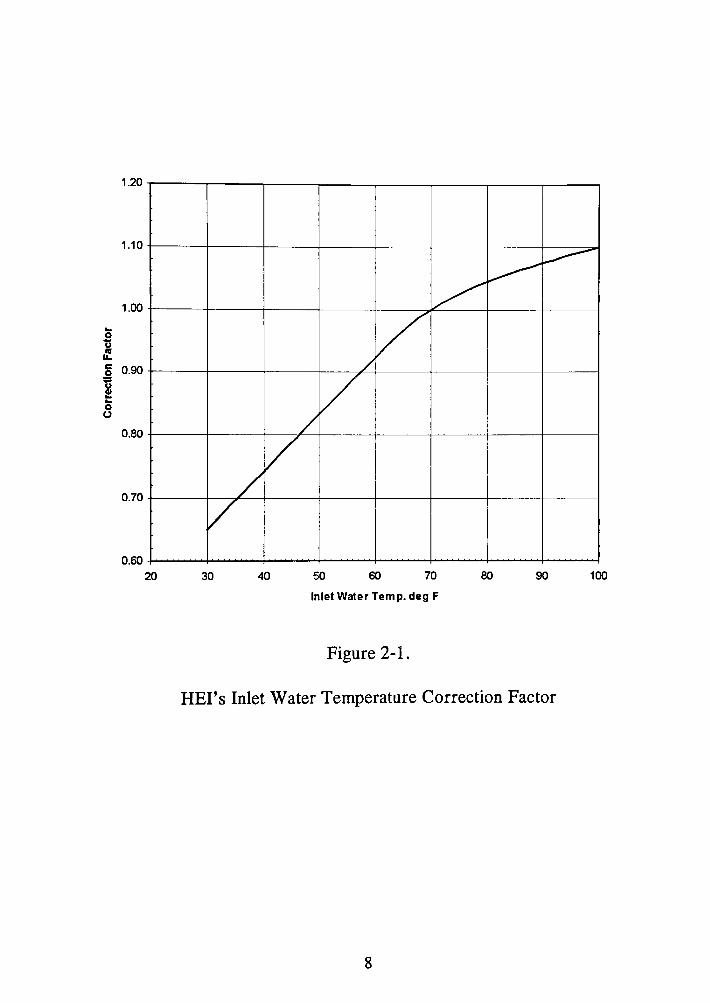
2 .4 Present HEI Standards
The present HEI method for determining the overall heat transfer coefficient is
basically the same as that presented in Kern's5 book. The only difference is that the
wall material factor, FTM, that was originally proposed by Orrok and deleted by Kern,
has been added. This addition yields the following equation:
2-4
It is the temperature correction factor, FT, that is of prime interest for this
paper. In the current edition of HEI Standards for Steam Surface Condensers1
, FT is
presented in graphical form as shown in Figure 2-1.
7
1.20
1.10
1.00
.. 0 "G " II. C 0.90 0
13 2! .. 0 0
0.80
~ _.,,--
/ /
/
V /
V /
/ 0.70
0.60 20 30 40 50 60 70 80 90 100
Inlet Water Temp. deg F
Figure 2-1.
HEI's Inlet Water Temperature Correction Factor
8
3.0 DESCRIPTION OF THE TEST FACILITY
3 .1 Introduction
The test facility used for this project provides a realistic simulation of the
entrance region of power plant surface condensers. It is equipped with high precision
instrumentation and automated data acquisition and control systems, as well as manual
controls and Bourdon tube gauges. It is easy to control, regulate and maintain, and is
capable of providing dependable, reproducible results. Some of the highlights of the
test facility design and operational characteristics are:
1. A steam generator which utilizes energy from a 350°F high pressure water primary
heating system used on the RIT campus. This water heated steam generator allows
more precise regulation of temperature, pressure and steam flow rate than could be
maintained with a conventional fuel-fired boiler.
2. A shell and tube heat exchanger with finned tubes to regulate the degree of
superheat of steam entering the test condenser.
3. A large steam dome to ensure homogeneous, uniform steam velocity entering the
test condenser.
4. A test condenser with interchangeable tube sheets, which permits incorporation of
various tube sizes and tube layouts.
5. An innovative approach of using 0-rings between two stainless steel plate
tubesheets at each end of the test condenser to seal the tubes in place. This
9
approach enables a straightforward, fast and inexpensive method of insertion and
removal of condenser tubes of various materials.
6. A steam separator to collect and measure condensate from the test condenser and
pass residual steam and noncondensible gases to a vacuum system.
7. Steam ejectors to remove noncondensible gases and uncondensed steam and provide
ease of control.
8. A large reservoir for the cooling water and cooling tower to accurately control the
cooling water temperature for all components in the system.
9. An on-line continuous water treatment system to prevent fouling.
10. Redundancy of high precision instrumentation to ensure reliable measurement of
critical parameters.
11. Use of ASME critical flow orifices to ensure accurate measurement of steam flow
rates to the test condenser.
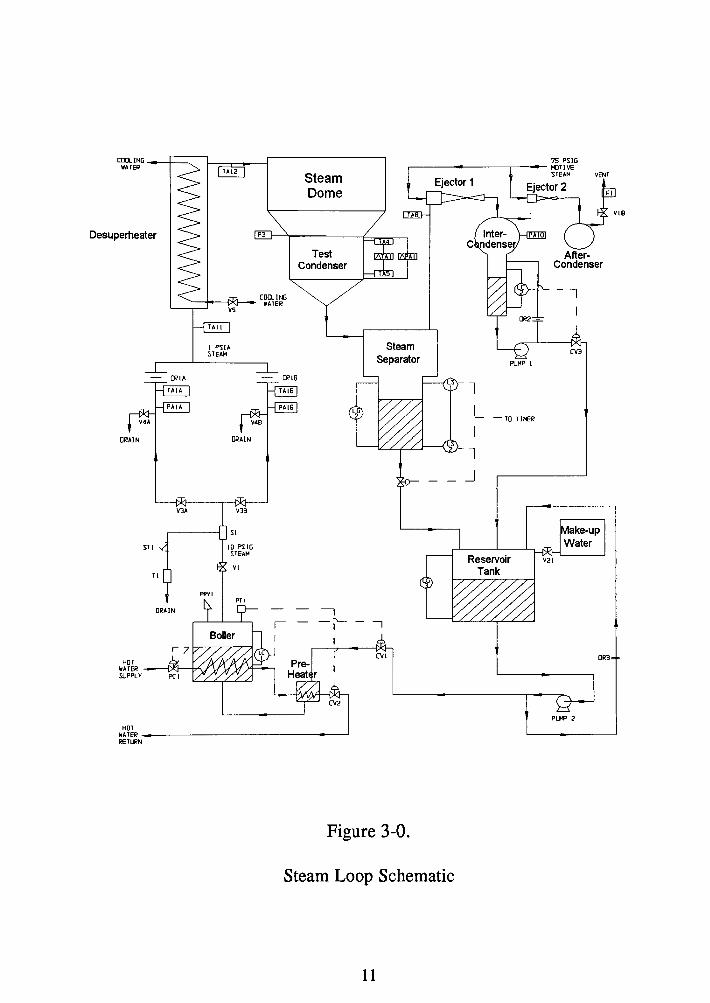
3.2 The Steam Loop
The steam loop was designed and engineered by the Graham Manufacturing
Company of Batavia, New York. Graham also fabricated several of the major
components in addition to procuring many of the other components for the steam loop.
A schematic diagram showing the major components of the steam loop is shown in
Figure 3-0. Also, a print-out of a three-dimensional wire frame model of the main
portion of the steam loop is shown in Figure 3-1.
10
Desuperheater
DRAIN
STI
HOT
113A
I PSU STEAM
lfATER ---(';lji--+,4 i' SUPPLY
HOT
DRAIN
IIJB
Steam Dome
Test Condenser
lfATER ----------------------' 11ETURN
75 PSIG ~------------ l'IITIVE
Steam Separator
CVI
I_
I
l _J
PUHP I
-TO TIMER
STEAM \/ENT
AfterCondenser
l
Make-up Water
DR3
PLK' 2
Figure 3-0.
Steam Loop Schematic
11
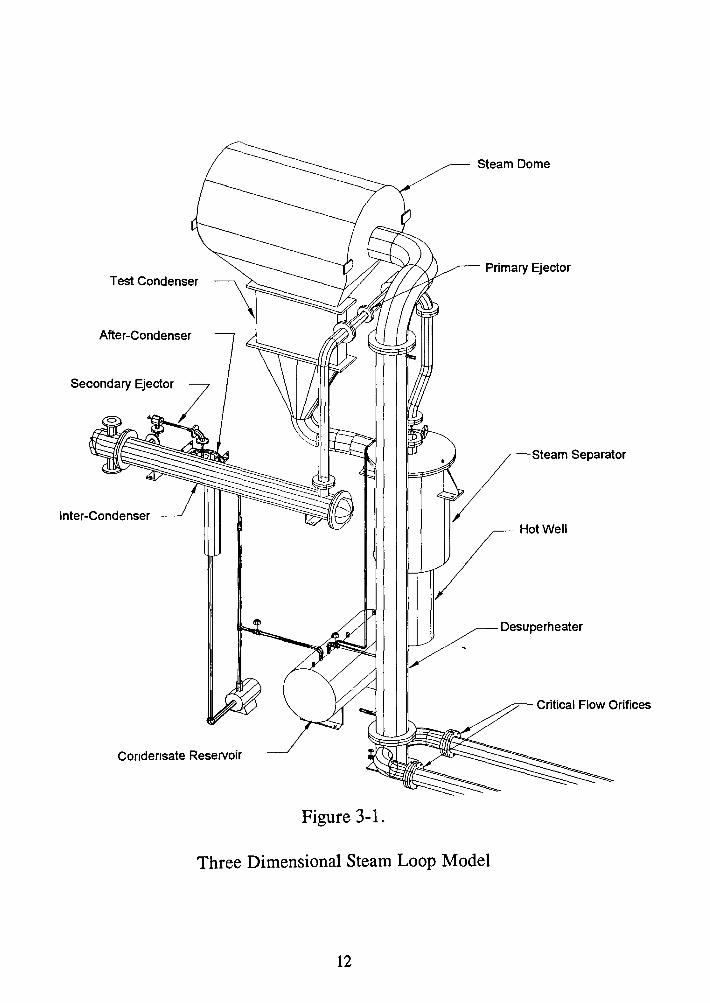
Steam Dome
Primary Ejector
After-Condenser
Inter-Condenser
~ Desuperheater
Critical Flow Orifices
Condensate Reservoir
Figure 3-1.
Three Dimensional Steam Loop Model
12
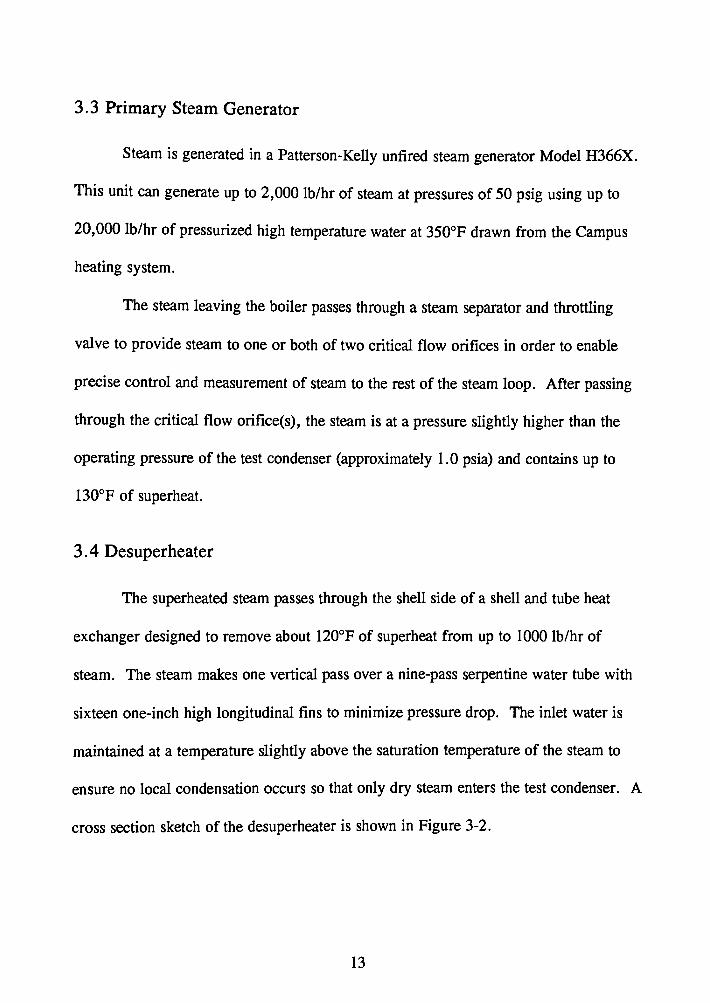
3. 3 Primary Steam Generator
Steam is generated in a Patterson-Kelly unfired steam generator Model H366X.
This unit can generate up to 2,000 lb/hr of steam at pressures of 50 psig using up to
20,000 lb/hr of pressurized high temperature water at 350°F drawn from the Campus
heating system.
The steam leaving the boiler passes through a steam separator and throttling
valve to provide steam to one or both of two critical flow orifices in order to enable
precise control and measurement of steam to the rest of the steam loop. After passing
through the critical flow orifice(s), the steam is at a pressure slightly higher than the
operating pressure of the test condenser (approximately 1.0 psia) and contains up to
I30°F of superheat.
3. 4 Desuperheater
The superheated steam passes through the shell side of a shell and tube heat
exchanger designed to remove about I20°F of superheat from up to 1000 lb/hr of
steam. The steam makes one vertical pass over a nine-pass serpentine water tube with
sixteen one-inch high longitudinal fins to minimize pressure drop. The inlet water is
maintained at a temperature slightly above the saturation temperature of the steam to
ensure no local condensation occurs so that only dry steam enters the test condenser. A
cross section sketch of the desuperheater is shown in Figure 3-2.
13
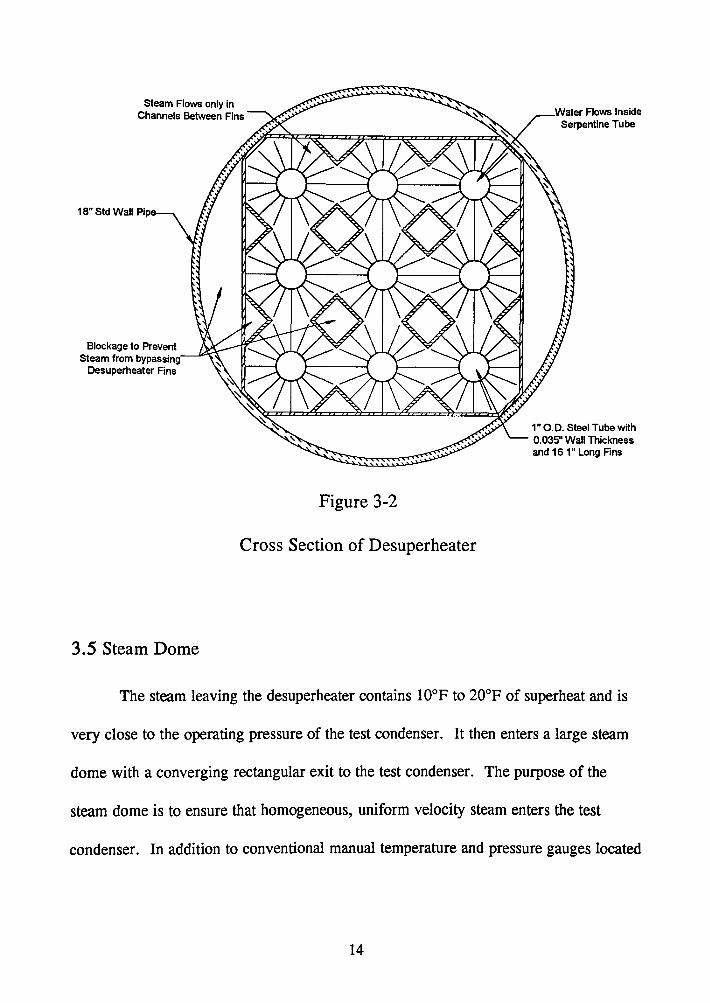
Steam Flows only in Channels Between Fins
18" Std Wall Pip
Blockage to Prevent Steam from bypassing·~--."
Desuperheater Fins
Figure 3-2
Cross Section of Desuperheater
3.5 Steam Dome
Water Flows Inside Serpentine Tube
1" 0.0. Steel Tube with 0.035" Wall Thickness and 161" Long Fins
The steam leaving the desuperheater contains 10°F to 20°F of superheat and is
very close to the operating pressure of the test condenser. It then enters a large steam
dome with a converging rectangular exit to the test condenser. The purpose of the
steam dome is to ensure that homogeneous, uniform velocity steam enters the test
condenser. In addition to conventional manual temperature and pressure gauges located
14
in the steam dome, a high precision basket tip pressure transducer was installed near
the exit of the steam dome to provide accurate stagnation pressure measurement of the
steam.
3.6 Test Condenser
The test condenser has a rectangular internal cross section, six inches wide,
three feet long, and twenty four inches deep. The end walls of the test condenser are
removable and constitute the internal tube sheets. A second set of tube sheets are
provided on the outside of the test condenser to compress 0-rings mounted on the tubes
and to seal the system. This innovative design enables an inexpensive and rapid
method of interchanging tubes to be tested in the condenser. Figure 3-3 shows a cross
section of the tube field lay for this experiment.
High precision absolute and differential pressure and temperature sensors are
provided just above and below the tube bank in the test condenser. These instruments
enable direct measurement of the actual temperature and pressure of the steam at the
inlet and exit of the test condenser, as well as direct measurements of the differential
temperature and pressure drops across the test condenser. The test condenser is also
equipped with a removable steel plate on one side to enable installation of an
observation window, if desired.
15
STEAM
t
IS''
L6"_J
1. 12S"
DUMMY HALF TUBES
54 7/8" TUBES
Figure 3-3.
Cross Section of Test Condenser
3. 7 Steam Separator
60°
I 0. 974"
The discharge from the test condenser, consisting of the condensate, surplus
uncondensed steam, and noncondensible gases is guided to a steam separator. The
16
temperature and pressure in the steam separator are monitored. A hotwell, eighteen
inches in diameter and thirty inches deep, is equipped with low and high level sensors
and a transparent sight glass. These sensors are connected to a timer that is monitored
by the data acquisition system. This design enables accurate measurement of the time
required to collect a fixed quantity of condensate, whose volume is equal to the product
of the cross sectional area of the separator and the distance between the low and high
level sensors.
A test run consists of the time required to collect a fixed volume of condensate
(3.25 ft3), typically between 20 and 40 minutes. This is accomplished by manually
actuating a control valve in the condensate discharge line to the closed position. The
test run is automatically initiated when condensate in the hotwell reaches the low level
sensor and is automatically terminated when the condensate reaches the high level
sensor. At this time the condensate control valve is automatically opened to allow the
hotwell to empty.
3. 8 Condensate Reservoir
The condensate discharged from the steam separator and the intercondenser is
routed to a reservoir that is equipped with low and high level sensors and a make-up
water system. The reservoir is "normally open" to the test condenser portion of the
steam loop and is, thus, at a pressure near that of the test condenser.
17
3. 9 Ejector System
Uncondensed residual steam and any noncondensible gases exiting the test
condenser are removed from the steam separator by an ejector system. The ejector
system consists of a primary and a secondary ejector separated by an intercondenser.
Both ejectors utilize motive steam generated in a separate gas fired boiler and regulated
to 75 psig. The pressure and temperature of the motive steam entering each ejector are
monitored.
3 .10 lntercondenser
The intercondenser located between the two ejectors condenses most of the
residual steam from the steam separator and the motive steam from the primary ejector.
This condensate is collected in the hotwell of the intercondenser that is equipped with
low and high level sensors. The level sensors control a valve in the discharge line from
the hotwell to a sealed pump which returns the condensate to the condensate reservoir
described above.
3 .11 Aftercondenser
An aftercondenser is located downstream from the secondary ejector and
operates at atmospheric pressure. The motive steam from the secondary ejector is
condensed and discarded to a waste drain. Any noncondensible gases from the steam
loop exit the aftercondenser through cascaded flow meters. This enables accurate
18
monitoring of noncondensible gases in the test loop to ensure there are no leaks in the
system.
Before installation, the ejector system capacity was calibrated by the Graham
Manufacturing Company. Certified performance curves were provided which show the
ejector steam capacity as a function of the suction pressure measured at the primary
ejector suction point. This provides an accurate determination of the flow rate of
uncondensed steam from the test condenser.
3 .12 Circulating Pump
A centrifugal pump continuously draws condensate from the condensate
reservoir tank described above to provide make-up water to the Patterson-Kelly boiler.
Excess water beyond that required by the boiler that passes through the circulating
pump is returned to the condensate reservoir tank.
3.13 Determination of Critical Values
The critical measurements required for the steam loop are the flow rate of steam
to the test condenser, the pressure and temperature at the inlet of the test condenser, the
pressure and temperature at the exit of the test condenser, the rate at which steam is
condensed in the test condenser, and the rate at which uncondensed steam passes
through the condenser. Independent measurements of the total steam flow rate to the
condenser, and condensate and uncondensed steam flow rates leaving the test condenser
19
provide the data required to conduct a mass balance of the steam to ensure the validity
of test data.
The measured pressure at the inlet of the test condenser enables the
determination of the saturation temperature at that point. The measured temperature
and the determined saturation temperature allow the determination of the degree of
superheat present at the inlet to the test condenser. The measured temperature at the
exit of the test condenser is a direct measure of the saturation temperature at that point
since tests are always conducted such that at least ten percent of the entering steam
remains uncondensed. This assures that the test condenser operates at full capacity.
This saturation temperature measurement can be compared to the saturation temperature
evaluated at the condenser exit from the measured exit pressure as a further check of
the validity of the data.
The data collected from the steam loop permits the determination of the total
heat duty, the heat duty required to cool the superheated steam to the saturation point,
and the heat duty required to condense saturated vapor. The data also enables
evaluation of the pressure drop and saturation temperature depression across the test
condenser.
20
3.14 The Water Loops
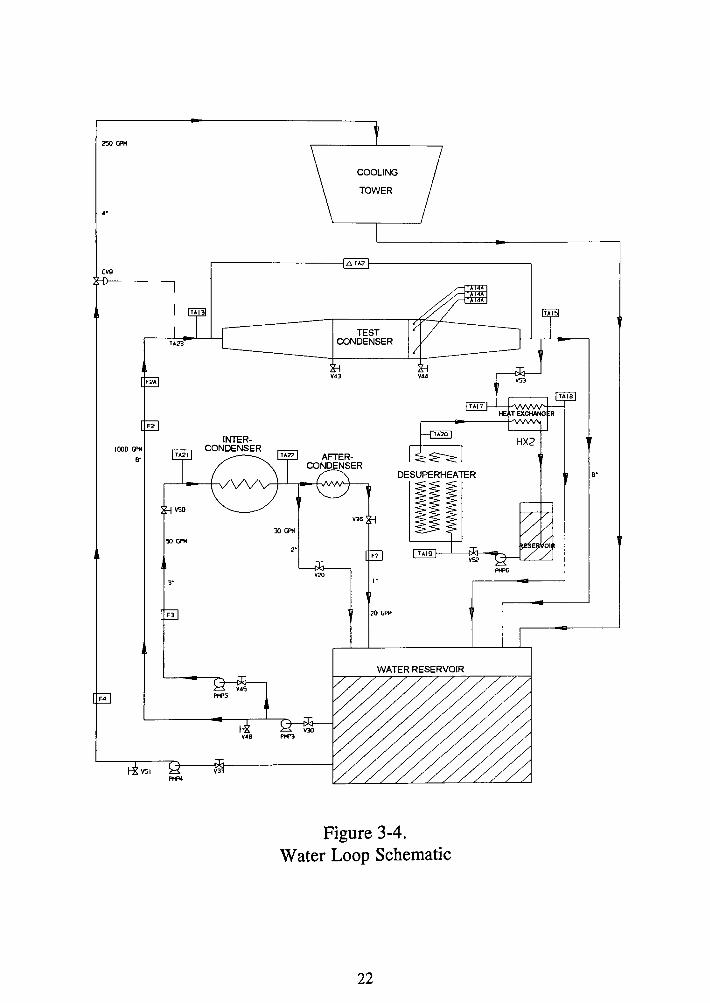
3.14.1 Main Reservoir and Cooling Tower Loop
A schematic of the water loops is shown in Figure 3-4. A five thousand gallon
reservoir is maintained at the desired operating temperature to supply cooling water to
all components in the test facility. This is accomplished with a 750,000 Btu/hr Marley
cooling tower located on the roof and supplied with up to 250 gpm of water by a 10 Hp
Goulds pump. A thermocouple in the line feeding cooling water to the test condenser
continuously monitors and controls a valve which supplies water to the cooling tower at
a rate necessary to maintain the desired reservoir temperature.
21
250 GPH
CV9
F4
1000 GPH
e·
i
l.A23
V50
50 G"4
3•
F3
"4PS
V3 "4P4
JO GPH
2·
V20
COOLING
TOWER
TEST CONDENSER
V43
V36
,.
20 GPM
WATER RESERVOIR
Figure 3-4. Water Loop Schematic
22
e·
3.14.2 Condenser Cooling Water Loops
Cooling water for the test condenser, the intercondenser, and the aftercondenser
is drawn from the reservoir by a 40 Hp Taco pump at up to 2,000 gpm. The main
discharge line from the pump is divided into separate feed lines for the test condenser,
for the intercondenser, and for the aftercondenser via manually controlled valves. The
water flow rate to the test condenser is monitored by both electro-magnetic and ultra
sonic flow meters. The flow rates to the intercondenser and aftercondenser are
monitored by orifice flow meters.
3.14.3 Test Condenser Cooling Water Loop
The temperature of the cooling water entering and exiting the test condenser is
measured by high precision platinum resistance temperature devices (RTD} that are
calibrated to provide differential temperatures with an accuracy of 0.02°F. The cooling
water exiting the test condenser passes through three separate eighteen inch long
measurement zones. High precision platinum RTD's (TA14a, TA14b and TA14c)
monitor the bulk temperature of the water in each region to see if there is any
measurable difference in the rate of heat transfer in the test condenser between tubes at
the top, middle, and bottom of the test condenser. A baffled mixing zone is located
twenty inches downstream from the exit of the test condenser to ensure a true average
cooling water temperature is measured by the high precision RTD (TA15) located thirty
23
inches from the exit. The cooling water from the test condenser is then returned
directly to the reservoir.
3.14.4 Water Treatment System
An automatic chemical treatment system is located in the return line of the test
condenser cooling water loop to maintain the pH levels between 7 .1 to 8.2 to ensure
that there is no solid deposition in the condenser tubes and to prevent any possibility of
bacterial fouling.
3.14.5 Intercondenser and Aftercondenser Cooling Water Loops
Approximately 27500 pounds per hour of cooling water passes through the
intercondenser. After exiting the intercondenser, approximately twenty gallons per
minute of this water flows through the aftercondenser before it is returned to the
reservoir, while the remainder returns directly to the reservoir. The inlet and exit
temperatures, as well as the flow rates of cooling water to both of these condensers, are
monitored continuously for purposes of additional material and energy balance checks.
3.14.6 Desuperheater Cooling Water Loops
The cooling water system for the desuperheater consists of two loops. One is a
closed circulating loop within which a 4 Hp Goulds pump draws water from a 40
gallon reservoir, directs it through the desuperheater, through a Graham heliflow heat
exchanger, and back to the reservoir. Water flow rate in this loop is controlled by a
24
manual valve to provide the desired degree of superheat in the steam flowing to the test
condenser (10-20°F). The second loop draws water from the main reservoir and passes
it through the heliflow heat exchanger and back to the reservoir. The flow rate in this
loop is controlled by a manual valve to maintain the inlet temperature of cooling water
to the desuperheater at approximately 3°F above the saturation temperature of the
steam. This ensures that no local condensation of steam can occur in the
desuperheater.
3 .15 Determination of Critical Values
The critical measurements for the water loops are the mass flow rate and the
temperature rise of cooling water across the test condenser. These data allow
determination of the total heat duty in the test condenser, which is compared to the total
heat duty obtained from the steam loop data to ensure the validity of the data. The
other data monitored and collected from the water loops are critical for the control of
the desired operating conditions of the system, but are not necessary for the thermal
analyses to be discussed below.
3.16 Data Acquisition and Analysis System
In addition to numerous manual pressure and temperature gauges used by the
operators to control the system, an automated data acquisition system and data analysis
25
computer are utilized to provide real time data for accurate monitoring and control of
all system parameters.
Temperatures are monitored with platinum RTD's, and pressures are monitored
with strain gauge transducers. The flow rate of cooling water to the test condenser is
monitored by both an electro-magnetic flow meter and an ultra-sonic flow meter, while
the flow rates of cooling water to other components are monitored by measuring the
pressure drop across calibrated orifices.
The flow rate of steam into the test condenser is calculated from the temperature
and pressure of the steam flowing through ASME standard critical flow orifices. The
rate of steam condensation is determined by measuring the time to condense a fixed
quantity of steam condensate (3 .25 ft3). The rate of flow of uncondensed steam passing
through the test condenser is monitored by measuring the pressure and temperature of
the steam entering the primary ejector and calculating a flow rate from calibration data
provided with the ejectors by Graham Manufacturing Company. With the three
independent measurements of (1) total steam flow to the condenser, (2) steam
condensed in the test condenser, and (3) uncondensed steam passing through the
condenser, an estimate of the uncertainty of data can be made from a material balance
of these flows. In addition, a heat balance is made against the water side heat duty as
an additional check of the accuracy of the data.
The output of all 28 sensors is continuously fed to a Daytronic data acquisition
system for signal conditioning and then passed on to a microcomputer. The
26
conditioned data from all 28 channels of data are recorded by the computer and
displayed on a monitor for operator monitoring and control. All data channels are
sampled and recorded simultaneously and updated approximately every six seconds.
This results in between two hundred and five hundred data samples from each
instrument as run durations vary between twenty and forty minutes, depending upon the
steam condensation rate.
The data acquisition hardware consists of a Daytronic DataPAC Model 10K4T
with four signal conditioning and analog to digital signal converter boards. Each board
can process eight channels of data, thus enabling 32 channels of data, each with 16 bit
data resolution. These data are filtered and transferred to a MS/DOS 80286 computer
via an ASCII RS-232C cable at transfer rates up to 153.6K Baud.
The data transferred to the computer is simultaneously displayed on a VGA
color monitor and written to the hard disk of the computer for permanent storage and
data analysis. The recorded data from each test is processed and analyzed using a
customized program.
The data analysis program is actually a collection of several programs contained
in a single menu driven interactive control program written in Microsoft's
QuickBASIC. This collection of programs permits complete analysis of experimental
data with various output formats, including data files for transfer to other programs.
27
4.0 TEST PROCEDURE AND DATA REDUCTION
4.1 Test Procedure The following outlines the procedure that was followed each time a set of data
points were collected. It was very important to follow this procedure each time to
ensure the safety of the operators and the integrity of the test data.
The first step is to tum on the computer and execute the data acquisition
program. Then the Fulton boiler is turned on by using the following steps:
1. Tum on the water pump to the boiler's make-up tank.
2. If the water level in the make-up tank is low, add water to the tank by
opening the city water valve.
3. Tum on the gas to the boiler.
4. Reset the gas and electric meters.
5. Close the steam relief valve on the boiler.
6. Tum the boiler switch to the on position.
7. Wait for the water to rise to the appropriate level by using the sight
glass.
8. Press the ignitor button to fire up the boiler.
While the boiler is coming up to pressure the cooling water loops need to be
turned on. This is done by turning on pump 1, pump 3, the condensate return pump,
the cooling tower pump, and the cool tower fan. Refer to Figure 3-4. When all the
28

cooling water pumps are running, the inlet water valves to the condensers can be
opened.
By this time, the pressure in the Fulton boiler should be approximately 75 psig.
Once the pressure reads 75 psig, the motive steam valves to the ejectors can be opened.
When the boiler pressure reaches 90 psig it is important to open the relief valve on the
boiler to bleed off some steam to ensure that the boiler does not over pressurize.
The next step is to start up the Patterson Kelly boiler while the air in the test
condenser is being evacuated. Before the boiler is started, one must make sure that the
bleed valves in the test condenser main steam line are closed. After checking the bleed
valves, go to the Patterson Kelly boiler and tum the black switch to the on position.
Then, open the Fisher Controls panel and set the pressure to 5 psig. Wait until the
pressure gauge on the boiler reads 4 psig. Once the boiler pressure is 4 psig, slowly
open the large valve on the top of the boiler. The pressure in the boiler will decrease
to approximately O psig when the valve is opened. When the pressure in the boiler
reaches 1.5 psig, the down stream orange valve is opened. By opening this valve, the
test is now supplied with steam. The next step is to open the bleed valves on the main
steam line in order to flush the condensate from the steam lines. When all the water is
blown out of the steam line the valves are closed so that a small steady stream of steam
exits the valves.
It is now necessary to obtain the correct steam temperature from the
desuperheater. This is done by going to the computer and reading the temperature for
29
channel TA 11. If there is condensate in the bottom of the desuperheater, the
temperature at channel TAll will be approximately 120 degrees F. This temperature
will remain at 120 degrees F until all the condensate is flashed off. The flashing
process can take up to one hour so it is very important to be patient. Once all the
condensate has evaporated, the temperature will rise very quickly. When the
temperature reaches 180 degrees F the desuperheater pump needs to be turned on. If
the temperature falls below 180 degrees F, the pump must be turned off and not turned
on again until TAll reads 180 degrees F. To control the amount of superheat to the
condenser just open or close the water valve to the desuperheater. It is very important
that channel DTAl, which measures the amount of superheat to the test condenser,
reads between 10 to 20 degrees F.
When the system reaches a steady state condition, data points may be taken. It
usually will take between two to three hours before the first test data can be collected.
To properly measure the effects of the cooling water inlet temperature on the
overall heat transfer coefficient the following set of standard test conditions were
established.
1. The pressure in the dome of the condenser was maintained at 1 psia
with 10 to 20°F of superheat.
2. The tube side velocity was set at 4.2 ft/sec.
3. The temperature of the cooling water was set between 55°F - 80°F
30
In addition to the above it was decided to limit the heat duty of the condenser to
no more than ninety percent of the entering steam. This was done to ensure that the
test condenser was saturated with steam. Thus the condenser would be working at full
capacity.
A typical test consists of manually adjusting the cooling water flow rate to 372
gpm. Then the flow rate of the water to the cooling tower has to be adjusted until the
proper cooling water inlet temperature is obtained. The cooling water temperature is
varied from 55°F to 80°F in 5 degree increments. The manual steam valves are then
adjusted to supply the necessary quantity of steam at 120°F to maintain a pressure of
1.0 psia in the test condenser and condense approximately 90% of the steam in the test
condenser.
A test run is initiated by actuating a control valve which closes off the
condensate discharge line from the hotwell and allows condensate to be collected in the
hotwell. When the condensate reaches the low level switch in the hotwell the data
acquisition system begins automatically recording the data. All the channels are
continuously sampled until the condensate level reaches the high level switch. The
time that it takes for the condensate to reach the high level switch is recorded and the
control valve is automatically opened to allow the condensate to drain. The time
required to collect the calibrated volume of 3.25 ft3 of condensate in the hotwell
provides an accurate measure of the condensing heat duty in the test condenser.
31
4.2 Data Reduction
Twenty-eight channels of data including ten pressures, twelve temperatures, and
six flow rates are each recorded at six second intervals throughout a data run. A
typical data run duration is from 20 to 40 minutes. Therefore, a run provides at least
200 recorded data points from each instrument in the system. The data analysis
program described in Section 3.4 provides a computer screen display and hardcopies of
the raw data collected as well as statistical analysis of the recorded data. The program
also provides the calculated heat duties and the overall heat transfer coefficient.
The program provides these calculated results based on the heat duties from the
data collected on both the steam side and the water side of the test condenser. In the
case of the steam side data, the results are obtained by using both the measured
saturation temperature data and the measured saturation pressure data. These
redundancies provide a measure of the accuracy and repeatability of the test results.
Inspection of the statistical analysis of the raw data provides information on the
stability of the test run and on the instruments themselves. Table 4-1 is a typical form
that the data reduction program produces. From Table 4-1 it can be seen that, for this
particular run, the recorded inlet and exit cooling water temperature fluctuated a
maximum of 0.3°F in the 17.4 minutes required to run this test. Although the
temperature fluctuated 0.3°F the standard deviation of the recorded data is only 0.04°F.
For this run, the cooling water was very stable as evidenced by its standard deviation
32
which shows that a deviation of less than 0.005 ft/sec. This resulted in a 1 %
fluctuation in the calculated heat duty based on the water side data.
Inspection of the steam side data in Table 4-1 reveals a similar high degree of
stability of the data throughout the test run. The level of stability and the consistency
of the data shown in Table 4-1 is typical of most of the tests conducted for this project.
However, stability of the test data was only one of the methods used to evaluate a test
run.
The measured water flow rate to the test condenser along with the measured
temperature rise across the test condenser provides data to calculate the total heat duty
in the test condenser. The recorded time to collect a measured volume of condensate
permits the condensing heat duty to be calculated. However, this does not take into
account the amount of heat duty required to cool the superheated steam to its saturation
temperature. While the desuperheating duty is small it still must be considered.
Figure 3-1 illustrates the location of the temperature and pressure measurements
in the steam loop of the test condenser. Pressure P3 is the basket tip transducer
referenced above and is located in the steam dome just above the test condenser. The
location is sufficiently close to the top row of tubes to be accurately used as the steam
pressure at the inlet to the test condenser. A differential pressure transducer, ~PAl,
records the pressure drop across the test condenser.
33
Table 4-1
Test Stability Analysis
Test Stability Analysis Tube Material: 304 SS SET #2 Data File Name: 12269203.DTA Data Samole Duration (min) : 17.4
Max Min TEST CONDENSER STEAM 882 871
Flow rate(lb/hr) Pressure (PSIA) 1.18 .82 Temperature, Ta (F) 119.5 118.4 Temperature, Tb (F) 101.4 101.0 Difference. Ta-Tb (F) 18.1 17.1
TEST CONDENSER WATER 4.22 4.2 Velocity (ft/sec) Inlet Temperature (F) 65.1 65.0 Outlet Temperature (F) 69.1 68.8 Heat Dutv (kBtu/hr) 734 712
OTHER MEASUREMENTS Steam Delivery Pressure Orifice 1 (PSIA) 1.3 1.2 Orifice 2 (PSIA) 16.1 15.9 Desuperheater Inlet Temperature (F) 192.9 192.5 Outlet Temperature (F) 123.3 121.8 Motive Steam Pressure (PSIG) 76.5 72.4 Motive Steam Temoerature (F) 179.1 177.7
Avg 876
.95 118.9 101.2 17.5 4.21
65.0 68.9 728
1.2 16
192.7 122.4 74.8 178.6
Version 1.0 Date: 1-4-93
Std Dev 2.5
.04
.27
.09
.27 0.00
.03
.04 4
0.00 0.05
.35
.11 .1 .01
Temperatures TA4, TA5, and LiTAl are the output of a differential platinum RTD that
records both the total temperature and the temperature difference between the inlet and
outlet of the test condenser. The temperature recorded at T A4 is the temperature of the
superheated steam entering the test condenser. Temperature TA5 records the saturation
temperature at the exit of the test condenser. The differential temperature recorded by
34
~TAl is the sum of the superheat of the entering steam and any temperature loss that
may occur in the test condenser. The pressure recorded by P3 minus the differential
pressure drop across the test condenser, ~p A 1, provides a measured saturation pressure
at the exit of the condenser.
Since the saturation point determines the temperature and pressure, a
comparison of the saturation temperature measured directly by TA5 and that deduced
from the saturation temperature corresponding to P3 - ~PA 1 provides a very sensitive
check of the validity of the test data. Typically, the saturation temperature determined
by these two methods differs by less than 2.0°F. This is quite good when considering
the sensitivity of the saturation temperature of steam at pressures in the range of 1.0
psia.
The temperature recorded by TA3 minus the saturation temperature
corresponding to the saturation pressure by P3 is a direct measure of the amount of
superheat in the steam entering the test condenser. The duty required to cool the
superheated steam must be added to the heat duty required to condense the condensate
in the hotwell. This must be done before the heat duties of the water side and the
steam side can be compared. This comparison of the heat duty is another check of the
validity of a test run.
Another check of the data obtained from the test run is a material balance of the
steam passing through the test condenser. The total steam flow rate is calculated from
the known flow area of the ASME critical flow orifice and the measured pressure and
35
temperature just upstream of the orifice. The flow rate of the steam that passes through
the condenser without being condensed is determined from the measured pressure at the
suction point of the first stage ejector. By using the calibrated performance curve of
the ejector and the suction pressure, the amount of water vapor carry over from the
condenser can be determined. The flow rate of the condensed steam is determined
from the time required to collect 3.25 ft3 of condensate in the hotwell. A material
balance of the data obtained from these three independent flow rates is typically within
five percent. Any test in which the material balance exceeds a 10% discrepancy must
be considered suspect.
The computer program described is Section 3. 4 provides all of the computations
necessary to reduce the data to conduct these data checks. The program also computes
the overall heat transfer coefficient and the components contributing to the overall
coefficient using the following three data sets:
1. Condensing heat duty based on the total water side heat duty minus
the heat duty required to remove the superheat from the entering
steam.
2. Condensing heat duty based on the measured condensation rate and
saturation properties at the temperature measured in the test
condenser.
3. Condensing heat duty based on the measured condensation rate and
saturation properties at the pressure measured in the test condenser.
36
Table 4-2 is the output of a typical test run. Careful examination of all of the
data collected along with an error analysis of the data, as described in Appendix B, led
to the conclusion that most consistently accurate data were obtained from the
condensing heat duty based on the measured condensation rate and saturation properties
based on temperature measurements in the test condenser. All subsequent analysis and
conclusions in the report are based on this data.
37
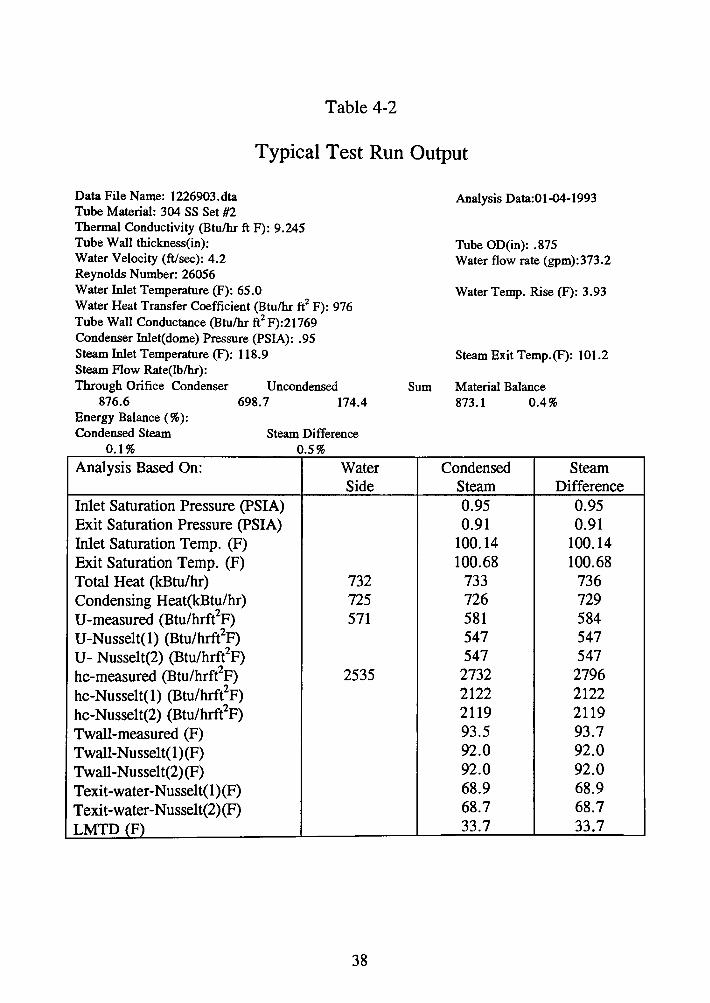
Table 4-2
Typical Test Run Output
Data File Name: 1226903.dta Tube Material: 304 SS Set #2 Thermal Conductivity (Btu/hr ft F): 9.245 Tube Wall thickness(in): Water Velocity (ft/sec): 4.2 Reynolds Number: 26056 Water Inlet Temperature (F): 65.0 Water Heat Transfer Coefficient (Btu/hr ft2 F): 976 Tube Wall Conductance (Btu/hr ft2 F):21769 Condenser Inlet(dome) Pressure (PSIA): .95 Steam Inlet Temperature (F): 118.9 Steam Flow Rate(lb/hr): Through Orifice Condenser Uncondensed
876.6 698.7 174.4 Energy Balance(%): Condensed Steam
0.1%
Analysis Based On:
Steam Difference 0.5%
Water Side
Inlet Saturation Pressure (PSIA) Exit Saturation Pressure (PSIA) Inlet Saturation Temp. (F) Exit Saturation Temp. (F) Total Heat (kBtu/hr) 732 Condensing Heat(kBtu/hr) 725 lJ-measured (Btu/hrft2F) 571 lJ-Nusselt(l) (Btu/hrft2F) lJ- Nusselt(2) (Btu/hrft2F)
2 2535 he-measured (Btu/hrft F) hc-N usselt( 1) (Btu/hrft2F) hc-Nusselt(2) (Btu/hrft2F) Twall-measured (F) Twall-Nusselt(l )(F) Twall-Nusselt(2)(F) Texit-water-Nusselt(l )(F) Texit-water-Nusselt(2)(F) LMTD (F)
38
Analysis Data:01-04-1993
Tube OD(in): .875 Water flow rate (gpm):373.2
Water Temp. Rise (F): 3.93
Steam Exit Temp.(F): 101.2
Sum Material Balance 873.1 0.4%
Condensed Steam Steam Difference 0.95 0.95 0.91 0.91
100.14 100.14 100.68 100.68
733 736 726 729 581 584 547 547 547 547
2732 2796 2122 2122 2119 2119 93.5 93.7 92.0 92.0 92.0 92.0 68.9 68.9 68.7 68.7 33.7 33.7
5.0 RESULTS
The data acquisition program is able to analyze all of the data points collected in
each test run and calculate the data shown in Table 4-0 and Table 4-1. The following
is an outline of the method used by the program.
The first step the program executes is to calculate the tube wall resistance
5-1
where D0 is the outside diameter of the tube, ~ is the thermal conductivity of the tube,
and Di is the inside diameter of the tube.
The heat transfer coefficient for the water side is calculated by using the well
known Petukhov-Popov7 equation. This equation has been demonstrated to be highly
reliable in predicting the water film coefficient for a plain tube. In order to calculate
the water side heat transfer coefficient several temperature dependent properties must
be determined. The program bases all of the water properties on the average tube side
temperature. Once the water properties are known8 the following equations are
evaluated.
5-2
where V w is the velocity of the water in the tubes, Mw is the mass flow rate, Ac is the
tube flow area and Pw is the water density.
Re= PwVwW/~ 5-3
where Wi is tube wetted diameter and ~ is the dynamic viscosity.
39
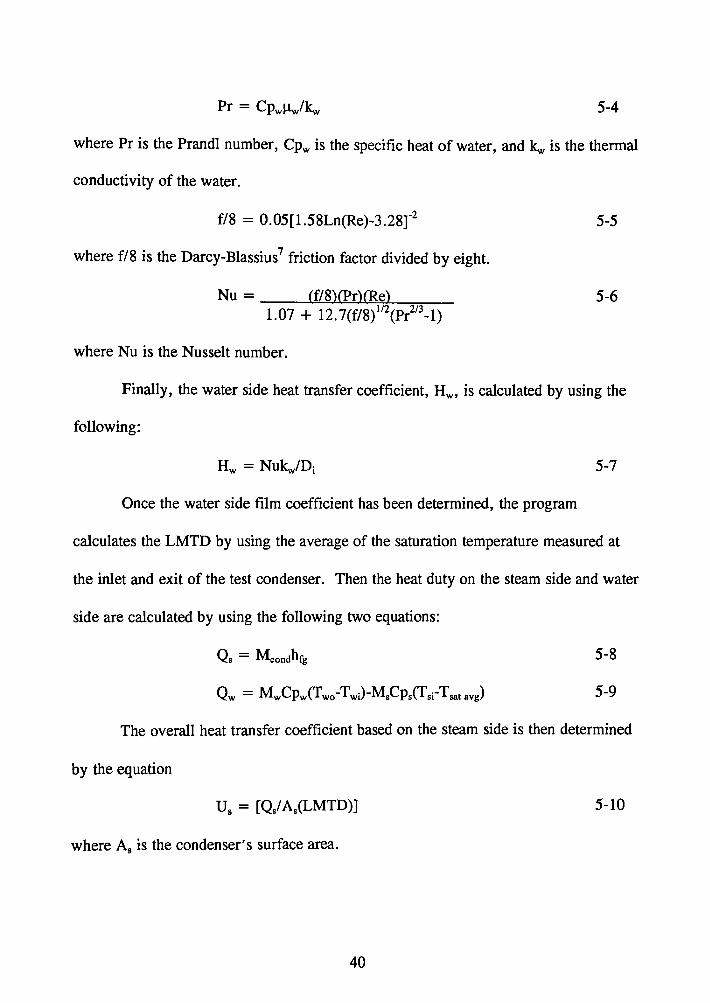
5-4
where Pr is the Prandl number, Cpw is the specific heat of water, and kw is the thermal
conductivity of the water.
f/8 = 0.05[1.58Ln(Re)-3.28r2 5-5
where f/8 is the Darcy-Blassius7 friction factor divided by eight.
Nu = ff/8)(Pr)(Re) 5-6 1.07 + 12.7(f/8)112(Pr213-l)
where Nu is the Nusselt number.
Finally, the water side heat transfer coefficient, Hw, is calculated by using the
following:
H = Nu1, ID· W Aw I 5-7
Once the water side film coefficient has been determined, the program
calculates the LMTD by using the average of the saturation temperature measured at
the inlet and exit of the test condenser. Then the heat duty on the steam side and water
side are calculated by using the following two equations:
5-8
5-9
The overall heat transfer coefficient based on the steam side is then determined
by the equation
Us = [Q/As(LMTD)] 5-10
where As is the condenser's surface area.
40
Finally, with the overall heat transfer coefficient determined, the condensing
film coefficient is calculated by the following:
5-11
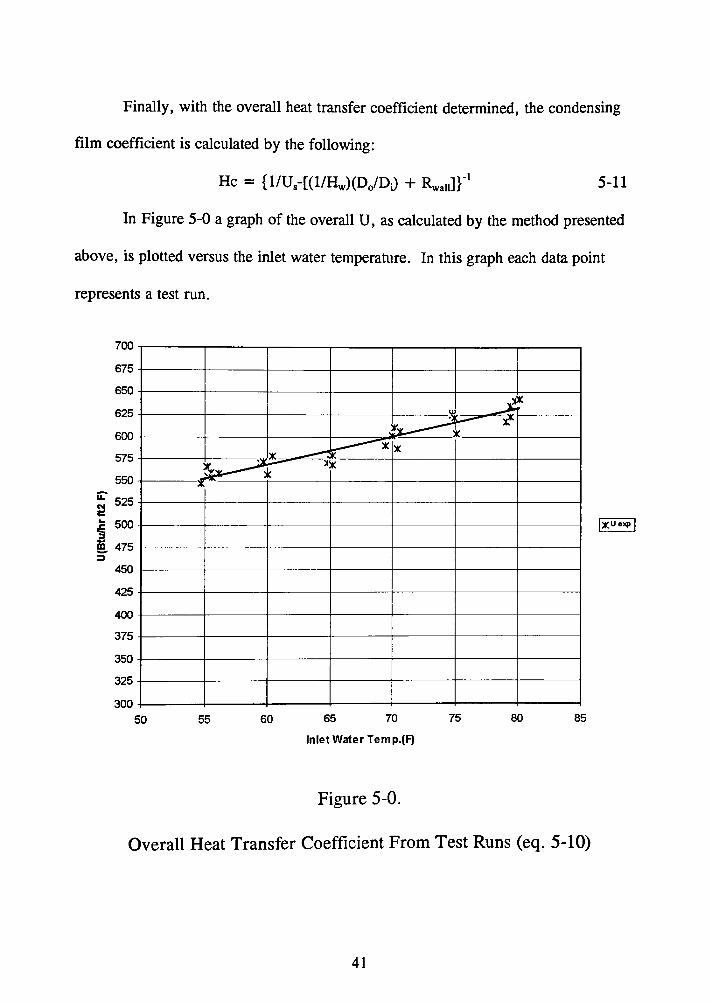
In Figure 5-0 a graph of the overall U, as calculated by the method presented
above, is plotted versus the inlet water temperature. In this graph each data point
represents a test run.
700
675
650
625
600
575
550
ii:" 525 ~ .. 500 '§ m 475 :i
450
425
400
375
350
325
300 50
X
~ I X "
55 60
t ~ ·--,-~x r
..---: ~Xx :I'.»(
65 70 75 80 85
Inlet Water Tern p.(F)
Figure 5-0.
Overall Heat Transfer Coefficient From Test Runs (eq. 5-10)
41
The data acquisition program also calculates the overall and condensing heat
transfer coefficients as predicted by theory. The calculation method is similar to the
procedure previously outlined except an iterative process must be used to determine the
condensing film coefficient. As seen in equations 5-14 and 5-15, the tube wall
temperature and the condensing heat transfer coefficient are dependent variables.
By using the inlet and outlet water temperatures from the test run, the heat
transfer coefficient for the water side is determined by equations 5-1 thru 5-7. After
the water side heat transfer coefficient has been calculated, the following steps are used
to determine the condensing and overall heat transfer coefficients.
Twallp = Tsat - 2 5-12
where T wall P is the initial guess of the tube wall temperature and T sat is the saturation
temperature of the steam.
5-13
where k1 is the conductivity of the water at (Tsat - Twallp)/2, p1 is the density of the
water, hrg is the enthalpy of the steam at the saturation temperature, µ1 is the dynamic
viscosity and D0 is the outside diameter of the tube.
5-14
where U is the predicted overall heat transfer coefficient.
5-15
where T wall is the outside tube wall temperature.
42
If IT wall - T wall P I > 0. 05, then T wall P is set equal to T wall and equations 5-13
thru 5-14 must be re-evaluated until the absolute difference of the two temperatures is
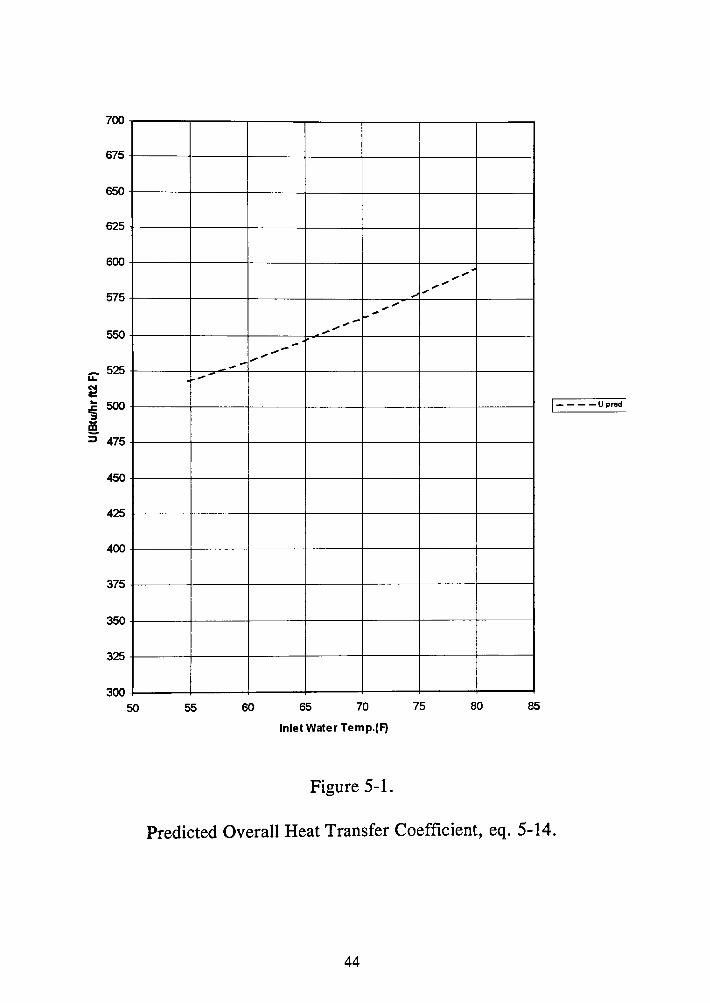
less than O. 05. A graph of the predicted U versus inlet water temperature is shown in
Figure 5-1. The predicted U, equ. 5-14, and the experimental U, equ. 5-10, are shown
in the same graph in Figure 5-2.
43
., .,. '-' .,-
550 i-----t-----+----4=-,.,._.,.~"'-+-------l-----l----_J
.,. ., -.,.-ii:" 525 i-----t--.,.:-.-_.-e-'--1i----+----+-------l-----l----_J
~ .. 500 i .------t---t---+----+---l----1----__j
::i 475 -r----,----t-----+------1-------1--------!---__j
450 i-------t----+----+----+-----1-------+--__j
425 -r----,----+-----+----+-----1---------l---__j
400 -r----,----t-----+----+-----+----+--__J
375 -t-------+-----+------+---------1---------1------l---__J
350 +-----t-----+-----+----+-----1---------l--------l
325 +-----+-----+----+-----+----+--------t-------l
50 55 60 65 70 75 80 85
Inlet Water Temp.(F)
Figure 5-1.
!- - - -Upred
Predicted Overall Heat Transfer Coefficient, eq. 5-14.
44
700
675
650
625
600
575
550
- 525 u.
~ ._ 500 i lii 5' 475
450
425
400
375
350
325
300 50
X
~XX X ~ii::
,x.,......... ~ ...... ~ 1,' -... --X -~ ---,----. -
55 60 65 70
Inlet Water Tern p.(F)
Figure 5-2.
l~
I ~ .;
X .,.., -,, -
75 80 85
Overall Heat Transfer Coefficients as Determined by Experiment, eq. 5-10, and
Theory, eq.5-14.
45
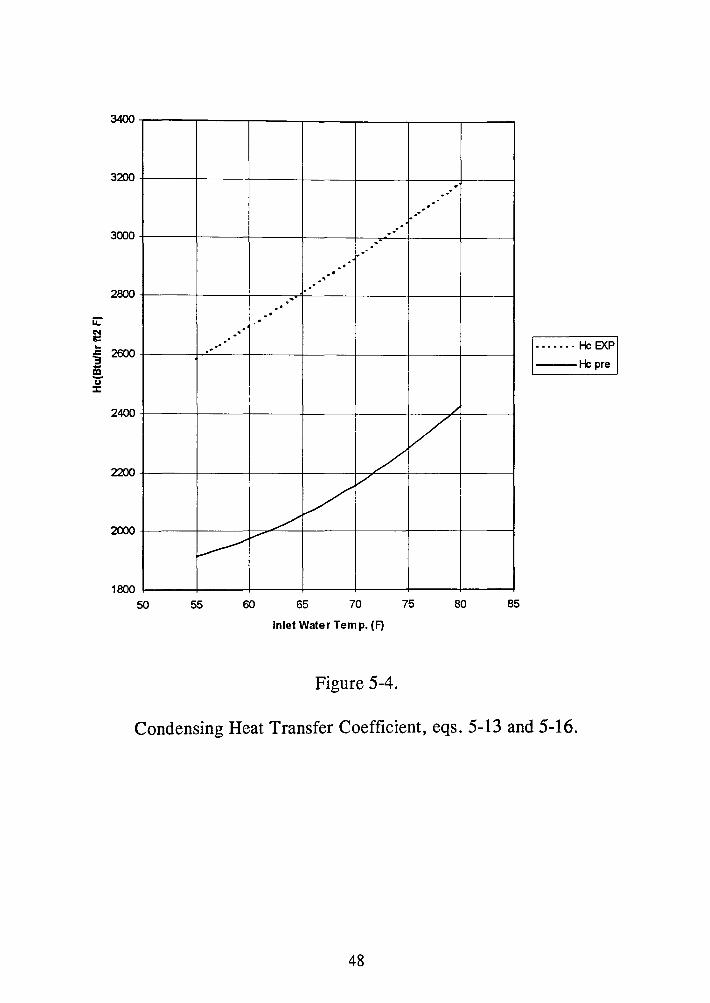
The condensing heat transfer coefficient, equation 5-16, was calculated by using
the curve fit equations of the predicted and experimental overall heat transfer
coefficients. This was done because the condensing heat transfer coefficient is very
sensitive to the value of the overall heat transfer coefficient. The condensing film
coefficient, He, is determined by using equation 5-16.
5-16
In Figure 5-3 the results of equation 5-16 are plotted for both the experimental
and predicted cases. This graph clearly demonstrates that the actual condensing heat
transfer coefficient is higher than that predicted by the single tube Nusselt equation.
The overall heat transfer coefficient, as calculated by HEI, is plotted with the
overall heat transfer coefficients as determined by experiment and theory in Figure 5-4.
This graph dramatically demonstrates that the overall heat transfer coefficient that is
calculated by using the HEI method, equation 2-4, underestimates the actual heat
transfer coefficient.
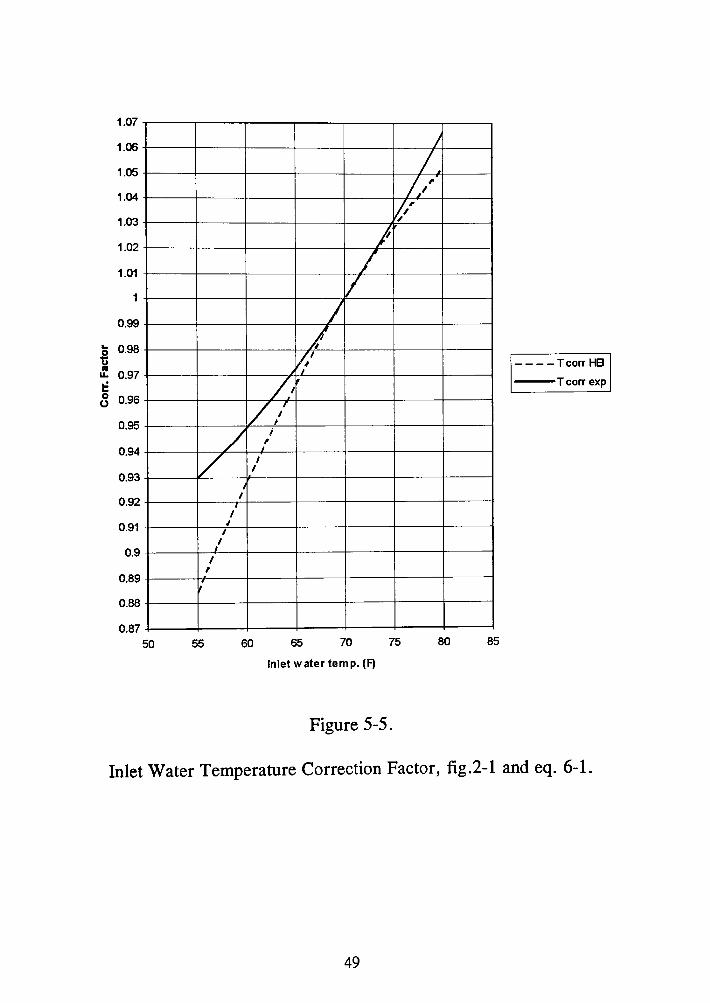
In addition to underestimating the overall heat transfer coefficient, the shape of
the REI curve is different than that of the other two curves. The main reason for this
difference in shape of the HEI curve is the HEI temperature correction factor, FT. The
curve for FT, Figure 2-1, has the same shape as the curve for the REI overall heat
transfer coefficient. By using the data collected from the test runs and normalizing that
data with the value of the overall heat transfer coefficient at 70°F, a graph of the
46

temperature correction factor versus inlet cooling water temperature is plotted in Figure
5-5.
700
675
650
625
600
575
550
U:- 525
~ .. 500 '§ lii 5' 475
450
425
400
375
350
325
300 50
X
~~ * X
----L,~-
. . . . .
55 60
.p. '
__;;;.
~ lK
~~x )t
~XX ., .,
.......... ...........--:x - .,
rx .... ., .......... , ----, .. --
...... ... . . . . . .
. . . . . . . .. .
65 70 75 80
Inlet Water Temp.(F}
Figure 5-3.
85
x Uexp
----Upred
······· Uhei
Comparison of Overall Heat Transfer Coefficient, eqs. 5-10, 5-14, and 2-4
47
ii:" ~
3400
3200
3000
2800
,E 2600 ::,
i5 u ::c
2400
2200
2000
1800 50
. • . . , . . . .. . .
L.--" I,,,'
55 60
. .. , . . . . . . . . · .
' . I,, • . . . • . , . .
' . .
/
I/ /
V V
/
65 70 75 80 85
Inlet Water Temp. (F)
Figure 5-4.
Condensing Heat Transfer Coefficient, eqs. 5-13 and 5-16.
48
.. ~ " u. .: .. 0 0
1.07
1.06
1.05
1.04
1.03
1.02
1.01
0.99
0.98
0.97
0.96
0.95
0.94
0.93
0.92
0.91
0.9
0.89
0.88
0.87 50
J I 7,,·
/," , f
/ V
I I
1/,' • I
// /,,'
/ I /
:/ I I
' I
' I
' I
/ I
I 7
II
55 60 65 70 75 80
Inlet water temp. (F)
Figure 5-5.
85
- - - - T corr H8
Tcorr exp
Inlet Water Temperature Correction Factor, fig.2-1 and eq. 6-1.
49
6.0 Discussion
Figure 5-0 appears to indicate a large scatter in the values of the overall heat
transfer coefficient at any given inlet temperature. However, the percentage difference
between the points is relatively small. For example, the percentage difference between
the most extreme point and the curve fit of the overall heat transfer coefficient for the
80°F inlet water temperature test runs is 2.4%. When one considers that a test run was
deemed acceptable if the material balance was less than 5 % , and that the overall heat
transfer coefficient is a function of the mass flow rate, a difference of 2.4% is within
the test parameters.
Figure 5-2 shows that the overall heat transfer coefficient as predicted by the
additive resistance method, as previously described, is approximately 6% conservative
when compared to the experimental overall heat transfer coefficient. This difference is
very small when one considers that the Nusselt correlation for the steam side
coefficient, equation 5-13, assumes a single condenser tube with laminar steam flow.
Figure 5-4 is a graph of the overall heat transfer coefficient as calculated by
HEI for 7/8" 304 stainless steel tubes. The HEI predicted overall heat transfer
coefficient is the overall heat transfer coefficient that is most commonly used by
manufacturers supplying condensers to the power industry. From this graph, it is clear
that a surface condenser designed to the HEI standards is over surfaced. This graph
also demonstrates that if a condenser were to be designed by the additive resistance
50
method, using the Petukhov-Popov and Nusselt equations, that condenser's actual
overall heat transfer coefficient would be approximately 6% higher.
Finally, in Figure 5-5 the temperature correction factor as determined by
experiment and by HEI are shown. For inlet water temperatures between 65°F and
75°F the two curves have very similar values. For inlet temperatures below 65°F, the
difference between the two curves increases with decreasing water temperature. At an
inlet temperature of 55 °F there is a five percent difference. Due to the heat rejection
capabilities of the cooling tower, it was not possible to obtain inlet water temperatures
less than 55°F. However, from Figure 5-5 it appears that the difference between the
HEI curve and the experimental curve would have been extremely large for lower inlet
water temperatures. At temperatures of 75 °F and higher the two curves are also
diverging, however, this divergence does not appear to be as great as compared to the
temperatures below 65 °F. When compared to the experimental data the HEI inlet
temperature correction factor is too conservative for temperature below 65 °F and for
temperature above 75°F. The equation for the curve fit in Figure 5-5 is as follows:
FT = 0.94 - .0042(TwJ + 7 X 10⁻⁵(Tw/ 6-1
where FT is the inlet water correction factor and Twi is the cooling water inlet
temperature in °F. As shown in Appedix C, equation 6-1 also predicts the inlet
cooling water correction factor for 5/8" tube with very good accuracy.
51
7 .0 Conclusions
The results of this experiment demonstrate that the inlet temperature correction
factor curve, FT, as published by The Heat Exchange Institute1•2 is in need of updating.
When compared to HEI, the temperature correction curve as determined by experiment
is as much as 5 % higher than HEI' s temperature correction curve over the range of
inlet temperatures investigated by this thesis. By viewing the trends of both curves in
Figure 5-5, it appears that the difference between the two would be much greater than
5 % for inlet water temperatures less than 55°F. A 5 % difference represents a
substantial increase in cost for a surface condenser supplied to the power industry.
Typically, a surface condenser for the power industry has a selling price of between
one to ten million dollars.
Due to time restraints, only one cooling water velocity and tube diameter were
investigated during this experiment. However, in examining the data collected by
Hefner9, Appendix C, in which several cooling water velocities and tube diameters
were considered, similar results are obtained.
This experiment also demonstrated that the single tube Nusselt correlation
provides a good method for calculating the condensing film coefficients for 7 /8 inch
tube on a 1.125 inch pitch with little air in leakage.
In this investigation there was negligible air in-leakage into the test condenser.
In industry the effects of non-condensibles on the overall heat transfer coefficient are of
52
great interest. Part of the reason that the overall U as determined by HEI is so
conservative is because HEI is concerned with trying to compensate for the reduction in
the overall heat transfer coefficient due to the presence of non-condensibles. With the
state-of-the-art test facilities at RIT an investigation into the effects of noncondensibles
on the overall heat transfer coefficient would be a very helpful project for industry as
well as for HEI.
53
References
1. REI Standards for Steam Surface Condensers, 8th ed., Heat Exchange Institute, Cleveland, OH, 1984.
2. Addendum to Standards for Steam Surface Condensers, 8th ed., Heat Exchange Institute, Cleveland, OH, 1989.
3 Orrok, G.A., "The Transmission of Heat in Surface Condensation", ASME Trans., vol. 32, 1910, pp. 1139-1214.
4 Wenzel, L.A., "Measurement of the Performance of Condenser Tubes", Proc. American Power Conference, Vol. XXIV, Chicago, 1962, pp. 617-629.
5. Kem, D.Q., Process Heat Transfer, McGraw-Hill Co., 1950.
6. Unknown, "Commercial Factors for Designing Surface Condensers", Power, Sept. 1932, pp. 133-134.
7. Incropera, F.P. and Dewitt, D.P., Fundamentals of Heat and Mass Transfer, John Wiley & Sons, 1985, pp. 372-373 and pp. 480-488.
8. Heald, C.C. Cameron Hydraulic Data, Ingersoll-Rand Company, 1988, pp.4-3 to 4-5.
9. Hefner, R.J. , Heat Transfer Performance of Double Enhanced Condenser Tubes, New York State Energy and Development Authority, 1995.
54
APPENDIX A
Summary of Expermental Data
File Twin Tw out U exp. U pred. He exp Hw Dome press.
12099201 55.3 60.4 555 519 2625 920 .96 12199201 55.6 60.6 554 521 2578 924 .93 12229201 55.2 60.5 566 518 2929 918 .95 12309201 55.5 60.7 560 520 2717 923 .95 12299202 56.1 61.2 559 521 2683 925 .96 12099202 59.8 64.6 546 531 2269 946 .99 12199202 60.0 64.6 558 533 2469 949 .97 12229202 60.4 65.1 579 533 2931 948 .96 12299202 59.7 64.5 572 531 2793 946 .96 12269202 59.4 64.3 571 531 2788 945 .98 12099203 64.8 68.7 571 547 2530 974 .97 12199203 65.2 69.0 569 548 2474 977 .98 12309203 65.2 69.2 580 548 2712 977 .95 12269203 65.0 68.9 581 547 2733 976 .95 12199204 70.4 73.8 587 565 2610 1009 .98 12299205 70.6 74.2 606 562 3103 1002 .97 12299204 70.0 73.7 602 561 3001 1000 .98 12309204 69.4 73.1 591 563 2689 1008 .97 12269204 70.1 73.7 611 563 3179 1006 .95 12099204 74.8 78.1 627 577 3399 1028 .97 12199205 75.1 78.0 604 581 2786 1033 .96 12229206 74.8 78.0 625 575 3390 1023 .97 12299205 74.9 78.1 621 577 3232 1026 .97 12199206 79.1 81.1 617 593 2891 1053 1.0 12229207 79.8 82.5 640 593 3564 1047 .97 12299206 79.4 82.1 635 598 3232 1064 .96 12309206 79.4 82.0 623 597 2983 1059 .96 12269206 80.1 82.7 642 598 3442 1061 .98
55
APPENDIX B
B .1 Data Reduction Methodology and Error Analysis
The condensing heat transfer coefficient in an operating surface condenser can
only be determined indirectly. For this reason numerous redundancies are provided in
the high precision instrumentation and data collection systems utilized in this project to
minimize uncertainties in the analysis of the data collected. The following paragraphs
describe the methodology used in evaluating the data collected. Estimated uncertainties
and errors in recorded and reduced data are also discussed.
Errors in recorded data typically fall into one of two categories. Those resulting
from calibration error and those resulting from the precision of the instrumentation
transducers, sign conditioning and recording systems. Calibration errors result in
consistent, and often predictable, errors whereas precision errors are the result of
inherent limitations of the instrumentation system which tend to result in random error.
The calibration of critical instruments used for this project were periodically
verified wherever practical. Pressure transducers were periodically checked using a
calibrated dead weight tester. Platinum RTD's used to measure temperatures were also
periodically checked using a constant temperature bath. For those instruments whose
calibration could not be verified, the manufacturer's calibration was assumed to be
56
accurate. In nearly all cases, redundancies in instrumentation and/or independent
verification techniques were used for this project to identify and minimize all
calibration errors.
The limiting magnitude of precision errors for an individual measurement can
normally be predicted from knowledge of the inherent precision of the measuring
transducer and the signaling conditioning and recording systems. The cumulative effect
of precision errors from multiple instruments used to evaluate results that cannot be
measured directly can be approximated using propagation of error techniques. For
purposes of this project, the maximum magnitude of error in an evaluated function, f
(xi, x2, •.•• , xJ resulting from the precision of each individual measurement xi is
estimated by:
where Ei is the estimated error of parameter xi. Equation B-1 assumes all errors are in
the same direction which results in a maximum uncertainty. Since precision errors tend
to be random, a more likely limiting magnitude of propagated error is given by a
Pythagorean summation of the individual uncertainties.
B-2
The propagation of errors were evaluated by both Equations B-1 and B-2 for
purposes of this project.
57
B .2 Cooling Water Measurements
The critical measurements required from the test condenser cooling water are
the mass flow rate of the cooling water and temperature of the cooling water at the inlet
and exit of the test condenser. Both an electro-magnetic flow meter and an ultra
magnetic flow meter and an ultra-sonic flow meter were used to monitor the cooling
water flow rate. Three platinum RTD's with a precision of ±0.1 °F were used to
monitor the inlet cooling water temperature in degrees Fahrenheit and four platinum
RTD's with the same precision were used to monitor the exit cooling water
temperature. In addition, two platinum RTD's set up and calibrated to measure
differences in temperature to a precision of ±0. 02 °F monitored the increase in cooling
water temperature across the test condenser.
The calibration of the RTD's used to monitor the cooling water temperature
could be routinely checked for purposes of determining the cooling water heat duty
since the heat duty requires measuring only the temperature rise, rather than the actual
magnitude of the temperature. Thus, at least once each week, the cooling water loop
was activated by circulating constant temperature water with no heat input to check the
output of each RTD relative to all of the others. This technique not only verified that
there was no drift in the calibration of these instruments, but it also verified the
magnitude and random nature of the uncertainties in the measurements with the RTD's.
58
The precision and calibration of the cooling water flow meters are specified by
the manufacturers to be accurate to within ±1.0%. While there was no way to verify
the accuracy of the total flow rates recorded, any calibration changes and random
variations could be monitored by comparing the output from each instrument.
B. 3 Steam Measurements
A number of techniques were used to verify the accuracy of steam side data.
The total flow rate of steam entering the test condenser is determined from precision
ASME critical flow orifices by monitoring the temperature and pressure of the steam
just upstream from the orifices. Based on the precision of the instruments used to
measure these temperatures and pressures and the uncertainties in the flow area in the
ASME orifices themselves, the propagation of maximum uncertainty in the
determination of the total steam flow rate is estimated to be ±4.2 % with a probable
uncertainty of ±3.8%.
The condensing heat duty based on steam side data is determined by measuring
the time required to condense and collect a specific volume of condensate. Analysis of
the uncertainties in the data necessary to determine this condensing heat duty indicates a
maximum uncertainty of ±1.8 % and a probable uncertainty of ±1.6%.
The flow rate of steam passing through the test condenser without being
condensed is determined by measuring the pressure in the system at the inlet to the
primary ejector in the system. Precision calibration of this ejector system by the
59
Graham Manufacturing Company permits determination of the rate of flow of
uncondensed steam to within ±3.2%.
Analysis of the propagation of uncertainties in determining these three steam
flow rates indicates that the difference between the total incoming steam flow rate and
the sum of the condensed and uncondensed steam flow rates should be within ±9.2%.
Thus, any test run that did not result in a verification of steam flow within this range
was considered suspect and the test discarded. Only eight test runs out of over a
hundred and fifty total tests failed to meet this criteria.
The absolute pressure of the superheated steam entering the test condenser was
monitored using a high precision strain gauge transducer mounted in a basket tip fitting
to ensure there was no velocity effect on the measurements. The uncertainty in the
actual absolute pressure recorded from this transducer is approximately ±0.15 psia. An
analysis of the predicted pressure drop between this transducer and the first row of
tubes in the test condenser indicates a maximum drop well less than the uncertainty in
the pressure measured by the basket tip transducer. Thus, this measured pressure is
assumed to be the actual absolute pressure at the first row of tubes in the test
condenser.
A strain gauge pressure transducer calibrated to measure pressure differences to
a precision of ±0.02 psia monitors the pressure drop across the test condenser.
Platinum RTD's located just above and just below the tubes in the test condenser
monitor the temperature of the steam. These RTD's are set up to record both the actual
60
temperature in degrees Fahrenheit to a precision of ±0.1 °F as well as the difference in
temperature between the two RTD's to within ±0.02°F.
The steam entering the test condenser is superheated and, thus, both the
measured temperature and pressure are required to establish the thermodynamic state of
the steam entering the test condenser. Operating conditions imposed for this project
resulted in a minimum of ten percent of the entering steam remaining uncondensed at
the exit of the test condenser. This results in saturation properties at the exit of the
condenser. Therefore, accurate measurement of either pressure or temperature at the
exit of the test condenser can be used to determine this thermodynamic state point.
A comparison of the saturation temperature at the exit of the test condenser as
determined from the pressure evaluated at that point to that recorded directly by the
RTD at that position typically agree within ±0.15°F. This corresponds to the
propagated precision error of the instruments involved and, thus provides confidence in
the results obtained in this project.
B.4 Determination of Heat Duties
The total heat duty in the test condenser, QT, consists of the heat duty required
to cool the superheated steam to the saturation temperature, Qsuper,, plus the heat duty
required to condense the steam, Qc. Only that portion of the heat duty required to
condense steam should be included in the determination of the condensing heat transfer
61
coefficient. This condensing heat duty can be determined directly from steam side data
from:
B-3
where Mc is the rate at which steam is condensed in the test condenser and hrg is the
heat of vaporization or condensation for water at the saturation state in the test
condenser. For this project Qc can be evaluated from steam side data with a maximum
uncertainty of ±1. 9 % from the propagation of discrete uncertainties due to the precision
of the measurements required.
Data recorded for the cooling water provides information from which only the
total heat duty can be evaluated. The condensing heat duty from water side data can be
evaluated using:
B-4
where Mw is the cooling water flow rate, Cpw is the heat capacity of the cooling water,
Two and T wi are the test condenser outlet and inlet cooling water temperatures,
respectively, Ms is the total flow rate of steam entering the test condenser, Cp1 is the
heat capacity of the superheated steam entering the test condenser, T super is the
temperature of the superheated steam entering the test condenser, and T sat is the
saturation temperature of the steam at the inlet of the test condenser. Propagation of
the discrete uncertainties of the parameters in Equation B-4 result in a predicted
maximum uncertainty of ±4.5 % .
62
The above uncertainties in the condensing heat duty indicate that the maximum
difference between the condensing heat duty as determined independently based on
steam side and water side data should be within ±6.4 % . All test runs for which the
steam material balance criteria described above also met this energy balance criteria for
the condensing heat duty of ±6.4 % .
B.5 Determination of Overall Heat Transfer Coefficients
The overall heat transfer coefficient, U, in the condensing region of a surface
condenser is determined from equation:
B-5
where Qc is the total heat duty in the condensing region of the condenser, A is the
surface area of the condenser and .1T LM is the log mean temperature difference between
the steam and cooling water.
For purposes of this project, the surface area, A, was evaluated using the
outside surface area of the condenser tubes.
The log mean temperature difference, .1T LM, was evaluated using:
.1T LM = (Two TwJ/n[(Two - T53.)/(Twi - TsaJ] B-6
where Twi is the cooling water inlet temperature, Two is the cooling water outlet
temperature, and T sat is the average steam saturation temperature in the condenser,
(T sat in + T sat ouJ/2.
63
Analysis of the propagation of uncertainties in the overall heat transfer
coefficient, U, as evaluated from Equation B-5, utilizing the condensing heat duty, Qc,
based on steam side data, indicates a maximum uncertainty due to instrumentation
limitations to be ±1.6% and a probable uncertainty of±l.4%.
B. 6 Determination of Condensing Heat Transfer Coefficients
The condensing heat transfer coefficient can be evaluated from the
experimentally evaluated overall heat transfer coefficient, U, from the equation:
B-7
where Rw is the thermal resistance of the tube wall, hw is the water side convective heat
transfer coefficient, D0 and Di are the outside and inside diameters of the condenser
tube, respectively. The thermal resistance of the tube wall, Rw, , is given by:
Rw = (D/2K)/n(DofDJ B-8
where K is the thermal conductivity of the condenser tube material.
The convective heat transfer coefficient on the water side of the condenser
tubes, hw, was evaluated for this project using the Petukhov-Popof equation:
hw = (f/8){Re)(Pr) 1.07 + I2.7(f/8)112(Pr113
- 1) B-9
The random fluctuations in the overall heat transfer coefficient due to the
propagation of discrete measurement error was found to be ± 1. 6 % . The uncertainties
in the evaluated values for Rw and hw(DofDi)) are each approximately ±1.0%. While
64
these uncertainties are quite small in view of the number of discrete experimental
measurements required, the propagation of these errors can result in greatly
exaggerated errors in the magnitude of the condensing heat transfer coefficient, he, as
evaluated by Equation B-7.
Attempts were made to conduct all tests with an average saturation temperature
in the test condenser of 101.7°F (1.00 psia). Actual unavoidable variation in the
steady state saturation temperature from one test to another was as great as ±l .5°F due
to the sensitivity of the saturation temperature in this pressure range. This resulted in
fluctuations in the real overall heat transfer coefficient, U, as great as ±1.1 % from
those values that would have been obtained if all tests had been conducted at an
identical saturation condition.
65
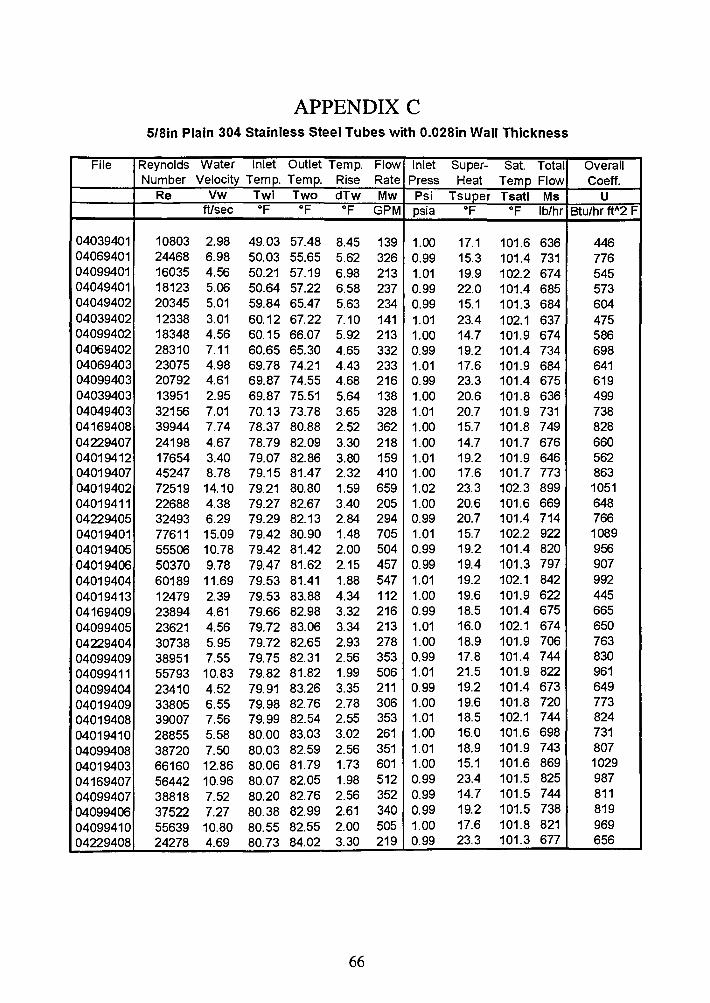
APPENDIX C 5/Sin Plain 304 Stainless Steel Tubes with 0.028in Wall Thickness
File Reynolds Water Inlet Outlet Temp. Flow Inlet Super- Sat. Total Overall Number Velocity Temp. Temp. Rise Rate Press Heat Temo Flow Coeff.
Re Vw Twl Two dTw Mw Psi Tsuper Tsatl Ms u fUsec OF OF OF GPM psia OF OF lb/hr Btu/hr ft/\2 F
04039401 10803 2.98 49.03 57.48 8.45 139 1.00 17.1 101.6 636 446 04069401 24468 6.98 50.03 55.65 5.62 326 0.99 15.3 101.4 731 776 04099401 16035 4.56 50.21 57.19 6.98 213 1.01 19.9 102.2 674 545 04049401 18123 5.06 50.64 57.22 6.58 237 0.99 22.0 101.4 685 573 04049402 20345 5.01 59.84 65.47 5.63 234 0.99 15.1 101.3 684 604 04039402 12338 3.01 60.12 67.22 7.10 141 1.01 23.4 102.1 637 475 04099402 18348 4.56 60.15 66.07 5.92 213 1.00 14.7 101.9 674 586 04069402 28310 7.11 60.65 65.30 4.65 332 0.99 19.2 101.4 734 698 04069403 23075 4.98 69.78 74.21 4.43 233 1.01 17.6 101.9 684 641 04099403 20792 4.61 69.87 74.55 4.68 216 0.99 23.3 101.4 675 619 04039403 13951 2.95 69.87 75.51 5.64 138 1.00 20.6 101.8 636 499 04049403 32156 7.01 70.13 73.78 3.65 328 1.01 20.7 101.9 731 738 04169408 39944 7.74 78.37 80.88 2.52 362 1.00 15.7 101.8 749 828 04229407 24198 4.67 78.79 82.09 3.30 218 1.00 14.7 101.7 676 660 04019412 17654 3.40 79.07 82.86 3.80 159 1.01 19.2 101.9 646 562 04019407 45247 8.78 79.15 81.47 2.32 410 1.00 17.6 101.7 773 863 04019402 72519 14.10 79.21 80.80 1.59 659 1.02 23.3 102.3 899 1051 04019411 22688 4.38 79.27 82.67 3.40 205 1.00 20.6 101.6 669 648 04229405 32493 6.29 79.29 82.13 2.84 294 0.99 20.7 101.4 714 766 04019401 77611 15.09 79.42 80.90 1.48 705 1.01 15.7 102.2 922 1089 04019405 55506 10.78 79.42 81.42 2.00 504 0.99 19.2 101.4 820 956 04019406 50370 9.78 79.47 81.62 2.15 457 0.99 19.4 101.3 797 907 04019404 60189 11.69 79.53 81.41 1.88 547 1.01 19.2 102.1 842 992 04019413 12479 2.39 79.53 83.88 4.34 112 1.00 19.6 101.9 622 445 04169409 23894 4.61 79.66 82.98 3.32 216 0.99 18.5 101.4 675 665 04099405 23621 4.56 79.72 83.06 3.34 213 1.01 16.0 102.1 674 650 04229404 30738 5.95 79.72 82.65 2.93 278 1.00 18.9 101.9 706 763 04099409 38951 7.55 79.75 82.31 2.56 353 0.99 17.8 101.4 744 830 04099411 55793 10.83 79.82 81.82 1.99 506 1.01 21.5 101.9 822 961
04099404 23410 4.52 79.91 83.26 3.35 211 0.99 19.2 101.4 673 649 04019409 33805 6.55 79.98 82.76 2.78 306 1.00 19.6 101.8 720 773 04019408 39007 7.56 79.99 82.54 2.55 353 1.01 18.5 102.1 744 824
04019410 28855 5.58 80.00 83.03 3.02 261 1.00 16.0 101.6 698 731
04099408 38720 7.50 80.03 82.59 2.56 351 1.01 18.9 101.9 743 807
04019403 66160 12.86 80.06 81.79 1.73 601 1.00 15.1 101.6 869 1029
04169407 56442 10.96 80.07 82.05 1.98 512 0.99 23.4 101.5 825 987
04099407 38818 7.52 80.20 82.76 2.56 352 0.99 14.7 101.5 744 811
04099406 37522 7.27 80.38 82.99 2.61 340 0.99 19.2 101.5 738 819
04099410 55639 10.80 80.55 82.55 2.00 505 1.00 17.6 101.8 821 969 04229408 24278 4.69 80.73 84.02 3.30 219 0.99 23.3 101.3 677 656
66
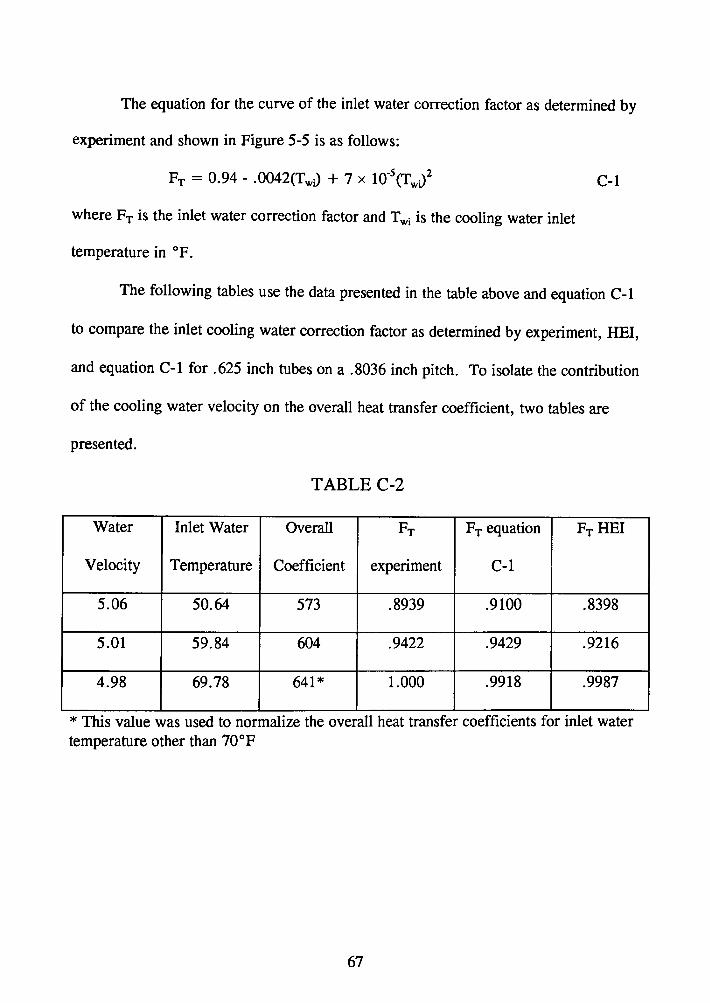
The equation for the curve of the inlet water correction factor as determined by
experiment and shown in Figure 5-5 is as follows:
where FT is the inlet water correction factor and T wi is the cooling water inlet
temperature in °F.
C-1
The following tables use the data presented in the table above and equation C-1
to compare the inlet cooling water correction factor as determined by experiment, HEI,
and equation C-1 for .625 inch tubes on a .8036 inch pitch. To isolate the contribution
of the cooling water velocity on the overall heat transfer coefficient, two tables are
presented.
TABLE C-2
Water Inlet Water Overall FT FT equation FTHEI
Velocity Temperature Coefficient experiment C-1
5.06 50.64 573 .8939 .9100 .8398
5.01 59.84 604 .9422 .9429 .9216
4.98 69.78 641* 1.000 .9918 .9987
* This value was used to normalize the overall heat transfer coefficients for mlet water temperature other than 70°F
67
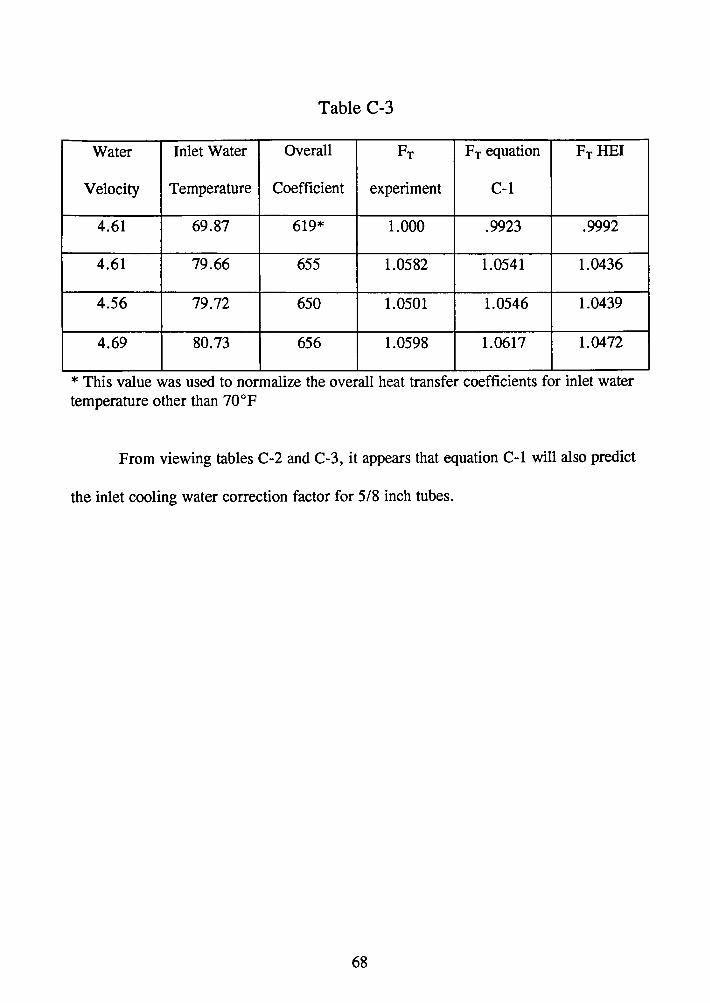
Table C-3
Water Inlet Water Overall FT FT equation FTHEI
Velocity Temperature Coefficient experiment C-1
4.61 69.87 619* 1.000 .9923 .9992
4.61 79.66 655 1.0582 1.0541 1.0436
4.56 79.72 650 1.0501 1.0546 1.0439
4.69 80.73 656 1.0598 1.0617 1.0472
* This value was used to normalize the overall heat transfer coefficients for inlet water temperature other than 70°F
From viewing tables C-2 and C-3, it appears that equation C-1 will also predict
the inlet cooling water correction factor for 5/8 inch tubes.
68