the effects of leaf shear breaking load on the feeding … effects of leaf shear breaking load on...
TRANSCRIPT

Copyright is owned by the Author of the thesis. Permission is given for a copy to be downloaded by an individual for the purpose of research and private study only. The thesis may not be reproduced elsewhere without the permission of the Author.

THE EFFECTS OF LEAF SHEAR BREAKING LOAD ON
THE FEEDING VALUE OF
PERENNIAL RYEGRASS FOR
SHEEP
A thesis presented in partial fulfilment of
the requirements for the degree of
Doctor of Philosophy
in Animal Science
at Massey University,
Palmerston North,
New Zealand
TATSUSHI INOUE
1 9 9 2

Preface
The contents of this thesis represent original work conducted by the author under
the supervision of Dr Ian Brookes and Professor Tom Barry of Department of
Animal S cience , Mas sey Universi ty and Dr Andrew John of Applied
Biotechnology Division, DSIR and Dr Warren Hunt of Grasslands Division, DSIR.
i

Abstract
Inom�, T. , 1 992. The Effects of Leaf Shear Breaking Load on the Feeding Value of
Perennial Ryegrassfor Sheep. 1 94pp.
Reducing physical resistance has been thought to be a key factor to increase
efficiency of masticatory breakdown of forage, which may lead to faster rumen
fractional outflow rates (FOR) and consequently to increased voluntary feed intake
and hence improved feeding value (FV). Two selections of perennial ryegrass
(PRG) were selected for low (LS) and high leaf shear breaking load (HS) based on
the maximum load required to shear across the leaf, i.e. leaf shear breaking load
(LSBL) . The series of experiments were conducted to investigate the effects of
LSBL on the FV of PRG for sheep.
LSBL, morphological and anatomical parameters were measured on the LS and HS
PRG selections grown under the optimum climatic conditions. LSBL for the LS
PRG selection was approximately 41 % lower the HS PRG selection. However,
the LS selection had shorter leaf lengths, narrower leaf widths and narrower leaf
cross-sectional area (CSA) than the HS selection. Therefore, in leaf shear strength
(LSS), the LS selection was estimated to be approximately 27 % less resistant to
shear than the HS selection per unit of CSA. The lower LSS in the LS selection is
due to the lower concentration of sclerenchyma tissues in leaf CSA compared with
the HS selection. However, the differences in the total shear load required to
breakdown a unit dry weight of leaves to 1 x 1 mm·particle size, namely, leaf index
of masticatory load (IML) between the selections were influenced by the
differences in morphological characteristics of leaves between the two PRG I
selections.
Comparisons were made between the LS and HS PRG selections in the efficiency
of mastication by sheep on particle breakdown. There were no major effects of
reduced LSBL in PRG on the efficiency of mastication during eating and during
ii

rumination. Although the LS PRG selection was approximately 29 % lower in
LSBL than the HS PRG selection, the difference for the two PRG selections in
IML was almost nil.
Effects of LSBL in PRG on rumen fractional outflow rate (FOR) and apparent
digestibilities were investigated in sheep fed at restricted feed intake levels. There
were no effects of reduced LSBL on FOR, although the LS PRG selection was
approximately 39 and 12 % lower than the HS PRG selection in LSBL and IML,
respectively. The digestibility of the cellulose fractions was approximately 16 %
lower in the LS PRG selection than the HS PRG selection. The leaf morphology in
PRO may affect the efficiency of fibre digestibility.
Two field trials were conducted to test the hypothesis that LSBL in PRG improves
FOR and leads to higher voluntary feed intake, and hence achieves improved live
weight gain and wool production, namely FV. Although the LS PRG selection had
25-30 % lower LSBL than the HS PRG selection, live weight gain and wool
production of sheep were not improved by reduced LSBL. FOR in sheep showed
no indications of difference and voluntary feed intake was similar between the
animals grazing the LS and HS PRO selections. The lack of difference in IML
between the LS and HS PRG selection can be considered as a main reason for this.
The hypothesis, that reduced LSBL in PRG would improve its FV, was therefore
rejected.
In conclusion, there were no major effects of reduced LSBL in PRG on efficiency
of masticatory particle breakdown, and consequently, FOR, feed intake and hence
FV in sheep. This is due to the lack of selection effect of PRG in IML. IML is a
determining factor for the efficiency of mastication both during eating and
rumination. The selection of PRG for a lower IML will, therefore, be necessary in I
order to increase efficiency of masticatory particle breakdown, FOR and hence FV
of PRG.
iii

Acknowledgements
I want to express my sincere appreciation and gratefulness to my supervisors, Dr
Ian Brookes , Professor Tom Barry of Department of Animal S cience and Dr
Andrew John and Dr Warren Hunt of DSIR for their enthusiastic guidance,
preparation of this manuscript and assistance with field trials (even at two o'clock
in the morning).
I want to thank Professor John Hodgson of Department of Agronomy, Dr Cam
Reid of Department of Physiology and Anatomy, Veterinary Sciences and Dr
Sydney Easton of DSIR for their valuable advice.
I also like to thank Dr Ian Gordon of Department of Agronomy, Dr Dorian Garrick
and Mr Carlos Sosa-Ferreyra of Department of Animal Science for their excellent
statistical guidance.
My special thanks are due to Professor Koji Toyokawa a visiting professor from,
my home country, Japan for his help during his stay at Massey University.
My special thanks are extended to DSIR, Mr Barry Parlane of Animal Physiology
Unit, Mr Tim Harvey, Mr Phil Whitehead and Mr Mike Hogan of Sheep and Beef
Cattle Research Unit for providing the facilities, experimental animals and help
with the experiments.
I was fortunate to have excellent technical support in the field trials from Ms
Jenney Wickham, Ms Catriona Jenkinson, Mr Dean Burnham and the late Mr Merv
Wycherley of Department of Animal Science and Mr John Kook, Mr Peter Millner
and Mr Norman Dench of DSIR.
I want to gratefully thank to laboratory staff, Ms Rosemary Watson, Mrs Barbara
Purchas, Mrs Kathy Morton, Mr Dave Hamilton of Department of Animal Science
iv

and Mr David Shelton of DSIR for their excellent service and technical assistance,
Mr A. Craig and Mr D. Hopcroft of DSIR for providing excellent technical
assistance with microscopy, Mr Leo Bolter of Department of Engineering and Mr
K. Palmer of Victoria University for the marker analysis.
My special thanks are also extended to Mr Mike Conlon of Department of Food
Technology and Mrs Elizabeth Halligan and Technical Services Group of Plant
Physiology Division , DSIR for providing the research facilities and technical
assistance.
Thanks are also due to Mrs B arbara Purchas and Ms Margaret Scott for proof
reading the manuscript.
I want to thank all the staff and postgraduate student in the Department of Animal
Science for friendship, support and understanding which made my stay in New
Zealand an enjoyable and memorable one.
I want to express my appreciation to my student colleagues, Frangoise, Raymundo,
Christine. (MacArthur), Sunan, Warren, Min and, especially, Zheng Zhong for
their help.
I acknowledge the personal financial support received from the New Zealand
University Grants Committee Scholarship. This project was financially supported
by the C. Alma Baker Trus t, the Grant-in-aid from DSIR and the Massey
University Research Fund.
I am particularly grateful to my friend, Sabine, for her support and encouragement.
Final ly, I a lso want to spec ially thank my parents for t heir continued
encouragement and support throughout my life.
V
Table of Contents
Page
Preface ...................................................................................................................... i
Abstract ....................................................................................................... ............. ii
Acknowledgements .................. ................................................................................ iv
List of tables ................................................ ........................................ .............. .... xvi
List of figures .............................. ................................................................... . . . . . xxiv
List of Abbreviations ......................................................................................... xxviii
Introduction ............................................................................................................. 1
Chapter One A Review of Factors Limiting the Feeding Value of Perennial
Ryegrass
1 . 1 Introduction ...................................................................................................... 3
1 .2 The role of perennial ryegrass in the New Zealand pasture ..................... . ....... 3
1 .2. 1 Agronomic characteristics of perennial rye grass ................................... 3
1 .2.2 Animal production response to perennial rye grass .................. . . . ........... 4
1 .2.2. 1 Definition of feeding value ...................................................... 4
1 .2.2.2 Feeding value of perennial rye grass ........................................ 5
1 .2. 3 Conclusion ............................................................................................. 7
1 .3 Factors limiting the feeding value of perennial rye grass ................................. 7
1 .3 . 1 Factors limiting nutritive value of perennial rye grass ........................... 7
1 .3. 1 . 1 Apparent digestibility of perennial rye grass ............................ 7
1 .3. 1 .2 Efficiency of utilisation of perennial ryegrass ......................... 9
1 .3. 1 .3 Conclusion ............................................................................. 1 1
1 .3.2 Factors limiting intake of perennial ryegrass ....................................... 1 1
1 .3.2. 1 Non-nutritional factors ......................... .................................. 13
1 .3.2. 1 . 1 Sward condition and prehending behaviour ................... 13
Vl

1 .3.2.2 Nutritional factors . . . .. . . . . . . . . .. . . . . . . . . . . .. . . . . . . . . . . . . . . . . . . . . . . . . . . . . . . . . . . . . . . . 16
1 .3.2.2. 1 Metabolic factors . . . . . . . . . . . . . . .. . . . . . . . . . . . . . . . . . . . . . . . . . . . . . . . . . . . . . . . . . . . . 16
1 .3 .2.2.2 Physical factors . . . . . . . . . . . . . . . . . . . . . . . . . . . . . . . . . . . . . . . . . . . . . . . . . . . . . . . . .... . . . 17
1 .3.2.3 Conclusion . . . . . . . . . . . . . . . . . . . . . . . . . . . . . . . . . . . . . . . .. .. . . . . . . . . . . . . . . . . . . . . . . . . . . . . . . . . . . 17
1 .3 .3 Digesta passage from the rumen . . . . . . . . . . . . . . . . . . . . . . . . . . . . . . . . . . . . . . . . . . . . . . . . . . . . . . . . .. 19
1 .3.3. 1 Physical reduction in particle size and microbial digestion . . . 19
1 .3.3. 1 . 1 Chewing during eating . . . . . . . . . . . . . . . . . . . . . . . . . . . . . . . . . . . . . . . . . . . . . . . . . . . . 19
1 .3.3. 1 .2 Chewing during rumination . . . . . . . . . . . . . . . . . . . . . . . . . . . . . . . . . . . . . . . . . . . . 20
1 .3.3. 1 .3 Role of microbial attack in the rumen . . .. . . . . . . . . . . . . . . . . . . . . . . . . . 23
1 .3.3.2 Passage through the reticulo-omasal orifice . . . . . . . . . . . . . . . . . . . . . . . . . . 23
1 .3.3.3 Conclusion . . . . . . . . . . . . . . . . . . . . . . . . . . . . . . . . . . . . . . . . . . . . . . . . . . . . . . . . . . . . . . . . . . . . . . . . . . . . . 24
1 .4 Attempts to improve feeding value of perennial ryegrass by
reducing physical resistance to breakdown .. . . . . . . . . . . . . . . . . . . . . . . . . . . . . . . . . . . . . . . . . . . . . . . . . . . 24
1 .4. 1 Physical resistance of perennial rye grass to fracture . . . . . . . . . . . . . . . . . . . . . . . . . . . 24
1 .4. 1 . 1 Anatomy of perennial ryegrass . . . . . . . . . . . . . . . . . . . . . . . . . . . . . . . . . . . . . . . . . . . . . . 24
1 .4. 1 .2 Forces applied at fracture . . . . . . . . . . . . . . . . . . . . . . . . . . . . . . . . . . . . . . . . . . . . . . . . . . . . . . . 28
1 .4. 1 .2. 1 Perennial rye grass in tensile stress . . . . . . . . . . . . . . . . . . . . . . . . . . . . . . . . . . 3 1
1 .4 . 1 .2 .2� Forces applied to the feed m aterial during
mastication by ruminants . . . . . . . . . . . . . . . . . . . . . . . . . . . . . . . . . . . . . . . . . . . . . . . . 35
1 .4. 1 .2.2. 1 Masticatory movements of ruminants . . . . . . . . . . . . . . . . . . . . . . . . . . 35
1 .4. 1 .2.2.2 Forces applying to the feed
material by teeth . . . . . . . . . . . . . . . . . . . . . . . . . . . . . . . . . . . . . . . . . . . . . . . . . . . . . . . . . . . . . . 37
1 .4. 1 .2.3 Conclusion ... . . . . . . . . . .. .. . . . . . . . . . . . . . . . . . . . . . . . . . . . . . . . . . . . . . . . . . . . . . . . . . . . . . . 37
1 .4.2 Contribution of reduced leaf shear breaking load in perennial
ryegras s towards improved intake and feeding value -
Background studies . . . . . . . . . . . . . . . . . . . . . . . . . . . . . . . . . . . . . . . . . . . . . . . . . . . . . . . . . . . . . . . . . . . . . . . . . . . . . . 40
1 .4.2. 1 Selection for low and high leaf shear breaking load
perennial ryegrass . . . . . . . . . . . . . . . . . . . . . . . . . . . . . . . . . . . . . . . . . . . . . . . . . . . . . . . . . . . . . . . . . . 40
1 .4.2.2 Rates of dry matter consumption, digestibilities and
liveweight gains of sheep grazing two perennial
ryegrass selections selected for low and high leaf
shear breaking load . . . . . . . . . . . .. . . . . . . . . . . . . . . . . . . .. .. . . . . . . . . . . . . . . . . . . . . . . . . . . . . . 43
1 .4.2.3 Conclusion . . . . . . . . . . . . . . . . . . . . . . . . . . . . . . . . . . . . . . . . . . . . : . . . . . . .. . . . . . . . . . . . . . . . . .. . . . . . . 43
vii

1 .4.3 Objectives of investigations in this thesis ............................................ 46
Chapter Two Comparisons of Leaf Anatomy, Leaf Morphology and Leaf
Shear Strength between Two Perennial Ryegrass Selections
Selected for Low and High Leaf Shear Breaking Load
2. 1 Introduction .................................................................................................... 48
2.2 Materials and methods ................................................................................ ... 48
2.2. 1 Low and high leaf shear breaking load perennial ryegrass
selections .................. .......................................................................... .. 49
2.2.2 Experimental design ................................ .................................. ........... 49
2.2.2. 1 Plant allocation ......... . ........................................... ................. 5 1
2.2.2.2 Identification and allocation of leaves ................ ............ ....... 5 1
2.2.3 Collection of leaves ......................................................................... ..... 5 1
2.2.4 Measurements of leaf morphology ...................................................... 52
2.2.5 Determination of leaf shear breaking load ........................................... 52
2.2.5 . 1 The position of shear on the leaf ........................................ ... . 52
2.2.5.2 Shear apparatus ..................................... ................................. 52
2.2.5.3 Determination of leaf shear breaking load ............................. 53
2.2.6 E stimation of leaf cross -sectional area and anatomical
examination of leaf cross-section .................. ....................................... 53
2.2.6. 1 Collection of leaf cross-sections ....................... ..................... 54
2.2.6.2 Preparation of specimens for microscopy .............................. 54
2.2.6.3 Microscope examination .......................... .............................. 54
2.2.6.4 Determination of leaf cross-sectional area .......................... . .. 55
2.2.6.5 Mathematical estimation of leaf cross-sectional area
from width .............................................................................. 55
2.2.7 Determination of leaf shear strength .................................................... 55
2.2.8 Chemical analyses ................................... ............................................. 55
2.2.9 Statistical analyses ............................................................................... 56
2.3 Results ............................................................................................................ 56
2.3. 1 Cross-sections of the leaves of the low and high leaf shear
viii

breaking load perennial rye grass selections ......................................... 56
2.3.2 Morphology of the leaves of the low and high leaf shear
breaking load perennial ryegrass selections . . . . . . . . . . . . . . . . . . . . . . . . . . . . . . . . . . . . . . . . . 58
2.3.3 Shear breaking loads and shear strengths of the leaves of the
low and high leaf shear breaking load perennial ryegrass
selections ..................................................... . ........................................ 63
2.3.4 Concentrations of dry matter, organic matter, lignin and cell
wall constituents in the leaves of the low and high shear
breaking load perennial rye grass selections ... .................... .................. 66
2.4 Discussion ...................................................................................................... 70
2.4. 1 Effects of selection . . . . . . . . . . . . . . . . . . . . . . . . . . . . . . . . . . . . . . . . . . . . . . . . . . . . . . . . . . . . . . . . . . . . . . . . . . . . . . . 70
2.4.2 Leaf anatomy ........................................................................................ 70
2.4.3 Effects of leaf emergence ................ ............................................... ...... 7 1
2.4.4 Effects of aging . . . . . . . . . . . . . . . . . . . . . . . . . . . . . . . . . . . . . . . . . . . . . . . . . . . . . . . . . . . . . . . . . . . . . . . . . . . . . . . . . . . . 73
2.4.5 Interaction between leaf shear breaking load and leaf morphology . . . . 74
2.5 Conclusion ................................................................................................. .... 77
Chapter Three T h e Effects of Reduced Leaf S he a r B reak i n g Load in
P e r e nn i al Ryegrass u p on Part ic le Breakdown during
Mastication in Sheep
3 . 1 Introduction .................................................................................................... 78
3.2 Materials and methods ...... ............................................................................. 78
3.2. 1 Low and high leaf shear breaking load perennial ryegrass
selections ...................................................... .............................. .......... 79
3.2.2 Experimental animals ........................................................................... 79
3.2.3 Experimental design ............................................................................. 79
3 .2.3 . 1 Adjustment period .................................................................. 79
3.2.3.2 Voluntary feeding period . . . . . . . . . . . . . . . . . . . . . . . . . . . . . . . . . . . . . . . . . . . . . . . . . . . . . . . 79
3.2.3.3 Trial periods ..... ...................................................................... 80
3 .2.3.3. 1 Trial 1: Efficiency of chewing during eating
upon particle breakdown . . . . . . . . . . . . . . . . . . . . . . . . . . . . . . . . . . . . . . . . . . . . 80
ix

3 .2 .3 .3 .2 Trial 2 : Efficiency of chewing during
rumination upon particle breakdown .. . .... . . . . . . . . . . . . . . . . . . 8 1
3.2.4 Recording of jaw movements ... . . . . . . . . . . . . . . . . . . . . . . . . . . . . . . . . . . . . . . . . . . . . . . . . . . . . . . . . . .. 8 3
3.2.5 Particle size analyses of rumen contents .. . . .. . . . . . . . ... . . . . . . . . . . . . . . . . . . . . .. . ... . . . . 8 3
3 .2.6 Determination of the index of masticatory load of leaves . . . . . . . . . . .. . . . . . . . 84
3.2.6. 1 Measurements of leaf morphology ... . . . . . . . . . . . . . . . . . . . . . . . . . . . . . . . . . . . . . 84
3.2.6.2 Measurement of leaf s hear breaking load and
determination of index of masticatory load . . . . . . . . . . . . . . . . . . . . . . . . . . . 84
3.2.7 Chemical analyses . . . . . . . . . . . . . . . . . . . . . . . . . . . . . . . . . . . . . . . . . . . . . . . . . . . . . . . . . ... . . . . . . . . . .. . ... . . . . . 85
3.2.8 Statistical analysis . . . . . . . . . . . . . . . . . . . . . . . . . . . . . . . . . . . . . . . . . . . . . . . . . . . . . . . . . . . . . .. . . . . . . . . . . . . . . . . . 85
3.3 Results . . . . . . . . . . . . . . . . . . . . . . . . . . . . . . . . . . . . . . . . . . . . . . . . . . . . . . . . . . . . . . . . . . . . . . . . . . . . . . . . . . . . . . . . . . . . . . . . . . . . . . . . . . . . 85
3.3. 1 Leaf morphology, leaf shear breaking loads and indices of
masticatory load of the low and high leaf shear breaking load
perennial rye grass selections . . . . . . . . . . . . . . . . . . . . . . . . . . . . . . . . . . . . . . . . . . . . . . . . . . . . . . . . . . . . ... . 85
3.3.2 Trial 1 . . . . . . . . . . . . . . . . . . . . . . . . . . . . . . . . . . . . . . . . . . . . . . . . . . . . . . . . . . . . . . . . . . . . . .. . . . . . . . . . . . . . . . . . . . . . . . . . . . . 87
3.3.2. 1 Masticatory behaviour and efficiency of chewing in
wethers during eating the low and high breaking load .. . . . . . . . . 87
3 .3.2.2 Particle s ize distributions in the rumen contents
recovered from the wethers immediately after
ingesting the low and high leaf shear breaking load
perennial rye grass selections . . . . . . . . . . . . . . . . . . . . . . . . . . . . . . . . . . . . . . . . . . . . . . . . . . 90
3.3.3 Trial 2 . . . . . . . . . . . . . . . . . . . . . . . . . . . . . . . . . . . . . . . . . . . . . . . . . . . . . . . . . . . . . . . . . . . . . . . . . . . . . . . . . . . . . . . . . . . . . . . . . . . 90
3.3.3 . 1 Rumen pool sizes of the wethers ruminating the low
and high breaking load perennial rye grass selections . . . . . . . .. .. . 90
3.3.3.2 Masticatory behaviour and efficiency of chewing in
wethers during ruminating the low and high breaking
load perennial rye grass selections . . . . . . . . . . . . . . . . . . . ... . . . . . . . . . . . . . . . . . . . . 93
3.3.3.3 Particle size distributions in the rumen contents
recovered at 10:30 and 17:30 hours from the wethers
ruminating the low and high leaf shear breaking load
perennial rye grass selections . .. . . . . . . . . . . . . . . . . . . . . . . . . . . .. . . . . . . ... . ... . . . . . . 93
3 .4 Discussion . . . . . . . . . . . . . . . . . . . . . . . . . . . . . . . . . . . . . . . . . . . . . . . . . . . . . . . . . . . . . . . . . . . . . . . . . . . . . . . . . . . . . . . . . . . . . . . . . . . . . . 96
3.4. 1 Effect of reduced leaf shear breaking load on· the index of
X

masticatory load of leaves . . . . . . . . . . . . . . . . . . . . . . . . . . . . . . . . . . . . . . . . . . . . . . . . . . . . . . . . . . . . . . . . . . . . 96
3.4.2 Effects of reduced leaf shear breaking load on particle size
distribution in the rumen contents . . . . . . . . . . . . . . . . . . . . . . . . . . . . . . . . . . . . . . . . . . . . . . . . . . . . . . . . 96
3.4.3 Influence of index of masticatory load on masticatory efficiency . . . . . . . 97
3.4.4 Particle breakdown during rumination ................................................. 98
3 .5 Conclusion ........... ...................... .......... ................................ . ....................... 100
Chapter Four The E ffect s of Reduced Leaf Shear B reak i n g Load i n
Perennial Ryegrass upon Rumen Digesta Outflow Rate and
Apparent Digestibility in Sheep
4. 1 Introduction .................................. .................................... ............................ 101
4.2 Materials and Methods .............................................................................. . . . 101
4.2. 1 Low and high leaf shear breaking load perennial ryegrass
selections . . . . .. . . . . .. .. . . .. .. .. .. .. . . .. .. .. .. .. . . .. .. .. . . .. . . . . .. . . .. .. . . .. .. .. .. . . . .. . .. .. . . .. . . .. . . 102
4.2.2 Experimental animals ......................................................................... 102
4.2.3 Experimental design .................................................... ....................... 102
4.2.3. 1 Adjustment period ......... ............ .......................................... . 102
4.2.3.2 Voluntary feeding period ..................................................... 102
4.2.3.3 Trial period ...................................... ..................................... 103
4.2.3.3 . 1 Determination of rumen digesta outflow rate ............... 103
4.2.3.3 .2 Determination of apparent digestibilities ...................... 104
4.2.4 Determination of the index of masticatory load of leaves ................. 105
4.2.4. 1 Measurements of leaf morphology .............................. ........ 105
4.2.4.2 Measurement of leaf shear breaking load of leaf ................. 105
4.2.5 Chemical analyses . . . . . . . . . . . . . . . . . . . . . . . . . . . . . . . . . . . . . . . . . . . . . . . . . . . . . . . . . . . . . . . . . . . . . . . . . . . . . . 106
4.2.6 Statistical analyses ............................. ...... ............. ............................. 107
4·.3 Results .......................................................................................................... 107
4.3. 1 Leaf morphology , leaf shear breaking load, index of
masticatory load and chemical composition of the low and
high shear breaking load perennial ryegrass selections ..................... 107
4.3.2 Rumen pool size, rumen digesta fractional outflow rates,
Xl
rumen digesta retention times and particle size distribution in
rumen contents in wethers fed on the low and high leaf shear
breaking load perennial rye grass selections . . . . . . . . . . . . . . . . . . . . . . . . . . . . . . . . . . . . . . . 1 10
4.3.3 Apparent digestibilities, concentrations of VFA and N�-N in
rumen contents in wethers fed on the low and high shear
breaking load perennial ryegrass selections . .. . . . . . . . . . . . . . . . . . . . . . . . . . . . . . . . . . . . . 1 10
4.4 Discussion . . . . . . . . . . . . . . . . . . . . . . . . . . . . . . . . . . . . . . . . . . . . . . . . . . . . . . . . . . . . . . . . . . . . . . . . . . . . . . . . . . . . . . . . . . . . . . . . . . .. 1 17
4.5 Conclusion . . . . . . . . . . . . . . . . . . . . . . . . . . . . . . . .. .. . . . . . . . . . . . . . . . . . . . . . . . . . . . . . . . . . . . . . . . . . . . . . . . . . . . . . . . . . . . . . . . . 1 18
Chapter Five The Effects of Reduced Leaf Breaking Load in Perennial
Ryegrass upon Rumen Digesta O utflow Rates, Voluntary
Feed Intake, Liveweight Gain and Wool Production in
Grazing Sheep
5 . 1 Introduction . . . . . . . . . . . . . . . . . . . . . . . . . . . . . . . . . . . . . . . . . . . . . . . . . . . . . . . . . . . . . . . . . . . . . . . . . . . . . . . . . . . . . . . . . . . . . . . . . . 1 19
5 .2 Materials and Methods . . . . .. . . . . . . . . .. . . . . . . . . . . . . . . . . . . . . . . . . .. . . . . . . . . . . . . . . . . . . . . . . .. . . . . . . . . . . . . . . . 1 19
5.2. 1 Pasture . . . . . . . . . . . . . . . . . . . . . . . . . . . . . . . . . . . . . . . . . . . . . . . . . . . . . . . . . . . . . . . . . . . . . . . . . . . . . . . . . . . . . . ... . . . . . . . 120
5.2.2 Trial 1 . . . . . . . . . . . . . . . . . . . . . . . . . . . . . . . . . . . . . . . . . . . . . . . . . . . . . . . . . . . . . . . . . . . . . . . . . . . . . . . . . . . . . . . . . . . . . . . . . 120
5 .2.2. 1 Determination of rumen digesta fractional outflow rates . . . . 120
5.2.2.2 Me asurements of l ive weight gain and wool
production in autumn-born lambs . . . . . . . . . . . . . . . . . . . . . . . . . . . . . . . . . . . . . . . . 121
5.2.2.2. 1 Live weight gain . . . . . . . . . . . . . . . . . . . . . . . . . . . . . . . . . . . . . . . . . . . . . . . . . . . . . . . . . . . 121
5 .2.2.2.2 Wool production . . . . . . . . . . . . . . . . . . . . . . . . . .. . . . . . . . . . . . . . . . . . . . . . . . . . . . . . . . . 122
5 .2.3 Trial 2 . . . . . . . . . . . . . . . . . . . . . . . . . . . . . . . . . . . . . . . . . . . . . . . . . . . . . . . . . . . . . . . . . . . . . . . . . . . . . . . . . . . . . . . . . . . . . . . . . 121
5.2.3. 1 Determination of rumen digesta fractional outflow rates . . . . 122
5 .2.3.2 Measurements of live weight gain in ewe-hoggets . . . . . . . . . . . . 123
5.2.3.3 Measurement of voluntary organic matter intake in
ewe-hoggets and rumen-fistulated wethers . . . . . . . . . . . . . . . . . . . . . . . . . . 123
5.2.4 Herbage analysis . . . . . . . . . .. . . . . . . . . . . . . . . . . . . . . . . . . . . . . . . . . . . . . . . . . . . . . . . . . . . . . . . . . . . . . . . . . . . . . . 127
5.2.4. 1 Pasture mass . . . . . . . . . . . . . . . . . .. . . . . . . . . . . . . . . . . . . . . . . . . .. . . . . . . . . . . . . . . . . . . . . . . . . . . . . 127
5.2.4.2 In vitro digestibility of herbage . . . . . . . . . . . . . . . . . . . . . . . . . . . . . . . . . . . . . . . . . . . . 127
5 .2.4.3 Composition and in vitro digestibility of material
xii
ingested by the sheep . . . . . . . . . . . . . . . . . . . . . . . . . . . . . . . . . . . . . . . . . . . . . . . . . . . . . . . . . . . 128
5.2.4.4 Determination of leaf shear breaking load and index
of masticatory load . . . . . . . . . . . . . . . . . . . . . . . . . . . . . . . . . . . . . . . . . . . . . . . . . . . . . . . . . . . . . . . 128
5.2.5 Chemical analyses . . . . . . . . . . . . . . . . . . . . . . . . . . . . . . . . . . . . . . . . . . . . . . . . . . . . . . . . . . . . . . . . . . . . . . . . . . . . . . 129
5 .2.5. 1 Rumen contents . . . .. . . . . . . . . . . . . . . . . . . . . . . . . . . . . . . . . . . . . . . . . . . . . . . . ... . . . . . . . . . . . . . 129
5.2.5.2 Faeces . . . . . . . . . . . . . . .. .. . . . . . . . . . . . . . . . . . . . . . . . . . . . . . . . . . . . . . . . . . . . . . . . . . . . . . . . . . . . . . . . . . 129
5.2.5.3 Herbage and oesophageal extrusa . . . . . . . . . . . . . . . . . . . . . . . . . . . . . . . . . . . . . . . . 130
5.2.6 Statistical analyses . . . . . . . . . . . . . . . . . . . . . . . . . . . . . . . . . . . . . . . . . . . . . . . . . . . . . . . . . . . . . . . . . . . . . . . . . . . . . 130
5 .3 Results . . . . . . . . . . . . . . . . . . . . . . . . . . . . . . . . . . . . . . .. . . . . . . . . . . . . . . . . . . . . . . . . . . . . . . . . . . . . . . . . . . . . . . . . . . . . . . . . . . . . . . . . . . 130
5.3 .1 Trial 1 . . . . . . . . . . . . . . . . . . . . . . . . . . . . . .. . . . . . . . . . . . . . . . . . . . . . . . . . . . . . . . . . . . . . . . . . . . . . . . . . . . . . . . . . . . . . . . . . . 130
5.3. 1 . 1 Pasture . . . . . . . . . . . . . . . . . . . . . . . . . . . . . . . . . . . . . . . . . . . . . . . . . . . . . . . . . . . . . . . . . . . . . . . . . . . . . . . . . . 130
5.3 . 1 .2 Live weight gain and wool production in autumn
born lambs grazing the low and high leaf shear
breaking load perennial ryegrass selections . . . . . . . . . . . .. . . . . . . . . . . . . 135
5 .3 . 1 .3 Rumen pool size, digesta fractional outflow rates,
digesta mean retention times and partic le size
distributions in rumen contents in wethers grazing
the low and high leaf shear breaking load perennial
ryegrass selections . . . . . . . . . . . . . . . . . . . . . . . . . . . . . . . . . . . . . . . . . . . . . . . . . . . . . . . . . . . . . . . 135
5.3.2 Trial 2 . . . . . . . . . . . . . . . . . . . . . . . . . . . . . . . .. . . . . . . . . . . . . . . . . . . . . . . . . . . . . . . . . . . . . . . . . . . . . . . . . . . . . . . . . . . . . . . . . 143
5.3.2. 1 Pasture . . . . . . . . . . . . . . . . . . . . . . . . . . . . . . . . . . . . . . . . . . . . . . . . . . . . . . . . . . . . . . . . . . . . . . . . . . . . . . . . . . 143
5 .3.2.2 Live weight gain and voluntary organic matter intake
in ewe-hoggets grazing the low and high leaf shear
breaking load perennial ryegrass selections . . . . . . . . . . . . . . . . . . . . . . . . . 143
5.3.2.3 Rumen pool size, digesta fractional outflow rates,
diges ta mean retention times and particle size
distributions in rumen contents in wethers grazing
the low and high leaf shear breaking load perennial
ryegrass selections . . . . . . . . . . . . . . . . . . . . . . . . . . . . . . . . . . . . . . . . . . . . . . . . . . . . . . . . . . . . . . . 152
5.4 Discussion . . . . . . . . . . . . . . . . . . . . . . . . . . . . . . . . . . . . . . . . . . . . . . . . . . . . . . . . . . . . . . . . . . . . . . . . . . . . . . . . . . . . . . . . . . . . . . . . . . . . 156
5.5 Conclusion . . . . . . . . . . . . . . . . . . . . . . . . . . . . . . . . . . . . . . . . . . . . . . . . . . . . . . . . . . . . . . . . . . . . . . . . . . . . . . . . . . . . . . . . . . . . . . . . . . . 158
xiii

Chapter Six General Discussion and Conclusion
6. 1 Introduction . . . . . . . . . . . . . . . . . . . . . . . . . . . . . . . . . . . . . . . . . ... . . .. . . .. .. .. . . . . . . . . . . ... . . . . . . . . . . . . . . . . . . ... .. .. . . . . 160
6.2 Relationship s between leaf shear breaking load and index of
masticatory load of leaf in perennial rye grass . .. .. .. . . .. .. .. .. .. . . .. .. .. .. . . .. .. .. .. .. . . . . 160
6.3 Limitation of reducing leaf shear breaking load in perennial rye grass
on improving feeding value to sheep . . . ... . . . . . . . .. . . . . . . . . . . . . . ... .. . . . . ... . . . . . . . . . . . . . . . . . . . 1 62
6.4 Influence of index of masticatory load on particle breakdown and
masticatory behaviour in sheep ... . ...... . . . ... . . ... . . . . . . . . . . . ... .. . . . . . . ... . . . . . . . . . . . ... . . . . . . . . 166
6.5 Direction of further studies . . . . . . . . . . . ... . . . . . . . . . . . . . . . . . . . . . . . . . . . ... . . . . . . . . . . . . . . . . . .... . . . . . . . .. 167
6.6 Conclusion . . . . . . . . . . ... . . . . . . . . .. . . . . . . . .... . . ... .. . . . . . . . . . . . . . . . . . . . . . . . . . . . . . . . . . . . . . . .. . . . ... .. . . . .... ... 168
Appendix 2.1
Appendix 2.2
Appendix 2.3
Newcastle State University Phytotron Nutrient Solution . . . . . . .. 169
Movements of the blade and position of the slot of a
Warner-Bratzler meat shear apparatus in shearing action . . . . . . . 170
An example of table of analysis of variance for fresh
weight of the leaves of the low and high shear breaking
load perennial rye grass selections . . . . . . . . . . . . . .... . . . . . . . . . . . ... . . . .. . . .... . . 171
Appendix 2.4 Concentrations of organic matter, lignin and cell-wall
constituents of the second-emerged, fourth-emerged
and sixth-emerged leaves of the low and high leaf shear
Appendix 3.1
breakin g load p erennial ryegra s s selections a t
maturation, 10 days and 20 days after the maturation . . . ... . . . . . . . 172
An example of a table of analysis of variance for the
proportion of particles larger than 1 mm in rumen
contents recovered from wethers immediately after
inges ting the low and high shear breaking load
perennial ryegrass selections . . . . . . . . . .. . . . . . . ... . . . . . . . . . . . ... . . . . . . . . . . . . ... . . . 173
Appendix 5.1 Portable marker infusion backpack set . . . ... . . . . . . . . . . . . . . . .. . . . . . . . . . ... . 17 4
Portable marker infusion set in operation . . . . . . . . ... . . . . . . ... . .. ... . . . . . . 17 5
Appendix 5.2 Diurnal pattern of total rumen pool and dry matter
rumen pool of rumen-fi stulated wethers grazing
XIV

perennial rye gra ss .. .. .. .. . . . . .. .. . . . . . . .. .. .. .. .. .. .. . . . . .. . . . . .. .. . . . . . . . . .. . . . . . . .. 17 6
Appendix 5.3 Preparation of Co(III)-EDTA ............................................ ...... 177
Appendix 5.4 E stimation of Cr relea se rate .......... . . . ... .................. ................ .. 178
References ........................................................................................................... 179
XV
List of Tables
Table 1.1 The relative feeding value of New Zealand pasture species
Page
under grazing conditions for young sheep (Ulyatt, 1 970) . . . . . . . . . . . . . . . . . . . . 6
Table 1.2 Composition, decline in apparent in vivo digestibility and
utilisation of metabolisable energy (ME) of dried S23
perennial ryegrass harvested at 4 stages of maturity and fed
to sheep at maintenance level of intake (adapted from
Waghorn et al. , 1987) . . . . . . . . . . . . . . . . . . . . . . . . . . . . . . . . . . . . . . . . . . . . . . . . . . . . . . . . . . . . . . . . . . . . . . . . . . . 8
Table 1.3 Data on the digestion of Ruanui perennial rye grass and Huia
white clover by sheep (Ulyatt, 198 1) . . . . . . . . . . .. . . . . . . . . . . . . . . . . . . . . . . . . . . . . . . . . . . . . . . 10
Table 1.4 The effect of chewing during eating (C.EA T) on feeding
behaviour and particle size reduction in sheep (n=6) fed
three fresh herbages and two chaffed hays (adapted from
Ulyatt et al., 1986) . . . . . . . . . . . . . . . . . . . . . . . . . . . . . . . . . . . . . . .. . . . . . . .. . . . . . . . . . . . . . . . . . . . . . . . . . . . . . . 21
Table 1.5 Effect of chewing during rumination (C.RUM) on particle
size distributions in sheep (n=6) fed three fresh herbages and
two chaffed hays (adapted from Ulyatt et al. , 1986) . . . . . . . . . . . . . . . . . . . . . . . . . . 22
Table 1.6 Mean leaf strengths, sclerenchyma wall percentages and
cellulose percentages of perennial, Ariki, Italian and Short
rotation ryegrass and mean liveweight gain of sheep
(adapted from Evans, 1964a, and Rae et al. , 1964) . . . . . . . . . . . . . . . . . . . . . . . . . . . .32
Table 1.7 Young' s modulus of tensile strength and volume-fraction of
leaf of perennial ryegrass (adapted from Vincent 1982 and
Betteridge et al., 1986) . . . . . . . . . . .. . . . . . . . . . . . . . . . . . . . . . . . . . . . . . . . . . . . . . . . . . . . . . . . . . . . . . . . . . . . . 34
XVI
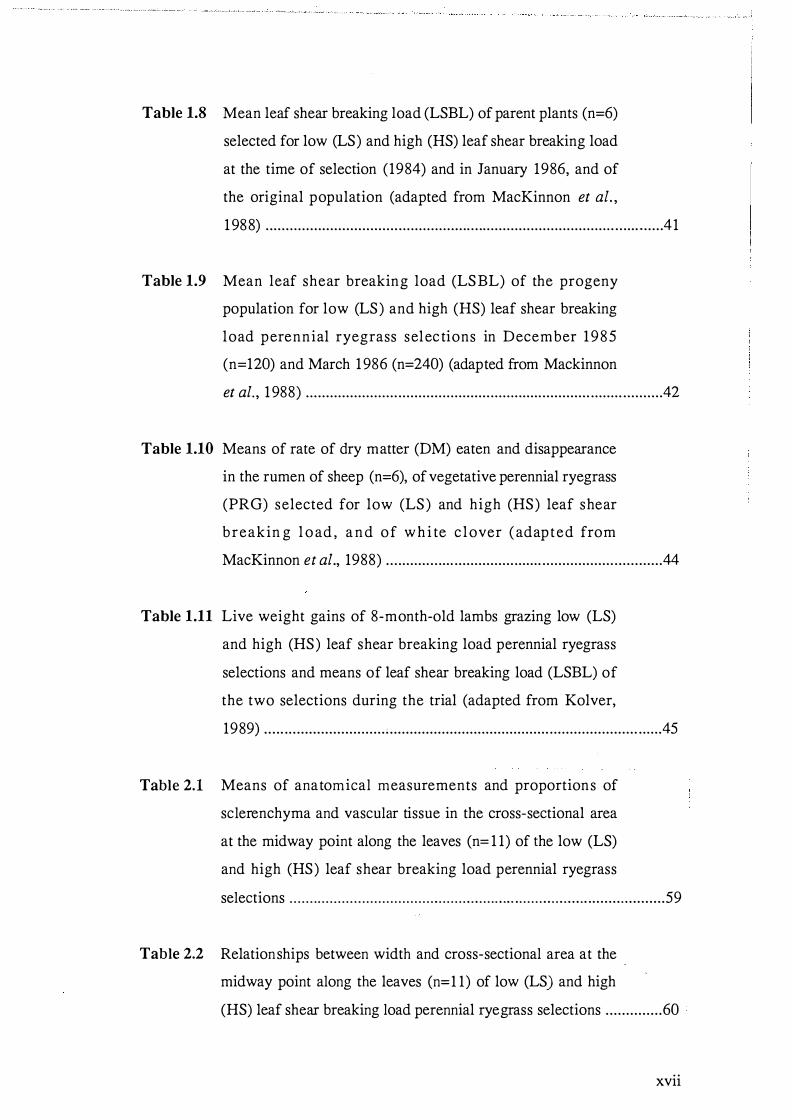
Table 1.8 Mean leaf shear breaking load (LSBL) of parent plants (n=6)
selected for low (LS) and high (HS) leaf shear breaking load
at the time of selection (1984) and in January 1986, and of
the original population (adapted from MacKinnon et al. ,
1 988) . . . . . . . . . . . . . . . . . . . . . . . . . . . . . . . . . . . . . . . . . . . . . . . . . .. . . .. . . . . . . . . . . . . . . . . . . . . . . . . . . . . . . . . . . . . . ... . . . . 41
Table 1.9 Mean leaf shear breaking load (LSBL) of the progeny
population for low (LS) and high (HS) leaf shear breaking
load perennial ryegrass selec tions in December 1985
(n=120) and March 1986 (n=240) (adapted from Mackinnon
et al. , 1 988) . . . . . . . . . . . . . . . . . . . . . . . . . . . . . . . . . . . . . . . . . . . . . . . . . . . . . . . . . . . . . . . . . . . . . . . . . . . . . . . . . . . . . . . . . 42
Table 1.10 Means of rate of dry matter (DM) eaten and disappearance
in the rumen of sheep (n=6), of vegetative perennial rye grass
(PRO) selected for low (LS ) and high (HS) leaf shear
breakin g l o ad , and of wh i te c lover ( adapted from
MacKinnon et al., 1988) . . . . . . . . . . . . . . . . . . . . . . . . . . . . . . . . . . . . . . . . . . . . . . . . . . . . . . . . . . . . . . . . . . . . . 44
Table 1.11 Live weight gains of 8-month-old lambs grazing low (LS)
and high (HS) leaf shear breaking load perennial ryegrass
selections and means of leaf shear breaking load (LSBL) of
the two selections during the trial (adapted from Kolver,
1989) . . . . . . . . . . . . . . . . . . . . . . . . . . . . . . ; . . . . . . . . . . . . . . . . . . . . . . . . . . . . . . . . . . . . . . . . . . . . . . . . . . . . . . . . . . . . . . . . . . . . 45
Table 2.1 Means of anatomical measurements and proportions of
sclerenchyma and vascular tissue in the cross-sectional area
at the midway point along the leaves (n= 1 1) of the low (LS)
and high (HS) leaf shear breaking load perennial ryegrass
selections . . . . . . . . . . . . . . . . . . . . . . . . . . . . . . . . . . . . . . . . . . . . . . . . . . . . . . ... . . . . . . . . . . . . . . . . . . . . . . . . . . . . . . . . . . . . 59
Table 2.2 Relationships between width and cross-sectional area at the
midway point along the leaves (n=l l) of low (LS ) and high
(HS) leaf shear breaking load perennial rye grass selections . . . . . . . . . . . . . . 60
xvii
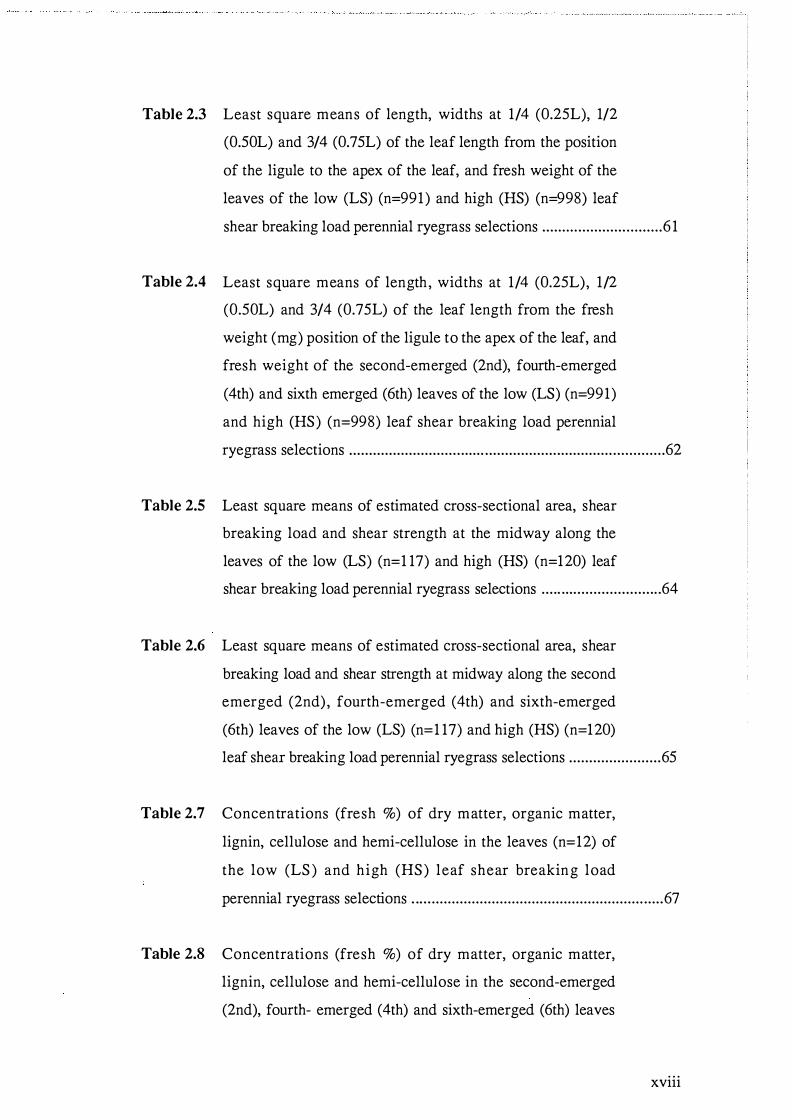
Table 2.3 Least square means of length, widths at 1/4 (0.25L), 1/2
(0.50L) and 3/4 (0.75L) of the leaf length from the position
of the ligule to the apex of the leaf, and fresh weight of the
leaves of the low (LS) (n=991 ) and high (HS) (n=998) leaf
shear breaking load perennial ryegrass selections . . . . . . . . . . . . . . . . . . . . . . . . . . . . . . 6 1
Table 2.4 Least square means of length , widths at 1/4 (0.25L), 1/2
(0.50L) and 3/4 (0.75L) of the leaf length from the fresh
weight (m g) position of the ligule to the apex of the leaf, and
fresh weight of the second-emerged (2nd), fourth-emerged
(4th) and sixth emerged (6th) leaves of the low (LS) (n=991)
and high (HS) (n=998) leaf shear breaking load perennial
rye grass selections . . . . . . . . . . . . . . . . . . . . . . . . . . . . . . . . . . . . . . . . . . . . . . . . . . . . . . . . . . . . . . . . . . . . . . . . . . . . . . . 62
Table 2.5 Least square means of estimated cross-sectional area, shear
breaking load and shear strength at the midway along the
leaves of the low (LS) (n=1 17) and high (HS) (n=120) leaf
shear breaking load perennial ryegrass selections . . . .. . . . . . . . . . . . . . . . . . . . . . . .. . 64
Table 2.6 Least square means of estimated cross-sectional area, shear
breaking load and shear strength at midway along the second
emerged (2nd) , fourth-emerged (4th) and sixth-emerged
(6th) leaves of the low (LS) (n=1 17) and high (HS) (n=120)
leaf shear breaking load perennial rye grass selections . . . . . . . . . . . . . . . . . . . . . . . 65
Table 2.7 Concentrations (fresh %) of dry matter, organic matter,
lignin, cellulose and hemi-cellulose in the leaves (n=12) of
the low (LS ) and high (HS) leaf shear breaking load
perennial ryegrass selections . .. . . . . . . . . . . . . . . . . . . . . . . . . . . . . . . . . . . . . . . . . . . . . . . . . . . . . . . . . . . . . 67
Table 2.8 Concentrations (fresh %) of dry matter, organic matter,
lignin, cellulose and hemi-cellulose in the second-emerged
(2nd), fourth- emerged (4th) and sixth-emerged (6th) leaves
xviii

(n=1 2) of the low (LS) and high (HS) leaf shear breaking
load perennial rye grass selections . . . . . . . . . . . . . . . . . . . . . . . . .. . . . . . . . . . . . . . . . . . . . . . . . . . . . . . 68
Table 2.9 Concentrations (fresh %) of dry matter, organic matter,
lignin, cellulose and hemi-cellulose in the second-emerged
(2nd), fourth- emerged (4th) and sixth-emerged (6th) leaves
(n=1 2) of the low (LS) and high (HS) leaf shear breaking
load perennial ryegrass selections at maturation (M OO) and
at 10 days after the maturation . . . . . .. . . . . .. . . . . . . . . . . . . . . . . . . . . . . . . . . . . . . . . . . . . . . . . . . . . . . . 69
Table 2.10 Length :dry weight ratio, and index of masticatory load
(IML) of the leaves of the low (LS ) (n= 1 1 7) and high
(n= 1 20 ) leaf shear breaking load perennial rye grass
selections . . . . . . . . . . . . . . . . . . . . . . . . . . . . . . . . . . . . . . . . . . . . . . . . . . . . . . . . . . . . . . . . . . . . . . . . . . . . . . . . . . . . . . . . . . . . . 76
Table 3.1 Means of morphology, shear breaking load, index of
masticatory load (IML), in vitro dry matter digestibility
(IVDMD) and concentration of total nitrogen (N) of the
leaves of the low (LS) and high (HS) leaf shear breaking
load perennial rye grass selections . . . . . . . . . . . . . . . . . . . . . . . . . . . . . . . . . . . . . . . . . . . . . . . . . . . . . . . 86
Table 3.2 Masticatory behaviour and index of efficiency of chewing
( <C.EAT>) in wethers (n=8) during eating the low (LS) and
high (HS) shear breaking load perennial ryegrass for a
period of 30 minutes . . . . . . . . . . . . . . . . . . . . . . . . . . . . . . . . . . . . . . . . . . . . . . . . . . . . . . . . . . . . . . . . . . . . . . . . . . . 88
Table 3.3 Rumen pool sizes at 10:30 and 17 :30 hours and rate of dry
matter disappearance in the wethers (n=8) ruminating low
(LS) and high (HS) leaf shear breaking load perennial
ryegras s and their in vitro dry m atter diges tibilities
(IVDMD) and concentrations of total nitrogen (N) . . . . . . . . . . . . . . . . .. . . . . . . . . . . 92
XIX

Table 3.4 Masticatory behaviour and index of efficiency of chewing
(<C.RUM>) in wethers (n=8) during ruminating the low
(LS) and high (HS) shear breaking load perennial ryegrass
for a period of 7 hours . . . . . . . . . . . . . . . . . . . . . . . . . . . . . . . . . . . . . . . . . . . . . . . . . . . . . . . . . . . . . . . . . . . . . . . . . 94
Table 4.1 Means of morphology, shear breaking load and index of
masticatory load (IML) of the leaves of the low (LS) and
high (HS ) leaf shear breaking load perennial ryegrass
selections . . . . . . . . . . . . . . . . . . . . . . . . . . . . . . . . . . . . . . . . . . . . . . . . . . . . . . . . . . . . . . . . . . . . . . . . . . . . . . . . . . . . . . . . . . . 1 08
Table 4.2 Concentrations of dry matter, organic matter , total nitrogen
and cell-wall constituents of the low (LS) and high (HS) leaf
shear breaking load perennial ryegras s offered to the
animals . . . . . . . . . . . . . . . . . . . . . . . . . . . . . . . . . . . . . . . . . . . . . . . . . . . . . . . . . . . . . . . . . . . . . . . . . . . . . . . . . . . . . . . . . . . . . . 1 09
Table 4.3 Total and dry matter rumen pool sizes in wethers (n=8) fed
on the low (LS ) and high (HS ) leaf shear breaking load
perennial ryegrass selections . . . . . . . . . . . . . . . . . . . . . . . . . . . . . . . . . . . . . . . . . . . . . . . . . . . . . . . . . . . . . 1 12
Table 4.4 Rumen digesta fractional outflow rates (FOR) and rumen
digesta mean retention times (MRT) for liquid-phase and
particulate-phase in wethers (n=8) fed on the low (LS) and
high (HS ) leaf shear breaking load perennial ryegrass
selections . . . . . . . . . . . . . . . . . . . . . . . . . . . . . . . . . . . . . . . . . . . . .. . . . . . . . . . . . . . . . . . . . . . . . . . . . . . . . . . . .. . . . . . . . . . 1 13
Table 4.5 Apparent digestibilities (%) of dry matter, organic matter,
total nitrogen and cell-wall constituents in wethers (n=8) fed
on the low (LS ) and high (HS) leaf shear breaking load
perennial ryegrass selections . . . . . . . . . . . . . . . . . . . .. .. . . . . . . . . . . . . . . . . . . . . . . . . . . . . . . . . . . . . . . 1 15
Table 4.6 Concentrations and proportions of volatile fatty acids (VFA)
and concentration of NH3-N . in the rumen fluid in
wethers (n=8) fed on the low (LS) and high (HS) leaf shear
XX
breaking load perennial rye grass selections . . . . . .. . . . . . . . . . . . . . . . . . . . . .. . . . . . . . . . 1 16
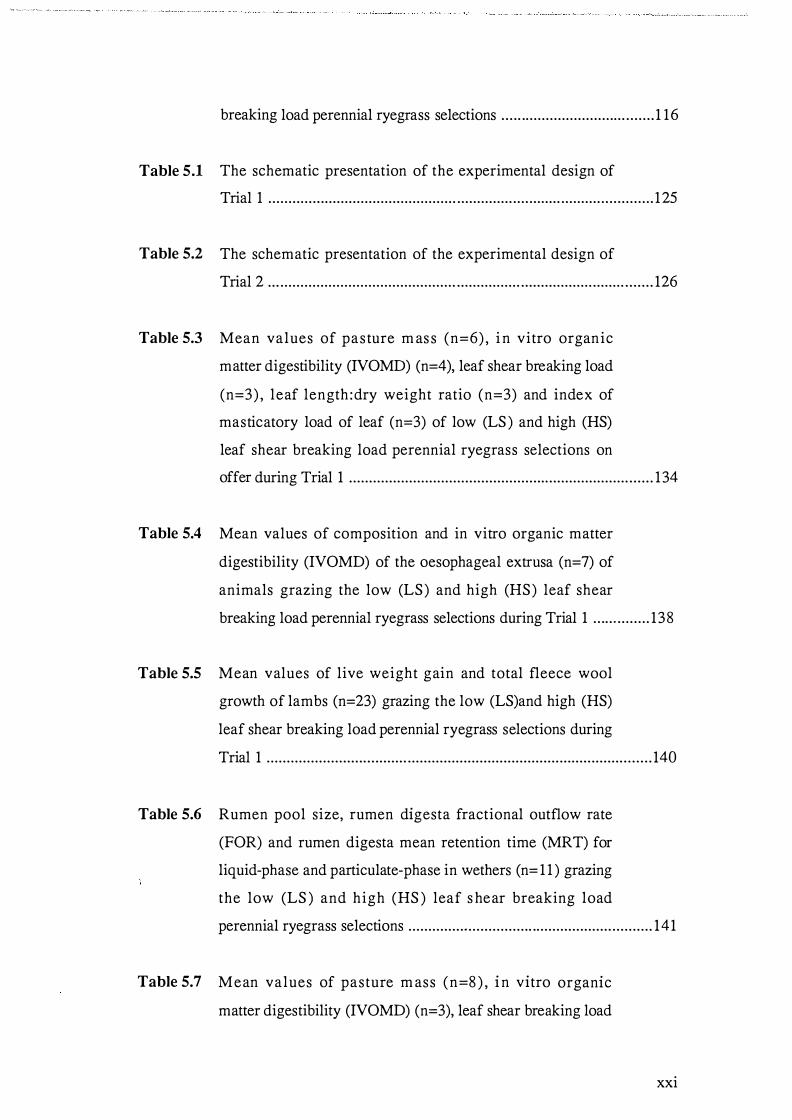
Table 5.1 The schematic presentation of the experimental design of
Trial 1 . . . . . . . . . . . . . . . . . . . . . . . . . . . . . . . . . . . . . . . . . . . . . . . . . . . . . . . . . . . . . . . . . . . . . . . . . . . . . . . . . . . . . . . . . . . . . . . . 125
Table 5.2 The schematic presentation of the experimental design of
Trial 2 . . . . . . . . . . . . . . . . . . . . . . . . . . . . . . . . . . . . . . . . . . . . . . . . . . . . . . . . . . . . . . . . . . . . . . . . . . . . . . . . . . . . . . . . . . . . . . . . 126
Table 5.3 Mean values of pasture m as s (n=6) , i n vitro organic
matter digestibility (IVOMD) (n=4), leaf shear breaking load
(n=3) , leaf length :dry weight ratio (n=3) and index of
masticatory load of leaf (n=3) of low (LS ) and high (HS)
leaf shear breaking load perennial ryegrass selections on
offer during Trial 1 . . . . . . . . . . . . . . . . . . . . . . . . . . . . . . . . . . . . . . . . . . . . . . . . . . . . . . . . . . . . . . . . . . . . . . . . . . . . 134
Table 5.4 Mean values of composition and in vitro organic matter
digestibility (IVOMD) of the oesophageal extrusa (n=7) of
animals grazing the low (LS) and high (HS) leaf shear
breaking load perennial ryegrass selections during Trial 1 . . .. . .. . . . . . . . 138
Table 5.5 Mean values of live weight gain and total fleece wool
growth of lambs (n=23) grazing the low (LS)and high (HS)
leaf shear breaking load perennial rye grass selections during
Trial 1 . . . . . . . . . . . . . . . . . . . . . . . . . . . . . . . . . . . . . . . . . . . . . . . . . . . . . . . . . . . . . . . . . . . . . . . . . . . . . . . . . . . . . . . . . . . . . . . . 140
Table 5.6 Rumen pool size, rumen d igesta fractional outflow rate
(FOR) and rumen digesta mean retention time (MRT) for
liquid-phase and particulate-phase in wethers (n= 1 1 ) grazing
the low (LS ) and high (HS ) leaf s hear breaking load
perennial ryegrass selections . . . . . . . . . . . . . . .. . . . . . . . . . . . . . .. .. . . . . . . . . . . . . . . . . . . . . . . . . . . . . 141
Table 5.7 Mean values of pasture m ass (n=8 ) , in v itro organ ic
matter digestibility (IVOMD) (n=3), leaf shear breaking load
xxi

(n=3) , leaf length :dry weight ratio (n=3) and index of
masticatory load of leaf (n=3) of the low (LS) and high (HS)
leaf shear breaking load perennial ryegrass selections on
offer during Tria 12 ........................................................................ .... 147
Table 5.8 Mean values of composition and in vitro organic matter
digestibility (IVOMD) of the oesophageal extrusa (n=4) of
the animals grazing the low (LS) and high (HS) leaf shear
breaking load perennial ryegrass selections during Trial 2 .............. 149
Table 5.9 Mean values of live weight gain and voluntary organic
matter intake (VOMI) of ewe-hoggets grazing the low (LS)
and high (HS) leaf shear breaking load perennial ryegrass
selections during Trial 2 .................................................................... 15 1
Table 5.10 Rumen pool size, rumen digesta fractional outflow rate
(FOR) and rumen digesta mean retention time (MRT) for
liquid-phase , and particulate-phase in wethers (n=8) grazing
the low (LS ) and high (HS) leaf shear breaking load
perennial ryegrass selections ............................................................. 153
Table 5.11 Voluntary organic m atter intake (VOMI) e s timated
based the Cr faecal marker and Ru-Co dual-phase ruminal
marker of wethers (n=8) grazing the low (LS) and high (HS)
leaf shear breaking load perennial ryegrass selections ..................... 154
Table 5.12 Feeding value in live weight gain (L WG) and leaf shear
breaking load (LSBL) for low (LS) and high (HS) perennial
ryegrass selections in previous studies and in the present
study .............................................................................. .................... 157
Table 6.1 Leaf shear breaking load (LSBL) , index of masticatory
load (IML) of leaf and leaf length-width ratio (L WR) of the
xxii

low leaf shear breaking load perennial ryegrass selection
expressed relative to the high leaf shear breaking load
p erennial ryegras s selection (as 1 00) in the present
investigation ...................................................................................... 1 63
Table 6.2 Summary of effect of the reduced leaf shear breaking load
(LSBL) in perennial ryegrass on masticatory behaviour
during eating in sheep ....................................................................... 164
Table 6.3 Summary of effect of reduced leaf shear breaking load
(LSBL) on rumen pool sizes, fractional outflow rates (FOR),
voluntary organic matter intake (VOMI) and feeding values
in sheep ............................................................................................. 165
XXlll

List of Figures
Figure 1.1 The relationship of pasture intake to various pas ture
characteristics and methods of pasture allocation (Poppi et
Page
al., 1987) . . . . . . . . . . . . . . . . . . . . . . . . . . . . . . . . . . . . . . . . . . . . . . . . . . . . . . . . . . . . . . . . . . . . . . . . . . . . . . . . . . .. . . . . . . . . . 12
Figure 1.2 The influence of sward height on the components of
ingestive behaviour (Penning, 1985) . . . . . . . . . . . . . . . . . . . . . . . . . . . . . . . . . . . . . . . . . . . . . . . . . . 14
Figure 1.3 The influence of pasture mass on the liveweight gain of
ewes offered pasture at various levels of pasture allowance
(Rattray et al., 1 984) . . . . . . . . . . . . . . . . . . . . . . . . . . . . . . . . . . . . . . . . . . . . . . . . . . . . . . . . . . . . . . . . . . . . . . . . . . . 15
Figure 1.4 Relationship between the voluntary intake of digestible
organic matter (DOMI) and the apparent retention time of
organic matter in the rumen (RTOM) for temperate (from
Ulyatt, 1 97 1 ) and tropical pasture species (Thornton et al.,
1 973) . . . . . . . . . . . . . . . . . . . . . . . . . . . .. . . . . . . . . . . . . . . . . . . . . . . . . . . . . . . . . . . . . . . . . . . . . . . . . . . . . . . . . . . . . . . . . . . . . . . 18
Figure 1.5 Young plant of perennial ryegrass (x 1 .75 Soper et al. ,
1956) . . . . . . . . . . . . . . . . . . . . . . . . . . . . . . . . . . . . . . . . . . . . . . . . . . . . . . . . . . . . . . . . . . . . . . . . . . . . . . . . . . . . . . . . . . . . . . . . . . . 25
Figure 1.6 Transections of the blade of the mature leaf of perennial
ryegrass (after Soper et al. , 1956) . . . .. . . .. . . . . . . . . . . . . . . . . . . . . . . . . . . . . . . . . . . . . .. . . . . . . . . 27
Figure 1.7 Types of force to apply to the material . .. . . . . .. . . . . . . . . . . . . . . . . . . .. . . . . . . . . . . . . . . . . . . 29 I
Figure 1.8 Hooke ' s e las tic i ty in ( a) tension , (b) s hear and (c)
compression . . . . . . . . . . . . . . . . . . . . . . . . . .. . . . . . . . . . . . . . . . . . . . . . . . . . . . . . . . . . . . . . . . . . . . . . . . . . . .. .. . . . . . . . 30
Figure 1.9 Masticatory musculature of sheep (Turnbull, 1 970) . . . . . . . . . . . . . . . . . . . . . . .... .36
xxiv

Figure 1.10 The movements of the lower jaw in a "typical" chewing
cycle in goat, in opossum and in cat (adapted from Hiiemae,
1 978) ................................................................................................... 38
Figure 1.11 Relation ship of feed m aterial in lateral m asticatory
movements of opposing occlusal surfaces .......................................... 39
Figure 2.1 Schematic representation of the plant and leaf a l location for the
controlled atmosphere trial ......................................................................... 50
Figure 3.1 Decline of mean chewing rate of the wethers (n=8) during
eating the low (LS ) and high (HS ) shear breaking load
perennial rye grass selections over a period of 30 minutes ................. 89
Figure 3.2 Particle size distributions in the rumen contents recovered
from the wethers (n=8) immediately after ingesting the low
(LS ) and high (HS) leaf shear breaking load perennial
rye grass selections ................................ ............................................... 9 1
Figure 3.3 Particle size distributions in the rumen contents recovered at
10 :30 and 17 :30 hours from the wethers (n=8) ruminating
the low (LS) and high (HS ) leaf shear breaking load
perennial ryegrass selections ........................................................... . ... 95
Figure 3.4 A model of a relationship between efficiency of particle
breakdown and index of masticatory load (IML) of perennial
ryegrass ............................................................................................... 99
Figure 4.1 Particle size distributions in rumen contents in wethers
(n=8) fed on the low (LS) and high (HS) leaf shear breaking
load perennial rye grass selections ..................................................... 1 14
Figure 5.1 Changes in p asture mas s and in vitro organic m atter
digestibility (IVOMD) of the low (LS) and high (HS) leaf
XXV

shear breaking load perennial ryegrass selections during
Trial 1 ................................................................................................ 1 3 1
Figure 5.2 Changes in leaf shear breaking load (LSBL) and leaf
length:dry weight ratio (L WR) of low (LS) and high (HS)
leaf shear breaking load perennial ryegrass selections during
Trial 1 . . . . . . . . . . . . . . . . . . . . . . . . . . . . . . . . . . . . . . . . . . . . . . . .. . . . . . . . . . . . . . . . . . . . . . . . . . . . . . . . . . . . . . . . . . . . . . . . 1 32
Figure 5.3 Changes in index of masticatory load (IML) of low (LS) and
high (HS ) leaf shear breaking load perennial ryegrass
selections during Trial 1 . . . . . . . . . . . . . . . . . . . . . . . . . . . . . . . . . . . . . . . . . . . . . . . . . . . . . . . . . . . . . . . . . . . . 133
Figure 5.4 Changes in composition and in vitro organic m atter
digestibility (IVOMD) of the oesophageal extrusa of the
animals grazing the low (LS) and high (HS) leaf shear
breaking load perennial rye grass selections during Trial 1 . . . . . . . . . . . . . . 1 37
Figure 5.5 Changes in live weight of the lambs (n=23) grazing the low
(LS ) and high (HS) leaf shear breaking load perennial
ryegrass selections during Trial 1 . . . . . . . . . . . . . . . . . . . . . . . . . . . . . . . . . . . . . . . . . . . . . . . . . . . . . 1 39
Figure 5.6 Particle size distribution of rumen contents of wethers
(n= 1 1 ) grazing the low (LS ) and high (HS) leaf shear
breaking load perennial ryegrass selections . . . . . . . . . . . . . . . . . . . . . . . . . . . . . . . . . . . . . . 142
Figure 5.7 Changes in pasture mass and in vitro organic m atter
digestibility (IVOMD) of the low (LS) and high (HS) leaf
shear breaking load perennial ryegrass selections during
Trial 2 . . . . . . . . . . . . . . . . . . . . . . . . . . . . . . . . . . . . . . . . . . . . . . . . . . . . . . . . . . . . . . . . . .. . . . . . . . . . . . . . . . . . . . . . . . . . . . . . 144
Figure 5.8 Changes in leaf s hear breaking load (LSBL) and leaf
length:dry weight ratio (L WR) of the low (LS) and high
(HS) leaf shear breaking load perennial ryegrass selections
xxvi

during Trial 2 .................................................................................... 145
Figure 5.9 Changes in index of masticatory load (IML) of the low (LS)
and high (HS) leaf shear breaking load perennial ryegrass
selections during Trial 2 . . . . . . . . . . . . . . . . . . . . . . . . . . . . . . . . . . . . . . . . . . . . . . .. . . . . . . . . . . . . . . . . . . . . 146
Figure 5.10 Changes in c omposition and in vitro organic matter
digestibility (IVOMD) of the oesophageal extrusa of the
animals grazing the low (LS ) and high (HS) leaf shear
breaking load perennial ryegrass selections during Trial 2 . . . . . . . . . . . . . . 148
Figure 5. 11 Changes in live weight, 24-hour fasted weight and voluntary
organic matter intake (VOMI) of the ewe-hoggets grazing
the low (LS ) and high (HS) leaf shear breaking load
perennial ryegrass selections during Trial 2 . . . . . . . . . . . . . . . . . . . . . . . . . . . . . . . . . . . . . 1 50
Figure 5.12 Particle size distribution of rumen contents of wethers (n=8)
grazing the low (LS) and high (HS) leaf shear breaking load
perennial ryegrass selections . . . . . . . . . . . . . . . . . . . . . . . . . . . . . . . . . . . . . . . . . . . . . . . . . . . . . . . . . . . . . 155
Figure 6.1 Changes in leaf shear breaking load (LSBL) of low leaf
shear breaking load (LS) and high leaf shear breaking load
(HS) perennial ryegrass selections in the field during a year
(April 1989 - March 1990) . . . . . . . . . . . . . . . . . . . . . . . . . . . . . . . . . . . . . . . . . . . . . . . . . . . . . . . . . . . . . . . . 161
xxvii

General
ADF
CAC
<C.EAT>
Co
Co(lll)-EDT A
Cr
<C.RUM>
Cr203
Cr-EDTA
CSA
d
DM
DOMI
DSIR
ep
EPM
Fig.
FOR
FV
GLM
HS
IML
IVDMD
IVOMD
L.
List of Abbreviations
acid detergent fibre
controlled atmosphere cabinet
efficiency of chewing during eating in reducing particles to
< l .O mm
cobalt
cobalt ethylenediaminetetraacetic acid
chromium
efficiency of chewing during rumination in reducing
particles to < 1 .0 mm
chromium sesquioxide
chromium ethylenediaminetetraacetic acid
cross-sectional area
day
dry matter
voluntary intake of digestible organic matter
Department of Scientific and Industrial Research
epidermis
Ellinbank pasture meter
figure
fractional outflow rate
feeding value
general linear model
high leaf shear breaking load
index of masticatory load
in vitro dry matter digestibility
in vitro organic matter digestibility
Linnaeus
xxviii
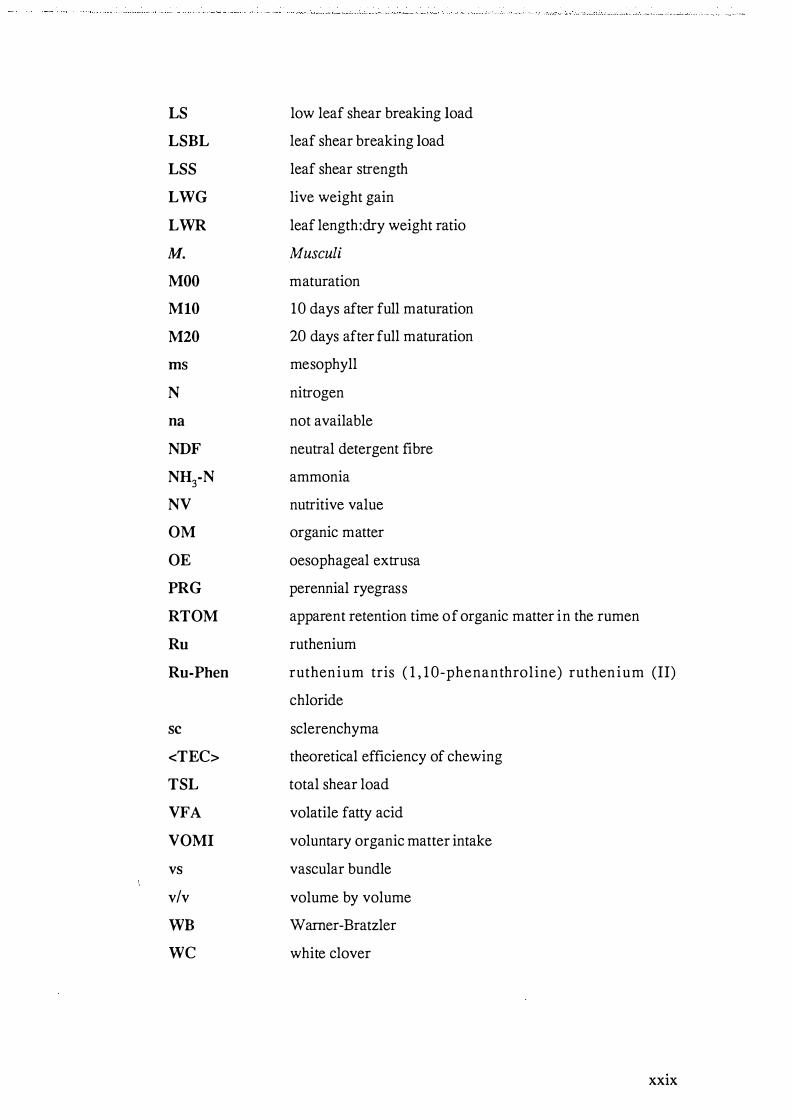
LS
LSBL
LSS
LWG
LWR
M.
MOO
MlO
M20
ms
N
na
NDF
NH3-N
NV
OM
OE
PRG
RTOM
Ru
Ru-Phen
se
<TEC>
TSL
VFA
VOMI
vs
v/v
WB
WC
low leaf shear breaking load
leaf shear breaking load
leaf shear strength
live weight gain
leaf length:dry weight ratio
Musculi
maturation
10 days after full maturation
20 days after full maturation
mesophyll
nitrogen
not available
neutral detergent fibre
ammonia
nutritive value
organic matter
oesophageal extrusa
perennial ryegrass
apparent retention time of organic matter in the rumen
ruthenium
ruthenium tris ( 1 , 1 0-phenanthroline) ruthenium (II)
chloride
sclerenchyma
theoretical efficiency of chewing
total shear load
volatile fatty acid
voluntary organic matter intake
vascular bundle
volume by volume
Warner-Bratzler
white clover
XXIX

Units
a are
c centi-
eo degree centigrade
g gram
G Newtonian constant of gravitation
h hecto-
hr hour
in inch
J joule
k kilo-
litre
m milli-
m metre
M mega-
M mole
� micro-
min. minute
% per cent
w watt
Statistical
df degrees of freedom
n number of observations
r correlation
RSE root square of error
s.e. standard error
S.E.D. standard error of difference
ns not significant * significant at p<0.05
XXX

**
***
I
significant at p<O.Ol
significant at p<O.OOl
i n d i c a t i n g rang e s o f s t a ndard e rror i n fi gure s
XXXI

Introduction
In New Zealand, pasture is the source of most of the nutrients consumed by grazing
l ivestock, and perennial ryegras s (Lolium perenne L. ) i s the most widely
established pasture grass. Although the application of agronomic knowledge and
the continuous efforts of plant breeders have achieved high levels of pasture
productivity and adaptability, the efficiency of conversion of perennial ryegrass to
animal products is quite low in comparison with other temperate forages.
Feeding value is a parameter used to quantify the 'efficiency of animal production'
and is described by the formula :
Feeding value = Intake x Nutritive Value.
Over the years, plant breeders have concentrated more on improving 'nutritive
value ' , but other attributes which may improve 'intake ' have been almost
neglected.
Recently, our understanding of ruminant nutrition has increased to the stage where
the constraints on voluntary feed intake can be identified. Digesta passage from
the rumen is of great importance in determining feed intake. The faster the rate of
passage, the faster the digesta load is reduced, and the greater the amount the
animal is able to consume. The rate of clearance depends on two roles of the
rumen, particle breakdown and actual passage from the rumen. Mastication
contributes most effectively to particle breakdown, and hence to passage from the
rumen.
These facts have led to a new concept amongst plant breeders -reducing physical
resistance of the grass against breakdown when the plant is masticated. Leaf shear
breaking load has been chosen as a parameter of the resistance to breakdown, and
two types of perennial ryegrass have been selected by the DSIR ' s Grassland
1

Division for either low leaf shear breaking load or high leaf shear breaking load.
This thesis investigates whether reduced leaf shear breaking load in perennial
ryegrass demonstrates advantages in feeding value.
2

Chapter One
A REVIEW OF FACTORS LIMITING THE FEEDING VALUE
OF PERENNIAL RYEGRASS
1.1 Introduction
This chapter, based on previously published studies, describes the current status of
and factors limiting the feeding value (FV) of perennial rye grass (PRG) in New
Zealand pastoral agriculture. Numerous studies examining the factors limiting the
FV of PRG led plant breeders to a new concept - reducing physical resistance to
breakdown by mastication. Using this new concept, attempts to improve FV of
PRG are also reviewed and the hypotheses for the present investigations are
developed in this chapter.
1.2 The role of perennial ryegrass in the New Zealand pasture
1 .2. 1 Agronomic characteristics of perennial rye grass
PRG is the most widely used pasture grass in New Zealand. Approximately 69 %
of grass seed dressed in New Zealand i s PRG (New Zealand Department of
S tatistics, 1 983).
The advantages of PRG in New Zealand pasture, e.g. ease of establishment and the
ability to support grazing animals over a wide range of climatic conditions, the
ability to with stand poor soil fertility, and good winter growth etc. are well
recognized.
White clover (WC) is usually sown together with PRG to improve overall pasture
quality, to fix atmospheric nitrogen and return this to the soil for subsequent
3

utilization by the PRG. Normally, New Zealand PRG pastures contain PRG:WC in
the approximate ratio of 80:20.
The suitability of PRG to the range of New Zealand farm ecosystems, and further
improvement, is being continually assessed amongst other grasses by the Plant
Breeding section of DSIR Grasslands Divis ion. Recently, the role of PRG in
certain grazing situations has been challenged by the introduction of new pasture
grass cultivars, such as an improved prairie grass (Bromus catharticus) -
Grasslands Matua, and also Grasslands Roa, an improved tall fescue (F estuca
arundinacea) variety, which are more tolerant to the wide range of agronomic
conditions found in New Zealand. Recent studies show an association between the
fungal endophyte that infects PRG and the neurotoxic disorder ryegrass staggers
(Fletcher et al. , 198 1 ; Fletcher, 1982, 1986). Also, presence of the endophyte in
PRG has been associated with increased resistance of the plant to attack by
Argentine stem weevil (Listronotus bonariensis) (Prestidge et al., 1 982).
In spite of the fact that the extensive use of PRG in New Zealand pastures is being
reconsidered with regard to new species, it will remain an integral part of the
grassland system for sometime because of its wide adaptability and relatively high
productivity.
1 .2.2 Animal production response to perennial ryegrass
1 .2.2. 1 Definition of feeding value
The ultimate criterion of pasture quality under New Zealand conditions must be the
productivity of the grazing ruminant. Numerous methods of forage evaluation
have been devised (Raymond, 1 969). However, the preferred method for a grazing
ecosystem i s to measure animal production while the pasture i s being grazed.
Under these conditions , it i s important that intake is not limited by herbage
availability.
4
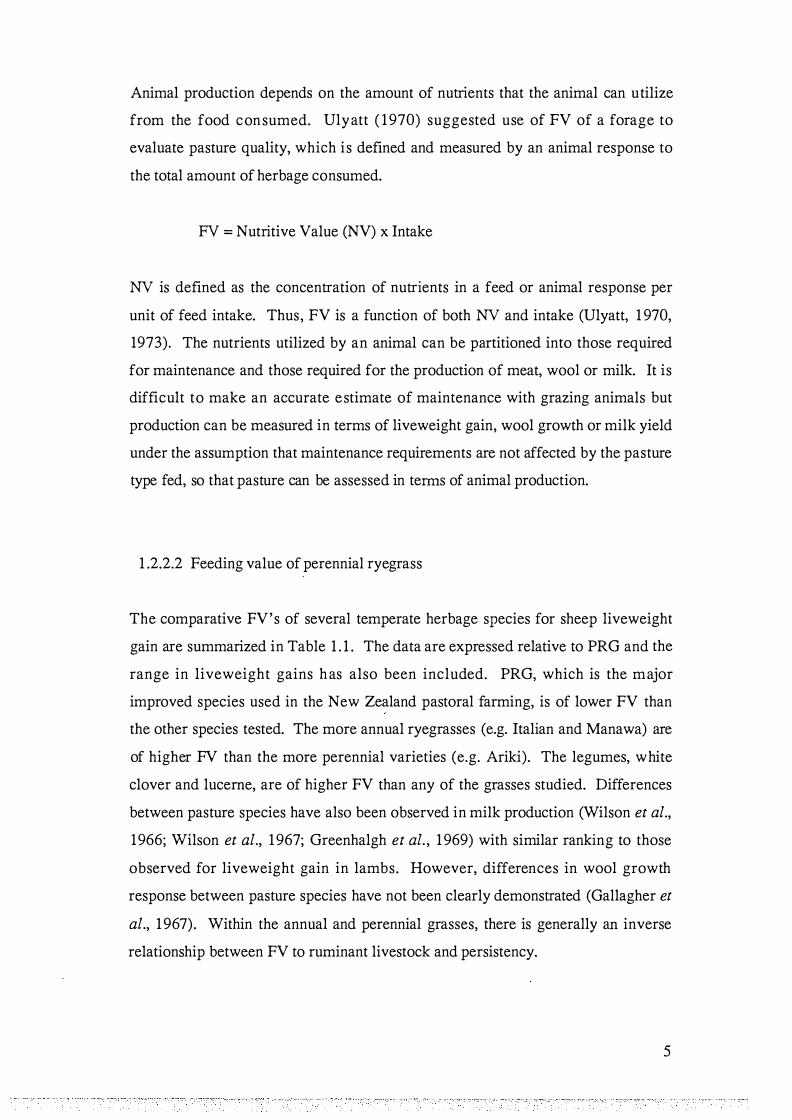
Animal production depends on the amount of nutrients that the animal can utilize
from the food consumed. Ulyatt ( 1 970) suggested use of FV of a forage to
evaluate pasture quality, which is defined and measured by an animal response to
the total amount of herbage consumed.
FV = Nutritive Value (NV) x Intake
NV is defined as the concentration of nutrients in a feed or animal response per
unit of feed intake. Thus, FV is a function of both NV and intake (Ulyatt, 1 970,
1973). The nutrients utilized by an animal can be partitioned into those required
for maintenance and those required for the production of meat, wool or milk. It is
difficult to make an accurate estimate of maintenance with grazing animals but
production can be measured in terms of liveweight gain, wool growth or milk yield
under the assumption that maintenance requirements are not affected by the pasture
type fed, so that pasture can be assessed in terms of animal production.
1 .2.2.2 Feeding value of perennial rye grass
The comparative FV's of several temperate herbage species for sheep liveweight
gain are summarized in Table 1 . 1 . The data are expressed relative to PRG and the
range in liveweight gains has also been included. PRG, which is the major
improved species used in the New Zealand pastoral farming, is of lower FV than
the other species tested. The more annual rye grasses (e.g. Italian and Manawa) are
of higher FV than the more perennial varieties (e.g. Ariki). The legumes, white
clover and lucerne, are of higher FV than any of the grasses studied. Differences
between pasture species have also been observed in milk production (Wilson et al.,
1966; Wilson et al., 1 967; Greenhalgh et al. , 1 969) with similar ranking to those
observed for liveweight gain in lambs. However, differences in wool growth
response between pasture species have not been clearly demonstrated (Gallagher et
al., 1 967). Within the annual and perennial grasses, there is generally an inverse
relationship between FV to ruminant livestock and persistency.
5

Table 1 .1 The relative feeding value of New Zealand pasture species
under grazing conditions for young sheep (Uiyatt, 1 970).
Perennial ryegrass 1 Manawa ryegrass2
Ariki ryegrass3
Italian ryegrass4
Timothy
White clover
Lucerne
1 : L. perenne.
2: L. perenne x L. multiflorum.
No.of experiments
1 2
1 1
2
1
5
7
5
3: L. perenne x (L. perenne x L. multiflorum).
4: L. multiflorum.
Relative liveweight
gain
1 00
1 48
1 1 1
1 60
1 29
1 86
1 70
Range i n liveweight
gain (g/day)
23 - 227
45 - 270
86 - 1 50
1 41
1 27 - 1 68
1 68 - 331
1 54 - 29 1
6

1 .2. 3 Conclusion
PRO is the most important resource of nutrients for ruminant livestock in New
Zealand. Plant breeders have largely concentrated on improving PRG in
agronomic factors. However, PRO has the lowest FV amongst temperate forages
in New Zealand. Little attention has been paid by plant breeders to · the
efficiency of conversion of PRO to animal production. Large differences in FV
exist among herbage species and there must be a considerable potential for
improvement for PRO in FV.
1.3 Factors limiting the feeding value of perennial ryegrass
1 .3 . 1 Factors limiting nutritive value of perennial ryegrass
Many variables can influence NV. Ulyatt ( 1 973) suggests two major factors
contributing to NV are ;
( 1) apparent digestibility,
(2) the efficiency with which digested nutrients are converted into
products within the animal tissues.
1 .3 . 1 . 1 Apparent digestibility of perennial ryegrass
The factors that affect the apparent digestibility of temperate pasture species have
been examined in great detail (Raymond, 1969). Apparent digestibility is clearly
related to herbage maturity and there is a general pattern for all species; a high
apparent digestibility i s maintained in the spring and this declines as the plant
matures over the summer. These changes in apparent digestibility with maturity
can be explained in terms of changes in plant structure and chemical composition
(Table 1 .2). As a plant matures, the proportion of stem increases, the proportions
7

Table 1 .2 Composit ion , decl ine in apparent in vivo d igestibil ity and
ut i l i sat i o n o f meta b o l i sab le e nergy ( M E) of d ried S23 perenn ia l
ryeg rass h arvested at 4 stages of matu r i ty and fed to sheep at
maintenance level of intake (adapted from Waghorn et al. , 1 987).
Young Late Head Seed Decline in leafy leafy emergence setting digestibi lity (%)
Composition (% DM) :
Water soluble sugars 1 4 1 2 1 1 1 0 1 00-1 00
Cellulose 21 22 24 27 92- 73
Hemi-ce llulose 1 6 1 9 1 9 26 93- 56
Lignin 3 4 4 7 23- 0
Ash 8 8 7 6 64- 52
Lipid 9 8 7 5 65- 43
Cell wall 1 40 45 47 60
Digestibility of DM (%) 86 83 79 62
M El gross energy (%) 66 61 62 52
Efficiency of M E utilisation for:
Maintenance (%) 78 76 75 74
Growth (%) 53 54 47 34
1 : Cellulose, hemi-cellulose plus lignin.
8

of slowly digested and indigestible chemical constituents (cellulose, hemi-cellulose
and lignin) in the stem also increase, and as a result apparent digestibility declines.
Differences in apparent digestibility between and within species can be defined in
terms of differences in leaf to stem ratio and in chemical composition.
Plant breeders of temperate forage plants have selected to improve apparent dry
matter digestibility (Dennis et al. , 1 986), and these are considerably high (70 - 80
%) in their vegetative state. However, improved apparent dry matter digestibility
may not necessarily lead to improved animal performance because ruminants
utilize the major dietary nutrients with different efficiencies (Ulyatt, 1 973, 1980).
1 .3 . 1 .2 Efficiency of utilisation of perennial ryegrass
Of further importance is the site at which digestion takes place (Ulyatt, 198 1) . A
good example, the comparison between PRG and WC is shown in Table 1 .3 .
There are large differences between the species in live weight gain. There are also
differences in chemical composition between the species, indicated by the higher
ratio of structural to readily fermentable carbohydrate in PRG. However, there are
no significant differences in apparent digestibility. Apparent digestibility of a feed
only measures the total amount of nutrients digested and indicates nothing of the
processes of digestion or end products of digestion. Digestion in the rumen and
caecum is by microbial fermentation and while this process is beneficial, in that it
enables ruminants to digest structural carbohydrates, it occurs with a loss of
approximately 25 % of digestible energy as methane and heat (Ulyatt, 198 1) . The
results also emphasize the importance of a specific nutrient, - protein, rather than
just energy in influencing growth of animals , a physiological function which
requires a high amount of protein. The fermentation of protein in the rumen or
caecum causes loss of nitrogen as ammonia. When protein is digested in the small
intestine there is little loss and the animal benefits by the absorption of amino
acids.
9

Table 1 .3 Data o n the d igestion of Ruanui perenn ial ryegrass and
Huia white c lover by sheep (U iyatt, 1 981 ) .
Field experiments :
Liveweight gain (g/d)
OM intake (g/d)
Liveweight gain per 1 OOg digestible OM intake (g)
OM retention time in rumen (h)
Structu ral/readily fermentable carbohydrate in diet
I ndoor experiments :
OM intake (g/d)
OM digestibility (%) 1
OM digested in stomach (% OM intake)
Rumen VF A production (moles/d)
Nitrogen intake (g/d)
Nitrogen digested in stomach (% N intake)
Protein-N digested in small intestine (% N intake)
Protein-N digested in small intestine at field intakes (g/d)
Absorbed proteinNFA energy I (g/MJ)
1 : Apparent digestibility. OM: organic matter. VFA: volatile fatty acid
Perennial rye grass
227
1 086
26.0
1 0.4
1 .7
800
80.4
54.6
4.7
37.8
26.5
40.0
1 1 9
1 1 .7
White clover
331
1 243
32.6
6 .3
0 .8
800
8 1 . 6
53 .9
4.8
35.2
1 8 . 0
49.4
1 88
1 9.0
10

However, the main cause of the WC's higher nutritional efficiency is the faster
passage rate of WC due to the low ratio of s tructural to readily fermentable
carbohydrate. This resulted in more nitrogen in WC available for
small intestine.
digestion in
Ulyatt (198 1 ) suggested that the legume diets provide the animals ' tissues with a
higher ratio of absorbed protein to energy and that in case of PRG this can be
achieved if rumen retention time is reduced.
1 .3 . 1 .3 Conclusion
Nutritive value of PRG depends on its digestibility and its efficiency as a nutrient
source in animal metabolism. Apparent digestibility of PRG is considerably high
(70-80 %) in the vegetative stage. Nutrients supplied from PRG are les s
effectively used by animals mainly because of slow passage from the rumen and of
low absorption of protein relative to energy.
1 .3.2 Factors limiting intake of perennial ryegrass
When animals are grazing pasture, intake is determined by the opportunity for
animals to harvest pasture. When pasture is offered to an animal in increasing
quantities, intake increases curvilinearly (Fig. 1 . 1) . In the ascending part of the
curve (non-nutritional) , the ability of the animal to harvest pasture, is influenced by
non-nutritional factors such as pasture structure and the grazing behaviour of the
animal. At the plateau section of the curve ( nutritional) , nutritional factors such as
digestibility, feed retention time in the rumen and concentration of metabolic
products are important in controlling intake.
1 1

N UTRITIONAL
NON-NUTRITIONAL
Pasture mass (kgDM/ha) ,_ G reen pasture mass (kgDM/ha) Pasture height (cm) Post-g razing pastu re mass (kgDM/ha) Pastu re allowance (kgDM/head/day)
Fig u re 1 . 1 The re lat ionsh i p of pasture intake to var ious past u re
characteristics and methods of pasture al location (Pappi et al. , 1 987) .
12

1 .3.2. 1 Non-nutritional factors
1 .3.2. 1 . 1 Sward condition and prehending behaviour
Grazing animals generally select leaf in preference to stem and reject dead material
where possible (Barthram et al., 1984; Rattray et al., 1984; L'Huillier et al., 1 986).
In place of sheep ' s upper incisor teeth there is a thick pad of connective tissue
against which the chisel-like lower incisors close to grip each mouthful of herbage
and it is severed by a quick jerk of the head (Hodgson, 1990). Prehending intake
can be expressed as a physical process with the following components;
Intake = bite size (g!bite) x rate of biting (bites/min) x grazing time (hr).
Pasture sward height is a major factor affecting all these components and hence
intake (Fig. 1 .2) . Bite size has been shown to have the most influence on intake
and represents the major component of the non-nutritional constraint (Hodgson,
1 985 ) . Rate of biting changes in relation to sward structure, but is not as
responsive as bite size (Kenney et al. , 1984; Black et al., 1984) . Grazing time has
a large influence on intake. Animals can graze up to 12 - 13 hours a day when
pasture of an adequate herbage mass is presented.
Pasture mass is defined as the amount of pasture per unit area. Therefore, pasture
mass influences intake through both pasture height and/or pasture density, which
are components of pasture structure (Fig. 1 .3). Black et al. (1984) reported the rate
of intake by sheep grazing pasture increased with both the height and density of the
pasture and was best described by herbage mass per unit area effectively covered
by one bite.
13

Q) 15 150 --� 0 100 Ol E
� ::J 0 :r:
50
00
(a) 100
c:: 75 .E -- 50 Cl) 2 m 25
3 6 9 12 00 Sward height (cm)
(c)
�
3 6 9 12 ..
Sward height (cm)
(b)
~ 3 6 9 11
(d)
� 3 6 9 12
Fig u re 1 .2 The i nf l uen ce of swa rd h e i g ht o n the c ompo n en ts of
ingestive behaviour (Penn ing , 1 985) . (a) bite size (b) rate of b iting (c) grazing time (d) daily herbage intake.
14

-;:; C"O
"'0 --(!) $: (!)
--
9 .!: C"O Ol .E Ol ·a; $: (!) >
:::::i
240 Pre-grazing pasture mass (kg green DM/ha)
2 5 0 0
1 6 0 1 · 8
1 -4 8 0
1 ·0 0
0 · 6 - 8 0
Pasture allowance (kg green DM/ewe/day) ..
-;:; C"O � (!) $: (!)
--
::2 0 Ol 6 (!)
.::;: CO E (!) �
::::l (j) CO 0...
Figure 1 .3 The i nf luence of pasture mass on the l iveweight ga in of
ewes offered pasture at various levels of pasture a l lowance (Rattray et al. , 1 984) .
1 5

1 .3 .2.2 Nutritional factors
Nutritional constraints on intake occur when non-nutritional factors are not
restrained. Level of intake is regulated by the amount of pasture which can be
accommodated in the rumen and the rate at which it disappears by digestion and
passage.
The major limitation to intake of herbage has been generally considered to be
physical capacity of the rumen (Campling et al. , 1 9 6 1 ; Jones, e t al . , 1 972;
Thornton et al. , 1973). However, the final intake level achieved by an animal in
any particular physiological state is influenced by;
( 1 ) the nutrient supply (i.e. metabolic factors) ,
(2) the extent to which the animal is prepared to distend its rumen and the rate
of disappearance of digesta from the rumen (i.e. physical factors) (Weston
et al., 1 987; Cruickshank, 1986).
1 .3 .2.2. 1 Metabolic factors
Metabolic factors play a role in the regulation of intake of high quality pasture
(Thomson et al., 1985 ; Cruickshank et al. , 1 987). Metabolic factors are those
metabolites that influence intake and are generally associated with energy-yielding
substrates, such as VFAs, lipids, and amino acids. Intake regulation relates to the
amount of energy the animals can metabolize (Thompson et al. , 1990). Sheep
grazing legumes tend to have approximately 25 % lower rumen fill than sheep
grazing grasses despite similar or higher intakes (McLean et al. , 1 965; Ulyatt,
197 1) . This suggests that intake for the animals on legume pastures appears to be
regulated by both the nutrient supply, i.e. metabolic factors, and physical factors
(Weston et al. , 1987). Cruickshank (1986) considers that metabolic regulation of
intake is less important in sheep grazing grasses than in sheep grazing legumes .
16

1 .3 .2.2.2 Physical factors
The feed intake required to s atisfy total energy demand of grazing ruminants
commonly may not be reached because of limitations due to gastro-intestinal tract
capacity (Black, 1 990). Grovum ( 1987) considers capacity of the rumen and
reticulum and not the intestines or abomasum is the major limiting factor. Thus,
the amount of material that can accumulate in the rumen and its rate of
disappearance from the rumen affect voluntary feed intake.
From computer simulation studies B lack e t al. , ( 1 982) deduced that slow
degradation and outflow rates from the rumen were the major factors causing long
rumen retention time and reduced voluntary intake in sheep fed PRG, although rate
of digestion might contribute approximately 5 % of the difference in feed intake
between sheep eating WC and PRG.
Figure 1 .4 shows the relationship between the apparent retention time of digesta in
the rumen and voluntary intake. The rate at which particles reduce in size is a
major factor which influences overall retention time of material in the rumen.
Large particles have a low probability of leaving the rumen and must be therefore
broken down physically before they can pass out of the rumen (Ulyatt et al., 1 986;
Poppi et al. , 1 987).
1 .3 .2.3 Conclusion
Voluntary intake of animals is affected by non-nutritional factors and nutritional
factors. Non-nutritional factors depend substantially on grazing management. Of the
nutritional factors, metabolic factors appear to be less significant than physical
factors in the case of PRG. Slow degradation and hence long rumen retention
times of PRG are major factors reducing intake. Rate of passage of digesta out of
the rumen is influenced by the rate of breakdown of large feed particles to small
ones and their rate of outflow from the rumen.
17

1 200
1000
Tropical pasture
Temperate pasture L
400
200 ot����������-L����
5 6 7 8 9 1 0 1 1 1 2 1 3 1 4 1 5 1 6 1 7 1 8 1 9 20
RTOM (hr)
Figure 1 .4 Re lati o nsh i p between the vo luntary intake of d igestible
o rg a n i c matte r (DOMI ) a n d the apparent retention t ime of o rganic
m atte r i n the r umen ( RTOM) fo r temperate (fro m U lyatt , 1 971 ) and
tropical pasture species (Thornton et al. , 1 973).
18

1 .3.3 Digesta passage from the rumen
The swallowed boli of feed are delivered into the reticulo-rumen in which
approximately 60 % of organic matter digestion occurs (Ulyatt, 1983). Clearance
of feed residues from the reticulo-rumen depends on two interacting processes:
( 1 ) physical reduction in particle size plus microbial digestion,
(2) passage through the reticulo-omasal orifice.
1 .3 .3 . 1 Physical reduction in particle size and microbial digestion
Ingested herbage must be reduced to a critical particle size which is able to pass out
from reticulo-omasal orifice. For sheep this threshold particle size appears to be 1
- 2 mm and 2 - 4 mm for cattle (Poppi et al. , 1980; Ulyatt, 1983; Ulyatt et al.,
1986). This threshold appears to be well regulated and not influenced by a range
of dietary and physiologi9al variables.
Particle size reduction is achieved by three major processes:
( 1 ) chewing during eating,
(2) chewing during rumination,
(3) microbial attack in the rumen.
1 .3.3. 1 . 1 Chewing during eating
By chewing during eating, long forages are reduced to a size that c an be
incorporated into a bolus and swallowed, soluble nutrients are released for
fermentation and inner structures of forage material are exposed to enable effective
19

invasion of the reticulo-rumen microbes. Ulyatt et al. (1986) reported a relationship
between chewing behaviour and diet particle breakdown of sheep (Table 1 .4). The
chews/min is reasonably constant within species of forage. PRO resulted in a high
number of chews/g DM, a low rate of eating, and a high proportion of particulate
matter remained on a 4.0 m m sieve. Ulyatt ( 1 983) reported that, in s heep,
effectiveness of chewing during eating in reducing particles to < 1 . 0 m m
(<C.EAT>) varied from 46 - 53 % between three fresh herbages and a hay, whereas
John et al. (unpublished) have shown that <C.EAT> was 49. 1 , 40.9 and 46.0 % for
two fresh PRO cultivars and a tall fescue, respectively (Ulyatt, 1986).
1 .3.3. 1 .2 Chewing during rumination
Rumination serves two purposes; it reduces the particle size of refractory material,
and it damages regurgitated digesta to further expose internal plant structure for
microbial attack.
Table 1 .5 shows effect of chewing during rumination on particle breakdown. PRO
shows a high number of chews/gDM, longer rumination time/DM intake, and a
high proportion of particles larger than 1 mm in rumen contents. These are
similar results to effect of chewing during eating on particle breakdown.
The efficiency of chewing during rumination in reducing particles to < 1 mm
(<C.RUM>) in sheep had been measured as 60 % (Ulyatt, 1983), 59 % (Domingue
et al., 1 99 1b) and 39 - 65 % (Table 1 .5). Chai et al. (1984) reported <C.RUM> as
58 - 75 % in cattle, and similarly Kennedy ( 1985) reported that approximately 70
% of large particles in the mouth were comminuted to small particles during one
cycle of rumination and rumination accounted for approximately 85 % of
comminution of large particles which entered the rumen. Ulyatt et al. ( 1986)
consider that the major role of rumination is to reduce the particle size of refractory
material so that it can be cleared from the reticulo-rumen and that chewing during
rumination is the more important process than chewing during eating in reducing
feed particle size.
20

Table 1 .4 The effect of c hewi n g dur ing eating (C.EAT) on feeding
behaviour and particle size reduction in sheep (n=6) fed three fresh
herbages and two chaffed hays (adapted from Ulyatt et al. , 1 986).
Perennial Red Lucerne Lucerne Meadow RSE ryegrass clover hay hay
I ntake (gDM/d) 861 9 18 952 946 943
I ntake rate (gDM/min) 4.1 1 1 . 1 1 3 .6 7 .7 1 0 .7 0.5
Chewing rate:
Chews/min 1 50 1 45 1 43 1 42 1 25 2.6
Chews/gDM 36.6 1 3 . 1 1 0.5 1 8 .5 1 1 .7 1 .59
% large particle DM reduced to < 1 .0 mm by C.EAT 48.6 51 .6 45.4 37. 1 34.6
For the fresh diets feed particle size > 1 .0 mm was 1 00 %, while the values for lucerne and meadow hays were 96.4 and 97.8 %, respectively.
2 1
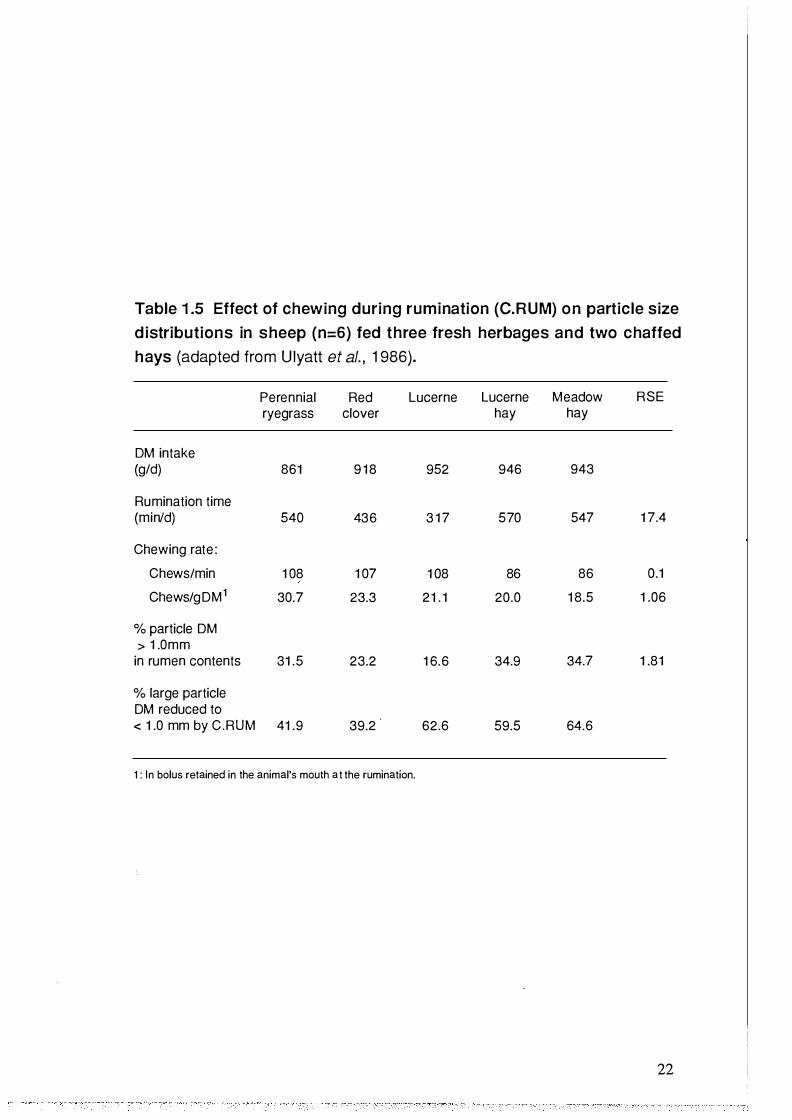
Table 1 .5 Effect of chewing during rumination (C.RUM) on particle size
d istributions in sheep (n=6) fed three fresh herbages and two chaffed
hays (adapted from U lyatt et al. , 1 986).
Perennial Red Lucerne Lucerne Meadow RSE ryegrass clover hay hay
OM intake (g/d) 861 9 1 8 952 946 943
Rumination time (min/d) 540 436 3 1 7 570 547 1 7.4
Chewing rate :
Chews/min 1 08 1 07 1 08 86 86 0.1
Chews/gOM1 30.7 23.3 21 . 1 20.0 1 8.5 1 .06
% particle OM > 1 .0mm
in rumen contents 31 .5 23.2 1 6.6 34.9 34.7 1 .81
% large particle OM reduced to < 1 .0 mm by C.RUM 41 .9 39.2 62.6 59.5 64.6
1 : In bolus retained in the animal's mouth at the rumination.
22

1 .3.3. 1 .3 Role of microbial attack in the rumen
The rumen microorganisms enter the chewed plant tissue, via cut ends and
damaged surfaces , in the general order of mesophyll, phloem > epidermis,
parenchyma bundle sheath > sclerenchyma > lignified vascular tissue (Akin, 1979).
As a result, the spatial architecture of the plant tissue remains comparatively intact
(Van Soest, 1975). Akin et al. ( 1 989) reported that ruminal fungi weakened plant
residue more amenable to physical degradation, thus, allowing the plant digesta to
be more easily broken apart during rumination. Although it contributes to
clearance of dry matter from the reticule-rumen by weakening the cell wall
structure internally, microbial digestion per se has relatively little effect on particle
size reduction (Poppi et al. , 1980; Uden et al. , 1982; Ulyatt, 1983).
1 .3 .3.2 Passage through the reticulo-omasal orifice
Digesta flow from the rumen depends on the frequency and amplitude of reticule
rumen contractions and the size of particles presented in the reticule-rumen. The
regular contraction of the reticule-rumen provide the propulsive force for passage.
Although particle size reduction is a prerequisite, the material present in the
reticule-rumen at any time is predominantly below the threshold size (Poppi et al.,
198 1 ; Ulyatt, 1983).
Evans et al. ( 1 973) and Kennedy et al. ( 1 988 ) suggest that density of particles
within the rumen also affects the passage. Welch (1987) and Reid ( 1984) reported
that light particles were more likely to be returned to the reticulum from the
omasum than heavier particles during the reticule-rumen contraction. Reduction of
feed particle size therefore only increases the probability of passage (Poppi et al., I
1980, 1985). The rate of outflow of the material presented in the reticule-rumen is
determined primarily by the rate of breakdown of particles to a size which is small
enough to have high probability of passing through the reticule-rumen orifice
(Egan et al. , 1984; Poppi et al. , 1 985).
23

1.3.3.3 Conclusion
There is a threshold particle size above which material has low probability of
passing from the reticulum to the omasum. The threshold size in sheep appears to
be between 1 .0 mm and 2.0 mm. Feed particles are reduced in size predominantly
by chewing both during eating and ruminating. Chewing during rumination is
more important than chewing during eating in reducing the particle s ize of
refractory material and no further particle size reduction occurs after the rumen.
PRG requires a higher number of chews both during eating and ruminating to
reduce the ingesta particle size compared with legumes. Microbial digestion per se
is considered to have little effect in reducing particle size. Although the material
present in the reticulo-rumen at any time is predominantly less than the threshold
size, particle size reduction is a prerequisite for passage.
1.4 Attempts to improve feeding value of perennial ryegrass by reducing
physical resistance to breakdown
PRG requires a longer chewing time during both eating and ruminating, which is
considered to be a major cause of slow passage from the rumen, thus resulting in
lower voluntary intake and less nutrients available for the animals in their small
intestine. This hypothesis has led to a new concept for plant breeders - to reduce
physical resistance so that plant material can be easily broken down in size by
mastication.
1 .4. 1 Physical resistance of perennial rye grass to fracture
1 .4. 1 . 1 Anatomy of perennial rye grass
Figure 1 .5 is a drawing of a young plant grown outside in full daylight, presented
to show the relative positions and proportions of organs of a young PRG.
24

Blade of leaf 3 -tit----_j
Seed
Blade of leaf 1
Position of legule in axil of leaf 1
Adventitious seminal roots
Figure 1 .5 Young plant of perennial ryegrass (x 1 .75 Soper et al. , 1 956).
25

In terms of animal nutrition, leaf i s the most important part of the plant as a
nutrient source. Figure 1 .6 shows the structure of the leaf of PRG.
The blade consists of a skeleton of parallel vascular bundles which together with
the epidermis and sclerenchyma fibre support the mesophyll.
The vascular bundles are effectively continuous cylindrical sheaths that run the
length of the leaf. The nutrient supply for the leaf is carried within the bundles.
The single large vascular bundle is associated with the mid-rib. The remaining
vascular bundles are quite regularly spaced across the leaf, with the medium sized
bundles separated by two or three small bundles, depending on the width of leaf.
The sclerenchyma fibres are located immediately above the vascular bundles and a
few below the vascular bundles and also along each edge of the leaf. The term
sclerenchyma refers to complexes of thick-walled cells, often lignified, whose
principal function is mechanical. These cells are supposed to enable plant organs
to withstand various strains, such as these resulting from stretching, bending,
weight and pressure, without causing damage to the thin-walled softer cells (Esau,
1 953). The degree of development of these small continuous fibres varies across
the leaf, and from leaf to leaf in the s ame manner as the vascular bundles
(Betteridge et al., 1986).
Surrounding the vascular bundles are , two layers of cells. The inner sheath is of
thick-walled, more or less lignified cells with the thickening heaviest on the radial
and inner tangential walls. This layer probably serves as protection against
crushing of the phloem cells and adds rigidity to the leaf as a whole. The outer
sheath i s of thin-walled parenchyma cells which contain small numbers of
chloroplasts (Soper et al., 1956).
26
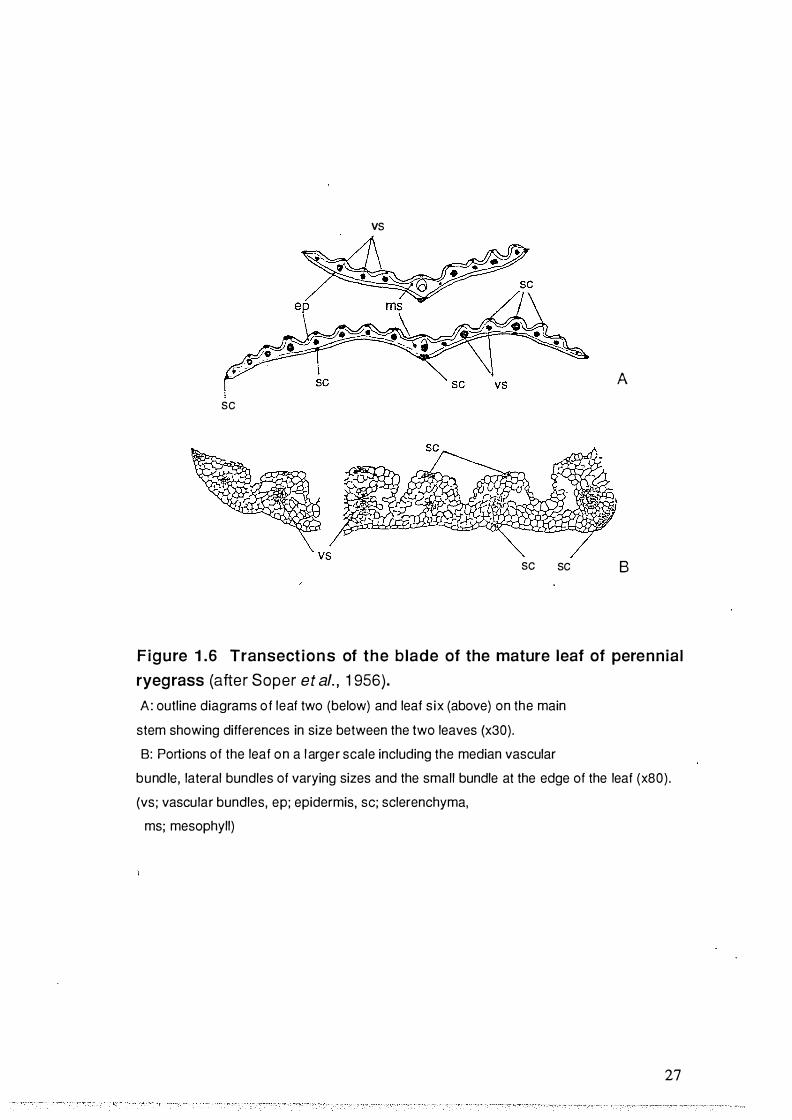
vs
se
A
se se B
Figure 1 .6 Transect ions of the blade of the mature leaf of perennial
ryegrass (after Soper et al. , 1 956). A: outline diagrams of leaf two (below) and leaf s ix (above) on the main
stem showing differences in size between the two leaves (x30).
B: Portions of the leaf on a l arger scale including the median vascular
bund le, lateral bundles of varying sizes and the small bundle at the edge of the leaf (x80) .
(vs ; vascular bundles, ep; epidermis, se; sclerenchyma,
ms; mesophyll)
27

1 .4. 1 .2 Forces applied at fracture
Figure 1 .7 shows three major different forces that can be applied to the material.
Direct tension occurs in a two-force member when the forces are pulling on it in
the axial direction, i.e. direct tensile force. When a force acts on a member in a
manner that it tends to cause the member to separate along a plane parallel to the
applied force, it is called a direct shearing force. Direct compression occurs in a
two-force member when the forces are pushing on it in the axial direction. These
stresses on the material can be measured at fracture as a criteria of the physical
resistance to fracture, i.e. physical strength of the material.
The physical strength of the material for these types of stress is defined as the
stress at fracture, Sf;
Breaking load Sf = -----
A
where A is the cross-sectional area at fracture providing no deformation of the
material occurs (static).
Young' s modulus is often used to express stiffness of material which is the ratio of
stress to strain (dynamic). Hooke' s solid is a model of a material which is elastic,
homogeneous and i sotropic . When the Hooke ' s solid i s under tensile or
compressive stress (see Fig. 1 .8), Young's modulus , E, is given by;
where
tensile or compressive stress, cr E =------------
tensile or compressive strain, "C
force, f 0' = ----
area, A
oz and "C = --.
l
where l in the length of the solid.
28

' F I J I
F � F I F
t I F I
(a) (b)
Figure 1 .7 Types of force to apply to the material.
(a) direct tension . (b) direct shear. (c) direct compression.
F: force.
-E--F
(c)
29

l
no forces applied
I F
D
(b)
F ...:;.-- ---;;... F I
(a)
F
(c)
l
F i g u re 1 .8 H o o ke ' s e l ast i c i ty i n {a) t en s i o n , (b) s h e a r a n d (c)
compression. F: force.
30

When the Hook' s solid is subjected to distortion by shear stress, the shear modulus,
G, is given by;
where
shear stress, Jl G = -----
force, f Jl = ----
area, A
shear strain, 8
D and 8 = -- = tan 0,
l where D is an angle of the strain.
When the material is reinforced with fibres (fibre-reinforced composite) the Voigt
model can be applied to give the overall modulus, EL, as;
EL = :L E.V. 1 1
where Ei and Vi are the modulus and volume fractions of the components (Kelly,
1966).
1 .4. 1 .2. 1 Perennial ryegrass in tensile stress
Apart from some early works, there have been very few published studies of the
properties of PRG in tensile stress.
In some early studies, Evans ( 1964a, 1967a, 1967b) used a specially constructed
apparatus to compare the tensile strength of leaf in four ryegrass varieties under
grazing pasture conditions over a period of one year. He reported seasonal change I
in the tensile strength and that the varieties with high tensile strength of leaf had
high cellulose contents and sclerenchyma wall percentages. These results were
consistent with the animal weight gains recorded on the same trial (Rae et al.,
1964)(Table 1 .6).
3 1

Table 1 .6 Mean leaf strengths, sclerenchyma wall percentages and
cel l u lose percentages of perennia l , Ariki, Ita l ian and Short-rotati on
ryegrass and mean l iveweight gain of sheep (adapted from Evans, 1 964b, and Rae et al. , 1 964 ).
Variety
Perennial
Ariki
Italian
Shortrotation
Strength (g/mg of 5 cm length) 1
97.3
90.6
69.9
70.9
Cellulose (%) 1
1 2 .8
1 2. 1
1 0. 1
1 0.4
1 : Measured on 8 dates during the period o f 24/6/63 - 9/1 0/63.
Sclerenchyma wall (%)2
Mean liveweight gain (g/d)3
2 . 1 0 1 40
1 .60 1 35
0 .87 223
0.98 na
2: Percentage of total cross-section of the leaf measured on 4 dates during the period of 1 0/7/63 - 9/10/63. 3: Mean liveweight gains during the period of 517163 - 26/1 1/63.
32

Bailey ( 1964) pointed out the relationship between leaf tensile strength and physical
breakdown of digesta particles. However, in these early studies, Evans ( 1967a,
1967b) and Wilson ( 1965) suggested the use of leaf strength as a indicator of
cellulose content in leaf, which was believed to be a criterion of nutritive value
affecting animal performance (Johns, 1962, Rae et al., 1963; Rae et al., 1964).
More recently, Vincent ( 1 9 82) and Betteridge et al. , ( 1 986) criticized these
pioneers' studies for using inappropriate measurement methods. In Evans ' ( 1964a,
1967a, 1967b) and Wilson' s ( 1965) studies, their measurement of "tensile strength
of leaf' was defined as;
tensile breaking load of leaf tensile strength of leaf =
dry weight of a 5 cm-length-cut leaf.
The more appropriate parameter for the tensile strength is, as mentioned in the
section 1 .4. 1 .2, the stress at fracture, Sf;
Tensile breaking load Sf =
Cross-sectional area of leaf at fracture.
There is no simple relationship between Sf and the tensile strength defined by
Evans and Wilson (Betteridge et al., 1986).
Vincent ( 1982) and Betteridge et al . ( 1986) measured tensile strength of leaf of
PRG and estimated cross-sectional area using width and thickness of leaves,
although Vincent ( 1 982) reported that this method overestimates the true cross-\
sectional area by about 25 %. The results of both studies are summarised in Table
1 .7 . Although values in the Vincent study (1982) were estimated as being higher
than those in the study by Betteridge et al. ( 1986), sclerenchyma fibres in both
studies are. much stronger than leaves or vascular bundles in PRG. The transverse
strength of leaf was also reported as less than 0. 142 x 107 kg/m2(Young's modulus)
33

Table 1 .7 Young's modulus of tensile strength and volume-fraction of
leaf of perennial ryegrass (adapted from Vincent, 1 982, and Betteridge et al. , 1 986).
M easured by
Leaf
Sclerenchyma fibre
Vascular bundle
Modulus (kg/m2)
5 .63 X 1 07
230.4 X 1 07
8 .54 x 1 o7
1 : Percentage of total cross-sectional area.
Vincent
Volume fraction (%) 1
4.24 - 1 .88
4.1 2
Betteridge et al. Modulus Volume (kg/m2) fraction (%) 1
0 .82 X 1 07
29.6 X 1 07 2 .93
4 .4 X 1 07 3 .52
34

which could be accounted for by the cuticle covering the leaf and leaf matrix
(Vincent, 1982). Regarding the transverse modulus as equivalent to the matrix
modulus in the Voigt model (see section 1 .4. 1 .2) , Vincent (1982) estimated the
sclerenchyma fibres account for between 90 and 95 % of the tensile strength of the
leaf. In Betteridge et al. ' s study ( 1986) it can be calculated as being approximately
85%.
Vincent ( 1 982) related tensile strength to the animals' behaviour of prehending
grass from the ground, which is one of the non-nutritional factors affecting intake.
There are very few published studies of the relationship between the mastication of
ruminants and the force s applying to the feed material during breakdown by
mastication.
1 .4. 1 .2.2 Forces applied to the feed material during mastication by rumi�ants
1 .4. 1 .2.2. 1 Masticatory movements of ruminants
Although Troelsen et al. ( 1964) invented a artificial mechanical masticator, which
was cons truc ted from a simple double gear pump, to measure the rate of
breakdown of forages by ruminants, there have been very limited published studies
of masticatory movements of ruminants.
Figure 1 .9 shows the masticatory musculature of sheep. In herbivores like goats,
Musculi masseter mainly produces the forces caused by sideward tension which
moves the lower jaw laterally (Schumacher, 1985). In functional analyses of the
mammalian masticatory apparatus , Turnbull ( 1970) calculated in sheep Musculi
masseter accounted for approximately 64 % of total jaw closing power compared
with 9.7 % and 13 . 1 % in opposums and cats, respectively.
From a study of the grinding surface of the teeth and articular surfaces of the skull
and the jaw bone, Murphy (1959) has determined the axis of the chewing stroke in
35

M. zygomaticomandibu/aris
M. masseter
pars profunda pars superficia!is
aponeurosis covering M. temporalis
M. digastricus anterior belly posterior belly
Figure 1 .9 Masticatory musculature of sheep (Turnbul l , 1 970). Superficial d issection in lateral aspect showing the aponeurosis of M. temporalis and
showing M. masseter and M. zygomaticomandibularis.
(M; Musculi).
36

adult sheep. The masticatory movements as sliding movement of the lower teeth
of sheep can be simulated by defining these axes •.
Hiiemae ( 1978), in a comparison of the lower jaw movements in some mammals,
noticed that the degree of lateral movement is the greatest in goat and the least in
cat (Fig. 1 . 10). The profiles are shown in frontal view with the working side in the
right side of the jaws. (The horizontal line indicates the transverse plane of centric
occlusion and the vertical line i s perpendicular to it at the point of centric
occlusion. The hatched vertical line corresponds to the anatomical midline.)
1 .4.1 .2.2.2 Forces applying to the feed material by teeth
When feed material is between the upper and lower cheek teeth during lateral
masticatory movements, the masticatory force applying to the feed material is the
shear force (Fig. 1 . 1 1 ) . Rensberger ( 1973), in his simulation study of mastication
and dental wear in herbivorous mammals, showed that the grinding masticatory
stroke actually consisted of shear when the tops of the tooth crests are in contact.
The function of mastication, however, also occurs on a microscopic scale because
each cheek tooth of ruminants has multiple cusps whose individual shapes are
irregular or complex. Thus, the major force applying to the feed material by teeth
is probably shear, but tensile force may be involved to a certain extent.
1 .4 . 1 .2.3 Conclusion
Although in early s tu dies ten sile breaking load of PRG was measured,
interpretation of data from these studies should remain only as a guide due to the
inappropriate definition of strength. More recent works reported that sclerenchyma
tissues account for approximately 90 % of tensile strength. However, in actual
mastication of sheep , shear appears to be a major force applying to the breaking
down of the feed material rather than tensile force.
37

Goat Opossum Cat
Figure 1 . 1 0 The movements of the l ower jaw in a "typical" chewin g
cycle in goat, in o possum and in cat (adapted from Hi iemae, 1 978). (The horizontal l ine indicates the transverse plane of centric occlusion and the vertical l ine
i s p e rpend ic u l a r to it at the point o f centr ic occ lus io n . The hatch ed ve rt ica l l i n e
corresponds t o the anatomical midline.)
38

upper teeth
------F l ower teeth
F i g u re 1 . 1 1 R e l at i o n s h i p of feed mater ia l i n late ra l mastic at o ry
movements of o pposing o cclusal surfaces.
( F ; forces applying)
39

1 .4.2 Contribution of reduced leaf shear breaking load in perennial ryegrass
towards improved intake and feeding value - Background studies
1 .4.2. 1 S election for low and high leaf s hear breaking load perennial
rye grass
Easton ( 1989) adopted the leaf shear breaking load (LSBL) as a parameter of the
physical resistance to breakdown of the PRG. LSBL was measured as shearing
across the leaf at 3 and 6 cm below the ligule by a Warner-Bratzler meat shear
apparatus. The maximum load required to shear a leaf was defined as LSBL. In
1984, based on LSBL, six plants of the low leaf shear breaking load (LS) selection
and six plants of the high leaf shear breaking load (HS) selection were taken from a
population of 155 'Grasslands Nui' Lolium perenne plants and 216 (L. perenne x L.
multiflorum) x L. perenne plants. Four plants for the HS selection, and two plants
for the LS selection were taken from the 'Nui' population, the remainder were
from the pair-cross population. The LS and HS selection groups were isolated
separately in pollen-proof glasshouses and allowed to interpollinate. Seed from
these two selection lines were harvested from individual plants in January 1985,
and sown in the glasshouse. These are referred to as progeny.
Mean LSBL of these parent plants and progeny plants are shown in Table 1 . 8 and
Table 1 .9 , respectively. Predicted heritability within a selection was calculated as
0.36 (Easton, 1989). The LS and HS selections in 1984 had mean LSBL 32.4 %
lower and 36.8 % higher, respectively, than the mean of the original population.
The large difference in LSBL of the parent lines was still evident in March 1986
(p<0.001) .
40

Table 1 .8 Mean leaf shear breaking load (LSBL) of parent plants ( n=6) selected for low (LS) and high (HS) leaf shear breaking load at the time
of selection (1 984) and in January 1 986, and of the original population
(adapted from MacKinnon et al. , 1 988).
Selected parents Original Effect of
population selection LS HS
LSBL (kg/leaf)
Time of selection (1 984) 0.46 0.93 0 .68 ***
January 1 988 0.56 0 .88 *
41

Tab le 1 .9 Mean leaf shear b reak ing l oad ( LS B L) of the progeny
p o p u l at i o n fo r l ow ( LS) a n d h i g h ( HS) l eaf shear breaki n g l oad
perennial ryegrass select ions in December 1 985 (n=1 20) and March
1 986 (n=240) (adapted from Mackinnon et al. , 1 988).
Progeny Effect of
LS HS selection
LSBL (kg/leaf)
December 1 985 0 .48 0.66 * * *
March 1 986 0 .66 0.86 ***
42

1 .4.2.2. Rates of dry matter consumption, diges tibilities and liveweight
gains of sheep grazing two perennial ryegrass selections selected for
low and high leaf shear breaking load
MacKinnon et al. , ( 1 988) also determined rates of dry matter consumption and
ruminal degradation of dry matter using the polyester bag technique with the two
progeny selections , and also WC using sheep fed a basal diet of fresh PRGJWC
pasture (Table 1 . 10) . The LS selection of PRG increased the rate of dry matter
consumption by 1 7 % (p<0.05) but thi s was still lower than the rate of WC
consumption by sheep (p<O.OOl) . The rate at which the insoluble component was
degraded in the rumen (i.e. constant c) was greater for WC than for either PRG
selection (p<O.OO l) . Selecting PRG for LS had no effect at all upon rate of dry
matter degradation (c) or upon potential degradability (a + b). From these results,
MacKinnon et al. ( 1988) considered that the plant selection may have resulted in a
faster rate of breakdown during chewing, resulting in a faster rate of dry matter
consumption.
Kolver ( 1989) measured live weight gains of 8-month-old lambs grazing either LS
or HS PRG swards at generous pasture allowances and reported that the animals
grazing the LS selection grew faster than the animals grazing the HS selection
(p<O.Ol ) (Table 1 . 1 1 ) .
1 .4.2.3 Conclusion
The HS and LS selections were selected from large numbers of PRG. The
heritability of LSBL was estimated to be 0.36. Measurements of LSBL made on
the progeny of both selections confirmed this estimate.
The rate of dry matter consumption by sheep was higher in the LS selection than
the HS selection, but rumen degradation rate was not different. In a grazing trial,
8-month-old wether lambs grazing the LS selection grew faster than the animals on
the HS selection.
43

Table 1 .1 0 Means of rate of dry matter (DM) eaten and disappearance
i n the rumen of sheep (n=6) , of vegetative perennial ryegrass (PRG)
selected for low (LS) and h igh (HS) leaf shear breaking load, and of
white clover (adapted from MacKinnon et al. , 1 988).
Rate of eating (gDM/min)
Rate of DM disappearance 1 :
Constant a (%)
Constant b (%)
Constant c (%/h)
Potential degradability (a + b)
PRG selection
LS HS
7.6 6.5
36.6 35.9
5 1 .8 52.8
9.8 1 0.0
88.4 88.7
White clover
9.4
35. 1
57.8
22.7
92.9
Effect of selection
*
ns
ns
ns
ns
1 : DM disappearance from polyester bags (y) expressed as a percentage o f that present a t t=O, was fitted to the equation; y = a + b ( 1 -e-et) , where the instantly soluble fraction (a), the proportion degraded in time t (b) (i.e. the insoluble component) and the degradation rate of the 'b' fraction (c).
44

Table 1 .1 1 Live weight gains of 8-month-old lambs grazing low (LS)
and h igh (HS) leaf shear breaking load perennial ryegrass selections
and means of leaf shear breakin g load (LS B L) of the two selections
during the trial (adapted from Kolver, 1 989).
Live weight gain (g/day)
LSBL (g/leaf)
LS
1 25
567
Selection
HS
1 08
751
Effect of selection
**
**
45

1 .4.3 Objectives of investigations in this thesis
As discussed in section 1 .4. 1 .2, physical resistance of leaf to shear, namely leaf
shear strength, is a function of LSBL and cross-sectional area of the leaf and is
defined as;
LSBL Leaf shear strength = -------------
Cross-sectional area of leaf at fracture.
The LS and HS PRG were, however, selected and established based on only LSBL
(see section 1 .4.2. 1 ). Thus, the effect of selection for the LS and HS PRG in the
true sense of physical resistance is yet to be investigated. Since leaves of PRG are
fibre-reinforced composites having many parallel fibres along the leaf, the strength
of leaf to breakdown may differ between when the force applied across the leaf and
when the force applied along the leaf. This means that morphology of the leaf may
influence the efficiency of breakdown by mastication. In addition , no
demonstrations have been made, in comparison between the HS and LS selections,
that the LS selection physically degrades more efficiently by mastication of
ruminants, and hence, improves rumen digesta outflow rate and consequently leads
to higher voluntary intake associated with increased efficiency of utilisation of both
protein and the whole diet and, as a result, achieves improved FV.
Therefore, in this thesis, Chapter 2 and Chapter 3 compare the two PRG selections
in the physical and morphological properties of leaves and in efficiency of
breakdown by mastication. Chapter 4 and Chapter 5 investigate the effect of
reduced LSBL in PRG on digesta outflow rate, voluntary intake and FV;
Chapter two compares leaf anatomy, leaf morphology and leaf shear strength
between the two PRG selections selected for LS and HS,
Chapter three examines the effect of reduced LSBL in PRG upon particle
breakdown during the mastication in sheep
46

Chapter four examines the effect of reduced LSBL in PRG upon rumen
digesta outflow rate and apparent digestibility in sheep
Chapter five examines the effect of reduced LSBL in PRG upon voluntary
feed intake, live weight gain and wool production in grazing sheep.
47

Chapter Two
COMPARISONS OF LEAF ANATOMY, LEAF MORPHOLOGY
AND LEAF SHEAR STRENGTH BETWEEN TWO
PERENNIAL RYE GRASS S ELECTIONS S ELECTED FOR
LOW AND HIGH LEAF SHEAR BREAKING LOAD
2.1 Introduction
Two selections of perennial ryegrass (PRO) were selected for low (LS) and high
leaf shear breaking load (HS) based on the maximum load required to shear across
the leaf, i.e. leaf shear breaking load (LSBL) (Easton, 1989). However, the true
measure of physical resistance of the leaf to shear, namely, leaf shear strength (LSS)
is a function of LSBL and cross-sectional area (CSA) at fracture (see section
1 .4. 1 . 2) . Leaves of PRO are fibre-reinforced composites that have many
sclerenchyma fibres along the leaves. These sclerenchyma fibres account for more
than 85 % of the total strength when the leaves are in tensile stress (Vincent,
1 982 ; Betteridge et al . , 1 986 ) . This suggests that the morphological and
anatomical characteristics of PRO leaf are important factors in understanding its
physical resistance to breakdown.
Therefore, this chapter further investigates the differences in LSBL between the
two selections in relation to the leaf cross-section, anatomical structure and
chemical composition. Furthermore, the relationship between LSBL and leaf
morphology, when the two selections are subject to breakdown, is discussed.
2.2 Materials and Methods
LS and HS PRG selections were grown under a controlled atmosphere. Anatomy
of the leaf CSA for the two PRO selections was examined using a light
48

microscope. LSBL and cross-sectional areas of three successively emerged leaves
at three aging levels for the two PRG selections were examined to estimate the
LSS . Morphological measurements were also made on each leaf. Chemical
analyses were performed to determine concentrations of cell-wall constituents.
2.2. 1 Low and high leaf shear breaking load perennial ryegrass selections
In May 1 987, approximately 1 50 seeds each of LS and HS PRG selections ,
harvested in 1985 (See section 1 .4.2. 1 ) , were sown in a glasshouse of the Plant
Physiology Division DSIR, Palmerston North for germination.
In June 1987, 60 young germinated shoots were randomly selected from each
selection and transplanted into individual plastic pots. The soil used consisted of
70 % fine gravel, 1 5 % peat and 15 % vermiculite. The pots remained in the glass
house and were watered regularly.
In August 1 987, all the pots were moved to a controlled atmosphere cabinet (CAC)
of the Plant Physiology Division 's Climate Laboratory. All the tillers already
emerged were clipped so that sampling could be made on leaves on the newly
formed tillers. In the CAC, climatic conditions were set for optimum growth
conditions determined for PRG (Hunt et al., 198 1 ; Hunt et al., 1985) i.e. constant
temperature of 20 eo, 1 50 W/m2 irradiance for a 12-h light period and 5 mbar
pressure deficit. Each pot received 250 ml of nutrient solution (see appendix 2. 1 )
twice a day supplied through a polyethylene tube inserted into the soil.
2.2.2 Experimental design i
Plant and leaf allocations were made as shown schematically in Figure 2. 1 .
49

Total Selection Emergence level Aging level
MOO (1 0 leaves)
within 2nd (20 pots) - - each r- - M 1 0 (1 0 leaves)
pot
LS (60 pots) 4th (20 pots) M20 (1 0 leaves)
1 20 pots 6th (20 pots)
HS (60 pots)
Figure 2.1 Schematic representation of the plant and leaf al locat ion
for the control led atmosphere trial .
(MOO: maturation , M 1 0 : 1 0 days after maturation , M20: 20 days after maturation)
50
2.2.2. 1 Plant allocation
Sixty pots each of both PRO selections were randomly allocated into three 20-pot
groups for leaf collections at three emergence levels i.e. the second-emerged (2nd),
the fourth-emerged (4th) and the sixth-emerged (6th) leaves to examine effects of
the leaf emergence on the physical and chemical parameters of the leaves.
2.2.2.2 Identification and allocation of leaves
In each pot, 30 individual tillers were randomly selected. In each newly emerged
tiller, each leaf emergence level was identified by counting leaves from the first
newly emerged leaf. All the identified leaves were marked by sticking self
adhesive labels on both their sides. In each pot, the 30 tillers were then randomly
allocated into 10 tillers each of three leaf aging levels, i.e. maturation (MOO), 10
days (M10) or 20 days (M20) after full maturation, respectively, to examine the
aging effects on the physical and chemical parameters of leaf. The maturation of
the leaf was defined as appearance of a ligule on each leaf.
2.2.3 Collection of leaves
Leaves of 2nd-MOO, 4th-MOO and 6th-MOO were collected over two-day periods,
three weeks, five weeks and eight weeks after the clipping, respectively. The
sampling dates were decided when ligules had appeared on more than 90 % of the
identified leaves. Collections of leaves of M10 and M20 were made over two-day
periods, 10 days and 20 days after the collections of leaf MOO, respectively.
I
The leaves were carefully cut off from the tillers immediately below the position of
the ligule using a pair of scissors. The leaves collected from each pot were placed
into individual plas tic bags and immediately stored under refrigeration
(approximately 4 C0) for up to 18 hours before taking any measurements. Leaves
which had partially or entirely died were omitted from the morphological and
5 1

LSBL analyses. Most of the leaves collected for aging level M20 were found in
this category and therefore, only chemical analyses were performed on them.
2.2.4 Measurements of leaf morphology
The morphological measurements were made for length, width and weight of each
collected leaf. The length of leaf was measured on each leaf as the distance
between the apex of the leaf and the position of the ligule on the leaf. The widths,
the distance between both edges of the leaf, were measured on each leaf at three
leaf positions i.e. 1/4 (0.25L), 1/2 (0.50L) and 3/4 (0.75L) of the leaf length from
the position of the ligule to the apex using a pair of vernier calipers. Fresh weight
of each leaf was also recorded.
2.2.5 Determination of leaf shear breaking load
2.2.5. 1 The position of.shear on the leaf
After the completion of morphological measurements, 10 leaves at each aging level
collected from each pot at each emergence level were gathered and aligned along
the 0.50L position and were then shorn at that position.
2.2.5.2 Shear apparatus
A Warner-Bratzler (WB) meat shear apparatus (manufactured by G and R Electric
Co. , Kansas, USA) was used to measure leaf shear breaking load. Originally, the I
apparatus was designed to simulate the act of mastication of meat in the human
mouth, to measure the physical resistance of meat (Warner, 1928). The apparatus
was used for selecting the LS and HS PRO selections (see section 1 .4.2. 1) . A steel
blade 1 .0 16 mm (0.04 in) thick was moved through a slot that cleared it by 0. 127
mm (0.005 in) at a constant speed of 22.86 cm/min (9.0 in/min) by a motor driven
52

screw. A bundle of 10 leaves was placed, so that the direction of the fibre in the
leaf lay across the blade, in a triangular hole in the blade that circumscribed a 25.4
mm ( 1 .0 in) diameter circle. The edges of the hole formed a semicircular edge of
0.508 mm (0.02 in) radius that contacted the sample. These specifications were
established by Bratzler (Bratzler, 1949) . As the blade was pulled through the slot,
the leaves were compressed to a triangular cross-section and finally shorn. The
maximum load required to pull the blade through the slot was indicated by a spring
scale with a pointer held at maximum load. Movements of the blade and position
of the slot of WB in shearing action are shown in Appendix 2.2.
2.2.5.3 Determination of leaf shear breaking load
Although the reading from the WB apparatus was actually a combination of forces
of tension, compression and shear (Pool et al., 1969, Larmond et al., 1 972, Voisey
et al. , 1 974 and Voisey, 1 976), because the material in contact with the cutting
edges was subject to complex stress patterns, the direct reading from the apparatus
divided by number of the, leaves shorn was determined as LSBL. The fragments of
leaves were collected each time after the shear for the chemical analyses. The leaf
fragments within each aging level were pooled, freeze-dried and ground through a
1 mm mesh sieve to conduct the chemical analyses.
2.2.6 Estimation of leaf cross-sectional area and anatomical examination of leaf
cross-section
It was impractical to measure the CSA at fracture (i.e. 0.50L position) directly for
eac h collected leaf due to a large number of s amples (total 3600 leaves). I
Alternatively, regressions between the leaf CSA and the leaf width at 0.50L were
determined by the following procedure in 1 1 plants each selected from the two
PRG selections. CSA for the collected leaves was then mathematically estimated
from the regressions. Anatomical examinations of leaf cross-sections were also
made.
53

2.2.6. 1 Collection of leaf cross-sections
After the above leaf collections were completed, 1 1 pots were randomly selected
from each PRG selection. The tillers were again cut back and allowed to regrow.
The 2nd-MOO leaves were then collected, three weeks after the clipping, when
ligules appeared on more than 90 % of the leaves. For each collected leaf,
an approximately 3 mm length of transverse leaf section was cut out at 0.50L using
a safety razor.
2.2.6.2 Preparation of specimens for microscopy
The specimens were fixed in 3 % glutaraldehyde and 2 % formaldehyde in 0. 1 M
phosphate buffer at pH 7.2 for 12 hours, followed by dehydration with an ethanol
series 20 - 100 % (v/v). The specimens were then infiltrated and embedded in
Polysciences ' JB-4 plastic medium. Transverse sections (1 j.lm thick) were cut
with an LKB-ultramicrotome and transferred to a drop of water on each
microscope slide. The slides were then placed on a hot plate and allowed to dry.
Sections were stained on the microscope slides by applying several drops of 0.05
% toluidine blue in 0. 1 M phosphate buffer. After staining, the toluidine blue
solution was rinsed off the sections with distilled water and the sections allowed to
dry before light microscope examination.
2.2.6.3 Microscope examination
Each specimen was examined for anatomical structure and photographed through a
light microscope with a camera attached (manufactured by Olympus Optical ltd. , I
Japan).
54

2.2.6.4 Determination of leaf cross-sectional area
The photographs of each specimen were projected and enlarged (x 140) on drawing
paper. Leaf width was measured and outlines of cross-section, sclerenchyma
tissues and vascular bundles were carefully traced on to the paper for each
specimen. Each tissue outline was then cut out and weighed for each specimen.
Areas for each tissue segment and total cross-section were determined based on
proportional weights of the cutouts to the paper weight of a known area for each
specimen.
2.2.6.5 Mathematical estimation of leaf cross-sectional area from width
Regression analyses were performed between the leaf CSA and leaf width in the 1 1
specimens for each PRO selection. The obtained regression equations were used to
estimate CSA from the width at 0 .50L for the leaves measured LSBL. The
equations were assumed to be effective for all the leaf emergence levels and aging
levels.
2.2.7 Determination of leaf shear strength
The (static) LSS for each leaf was determined as LSBL divided by the leaf cross
sectional area estimated by the regressions. A modulus (dynamic) based on the
ratio of the shear breaking stress to the shear breaking strain was not estimated due
to technical difficulties in determining the strain for the leaf.
2.2.8 Chemical analyses
The chemical analyses were performed for acid detergent fibre (ADF), neutral
detergent fibre (NDF) and lignin concentrations (Robertson et al. , 198 1 ) and
organic matter was determined by ashing overnight at 550 eo.
55

Cellulose and hemi-cellulose concentrations were determined by subtracting the
concentration of lignin from ADF concentration) and ADF concentration from NDF
concentration, respectively.
2.2.9 Statistical analyses
Statistical analyses were performed by the analysis of variance for a fixed effect
completely randomized model with five hierarchies, i.e. two selections, three leaf
emergence levels nested within each selection, three aging levels nested within
each leaf emergence level, 20 pots nested within each aging level and 10 leaves
nested within each pot. Thus, interactions among the hierarchies were not able to
be analysed. The Type II test in GLM procedure of SAS (SAS Inst., Inc . , NC.,
USA) was used for the analyses. An example table of the analysis of variance is
shown in the appendix 2.3.
2.3 Results
2.3. 1 Cross-sections of the leaves of the low and high leaf shear breaking load
perennial ryegrass selections
Examples of leaf cross-sections of the LS and HS PRG selections are shown in
Plate 2. 1 . In leaves of the LS selection, sclerenchyma tissues were observed as
being less developed than those in the leaves of the HS selection. Sclerenchyma
tissues in the inner epidermis were associated with each vascular bundle in the
leaves of both PRG selections . In the leaves of the LS selection, however,
sclerenchyma tissues in the outer epidermis were only associated with the major
vascular bundles , whereas in the leaves of the HS selection, they were well
developed and associated with each vascular bundle.
56

. . \ ...
• •
I . • .
" .• .
. '
Plate 2.1 Cross-sections of the low and high leaf shear breaking load
perennial ryegrass selections cut at the midway point along the leaf.
A: low leaf shear breaking load selection. B: high leaf shear breaking load selection .
(se ; sclerenchyma tissues. vb; vascular bundles.)
57

Table 2 . 1 shows means of anatomical measurements in the leaf cross-section at
0.50L for the LS and HS PRG selections . The leaves of the LS selection were
approximately 1 3 % narrower (p<0.0 1 ) and 1 6 % smaller in total CSA (p<0.05)
than the leaves of the HS selection. Major significant differences appeared in the
proportion of sclerenchyma tissues in total leaf CSA between the two selections.
The proportion of outer sclerenchyma in the leaf CSA of the LS selection was
approximately 66 % less (p<0.01) and of inner sclerenchyma was approximately
49 % less (p<0.01) than those present in the leaf CSA of the HS selection. For
vascular tissues (including protoxylem lacunae) in the leaf CSA, the LS selection
contained approximately 24 % less (p<0.05) than the HS selection.
In both selections , the leaf widths were significantly correlated with the leaf CSA
at 0.50L. The relationships between the leaf width and leaf CSA at 0.50L are
shown in Table 2.2 . The linear regression relating leaf width and CSA was
significant for both PRG selections (p<0.01 for the LS and p<0.001 for the HS
selections) . S ince there were no significant differences in linear regression
between the selections for either slopes and intercepts (Neter et al. , 1 974), the
pooled linear regression was also estimated.
2.3 .2 Morphology of the leaves of the low and high leaf shear breaking load
perennial ryegrass selections
Least square means of morphological measurements for the leaves of the LS and
HS PRG selections are shown in Table 2.3. These values for the 2nd, 4th and 6th
leaves in each PRG selection are shown in Table 2.4. No significant (p>0. 10)
aging effects were observed on these parameters and, therefore, the values are
pooled over the aging levels. I
The leaves of the LS selection, in comparison with the HS selection, were
approximately 1 8 % shorter, 14 % narrower and 34 % lighter (Table 2.3). In both
selections, the leaf widths at 0.75L were approximately 21 % narrower than the
leaf widths at 0.25L.
58
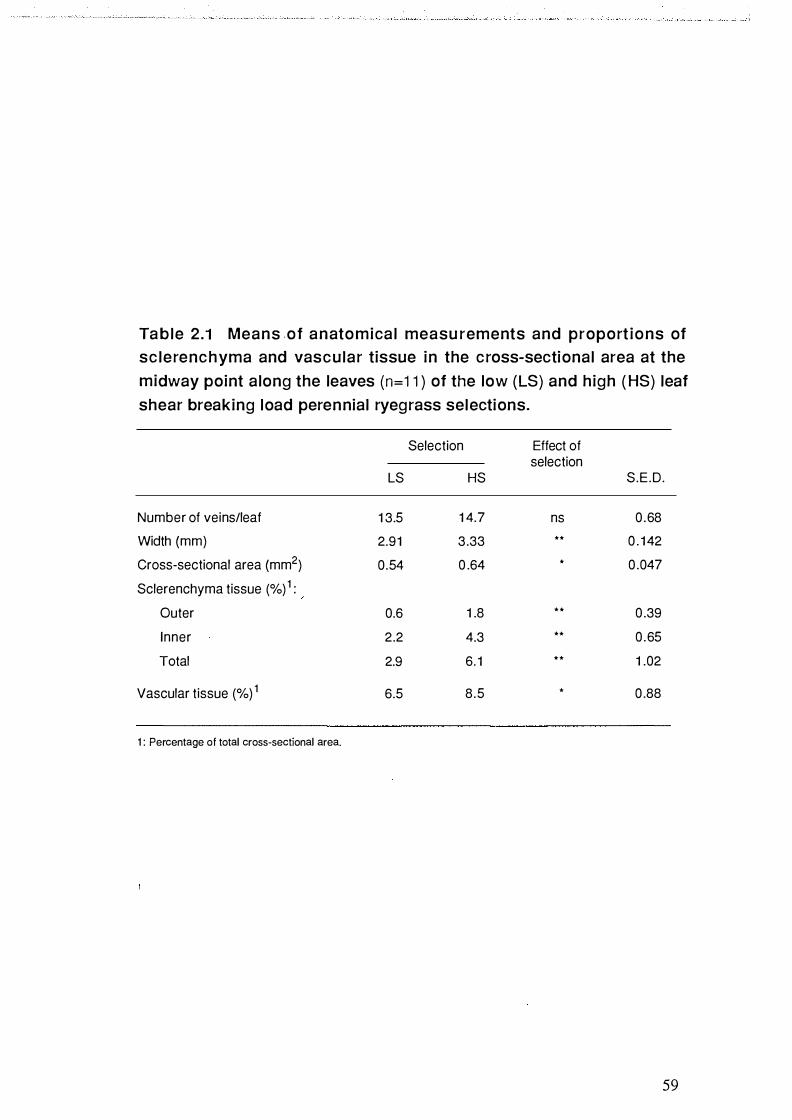
Table 2.1 Means .of anatomical measu rements and proport ions of
sc lerenchyma and vascular tissue in the cross-sectional area at the
midway point along the leaves (n=1 1 ) of the low (LS) and high ( HS) leaf
shear breaking load perennial ryegrass selections.
LS
Number of veins/leaf 1 3.5
Width (mm) 2.91
Cross-sectional area (mm2) 0.54
Sclerenchyma tissue (%) 1 : Outer 0.6
Inner 2.2
Total 2.9
Vascular tissue (%) 1 6.5
1 : Percentage of total cross-sectional area.
Selection
HS
1 4.7
3 .33
0 .64
1 .8
4.3
6. 1
8 .5
Effect of selection
ns * *
*
* *
* *
* *
*
S.E.D.
0 .68
0 . 1 42
0 .047
0 .39
0 .65
1 .02
0 .88
59

Table 2.2 Relationships between width and cross-sectional area at the
midway po int a long the leaves (n=1 1 ) of l ow ( LS) and high ( HS) leaf
shear breaking load perennial ryegrass selections.
Selection
LS
HS
Pooled
Correlation coefficient
0.80
0 .87
0.86
Significance
**
***
* * *
Relationship between width, X (mm) and crosssectional area Y (mm2) 1 •2
Y = 0.339X - 0.447 (±0.0833)(±0.2429)
Y = 0.256X - 0.2 15 (±0.0489)(±0. 1 639)
Y = 0 .265X - 0.239 (±0. 0346) (±0 .1 085)
Significance
**
* * *
* * *
1 : Intercepts for LS and HS are not significantly different from 0, but intercept for pooled significantly differs from 0 at p<0.05. 2: (S.E.).
60

Table 2.3 Least square means of length, widths at 1 /4 (0.25L), 1 /2
(0.50L) and 3/4 (0.75L) of the leaf length from the position of the l igule
to the apex of the leaf, and fresh weight of the leaves of the low (LS)
( n=99 1 ) and h i g h (HS) ( n=998) l eaf shear breaking l oad peren nia l
ryegrass selections.
LS
Length (mm) 258.0
Width (mm):
0 .25L 3.77
0.50L 3.43
0.75L 3.00
Mean 3.42
Fresh weight (mg) 1 49.0
Selection
HS
31 6.3
4.45
4. 1 0
3 .43
3.99
225.3
Effect of selection
***
* * *
* * *
* * *
* * *
* * *
S.E.D.
4.83
0.052
0 .046
0 .038
0 .043
5.22
61

Table 2.4 Least sq uare means of length, widths at 1 /4 (0.25L) , 1 /2
(O.SOL) and 3/4 (0.75L) of the leaf length from the fresh weight (mg)
position of the l igu le to the apex of the leaf, and fresh weight of the
second-emerged (2nd), fourth-emerged (4th) and sixth-emerged (6th)
l eaves of t h e l ow ( LS) ( n=99 1 ) and h i g h ( HS) (n=998) leaf shear
breaking load perennial ryegrass selections.
Selection LS Effect of HS Effect of ------ emergence1
------ emergence1
Emergence 2nd 4th 6th 2nd 4th 6th S.E.D.
Length (mm) 1 89 .3a 261 .0b 323.7c *** 241 .0a 3 1 4. 1 b 393.7c *** 7.27
Width (mm) :
0.25L 3.22a 3.92b 4.1 7c * 3.96a 4.55b 4.84c ** 0 .078
0.50L 3.ooa 3 .58b 3.84c ** 3.68a 4. 1 4b 4.49c ** 0.069
0.75L 2.61a 3 .09b 3.3 1 b ** 3.05a 3.39b 3.85c ** 0.057
Mean 2.95a 3 .53b 3.77c ** 3.56a 4.02b 4.39c ** 0.064
Fresh weight (mg) 90.9a 1 61 .2b 1 94.8c *** 1 52.2a 224.2b 299.4c *** 7.86
1 : Leaves with different superscript differ significantly within a selection.
62

Leaf size increased with the leaf emergence level (Table 2.4). The 4th leaves were
approximately 37 and 30 % longer, 20 and 13 % wider and 77 and 47 % heavier
than the 2nd leaves for the LS and HS selections, respectively. Compared to the
4th leaves, the 6th leaves were approximately 24 and 25 % longer, 7 and 9 % wider
and 21 and 34 % heavier for the LS and HS selections , respectively.
2.3.3 Shear breaking loads and shear strengths of the leaves of the low and high
leaf shear breaking load perennial ryegrass selections
Cross-sectional areas of leaves of the LS and HS PRG selections were estimated by
the pooled regression equation, since there were no significant differences in linear
regression between the selections . Table 2.5 shows least square means of leaf
CSA, LSBL and LSS for the LS and HS PRG selections. These values for the 2nd,
4th and 6th leaves in each PRG selection are shown in Table 2.6. No significant
(p>0. 10) aging effects were observed on these parameters and therefore, the values
are pooled over the aging levels.
The LS PRG selection was approximately 20 % smaller in estimated leaf CSA
(p<0.001 ) and were approximately 41 % lower (p<0.001 ) in LSBL than the HS
PRG selection (Table 2.5 ) . In both of the selections , the estimated leaf CSA
increased with the leaf emergence level but LSBL were similar among the leaf
emergence levels except for the 2nd leaves of the LS selection, which was lower
(p<0.05) than other leaves of the LS selection (Table 2.6). Estimated LSS declined
with emergence level in both of the selections . In overall means, estimated LSS
for the LS selection was approximately 27 % lower (p<0.00 1 ) than the HS
selection.
63

Table 2 .5 Least square means of esti mated cross-sectiona l a rea,
shear breaking load and shear strength at the midway point a long the
leaves of t h e l o w ( LS} ( n = 1 1 7 ) a n d h i g h ( HS) ( n = 1 20 ) leaf shear
breaking load perennia l ryegrass selections.
Estimated cross-sectional area (mm2)
Shear breaking load (g/leaf)
Estimated shear strength (g/mm2)
LS
0.68
337.5
500.7
Selection
HS
0 .85
573.9
689.5
Effect of selection
***
***
***
S.E.D.
0 .01 2
1 4. 1 5
1 7.78
64

Table 2 .6 Least sq uare means of est imated cross-sectional a rea,
shear breaking load and shear strength at midway along the second
emerged (2nd), fourth-emerged (4th) and sixth-emerged (6th) leaves of
the low ( LS) (n=1 1 7) and h igh (HS) (n= 1 20) leaf shear breaking load
perennial ryegrass selections.
Selection LS Effect of HS Effect of ------ emergence 1 ------ emergence 1
Emergence 2nd 4th 6th 2nd 4th 6th S .E. D.
Estimated cross-sectional area (mm2) 0.56a 0 .71 b 0.78c
Shear breaking load (g/leaf) 284.2a 384.3b 344.1 b
Estimated shear strength (g/mm2 cross-sectional area) 51 5.6a 543.8a 442.6b
** 0.74a 0 .86b 0 .95c ***
* 597.7 564.5 559.5 ns
* 81 3 .5a 663.0b 592.0c *
1 : Leaves with different superscript differ significantly within a selection.
0 .01 9
21 .66
27.21
65

2 . 3 .4 Concentrations of dry matter, organic matter, lignin and cell-wall
constituents in the leaves of the low and high leaf shear breaking load
perennial ryegrass selections
The concentrations of dry matter, organic matter, lignin and cell-wall constituents
in the leaves of the LS and HS PRG selections are shown in Table 2.7. These
values for each leaf emergence level in each selection are shown in Table 2.8 and
for each aging level of each leaf emergence level in each selection are shown in
Table 2.9. The values in the tables are expressed as a percentage of fresh weight in
order to relate to the leaf CSA which includes the areas filled with cell-water.
Because the most of the M20 leaves were entirely or partially dead, the values for
the M20 leaves have been excluded from the analyses but they are shown in
Appendix 2.4 on a dry matter basis.
The leaves of the LS PRG selection had approximately 45 % more lignin but 10 %
less cellulose than the leaves of the HS selection. Concentrations of dry matter,
organic matter and hemi-cellulose were similar for both PRG selections (Table
2 . 7 ) . Dry m atter, organic m atter and hemi-cellulose concentrations were
significantly higher in 2nd leaves than in 4th or 6th leaves for both PRG selections
(Table 2.8). These differences were more evident at MOO than at MlO (Table 2.9).
Concentrations of dry matter, organic matter and cell-wall constituents were not
affected by maturity in 2nd leaves but increased significantly for MlO in the 6th
leaves.
66
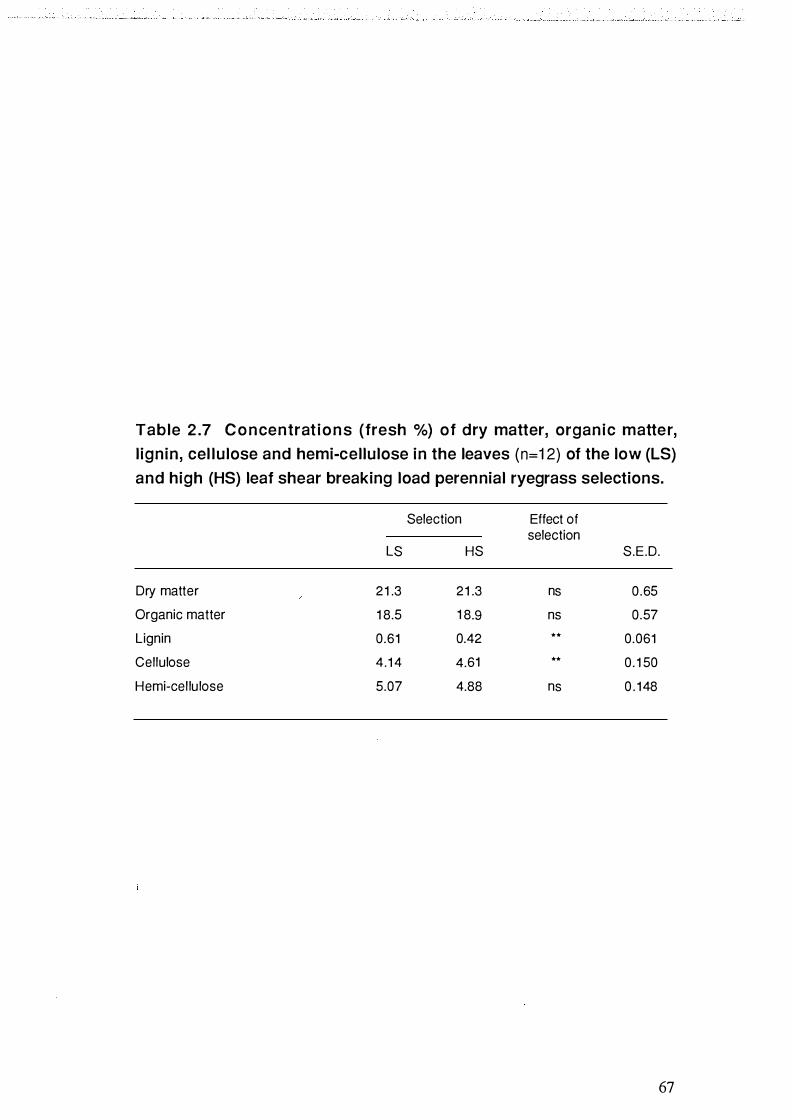
Table 2 .7 Concentrat ions (fresh %) of dry matter, organ ic matter,
l ignin, cel lulose and hemi-cellulose in the leaves (n=l 2) of the low (LS)
and high (HS) leaf shear breaking load perennial ryegrass selections.
Selection Effect of selection
LS HS S.E.D.
Dry matter 21 .3 21 .3 ns 0.65
Organic matter 1 8.5 1 8.9 ns 0.57
Lignin 0.61 0.42 ** 0.061
Cellulose 4.1 4 4.61 ** 0. 1 50
Hemi-cel lu lose 5.07 4.88 ns 0 . 148
67

Table 2 .8 Concentrations (fresh %) of dry matter, organ ic matter,
l i g n i n , cel l u l ose and hemi-cel l u lose in the second-emerged (2nd),
fourth-emerged (4th) and sixth-emerged (6th) leaves (n=1 2) of the low
( LS) a n d h i g h (HS) leaf s h e a r brea ki n g l oad pere n n i a l ryegrass
selections.
Selection LS Effect of HS Effect of emergence 1 emergence1
Emergence 2nd 4th 6th 2nd 4th 6th S.E.D.
Dry matter 23.3a 20.1 b 20.1 b * 24. 1 a 1 9.9b 2o.ob * * 1 . 1 3
Organic matter 20.4a 1 7.9b i 7.2b * 2i .4a i 7.6b 1 7.5b * * 0.99
Lignin 0.68 0.52 0.64 ns 0.42 0 .46 0.39 ns 0. 1 05
Cel lulose 4 . 13 4.25 4.03 ns 4 .88 4.39 4.57 ns 0 .260
Hemi-cel lu lose 5.60a 4.93b 4.68b * 5 .39a 4.64b 4.60b * 0.256
1 : Leaves with different superscript differ significantly within a selection.
68

Table 2.9 Concentrations (fresh %) of d ry matter, organ ic m atter,
l i g ni n , cel l u l ose a n d hemi-cel l u lose in the second-emerged (2nd),
fourth-emerged (4th) and sixth-emerged (6th) leaves (n=1 2) of the low
( LS) a n d h i g h (HS) leaf s h e a r break i n g l oad pere n n i a l ryegrass
selections at maturation (MOO) and at 10 days after the maturat ion.
Selection LS
Emergence 2nd Effect 4th Effect 6th Effect of of of
Age MOO M 1 0 aging MOO M 1 0 aging MOO M 1 0 aging S.E.D.
Dry matter 23.9 22.6 ns 1 9 .0 21 .9 ns 1 6.3 23.9 *** 1 .75
Organic matter 21 . 1 1 9.6 ns 1 6.8 1 9 . 1 ns 1 4. 1 20.4 * * * 1 .40
Lignin 0 .69 0.68 ns 0.56 0.47 ns 0.43 0.85 * 0 . 148
Cellulose 4.1 8 4.08 ns 3.60 4.89 * 3.31 4.75 ** 0 .347
Hemi-cellulose 5.69 5.51 ns 4.40 5.45 * 3.79 5.57 *** 0 .362
------------------------------------------------------------------------------------------------------------------------
Selection HS
Emergence 2nd Effect 4th Effect 6th Effect of of of
Age MOO M 1 0 aging M OO M 1 0 aging MOO M 1 0 aging S .E.D.
Dry matter 23.5 24.6 ns 1 9.4 20.3 ns 1 7. 1 22.9 *** 1 .75
Organic matter 21 . 1 21 .7 ns 1 7.3 1 7.9 ns 20.0 1 7.5 ** 1 .40
Lignin 0 .39 0.45 ns 0 .39 0 .53 ns 0.31 0.47 ns 0 . 1 48
Cel lulose 4.82 4.94 ns 4.1 9 4.58 ns 3.80 5.33 * * 0.367
Hemi-cellulose 5 . 1 6 5 .62 ns 4.42 4.86 ns 3 .99 5.21 ** 0 .362
69

2.4 Discussion
2.4. 1 Effects of selection
The LS PRO selection had approximately 41 % lower (p<0.001) LSBL than the HS
PRO selection. The LS selection, however, also had approximately 21 % smaller
(p<O.OOl ) leaf CSA than the HS selection. Therefore, in LSS (i.e. LSBL/CSA) the
LS PRO selection was approximately 27 % lower (p<O.OO l ) than the HS PRO
selection (5.00 x 10⁵ vs 6.90 x 10⁵ kg/m2). Pool et al. (1969) pointed out that when
meat was shorn by the WB meat shear apparatus, tensile stress was generated
predominantly in the meat fibres. Voisey ( 1974, 1976), using wiener sausages as
the test material, confirmed that the samples in a WB meat shear apparatus failed in
tension not shear. These observations suggest that the LSBL measured in the
present study probably included considerable extent of tensile load. Betteridge et
al. ( 1986) estimated leaf tensile strength of PRO grown in indoors as 6.52 x 10S
kg/m2, which is within the range of two PRO selections measured in the present
study. These facts confirm the two PRO selections have been selected for low and
high physical resistance to breakdown in the true sense and not only selected for
low and high LSBL.
2.4.2 Leaf anatomy
The most remarkable difference in leaf anatomy between the two PRO selections
was that the LS selection had approximately 52 % less (p<0.001) sclerenchyma
tissues occurring in the total leaf CSA (2.9 vs 6. 1 %) than the HS selection. In the
leaves of the LS selection the development of sclerenchyma strands in the outer
epidermis was poor (Plate 2. la) whereas the leaves of the HS selection often had
sclerenchyma strands in both the inner and outer epidermis of each vein (Plate 2. 1b).
Sant ( 1969) reported mean number of sclerenchyma fibres in sixth emerged PRO
leaves as 2.5 and 1 3 .0 for the outer and inner epidermis, respectively and mean
number of vascular bundles was 1 3.2 and the proportion of sclerenchyma tissues to
total cross-sectional area of lamina was 1 .9 %.
70

Although sclerenchyma tissues occupy only small areas in the leaf CSA, the
sclerenchyma tissues are believed to provide up to 95 % of the reinforcement to
the leaf structure (Vincent, 1 982; Betteridge et al. , 1 986). Assuming the entire
resistance to shear stress is provided by sclerenchyma fibres only, the application
of the Voigt model (see section 1 .4. 1 .2) estimates the static shear strength for
sclerenchyma fibres in the present study as 1 .76 x 107 and 1 .40 x 107 kg/m2 (±
0 . 148 x 1 07 S.E.D. , p<0.05) for the LS and HS selections, respectively. This
indicates that sclerenc hyma ti s sue for the leaves of the LS selection i s
approximately 26 % stronger than for the leaves of the HS selection. This may be
related to the higher concentration of lignin in the leaves for the LS selection than
the HS selection. However, relationships between the magnitude of lignification
and sclerenchyma tissues in leaves of PRG are not well understood (Soper et al. ,
1956; Wilkins, 1972). Betteridge et al. ( 1986) dissected sclerenchyma fibres from
the mid-rib area of PRG leaves and measured their tensile strengths as 1 .6 x 107
kg/m2, which is approximately the intermediate value of the two selections studied
here. Vincent ( 1982) reported Young's moduli as 5 .63 x 107 and 2.30 x 10⁹ kg/m2
of cross-sectional area of sclerenchyma tissue for tensile stiffness of the leaves and
the sclerenchyma fibres ,of PRG, respectively. However, Vincent' s data can not
directly be compared with the data from the present study, because only static
shear strength was estimated in the present study. These suggest that the difference
in proportion of sclerenchyma tis sues in leaf CSA mostly accounts for the
difference in LSS between the two PRG selections.
2.4.3 Effects of leaf emergence
In the present study, LSBL of PRG was similar for the leaf emergence levels and
moreover, LSS decreased with the leaf emergence level. Sclerenchyma tissues are I
thick-walled cells and their structural organisation is based on cellulose. Inside of
these cells are the lacunae (Esau, 1953). Thus, sclerenchyma walls account for the
entire strength of sclerenchyma tissues to physical stresses. If the physical strength
of s cl erenchyma ti s sues are as high as estimated above, the s trength of
sclerenchyma walls can be estimated as being far higher than the figures for the
7 1

sclerenchyma tissues . Vincent ( 1991 ) estimated it as approximately 7 . 1 x 10⁷
kg/m2• Evans ( 1964a) reported the proportion of the sclerenchyma wall to leaf
CSA of PRG as 2. 10 %. In leaves of orchardgrass, Kawamura et al. ( 1976, 1981)
estimated that the mechanical tissue fractions consisting of sclerenchyma, vascular
bundle and epidermis contained 39.3 - 52.7 % of cellulose. These indicate. that
cellulose is highly concentrated in the cell walls of sclerenchyma probably to
generate such high mechanical strength. In the present study, the leaves of the LS
PRG selection , which h ad less sclerenchyma ti ssues, had lower cellulose
concentration than the leaves of the HS PRG selection. The lack of change in
LSBL of PRG with the leaf emergence level, therefore, indicates that the amount of
sclerenchyma wall in leaf CSA was constant at any leaf emergence levels. In the
present study, the leaf CSA enlarged but dry matter concentration declined with
leaf emergence level. The latter is more obvious at aging level of MOO and there
was no aging effect on the leaf CSA nor LSBL. Thus, the enlargements in the leaf
CSA with the leaf emergence level are probably due to the increased amount of
water, which is filling the inside of the cells and therefore, the LSS declined with
leaf emergence level.
However, anatomical studies of PRG have confirmed that in proportion to the total
leaf CSA, sclerenchyma tissues increased with successive leaf emergence (Soper et
al. , 1956 ; Evans 1964b; Sant, 1 969; Wilkins, 1 972). Evans ( 1964a) found a
positive relationship between the cellulose concentration (% freeze-dry weight) and
the proportion of the sclerenchyma wall in leaf CSA in the four different grass
species. However, in his study, the cellulose concentrations on a fresh basis should
have been compared to the proportion of sclerenchyma tissue to total leaf CSA
because the tissue cells in the cross-section were expanded with the liquid filling
inside of the cells. Some cell walls of fibres may swell and have a great capacity
for absorption of water (Esau , 1 95 3 ) . The relation ships among water I
concentration, ability to accommodate water in cells and size of cells in the various
plant tissues are perhaps complex. This implies that a comparison of proportions
of sclerenchyma tissue in the leaf CSA for the leaves having different water
concentrations may not be accurate . In the present study, the dry matter
concentrations in leaves for each emergence level between the two selections were
72

very similar.
The proportions of sclerenchyma tissues in cross-sections of PRG have been
reported as varying between 0.7 - 1 .7 % (Soper et al. , 1956) 1 .01 - 2. 16 % (Evans,
1964b), 2.72 % (Evans, 1967), 0.9 - 1 .9 % (Sant, 1969), 4.49 % (Wilkins, 1 972),
4.24 % (Vincent, 1982) and 2.93 % (Betteridge et al., 1 986). This variation may
partially be due to differences in location on the leaf where the dimensions were
taken and in analytical method adopted (Harris et al., 1981) but also the amount of
water which is filling cells may have a large influence. Vincent ( 1983) studied the
influence of water concentration on the stiffness and fracture properties of PRO.
He demonstrated that work to fracture across the leaf veins was almost independent
of water concentration which ranged 0 - 300 % of dry weight. However, the
magnitude of changes of water concentration among leaves in the present study are
probably too small to make major influences on the resistance of the leaves to the
shear.
2.4.4 Effects of aging ,
Although aging at least up to 10 days after the maturation did not alter the LSBL
and LSS , leaves at aging level of M10, relative to MOO, tended to have higher
concentrations of dry matter, organic matter and cell-wall constituents. This is
due probably to the secondary thickening of cell walls in the
plant tissues which include sclerenchyma tissues. However, because sclerenchyma
tissue may require large amount of cellulose to generate its strength, the extent of
the increase of cellulose concentration for 10 days was probably still too small to
influence the LSS . Although the M20 leaves increased considerably the
concentrations of the cell-wall constituents and lignin, which may be affecting the I
leaf strength, death of the leaves appears to occur between 10 days and 20 days
after appearance of ligules on the leaves under the conditions for optimum growth
of PRG.
73
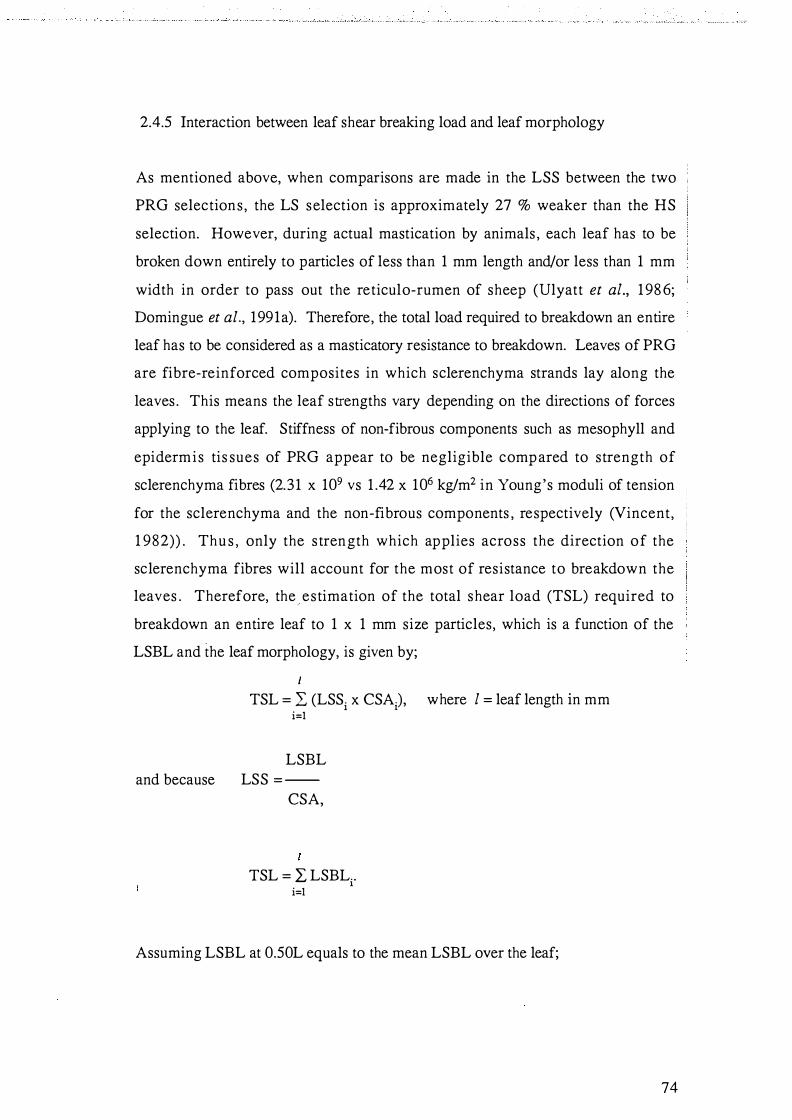
2.4.5 Interaction between leaf shear breaking load and leaf morphology
As mentioned above, when comparisons are made in the LSS between the two
PRG selections , the LS selection is approximately 27 % weaker than the HS
selection. However, during actual mastication by animals , each leaf has to be
broken down entirely to particles of less than 1 mm length and/or less than 1 mm
width in order to pass out the reticulo-rumen of sheep (Ulyatt et al., 1 986;
Domingue et al., 1991a). Therefore, the total load required to breakdown an entire
leaf has to be considered as a masticatory resistance to breakdown. Leaves of PRG
are fibre-reinforced composites in which sclerenchyma strands lay along the
leaves . This means the leaf strengths vary depending on the directions of forces
applying to the leaf. Stiffness of non-fibrous components such as mesophyll and
epidermis tis sues of PRG appear to be negligible compared to strength of
sclerenchyma fibres (2.31 x 10⁹ vs 1 .42 x 106 kg/m2 in Young's moduli of tension
for the sclerenchyma and the non-fibrous components , respectively (Vincent,
1 982)) . Thu s , only the s trength which applies across the direction of the
sclerenchyma fibres will account for the most of resistance to breakdown the
leaves . Therefore, the " estimation of the total shear load (TSL) required to
breakdown an entire leaf to 1 x 1 mm size particles, which is a function of the
LSBL and the leaf morphology, is given by;
and because
' TSL = 2: (LSSi x CSA), where l = leaf length in mm
i=l
LSBL LSS = -
CSA,
TSL = l: LSBL.. 1 i=l
Assuming LSBL at 0.50L equals to the mean LSBL over the leaf;
74

TSL = LSBL x leaf length in mm.
When the TSL is expressed for the unit mass intake;
LSBL x leaf length in mm TSL =-----------------
leaf weight
An index of masticatory load (IML) of leaf may then be given by;
or
LSBL (kg/leaf) x leaf length (mm) IML (kWmgDM) =--------------------
leaf dry weight (mg).
IML = LSBL (kg/leaf) x leaf length:dry weight ratio (mm/mgDM).
Thus, IML is a measure of a total shear load (kg) required to break a unit dry
weight (mgDM) of leaf into particles small enough to have a high probability of
leaving the rumen.
The values of leaf IML for the LS and HS PRO selections are shown in Table 2. 1 0.
The LS PRO selection had approximately 26 % higher (p<O.OOl ) leaf length:dry
weight ratio than the HS PRO selection. In leaf IML, the LS selection was still
approximately 27 % lower than the HS selection. However, this difference in leaf
IML can be altered by changes in the dry matter concentration of the leaf, the leaf
length and the LSBL. In the present study, the two PRO selections were grown
under the optimum climatic conditions for PRO. Mitchell et al. ( 1958) and Evans \ ( 1 9 64b) reported changes of morphological characteristics with climatic
conditions. For the selections growing outdoors where climatic conditions are not
constant, variations of IML can be anticipated.
75

Table 2.1 0 Length :dry weight ratio, and index of masticatory load ( IML)
o f the leaves of the low ( LS) (n=1 1 7) and h igh ( n= 1 20) l eaf shear
breaking load perennial ryegrass selections.
Selection Effect of selection
LS HS S.E.D.
Length :dry weight ratio (mm/mgDM) 8.61 6.86 *** 0 . 1 41
IML (kg/mgDM) 2.84 3.91 *** 0. 1 02
76

2.5 Conclusion
The LSBL for the LS PRO selection was approximately 41 % lower the HS PRO
selection when the leaves were shorn by a WB meat shear apparatus . However, in
morphological and anatomical comparison, the LS selection had shorter leaf
lengths, narrower leaf widths and narrower leaf CSA than the HS selection.
Therefore, in LSS , the LS selection was estimated to be approximately 27 % less
resistant to shear than the HS selection per unit of cross-sectional area. The lower
LSS in the LS selection is due to the lower concentration of sclerenchyma tissues
in leaf CSA compared with the HS selection . The LSS declined as the leaf
emergence proceeded and this was associ ated with the changes in water
concentrations, although LSBL was not affected by the leaf emergence level nor by
aging level.
However, when the same dry weight of leaves of both selections are masticated by
animals, the difference in the total shear load required to breakdown the leaves to 1
x 1 mm particle size, namely, leaf IML between the selections will be influenced
by the differences in morphological characteristics of leaves between the two PRO
selections. In IML, the leaves of the LS selection were estimated lower than the
leaves of the HS selection by approximately 27 %, when both were grown under
the optimum climatic conditions .
The effects of reduced LSBL in PRO on actual breakdown during mastication in
sheep will be examined in the next chapter.
77

Chapter Three
THE EFFECTS OF REDUCED LEAF SHEAR BREAKING
L O A D IN P E R E N N I A L R Y E G R A S S UPON PAR T ICLE
BREAKDOWN DURING MASTICATION IN SHEEP
3.1 Introduction
Reduction of dietary particles to less than 1 mm in size is a prerequisite to passage.
Mastication, especially during rumination, i s considered the most important
process in dietary particle breakdown (Ulyatt, 1 983; Ulyatt et al. , 1986; Domingue
et al. , 1991a, 1 99 1b). The high physical strength of perennial ryegrass (PRG) is
believed to be as a major limiting factor to breakdown (Bailey, 1964; Troelsen et
al. , 1 964; Evans et al . , 1 97 3 ; B etteridge, et al . , 1986 ; Poppi et al. , 1 987;
MacKinnon et al., 1988; Easton, 1989; Waghorn et al., 1989; Hodgson, 1990).
This chapter, based on an experiment conducted in April and May 1990, compares
the actual breakdown during mastication in sheep fed two PRG selections selected
for low (LS) and high leaf shear breaking load (HS). Furthermore, the factors
which may influence breakdown of PRG during mastication are discussed.
3.2 Materials and Methods
Comparisons were made between the LS and HS PRG selections in efficiency of
mastication by sheep on particle breakdown in two trials. The efficiencies of I
chewing during eating and chewing during rumination on particle breakdown for
the two PRG selections were measured in trial 1 and trial 2, respectively. LS or HS
PRG selections were offered to eight rumen-fistulated wethers in a cross-over
design. Masticated materials were recovered from the rumen and particle analyses
were conducted. Jaw movements of the animals were recorded during mastication.
78

3.2. 1 Low and high leaf shear breaking load perennial ryegrass selections
The LS and HS PRG selections harvested in 1985 (see section 1 .4.2. 1 ) were sown
into separate 1 .5 ha halves of a 3.0 ha paddock located at DSIR's Tiritea Research
Area, Palmerston North in April 1 987. The paddocks were maintained as a pure
ryegrass sward . The two PRG selections were harvested from the paddocks at
09 :00 hours during the sampling periods. Dry matter concentrations were
determined daily by oven drying ( 105 °C) for 24 hours.
3.2.2 Experimental animals
Eight mature rumen-fistulated Romney wethers (mean live weight 53.4 kg ± 0.74
s.e.) were used. The animals were fitted with permanent rubber cannulae (65 mm
i.d.) . All the animals were housed individually in metabolism crates w ith an
automatic feeder attached.
3.2.3 Experimental design
3.2.3 . 1 Adjustment period
Chaffed lucerne hay was fed ad libitum to all the animals for five days to adjust
them to indoor conditions. The feed was placed upon the belts of the automatic
feeders which were set for continuous hourly feeding. Jaw harnesses, which
contained jaw movement sensors (see section 3.2.5) , were fitted on the animals and
left on for increasing periods of time until the animals became used to the
harnesses.
3.2.3.2 Voluntary feeding period
Following the adjustment period, freshly cut PRG, containing approximately 20 %
79

white clover (WC), was fed ad libitum to the animals to measure voluntary intake
for seven days . The PRG-WC was harvested in the mornings from grazing
paddocks at the Dairy Cattle Research Unit, Massey University. The PRG-WC
was placed upon the automatic feeders three times a day following storage under
refrigeration (approx. 4 °C). Refusals were collected and weighed for each animal
and dry matter contents of the fresh forages and refusals were determined daily by
oven drying ( 105 °C)Jor 24 hours . Daily dry matter intake for each animal was
recorded during the seven-day period.
3 .2.3.3 Trial periods
The animals were allocated into two groups so that the mean voluntary intake
levels were similar for the two groups. The animals received either the LS or HS
PRG selections in a cross-over design.
3.2.3.3. 1 Trial 1 : Efficiency of chewing during eating upon particle breakdown
Feeding level was restricted for each animal to 90 % of voluntary intake on dry
matter basis . The two PRG selections were placed upon the automatic feeders
three times a day and were fed to the animals for at least three days prior to the
sampling. The sampling was made daily on two animals in each treatment. The
animals were fitted with the jaw harnesses one day prior to the sampling day.
On each sampling day, the automatic feeders were stopped at 10 :00 hours and
drinking water and mineral salt blocks were removed from the animals. The rumen
contents were removed from the animals through the cannulae by manual bailing. I
After most of the contents were removed from the rumen, warm water was poured
into the rumen using a funnel and fine residues of rumen contents were flushed out
of the rumen several times until effluent water became clear. Test meals of 2 kg of
either freshly cut LS or HS PRG selections were then placed in the feed bins fitted
in front of the animals. The animals were allowed to ingest the test meals for a
80

period of 30 minutes. At the end of the 30-minute period, residues of the test
meals were removed from the feed bins and weights of the consumed test meals
were recorded. The boli present in the rumen were collected from the animals
through the cannulae. Subsamples of the boli recovered from the rumen were
taken for determination of p article s ize distribution. The rumen contents
previously removed were then returned to the animals. When the collections of
boli from the rumen were completed for all the animals, the feed treatments were
crossed over so that the animals received the other selection of PRG. The animals
were then given at least 3 days to adjust to the new treatments prior to another
sampling, and the sampling procedure was repeated.
An index of efficiency of chewing during eating ( <C.EAT>) (Ulyatt et al., 1 986;
Domingue et al. , 199 1b) in reducing particle size to less than 1 .0 mm for each
animals was calculated as;
g DM <1 .0 mm in boli <C.EAT> (%) = X 100
g DM test meal consumed.
3 .2 .3 .3 .2 Trial 2: Efficiency of chewing during rumination upon particle
breakdown
Following the completion of the above sampling period, the animals received
either LS or HS PRG selections for five days. Feeding level was restricted for each
animal to 90 % of voluntary intake on a dry matter basis. The sampling was made
on two animals in each treatment daily. The animals were fitted with the jaw
harnesses one day prior to the sampling day.
On each sampling day, the automatic feeders were stopped at 07 :30 hours. Test
meals of 4 kg of either freshly cut LS or HS PRG selections were placed into the
feed bins. The animals were allowed to ingest these for 3 hours until 10:30 hours.
At the end of the ingestion period, drinking water and mineral salt blocks were
removed from the animals and residues of the test meals were collected from the
8 1

feed bins and weights of the consumed test meals were recorded. The rumen
contents were then sampled, and again at 17:30 hours after the animals had been
left to ruminate for 7 hours. At each of the samplings, the rumen contents were
entirely removed from the rumen by manual bailing through the c annulae,
weighed, mixed thoroughly, subsampled for 1 kg fresh weight and the remainder
returned to the animals . The subsamples were analysed for dry m atter
concentration by oven drying ( 105 °C for 72 hours) and particle size distribution.
When the collections of the ruminated rumen contents were completed for all the
animals, the feed treatment was crossed over. After a four-day of feeding period,
the sampling procedure was repeated.
An index of efficiency of chewing during rumination (<C.RUM>) (Ulyatt et al.,
1986; Domingue et al. , 199 1b) in reducing particle size to less than 1 .0 mm for each
animal was calculated as;
where,
A - B <C.RUM> (%) = -- x 100
A
A; g DM > 1 .0 mm in rumen contents at 10:30 hours (rumen contents at 10:30
refers to the amount actually returned to the animals for rumination after
removal of the 1 kg fresh sample),
B; g DM > 1 .0 mm in rumen contents at 17 :30 hours.
The calculation is based on the assumption that feed particles larger than 1 .0 mm
cannot leave the rumen (Pappi et al., 1 980 Ulyatt 1983, Ulyatt et al. , 1 986;
Domingue et al. , 199 1a, Domingue et al., 199 1c). Hence, it was assumed that the
reduction of particles larger than 1 mm in rumen contents during the period of I 10:30 - 17:30 hours was due only to rumination, without any loss of particles larger
than 1 .0 mm flowing out of the rumen.
82

3.2.4 Recording of jaw movements
Jaw movements were recorded while the animals were ingesting (Trial 1 ) or
ruminating (Trial 2) the test meals. Jaw activities were obtained by sensing the
compression of a small rubber balloon held under the lower jaw by the harness
when the animal opened its j aw. The air pressure caused by compressing the
balloon was transmitted to a pressure transducer connected to a multi-channel
amplifying and recording unit (manufactured by Graphtech Corp., Japan). On the
recording unit, each time the balloon was compressed by the j aw a spike was
drawn on a chart paper travelling at constant speed of 1 mm/second. With this
system, any open-close types of jaw movements were recorded, regardless whether
the jaw movement was for actual mastication or not and regardless of the extent of
masticatory force applied. However, in the present study, each spike recorded on
the chart paper was defined as a jaw movement for actual mastication of the test
meals. Time spent for mastication was determined from the recorded chart and the
mastication rates were determined by counting 10 periods of 60 seconds for each
animal in each treatment.
3.2.5 Particle size analyses of rumen contents
This analysis was conducted using a wet sieving machine (manufactured by Turner
and Newall Ltd. , England) consisting of a cascade of rotating sieves of decreasing
square mesh sizes of 8.0, 4.0, 2.0, 1 .0 and 0.5 mm for the rumen content samples
collected in Trial 1 and mesh sizes of 4.0, 2.0, 1 .0, 0.5 and 0.25 mm for the rumen
content s amples collected in Trial 2. While in operation for 4 m inutes,
approximately 30 g wet weight of rumen contents were washed by recirculating
water ( 1600 ml, 4 1/min) through the sieves and additional agitation was provided I
by a stirrer for each sieve. Materials retained on the sieves were washed on to
tared filter paper and oven dried ( 105 °C for 24 hours) to determine the dry weight
of each particle size fraction. Particles retained on each sieve were assumed to be
larger than each sieve mesh size. Material that passed through all the sieves was
mixed and a 1000 ml aliquot taken, centrifuged at 850 G for 20 minutes and the
83

residue transferred to filter papers and dried as above. The quantity of material not
retained on sieves nor as residues, i.e. defined as solubles, was determined by
difference from the initial dry sample weight and the sum of recovered particulate
dry matter fractions.
3.2.6 Determination of the index of masticatory load of leaves
3.2.6. 1 Measurements of leaf morphology
During the two trial periods, fresh LS and HS PRG selections were sampled daily,
p ooled over the periods and stored in the deep freeze before taking any
measurements . Three hundred pieces of green leaf were then randomly
subsampled, regardless whether entire or part of a leaf, from each PRG selection.
Length and width at the midway point along the leaf piece were recorded on each
leaf. The 300 pieces of leaf were then oven-dried ( 105 °C for 24 hours) and
weighed to determine the average dry weight of a leaf piece.
3.2.6.2 Measurement of leaf shear breaking load and determination of index of
masticatory load
An Instron Food Testing Instrument (model 1 140, manufactured by Instron Ltd.,
England) fitted with Warner-Bratzler Meat Shear type blades (no. 2830-0 13,
manufactured by Instron Ltd . , England) was used to measure the leaf shear
breaking load (LSBL) . Drive speed was set for 80 mm/min. This assembly
provided graphic analog records of the translation of the force applied to the
blades. One hundred pieces of green leaf were randomly sampled, regardles s I
whether entire or part of a leaf, from each PRG selection on a day between Trial 1
and Trial 2. The leaves were gathered in bundles of 10 leaves each, aligned along
the midway point of the leaf piece length. Ten replicates of 10-leaf bundles for
each PRG selection were then sheared. The maximum force exerted divided by
number of leaf pieces sheared was determined as LSBL. The index of masticatory
84

load (IML) of leaf was then estimated for the two PRG selections as defined in
section 2.4.5.
3.2.7 Chemical analyses
The chemical analyses were performed for in vitro dry matter digestibility and total
nitrogen on each PRG selections pooled over Trial 2. The samples of both PRG
selections were freeze-dried and ground through a 1 mm mesh sieve. In vitro dry matter digestibility (IVDMD) was determined by the procedure described by
Roughan et al. ( 1 977) and total nitrogen (N) was determined by the Kjeldahal
procedure using a Kjeltec Auto 1030 Analyzer (manufactured by Tecator Ltd.,
Sweden).
3.2.8 Statistical analysis
Statistical analyses were performed by analysis of variance for a cross-over design.
GLM procedure of SAS (SAS inst. , Inc., NC., USA) was used for the analyses. An
example table of the analysis of variance is shown in Appendix 3 . 1 .
3.3 Results
3.3 . 1 Leaf morphology, leaf shear breaking loads and indices of masticatory load
of the low and high leaf shear breaking load perennial rye grass selections
Means of the leaf morphology, LSBL, leaf IML, IVDMD and concentration of I
total N of the LS and HS PRG selections are shown in Table 3 . 1 . The LS PRG
selection had approximately 19 % shorter (p<0.001 , ±4.02 s.e.d.) , 20 % narrower
(p<0.001 , ±0.05 s.e.d.) and 42 % lighter leaves than the leaves of the HS PRG
selection. Thus, in leaf length:dry weight ratio, the LS selection was
85

Tab l e 3 . 1 M e a n s of morpho lo gy , s hear breaki n g l o a d , i ndex of
masticatory l oad ( I ML), in vitro d ry matter d igestibi l ity ( IVD M D) and
concent rat ion of total n itrogen (N) of the leaves of the low (LS) and
high (HS) leaf shear breaking load perennial ryegrass selections.
Selection
LS HS
Morphology:
Length (mm) 1 31 . 1 1 61 .7
Width (mm) 2. 1 8 2.70
Dry weight (mg/leaf) 8 .0 1 3.7
Length:dry weight ratio (mm/mgDM) 1 6.4 1 1 .8
Shear breaking load(g/leaf) 507.6 71 0.5
IML (kg/mgDM) 8.32 8 .39
IVDMD (%) 76. 1 74.7
Total N (%) 3.74 3 .75
86

approximately 39 % greater than the HS selection. The LS selection had
approximately 29 % lower LSBL than the HS selection and thus, leaf IML was
e s timated as 8 . 3 2 and 8 . 39 kg/mgDM for the LS and HS PRO selections,
respectively. IVDMD and concentration of total N were similar for the two PRO
selections. Statistical analyses were not carried out for leaf weight, leaf length:dry
weight ratio, LSBL, leaf IML, IVDMD and total N concentration because leaves
were pooled to determine those parameters.
3.3.2 Trial 1
3.3.2. 1 Masticatory behaviour and efficiency of chewing in wethers during
eating the low and high breaking load perennial ryegrass selections
Table 3.2 shows the masticatory behaviour and <C.EA T> in wethers during eating
the test meals of the LS and HS selections. The amount of dry matter consumed
was similar for the two PRO selections, although the total number of chews for the
LS selection was approximately 1 8 % less (p<0.01 ) than for the HS selection. The
animals spent approximately 13 % less time chewing for the LS selection than for
the HS selection, but this difference was not statistically significant (p=0. 107).
Both PRO selections were similar in the chewing rate for time (no. chews/min.
eating), but in the chewing rate for ingestion (no. chews/gDM ingested), the LS
selections were approximately 1 8 % lower than the HS selection. The LS selection
was approximately 25 (ns) and 34 % (p=0. 1 35) higher than the HS selection in the
ingestion rate for time (gDM ingested/min. eating) and in the ingestion rate for
chewing (mgDM ingested/chew), respectively. There were no major differences
between the two PRO selections in <C.EAT> although <C.EAT> (%/chew) tended
to be higher for the LS PRO selection than the HS PRO selection (p=0. 1 06). I
Approximately 40 % of PRO was broken down to a size less than 1 mm during
eating for both PRO selections. Figure 3 . 1 shows decline of chews/min.eating in
the wethers for the LS and HS PRO selections. The time progression is expressed
in percentage of the total time spent eating because the time spent for chewing
varied for each animal.
87

Table 3.2 Mast icatory behavio u r and i ndex of efficiency of chewing
(<C.EAT>) in wethers ( n=8) dur ing eat ing the low (LS) and high (HS)
shear breaking l oad perennial ryegrass for a period of 30 minutes.
Selection Effect of selection
LS HS S . E.D .
Total dry matter consumed (g) 93.9 91 .8 ns 8.99
Time spent for chewing (min) 23.0 26.4 ns 1 .60
(p=0.07)
Recorded total number of chews 3245 3948 ** 1 1 2.3
Chewing rate :
(no . chews/min eating) 1 40.3 1 48.9 ns 5 .25
(no. chews/gDM ingested) 39.6 48.6 ns 8 .47
I ngestion rate:
(gDM ingested/min eating) 4.27 3 .41 ns 0 .70
(mgDM ingested/chew) 31 .3 23.3 ns 4.31 (p=0. 1 35)
<C.EAT>1
(%) 40.7 40.7 ns 2.51
(%/min eating) 1 .92 1 .60 ns 0 .236
(%/chew) 0 .0 14 0.01 1 ns 0 .0014 (p=0. 1 06 )
1 : (g OM < 1 .0 mm I g OM ingested) x 1 00.
88
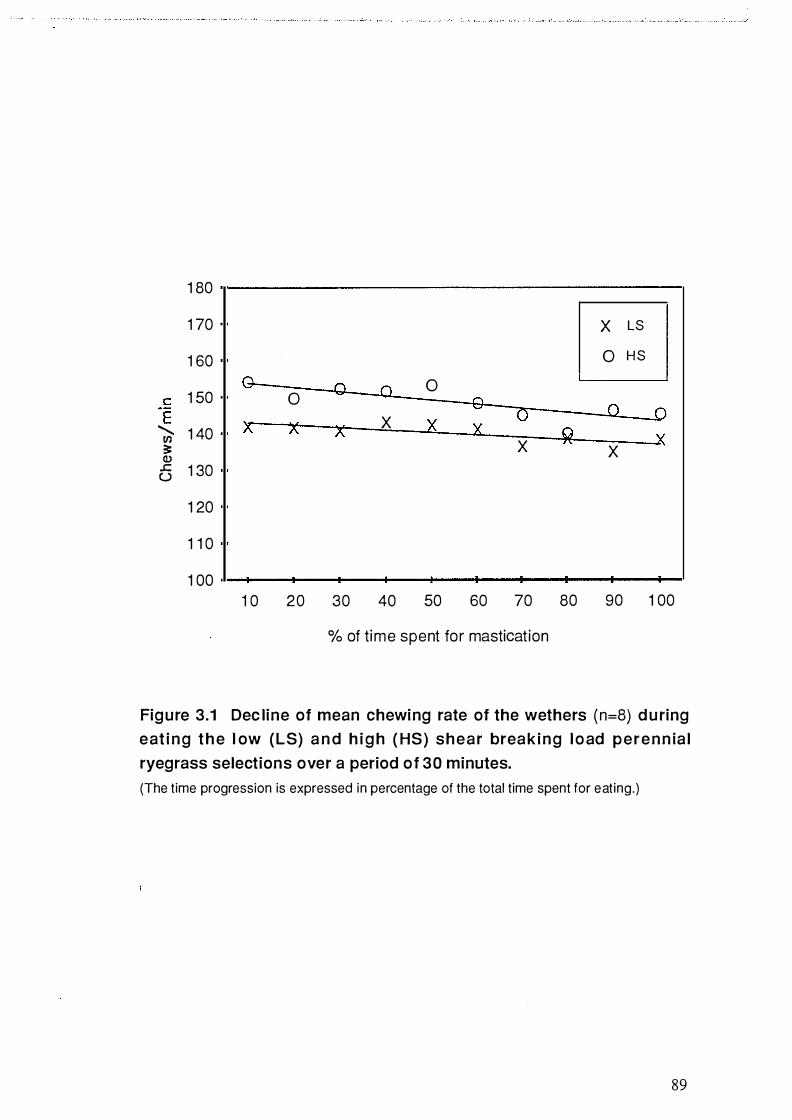
1 80
1 70 X LS
1 60 0 H S
G- 0 a 0 c: 1 50 0 8 E X 0 0 .D
............ 1 40 x- X X X X � tf) X }( 3: X Q) ..c: 1 30 u
1 20
1 1 0
1 00 1 0 20 30 40 50 60 70 80 90 1 00
% of time spent for mastication
Figure 3.1 Dec line of mean chewing rate of the wethers ( n=8) d u ring
eat i n g t h e l ow (LS) a n d h i g h ( HS) shear break ing l o ad perenn ia l
ryegrass selections over a period of 30 minutes.
(The time progression is expressed in percentage of the total time spent for eating.)
89

The number of chews/min.eating slightly declined with time for both PRG
selections (-0.067 and -0. 1 14 chews/% of total time spent P>0. 10 ±0.070 S .E.D. for
the LS and HS selections , respectively).
3 .3 .2.2 Particle size distributions in the rumen contents recovered from the
wethers immediately after ingesting the low and high leaf shear breaking
load perennial ryegrass selections
The particle size distributions in the rumen contents recovered from the wethers
immediately after ingesting the LS and HS PRG selections are shown in Figure 3.2.
There were no major differences in the particle size distribution in the rumen
contents for the two PRG selections. The proportion of particles larger than 1 mm
was the same for the two PRG selections (59.3 vs 59.3 % for the LS and HS PRG
selections, respectively).
3.3.3 Trial 2
3.3.3. 1 Rumen pool sizes of the wethers ruminating the low and high breaking
load perennial ryegrass selections
During the three-hour ingestion period (07:30- 10:30 hours) the animals ingested
363 and 4 1 6 g of dry matter (p>0. 1 0 ±3 1 . 3 S .E.D.) for the LS and HS PRG
selections, respectively.
Table 3.3 shows the rumen pool size at 10:30 and 17 :30 hours and the average rate I
of dry matter disappearance in the wethers ruminating the two PRG selections.
The values shown in the table for the rumen pool sizes at 10:30 hours are the
amounts actually returned to the rumen for rumination after removal of the 1 kg
fresh sample. The dry matter rumen pool size in wethers for the LS PRG selection
was approximately 10 % less than for the HS PRG selection at both times
90

40
30 Cl) > Cl) tfl c 0
"'0 Cl) 20 c 0 ....... Cl) \...
� 0 � 1 0
0
[;] s
* *
*
8.0 4.0 2.0 1 .0 0.5 Res , Sol 2 Sieve size (mm)
70
60
50
40
30
20
1 0
0 2: 1 .0 < 1 .0
Figure 3.2 Particle size d istributions in the rumen contents recovered
f rom the wethers ( n=8) immediately after ingesting the low (LS) and
h igh (HS) leaf shear breaking load perennial ryegrass selections.
1 : Residues. 2: Soluble DM defined as the OM remaining in solution after centrifugation at 850 G for 20 minutes.
9 1

Table 3.3 Rumen pool sizes at 1 0 :30 and 1 7 :30 hours and rate of d ry
matter d isappearan ce in the wethers ( n=8) ruminatin g low (LS) and
h igh (HS) leaf shear breaking load perennial ryegrass and their in vitro dry matter digestibil ities (IVDMD) and concentrations of total n itrogen
(N).
Rumen pool size (g) 1 :
At 1 0:30;
Fresh
Dry matter
DM particles> 1 .0 mm(2l
At 1 7:30;
Fresh
Dry matter
DM particles> 1 .0 mm(2l
Rate of dry matter disappearance from the rumen (%/h)3
LS
4466
432
1 55
2925
202
45
. 7.7
Selection
HS
4740
478
1 79
3068
223
48
7.6
Effect of selection
ns
ns
ns
ns
ns
ns
ns
1 : The amount actually returned for rumination after removal of the 1 kg fresh sample. 2: DM particles retained on sieves > 1 .0 mm mesh. 3: Determined for the period of 10 :30 - 1 7:30.
S.E.D.
1 41 .8
20.0
1 3.8
202.2
1 4.5
6.7
0 .44
92

measured, but the difference was not statistically significant (p>0. 10) . For both
PRG selections, dry matter pool size was reduced by approximately 53 % from
1 0:30 to 17 :30 hours. Thus, the rate of dry matter disappearance from the rumen
was similar for the two PRG selections.
3 .3.3.2 Masticatory behaviour and efficiency of chewing in wethers during
ruminating the low and high breaking load perennial rye grass selections
Table 3 .4 shows the masticatory behaviour and <C.RUM> in wethers during
ruminating the test meals of the LS and HS selections for a period of seven hours
( 10:30-17 :30) . There were no major differences between the two PRG selections
in the masticatory behaviour and in <C.RUM>. Approximately 70 % of PRG was
broken down to the size less than 1 mm during rumination in a period of seven
hours for both PRG selections.
3.3.3.3 Particle size distributions in the rumen contents recovered at 10:30 and
17 : 30 hours from the wethers ruminating the low and high leaf shear
breaking load perennial ryegrass selections
Particle size distributions in the rumen contents recovered at the two sampling
times from the wethers ruminating the LS and HS PRG selections are shown in
Figure 3 . 3 . There were no major s ignificant differences in the particle size
distribution in the rumen contents for the two PRG selections at both sampling
times. The proportion of particles larger than 1 mm were 36. 1 and 36.6 % at 10:30
hours and 22.6 and 2 1 .9 % at 17 :30 hours for the LS and HS PRG selections,
respectively. The proportion of particles larger than 4 mm were reduced
approximately 50 % for both PRG selections (36. 1 to 1 8.9 % and 36.6 to 2 1 .9 %
for the LS and HS PRG selections , respectively) however the proportion of
particles smaller than 0.5 mm but larger than 0.25 mm increased approximately 70
% ( 1 1 .3 to 1 8 . 9 % and 1 1 .9 to 20.4 % for the LS and HS PRO selections ,
respectively) from 10:30 to 17 :30 hours.
93

Table 3.4 Masticatory behaviour and index of efficiency of chewing
(<C.RUM>) in wethers ( n=8) during ruminating the low (LS) and high
(HS) shear breaking load perennial ryegrass for a period of 7 hours.1
Selection Effect of selection
LS HS S.E.D.
Rumen dry matter pool(g) 432 478 ns 1 9 .9
Dry matter ruminated (g)2 1 1 0 131 ns 1 0.3
Time spent for rumination (min) 1 31 .4 1 39.3 ns 8.73
Recorded total numbers of chews 1 5594 1 6274 ns 1 039.1
Chewing rate;
(no. chews/min rumination) 1 20.3 1 1 7.6 ns 2 .23
(no. chews/gDM ruminated)2 1 43.9 1 38.3 ns 6.62
Rumination rate;
(gDM ruminated/min rumination)2 0 .87 0.91 ns 0 . 1 97
(mgDM ruminated/chew)2 7.28 7.74 ns 0.483
<C.RUM>3
(%) 70.7 71 .5 ns 3 .33
(%/min rumination) 0.57 0 .53 ns 0.035
(%/chew) 0.0048 0.0046 ns 0.00030
1 : 1 0:30-1 7:30 hours. 2: DM ruminated (g) = gDM>1 .0 mm at 10 :30 hours - gDM>1 .0 mm at 1 7:30 hours. 3: (g DM>1 .0 mm at 1 0:30 hours - g DM>1 .0 mm at 1 7:30 hours)/ g DM>1 .0 mm at 10 :30 hours.
94

At 1 0 :30 hours 30�----------------------------.
25
20
1 5
Q) 1 0 > Q) tn 5 c 0
"'0 0 Q) c At 1 7 :30 hours B 30�----------------------------�
e :::! 25 0 � 20
1 5
1 0
5
0 4.0 2.0 1 .0 0.5 0 .25 Res1 Sol 2
Sieve size (mm)
.----------r 80
70
60
50
40 30
20
1 0
0
..-------:;:-""1'"-r 80
> 1 .0 < 1 .0
70
60
50
40
30
20
1 0
0
Figu re 3.3 Particle size distributions in the rumen contents recovered
at 1 0 :30 and 1 7 :30 hours from the wethers (n=8) ruminating the low
( LS) a n d h i g h (HS) l eaf s hear breaki n g l oad pere n n i a l ryeg rass
1 selections.
1 : Residues.
2: Soluble OM defined as the DM remaining in solution after centrifugation at 850 G for 20 minutes.
95

3.4 Discussion
3.4. 1 Effect of reduced leaf shear breaking load on the index of masticatory load
of leaves
Both PRG selections appeared to consist of mostly green leaves although determination of pasture
composition by manual dissection was not conducted. The effect of the selection for LS and HS on
LSBL in the present study (507.6 and 7 1 0.5 g/leaf for the LS and HS selections, respectively) was
not as large as those in the previous chapter, where the PRG selections were grown under the
optimum conditions (337 .5 and 5 7 3 . 9 g/leaf for the LS and HS s elections, respectively).
Additionally, there was a large difference in the leaf length:dry weight ratio between the two PRG
selection i .e. 16.4 and 1 1 .8 mm/mgDM for the LS and HS selections, respectively and thus, the
effect of selection on the leaf IML was almost nil in the present study. Because the Instron Food
Testing Instrument had slightly different shear blades and operating conditions from the Warner
Bratzler specifications and also the samples of leaf were not necessarily intact in the present study,
comparisons of other corresponding morphological parameters from the previous chapter are not
appropriate.
3.4.2 Effects of reduced leaf shear breaking load on particle size distribution in
the rumen contents
There were no major effects of reduced LSBL in PRG on the <C.EA T> ( 40.7 vs 40.7 % for the LS
and HS PRG selections, respectively) and on <C.RUM> (70.7 vs 7 1 .5 % for the LS and HS PRG
selections, respectively). The particle size distributions in the rumen contents were similar for the
two PRG selections in both trials. The ingestion rates during eating tended to be higher for the LS
PRG selection than for the HS PRG selection (4.3 vs 3.4 gDM/min eating and 3 1 .3 vs 23.3 mgDM
ingested/chew for LS and HS selections, respectively). Total eating and ruminating times during a
complete 24-hour period were not measured in the present trial. However, in a previous study
(Inoue et al., 1989), when feed intake was high, sheep consumed significantly more the LS PRG
selection than the HS PRG selection (102 vs 86 g/kg0·75/d). Although ingestion rates were similar
(259 vs 225 min/kgDM, for the LS and HS PRG selection, respectively) sheep fed the LS PRG
selection spent more time eating during the day than for HS PRG selection (38 1 vs 279 min/d).
Sheep fed LS PRG selection ruminated at a lower rumination rate than for HS PRG selection (426
vs 542 min/kgDM/d) . Total time spent for rumination during a day was similar for both PRG
selections (626 vs 672 min, for LS and HS PRG selections, respectively). In the present study,
however, masticatory behaviour during rumination was similar for the two PRG selections. Ulyatt
et al. ( 1 986) reported similar observations where ingestion rates in sheep were 4. 1 and 1 1 . 1
gDM/min eating respectively for PRG and red clover and proportions of particles less than 1 mm in
boli were 48.6 and 5 1 .6 for PRG and red clover, respectively.
96

Kennedy ( 1985) also observed in sheep proportions of large particles
in chewed boli collected from oesophageal fistulas were not greatly different
among four different chopped forage diets. This indicates that animals continue to
chew the �(':_eds regardless of their physical and morphological properties until a
certain particle size distribution is reached. Thus, the physical and morphological
properties of feeds will not alter particle size distribution in masticated rumen
contents but will alter ingestion rate. Perhaps, tactile stimulation by dietary
particles are largely involved in masticatory behaviour.
3.4.3 Influence of index of masticatory load on masticatory efficiency
The masticatory mechanism is a complex �}'_stem, which has perceptual skills i. e. the
ability of subjects to detect the size of objects and the forces applied to the teeth
(Kawamura et al. , 1 960; M<j>ller, 1966; Bowman et al., 1968). Bigland et al.
(1954) and Podolsky et al. (1980) demonstrated an inverse relationship between
force and velocity in muscle contraction. This implies that when a greater bite
force is required the m&sticatory muscles must contract more strongly in each
chewing and this may result in slow jaw movement and thus, lower chewing rate.
If this is true, the relationship between physical resistance of PRG leaves to
breakdown and theoretical efficiency of chewing <TEC> is given by;
1 <TEC> (mgDM broken into 1 mm particles /chew) = f x -
IML
and,
1 <TEC> (mgDM broken into 1 mm particles I min) = f x k x -
IML
where,
f (kg) = mean bite force per chew at chewing rate of k (chews/min).
97

Therefore, IML is a determining factor of the efficiency of mastication. A previous
study (John et al., 1989) showed that a difference in LSBL between the LS and HS
PRO selection was maintained after incubation in the rumen of cows for at least 24
hours. This suggests that IML influences masticatory efficiency during rumination
as well as during ingestion for at least up 24 hours after ingesting PRO.
Rhythmical contractions of the masticatory muscles during chewing are inherently
controlled by an oscillating system located within the animal's brain stem (Dellow
et al. , 1 97 1 ; Phyllips et al. , 1 973) and chewing rates are constant within each
animal species (Hiiemae, 1978). Ulyatt et al. (1986) reported that chewing rates
did not greatly differ among animals eating three different fresh forages and two
different hays . This suggests that animals chew at a certain chewing rate
regardless the properties of the feeds. Similar chewing rate for the two PRO
selections in the present study supports this. It is possible to speculate that animals
may regulate amount of feed to chew (i.e. ingestion and rumination rates) in each
chewing stroke to equalize the breaking load of feed to a constant bite force
exerted, so that the animals maintain a certain chewing rate. Figure 3.4 shows a
model of a relationship between efficiency of particle breakdown and IML of PRO.
In the present study, number of chews/gDM tended to be lower for the LS PRO
selection than for the HS PRO selection although IML and chewing rate during
eating (no. chews/min) were similar for the two PRO selections. This is probably
due to narrower (20 %, p<0.001) leaf width for the LS PRO selection thus, fewer
chews were required to cut the leaf parallel to the sclerenchyma fibres. Although
the load to break the leaf in this direction is estimated to be small (0. 142 x 1 0 7
kg/m2, Young' s modulus in tension; Vincent, 1982), IML might have been altered
if this breaking load could have been taken into account.
3.4.4 Particle breakdown during rumination
Consumption and dry matter pool size for the LS PRO selection were
approximately 13 and 10 %, respectively, lower than for the HS PRO selection at
98

oscillator in brain ste m
constant Chewing rate, k (chews/min)
Inverse relationship
I '
FORCE INPUT - co nstant : Bite force, f (kg)
equal ' ' PRG having total
FEED INPUT load of f (kg)
required to breakdown
'
Feed supply to occlusion
r-- f
I ML (mg DM)
• Regulation of feed supply Manipulation by tongue
t + feed PRG
IN EACH CHEW
...... f
,... I ML m gD M
of PRG
broken down to 1 mm
particles
OUT PUT
Figure 3.4 A model of a relationship between eff iciency of part icle
breakdown and index of masticatory load (IML) of perennial ryegrass.
99
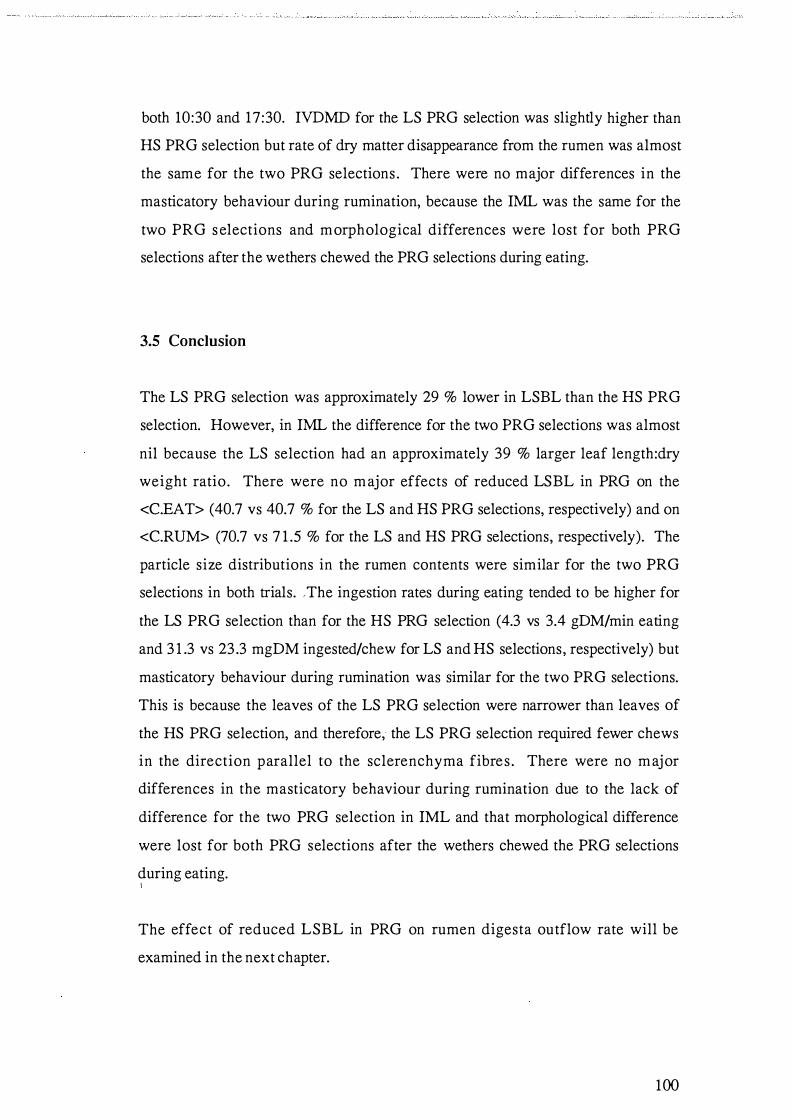
both 10:30 and 17:30. IVDMD for the LS PRG selection was slightly higher than
HS PRG selection but rate of dry matter disappearance from the rumen was almost
the same for the two PRG selections . There were no major differences in the
masticatory behaviour during rumination, because the IML was the same for the
two PRG selections and morphological differences were lost for both PRG
selections after the wethers chewed the PRG selections during eating.
3.5 Conclusion
The LS PRG selection was approximately 29 % lower in LSBL than the HS PRG
selection. However, in IML the difference for the two PRG selections was almost
nil because the LS selection had an approximately 39 % larger leaf length:dry
weight ratio. There were no major effects of reduced LSBL in PRG on the
<C.EAT> (40.7 vs 40.7 % for the LS and HS PRG selections, respectively) and on
<C.RUM> (70.7 vs 7 1 .5 % for the LS and HS PRG selections, respectively). The
particle size distributions in the rumen contents were similar for the two PRG
selections in both trials. , The ingestion rates during eating tended to be higher for
the LS PRG selection than for the HS PRG selection (4.3 vs 3.4 gDM/min eating
and 3 1 .3 vs 23 .3 mgDM ingested/chew for LS and HS selections, respectively) but
masticatory behaviour during rumination was similar for the two PRG selections.
This is because the leaves of the LS PRG selection were narrower than leaves of
the HS PRG selection, and therefore, the LS PRG selection required fewer chews
in the direction parallel to the sclerenchyma fibres . There were no major
differences in the masticatory behaviour during rumination due to the lack of
difference for the two PRG selection in IML and that morphological difference
were lost for both PRG selections after the wethers chewed the PRG selections
during eating. I
The effect of reduced LSBL in PRG on rumen digesta outflow rate will be
examined in the next chapter.
100

Chapter Four
THE EFFECTS OF REDUCED LEAF SHEAR BREAKING
LOAD IN PERENNIAL RYEGRASS UPON
RUMEN DIGEST A OUTFLOW RATE AND
APPARENT DIGESTIBILITY IN SHEEP
4.1 Introduction
Prolonged retention of digesta in the rumen of forage-fed animals can reduce
voluntary intake and feeding value (Thornton et al. , 1 973) . Black et al. ( 1982),
using computer simulations, suggested that slow degradation and rumen digesta
fractional outflow rates (FOR) were principal factors causing long rumen retention
times and reduced voluntary intakes in sheep fed perennial ryegrass (PRG). FOR
is likely to be influenced by the rates of particle size reduction through chewing
and rumination (Black et al. , 1982; Ulyatt et al, 1986; Poppi et al., 1987). This
chapter, based on an experiment conducted in April and May 1988, investigates the
effects of reduced leaf shear breaking load (LSBL) in PRO on rumen FOR and
apparent digestibilities in sheep fed at restricted feed intake levels.
4.2 Materials and Methods
Two PRO selections selected for low (LS) and high leaf shear breaking load (HS)
were fed to a total of eight rumen-fistulated wethers in a cross-over design. The
feeding level was restricted to 90 % of dry matter voluntary intake. FOR was I
measured by the inert ruthenium-phenanthroline/chromium-
ethylenediaminetetraacetic acid dual-phase marker infusion technique and also by
lignin as a particulate marker. Total faecal collections were made to determine the
apparent digestibilities for the two PRG selections.
101

4.2.1 Low and high leaf shear breaking load perennial ryegrass selections
The LS and HS PRG selections harvested in 1985 (see section 1 .4.2. 1 ) were sown
into separate 0.25 ha halves of a 0.5 ha paddock located at DSIR, Palmerston North
in April 1987. The paddocks were maintained as a pure ryegrass sward . The two
PRG selections were harvested from the paddocks at 09:00 hours daily during the
trial period. Dry matter concentrations were determined daily by oven drying (105
C0) for 24 hours.
4.2.2 Experimental animals
Eight mature rumen-fistulated Romney wethers (mean live weight 7 1 .0 kg ± 0.23
s.e.) were used. The animals were fitted with permanent rubber cannulae (65 mm
i.d.) . All the animals were housed individually in metabolism crates with an
automatic feeder attached.
4.2.3 Experimental design
4.2.3 .1 Adjustment period
Chaffed lucerne hay was fed to all the animals for seven days to adjust them to the
indoor conditions. The feed was placed upon the belts of the automatic feeders
which were set for continuous hourly feeding.
4.2.3.2 Voluntary feeding period
Following the adjustment period, freshly cut PRG, containing approximately 20 %
white clover (WC), was fed to the animals to measure voluntary intakes for seven
days. The PRG-WC was harvested at 09:00 hours from the grazing paddocks at
DSIR, Palmerston North. PRG-WC was placed upon the automatic feeder two
102

times a day following storage under refrigeration (approx, 4 eo) . Refusals were
weighed daily before the new forage was fed to the animals. Dry m atter
concentrations of the fresh forage and refusals were determined daily by oven
drying ( 105 oe for 24 hours). Daily dry matter intakes were recorded for each
animal during the seven-day period.
4.2.3.3 Trial period
The animals were allocated into two groups so that the mean voluntary intake
levels were similar for the two groups. The animals received either freshly cut LS
or HS PRO selection during the two 12-day feeding periods in a cross-over design.
Feeding level for each animal was restricted to 90 % of voluntary dry matter intake
measured during the voluntary feeding period. The PRG selections were placed
upon the automatic feeders two times a day ( 1 1 :00 and 23 :00 hours) following
storage under refrigeration (approx. 4 e0).
4.2.3.3 . 1 Determination of rumen digesta outflow rate
The inert particulate-phase marker ruthenium tris (1 , 10-phenanthroline) ruthenium
(II) chloride (Ru-phen) (MacRae et al., 1974; Evans et al., 1977) was prepared by
the procedure described by Tan et al. ( 1 97 1 ) with a concentration of 99. 6 mg
Ru/kg o f m arker so lu t ion . The inert l iquid-phase m arker, c hromium
ethylenediaminetetraacetic acid (er-EDTA) (Faichney, 1975) was prepared by the
procedure described by Binnerts et al. ( 1 968) with a concentration of 4000 mg
er/kg of marker solution. The Ru-Phen and er-EDTA markers were then
combined in equal volumes to make a dual-phase (Ru-er) marker solution. I
During the last 6 days of each 12-day feeding period, the Ru-er marker was
infused into the rumen at a mean rate of 13 and 537 mg/day, for Ru and er
respectively. At the end of each feeding period, entire rumen contents were
removed, weighed, mixed thoroughly, samples taken for dr)r matter concentration,
103

p article s ize and m arker analyses and the contents returned. Dry m atter
concentrations of rumen contents were determined by oven-drying ( 105 °C for 72
hours).
FOR for the particulate phase and liquid-phase were estimated as the proportion of
the total rumen contents leaving from the rumen per unit time (Faichney, 1975) i.e.
and
Infusion rate of Cr (mg!h) FOR for liquid-phase (%/h) = x 100
Total Cr (mg) in rumen
Infusion rate of Ru (mg!h) FOR for particulate-phase (%/h) = x 100
Total Ru (mg) in rumen
Faeces lignin output (mg!h) = X 100
Rumen lignin pool size.
Mean rumen digesta retention times (MRT) were calculated as the reciprocal of
their respective FOR. Particle size analyses was conducted as described in section
3.2.6 using sieves of 4.0, 2.0, 1 .0, 0.5 and 0.25 mm mesh sizes.
4.2.3 .3.2 Determination of apparent digestibilities
Total faecal collections were made on the last 6 days of each feeding period using I
faecal collection bags fitted to the animals. Prior to the faecal collections , the
faecal collection bags were fitted to the animals and left on for increasing periods
of time so that the animals became used to the bags. Faeces from each animal were
weighed daily, pooled over each feeding period and stored in the deep freeze
(approx. -20 C0). They were later thoroughly mixed, subsampled, freeze-dried and
104
ground through a 1 mm sieve for chemical analyses. During the faecal collection
period, feed refusals in feeding bins and under-crate residues were collected and
weighed daily for each animal. Determinations of dry matter concentrations were
made daily by oven-drying (105 oe for 24 hours) for the PRG offered, refusals in
feeding bins and under crates residues. Samples of the two PRG selections and
refusals were pooled over each digestion trial period and stored in the deep freeze
(approx. -20 eo). They were later thoroughly mixed, subsampled, freeze-dried and
ground through a 1 mm mesh sieve for chemical analyses. On the last day of the
each feeding period, rumen fluid was sampled through the fistulae for pH,
ammonia and volatile fatty acid (VFA) analyses.
4.2.4 Determination of the index of masticatory load of leaves
4.2.4. 1 Measurements of leaf morphology
During the last 6 days of each feeding period the fresh LS and HS PRG selection
were sampled, pooled oyer each period and s tored in the deep freeze (-20 eo)
before taking any measurements. One hundred and fifty pieces of green leaf were
randomly subsampled from each PRG selection, regardless whether entire or part
of a leaf. Length and width at the midway point along the leaf length were
recorded on each piece of leaf. The 1 50 pieces of leaf were then pooled, oven
dried (105 oe for 24 hours) and weighed to determine the average dry weight of a
leaf piece. Approximately 1 50 g of fresh subsample of each PRG selection was
dissected manually into green grass and dead material fractions. These dissected
fractions were oven-dried (105 eo for 24 hours) and then weighed to determine the
composition of each PRG selection.
4.2.4.2 Measurement of leaf shear breaking load of leaf
An Instron Food Testing Instrument (model 1 140, manufactured by Instron Ltd.,
England) fitted with Warner-Bratzler Meat Shear type blades (no. 2830-0 1 3,
105

manufactured by Instron Ltd. , England) was used to measure the LSBL. Drive
speed was set for 80 mm/min. One hundred pieces of green leaf were randomly
sampled from both PRG selections on a day between the two 1 2-day feeding
periods regardless whether entire or part of a leaf. The leaves were gathered in
bundles of 10 leaves each, aligned along the midway of the leaf piece length. Ten
replicates of 10-leaf bundles for each PRG selection were then sheared. The
m aximum force exerted divided by the number of leaf pieces sheared was
determined as LSBL. The index of masticatory load (IML) of leaf was then
estimated for the two PRG selections as defined in section 2.4.5.
4.2.5 Chemical analyses
For the marker analyses, rumen contents were freeze-dried, and ground through a
0.5 mm mesh sieve. Five grams of the ground samples were compressed into self
supporting disks. The disks were analysed for concentrations of Ru and Cr by X
ray fluorescence spectrometry at Victoria University, New Zealand using a Philips
RW1404 Automatic Sequential X-ray fluorescence Spectrometer (manufactured by
Philips Ltd., Netherlands) (Evans et al. , 1 977). Chemical analyses were performed
on faeces, PRG offered and refusals, for total nitrogen by the Kjeldahal procedure
using a Kjeltec Auto 1 030 Analyzer (manufactured by Tecator Ltd. , Sweden),
concentrations of acid detergent fibre (ADP), neutral detergent fibre (NDF), lignin
(Robertson et al. , 1 9 8 1 ) and organic matter by ashing overnight at 550 °C.
Cellulose and hemi-cellulose concentrations were determined by subtracting the
concentration of lignin from ADP concentration and ADP concentration from NDF
concentration, respectively. The pH of the rumen fluid was determined
immediately after the s ampling on a pH meter (PHM6 1 , manufactured by
Radiometer Ltd., Denmark). The samples of rumen fluid were deproteinised and
analysed for ammonia-N (�-N) by steam distillation on the Kjeltec Auto 1030
Analyzer (manufactured by Tecator Ltd., Sweden). VFA in the samples of rumen
fluid were analysed by gas-liquid chromatography (Shimadzu Gas Chromatograph
GC-8A, Shimadzu Ltd. , Japan).
106

4.2.6 Statistical analyses
S tatistical analyses were performed by the analysis of variance for a cross-over
design. OLM procedure of SAS (SAS Inst. , Inc. , NC., USA) was used for the
analyses.
4.3 Results
4.3 . 1 Leaf morphology, leaf shear breaking load, index of masticatory load and
chemical composition of the low and high shear breaking load perennial
ryegrass selections
Means of leaf morphology, LSBL and IML for the two PRO selections are shown
in Table 4. 1 . The leaves of the LS PRO selection were approximately 1 3 %
shorter (p<0.001 , ±7.83 s .e.d.), 1 9 % narrower (p<0.001 , ±0. 10 s .e.d.) and were 40
% lighter than the leaves of the HS PRO selection. Thus, in leaf length:dry weight
ratio, the LS selection was approximately 46 % higher than the HS selection.
LSBL for the LS PRO selection was approximately 39 % lower than that for the
HS PRO selection and thus, IML for the LS PRO selection was estimated as
approximately 12 % lower than for the HS PRO selection. Statistical analyses
were not carried out for dry weight, breaking load and estimated IML of the leaves
because the leaves were pooled to determined those parameters.
Concentrations of dry matter, organic matter, total nitrogen and cell -wall
constituents are shown in Table 4.2. The LS and HS PRO selections offered to the
animals contained approximately 25.9 and 20.0 % of dead matter, respectively.
The concentrations of dry matter, organic matter, total nitrogen, lignin and hemi-:
cellulose were all similar for both PRO selections except cellulose concentration,
which was approximately 12 % lower for the LS POR selection than the HS PRO
selection.
107

Table 4.1 Means of morpho logy, shear breaking l oad and index of
masticatory load {IML) of the leaves of the low {LS) and high {HS) leaf
shear breaking load perennial ryegrass selections.
Selection
LS HS
Morphology:
Length (mm) 238.0 273 .6
Width (mm) 2.81 3 .51
Dry weight (mg/leaf) 20.7 34.5
Length :dry weight ratio (mm/mgDM) 1 1 .5 7.9
Shear breaking load (g/leaf) 693.2 1 1 41 .7
IML (kg/mgDM) 7.98 9.05
108

Table 4.2. Concentrations of dry matter, organic matter, total nitrogen
and cel l-wal l constituents of the l ow ( LS) and h igh (HS) leaf shear
breaking load perennial ryegrass offered to the animals.
Selection
LS H S
Dry matter (%) 1 8 .7 1 9 . 0
Organic matter (% OM) 87.9 88. 1
Total nitrogen (% OM) 3.36 3 .35
Lignin (% OM) 1 .76 1 .74
Cellulose (% OM) 1 7.8 20.2
Hemi-cellulose (%DM) 26.0 23 .9
109

4.3.2 Rumen pool size, rumen digesta fractional outflow rates, rumen digesta
retention times and particle size distribution in rumen contents in wethers
fed on the low and high leaf shear breaking load perennial ryegrass
selections
Mean daily dry matter intake in wethers during the last 6 days of feeding period
was 1 1 14 and 1 1 1 8 g for the LS and HS PRO selections, respectively. Rumen pool
sizes in wethers fed on the LS and HS PRO selections are shown in Table 4.3 . The
LS PRO were approximately 16 (p<0.05), 1 6 (p<O. lO) and 13 % higher than the
HS PRO in liquid pool size, total rumen pool size and in dry matter pool size,
respectively.
The FOR and MRT for liquid-phase and particulate-phase of rumen digesta in
wethers fed on the LS and HS PRO selections are shown in Table 4.4. No major
differences occurred in FOR and MRT for the two PRO selections.
Particle size distributions in rumen contents in wethers fed on the LS and HS PRO
selections are shown in Figure 4. 1 . There were no major differences in particle
size distribution in rumen contents between the two PRO selections . The
proportion of particles smaller than 1 mm was almost 80 % for both PRO selections .
4.3.3 Apparent digestibilities, concentrations of VFA and NH3-N in rumen
contents in wethers fed on the low and high shear breaking load perennial
ryegrass selections
Table 4. 5 shows apparent digestibilities of dry matter, organic matter, total
nitrogen and cell-wall constituents in wethers fed on the LS and HS PRO I
selections. The apparent digestibilities of dry matter, organic matter, total nitrogen
and hemi-cellulose were similar for the LS and HS PRO selections . Apparent
cellulose digestibility was approximately 1 6 % (p<0.01 ) lower for the LS PRO
selections than for the HS PRO selections. Although the apparent digestibility of
lignin showed negative ,values for both PRO selections due to artifact lignin in the
1 10

faeces analysed, it was also lower (p<0.05) for the LS PRG selection than for the
HS PRG selection.
Concentrations and proportions of VFA, concentration of �-N and pH in the
rumen fluid in wethers fed on the LS and HS PRG selections are shown in Table
4.6 . There were no major differences in those parameters for the two PRG
selections.
1 1 1

Table 4.3 Total and dry matter rumen pool sizes in wethers (n=8} fed
o n the l o w ( LS) and h i g h (HS) l eaf s h ea r breakin g l oad peren n ial
ryegrass selections.
Selection Effect of selection
LS HS S.E.D.
Total rumen pool size (g) 5809 5005 ns 330.7
Dry matter rumen pool size (g) 567.2 504.2 ns 34.68
Liquid pool size (g) 5241 4501 * 300.9
1 12

Table 4.4 R u men d igesta fractional o utflow rates (FOR) and rumen
d igesta mean retention times ( MRT) for l iquid-phase and particulate-
phase i n wethers (n=8) fed on the l ow (LS) a nd high (HS) leaf shear
breaking load perennial ryegrass selections.
Selection Effect of selection
LS HS S .E .D.
FOR (%/h) :
Liquid-phase 1 1 .2 1 1 .8 ns 0.62
Particulate-phase
(based on Ru) 6.4 6.6 ns 0 .38
(based o n l ignin) 5.2 6 . 1 ns 0.68
M RT (h) :
Liquid-phase 9 . 1 8 .7 ns 0.45
Particulate-phase
{based on Ru) 1 6.4 1 6.2 ns 1 . 1 5
(based o n l ignin) 1 9 .6 20.2 ns 2.76
1 13

40 90
30 B 80
70 s
Q) > 60 Q) 1/) c: 0 50
""0 Q) 20 c: 0 40 ...... Q) \...
� 30 a � 1 0 * * * * 20
1 0
0 0 4.0 2.0 1 .0 0.5 0 .25 Res, Sol 2 > 1 .0 < 1 .0
Sieve size (mm)
F igure 4.1 Particle size d istributio ns in rumen contents in wethers
( n=8) fed o n the l o w (LS) and h i g h (HS) l eaf shear brea k i n g load
perennial ryegrass selectio ns.
1 : Residues. 2: Soluble OM defined as the OM remaining in solution after centrifugation at 850 G for 20 minutes.
1 14

Table 4 .5 Appa rent d igest ibi l ities (%) of d ry matter, o rganic matter,
tota l nitrogen and cel l -wal l constituents in wethers (n=8) fed o n the
low (LS) and h igh (HS) leaf shear breaking l oad perennial rye grass
selections.
Selection Effect of selection
LS HS S. E.D.
Dry matter 68.8 70.3 ns 0 .84
O rganic matter 70.3 71 .8 ns 0 .86
Total n itrogen 74.9 75.6 ns 0 .73
Lignin -1 7.9 -7.2 * 0 . 65
Cel lu lose 66.3 78.5 * * 2.62
Hemi-ce l lu lose 68.2 65.6 ns 2.74
1 15
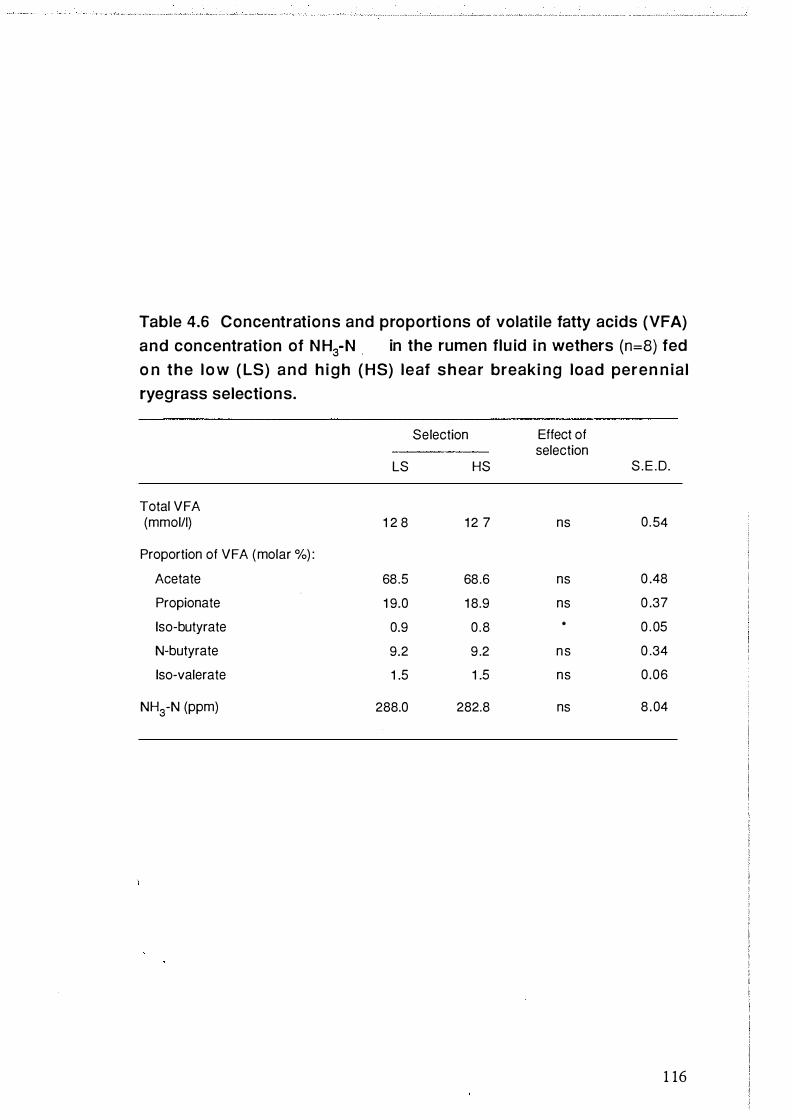
Table 4.6 Concentrations and proportions of volati le fatty acids (VFA)
and concentration of N H3-N . in the rumen flu id in wethers (n=B) fed
o n the l o w ( LS) and h i g h (HS) leaf s h ear breaki ng load peren n ia l
ryegrass selections.
Selection Effect of selection
LS HS S .E .D.
Total VFA (mmol/1) 1 2 8 1 2 7 ns 0.54
Proportion of VFA (molar %) :
Acetate 68.5 68.6 ns 0 .48
Propionate 1 9.0 1 8.9 ns 0 .37
!so-butyrate 0.9 0 .8 * 0 .05
N-butyrate 9.2 9 .2 ns 0 .34
!so-valerate 1 .5 1 .5 ns 0 .06
NH3-N (ppm) 288.0 282.8 ns 8 .04
1 16

4.4 Discussion
The LS PRG selection was considerably (39 %) lower in LSBL than the HS PRG
selection. However this selection effect was somewhat decreased in IML ( 12 %)
because the LS PRG selection was approximately 46 % higher in leaf length:dry
weight ratio than the HS PRG selection. The lack of major effects of reduced
LSBL in PRG on FOR, rumen pool sizes and particle size distribution in the rumen
contents may be explained by this relatively small effect of PRG selection in IML
and the considerably low feed intake level (approx. 50 gDM!kg0·75) in the present
study.
The FOR ' s based on lignin were s lightly lower than FOR ' s based on Ru.
Domingue et al. ( 199 1c) observed a similar relationship between FOR's based on
lignin and on Ru-Phen in goats, sheep and deer. FOR based on lignin is believed
to be more accurate on the assumption that there was minimal post-rumina!
degradation of lignin (Faichney, 1980).
The LS PRG selection }}ad a higher concentration of hemi-cellulose but lower
concentration of cellulose than the HS PRG selection. This agrees with the results
in chapter two, except for the lignin concentration, in which the LS PRG was
similar to the HS PRG selection in the present study. The apparent digestibility of
cellulose for the LS PRG selection was approximately 16 % lower than the HS
PRG selection. Factors which could influence fibre digestive efficiency include
rumen pool size, FOR, particle size dis tribution and rumen environment
(Domingue et al., 1991b). In the present study, however, there were no differences
for the two PRG selections in these factors. The rumen microorganisms enter the
chewd plant tissues, via c·ut and damaged surfaces (Akin, 1976, 1979; Elliott et al. ,
1 985). The LS PRG leaves were approximately 19 % narrower and 13 % shorter I
than these of the HS PRG selection. After both PRG leaves are broken down to the
same particle size distribution, particles of the LS PRG leaves must have fewer
chewed surfaces than the particles of the HS PRG leaves. Therefore, less damaged
surfaces were available for microorganisms to enter for the LS PRG selection than
for the HS selection and thus, lower cellulose digestibility might occur. This
1 17

assumption agrees with the observation in chapter three in which a fewer number
of chews were required for the LS PRG than for the HS PRG selection. This
implies that leaf morphology in PRG may affect the efficiency o f fibre
digestibility.
Lignin also appeared less digestible for the LS PRG selection. The greater
concentration of this lignin, if associated with the cellulose component of the
sclerenchyma, could account for the reduced cellulose digestibility of the LS PRG
selection.
4.5 Conclusion
The LS PRG selection was approximately 39 % lower than the HS PRG selection
in LSBL. When expressed as IML, the LS PRG selection remained approximately
1 2 % lower than the HS PRG selection. However, there were no effects of reduced
LSBL on FOR, rumen pool s izes and particle size distribution. This m ay be
associated with relatively small selection effect of PRG in IML and low feed intake
level. The cellulose fraction for the LS PRG selection was digested approximately
1 6 % less than that for the HS selection. The LS PRG leaves were approximately
1 9 % narrower than the HS PRG leaves. When the forages were broken down to
the same particle size distribution, the LS PRG leaves would have less damaged
surfaces available for the rumen microorganisms to enter. The leaf morphology in
PRG may affect the efficiency of fibre digestibility.
1 1 8

Chapter Five
THE EFFECTS OF REDUCED LEAF BREAKING LOAD IN
P E R E N N I A L R Y E G R A S S U P O N R U M E N D I G E S T A
O UTFL O W R A TE S , V O L UNTA R Y FEED INTAKE, LIVE
WEIGHT GAIN AND WOOL PRODUCTION
IN GRAZING SHEEP
5.1 Introduction
Slow rumen fractional outflow rate (FOR) is a major factor causing long mean
rumen digesta retention time (MRT) and reduced feed intake, thus, reduced feeding
value (FV) of perennial ryegrass (PRG) (Black et al., 1982) . The rate at which
dietary particles reduce in size influences MRT (Black et al. , 1982; Ulyatt et al.,
1986 ; Poppi et al. , 1 987). Reduction of the dietary particle size is achieved
predominantly by mastication. Reducing the physical resistance is believed to be a
key fac tor to increase efficiency of breaking down the ingested forage by
mastication (Bailey, 1964; Waghorn et al. , 1989; McLeod et a/., 1989; Hodgson
1990) Increased efficiency of masticatory break down of forage can lead to faster
rumen fractional outflow rates (FOR). Improved FOR can achieve increased feed
intake and increased nutritive efficiency in the small intestine, thus, improved FV.
Two trials were conducted in summer 1988 (Trial 1) and in summer 1989 (Trial 2)
to test the hypothesis that reduced leaf shear breaking load (LSBL) in PRG
improves FOR and leads to higher voluntary feed intake, and hence achieves
improved live weight gain and wool production.
5.2 Materials and Methods
Trial 1 measured FOR, live weight gain and wool production in sheep grazing
either the LS or HS PRG selections. FOR was measured in rumen-fistulated
1 19

wethers by the inert ruthenium-phenanthroline/chromium
ethylenediaminetetraacetic acid (Ru-Cr) dual-phase marker infusion technique.
Live weight gain and wool production were measured in autumn-born lambs
grazing the two types of PRG selections in spring. The schematic presentation of
the experimental design of this trial is shown in Table 5.1 (p. 125). Trial 2 also
measured FOR, live weight gain and voluntary organic matter intake (VOMI) in
sheep grazing either the LS and HS PRG selections . FOR and VOMI in rumen
fistulated wethers were measured by the ruthenium-phenanthroline/cobalt
ethylenediaminetetraacetic acid (Ru-Co) dual-phase marker infusion technique.
Measurements of live weight gain were made in one-year-old ewe-hoggets. The
chromium sesquioxide (Cr203) marker was also adminis tered to the rumen
fistulated wethers and the ewe-hoggets to measure VOMI. VOMI was cross
compared between the rumen-fistulated wethers and ewe-hoggets. The schematic
presentation of the experimental design of this trial is shown in Table 5.2 (p. 126).
5.2. 1 Pasture
The LS and HS PRG selections harvested in 1985 (see section 1 .4.2. 1 ) were sown
into separate 1 .5 ha halves of a 3 ha paddock located at DSIR's Tiritea Research
Area, Palmerston North in April 1987. The paddocks were maintained as a pure
ryegrass sward by applications of urea and herbicide for annual weed control.
5 .2.2 Trial 1
5.2.2. 1 Determination of rumen digesta fractional outflow rates
On November 6th 1988, 12 rumen-fistulated Romney wethers (mean live weight 36.5
kg ± 1 .37 s .e . ) fitted with a permanent rubber cannulae were allocated into two
groups so that the mean live weight was similar between the two groups. The animals
were grazed on either the LS or HS PRG selections in a cross-over design. A
backpack, which consisted of a battery operated portable pump and a infusate
120

reservoir, was constructed (see Appendix 5 . 1 ) and fitted on each animal one week
prior to the first infusion period. The Ru-Cr dual-phase marker solution was
prepared as described in Section 4.2.3 .3. 1 . On November 30th, the Ru-Cr dual
phase marker solution was infused into the rumen for 9 days at an average rate of
542 and 13 mg/day for Cr and Ru, respectively. On December 9th, the animals
were rumen-emptied by manual bailing through the cannulae. The bailing was
made at midday because preliminary measurements of the diurnal pattern of the
rumen pool size showed that around midday the rumen pool size was close to the
mean in 8 rumen-fistulated wethers grazing PRG (see appendix 5 .2) . The bailed
rumen contents were weighed, mixed thoroughly, samples were taken for dry
matter concentration, particle size and marker analyses and the contents returned.
The animals were then changed over between the treatments and left to adjust
themselves to the new treatments for 2 days. Another infusion period was started
on December 1 1 th for 9 days and the sampling procedure repeated on December
20th. FOR and rumen digesta mean retention time (MRT) of the liquid-phase and
particulate phase were estimated as described in Section 4.2.3.3. 1 . During the trial,
however, the marker infusion was accidentally interrupted in one of the rumen
fistulated wethers, therefore, all the data of this animal were excluded from the
statistical analyses.
5.2.2.2 Measurements of live weight gain and wool production in autumn-born
lambs
5.2.2.2. 1 Live weight gain
On November 1 1 th 1 988, 30 female and 16 male Romney autumn-born lambs were
allocated into two groups so that both groups were balanced for sex. Within each I sex, the allocation was made randomly. The two groups were grazed on either the
LS or HS PRG selections. Live weight of each animal was recorded weekly from
November 1 8th for a period of 33 days. The animals were not fasted prior to the
weighing but recording of live weights was made at 0900 hours each time.
121

5.2.2.2.2 Wool production
A mid-side patch of wool measuring approximately 100 cm2 was taken from the
left side of each animal by clipping to the skin surface on November 1 1th and on
December 21 st. The greasy weight of each wool sample was measured and, after
scouring, the clean weight was also determined. On December 23rd, the animals
were completely shorn and the greasy whole fleece weight was measured for each
animal. A sample of greasy wool was taken from the right midside of each animal
and the greasy wool weight-clean wool weight ratio was determined by weighing
before and after scouring. The clean whole fleece weight was then estimated. The
total daily fleece wool growth rate during the grazing period for each animal was
calculated as;
C B Total fleece wool growth, (g/day) = x --
where
A = initial midside wool (g/1 00cm2),
B = final midside wool (g/100cm2) ,
C = total fleece (g) .
5.2.3 Trial 2
no. of days A + B
5 .2.3 . 1 Determination of rumen digesta fractional outflow rates
On November 18th 1988, 8 rumen-fistulated Romney wethers, fitted with permanent I
rubber cannulae (mean live weight 50.8 kg ± 1 .64 s .e.) were allocated into two
groups so that the mean live weight was similar between the two groups. The
animals were grazed on either the LS or HS PRG selections in a cross-over design.
A backpack (see section 5.2.2. 1 ) was fitted on each animal one week prior to the
first-infusion period. A dual-phase marker was prepared as described in section
122

4.2.3 .3 . 1 except that Co(III) -EDTA (for preparation see Appendix 5 .3) was
substituted for Cr-EDTA, because the Cr203 marker was also administrated to each
rumen-fistulated animal (see section 5 .2.3.3). On November 29th, the Ru-Co dual
phase marker solution was infused into the animals consecutively for 9 days at an
average rate of 58 1 and 1 5 mg/day for Co and Ru, respectively. At noon on
December 8th , the animals were rumen-emptied and samples were taken as
described in section 5 .2.2. 1 . The animals were then changed over between the
treatments and left to adjust themselves to the new treatments for 4 days. Another
infusion period was started on December 1 3th, for 9 days and the sampling
procedure repeated on December 22nd. FOR and MRT for the liquid-phase and
particulate phase were estimated as described in section 4.2.3 . 3 . 1 but Co was
substituted for Cr in the equation.
5.2.3.2 Measurements of live weight gain in ewe-hoggets ·
On November 9th, 40 one-year-old Romney ewe-hoggets were randomly allocated
into two groups to graze either the LS or HS PRO selections. The animals ' live
weights were recorded weekly from November 15th for 6 weeks at 0900 hours
without fasting. 24 hour-fasted weights of the animals were also measured on
November lOth and on December 9th and 23rd. Due to a shortage of the HS PRO
selection, however, 4 animals were randomly selected from the HS paddock and
were withdrawn from the trial on November 29th. All the data pertaining those
animals were, therefore, excluded from statistical analyses.
5.2.3.3 Measurement of voluntary organic matter intake in ewe-hoggets and
rumen-fistulated wethers
VOMI of the animals was estimated from the faecal OM output and the in vitro
organic matter digestibility (IVOMD) of the ingested material from the animals.
Faecal OM output for the ewe-hoggets was estimated based on the Cr203 marker.
Faecal OM output for the rumen-fistulated wethers was estimated based on the
1 23

Cr203 marker and also the Ru-Co dual-phase marker. An intra-ruminal Cr203 controlled release capsule (Captec Chrome for Sheep, manufactured by Captec Pty.
Ltd., Australia) was administered to 12 of the ewe-hoggets randomly selected from
each paddock and to each rumen-fistulated wether on November 15th and 26th,
respectively. The capsules were designed to release Cr sesquioxide faecal marker
at a constant rate for approximately 25 days. Faecal collections were made per
rectum on each animal. Faecal samples of each ewe-hogget were collected during
the total three periods of five consecutive days, namely, from November 23rd to
27th (PI) , December 4th to 8th (PII) and after the 2nd administration of the
capsules on December 1 1th, from December 1 8th to 22nd (Pili). Faecal samples
of each rumen-fistulated wether were collected during periods PII and Pili. PIT
and Pili were synchronized with the last five days of each dual-phase rumina!
marker infu sion period so that the data measured in the ewe-hoggets were
comparable with the data measured in rumen-fistulated wethers. The collected
faeces were then pooled within each period for each animal for marker analyses.
At the completion of the faecal collection, the capsules were recovered from the
rumen-fistulated wethers through the cannulae to determine the actual Cr release
rate. The actual Cr release rate was estimated by the rate of disappearance of mass
of the Cr-tablets in the capsules and actual concentration of chromium in the tablets
(see Appendix 5 .4) . Daily VOMI was then estimated from the faecal OM output
and the IVOMD of ingested material estimated from oesophageal extrusa (OE)
recovered from the oesophageal fistulated animals (see section 5 .2.4 . 3 ) by
following;
Faecal OM output (g/day) VOMI (g/day) =
1 - IVOMD of OE.
Daily faecal OM output was calculated as;
Cr, Ru, Co release/infusion rate (mg/day) Faecal OM output (g/day) =
Cr, Ru, Co in OM of faeces (mg/g).
IVOMD of OE collected on November 25th, December 4th and 2 1 st were used to
estimate intakes for the periods of PI, PIT and PIIT, respectively.
124

Pasture mass T O 0 le T le l e c Herbage
0 le le \.. sample
OE le le sample c le c LSBUIML 0 le le Marker le,\.. tclc 1crc [clc [c s lr!r i cle lc 'c le l e [C B infusion
Live weight 0 0 le le le Wool IM IM I s sample
10 1 2 14 1 6 1 8 20 22 24 26 28 30 2 4 6 8 10 12 1 4 1 6 18 20 22 24 Nov Dec
T: topping B: bailing M: midside S: shearing
Table 5.1 The s ch ematic presentatio n of the experimental design of Trial 1 .
o: measured and/or sampled.
125

Posture 0 mass 0 0 T [o [o [c 'c Herbage
c sample 11... 1...
OE c [e c sample 0 LSBUIML 0 [0 [c Marker rjo [c[o[c o[c infusion [c s le c cc ie[c[e C B
Faecal jRFV. c o:c [OIC ICICle c samplejEwe c !o o 0 0 0 91C I<JIC c I_<: l e l elce Live weight F 0 0 [c F [e le F
1 0 1 2 1 4 1 6 1 8 20 22 24 26 28 30 2 4 6 8 1 0 1 2 1 4 1 6 1 8 20 22 24 Nov Dec
T: topping B: bailing RFW: wethers C: marker in F: fasted
Table 5.2 The schematic presentat ion of the experimental design of
Trial 2. o : measured and/or sampled.
126

5 .2.4 Herbage analysis
5.2.4. 1 Pasture mass
During the trials, pasture mass was calibrated from pasture height measured by a
rising plate meter (Earle et al., 1979). An Ellinbank Pasture Meter (EPM) attached
with a rising plate of O . lm2, 5 .0 kg/m2 (designed by Dairy Research Institute, New
Zealand) was used to measure pasture height at which the plate was held. The
EPM reading depends on both height and density and can be used as an indirect
measure of pasture mass. Calibration of the pasture height to pasture mass was
made by measuring the height of the pasture and dry matter yield of a 0. 1 m2
quadrat. The dry matter yield of a quadrat was determined by cutting the herbage
to ground level, then removing, washing and oven-drying the herbage (105 °C for
24 hours) . Pasture height and dry matter yield of ten quadrats were taken from
each paddock for the calibration. The weight of the dry matter was then calculated
as a pasture mass (kgDM/ha) and related to the pasture height by a linear model.
Calibrations were made on November 24th and on December 9th for Trial 1 and
Trial 2, respectively. Pasture height was determined by taking an average of 100
pasture height measurements randomly from each paddock. Pasture height was
determined on November 1 8th, 24th, 30th, December 5th, 13th, 18th in Trial l (see
Table 5 . 1 ) and on November lOth, 14th, 1 8th, 23th, 28th, December 3rd, 1 1 th and
19th in Trial 2 (see Table 5 .2). During the trials, the LS and HS paddocks were
maintained at equal pasture mass in the two paddocks having pasture height within
the range of 8 - 12 cm by introducing non-experimental sheep to the paddocks.
Emerged seed heads were topped by a rotary mower set at a cutting height of 7.5
cm on November 17th and December 2nd in Trial l and November 20th in Trial 2.
5 .2.4.2 In vitro digestibility of herbage
Herbage samples were randomly taken from each paddock by clipping to ground
level on November 27th, December 5th, 13th and 18th in Trial 1 (Table 5 . 1 ) and
November 28th, December 1 3th and 20th in Trial 2 (Table 5.2). The herbage
127

samples were washed with water, freeze-dried, ground through a 1 mm mesh sieve
and analysed for in vitro organic matter digestibility (IVOMD).
5.2.4.3 Composition and in vitro digestibility of material ingested by the sheep
To estimate the digestibility and composition of the material ingested by the
experimental animals, four mature oesophageal-fistulated wethers (mean live
weight 75.7 kg ± 2.85 s.e.) were used to collect OE. It was assumed that the OE
represented the material ingested by the experimental animals. The oesophageal
fistulated wethers were randomly paired and allocated to graze each PRO selection.
An OE collection bag was attached on each animal and the animals were allowed
to graze for approximately 20 minutes. The bag was removed from the animal
before rumination occurred. The OE was collected and pooled within each pair.
After completion of the OE collection, the pairs were changed over between the
paddocks e ach time. The collection of OE was made on November 28th,
December 1 st, 5th, 8th, 12th, 15th and 19th in Trial 1 (Table 5 . 1 ) and November
25th, December 4th, 13th, and 21st in Trial 2 (Table 5 .2) . Approximately 1 50 g of
fresh subsample of each collected OE was dissected manually into green grass and
seed heads or dead material fractions. These dissected fractions were oven-dried
( 105 °C for 24 hours) and then weighed to determine the composition of OE. A
subsample of each collected OE was also freeze-dried, ground through a 1 mm
mesh sieve and analysed for IVOMD.
5 .2.4.4 Determination of leaf shear breaking load and index of masticatory load
Ten 0. 1 m2 quadrat samples of herbage were randomly collected by clipping to I
ground level from each paddock on November 25th, December 5th and 14th in
Trial 1 (Table 5. 1 ) and November 15th, 30th and December 19th in Trial 2 (Table
5.2). The quadrat samples taken were pooled and thoroughly mixed. Subsamples
of 1 00 to 150 green fresh leaf pieces, regardless whether entire or part of a leaf,
were randomly selected for measuring morphology and shear breaking load.
128

Length (longitudal length) of the leaf piece was recorded for each leaf piece and
the leaf pieces were then pooled, oven-dried (105 °C for 24 hours) and weighed to
determine the average dry weight of a leaf piece. An Instron Food Testing
Instrument (model 1 140, manufactured by Instron Ltd., England) fitted with
Warner-Bratzler Meat Shear type blades (no. 2830-013, manufactured by Instron
Ltd. , England) was used for measuring the LSBL. Drive speed was set at 80
mm/min. Ten replicates of 10 fresh leaf pieces, which were gathered and aligned
along the midway of the length, were sheared and the maximum forces exerted
were recorded. The maximum force exerted divided by the number of leaf pieces
sheared was determined as the shear breaking load of a leaf piece. The IML of a
leaf piece was then estimated as defined in section 2.4.5.
5 .2.5 Chemical analyses
5 .2.5 .1 Rumen contents
Dry matter concentrations of rumen contents samples were determined by oven
drying (105 °C for 72 hours). For the marker analyses, samples of rumen contents
were freeze-dried and ground through a 0.5 mm mesh sieve. Concentrations of Ru
and Cr (Trial 1) , Ru and Co (Trial 2) in the samples were determined by X-ray
fluorescence spectrometry as described in section 4.2.5. Particle size analyses were
made as described in section 3.2.6 using sieves of 4.0, 2.0, 1 .0, 0.5 and 0.25 mm
mesh.
5.2.5.2 Faeces
Faecal samples collected in Trial 2 were oven-dried ( 105 °C for 24 hours) and
ground through a 0 .5 mm mesh sieve. Concentrations of Ru and Co were
determined by X-ray fluorescence spectrometry as described in section 4.2.5.
Concentration of Cr was determined by atomic absorption spectrophotometry
( 1982 IL 457 AA, manufactured by Instrumentation Laboratory Inc . , USA)
129

(Williams et al., 1962; Costigan et al., 1987; Parker, 1990).
5.2.5.3 Herbage and oesophageal extrusa
Analyses of IVOMD for herbage samples and oesophageal extrusa were made
using the procedure described by Roughan et al. (1977).'
5.2.6 Statistical analyses
For the data collected from the rumen-fistulated wethers,statistical analyses were
performed by analysis of variance for a cross-over design. For the data collected
from lambs and ewe-hoggets, statistical analyses were performed by the analysis of
variance for a completely randomized design. GLM procedure of SAS (SAS Inst.,
Inc., NC., USA) was used for the analyses.
5.3 Results
5.3. 1 Trial 1
5.3. 1 . 1 Pasture
Changes in pasture mass and IVOMD of the LS and HS PRG selections during the
trial are shown in Figure 5 . 1 . Changes in LSBL and leaf length:dry weight ratio of
the two types of PRG selections during Trial 1 are shown in Figure 5 .2. Changes
in IML of the two types of PRG selections during the trial are shown in Figure 5.3. I
The mean values of above measures are shown in Table 5 .3 . There was no
significant difference between LS and HS PRG selections in mean pasture mass
and IVOMD during the trial. The LS PRG selection had approximately 25 %
(p<0.05) lower mean LSBL and approximately 30 % higher (p<O. lO) mean leaf
length:dry weight ratio than the HS PRG selection during the trial. However, there
130

-0 .c:
......... � 0 Cl � ........,
en en 0 E Q.) I.. ::J ...... en 0
CL
2600
2400
2200
2000
1 800
80
0 70 � 0 >
. . o · . . · o· .
.::.!.. 0 , , , , , . (
1 000 �----------------------------�
,....._ Q) u Q) a. 800
........... 600 .....J CO (/) .....J
,....._ � 0 Cl E .......... E E ........... n:: ::: .....J
400
1 5 1 4
1 3 1 2
1 1
1 0
9 8
7 6 5
0 · 11 • • • • • • · 0 · . . . . . . · 0
o · . . . . 0 . . . . D 0
0
· o
1 8 20 22 24 26 28 30 2 4 6 8 1 0 1 2 1 4 1 6 1 8 20
Nov Dec
X.-- LS O·· · · · · · · · HS
Fi g u re 5.2 C h a ng es in l eaf shear b re a ki n g l o a d ( LS B L) and l eaf
length :dry wei g ht rat io ( LW R) of l ow ( LS) and h igh (HS) leaf shear
breaking load perennial ryegrass selections during Trial 1 .
1 32
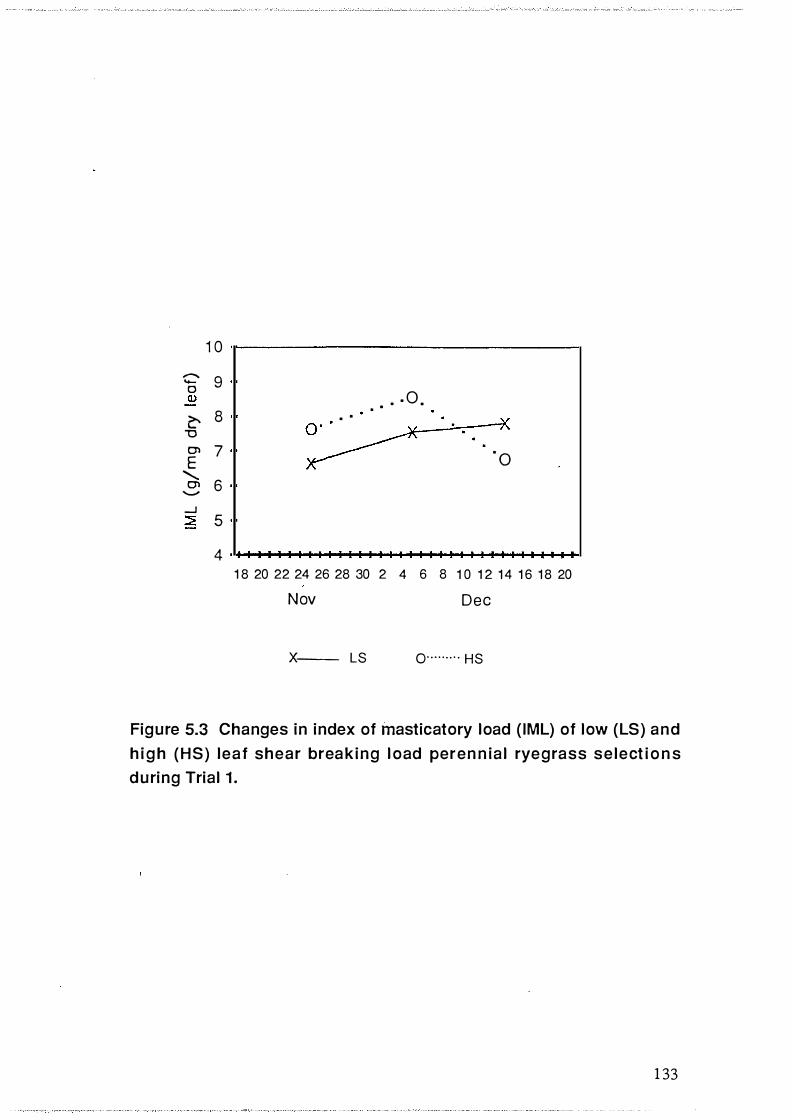
1 0
........... 9 .... 0 (]) . . . 0 . � 8 . .
"'0 Q') 7 · a E
.......... 6 Q')
.........
_J ::2: 5
4 1 8 20 22 24 26 28 30 2 4 6 8 1 0 1 2 1 4 1 6 1 8 20
Nov Dec
X-- LS O· · · · · · · · · HS
Figure 5.3 Changes in index of masticatory load ( IML) of low (LS) and
h i g h (HS) leaf shear break ing l oad peren n ia l ryegrass se lect i o n s
during Trial 1 .
1 33

Table 5.3 Mean values of pasture mass (n=6) , in vitro o rganic matter
d ig e st i b i l i ty ( I VO M D ) ( n=4 ) , leaf s h e a r b reak ing l oad ( n=3 ) , leaf
length :dry weight ratio (n=3) and index of masticatory load of leaf (n=3)
of l ow (LS) and high (HS) leaf shear breaking load perennial ryeg rass
selections on offer during Trial 1 .
Selection
LS HS
Pasture mass (kgDM/ha) 2324 2241
IVOMD (%) 71 . 1 70.4
Leaf shear breaking load (g/leaf) 554.7 737.0
Lea! length:dry weight ratio (mm/mg D M) 1 3.5 1 0.4
I ndex of masticatory load (g/mgDM leaf) 7.34 7.67
Effect of selection
ns
ns
*
ns (n=0.07)
ns
S .E.D.
39.6
0 .47
64.70
1 .24
0 .61 9
134

were no significant differences between the two types of PRO selections in mean
IML during the trial.
Changes in composition and IVOMD of OE of animals grazing the LS and HS
PRG selections during the trial are shown in Figure 5.4 and mean values are shown
in Table 5 .4. There were no significant differences between the OE of animals
grazing the two types of PRO selections in composition and in IVOMD. Although
both OE contained approximately 1 1 - 15 % of seed heads and dead material, the
IVOMD was approximately 80 % for both PRO selections.
5 .3 . 1 .2 Live weight gain and wool production in autumn-born lambs grazing the
low and high leaf shear breaking load perennial rye grass selections
Changes in live weight of lambs grazing LS and HS PRO selections during the trial
are shown in Figure 5.5 . Mean values of live weight gain and total fleece wool
growth are shown in Table 5 .5 . There were no significant differences in live
weight between the two groups of animals grazing LS and HS PRO selections at
any time during the trial period (Fig. 5.5). There were no significant differences
between the two groups of animals in mean daily live weight gain and in mean
daily total fleece wool growth (Table 5.5) .
5.3. 1 .3 Rumen pool size, digesta fractional outflow rates, digesta mean retention
times and particle size distributions in rumen contents in wethers grazing
the low and high leaf shear breaking load perennial ryegrass selections
Rumen pool size, FOR and MRT of liquid-phase and particulate-phase of wethers I
grazing the LS and HS PRO selections are shown in Table 5.6. The animals
grazing the LS PRO selection had approximately 16 % higher (p=0.07) dry matter
rumen pool size and 1 0 % lower (p<0.05) FOR for the liquid-phase than the
animals grazing the HS PRO selection. However, there were no other major
differences occurring between the animals grazing the two types of PRO
135

selections.
Figure 5 . 6 shows the particle size distributions of the rumen contents of the
animals grazing the LS and HS PRG selections. There were no major differences
in particle size distribution of the rumen contents between the two groups of
animals.
1 36

1 00
80
60
40
� 20
0 c 0 1 00 ....... tl) 0 a. 80 E 0
u 60
40
20
0
" - .......... -
v--
LS
HS / � � "' V -
• GREEN
C SH+DEAD ' - IVOMD
1 8 20 22 24 26 28 30 2 4 6 8 1 0 1 2 1 4 1 6 1 8 20
Nov Dec
90
80
70 < 0 s: 0
60
90
80
70
60
Fi g u re 5 . 4 C h a n g es in c o m po s i t i o n and in vitro o rgan ic matter
d i gest i b i l ity ( I V O M D) of the o es op h a gea l extrusa of the a n i ma ls
g razing the low (LS) and h igh (HS) leaf shear breaking load perennial
ryegrass selections during Trial 1 .
(Composition ; green grass (GREEN), seed head and dead material (SH+DEAD)
1 37

Table 5.4 Mean val ues of c o mposition and in vitro o rgan ic matter
d igest ib i l ity ( IVOMD) of the oesophagea l extrusa (n=7) of a n i mals
g razing the low (LS) and high (HS) leaf shear breaking load perennial
ryegrass selections during Trial 1 .
Selection Effect of selection
LS HS S . E.D .
Composition (DM%) :
G reen material 88.9 85.3 ns 3.70
Seed head and dead material 1 1 . 1 1 4.7 ns 3.70
IVOMD (%) 80.3 79.7 ns 0.75
138

42 �------------------------------�
41 -
0' 40 � � ...... 39 ..c 0'
· - 38 Cl) � 37 Cl) > 36 _j
35
34��++++�����++++����� 1 8 20 22 24 26 28 30 2 4 6 8 1 0 1 2 1 4 1 6 1 8 20
Nov Dec
X,.--- LS O· · · · · · ·· · HS
Figure 5.5 Changes in l ive weight of the lambs (n=23) g razing the low
( LS) a n d h ig h (HS) leaf s h ear brea k i n g l o a d pere n n i a l rye g rass
selections during Trial 1 .
139

Table 5.5 Mean values of l ive weight gain and total fleece wool g rowth
of lambs (n=23) grazing the low (LS)and high (HS} leaf shear breaking
l oad perenn ial ryegrass selections d uring Trial 1 .
Live weight gain (g/day)
Total fleece wool growth (g/day) :
Greasy
Scoured
LS
1 38
1 4.2
1 0.3
Selection
HS
1 27
1 3.7
1 0.6
Effect of selection
ns
ns
ns
S.E .D.
1 0 .0
0 .67
0 .53
140

Table 5 .6 R u me n p o o l s ize, rumen d igesta fractio na l outflow rate
(FO R) and rumen digesta mean retention time (MRT) for l iquid-phase
and particulate-phase in wethers (n=1 1 ) g razing the low (LS) and high
(HS) leaf shear breaking load perenn ial ryegrass selections.
Rumen pool size (g) :
Total
Dry matter
FOR (%/h) :
Liquid-phase
Particulate-phase
M RT (h) :
Liquid-phase
Particu late-phase
LS
3978
41 3.0
1 2.3
8.1
8.4
1 2.9
Selection
HS
3805
365.6
13 .7
7.9
7.6
1 3.0
Effect of selection
ns
ns (p=O.O?)
ns
ns
ns
S .E .D .
99 .4
1 9.85
0 .50
0 .51
0 .36
0 .90
141

40 90
I : �: I 80
30 70
Q) > 60 Q)
(/) * c: 0 50 "'0 Q) 20 c: 0 40 ....... Q) '-
� 30 0
� 1 0
20
1 0
0 0 4.0 2 .0 1 .0 0.5 0.25 Res1 Sol 2 � 1 .0 < 1 .0
Sieve size (mm)
Figu re 5 .6 Partic le s ize d istribution of rumen contents of wethers
(n=1 1 ) g raz ing the low ( LS) a nd h igh (HS) leaf shear breakin g load
perennial ryegrass selections.
1 : Residues. 2: Soluble DM defined as the DM remaining in solution after centrifugation at 850 G for 20 minutes.
142

5.3.2 Trial 2
5.3.2. 1 Pasture
Changes in pasture mass and IVOMD of the LS and HS PRG selections during the
trial are shown in Figure 5.7. Changes in LSBL and leaf length:dry weight ratio of
the two types of PRG selections during the trial are shown in Figure 5.8. Changes
in IML of the two types of PRG selections during the trial are shown in Figure 5 .9.
The mean values of above measures are shown in Table 5 .7 . There was no
significant difference between the LS and HS PRG selections in mean pasture mass
and IVOMD during the trial. The LS PRG selection had approximately 3 1 %
lower (p<0.05) LSBL and approximately 37 % higher (p<0.05) leaf length:dry
weight ratio than the HS herbage. However, there were no significant differences
between the two types of PRG selections in mean IML during the trial. Changes in
composition and IVOMD of OE of animals grazing LS and HS PRG selections
during the trial are shown in Figure 5. 10 and mean values are shown in Table 5.8.
There were no significant differences between the OE of the animals grazing the
two types PRG selections in composition and in IVOMD. Although both OE
contained higher proportion of seed head and dead material than in Trial 1 , the
IVOMD was over 80 % for both PRG selections.
5.3.2.2 Live weight gain and voluntary organic matter intake in ewe-hoggets
grazing the low and high leaf shear breaking load perennial ryegrass
selections
Changes in live weight, 24-hour fasted weight and daily VOMI of the ewe-hoggets
grazing the LS and HS PRG selections during the trial are shown in Figure 5 . 1 1 . I
Mean values of live weight gain based on 24-fasted weight and VOMI estimated
based on the Cr203 of the ewe-hoggets grazing the LS and HS PRG selections
during the trial are shown in Table 5.9. There were no significant differences in
live weight and in 24-fasted weight between the two groups of ewe-hoggets
grazing the LS and HS PRG selections at any time of the trial period (Fig 5. 1 1 ).
143

,-.... 0 ..c
' :::2: 0 O'l � ........ tJ') tJ') 0 E Q.) '-::l ....... tJ') 0
Cl.
3400
3200
3000
2800
2600
80
0 70 :::2: 0 >
V.. ,, ,
0· . . . . . . . . . . . . . 0 . . . . . .
1 0 1 2 1 4 1 6 1 8 20 22 24 26 28 30 2 4 6 8 1 0 1 2 1 4 1 6 1 8 20 22 24
Nov Dec
X,---- LS o··· · · · · · · Hs
Fig u re 5 . 7 C h a nges i n pasture mass and i n vitro o rgan ic matte r
d igestibi l ity ( IVOMD) of the low (LS) and high (HS) leaf shear breakin g
load perennial ryegrass selections during Trial 2.
144

1 000
........ (]) 0 . . . . . . . . . . . . . Q. (..) . . (]) . . 800
. . a. . . . . ._ . . 0 .
· o (]) ......... 01 ........., 600 _J en (/) _J
400
1 5
1 4 ........ 1 3 ::!E 0 1 2 01 E 1 1 ......... E 1 0 E 9 0 . . . . . . .........,
0:: 8
/ . . . . . . . 0· . . . . . . . :: . . . . . . _J 7 . . . . 0
6
5 1 0 1 2 1 4 1 6 1 8 20 22 24 26 28 30 2 4 6 8 1 0 1 2 1 4 1 6 1 8 20 22 24
Nov Dec
X-- LS O··· · · · · · · HS
Fi g u re 5.8 C h a n g es i n leaf shear b rea ki n g l oad ( LS B L) and leaf
length :dry weight ratio (LWR) of the low (LS) and h igh (HS) leaf shear
breaking load perennial ryegrass selections during Trial 2.
145

1 0
,......., 9 -0 Q)
c 8 "'0 O'l 7 E
........... O'l 6 .........
.....J :::::!: 5
0 · . . . . . . . . . . . . 0 .
· a
1 0 1 2 1 4 1 6 1 8 20 22 24 26 28 30 2 4 6 8 1 0 1 2 1 4 1 6 1 8 20 22 24
Nov Dec
X:--- LS Q· ·· · · · · · · HS
Figure 5.9 Changes in index of masticatory load (IML) of the low (LS)
and h igh (HS) leaf shear breaking load perennial ryegrass selections
during Trial 2.
146

Table 5.7 Mean values of pasture mass (n=8), in vitro o rganic matter
d i gest ib i l i ty ( I V O M D) ( n =3 ) , l eaf s h e a r b re ak i n g l oa d ( n = 3 ) , l eaf
length :dry weight ratio (n=3) and index of masticatory load of leaf ( n=3)
of the l o w ( LS) and h i g h ( HS) leaf s h e a r breaki n g l oad perenn ia l
ryegrass selections on offer during Trial 2.
LS
Pasture mass (kgDM/ha) 2987
IVDMD (%) 71 .2
Leaf shear breaking load (g/leaf) 578.7
Leaf length:dry weight ratio (mm/mgDM) 1 1 .1
I ndex of masticatory load (g/mgDM leaf) 6.42
Selection
HS
3034
73.5
837.3
8 . 1
6.86
Effect of selection
S .E .D .
ns 70.0
ns 0 .81
67.62
• 0.97
ns 1 .087
147

1 00
80
60
40
� 20
0
c: 1 00 0
o+J
.iii 80 0 a.
� 60 u
40
20
0
� � �
LS
HS r------ ---
• G REEN
0 SH+DEAD
- IVOMD
1 0 1 2 ; 4 ; 6 ; 8 20 22 24 26 28 30 2 4 6 8 1 0 ; 2 1 4 ; 6 1 8 20 22 24
Nov Dec
90
80
70 -< 0 ;;:
60
90
80
70
60
0
Figu re 5 . 1 0 C h anges i n c o mp osit ion and i n vitro o rgan ic m atter
d i gest i b i l i ty ( I VO M D) of the oesophagea l extrusa o f the an i ma ls
g razing the l ow ( LS) and high (HS) leaf shear breaking load perennial
ryegrass selections during Trial 2.
(Composition ; green g rass (GREEN) , seed head and dead material (SH+DEAD)
148

Table 5.8 Mean val ues of composit ion and i n v itro o rganic matter
d igestibi l ity (IVOMD) of the oesophageal extrusa (n=4) of the an imals
g razing the low (LS) and high (HS) leaf shear breaking load perennial
ryegrass selections during Trial 2.
Selection Effect of selection
LS HS S.E .D .
Composition ( OM%) :
Green material 71 .4 71 .7 ns 1 1 .84
Seed head and dead material 28.6 28.3 ns 1 1 .84
IVOMD (%) 80.5 80.4 ns 1 .28
149

50
,..... 48 Cl � 46 ..._,
........ 44 ..c Cl
Q) 42 �
Q) 40 > ....J
38
36
2000
,.....
::e. 1 800 Cl
� � 1 600
�·· • •
A• • Ae • · · · ·'i"
• • "1"
• ••A {;)• • • r
A• • • • • •r • • • •r
. . . . . . . . . l . . . . . . . . . . . . . l
1 0 1 2 1 4 1 6 1 8 20 22 24 26 28 30 2 4 6 8 1 0 1 2 1 4 1 6 1 8 20 22 24
Nov Dec
x--- LS o · · · · . . HS X-- 24-h fasted LS O · · · · · · · · · 24-h fasted H S
F i g u re 5 . 1 1 C h a n g es in l ive wei g ht , 24-h o u r fasted wei g ht and
voluntary o rganic matter intake (VOMI) of the ewe-hoggets grazing the
1 l ow (LS} and h igh (HS) leaf shear breaking load perennial ryegrass
selections during Trial 2.
(n=20 for LS and n=1 6 for HS in live weight, n=12 in VOMI}.
150

Table 5 .9 Mean values of l ive wei g ht ga in and vo l u ntary o rg anic
matter i ntake (VOMI) of ewe-hoggets g razing the l ow (LS) a nd high
{ HS) leaf shear breaking load perenn ia l ryeg rass select ions d u ring
Trial 2.
Live weight gain 1 (g/day)
VOMI2 (g/d)
1 : �sed on 24-hour starved weight. 2: Estimated based on Cr2o3.
Selection
LS HS
1 76 1 78 (n=20) (n=16)
1 735 1 795 (n=1 2) (n=1 2)
Effect of selection
S.E.D.
ns 1 1 .55
ns 8 1 .8
151

Mean daily live weight gain based on 24-hour fasted weight was similar between
the two groups of animals (Table 5.9). Mean daily live weight gain based on non
fasted weight was 176 and 196 g (s.e.d. ±15 .2, ns) for the animals grazing the LS
and HS PRG selections, respectively. In VOMI, no significant differences
occurred at any time during the trial between animals grazing the LS and HS PRG
selections (Fig. 5 . 1 1 ) and mean daily VOMI was similar between the two groups of
animals (Table 5.9).
5.3.2.3 Rumen pool size, digesta fractional outflow rates, digesta mean retention
times and particle size distributions in rumen contents in wethers grazing
the low and high leaf shear breaking load perennial rye grass selections
Rumen pool size, FOR and MRT of liquid-phase and particulate-phase of wethers
grazing the LS and HS PRG selections are shown in Table 5 . 10. The wethers
grazing the LS PRG selection had approximately 14 and 16 % lower total rumen
pool size and dry matter rumen pool size, respectively than the wethers grazing the
HS PRG selection. The�e differences, however, were not statistically significant
(p>0. 10) . There were no significant differences in FOR and MRT between the two
groups of wethers grazing the LS and HS PRG selections.
Table 5 . 1 1 shows VOMI based on the Cr203 and Ru-Co dual-phase marker. There
were no significant differences in VOMI between the animals grazing the LS and
HS PRG selections based on any marker used in the trial. The estimation of VOMI
was similar for all the markers used. Correlation coefficients among the VOMI
based on three markers were 0.97 (p<0.001), 0.70 (p<0.01) and 0.62 (p<0.05) for
VOMI based on Ru and Co, on Ru and Cr and on Co and Cr, respectively. The
variability of estimate of VOMI based on Ru marker was the least among the three I types of markers.
Particle size distribution of rumen contents of wethers grazing the LS and HS PRG
selections is shown in Figure 5 . 1 2. There were no significant differences in
particle size distribution of the rumen contents between the two groups of animals.
152

Table 5.1 0 Rumen pool size, rumen digesta fractional outflow rate
{FOR) and rumen digesta mean retention time {MRn for l iquid-phase
and particu late-phase in wethers ( n=8) grazing the low {LS) and high
{HS) leaf shear breaking load perennial ryegrass selections.
Selection Effect of selection
LS HS S .E.D.
Rumen pool size (g) :
Total 4330 5053 ns 386.2
Dry matter 453.7 542.2 ns 47.87
FOR (%/h) :
Liquid-phase 9.7 1 0 .4 ns 0 .63
Particulate-phase 8.6 7.7 ns 0 .74
M RT (h) :
Liquid-phase 1 1 .9 1 1 .3 ns 1 . 1 1
Particulate-phase 1 3.4 1 5.0 ns 1 . 61
153

Table 5.1 1 Vo luntary o rganic matter intake (VOMI) estimated based
the Cr faecal marker and Ru-Co dual-phase ruminal marker of wethers
( n=8) g raz in g the low ( LS) and h i g h (HS) leaf shear breaking l oad
perennial ryegrass selections.
Selection Effect of selection
LS HS S. E.D.
VOMI (g/day) based on:
Cr 1 840 1 862 ns 1 56.8
Ru 1 777 1 860 ns 94.1
eo 1 772 1 852 ns 1 54.5
1 54

40 90
[;] 80
70 30
s
Q) > 60 Q)
Vl c 0 50
"0 Q) 20 c 0 40 ....... Q) "-
:::?: 30 0 � 1 0 20
1 0
0 0 4.0 2.0 1 .0 0.5 0.25 Res , Sol 2 > 1 .0 < 1 .0
Sieve size (mm)
Fig u re 5 . 1 2 Partic le size d istribut ion of rumen contents of wethers
( n=8) g raz in g the l ow ( LS) and h i g h ( HS) l eaf shea r breaking l oad
perenn ia l ryegrass selections.
1 : Residues. 2: Soluble DM defined as the DM remaining in solution after centrifugation at 850 G for 20 minutes.
155

5.4 Discussion
In the present study, there was no evidence of improved FV of PRO due to reduced
LSBL. Live weight gain of lambs and ewe-hoggets were similar between the
groups of animals grazing the LS and HS PRO selections , although the LS PRO
selection had 24 - 3 1% lower LSBL than the HS PRO selection. There were no
significant differences in wool growth between the two groups of animals . Table
5 . 1 2 compares FVs as live weight gain of animals grazing the LS and HS POR
selections in the previous s tudies (Kolver, 1 989 ; Brookes et al. , personal
communication) and in the present study. Kolver ( 1989) found that animals
grazing the LS PRO selection grew at a significantly (p<0.01 ) faster rate than
animals grazing the HS PRO selection, when the LS PRO selection had 24 % lower
LSBL than the HS PRO selection (Table 5 . 12). He suggested that increased live
weight gain produced from the LS PRO selection was due to increased voluntary
feed intake, although he did not measure the voluntary feed intake. However, there
was no significant difference in VOMI estimated in the ewe-hoggets in Trial 2.
The VOMI estimated in the rumen-fistulated wethers in Trial 2 represented the
mean VOMI of the wethers over the period of the PII and PHI (see 5 .2.3.3). The
mean VOMI of the ewe-hoggets over the period of the PII and Pili was calculated
as 1692 and 1 800 g/day, respectively, for the ewe-hoggets grazing the LS and HS
PRO selections and difference between the treatments was not significant (±1 17
s.e.d.) . This is consistent with the lack of difference in VOMI estimated in the
rumen-fistulated wethers based on the same marker (Cr203). The estimation of
VOMI for the rumen-fistulated wethers was similar for all the markers used.
Therefore, it can be assumed that the FOR estimated in wethers can be applied to
the ewe-hoggets. This suggests that reduced LSBL in PRO did not improve FOR, I
and, consequently, did not increase voluntary feed intake and, thus, did not
improve live weight gain. The lack of significant difference in live weight gain,
wool production and FOR in Trial 1 corresponds with the results in Trial 2 and
support the rejection of the hypothesis (see section 5. 1 ).
1 56

Table 5 .1 2 Feeding value in l ive weight gain (LWG) and leaf shear
breaking load (LS B L) for low (LS) and high (HS) perenn ial ryeg rass
selections in previous studies and in the present study.
Study Year Type of LWG (g/day) Effect of LSBL (g/leaf) stock selection
LS HS LS H S
Kolver ( 1 989) :
1 989 Lamb 1 25 1 08 ** 567 751
Present study:
1 988 Lamb 1 38 1 27 ns 553 727
1 989 Ewe-hogget 1 76 1 78 ns 579 837
Brookes et a/. 1 : 1 991 Lactating ewe -1 05 -81 ns 647 838
(Winter) Lamb 1 74 1 81 ns
1 991 Lactating ewe 1 66 1 44 ns 747 809 (Spring) Lamb 1 99 226 ns
1 : unpublished data.
157
Although IVOMD of OE was as high as 8 0 % for both PRG selections,
considerable amounts of dead material and seed head were contained in the OE. In
September 1989, Atrazine herbicide (Gesaprim 500FW, manufactured by Ciba
Geigy, New Zealand Ltd.) was applied to the paddocks for the annual weed
control. The application of Atrazine herbicide suppressed the annual weed
successfully but also damaged the ryegrass sward. This resulted in the increased
proportion of the dead material and seed head in OE in Trial 2. Application of
Tramat herbicide (manufactured by Schering AG. , Germany) would be a better
alternative for annual weed control in future trials, since this herbicide is very
selective to weeds in ryegrass (O'Connor, 1990).
The lack of differences between the animals grazing the LS and HS herbage in the
present study may be attributed to the lack of difference in IML between the two
type of PRG selections. Although the difference between the LS and HS PRG
selections in LSBL in the present study was similar to that in the Kolver' s study
( 1989), there were no differences in IML between the two types of PRG selections
in the present study. In Kolver's study (1989), IML was not available. The most
recent study included twq growth trials conducted in winter and spring 199 1 (Table
5 . 12, Brookes et al. , unpublished) . In the winter trial , there were no significant
differences between the animals grazing the LS and HS PRG selections, although
the LS PRG selection had approximately 23 % lower LSBL than the HS PRG
selection (IML was not available) . No differences between the animals grazing the
two types of PRG selections were found during the spring trial again, but the LS
PRG selection was only approximately 8 and 3 % lower than the HS PRG selection
in LSBL and in IML, respectively. LSBL is one of the main factors to determine
IML, however other attributes i.e. leaf morphology also affect IML. These other
studies confirm that reduced LSBL per se will not improve FV of PRG.
5.5 Conclusion
Although the LS PRG selection had 25-3 1 % lower LSBL than the HS PRG
selection, FV measured as live weight gain and wool production of sheep in the
158

two separate trials was not improved by reduced LSBL. FOR in rumen-fistulated
wethers showed no indications of difference and VOMI was similar between the
animals grazing the LS and HS PRG selections. The lack of difference in IML
between the LS and HS PRG selection can be considered as a main reason for this.
The recent study by Brookes et al.(unpublished) supports this clearly. LSBL is one
of factors to determine IML, however, IML is not proportional to the LSBL
because leaf morphology also affects IML. Therefore, the hypothesis, that reduced
LSBL in PRG would improve its FV, was rejected. The next chapter summarizes
the results discussed so far and also discusses the prospects for further trials
aimed at increasing efficiency of breakdown by mastication, hence, increasing FV
ofPRG.
159

Chapter Six
GENERAL DISCUSSION AND CONCLUSION
6.1 Introduction
Reducing physical resistance has been proposed as a key factor to increase
efficiency of masticatory breakdown of forage (Bailey, 1 964; Black et al., 1 982;
Waghorn et al. , 1 989; McLeod et al. , 1989; Hodgson 1990), which may lead to
faster rumen fractional outflow rates (FOR) and consequently to increased
voluntary feed intake and hence improved feeding value (FV). However, the series
of experiments conducted in the present investigation did not demonstrate
improved FV in sheep by reducing leaf shear breaking load (LSBL) in perennial
ryegrass (PRG). In this chapter, the relationships between LSBL and index of
masticatory load (IML), limitations of effect of reduced LSBL in PRG on
improving FV and influence of IML on particle breakdown are summarized and '
the directions for further research are discussed.
6.2 Relationships between leaf shear breaking load and index of masticatory
load of leaf in perennial ryegrass
Changes in LSBL for the low leaf shear breaking load (LS) and the high leaf shear breaking load
(HS) PRG selections in the field during a complete year (April 1 9 89 - March 1 990) have been
observed and are shown in Figure 6. 1 . The LS PRG selection had a consistently lower LSBL than
the HS PRG selection throughout the year. LSBL for both PRG selections tended to be higher in
I spring and lower in winter. Similar changes in leaf tensile strength in PRG were observed by Evans
(1964a). Averaged over the year, the LS PRG selection was approximately 2 1 % lower (P<O.Ol)
than the HS PRG selection (586.2 vs 74 1 .2 g/leaf, ±4 1 .21 s.e.d. in LSBL). Differences between the
PRG selection lines in physical properties of the leaves did not result in any apparent differences in
sward growth characteristics or persistency throughout the year.
160

_J CD (/) _J
Apr May Jun Jul Aug Sep Oct Nov Dec Jan Feb Mar 1 989 1 990
'----- LS 0-------- HS
Figu re 6.1 Changes in leaf shear breaki n g l oad (LS B L) of l ow leaf
s h e a r brea k i n g l oad ( LS) and h i g h leaf s h ea r b reaking l oad (HS)
perennia l ryegrass selections in the fie ld d uring a year (April 1 989 -
March 1 990).
(LSBL is expressed in logarithmic scale)
161

IML is a measure of the total load to break a unit dry weight of PRG leaves into
particles small enough to have a high probability of leaving the rumen. IML is a
function of LSBL and the leaf length :dry weight ratio (L WR) . Table 6 . 1
summarizes those values in the present investigation. The LS PRG selection had
approximately 41 % lower LSBL, 26 % higher leaf length:dry weight ratio (LWR)
thus, 27 % lower IML than the HS PRG selection when grown under optimum
climatic conditions . However, this selection effect on IML decreased under field
conditions, as the LS PRG selection had only 1 - 12 % lower IML than the HS
PRG selection. This is due to the decreased selection effect on LSBL and the
increased effect on L WR. Reasons for these alterations of selection effect in PRG
under field conditions are unknown, although cross-pollination between the two
PRG selections may account for part of the effect.
6.3 Limitation of reducing leaf shear breaking load in perennial ryegrass
on improving feeding value to sheep
The effect of reduced L�BL in PRG on masticatory behaviour, rumen pool size,
rumen FOR and FV are summarized in Table 6.2 and Table 6.3. Efficiency of
particle breakdown during eating for the LS PRG selection tended to be higher than
for the HS PRG selection. This may lead to the higher ingestion rate for the LS
PRG selection than for the HS PRG selection because mastication during eating
appears to be continued until similar particle size distribution was achieved for the
two PRG selections. Higher ingestion rate for the LS PRG selection than for the
HS PRG selection has been observed by MacKinnon et al. (1988). However, the
efficiency of particle breakdown during rumination was similar for the two PRG
selections. Thus, even if the LS PRG selection was ingested faster than the HS
PRG selection by animals , ruminal particle breakdown was similar for the two I PRG selections (Table 6.2). Consequently, FOR, feed intake and FV were also
similar (Table 6.3).
162

Table 6.1 Leaf shear breaking load (LSBL), index of masticatory load
( I ML) of leaf and leaf length-width ratio (LWR) of the low leaf shear
breaking load perennia l ryegrass selection expressed relative to the
high leaf shear breaking load perennial ryegrass selection (as 1 00) in
the present investigation.
Grown under optimum indoor conditions (Chapter 2)
Mastication trial (Chapter 3)
I ndoor feeding trial (Chapter 4)
G razing trial : (Chapter 5)
1 988
1 989
LSBL
59
71
61
75
69
LWR
1 26
1 39
1 46
1 30
1 37
I M L
73
99
88
96
94
1 63

Table 6 .2 Summary of effect of the reduced leaf shear breaking load
(LS B L) in perennial ryegrass on masticatory behaviour during eating
in sheep.
{Chapter 3) : Chewing rate:
(chews/min)
(chews/gDM ingested)
Ingestion rate:
(gDM/min)
(mgDM/chew)
MacKinnon et al., ( 1 988) :
Ingestion rate (gDM/min)
Low
1 40.3
39.6
4.27
31 .3
7.6
LSBL
High
1 48 .9
48.6
3.41
23.3
6.5
164

Table 6 .3 Summary of effect of reduced leaf shear breaking l oad
(LSBL) on rumen pool sizes, fractional outflow rates (FOR), voluntary
o rganic matter intake (VOMI) and feeding values in sheep.
Rumen pool size (g):
I ndoor feeding trial (Chapter 4}:
Total
DM
Grazing trial ( 1 988) (Chapter S) :
Total
DM
Grazing trial ( 1 989) (Chapter S} :
Total
DM
FOR (%/h) :
I ndoor feeding trial (Chapter 4) :
Liquid
Particulate
Grazing trial ( 1 988) (Chapter S}:
Liquid
Particulate
Grazing trial ( 1 989) (Chapter S}:
Liquid
Particulate
VOMI (g/day) (Chapter S} :
Grazing trial ( 1 989)
Feeding value (Chapter S}:
Live weight gain (g/day) :
Grazing trial ( 1 988) 1 G razing trial ( 1 989)2
Fleece wool growth (g/day) 1 : G reasy
Scoured
1 : Lambs. 2: Ewe-hoggets.
Low
5805
567.2
3978
41 3.0
4330
453.7
1 1 .2
6.4
1 2.3
8 . 1
9.7
8.6
1 735
1 38
1 76
1 4.2
1 0.3
LSBL
High
5005
504.2
3805
365 .6
5053
542.2
1 1 .8
6.6
1 3 .7
7.9
1 0 .4
7.7
1 795
1 27
1 78
1 3 .7
1 0.6
165

6.4 Influence of index of masticatory l oad on particle breakdown and
masticatory behaviour in sheep
The lack of selection effect of the two PRO selections on IML may account for the
lack of significant differences between the two PRO selections in efficiency of
particle breakdown. Although a relatively large selection effect on IML (12 %)
was recorded in the indoor feeding trial (Chapter 4), there was no difference in
FOR between the two PRO selections. However, this could mainly be attributed to
the considerably low feed intake. The relationship between physical resistance of
PRG leaves to breakdown and theoretical efficiency of chewing <TEC> is given
by;
1 <TEC> (mgDM broken into 1 mm particles /chew) = f x -
IML
and,
1 <TEC> (mgDM broken into 1 mm particles I min) = f x k x -
IML
where,
f (kg) = mean bite force per chew at chewing rate of k (chews/min).
Therefore, IML is a determining factor of the efficiency of particle breakdown. A
previous study (John et al., 1989) showed that a difference in LSBL between the
LS and HS PRO selection was maintained after incubation in the rumen of cows
for at least 24 hours. This suggests that IML influences masticatory efficiency I
during rumination as well as during ingestion for at least 24 hours after ingested
PRO. Thus, the higher ingestion rates for LS PRO selection than the HS PRO
selection (Mastication trial; Chapter 3) may be due to narrower leaf width, which
required fewer chews to cut in a direction parallel to the sclerenchyma fibres.
There was similar masticatory behaviour for the two PRO selections during
166

rumination, because both PRG selections became similar in morphology after the
mastication during eating. Lower digestibilities for the LS PRG selection than for
the HS PRG selection (indoor feeding trial; Chapter 4) supports this interpretation
because the LS PRG leaves must have had fewer chewed areas which allow
microorganisms to enter into the plant tissues.
6.5 Direction of further studies
IML appears to be a determining factor of efficiency of particle breakdown. IML
is determined by the two factors , namely, LSBL and LWR. Thus, selection for
lower IML can be approached by either selecting for lower LSBL whilst keeping
L WR constant, or for lower L WR whilst keeping LSBL constant. Selection for the
LS and HS PRG was originally made based on the LSBL, however, L WR was not
held constant. The lower LSBL can be achieved by reducing sclerenchyma tissues
in leaf cross-section since sclerenchyma fibres account for the most of physical
resistance to breakdown (Vincent, 1982; Betteridge et al. , 1986). On the other
hand, the lower L WR can be achieved by selecting for the wider and/or thicker
leaves. This suggests that the lower IML PRG leaves will be thicker and/or wider
but having less sclerenchyma tissues in leaf cross-section. Wider leaves may have
increased apparent digestibility but may have decreased ingestion rate as
chews/gDM may increase.
IML, a model of work load, developed in the present investigation does not
account for the leaf breaking load parallel to the sclerenchyma fibres. Thus, it is
desirable to develop a further model to describe the work load, since the lower IML
PRG leaves are expected to have wider/thicker leaves. It is also necessary to
investigate the relationship between bite force and chewing rate. Electromyography I
may be a useful method in this future investigation.
In the present investigation, shear was used as a physical parameter of force under
the assumption that sheep mainly exert this type of force to break grass. However,
further studies are needed to investigate the sheep's chewing pattern in detail to
167

describe more accurate models of chewing. Also, Warner-Bratzler (WB) Meat
Shear Apparatus and Instron Food Testing Instrument fitted with WB type blades
were used to measure LSBL in the present investigation. LSBL measured by these
instruments probably confound shear and tension (Pool et al., 1969; Voisey, 1 974,
1 976). This may need to be modified according to the chewing model.
6.7 Conclusion
The primary hypothesis was that reducing LSBL in PRG should increase the
efficiency of masticatory particle breakdown both during eating and during
ruminating, and hence, improve rumen FOR and consequently lead to higher
voluntary intake and as a result, achieve improved FV. The LS PRG selection was
25 - 4 1 % lower than the HS PRG selection in LSBL. However, in IML the
selection effect decreased to 1 - 27 % due to the morphological differences
between the two PRG selections. In the present investigation, there were no
obvious effects of reduced LSBL in PRG on efficiency of masticatory p article
breakdown, and consequ"ently, FOR, feed intake and hence FV in sheep. This is
due to the lack of selection effect of PRG in IML. IML is a determining factor for
the efficiency of mastication both during eating and ruminating. Therefore,
selection of PRG for a lower IML is necessary in order to increase efficiency of
masticatory particle breakdown, FOR and hence FV of PRG. Lower IML can be
achieved by selecting for lower LSBL whilst keeping L WR constant or vice-versa
in future selections of PRG.
168
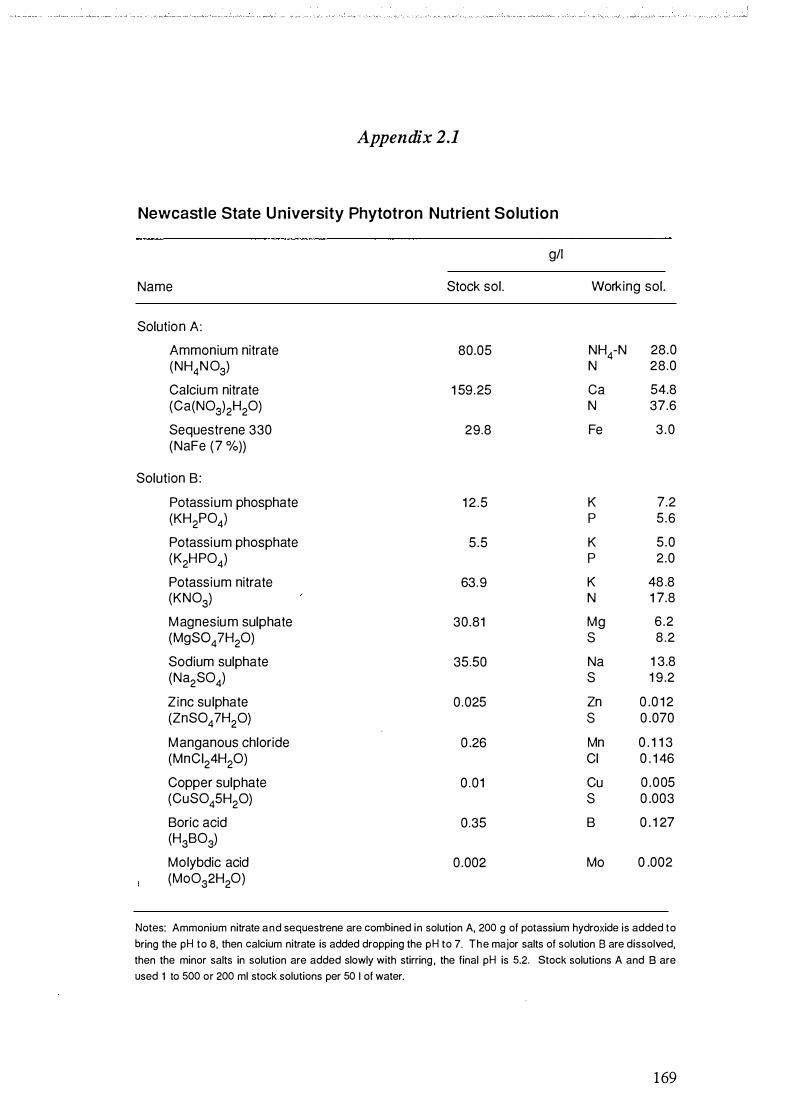
Appendix 2.1
Newcastle State University Phytotron Nutrient Solution
g/1
Name Stock sol. Working sol.
Solution A:
Ammonium nitrate 80.05 NH4-N 28.0 (NH4N 03) N 28.0
Calcium nitrate 1 59.25 ea 54.8 (Ca(N03)2H20) N 37.6
Sequestrene 330 29.8 Fe 3 .0 (NaFe (7 %))
Solution B:
Potassium phosphate 1 2 .5 K 7.2 (KH2P04) p 5.6
Potassium phosphate 5.5 K 5 .0 (K2HP04) p 2.0
Potassium nitrate 63.9 K 48 .8 (KN03) N 1 7.8
Magnesium sulphate 30.81 Mg 6.2 (MgSO 4 ?H20) s 8.2
Sodium sulphate 35.50 Na 1 3.8 (Na2S04) s 1 9 .2
Zinc su lphate 0 .025 Zn 0 .0 1 2 (ZnSO 4 ?H20) s 0 .070
Manganous chloride 0 .26 Mn 0 . 1 1 3 (MnCI24H20) Cl 0 . 1 46
Copper sulphate 0 .01 Cu 0 .005 (CuS045H20) s 0 .003
Boric acid 0.35 B 0 . 1 27 (H3B03)
Molybdic acid 0 .002 Mo 0 .002 (Mo032H20)
Notes: Ammonium nitrate and sequestrene are combined in solution A, 200 g of potassium hydroxide is added to bring the pH to 8, then calcium nitrate is added dropping the pH to 7. The major salts of solution 8 are dissolved, then the minor salts in solution are added slowly with stirring , the final pH is 5.2. Stock solutions A and 8 are used 1 to 500 or 200 ml stock solutions per 50 I of water.
169

Appendix 2.2
Scale
r------..__-----r- - - - - - - -
Blade - - - - - - - -
l :=--=--=------l 1-------'"11 - - - - - - - -
- - - - - - - - - - _ .... Test material
Front view Side view
M ovements of the b lade and position of the slot of a Warner-Bratzler
meat shear apparatus in shearing action.
(Arrows indicate directions of the movement)
170

Appendix 2.3
An exa m ple of table of ana lysis of variance fo r fresh weight of the
leaves of the l ow and h igh shear breakin g load perennia l ryeg rass
selections.
Source df Sum of Mean F value Probabil ity squares squares
Selection 3 . 1 333 3. 1 333 231 . 1 9 0.0001
Emergence nested in selection 4 5.5829 1 .3957 1 02.99 0 .0001
Aging nested in emergence leve l 6 0 .0140 0.0023 0 .1 7 0.9840
Replicates nested in aging level 225 3 .0493 0.01 36 Error term
Til ler nested in replicate 1 752 4.6646 0.0027
Total 1988 1 6.4441
17 1

Appendix 2.4
Concentrations (%DM) of organic matter, l ig n in and cell-wal l constituents of the
second-emerged (2nd), fourth-emerged (4th) and sixth-emerged (6th) leaves of the
low (n= 1 8) and high (n=1 8) leaf shear breaking load perennial ryegrass selections at
maturation (MOO), 1 0 days (M1 0) and 20 days (M20) after the maturation.
Selection Leaf Aging Organic Lignin Cel lu lose Hemi-emergence level matter cel lulose
M OO 88.2a 2.83 1 7.4a 22.oa
2nd M 1 0 86.7b 3.00 1 8 . 1 a 22.8a
M20 90.4c 3.53 25.3b 30 .6b
Aging effect 1 * ns *** ***
MOO 88.1 a 2.97ab 1 8 .9a 22.8a
LS 4th M 1 0 87.4a 2 . 13b 22.3b 24.0a
M20 9 1 .6b 3 .45ca 28.5c 27.9b
Aging effect 1 *** * ** ***
MOO 86.5a 2.63 20.3a 23.3a
6th M 1 0 85.4a 3.60 1 9 .9a 22.7a
M20 90.8b 3. 1 1 27.7b 28.2b
Aging effect1 *** ns *** ***
M OO 9o.oa 1 .65a 20.5a 23.9a
2nd M 1 0 88.2b 1 .83ab 20.oa 24.4a
M20 89.2ab 2.88b 24.6b 30.6b
Aging effect 1 ** * ** ***
MOO 89.1 a 1 .99 21 .6a 23. 1 a
HS 4th M1 0 88.4a 2.55 22.6a 24.9a
M20 90.5b 2.47 28.9b 3 1 .2b
Aging effect 1 * ns *** *
MOO 88.2a 1 .8oa 22.2a 23.2a
6th M1 0 87.2a 2.04a 23.3ab 23.3a
M20 90.3b 3. 1 7b 25.5b 30.7b
Aging effect 1 ** * * **
S.E.D.2 0 .61 0 .52 1 . 1 6 1 .51
LS pooled pooled 88.3 3.03 22. 1 26. 1
HS pooled pooled 89.0 2.61 23.2 24.9 selection effect3 ** *** ** *
S.E.D.3 0.20 0.1 7 0.39 0.50
1 : Leaves with different superscripts differ significantly within a leaf emergence. 2: Standard error of difference within a leaf emergence. 3: Standard error of difference between selections.
172

Appendix 3.1
An exa m ple of a table of analysis of variance for the p roport i o n of
particles larger than 1 mm in rumen contents recovered from wethers
immediately after ingesting the low {LS) and high {HS) shear breakin g
load perennial ryegrass selections.
Sampling scheme;
Block 1
LS HS
Day 1 A B seq1 C D seq2
Day 2 E F seq2 G H seq1
A.B.C.D�E.F.G .H: sheep
seq: sequence
Source df Sum of squares
Block 1 75 .55
Sequence 1 1 0 .26
Date 2 1 2. 1 3
Selection 1 <0.00
Selection x block 1 0 .58
Sheep 5 32.33
E rror 4 1 00 .57
Total 1 5 231 .43
Block 2
LS HS
Day 3 C D seq2 A B seq1
Day 4 G H seq1 E F seq2
M ean F value Pro babil ity squares
75.55 3.00 0 . 1 58 1
1 0 .26 0 .41 0.5576
6 .07 0 .24 0.7963
<0.00 <0.00 0.9967
0 .58 0 .02 0.8862
6.47 0 .26 0 .91 56
25. 1 4
173

Appendix 5.1
Portable marker infusion backpack set
1 : Peristaltic Universal Micro-metering Pump (manufactured by Everest Electronics Ltd. , Australia). 2: l nfusate in IV pack. 3: Silicone rubber tubing (3.35 mm id). 4: Protection silicone rubber tubing (4.80 mm id) and wire coil. 5: Cannulae plug. 6: Rubber webbing. 7: Garden mesh. 8: Joint (IV pack to the silicon rubber tubing). 9: Pinchcock. 10 : Suspender clip. 1 1 : Sponge pad.
174
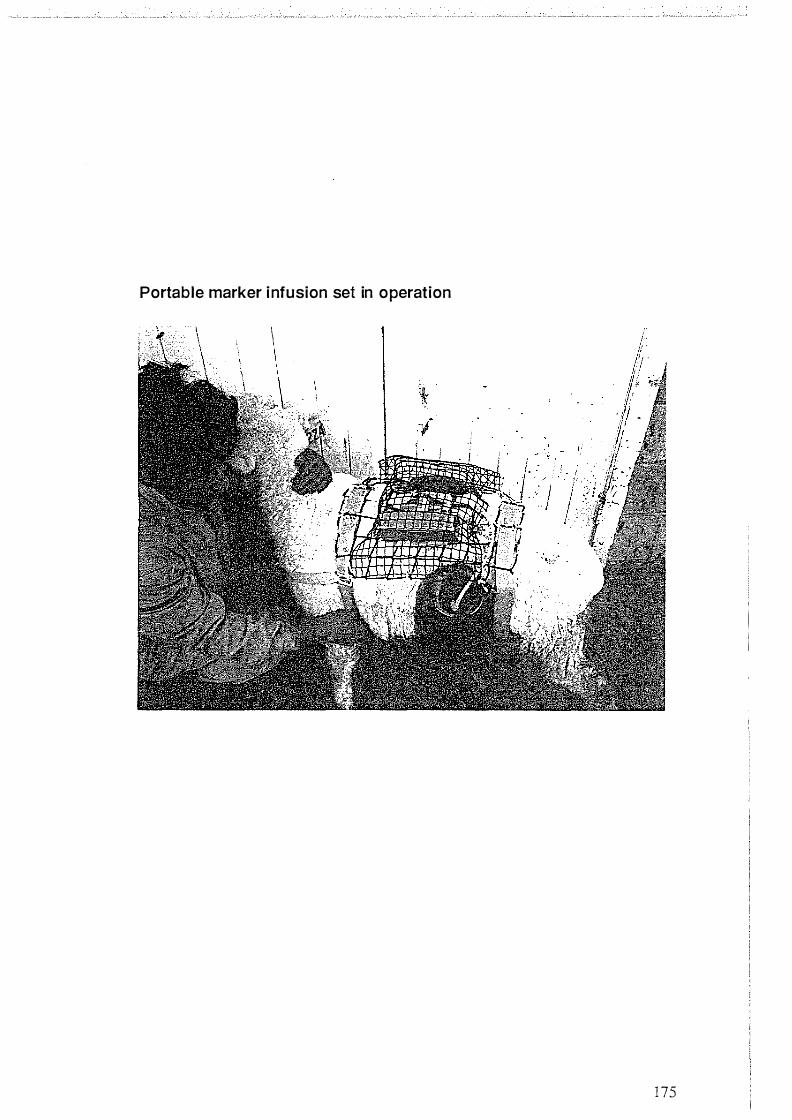
Portable marker infusion set in operation
\ \
, ,
l ji
.
t: p
'
. I . 1' //. . . -v · ;
1 75

Appendix 5.2
5000 l; - 'l l 4000
,.-.... 01 '-"
0 g_ 3000 0 ...... 0
1-
2000
1 000 ._�----�----�--�-----P----�----��
0 4 8 1 2 1 6
Time
0 LS 0--------- HS
20 24
500
400
0 ;;:::
"0 300 0 0
,.-.... 1.0 '-"
200
1 00
Diurnal pattern of total rumen pool (total pool) and dry matter rumen
poo l (OM pool ) of rumen-fistulated wethers (n=8) grazing perennial
ryegrass.
Diurnal pattern of rumen poo l size was determined by total bail ing at 0000, 0400, 0800,
1 200, 1 600, and 2000 hours in 8 rumen-fistulated wethers grazing PRG. Each animal was
rumen-emptied only twice a day, namely, at 0000 and 1 200 (day1 ) , 0400 and 1 600 (day 2) I \ and 0800 and 2000 (day 3) to minimize the stress on the animals.
176

Appendix 5.3
Preparation of Co(I I I )-EDTA.
The Co( I I I )-EDTA solution (4000 mgCo/L) was prepared as follows.
Equ i -m o l a r qu ant it i es of coba lt d ich loride (Co( I I ) C 12 •6H20) and disod i u m s alt of
ethylenediaminetetraacetic acid (Na2EDTA) were dissolved in distil led water and heated to
form Co( I I) -EDTA complex . 30% hydrogen peroxide (H202) was added to oxidise Co( I I)
EDTA to Co(I I I)-EDTA unti l co lour changed from red to purple. Excess of H202 was then
driven off by heating for approximately 4 hours .
177

Appendix 5.4
Estimation of Cr release rate.
Cr release rate was estimated based on the Cr203 tablets (n=1 2) i n the recovered
capsules from the rumen-fistu lated wethers as following;
Cr release rate mgCr/day = IT x r2 x d x I x (p/1 00) x mw
where
r = radius of the tablet (mm) <7>,
d = density of Cr (g/cm3) <2.08> ,
I = rate of disappearing of the tablet ( in length) (mm/d) <0.91 5±0.0 1 8 s.e.>,
p = concentration of Cr sesguioxide in the tablet (%) <74.5±1 .7 s.e.>,
mw = proportional molecular weight of Cr in Cr sesquioxide <0.6843>.
(<values .used in the present thesis>)
178

References
Akin, D . E. ( 1 976). Ultrastructure of rumen bacterial attachment to forage cell
walls. Applied and Environmental Microbiology 31, 562-568.
Akin, D. E. ( 1 979) . Microscopic evaluation of forage digestion by rumen
microorganisms - a review. Journal of Animal Science 48, 701-7 10.
Akin, D. E., Lyon, C. E., Windham, W. R. & Rigsby, L. L. ( 1989). Applied and
Environmental Microbiology SS, 61 1-616.
Bailey, R . W. ( 1964). Pasture quality and ruminant nutrition. New Zealand
Journal of Agricultural Research 7, 496-507.
Barthram, G. T. & Grant, S . A. (1984). Defoliation of ryegrass-dominated sward
by sheep. Gras� and Forage Science 39, 21 1-219.
Betteridge, G. P. , Talion, J. L., Staines, M. P. , Buckley, R. G., Bryan, H. L. &
Stevenson, I. C. ( 1986). An interim report on the tensile properties of four
forage grasses. PEL Report No. 933, Physics and Engineering DSIR, New
Zealand.
Bigland, B . & Lippold, 0. C. J. ( 1954). The relation between force, velocity and
integrated electrical activity in human muscle. Journal of Physiology 123,
214-224.
I
Binnerts, W. T., van ' t Klooster, A. Th. & Frens, A. M. (1968). Soluble chromium
indicator measured by atomic absorption in digestion experiments. The
Veterinary Record 82, 470.
Black, J. L., Faichney, G. J. & Sinclair, R. E. (1982). Role of computer simulation
179

in overcoming limitations to animal production from pastures . In
Nutritional limits to animal production from pastures, pp. 473-493 (J. B.
Hacker, editor) . Farnham Royal: Commonwealth Agricultural bureaux.
Black, J. L. & Kenney, P. A. ( 1984). Factors affecting diet selection by sheep. II.
Height and density of pasture. A ustralian Journal of Agricultural
Research 35, 565-578.
Black, J. L. ( 1990). Nutrition of the grazing ruminant. Proceedings of the New
Zealand Society of Animal Production 50, 7-27.
Blaxter, K. L., Graham, N. Me. & Wainman, F. W. ( 1956). Some observations on
the digestibility of food by sheep and on related problems. British Journal
ofNutrition 10, 69-9 1 .
Bowman, D . C . & Nakfoor, P . M . ( 1968). Evaluation of the human subjects ability
to differentiate intensity of forces applied to the maxillary central incisors.
Journal of Dental Research 47, 252-259.
Bratzler, L. J. ( 1949). Determining the tenderness of meat by the use of the
Warner-Bratzler method. Proceedings of the 2nd Reciprocal M eat
Conference, p. 1 17 .
Campling, R. C. & Balch, C. C. (1961) . Factors affecting the voluntary intake of
food by cows. 1 . Preliminary observations on the effect on the voluntary
intake of hay, of changes in the amount of reticulorumen. British Journal
of Nutrition 15, 523-530.
Chai, K. , Kennedy, P. M. & Milligan, L. P. ( 1984). Reduction in particle size
during rumination in cattle. Canadian Journal of Animal Science 64,
Suppl., 339-340.
Costigan, P. & Ellis, K. J. ( 1987). Analysis of faecal chromium from controlled
1 80

release devices. New Zealand Journal a/Technology 3, 89-92.
Cruickshank, G. J. (1986). Nutritional constraints to lamb growth at pasture. PhD
Thesis, University of Canterbury, New Zealand.
Cruickshank, G. J., Poppi, D. P. & Sykes, A. R. ( 1987). In Second International
Symp osium on the Nutrition of Herbivores, pp. 97-98 . Occasional
publication of the Australian Society of Animal Production.
Dellow, P . & Lund, J. ( 1 97 1 ) . Evidence for central timing of rhythmical
mastication. Journal of Physiology 215, 1- 13.
Dennis , B. & Frandsen, K. J. ( 1 9 86) . Breeding for improved digestibility in
temperate forage grasses. In Plant Breeding Symposium, pp. 29 1-294 (T.
A. Williams & G. M. Wratt, editors). New Zealand Agronomy Society,
Special Publication No. 5.
Domingue, B. M. F. , Dellow, D. W. & Barry, T. N. (1991a) . Voluntary intake and
rumen digestion of low-quality roughage by goats and sheep. Journal of
Agricultural Science, Cambridge 117, 1 1 1 - 120.
Domingue, B. M. F., Dellow, D. W. & Barry, T. N. (199 1b). The efficiency of
chewing during eating and ruminating in goats and sheep. British Journal
of Nutrition 65, 355-363.
Domingue, B . M. F . , Dellow, D. W. , Wilson, P. R. & B arry, T. N. (199 1 c).
Comparative digestion in deer, goats and sheep. New Zealand Journal of
Agricultural Research 34, 45-53.
Earle , D . F. & McCowan, A. A. ( 1 979) . Evaluation and calibration of an
automated rising plate meter for estimating dry matter yield of pasture.
A ustralian Journal of Experimental Agriculture and Animal Husbandry
19, 337-343.
1 8 1

Easton, H. S . (1989). Variability of leaf shear strength in perennial ryegrass. New
Zealand Journal of Agricultural Research 32, 1-6.
Egan, J. K. & Doyle, P. T. ( 1984). A comparison of particulate markers for the
estimation of digesta flow from the abomasum of sheep offered oaten hay.
Australian Journal of Agricultural Research 35, 279-29 1 .
Elliot, R. & Norton, B . W. ( 1 985). In vivo colonisation of grass cell walls by
rumen microorganisms. Journal of Agricultural Science, Cambridge 105,
279-283.
Esau, K. ( 1953). In Plant Anatomy, pp. 195-220. John Wiley & sons, New York.
Evans, C. C., MacRae, J. C. & Wilson, S. ( 1977). Determination of ruthenium and
chromium by x-ray fluorescence spectrometry and the use of inert
ruthenuim (II) phenanthroline as a solid phase marker in sheep digestion
studies. Journal of Agricultural Science, Cambridge 89, 17-22.
Evans, E. W., Pearce, G. W., Burnett, J. & Pillinger, S. L. ( 1973). Changes in
some physical characteristics of the digesta in the reticulo-rumen of cows
fed once daily. British Journal of Nutrition 29, 357-376.
Evans, E. W., Burnett, J. & Bines, J. A. (1974). A study of the effect of exposure
in the reticulo-rumen of the cow on the strength of cotton, grass , hay and
straw. British Journal of Nutrition 31, 273-284.
Evans, P.S . ( 1964a). A study of leaf strength in four ryegrass varieties. New
Zealand Journal of Agricultural Research n, 508-5 13.
Evans, P .S . ( 1 9 64b) . A comparison of some aspects of the anatomy and
morphology of Italian ryegrass (Lolium multiflorum Lam.) and perennial
ryegrass (L. Perenne L.). New Zealand Journal of Botany 2, 120- 130.
1 82

Evans, P. S . ( 1 967a). Leaf strength studies of pasture grasses. I. Apparatus ,
tech niques and some factors affecting leaf s trength. Journal of
Agricultural Science, Cambridge 69, 17 1 - 174.
Evans, P. S . ( 1 967b) . Leaf strength studies of pasture grasses. II. S trength,
cellulose content and sclerenchyma tissue proportions of eight grasses
grown as single plants. Journal of Agricultural Science, Cambridge 69,
175- 1 8 1 .
Faichney, G . J. (1975). The use of markers to partition digestion within the gastro
intestinal tract of ruminants. In D ig estion and Metabolism in the
Ruminant, Proceedings of the !Vth International Symposium on Ruminant
Physiology, pp. 277-29 1 (I. W. MacDonald & A. C. I. Warner, editors) .
The University of New England Publishing Unit.
Faichney, G. J. ( 1980). Measurement in sheep of the quantity and composition of
rumen digesta and of the fractional outflow rates of digesta constituents.
Australian Journ,al of Agricultural Research 31, 1 129- 1 137.
Fletcher, L. R. (1982). Observations of ryegrass staggers in weaned lambs grazing
different ryegras s pastures . New Zealand Journal of Exp erimental
Agriculture 10, 203-207.
Fletcher, L. R. & Harvey, I. C. ( 1981) . An association of a Lolium endophyte with
ryegrass staggers. New Zealand Veterinary Journal 29, 185-186.
Fletcher, L. R. ( 1986) . Lolium endophyte and sheep performance of perennial
ryegras s cultivars . Proceedings of the New Zea land Grassland
Association 47, 99-105.
Gallagher, J . R. & Watkin, B. R. ( 1 967) . S tudies in the evaluation of pasture
quality with young grazing sheep . Journal of Agricultural Science,
Cambridge 68, 87-93.
1 83

Greenhalgh, J. F. D. & Reid, G . W. (1969) . The herbage consumption and milk production of cows grazing S24 ryegrass and S37 cocksfoot. Journal of
the British Grassland Society 24, 98- 103.
Grovum, W. L. (1987). A new look at what is controlling food intake. In Food
Intake by Beef Cattle , pp. 1 -40 (F. N. Owens , editor) . Oklahoma State University: Stillwater.
Harris , P . J., Lowry, K. H. & Chapas, L. C. (1981) . Comparison of methods for measuring tissue areas in sections of plant organs. Annals of Botany 47,
15 1 - 154.
Hiiemae, K. M. (1978). Mammalian mastication: A review of the activity of the jaw muscles and the movements they produce in chewing. In Development, Function and Evolution of Teeth, pp. 359-398 (P. M. Butler & Y. K. A. Joysey, editors). Academic Press : London.
Hodgson, J. ( 1 9 85 ) . The control of herbage intake in grazing ruminant.
Proceedings of the Nutrition Society 44, 339-346.
Hodgson, J. ( 1 990). Grazing Management: S cience into practice. Longman Scientific & Technical: New York.
Hunt, W. F . & Halligan, G. ( 198 1 ) . Growth and development responses of perennial ryegrass grown at constant temperature. I. Influence of light and
temperature on growth and net assimilation. Australian Journal of Plant
Physiology 8, 181 - 190.
Hunt, W. F. & Thomas, V. J. ( 1 985). Growth and developmental responses of
perennial ryegrass grown at constant temperature. II . Influence of light
and temperature on leaf, tiller and root appearance. Australian Journal of
Plant Physiology 12, 69-76.
Inoue, T. , Brookes, I. M. & Barry, T. N. (1 989). Effects of selection for shear
strength on the voluntary intake and digestion of perennial rye grass fed to
sheep. Proceedings of the New Zealand Society of Animal Production 49,
221 -224.
184

John, A., Inoue, T., Brookes, I. M., Hunt, W. F. & Easton, H. S. (1989). Effects of
selection for shear strength on structure and rumen digestion of perennial
ryegrass. Proceedings of the New Zealand Society of Animal Production
49, 225-228.
Johns, A. T. (1962) . Some aspects of rumen metabolism influencing intake and
production in sheep. Proceedings of the New Zealand Society of Animal
Production 22, 88-98.
Jon e s , D. E . M. & B ailey , R. W. ( 1 972 ) . The hydrolysis of cell wall
polysaccharides from freeze-dried and oven-dried herbage by rumen and
mould carbohydrases. Journal of the Science of Food and Agriculture 23,
609-614.
Kawamura, Y. & Watanabe, M. ( 1960). Studies of oral sensory thresholds; the
discrimination of small differences in thickness of steel wires in persons
with natural and artificial dentitions. Medical Journal of Osaka University
10, 291-301 .
Kawamura, 0., Senshu, T., Horiguchi, M. & Matsumoto, T. (1976). Fractionation
of orchardgrass tissues by pectinase treatment and digestion of the cell
wall by rumen microorganisms. Journal of Japanese Society of Grassland
Science 22, 280-288.
Kawamura, 0., Tanaka, S. & Miaki, T. ( 1 9 8 1 ) . S implified fractionation of
orchardgrass tissues and the cell wall composition and digestibility by
rumen microorganisms. Bulletin of the Faculty of Agriculture, Miyazaki
University 27, 331-336.
Kelly, A. (1966). Fibre reinforcement. In Strong Solids, pp. 121-163. Clarendon
Press: Oxford.
Kenney, P. A. & Black, J. L. (1984). Factors affecting diet selection by sheep. I.
1 85

Potential intake rate and acceptability of feed. Australian Journal of
Agricultural Research 35, 55 1-563.
Kennedy, P. M. ( 1985). Effect of rumination on reduction of particle size of rumen
digesta by cattle. Australian Journal of Agricultural Research 36, 8 19-
828.
Kennedy, P. M. & Murphy, M. R. ( 1 988) . The nutritional implications of
differential passage of particles through the ruminant alimentary tract.
Nutrition Research Reviews 1, 1 89-208.
Kolver, E. S . (1989). The effect of reduced leaf shear strength on liveweight gain
and wool weight of wether lambs grazing 'Grassland Nui' ryegrass. B .
Agr. Sci. (Hons) Dissertation, Massey University, New Zealand.
Larmond, E. & Petrasovits , A. (1972). Relationship between Warner-Bratzler and
sensory determinations of beef tenderness by the method of p aired
comparisons . Canadian Institute of Food Science and Technology,
Journal S, 138- 144.
Lees, G. L., Howarth, R. E., Goplen, B. P. & Fesser, A. C. (1981) . Mechanical
disruption of leaf tissues and cells in bloat-causing and bloat-safe forage
legumes. Crop Science 21, 444-448.
Lee s , G. L . , Howarth, R . E . & Goplen , B . P . ( 1 9 82) . Morphological
I
characteristics of leaves from some legume forages: relation to digestion
and mechanical strength. Canadian Journal of Botany 60, 2126-21 32.
L'Huillier, P. J., Poppi, D. P. & Fraser, T. J. ( 1 98 6). Influence of structure and
composition of ryegrass and prairie gras s-white clover swards on the
grazed horizon and diet harvested by sheep. Grass and Forage Science 9,
447-456.
186
MacKinnon, B . W., Easton, H. S. , Barry, T. N. & Sedcole, J. R. (1988). The effect
of reduced leaf shear strength on the nutritive value of perennial rye grass.
Journal of Agricultural Science, Cambridge 111, 469-474.
MacRae, J. C. & Evans, C. C. (1974). The use of inert ruthenium-phenanthroline
as a digesta particulate marker in sheep._The Proceedings of the Nutrition
Society 33, 1 0A-1 1A.
McLean, J. W., Thomson, G. G., Jagusch, K. T. & Lawson, B. M. (1965). Lamb
growth and development in relation to pasture species. Proceedings of the
Ruakura Farmers' Conference Week 17, 34-42.
McLeod, M. N. & Wilson J. R. ( 1989). The effect of method of preservation of
forages on their resistance to reduction in particle size with an artificial
masticator. Animal Feed Science and Technology 24, 185-190.
Mitchell, K. J. & Soper, K. ( 1958). Effects of differences in light intensity and
temperature on the anatomy and development of leaves of Lolium perenne
and Paspalum diatatum. New Zealand Journal of Agricultural Research
1, 1 - 1 6.
M<j>ller, E. (1966). The chewing apparatus. An electromyographic study of the
action of the muscles of mastication and its correlation to facial
morphology. Acta Physiologica Scandinavica 69, Suppl. , 280.
Murphy, T. ( 1 959). The axis of the masticatory stroke in the sheep. Australian
Dental Journal 4, 104-1 1 1 .
Neter, J & Wasserman, W. ( 1974). Topics of regression analysis -I. In Applied
linear statistical models, pp. 140-178. Richard D. Irwin, Inc. :Illinois.
New Zealand Department of Statistics . (1983). Agriculture Statistics 1982-1983.
Department of Statistics, Wellington.
1 87

O'Connor, B. P. ( 1990), New Zealand Agricultural and Plant Protection Manual,
3rd ed. WHAM/Navasearch, Wellington.
Parker, W. J. ( 1990). Application of intraruminal chromium controlled release
capsules to the measurement of herbage intake of sheep at pasture. PhD
Thesis. Massey University, New Zealand.
Penning, P. D. ( 1985). Some effects of sward conditions on grazing behaviour
and intake by sheep. In Grazing Research at Northern Latitudes.
Proceedings of NATO Workshop. (0. Gudmundsson, editor). Iceland.
Phyllips, A. G. & Fibiger, H. C. ( 1973). Substantia nigra: self-stimulation and post
stimulation feeding. Physiological Psychology 1, 233-236.
Podolsky, R. J. & Tawada, K. (1980). A rate-limiting step in muscle contraction.
In Muscle Contraction: Its regulatory mechanisms, pp. 65-78 (S . Ebashi et
al. , editors) . Japan Science Society Press: Tokyo/Springer-verlag, Berlin.
W-Germany.
Pond, K. R . , Ellis , W. C. & Akin, D . E . ( 1 984) . Ingestive mastication and
fragmentation of forages. Journal of Animal Science 58, 1567- 1574.
Pool, M. F. & Klose, A. A. (1969). The relation of force to sample dimensions in
objective measurement of tenderness of poultry meat. Journal of Food
Science 34, 524-526.
Poppi, D. P., Norton, B. W., Minson, D. J. & Hendricksen, R. E. ( 1980). The
validity of the critical size theory for particle leaving the rumen. Journal
of Agricultural Science, Cambridge 94, 275-280.
Poppi, D. P., Minson, D. J. & Temouth, J. H. (198 1) . Studies of cattle and sheep
eating leaf and stem fractions of grasses . II. Factors controlling the
retention of feed in the reticulo-rumen. Australian Journal of Agricultural
188

R esearch 32, 109-121 .
Poppi, D. P . , Hendricksen, R . E. & Minson, D. J . (1985). The relative resistance to
escape of leaf and stem particles from the rumen of cattle and sheep.
Journal of Agricultural Science, Cambridge 105, 9-14.
Poppi, D. P., Hughes, T. P. & L'Huillier, P. J. (1987). Intake of pasture by grazing
ruminants. In Livestock Feeding on Pasture, pp.55-64 (A. M. Nicol,
editor). Occasional publication No. 10. New Zealand Society of Animal
Production.
Prestidge, R. A. , Pottinger, R. P . & Barker, G. M. ( 1982). An association of
Lolium endophyte with ryegrass resistance to Argentine stem weevil. In
Proceedings of the 35th New Zealand Weed and Pest Control Conference,
pp. 1 19- 122.
Rae, A. L. , Brougham, R. W., Glenday, A. C. & Butler G. W. (1963). Pasture type
in relation to liv:e-weight gain, carcass composition, iodine nutrition and
some rumen characteristics of sheep. I. Live-weight growth. Journal of
Agricultural Science 61, 1 87-190.
Rae, A. L., Brougham, R. W. & Barton, R. A. (1964). A note on liveweight gains
of sheep grazing different ryegrass pastures . New Zealand Journal of
Agricultural Research 7, 491-495.
Rattray, P. V. & Clark, D. A. (1984). Factors affecting the intake of pasture. New
Zealand Agricultural Science 18, 141-146.
I
Raymond, W. F. ( 1 969) . The nutritive value of forage crops . Advances in
Agronomy 21, 1 - 108.
Reid, C . S. W. (1984). The progress of solid feed residues through the rumino
reticulum, the ins and outs of particles. In Ruminant Physiology, Concepts
1 89

and Consequences , pp.79-84 (S . K. Barker, J. M. Gawthorne, J. B .
Mackintosh & D . B . Purser, editors) . University of Western Australia.
Rensberger, J. M. (1973). An occlusion model for mastication and dental wear in
herbivorous mammals. Journal ofPaleontology 47, 5 15-528.
Robertson, J. B. & van Soest, P. J. ( 198 1) . In The Analysis of Dietary Fibre in
Food, pp. 1 23- 1 5 8 (W. P. T. James & 0. Theander, editor). Marcel
Dekker: New York.
Roughan, P . G. & Holland, R. ( 1 977). Predicting in vivo digestibilities of
herbages by exhaustive enzymic hydrolysis of cell walls. Journal of the
Science of Food and Agriculture 28, 1057- 1064.
Sant, F. I. ( 1 969) . A comparison of the morphology and anatomy of seedling
leaves of Lolium multiflorum Lam. and L. perenne L.. Annals of Botany
33, 303-3 13 .
Schumacher, G. H. ( 1 985) . Comparative functional anatomy of jaw muscles in
reptiles and mammals. In Fortschritte der Zoologie Band 30, pp. 203-212
(Duncker & Fleischer, editor). Fischer-verlag: S tuttgart.
Soper, K. & Mitchell, K. J. ( 1956). The developmental anatomy of perennial
ryegrass (Lolium perenne L . ) . New Zealand Journal of Science and
Technology 37, 484-504.
Tan, T. N. , Weston, R. H. & Hogan, J. P. (197 1 ). Use of 103Ru-labelled tris ( 1 , 10-
phenanthroline)-Ruthenium (II) chloride as a marker in digestion studies
with sheep. International Journal of Applied Radiation and Isotopes 22,
301-308.
Terry, R. A. & Tilley, J. M. A. ( 1964). The digestibility of the leaves and stems of
perennial ryegrass, cocksfoot, timothy and white clover by sheep. Journal
190

of the British Grassland Society 26, 149- 155.
Thomson, B. C., Cruickshank, G. J., Poppi, D. P. & Sykes, A. R. (1985). Diurnal
patterns of rumen fill in grazing sheep. Proceedings of the New Zealand
Society of Animal Production 45, 1 17-120.
Thompson, K. F. & Poppi, D. P. (1990). Livestock production from pasture. In
Pastures, their ecology and management, (R. H. M. Langer, editor).
Oxford University Press: Auckland.
Thornton, R. F. & Minson, D. J. ( 1 973). The relationships between apparent
retention time in the rumen, voluntary intake and apparent digestibility of
legume and grass diets in sheep. A ustralian Journal of Agricultural
Research 24, 889-898.
Troelsen, J . E. & Bigsby, F. W. (1964). Artificial mastication - A new approach
for predicting voluntary forage consumption by ruminants. Journal of
Animal Science �3, 1 139- 1 142.
Turnbull, W. D. ( 1 970). Mammalian masticatory apparatus . In Fieldiana:
Geology vol.l8. Field museum of national history: Chicago.
Uden, P. & van Soest, P. J. ( 1982) . . The determination of digesta particle size in
some herbivores. Animal Feed Science and Technology 7, 35-44.
Ulyatt, M. J. ( 1970). Evaluation of pasture quality under New Zealand conditions.
Proceedings of the New Zealand Grassland Association 32, 61-68.
Ulyatt, M. J. ( 197 1) . Studies on the causes of the differences in pasture quality
between perennial ryegrass, short-rotation ryegrass and white clover. New
Zealand Journal of Agricultural Research 14, 352-367.
Ulyatt, M. J. ( 1973). Feeding value of herbage. In Chemistry and Biochemistry of
191
herbage, vol.3, pp. 1 3 1 - 178 (G. W. Butler & R. W. Bailey, editors ) .
Academic Press: London.
Ulyatt, M. J . ( 1 980) . The feeding value of temperate pastures. In Grazing
A nimals, pp. 1 25- 1 4 1 (F. H. W. Morley, edi tor) . Elsevier Scientific
Publishing Company: Amsterdam.
Ulyatt, M. J. ( 198 1 ). The feeding value of herbage: Can't it be improved? New
Zealand Agricultural Science 15, 200-205.
Ulyatt, M. J. ( 1983). Plant fibre and regulation of digestion in the ruminant. In
Fibre in Human and Animal Nutrition, pp. 103-107 (G. Wallace & L. Bell,
editors). The Royal Society of New Zealand: Wellington.
Ulyatt, M. J., Dellow, D. W., John, A., Reid, C. S . W. & Waghorn, G. C. ( 1986).
Contribution by chewing during eating and rumination to the clearance of
digesta from the reticulo-rumen. In Control of Digestion and Metabolism
in Ruminants, pp. 498-5 15 (L. P. Milligan, W. L. Grovum & A. Dobson,
editors). Englewood Cliffs: New Jersey.
van Soest, P. J. ( 1975). Physio-chemical aspects of fibre digestion. In Digestion
and Metabolism in Ruminants, pp. 35 1-365 (1. W. McDonald & A. C. I.
Warner, editors) . University of New England Publishing Unit: Armidale.
Vincent, J. V. (1 982) . The mechanical design of grass . Journal of Material
Science 17, 856-860.
Vincent, J. V. (1983). The influence of water content on the stiffness and fracture I
of grass leaves. Grass and Forage Science 38, 107- 1 14.
Vincent, J. V. ( 199 1 ) . Strength and fracture of grasses. Journal of Material
Science 26, 1 947- 1950.
192

Voisey, P . W . & Larmond, E . ( 1 974) . Examination of factors affecting
performance of the Warner-Bratzler meat shear test. Canadian Institute of
Food Science and Technology, Journal 7, 243-249.
Voisey, P. W. (1976). Engineering assessment and critique of instrument used for
meat tenderness evaluation. Journal ofTexture Studies 7, 1 1-48.
Waghorn, G. C. & Barry, T. N. ( 1987). Pasture as a nutrient source. In Livestock
Feeding on Pasture, pp.2 1 -37 (A. M. Nicol , editor) . Occasional
publication No. 10. New Zealand Society of Animal Production.
Waghorn, G. C., Shelton, I. D . & Thomas, V. J. (1989). Particle breakdown and
rumen digestion of fresh ryegras s (Lolium perenne L.) and lucerne
(M edicago sativa L.) fed to cows during a restricted feeding period.
British Journal of Nutrition 61, 409-423.
Warner, K. F. ( 1 928) . Progress report of the mechanical test for tenderness of
meat. R ecord, of P roceedings of the American society of A nimal
Production 1, 1 14- 1 16.
Welch, J. G. ( 1987). Return of particles from the omasum to the rumen. Journal
of Animal Science 64, Supple., 458.
Weston, R. H. & Poppi, D. P. ( 1987). Comparative aspects of food intake. In The
Nutrition of Herbivores: Second International Symposium on the Nutrition
of Herbivores, pp. 1 33- 1 6 1 (J. B . Hacker & J . H. Ternouth, editors).
Academic Press: Sydney.
I
Wilkins, R. J. ( 1 972). The potential digestibility of cellulose in grasses and its
relationship with chemical and anatomical parameters . Journal of
Agricultural Science, Cambridge 78, 457-464.
Williams, C. H., David, D. J. & Ilsmaa, 0. (1962). The de.termination of chromic
193

oxide in faeces samples by atomic absorption spectrophotometry. Journal
of Agricultural Science, Cambridge 59, 381-385.
Wilson, D. ( 1965) . Nutritive value and the genetic relationships of cellulose
content and leaf tensile strength in Lolium. Journal of Agricultural
Science 65, 285-292.
Wilson, G. F. & McDowall, F. H. ( 1966). Ryegrass varieties in relation to dairy
cattle performance. I. The influence of ryegrass varieties on milk yield
and composition. New Zealand Journal of Agricultural Research 9, 1042-
1 052.
Wilson, G. F. & Dolby, R. M. (1967). Ryegrass varieties in relation to dairy cattle
performance . II. A comparison of milk yield and composition from
tetraploid and diploid ryegrass varieties . New Zealand Journal of
Agricultural Research 10, 4 15-424.
194

Massey University Library Thesis Copyright Form
Title of thesis: The effects of leaf shear breaking load on the feeding value of perennial ryegrass for sheep
(1) (a) I give permission for my thesis to be made available to
readers in Massey University Library under conditions
determined by the Librarian.
-fb) I do not vt'ish my thesis to be mB:de B:vailB:ble to reB:der� 'NitJaoa:t my 'Nritt�m consent for . . . montJas.
(2) (a) I agree that my thesis, or a copy, may be sent to
another institution under conditions determined by the
Librarian.
�b) I do not v.risJa my tJagsis, or a copy, to l;)g sgnt to . anotJagr institution \¥ithout my '.vrittgn consgnt for "ftionths.
i' - .
(3) (a) I agree that my thesis may be copied for Library use.
(b) I do not wish my tJagsis to l;)g copigd for Library u�e for . .. . months
Signed
Date 2- J L-l V\ e/ lCL<l:Z., The copyright of this thesis belongs to the author. Readers must
sign their name in the space below to show that they recognise
this. They are asked to add their permanent address.
NAME AND ADDRESS DATE