the effects of longwall coal mining on the
TRANSCRIPT

THE EFFECTS OF LONGWALL COAL MINING ON THE HYDROGEOLOGY OF SOUTHWESTERN PENNSYLVANIA
by
Megan N. Witkowski
B.S. in Civil and Environmental Engineering, Florida State University, 2008
Submitted to the Graduate Faculty of the
Swanson School of Engineering in partial fulfillment
of the requirements for the degree of
Master of Science
University of Pittsburgh
2010

ii
UNIVERSITY OF PITTSBURGH
SWANSON SCHOOL OF ENGINEERING
This thesis was presented
by
Megan N. Witkowski
It was defended on
November 18, 2010
and approved by
Luis E. Vallejo, Ph.D., Professor
Xu Liang, Ph.D., Associate Professor
Thesis Advisor: Anthony T. Iannacchione, Ph.D. P.E. P.G., Associate Professor

iii
Copyright © by Megan N. Witkowski
2010

iv
THE EFFECTS OF LONGWALL COAL MINING ON THE HYDROGEOLOGY OF SOUTHWESTERN PENNSYLVANIA
Megan N. Witkowski, E.I.T., M.S.
University of Pittsburgh, 2010
The purpose of this study is to investigate the susceptibility characteristics of domestic and
agricultural water supplies that may be vulnerable to diminution or total loss in supply when
active longwall mining is in the vicinity of the potable aquifer systems of Southwestern,
Pennsylvania. Susceptibility characteristics include hydrogeologic setting, proximal location to
mining, and climatic conditions at the time of impact. The investigation serves the purpose of
enhancing our understanding and will aid in predicting potential impacts during future
undermining of water sources such as wells and springs. The investigation will demonstrate an
understanding of the pre and post-mining behavior of hydrologic systems by considering the
relationship between the geologic and mining characteristics. Geologic characteristics include
overburden composition and geomorphology of the surface. Mining characteristics include
mining method, overburden depth, extraction thickness, etc.
The study focuses on water supplies in Greene and Washington Counties with reported
losses or reductions in supply that were attributed to the seven active longwall mines in operation
between 2003 and 2008. The undermined water supplies represent a variety of hydrogeologic
settings and mining conditions prevalent in the Southwestern Pennsylvania longwall coalfield.
The knowledge gained from this analysis can be used to more adequately plan for potential
disruptions in water supplies subjected to longwall coal mining and the local conditions that may
better predict the vulnerability of water supplies to interruption or loss of the supply.

v
TABLE OF CONTENTS
1.0 INTRODUCTION ........................................................................................................ 1
1.1 PURPOSE .................................................................................................................. 4
2.0 METHOD OF STUDY ................................................................................................ 5
3.0 PRE-MINING HYDROGEOLOGY OF STUDY AREAS ...................................... 9
4.0 LONGWALL MINING IMPACTS ON HYDROLOGY ....................................... 14
4.1 SUBSIDENCE THEORY ....................................................................................... 15
4.2 GREENE AND WASHINGTON COUNTY WATER SUPPLIES .................... 23
5.0 CHARACTERISTICS OF SUSCEPTIBILITY ...................................................... 27
5.1 HYDROGEOLOGIC SETTING ........................................................................... 28
5.1.1 TOPOGRAPHY .......................................................................................... 28
5.1.2 OVERBURDEN .......................................................................................... 29
5.1.3 HYDROGEOLOGIC LOCATION SCENARIO .................................... 31
5.2 PROXIMAL LOCATION TO MINING .............................................................. 33
5.2.1 HYDROLOGIC ANGLE OF INFLUENCE ............................................ 33
5.2.2 PANEL LOCATION .................................................................................. 35
5.3 CLIMATIC CONDITIONS AT TIME OF IMPACT ......................................... 38
5.3.1 LONG-TERM AVERAGE PRECIPITATION RATES ......................... 38
5.3.2 SEASONAL INFILTRATION RATES .................................................... 40
5.4 MINE INFLOW ...................................................................................................... 42

vi
5.5 RESOLUTIONS TO IMPACTS ........................................................................... 44
6.0 UNDERMINING CHARACTERISTICS BY MINE ............................................. 45
7.0 SUMMARY ................................................................................................................ 49
8.0 CONCLUSION ........................................................................................................... 51
APPENDIX A .............................................................................................................................. 52
APPENDIX B .............................................................................................................................. 54
BAILEY MINE WATER SUPPLIES ............................................................................... 55
BAILEY MINE OVERBURDEN ..................................................................................... 56
BLACKSVILLE NO. 2 MINE WATER SUPPLIES ...................................................... 57
BLACKSVILLE NO. 2 MINE OVERBURDEN ............................................................. 58
CUMBERLAND MINE WATER SUPPLIES ................................................................. 59
CUMBERLAND MINE OVERBURDEN ........................................................................ 60
EMERALD MINE WATER SUPPLIES .......................................................................... 61
EMERALD MINE OVERBURDEN ................................................................................ 62
ENLOW FORK MINE WATER SUPPLIES .................................................................. 63
ENLOW FORK MINE OVERBURDEN ......................................................................... 64
HIGH QUALITY MINE WATER SUPPLIES ............................................................... 65
HIGH QUALITY MINE OVERBURDEN ...................................................................... 66
MINE 84 WATER SUPPLIES .......................................................................................... 67
MINE 84 OVERBURDEN ................................................................................................. 68
BIBLIOGRAPHY ....................................................................................................................... 69

vii
LIST OF TABLES
Table 4.1: Average panel widths, depths, critical panel widths, and classifications for each longwall mine. ................................................................................................................... 16
Table 4.2: Total number of undermined and impacted water supplies per longwall mine ........... 25
Table 4.3: Percentage of impacted water supplies by mine .......................................................... 26
Table 5.1: Number of water supplies unaffected and impacted based on their topographic location .............................................................................................................................. 29
Table 5.2: Number of water supplies unaffected and impacted based on their overburden classification ..................................................................................................................... 30
Table 5.3: Number of water supplies unaffected and impacted based on their location scenario 31
Table 5.4: Number of impacted water supplies (n=106) tabulated by month of occurrence. ....... 39
Table 5.5: Number of water supplies impacted based on month of undermining; left side- high groundwater recharge months and right side- months with high rates of evapotranspiration ............................................................................................................. 41
Table 5.6: The mine inflow rates (rates of pumping required) for each longwall mine. .............. 42

viii
LIST OF FIGURES
Figure 1.1: Plan view of generic longwall mine ............................................................................. 2
Figure 3.1: Natural valley stress relief fractures (Wyrick and Borchers 1981). ........................... 12
Figure 4.1: A schematic showing the three subsidence basin types (D’Appolonia 2009). .......... 18
Figure 4.2: Depiction of the four subsidence zones (Peng 2008) ................................................. 19
Figure 4.3: Zones of compression and tensile strata fracturing (Booth 1986) .............................. 20
Figure 4.4: Hydrologic response zones (Kendorski and Consultants 1993) ................................. 21
Figure 4.5: Average longwall panel’s approximate hydrologic response zones; adapted from (Kendorski and Consultants 1993; Peng 2008). ............................................................... 22
Figure 4.6: Greene County and the location of the four active mines of the study ...................... 23
Figure 4.7: Washington County and the location of the three active mines of the study ............. 24
Figure 4.8: Number of undermined (n=1,214) and impacted (n=106) water supplies ................. 25
Figure 5.1: Raster images for surface elevations (left) and slopes (right) used to classify water supplies ............................................................................................................................. 28
Figure 5.2: Percentage of impacted water supplies based on location scenario. .......................... 32
Figure 5.3: Distribution of angles of influence for impacted water supplies ................................ 34
Figure 5.4: Panel classification locations and stress location cross-section ................................. 35
Figure 5.5: Percentage of impacted water supplies at each longwall panel location. ................... 37
Figure 5.6: Precipitation totals compared to the long-term precipitation averages for Waynesburg ........................................................................................................................................... 39
Figure 6.1: Mine impact rates compared to percentage of hilltop supplies undermined by mine 46
Figure 6.2: Mine impact rates compared to average overburden of the mine .............................. 47
Figure 6.3: Mine impact rates compared to percentage of water supplies undermined by a longwall panel ................................................................................................................... 48

ix
ACKNOWLEDGEMENTS
I first need to thank my thesis committee members for their help and guidance throughout this
process; thank you Dr Iannacchione, Dr Liang, and Dr Vallejo.
This thesis would not have been possible without the hard work of the University of Pittsburgh’s
ACT 54 project team:
• Project Advisors: Dr Iannacchione, Dr Tonsor, and Dr Harbert
• My fellow graduate students: Jessica Benner, Alison Hale, and Tina Shendge
• My CEE team members: Nicci Iannacchione, Mohamed Koubaa, and Amy Patil
And finally I’d like to thank my biggest supporters: Florida Witkowskis, Pittsburgh Kays, Aaron,
Jorge, Jessica, and Dr I. Thank you for your support, guidance, kindness, and patience.

1
1.0 INTRODUCTION
Underground coal mining plays an integral role in Southwestern Pennsylvania’s economy. The
production of energy resources is vital to the everyday operations of the region and to the
country. It is estimated that Southwestern Pennsylvania’s underground bituminous coalfields
have produced approximately 52 million short tons of coal annually in recent years
(Administration 2010). The mining methods used to extract coal, in this study, include longwall
mining and room-and-pillar mining.
Longwall mines consist of a series of coal panels which can be over 1,000-feet (ft) in
width and up to three miles in length. Prior to extraction, the dimensions of the panels are
developed by gateroads. Gateroads are produced by the room-and-pillar method and are a series
of entries and crosscuts which leave large pillars of coal for roof support. The gateroads are
necessary for the movement of miners, machinery, and coal; as well as for the safe ventilation of
the mining face. Figure 1.1 presents a plan view of a generalized longwall mine configuration.
Longwall extraction is performed using a series of mechanized hydraulic roof supports, known
as shields. A double drummed shearer is used to strip the face of the coal. As the coal face is
stripped, crushed, and removed via a conveyor system, the shields move forward causing the
roof to cave behind the shields. After the immediate roof rock caves into the mine void, the
subsequent layers of the overburden strata become unstable and cave, fracture, or deform. The
caved area of a mined longwall panel is known as the gob. The propagation of strata instability

2
to the ground surface is called subsidence. The characteristics of subsidence and the creation of
a subsidence basin will be discussed further in Section 4.0.
Figure 1.1: Plan view of generic longwall mine
Surface features such as structures, roadways, water supplies, streams, and wetlands that
are located above or adjacent to underground coal mines can be affected by the subsidence
caused by mining. In 1966, legislation was passed, known as the Bituminous Mine Subsidence
Land Conservation ACT (BMSLCA) with the intention of providing protection to surface
features located above active coal mines. In 1994, an amendment to BMSLCA was passed,
known as ACT 54. This amendment further addresses surface property owner rights, coal mine
operator responsibilities, and Pennsylvania Department of Environmental Protection (PA DEP)
regulatory responsibilities. Surface features that are impacted by mining are the mine operator’s
responsibility to replace, repair, or provide compensation to a surface property owner for the
damages. Mine operators are also required to submit extensive permit applications which
document the pre-mining conditions of surface features. The legislation holds the PA DEP
responsible for ensuring that impacts to surface features are minimized, mining companies are

3
operating under their permits, any mining induced impacts to surface features are repaired by the
mine operator within a reasonable time period, and that an impact resolution has been achieved
between land owners and mine operators.
ACT 54 also mandates that the investigations and impact resolution efficiency of the PA
DEP and mine operators be reported and made public every five years. The University of
Pittsburgh was contracted to conduct the five year assessment for the years 2003 to 2008
(Iannacchione, Tonsor et al. 2010). The data reported in the PA DEP and University of
Pittsburgh contract assessment report and the data presented in this study are nearly the same.
The minor differences will be addressed in Section 2.0.

4
1.1 PURPOSE
Between 2003 and 2008, there were seven longwall mines in operation in Greene and
Washington Counties. The seven longwall mines mined a total of 78 longwall panels of varying
length and width. On average, these panels were 218 acres, and a total of 17,675 acres were
undermined using the longwall panel extraction technique over the five year period. The total
acreage, including the room-and-pillar sections for all seven longwall mines, was approximately
24,535 acres. A map showing the location of the active longwall mines and the extent of mining
throughout the five year period is contained in Appendix A.1.
Because this technique is widely utilized in Southwestern Pennsylvania the purpose of
this study is to explore the susceptibility characteristics of shallow aquifer water supplies that
may be vulnerable to a water loss or reduction in supply when active longwall mining is in the
vicinity. By better understanding the hydrogeologic response of the overburden strata to
longwall mining, occurrences of water supply losses can be predicted more accurately. Proper
prediction and assessment of these susceptibility characteristics may be beneficial for the
planning of mining operations or for regulatory agencies when determining the cause of a
reported water supply impact.

5
2.0 METHOD OF STUDY
The 3rd
Iannacchione, Tonsor et al. 2010
assessment report on the impacts of underground bituminous coal mining on the
Commonwealth of Pennsylvania was completed by the University of Pittsburgh for the time
period from August 2003 to August 2008 ( ). A portion of the
data procured in the University’s assessment report is utilized in this study, and the processes and
methodology of data procurement is outlined below:
• An intensive search of the PA DEP’s Bituminous Underground Mine Information
System (BUMIS) was completed. The BUMIS database is a tool used by the PA
DEP to track the status of the land features undermined by bituminous coal mining in
Western Pennsylvania by individual mines. Information regarding the property
number, feature type and use, and if an effect of mining was reported were compiled
in tabular format for all water supplies undermined in the five year assessment period.
• The PA DEP provided the University with 6-month mining maps for each active mine
in the study period. These maps detail the mining that occurred six months prior to
submission, the intended location of mining six months in advance of submission, and
the locations of the surface features undermined by each mine. The PA DEP defines
a surface feature as being undermined if it within 200-ft of active mining. These
maps were spatially located, or georeferenced, into the University’s Geographic
Information System (GIS) database, using prominent surface features or landmarks

6
located on the maps. The GIS database was created using ArcGIS software. The
extent of longwall mining, room-and-pillar mining, and locations of the water
supplies were then digitized into the GIS database. The dates of mining were input as
characteristic attributes, and each water supply that was digitized was given a unique
identifier.
• The purpose of the GIS database is to establish a link between the spatial locations of
surface features on the maps to the tabular, or characteristic, data collected from the
BUMIS database search. The tabular data was joined to the spatial location point on
the map using the unique identifier, allowing the tabular information to be
characteristic attributes of the spatial location in the GIS database.
• Additional characteristics were attributed to each water supply with the creation of
overburden maps and surface elevation contours. The maps were created from GIS
spatial layers that were gathered from the Pennsylvania Spatial Data Access
(PASDA) and U.S. Geological Survey (USGS) online spatial databases. The
characteristic measurements (i.e. overburden depth and surface elevation) were
calculated by ArcGIS and automatically added to the attribute tables. The distance to
mining, topographic relief characteristics (i.e. hilltop, hillside, or valley bottom),
location with respect to the longwall panel (i.e. mid-panel, quarter panel, gateroad, or
outside), and approximate date of undermining were manually input into the attribute
tables.
• Additional information regarding the pre-mining water supply characteristics (i.e.
well depth, spring production rates, etc.) were determined by exploring the Module 8
section of the permit files located at the California District Mining Office (CDMO).

7
Module 8 is the hydrology section of the permit application submitted by each mine
operator, which contains details regarding the natural hydrology of the mine’s
location, a water supply inventory, background or pre-mining sampling, a description
of the prediction of hydrologic consequence, the means of protecting the hydrologic
balance, and a hydrologic monitoring plan.
• The complete database was used to determine the vulnerability statistics of the
undermined water supplies, as well as to create maps to visually represent the mining
locations and their undermined surface features.
The limitations of this study include:
• Mining during a five year period was only considered; therefore any locations of
mining conducted before 2003 and after 2008 were not considered. As a result, water
supplies classified as being located outside of active mining during the assessment
may actually have been undermined.
• Water supply characteristics (i.e. depth to water, production rates) were not able to be
determined for the majority of supplies. These quantitative water supply
measurements, previous to and during mining, would have helped to determine water
level changes caused by mining.
• Post-mining aquifer conditions were not able to be determined for the majority of
water supplies. The post-mining aquifer conditions would have been useful to
determine if long-term aquifer recovery occurred or if there were permanent water
level changes due to mining.

8
A number of water supplies within the contract report (Iannacchione, Tonsor et al. 2010)
were not included in this study:
• The Shoemaker Mine was not included in this study because it is located primarily in
West Virginia and did not mine a considerable distance into Pennsylvania.
• Only water supplies with diminution or total loss of supply were considered in this
study.
• Ponds were not considered in this study.
• The regulatory classifications of Liable and No Liability were not used to classify the
water supplies in this study. Only water supplies that were impacted by mining, as
determined by PA DEP descriptions, and have a resolution on record confirming the
PA DEP description were included as impacted supplies. Water supplies not meeting
this criteria and located outside of 200-ft of mining were not included, as well.
If compared, the contract report and this study present similar trends and concepts, but
inventory totals and percentages are not the same because of the reduced data analyzed in this
study.

9
3.0 PRE-MINING HYDROGEOLOGY OF STUDY AREAS
The natural, pre-mining, hydrogeologic principles governing the strata’s ability to produce
adequate water supplies include geology, overburden composition, permeability,
recharge/discharge locations, etc. The movement of water through the stratigraphic layers of the
ground is influenced by permeability, which may be classified as primary or secondary. Primary
permeability refers to the movement of water through the intergranular pore spaces of the strata
layers, whereas secondary permeability refers to groundwater movement through geologic
features such as fractures, bedding plane separations, joints, and cleats associated with the strata
(Wyrick and Borchers 1981).
Greene and Washington County have similar geologic units, such that longwall mining
occurs in the Pittsburgh coalbed. This coalbed is located in the Monongahela Group and is fairly
uniform in thickness. The consistency in the coal deposition allows the longwall mining
technique to be utilized effectively. The water-bearing layers of interest are therefore located
between the Pittsburgh coalbed and the ground surface. The primary geologic units include the
most recently deposited alluvium associated with the Pleistocene/Holocene Group, then the
Dunkard Group, and finally the oldest of the units of interest, the Monongahela Group.
10
The water-bearing characteristics of a generalized geology of Greene and Washington
counties follow:
• Pleistocene/Holocene Group: This group contains the material of the alluvium formation
which has been deposited along stream valleys by the movement of water. The layer
consists of a distribution of gravel, sand, silt, and clay, and this distribution will vary in
different locations (Newport 1973). Depending on the soil particle distribution, the
alluvial layers can be an adequate to excellent water-bearing layers because water is able
to flow vertically and horizontally through the pore spaces of the soils.
• Dunkard Group: This group consists of the Greene, Washington, and Waynesburg
Formations (in descending order). The Greene Formation is composed of mostly thin
limestone, shale, and sandstone. The sandstone layers are the most hydrologically
productive units because they contain a larger number of fractures and planes of
weakness; and are therefore the most important water-bearing units in the formation.
Shale and limestone units are generally poor water-bearing units because of low
hydraulic conductivities and a small number of fractures. Overall, the Greene
Formation’s wells will yield approximately 2-gallons per minute (gpm) and tend to be
located within the first 120-ft of the ground surface (Newport 1973). The Washington
Formation also consists of shale, sandstone, and limestone, with the addition of several
coalbeds. On average, the wells drawing water from the Washington Formation yield
between two and three-gpm, and range from 30 to 300-ft deep. It is also common for the
formation to discharge water as springs or seeps with average discharges around 0.50-
gpm (Stoner, Williams et al. 1987). The basal layer of the Dunkard Group is the
Waynesburg Formation. This formation has slightly more productive sandstone and coal

11
water-bearing layers, which average well yields of 3.8-gpm (Stoner, Williams et al.
1987).
• Monongahela Group: This group consists of the Uniontown and Pittsburgh Formations.
The basal unit of the Pittsburgh Formation is the Pittsburgh coalbed. The formations
generally consist of a combination of coal, limestone, shale, and sandstone; however, the
hydrologic production capabilities vary widely across both Greene and Washington
counties. In Greene County, the average well yield is 8-gpm for Uniontown Formation
wells, and the Pittsburgh Formation produces sufficient quantities in the Eastern portion
of Greene County as well. However, the Pittsburgh Formation becomes too deep for
domestic water supplies in the central and western portions of Greene County. In
Washington County, the average well yield is 1-gpm and it is necessary for most of the
wells to be deeper than 100-ft below the ground surface (Newport 1973). Washington
County’s Uniontown and Pittsburgh Formations consist of largely impermeable fine
grained shale; which is why the county’s formations have low water-bearing capabilities.
Much of the available water is stored in the fracture and joint system of the Uniontown
and Pittsburgh Formations in Washington County.
The production of potable water from the geologic formations described above, not
considering the alluvium formation, is largely dependent on the secondary permeability of the
strata, particularly the region’s sandstone layers. Fractures within these strata layers are natural
conduits of groundwater that make it possible for water to move through the shallow aquifer
system in the region. The secondary permeability tends to decrease by an order of magnitude as

12
the overburden increases every 100-ft (Stoner, Williams et al. 1987), which is why the majority
of groundwater resources are within the first 200-ft of the ground surface.
The natural stress relief of valley systems also plays a role in the permeability of the
strata in different topographic locations (i.e. hilltop, hillside, and valley bottom). As shown in
Figure 3.1, natural stresses caused by compressional and tensile forces of the valley system
induce fracturing in valley bottoms in the form of compression faults and valley walls in the
form of tensile fracturing (Ferguson 1974). These natural fractures will lead to increased
secondary permeability (Wyrick and Borchers 1981). The fracture density will be higher in
valley bottoms and lower in hilltop locations, and because of this principle, the hilltop water
supplies will tend to produce less water compared with valley bottom water supplies.
Figure 3.1: Natural valley stress relief fractures (Wyrick and Borchers 1981).
Aside from permeability, the hilltop water supplies are located in the recharge areas, and
are dependent on water infiltrating into the ground after a precipitation event. Valley bottoms

13
are almost always areas of water discharge from groundwater sources or overland runoff. Water
enters into the groundwater system through infiltration and flows from areas of high hydraulic
head to low hydraulic head to eventually discharge into the valley bottom. As water travels
downward through the strata it often encounters a stratigraphic layer of very low permeability,
creating perched or semi-perched aquifer conditions. This impermeable layer impedes the water
from percolating vertically, forcing the water to move laterally along the horizontal bedding
plane to eventually discharge as a hillside spring or seep. These springs will exit the hillside
where a fractured and permeable layer outcrops above an unfractured and impermeable layer.
Seasonal fluctuations in precipitation and infiltration rates can alter the amount of water
circulating through the shallow aquifer system. Areas of recharge, or hilltop supplies, will see
the greatest fluctuation of water levels during periods of low precipitation because the recharge
water takes more time to reach the deeper hilltop supply levels as compared to valley bottom
supplies levels. The discharges from hillside springs and water levels in wells less than 100-ft
deep can see large production decreases during times of low precipitation (Stoner, Williams et al.
1987). However, springs lower on the hillside or in valley bottoms may prove more viable
during times of low precipitation. Recharge rates are the highest between late fall and early
spring, and during the growing season (April to September) much of the recharge potential is lost
to evapotranspiration (evaporation and vegetation usage). Therefore, the groundwater levels are
generally highest in late winter, and lowest in late summer. Nearly 40-percent (pct) of the
average annual precipitation is lost to evapotranspiration throughout the year (Newport 1973).
The pre-mining hydrologic and geologic characteristics of the overburden strata, allow
for the potential production of small to moderate residential supplies throughout the year in
Greene and Washington Counties.

14
4.0 LONGWALL MINING IMPACTS ON HYDROLOGY
The overburden strata, in its pre-mining state, can produce adequate water supplies from the
natural strata and its permeability. By creating a void in an underground setting the natural flow
paths in the vicinity of the collapsed area have the potential to be altered. The elevation of the
original water table and flow characteristics of the groundwater are susceptible to changes due to
the overburden changes associated with subsidence. The alteration of overburden hydrologic
characteristics can potentially result in the depletion or total loss of a water supply producing
from the pre-mining production levels.

15
4.1 SUBSIDENCE THEORY
As briefly discussed in Section 1.0, longwall mining is a full extraction technique that allows
controlled and immediate subsidence of the ground surface. As the coal is being mined, the roof
support shields are advanced with the mining face, and the previously supported overburden is
allowed to cave into the void behind the shields. This area of fractured strata is also known as
the gob. Over the full extent of the panel, the shields advance many times leaving an area of gob
of nearly the dimensions of the mined panel. This gob area is translated to the ground surface as
a subsidence basin. Subsidence basins will range in size and depth depending on the panel
dimensions, extraction thickness, and depth of overburden.
The basin can reach a point of maximum subsidence, or greatest vertical drop, when the
critical panel width has been achieved (Peng 2008). If the actual panel width does not exceed the
critical panel width, the subsidence basin is classified as a subcritical basin, and maximum
subsidence is not achieved. The critical panel width, or short panel side, is linearly related to the
overburden thickness, as shown in the equation:
𝑊𝑊𝑊𝑊 = 100 + 1.048 ∗ ℎ (4-1)
where
Wc = critical width, feet
h = overburden thickness, feet
A point of maximum subsidence along the centerline of the panel, will be achieve when
the actual panel width equals the critical panel width; also known as a critical subsidence basin.
Once the critical panel width is surpassed by the actual panel width the subsidence basin is

16
considered a supercritical basin. A supercritical subsidence basin will reach the maximum
subsidence and maintain the maximum value laterally over a large area in the base of the basin.
Table 4.1 below provides a summary of the average panel widths, overburden, critical panel
width, and subsidence basin classification for each of the seven longwall mines.
Table 4.1: Average panel widths, depths, critical panel widths, and classifications for each longwall mine.
Mine Name Average Panel Width (ft)
Average Overburden Depth (ft)
Critical Width (ft)
Panel Classification
Bailey 1076 648 779 Supercritical Panels
Blacksville No. 2 1013 887 1030 Subcritical Panels
Cumberland 1183 739 874 Supercritical Panels
Emerald 1345 725 860 Supercritical Panels
Enlow Fork 1068 750 886 Supercritical Panels
High Quality 694 338 454 Supercritical Panels
Mine 84 1114 627 757 Supercritical Panels
The average longwall panels for six of the mines, except the Blacksville No. 2 mine, are
supercritical in classification. The average overburden depth of the Blacksville No. 2 mine is
deep enough that the actual panel width does not exceed the critical panel width which is why it
is considered subcritical in nature.
The maximum possible subsidence (Smax) for supercritical panels can be determined by
the relationship:
𝑆𝑆𝑆𝑆𝑆𝑆𝑆𝑆 = 𝑆𝑆 ∗ 𝑆𝑆 (4-2)

17
where
Smax = maximum possible subsidence depth, feet
m = extraction thickness, feet
a = subsidence factor, dimensionless
The subsidence factor can be represented by the equation (Peng 2008):
𝑆𝑆 = 0.6815519 ∗ 0.9997398ℎ (4-3)
where
a = subsidence factor, dimensionless
h = overburden thickness, feet
The calculated average subsidence factor, based on the average overburdens for each
mine (Table 4.1) is approximately 0.6 using Equation 4-3. An investigation on the effects of
longwall subsidence on highways using actual subsidence measurements from Southwestern
Pennsylvania longwall panels was conducted, and the average observed subsidence factor of
these panels was approximately 0.66 (Gutiérrez 2010). Under the assumption that the average
extraction height for each panel is 6-ft, the standardized Smax value for the typical longwall panel
for this study is calculated to be between 3.5-ft to 4-ft.
Another relevant property of a subsidence basin is the angle of draw. This angle is
measured from the vertical edge of the mined longwall panel to the point on the ground surface
in which the subsidence basin is no longer present. Values of 10 to 25 degrees are typical values
for the angle of draw in the Southwestern Pennsylvania’s coal field (Society for Mining 1992).

18
Figure 4.1 is a diagram that shows the properties and basin shapes of a subcritical,
critical, and supercritical subsidence basin (D’Appolonia 2009).
Figure 4.1: A schematic showing the three subsidence basin types (D’Appolonia 2009).
Subsidence propagation will cause the rock strata of the overburden to deform as well.
This deformation results in portions of the strata between the mine elevation and the ground
surface to fracture and displace. The subsided overburden strata are divided into four zones with
differing degrees of fracturing (Peng 1992), as shown in Figure 4.2. The variances noted in the
height of the zones are primarily due to the types of material comprising the strata. The zone
closest to the mine void, called the caved zone, is where the roof rock caves irregularly into the
mined out void. The height of this zone can be two to ten times the thickness of the mining
height. Above the caved zone is the fractured zone where the strata are highly fractured, but
remain stratified. This zone thickness can range between 28 to 52 times the mining height. The

19
next zone is called the continuous deformation zone where the strata bends and separates but
does not fracture. The uppermost zone is known as the soil zone, where the basin intercepts the
ground surface. It is possible for tension cracks to develop in this zone and propagate downward
from the surface.
Figure 4.2: Depiction of the four subsidence zones (Peng 2008)
Regions of compressive and tensile stresses will also form as a result of the creation of a
subsidence basin (Figure 4.3). Compressive stresses will cause the strata to shift laterally along
the bedding planes or rupture in shear. These stresses can also open horizontal bedding planes
and increase the lateral water movement, or create additional fractures when ruptured. Tensile
stresses cause natural fractures to widen or new fractures to form, which can create new or larger
vertical pathways for groundwater to move or be stored.

20
Figure 4.3: Zones of compression and tensile strata fracturing (Booth 1986)
The subsided overburden strata are divided into five zones based on their hydrologic
responses to high extraction mining (Kendorski and Consultants 1993). These zones include
(from mine to surface) a caved zone, fractured zone, dilated zone, constrained strata zone, and
surface fracture zone. The caved zone is reported to be six to ten times the thickness of the
extraction height and this zone is considered to be an area of complete hydrologic disruption.
Above the caved zone is the fractured zone. The strata within the fractured zone contain
vertically transmissive fractures, and the zone thickness can range between 24 to 30 times the
extraction thickness. The next zone is called the dilated zone, and its characteristics include
increased storativity with little or no vertical transmissivity. The dilated zone can range in
thickness from 30 to 60 times the extraction height. If the mine is located deeper than the
summation of the preceding zones thicknesses plus 50-ft for the surface fracture zone, there is a
remaining intermediate zone of overburden called the constrained zone. Mining is reported to
have little to no effect on the transmissivity or storativity of the strata in this zone. The
uppermost zone is known as the surface fracture zone, and this is where the basin intercepts the
ground surface, which can have vertically transmissive surface cracks. A common thickness of

21
this zone is reported to be around 50-ft thick. A depiction of the five zones with their relative
thicknesses and their hydrologic response descriptions is shown in Figure 4.4.
Figure 4.4: Hydrologic response zones (Kendorski and Consultants 1993)
Based on overburden response models by Peng (2008) and Kendorski and Consultants
(1993), the expected hydrologic responses are controlled by overburden and extraction
thicknesses. Shallow undermining results in a decreased distance from the mine void to the
ground surface, which causes the subsidence zones of higher deformation and fracturing to be
located nearer to the potable aquifer system (Peng 1992; Kendorski and Consultants 1993).
Figure 4.5 presents a visualization of the possible hydrologic conditions that the potable aquifer

22
systems may be encountering at an average overburden depth of 650-ft and an extraction
thickness of 6-ft, representative of this study.
Figure 4.5: Average longwall panel’s approximate hydrologic response zones; adapted from (Kendorski
and Consultants 1993; Peng 2008).
As shown in Figure 4.5, the potable water supplies are generally drawing water from
within the soil fracture zone and dilated zone which are associated with aquifer flow changes.
Generally, the depth of overburden did not allow for the formation of a constrained zone, where
little to no mining impact is generally observed. As the overburden depth increases a constrained
zone between the dilated and soil fracture zone will develop, decreasing the likelihood that
shallow aquifer groundwater levels would be altered by the dilated and fractured zones.
Therefore, one would expect that as overburden thickness increases, the highly fractured strata
would be located deeper underground, with the possible formation of a constrained zone, and an
overall expectation of a decrease in the number of water supplies being impacted by mining.

23
4.2 GREENE AND WASHINGTON COUNTY WATER SUPPLIES
There were four longwall mines that actively mined in Greene County between 2003 and 2008.
Figure 4.6 shows the location of the four active mines of Greene County and the extent of mining
over the five year period for each mine. Combined, these four longwall mines undermined
approximately 15,700 acres in the five year period.
Figure 4.6: Greene County and the location of the four active mines of the study
There were three longwall mines that actively mined in Washington County between
2003 and 2008. Figure 4.7 shows the location of the three active mines of Washington County
and the extent of mining over the five year period for each mine. Combined, these three
longwall mines undermined approximately 8,800 acres in the five year period.

24
Figure 4.7: Washington County and the location of the three active mines of the study
Collectively, the seven longwall mines undermined 1,214 wells and springs. Table 4.2,
provides a summary of the number of water supplies undermined by each of the seven mines. Of
these 1,214 undermined water supplies, 106 of the supplies were identified and tracked as having
had a water supply diminution or total loss attributed to longwall mining during the five year
period; which is also shown in Table 4.2. A summary map for each mine depicting the locations
of the undermined and impacted water supplies and the corresponding overburden values are
provided in Appendix B.1.

25
Table 4.2: Total number of undermined and impacted water supplies per longwall mine
Mine Name Water Supply Type Undermined Water Supplies
Impacted Supplies Well Spring
Bailey 116 142 258 19 Blacksville No.2 44 25 69 3
Cumberland 77 73 150 11 Emerald 89 90 179 13
Enlow Fork 136 221 357 25 High Quality 1 7 8 8
Mine 84 106 87 193 27 Total 569 645 1214 106
Figure 4.8 shows a comparison between the total number of undermined water supplies
compared to the total number of impacted supplies per mine.
Figure 4.8: Number of undermined (n=1,214) and impacted (n=106) water supplies
Based on the tables and figures shown, all of the mines impacted water supplies that it
undermined. The percentages of impacted supplies are presented in Table 4.3. The maximum
percentage of water supplies impacted is the High Quality Mine which impacted 100-percent of
357
258193 179
150
69825 19 27 13 11 3 8
050
100150200250300350400
Undermined Water Supplies Impacted water supplies

26
its supplies; followed by Mine 84 with a 14-percent impact rate. Four of the mines, Bailey,
Cumberland, Emerald, and Enlow Fork, impacted approximately 7-percent of the water supplies
undermined. The minimum percentage of impacted water supplies is the Blacksville No. 2
Mine, with 4-percent of undermined supplies with impacts. Overall, 8.73-percent of undermined
water supplies were impacted due to longwall mining from 2003 to 2008.
Table 4.3: Percentage of impacted water supplies by mine
Mine Name Percent Impacted
High Quality 100.00 Mine 84 13.99 Bailey 7.36
Cumberland 7.33 Emerald 7.26
Enlow Fork 7.00 Blacksville No.2 4.35
Since each mine’s water supplies reacted differently to the undermining process, as
shown by the percentages of impacted supplies per mine, it is clear that there is variability in the
hydrologic, geologic, and mining characteristics at each mine’s location. Therefore, it is
necessary to analyze the vulnerability characteristics of each water supply undermined by
longwall mining. Trends in individual water supply hydrogeologic and mining settings will be
analyzed in Section 5.0 to determine if particular characteristics will culminate into a water
supply impact or a successful undermining.

27
5.0 CHARACTERISTICS OF SUSCEPTIBILITY
A reason for the large variance in percentages of impacts at several of the mines may be the
result of certain mines undermining water supplies that are more characteristically susceptible to
a water loss, based on the attributes of the water supply. Some of these factors pertain to their
hydrogeologic setting, proximal location to mining, and timing at which each water supply was
undermined. Using a portion of the ACT 54 assessment data (refer to Section 2.0 for data
criteria), supporting literature, Module 8 of mine permit files, and the input of each water
supply’s characteristic attributes from the ArcGIS database, an analysis of an individual water
supply’s characteristic susceptibility is presented. The following subsections provide data to
substantiate or refute the influence of these water supply settings on the likelihood of an impact.

28
5.1 HYDROGEOLOGIC SETTING
5.1.1 TOPOGRAPHY
The water supplies can be classified as being topographically located on a hilltop, hillside, or
valley bottom. Hilltops and valley bottoms are low slope areas classified by their relative high
and low topographic elevations, respectively. Hillsides are areas of midrange elevations with
high slope values (Figure 5.1).
Figure 5.1: Raster images for surface elevations (left) and slopes (right) used to classify water supplies
Many studies have reported differences in impact rates associated with a water supply’s
topographic location; with hilltop supplies being the most frequently impacted, followed by
hillsides, and finally valley bottoms (Walker 1988; Leavitt and Gibbens 1992; Carver and Rauch
1994). The reasoning behind these results is most closely related to the recharge/discharge
principles in a valley system. Valley bottoms supplies, located in discharge areas, will benefit
from water recharge from upland areas; whereas hilltop supplies are dependent on recharge from

29
precipitation events. Table 5.1 presents the percentages of impacted supplies based on their
topographic location.
Table 5.1: Number of water supplies unaffected and impacted based on their topographic location
Topographic Classification
Unaffected Impacted Percent Impacted
Hilltops 200 26 13.00 Hillsides 535 48 8.97
Valley Bottom 373 32 8.58
Approximately 13.0-percent of the undermined hilltop supplies were impacted; with
hillsides and valley bottom supplies being impacted 9.0-percent and 8.6-percent, respectively.
These results coincide with literature findings while demonstrating that hilltop water supplies
may be more susceptible to even small groundwater elevation changes; whereas the valley
bottom supplies are more likely to have an adequate quantity of water discharging into the valley
area that any potential losses can be overcome. It is possible that the overburden disturbance
may provide a connection from the higher groundwater elevations found with hilltop and hillside
supplies, to deeper fracture systems of the valley bottom (Leavitt and Gibbens 1992).
5.1.2 OVERBURDEN
The average overburden for all seven longwall mines is approximately 687-ft with a standard
deviation of 97-ft. For normally distributed data, such as longwall overburden, one standard
deviation above and below 687-ft accounted for 2/3 of the data. Data in this range is considered

30
average for this study. Overburden values less than 590-ft are considered shallow and,
conversely, greater than 784-ft are classified as deep.
Apart from Kendorski and Consultant’s hydrologic response model, several studies found
that overburden thickness helps to determine the extent of aquifer system changes associated
with high extraction mining. Strata dewatering was found to be limited to overburdens less than
700 feet (Tieman and Rauch 1987), and dewatering problems are greater when overburden
values are less than 500-ft (Dixon and Rauch 1988; Parizek and Ramani 1996). Table 5.2 shows
the percent of water supplies impacted based on their classification as shallow, average, and deep
for this study.
Table 5.2: Number of water supplies unaffected and impacted based on their overburden classification
Overburden Classification
Unaffected Impacted Percent Impacted
Shallow 245 26 10.61 Average 640 57 8.91
Deep 223 23 10.31
Approximately 10.6-percent, 8.9-percent, and 10.3-percent of water supplies were
impacted at shallow, average, and deep overburdens, respectively. The impact rate for deep
supplies of 10.3-percent does not substantiate the results reported by other studies, but the large
number of impacted hilltop supplies, nearly 60-percent, at deep overburdens, may play a role in
the high impact rate for the deep supplies.

31
5.1.3 HYDROGEOLOGIC LOCATION SCENARIO
A combination of the water supplies’ topographic and overburden classification is presented to
determine if there are location scenarios that are more or less susceptibility to being undermined
as shown in Table 5.3.
Table 5.3: Number of water supplies unaffected and impacted based on their location scenario
Depth Topographic Location
Impact Category Unaffected Impacted
Shallow Hilltop 0 6 Hillside 79 5
Valley Bottom 166 15
Average Hilltop 91 7 Hillside 343 33
Valley Bottom 206 17
Deep Hilltop 109 13 Hillside 113 10
Valley Bottom 1 0
It is not unusual to see the majority of impacted supplies being attributed to an average
overburden depth because of the overburden normal distribution methodology. The potential
susceptibility of a particular topographic location and overburden scenario was determined by
relative percentages at each location scenario and shown in Figure 5.2.

32
Figure 5.2: Percentage of impacted water supplies based on location scenario.
As shown in Figure 5.2, the relative percentage of water supplies impacted at shallow
hilltop locations is 100-percent, and conversely zero deep valley bottom water supplies were
impacted. There was only one data point for the deep valley bottom supplies, so it is unclear if
this percentage would be as low if there was a larger dataset at this location. The other
topographic locations at differing overburdens show that an average of 92-percent of water
supplies remained unaffected after undermining. Shallow hilltop water supplies are particularly
susceptible to an impact due to undermining.
100
6 8 7 9 8 11 800
10
20
30
40
50
60
70
80
90
100
Shallow Hilltop
Shallow Hillside
Shallow Valley Bottom
Average Hilltop
Average Hillside
Average Valley Bottom
Deep Hilltop
Deep Hillside
Deep Valley Bottom
Perc
ent I
mpa
cted
Topographic Location

33
5.2 PROXIMAL LOCATION TO MINING
5.2.1 HYDROLOGIC ANGLE OF INFLUENCE
Acceptable values for the angle of draw for the coal fields of Southwestern Pennsylvania range
from 10 to 25-degrees; however the extent of hydrologic changes may extend beyond the
distance predicted by the angle of draw. Several studies reported maximum observed hydrologic
angle of influence in Southwestern Pennsylvania’s Pittsburgh coalbed of 27 to 38-degrees
(Carver and Rauch 1994), 24-degrees (Moebs and Barton 1985), and 42-degrees (Tieman and
Rauch 1987). The lateral distance between the water supply and the edge of the longwall panel
was determined in the ArcGIS database. Using the overburden depth and the measured lateral
distance, the angle of influence of the longwall panel to the water supply was determined using
the following geometric relationship:
𝐴𝐴𝐴𝐴𝐴𝐴𝐴𝐴𝐴𝐴 𝑜𝑜𝑜𝑜 𝐼𝐼𝐴𝐴𝑜𝑜𝐴𝐴𝐼𝐼𝐴𝐴𝐴𝐴𝑊𝑊𝐴𝐴 = arctan �𝐿𝐿𝑆𝑆𝐿𝐿𝐴𝐴𝐿𝐿𝑆𝑆𝐴𝐴 𝐷𝐷𝐷𝐷𝐷𝐷𝐿𝐿𝑆𝑆𝐴𝐴𝑊𝑊𝐴𝐴𝑂𝑂𝑂𝑂𝐴𝐴𝐿𝐿𝑂𝑂𝐼𝐼𝐿𝐿𝑂𝑂𝐴𝐴 𝐴𝐴
� (5-1)
The hydrologic angles of influence were calculated using the above equation for the
impacted water supplies. The distribution of angles varied from zero-degrees, or directly over
the longwall panel, to greater than 70-degrees. It is important to note that the water supplies
were inventoried based on the PA DEP’s regulatory standpoint that considers water supplies
undermined if they are within 200-ft of any active mining, longwall or room-and-pillar mining
methods. Therefore, it was not uncommon to see large angles of influence because the water
34
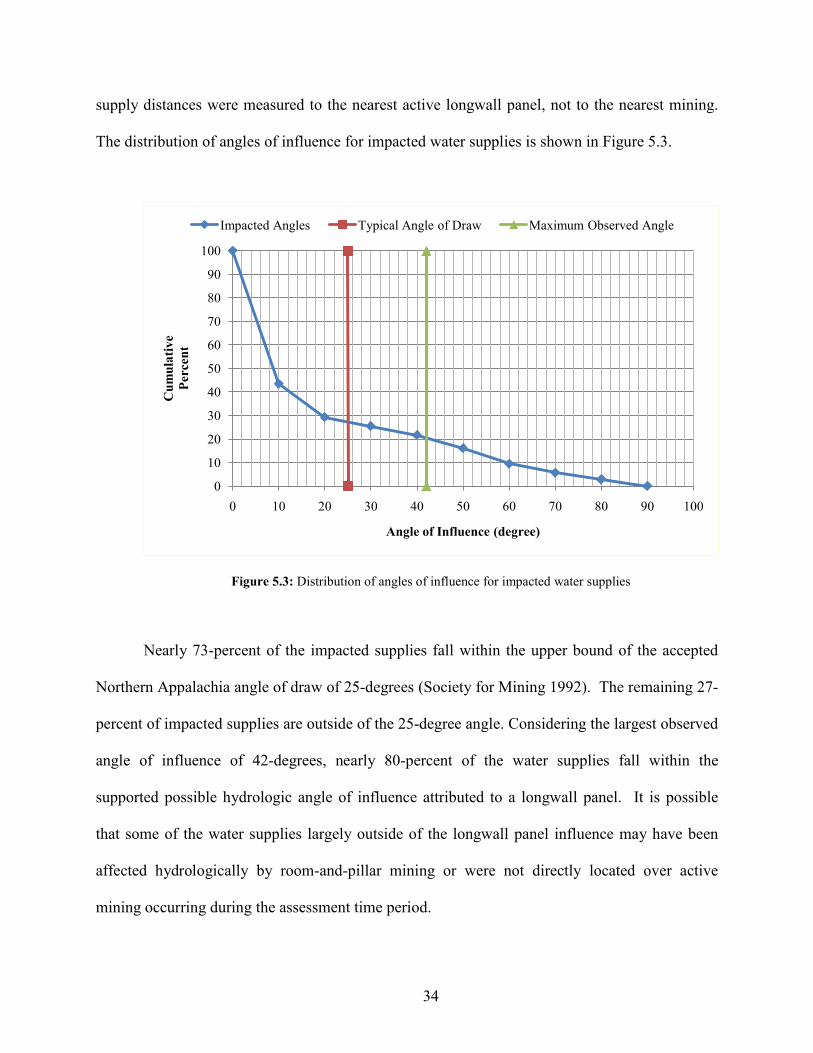
supply distances were measured to the nearest active longwall panel, not to the nearest mining.
The distribution of angles of influence for impacted water supplies is shown in Figure 5.3.
Figure 5.3: Distribution of angles of influence for impacted water supplies
Nearly 73-percent of the impacted supplies fall within the upper bound of the accepted
Northern Appalachia angle of draw of 25-degrees (Society for Mining 1992). The remaining 27-
percent of impacted supplies are outside of the 25-degree angle. Considering the largest observed
angle of influence of 42-degrees, nearly 80-percent of the water supplies fall within the
supported possible hydrologic angle of influence attributed to a longwall panel. It is possible
that some of the water supplies largely outside of the longwall panel influence may have been
affected hydrologically by room-and-pillar mining or were not directly located over active
mining occurring during the assessment time period.
0
10
20
30
40
50
60
70
80
90
100
0 10 20 30 40 50 60 70 80 90 100
Cum
ulat
ive
Perc
ent
Angle of Influence (degree)
Impacted Angles Typical Angle of Draw Maximum Observed Angle

35
5.2.2 PANEL LOCATION
Longwall subsidence basins have zones of compression and tensile stresses (Figure 4.3). The
compressive stresses are located in the flat portion of a supercritical subsidence basin, and extend
laterally until the inflection point is reached. The inflection point is the point in which there is
zero curvature, or the transition point from compressive to tensile stresses. A quarter-width
buffer for each panel was created in ArcGIS, and this buffer separated the panel into a mid-panel
(50-percent of the panel width) section for compressive stresses and quarter-panel (two outer 25-
percent panel regions) section for tensile stresses (Figure 5.4).
Figure 5.4: Panel classification locations and stress location cross-section

36
These regions provide a generalized depiction of the potential types of fracturing of the
strata near the ground surface. The impacted water supplies were classified as mid-panel,
quarter-panel, or if the supply was located outside of the panel it was classified as gateroad if
over a room-and-pillar section, or as outside of active mining.
Several studies have reported observing water supplies located over the centerline of the
longwall panel, or mid-panel region, to show the greatest water level fluctuations and head loss
due to mining (Hill and Price 1983; Moebs and Barton 1985; Walker, Green et al. 1986; Tieman
and Rauch 1987). This can most likely be attributed to the change from dynamic extensional
strains and fracturing to static compressive strains or recompression of fractures in the mid-panel
region of the subsidence basin. Water level fluctuations begin approximately when the ground
surface is subjected to tensile strains, and maximum rate of water loss and lowest water levels
corresponded to the point of maximum tensile ground strains; water levels began to recover once
the point of maximum compressional strain was achieved (Trevits and Matetic 1991). The point
of maximum compressional strain is most likely attributed to the closure or reduction of
extensional fractures. Correspondingly, water supplies located over room-and-pillar sections and
outside of active mining showed little negative effects of mining (Hill and Price 1983; Moebs
and Barton 1985; Carver and Rauch 1994). Therefore as the distance from the mid-panel
increases, the stresses on the overburden decrease (Walker 1988).
The percentage of impacted supplies according to their panel location is calculated and
shown in Figure 5.5.

37
Figure 5.5: Percentage of impacted water supplies at each longwall panel location.
Water supplies located directly over mined longwall panels accounted for 27-percent and
26-percent of the impacted water supplies, based on their location over the mid-panel and
quarter-panel regions, respectively; while gateroad and outside of active mining locations
accounted for 23-percent and 24-percent of the impacts, respectively. Due to the formation of a
subsidence basin directly over the mined panel, the expectation of an impact is greater over the
panel, and less likely as the distance between the water supply and the longwall panel increases.
This principle is affirmed in the figure, but not overwhelmingly.
27 26
23 24
0
5
10
15
20
25
30
Mid-Panel Quarter-Panel Gate Road Outside
Perc
ent
Location

38
5.3 CLIMATIC CONDITIONS AT TIME OF IMPACT
The date of the water supply impact was referenced to determine if undermining a water supply
during times of below average precipitation or during the months of low groundwater infiltration
translates to more water supplies being impacted by mining. No literature reporting on this
concept was found, but it is hypothesized that impacts rates may be higher when a water supply
is undermined in times of below average precipitation and during the growing season because
there is less water recharging the aquifer system.
5.3.1 LONG-TERM AVERAGE PRECIPITATION RATES
The daily precipitation totals for the duration of the assessment period were collected from
Waynesburg Wastewater Treatment Facility. The daily totals were summed to calculate monthly
totals during the five year assessment time period. The monthly totals for the years 2003 to 2008
were compared to the long term average precipitation rates for each month for Waynesburg,
Pennsylvania (Figure 5.6). The long-term average values were collected from the Weatherbase
website (Associates 1997).
39
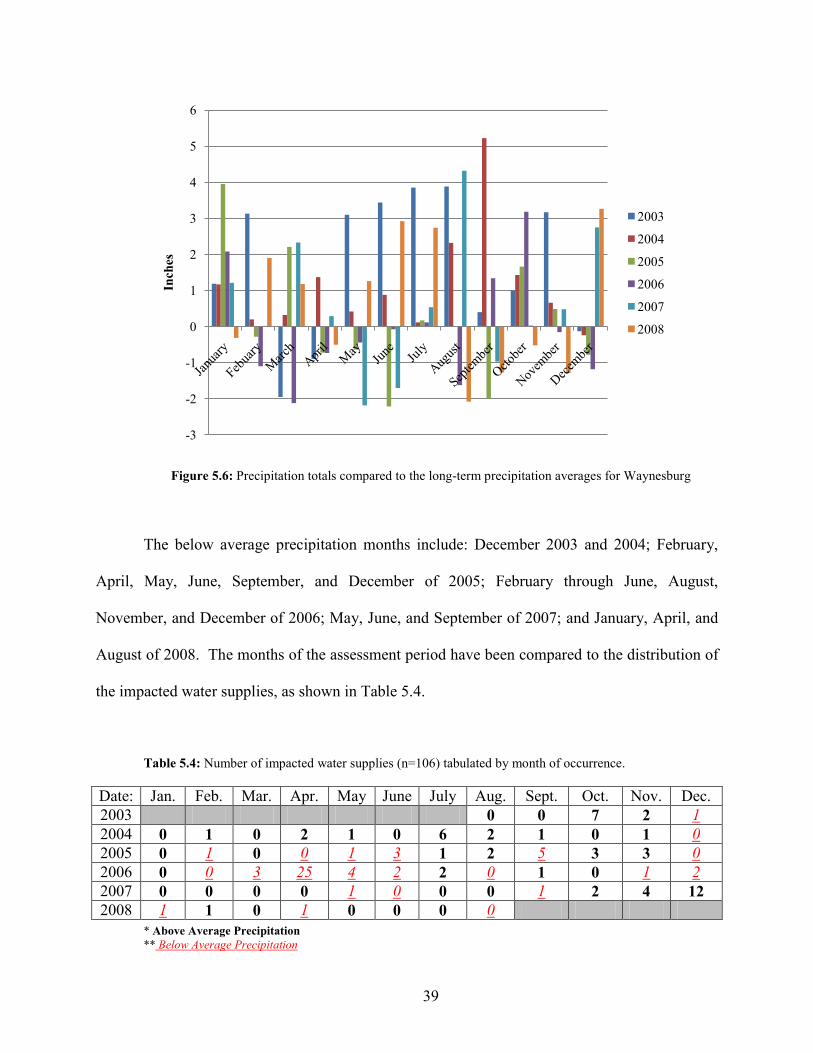
Figure 5.6: Precipitation totals compared to the long-term precipitation averages for Waynesburg
The below average precipitation months include: December 2003 and 2004; February,
April, May, June, September, and December of 2005; February through June, August,
November, and December of 2006; May, June, and September of 2007; and January, April, and
August of 2008. The months of the assessment period have been compared to the distribution of
the impacted water supplies, as shown in Table 5.4.
Table 5.4: Number of impacted water supplies (n=106) tabulated by month of occurrence.
Date: Jan. Feb. Mar. Apr. May June July Aug. Sept. Oct. Nov. Dec. 2003 0 0 7 2 1 2004 0 1 0 2 1 0 6 2 1 0 1 0 2005 0 1 0 0 1 3 1 2 5 3 3 0 2006 0 0 3 4 25 2 2 0 1 0 1 2 2007 0 0 0 0 1 0 0 0 1 2 4 12 2008 1 1 0 1 0 0 0 0
* Above Average Precipitation ** Below Average Precipitation
-3
-2
-1
0
1
2
3
4
5
6
Inch
es
2003
2004
2005
2006
2007
2008

40
As shown in Table 5.4, there were a total of 106 impacted water supplies; with 52
occurring in below average precipitation months and 54 occurring in at or above normal
precipitation months. There were 22 months of below average and 39 of normal or above
normal precipitation. By dividing the number of impacted water supplies by number of months
for each precipitation condition, there was an average of 2.36 supplies impacted per below
average month and 1.38 supplies impacted for above the average or normal precipitation months.
Water supplies appear to be between 1.5 to 2 times more likely to be impacted where below
average precipitation coincides with longwall undermining.
5.3.2 SEASONAL INFILTRATION RATES
The total number of impacted water supplies is categorized based on the month of undermining
to determine if the natural infiltration rates, based on seasonal climatic conditions can result in
higher rates of water supply impacts (Table 5.5). The months January, February, March,
October, November, and December are considered months of low evapotranspiration and
therefore times of high groundwater recharge. Conversely, months April through September will
have high rates of evapotranspiration, because of vegetation usage, and therefore lower rates of
groundwater infiltration.

41
Table 5.5: Number of water supplies impacted based on month of undermining; left side- high groundwater
recharge months and right side- months with high rates of evapotranspiration
High Groundwater Recharge High Evapotranspiration Rate Month Number of Impacts Month Number of Impacts January 1 April 28 February 3 May 7 March 3 June 5
October 12 July 9 November 11 August 4 December 15 September 8
Total 45 Total 61
Nearly 58-percent of the water supply impacts occurred during months of low
groundwater infiltration, as compared to the 42-percent of impacts occurring during months of
high groundwater infiltration. Undermining during times of low groundwater infiltration rates
may also influence how groundwater reacts to undermining.

42
5.4 MINE INFLOW
The mine inflow records for the seven longwall mines were collected by referencing the
Module 8 permit files for each mine. Mine inflow rates are estimated by the rate at which water
is pumped out of a mine. The water infiltrating into the mine can be moving in from the
groundwater system above the mine, or from nearby abandoned and flooded mines.
Groundwater will move by gravity or from pressure areas of high hydraulic head to areas of low
hydraulic head. The mine inflow rates were converted into gallons per minute per acre, and
shown in the Table 5.6. The value for Blacksville No.2 was not determined because discharges
from the mine occur in West Virginia.
Table 5.6: The mine inflow rates (rates of pumping required) for each longwall mine.
Mine Name Inflow (gpm/acre) Bailey 0.032
Blacksville No. 2 n/a Cumberland 0.250
Emerald 0.130 Enlow Fork 0.005 High Quality 0.480
Mine 84 0.036
Groundwater will only drain to the underground mine from the shallow aquifer system if
they are hydraulically connected via the fractured strata (Booth 1986). As shown in Figure 4.4,
a dilated zone of increased storativity with little or no vertical transmissivity (Kendorski and
Consultants 1993). This zone is defined as the layer that prevents large amounts of surface and
groundwater intrusion into the mine from above. The two layers below this layer are the
fractured and caved zones, which account for approximately 30 times the thickness of mining.

43
In order for the shallow aquifer system to infiltrate into the mine, with a mining height of 6-ft,
the shallow aquifer system would predictably need to be within 180-ft of the mine to
hydraulically connect the shallow aquifer system directly with the mine. The overburden of the
longwall mining that occurred during the assessment period was greater than 180-ft deep;
therefore little infiltration of the shallow aquifer system was expected.

44
5.5 RESOLUTIONS TO IMPACTS
The PA DEP ensures that if a water supply is impaired by mining that the property owner is
provided with a replacement water supply that was at the pre-mining water quantity and quality,
a buyout, or compensation for the loss. Of the 106 impacted water supplies, 69 of the impacted
supply claims were settled by a buyout, compensation, or by an agreement; 11 received a
replacement supply in the form of public water; and 26 of the supplies were replaced with new
supplies or the existing supplies recovered post-mining. Because of private contractual
agreements it is not possible to determine what actions were taken or how the supply was
replaced when an agreement was used to finalize an impact. A water supply may be replaced
with public water if that is the most convenient and economical option for the replacement;
therefore, the condition of the impacted well or spring post-mining is generally unknown.
Resolutions stating that the water supply was replaced with another well or spring, or that the
water supply recovered post-mining, indicate adequate water supplies can still be produced from
the shallow aquifer system post-mining.

45
6.0 UNDERMINING CHARACTERISTICS BY MINE
Section 5.0 presents trends in the data for individual water supply characteristics. It is important
to apply these trends to each of the seven mines to determine if the individual mines undermined
a certain characteristically susceptible water supply more or less frequently, compared with their
water supply impact rates. As presented in Table 4.3, the impact rates at each of the seven
longwall mines varied greatly. The High Quality mine impacted 100-percent of its supplies,
followed by Mine 84 with a 14-percent impact rate, and the lowest impact rate attributed to the
Blacksville No.2 mine with 4.4-percent of undermined water supplies impacted. The remaining
four longwall mines, Bailey, Cumberland, Emerald, and Enlow Fork all impacted approximately
7-percent of the water supplies undermined. The trends chosen for additional analysis for each
individual mine include percentage of hilltop supplies undermined, depth to mining, and
percentage of supplies located over the longwall panel.
As discussed in Section 5.1, the topographic location of a water supply directly
influences the likelihood of an impact due to mining. Hilltop supplies were impacted more
frequently, at 13.0-percent, whereas hillsides and valley bottoms were impacted 9.0-percent and
8.6-percent, respectively. Because hilltop supply locations are more likely to be impacted, the
percent of hilltop supplies undermined by each mine was determined and compared to the impact
rates to determine if undermining hilltop water supplies more frequently has an effect on the
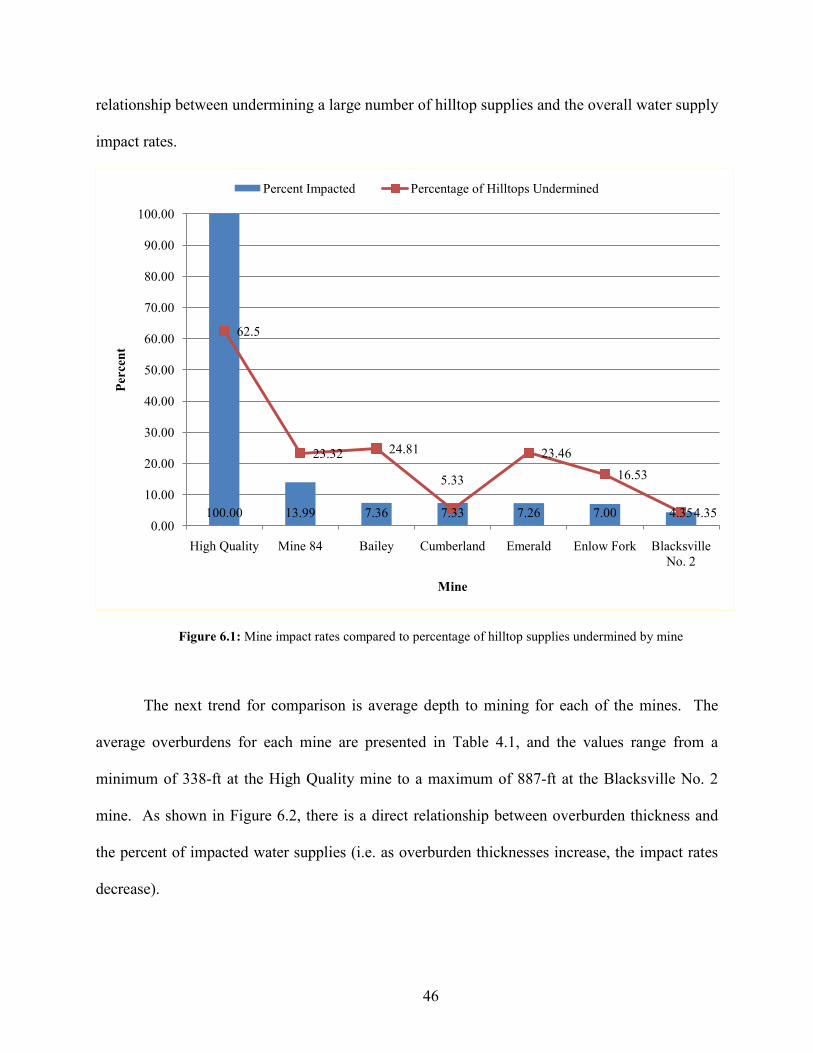
mine impact rates (Figure 6.1). As shown, there does not seem to be an overwhelming
46
relationship between undermining a large number of hilltop supplies and the overall water supply
impact rates.
Figure 6.1: Mine impact rates compared to percentage of hilltop supplies undermined by mine
The next trend for comparison is average depth to mining for each of the mines. The
average overburdens for each mine are presented in Table 4.1, and the values range from a
minimum of 338-ft at the High Quality mine to a maximum of 887-ft at the Blacksville No. 2
mine. As shown in Figure 6.2, there is a direct relationship between overburden thickness and
the percent of impacted water supplies (i.e. as overburden thicknesses increase, the impact rates
decrease).
100.00 13.99 7.36 7.33 7.26 7.00 4.35
62.5
23.32 24.81
5.33
23.4616.53
4.350.00
10.00
20.00
30.00
40.00
50.00
60.00
70.00
80.00
90.00
100.00
High Quality Mine 84 Bailey Cumberland Emerald Enlow Fork Blacksville No. 2
Perc
ent
Mine
Percent Impacted Percentage of Hilltops Undermined

47
Figure 6.2: Mine impact rates compared to average overburden of the mine
Water supplies located directly over a longwall panel accounted for a majority of the
impacted water supplies. The percentage of water supplies undermined by a longwall panel,
either mid or quarter-panel locations, at each mine was determined and compared with the water
supply impact rate for the mine (Figure 6.3). There does not seem to be any relationship to
frequency of supplies being directly undermined by a longwall panel, and impacts rates of the
mines.
100.00 13.99 7.36 7.33 7.26 7.00 4.35
338
627 648
739 725 750
887
0
100
200
300
400
500
600
700
800
900
1000
0.00
10.00
20.00
30.00
40.00
50.00
60.00
70.00
80.00
90.00
100.00
High Quality
Mine 84 Bailey Cumberland Emerald Enlow Fork Blacksville No. 2
Ove
rbur
den
(ft)
Perc
ent
Mine
Percent Impacted Average Overburden

48
Figure 6.3: Mine impact rates compared to percentage of water supplies undermined by a longwall panel
100.00 13.99 7.36 7.33 7.26 7.00 4.35
87.50
58.55
48.45
56.67
43.02
59.94 60.87
0.00
10.00
20.00
30.00
40.00
50.00
60.00
70.00
80.00
90.00
100.00
High Quality
Mine 84 Bailey Cumberland Emerald Enlow Fork Blacksville No. 2
Perc
ent
Mine
Percent Impacted Percentage of Water Supplies Undermined by a Longwall Panel

49
7.0 SUMMARY
There were seven longwall mines in operation in Greene and Washington County between the
years of 2003 and 2008. These seven mines undermined 24,535 acres and a total of 1,214 wells
and springs. Water supplies impacted by mining, either by water supply diminution or total loss
of supply, accounted for 106 out of the 1,214 undermined supplies; therefore, 8.7-percent of
water supplies within 200-ft of active mining were impacted. The water supplies undermined by
each of the seven mines varied in response to being undermined at each mine site, between 100
percent (High Quality Mine) and 4.35 percent (Blacksville No. 2 Mine).
Based on the characteristic attributes of the impacted supplies, potential susceptibility
characteristics were analyzed with the purpose of assessing water supply vulnerability to being
undermined by longwall mines. The following susceptibility characteristics were analyzed:
• Hydrogeologic Setting:
o Hilltops were confirmed to be more susceptible to longwall mining;
particularly shallow hilltops.
o Individual water supply overburden impact rates did not verify previous
observations that deeper overburden reduces likelihood of impact.
• Proximal Location to Mining:
o Hydrologic Angle of Influence: 80-percent of water supplies were within
maximum observed hydrologic angle of influence of 42 degrees

50
o Longwall Panel Location: Longwall panel location impact rates did not
overwhelmingly support previous observations that impacts are much higher
over the panel and decrease as distance away from panel center increases.
• Climatic Conditions at Time of Impact:
o Long-Term Average Precipitation Rates: Water supply impacts were 1.5 to 2
times more likely to occur during months of below average precipitation in
conjunction with undermining.
o Seasonal Infiltration Rates: Nearly 60-percent of water supply impacts
occurred during the growing season when much of the groundwater
infiltration is lost to evapotranspiration.
• Mine Inflow: There were no indications to suggest that the shallow aquifer system is
being lost to mine inflow. Generally, overburden values are not shallow enough to
hydraulically connect the shallow aquifer system directly with the mine.
The water supplies undermined by each of the seven mines varied in response to being
undermined at each mine site. The water supply impact rates were most closely related with the
average overburden thickness between the mine and the ground surface. The mines located
deeper underground had overall lower impact rates compared with mines will less overburden
between the mine and the ground surface.

51
8.0 CONCLUSION
The purpose of this study was to investigate the hydrogeologic changes to overburden strata due
to longwall coal mining and the effect of the changes on potable water supplies producing from
the strata of Southwestern, Pennsylvania. Understanding the hydrogeologic changes is useful
when attempting to predict if diminution or total loss in supply will occur when active longwall
mining is in the vicinity of the potable aquifer systems. Hydrologic response models based
solely on overburden thickness may indicate an overall trend at each mine site, but may not be
useful for predicting potential supply impacts on a case by case basis. In order to fully analyze
and predict potential impacts by longwall mine subsidence to the hydrogeology, it is imperative
to consider many factors including hydrogeologic setting, proximal location to mining, and
climatic conditions at time of undermining.

52
APPENDIX A
A.1 MAP OF EXTENT OF LONGWALL MINING (2003-2008)

53
BAILEY
WAYNESBURG
EMERALD
BLACKSVILLE NO. 2
CUMBERLAND
WASHINGTON
ENLOW FORK
HIGH QUALITY
MINE 84
MAP KEYACTIVE LONGWALL PANELSACTIVE ROOM-AND-PILLAR SECTIONSMINE PERMIT BOUNDARIES
HIGHWAYS
COUNTY BOUNDARY
MAJOR CITY
EXTENT OF MINING FOR GREENE AND WASHINGTON COUNTIES (2003-2008)

54
APPENDIX B
B.1 WATER SUPPLIES AND OVERBURDENS PER MINE
The following maps provide the extent of mining during the five year assessment, as well
as the location of the undermined water supplies. The water supplies that are symbolized as a
green circle are the supplies that were not affected by mining. The red crosses symbolize the
undermined water supplies that were impacted by mining. The appendix also contains additional
maps detailing the overburdens at each of the mine sites.
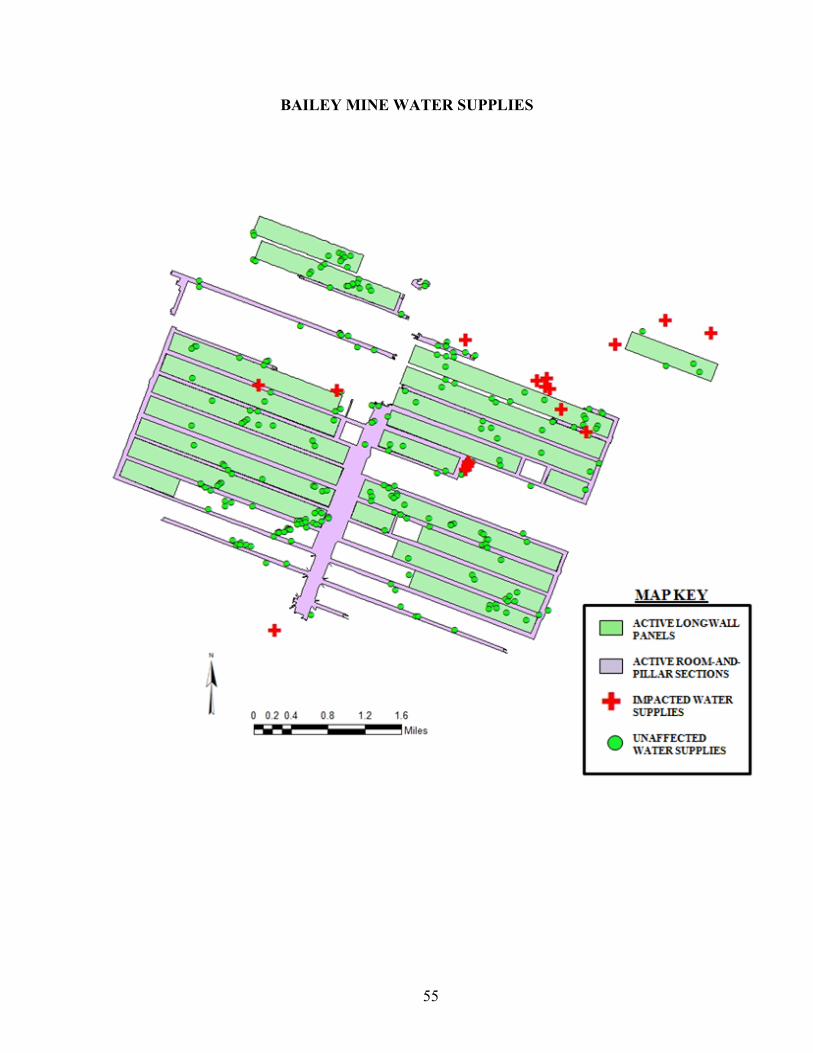
55
BAILEY MINE WATER SUPPLIES

56
BAILEY MINE OVERBURDEN

57
BLACKSVILLE NO. 2 MINE WATER SUPPLIES

58
BLACKSVILLE NO. 2 MINE OVERBURDEN
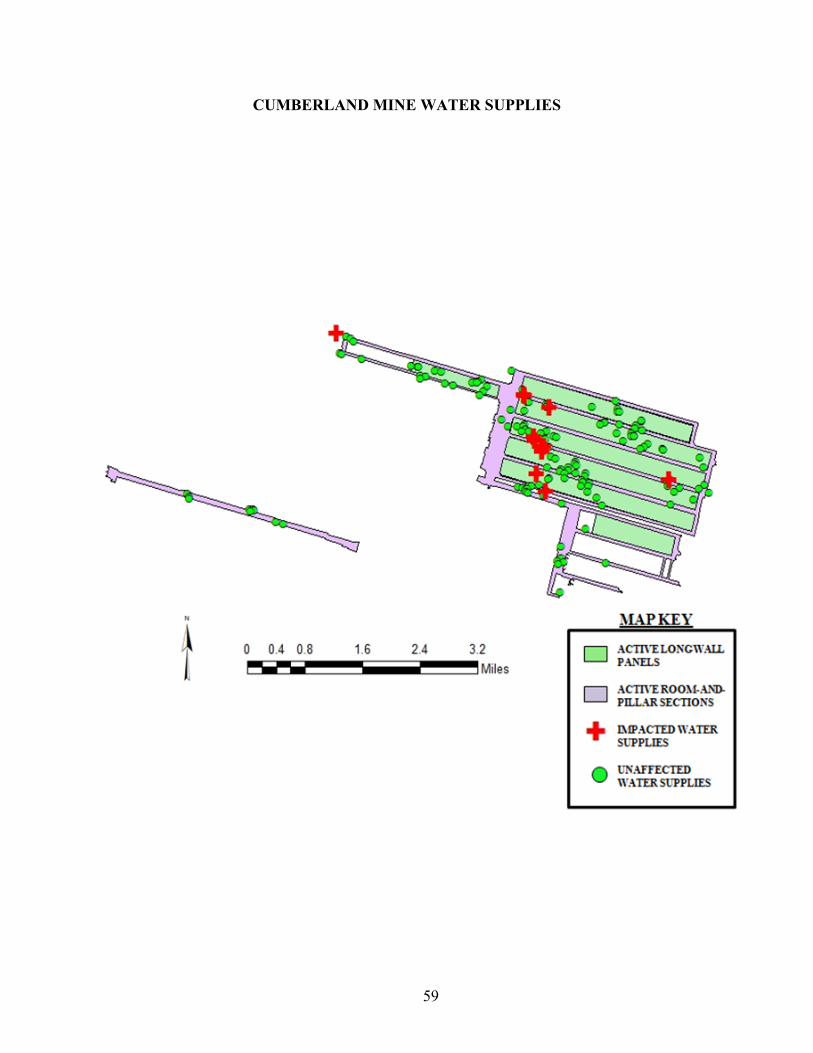
59
CUMBERLAND MINE WATER SUPPLIES

60
CUMBERLAND MINE OVERBURDEN

61
EMERALD MINE WATER SUPPLIES

62
EMERALD MINE OVERBURDEN

63
ENLOW FORK MINE WATER SUPPLIES

64
ENLOW FORK MINE OVERBURDEN

65
HIGH QUALITY MINE WATER SUPPLIES

66
HIGH QUALITY MINE OVERBURDEN

67
MINE 84 WATER SUPPLIES

68
MINE 84 OVERBURDEN

69
BIBLIOGRAPHY
Administration, U. S. E. I. (2010). "Coal Production and Number of Mines by State and Mine Type." Retrieved September 16, 2010, 2010, from http://www.eia.doe.gov/.
Associates, C. (1997, June 5, 2010). "Weatherbase: Waynesburg, PA." from
http://www.weatherbase.com/weather/weather.php3?refer=&s=763963. Booth, C. J. (1986). "Strata-Movement Concepts and the Hydrogeological Impacts of
Underground Coal Mining." Ground Water
24(4): 507-515.
Carver, L. and H. Rauch (1994). Hydrogeologic Effects of Subsidence at a Longwall Mine in the Pittsburgh Coal Seam. Ground Control in Mining
. S. Peng. Morgantown, WV, West Virginia University. 13th International Conference: 298-307.
D’Appolonia (2009). Engineering and Design Manual: Coal Refuse Disposal Facilities, Mine Safety and Health Administration: 868.
Dixon, D. Y. and H. W. Rauch (1988). Study of Quantitative Impacts to Ground Water
Associated with Longwall Coal Mining at Three Mine Sites in the Northern West Virginia Area. Ground Control in Mining
. S. Peng. Morgantown, WV, West Virginia University. 7th International Conference: 321-335.
Ferguson, H. F. (1974). Valley Stress Release in the Allegheny Plateau. Pittsburgh, Pa.: 9. Gutiérrez, J. J. (2010). Estimating Highway Subsidence Due to Longwall Mining. Civil
Engineering
. Pittsburgh, PA, University of Pittsburgh. Doctor of Philosophy: 177.
Hill, J. G. and D. R. Price (1983). "The Impact of Deep Mining on an Overlying Aquifer in Western Pennsylvania." Ground Water Monitoring Review
3(1): 138-143.
Iannacchione, A., S. Tonsor, et al. (2010). The Effects of Subsidence Resulting from Underground Bituminous Coal Mining on Surface Structures and Features and on Water Resources: 3rd ACT 54 Five-Year Report, Univerisity of Pittsburgh.
Kendorski, F. S. and M. M. E. Consultants (1993). Effect of High-Extraction Coal Mining on
Surface and Ground Waters. Ground Control in Mining. S. Peng. Morgantown, WV, West Virginia University. 12th International Conference: 412-425.

70
Leavitt, B. R. and J. F. Gibbens (1992). Effects of Longwall Coal Mining on Rural Water
Supplies and Stress Relief Fracture Flow Systems. Workshop on Surface Subsidence due to Underground Mining
. S. Peng. Morgantown, WV, West Virginia University. 3rd Proceedings: 228-236.
Moebs, N. N. and T. M. Barton (1985). Short-term Effects of Longwall Mining on Shallow Water Sources. Mine Subsidence Control
. Pittsburgh PA, Bureau of Mines. 9042: 12.
Newport, T. G. (1973). Summary Groundwater Resources of Washington County, Pennsylvania. Water Resource Report
. Harrisburg, PA, Department of Environmental Resources, Bureau of Topographic and Geologic Survey: 32.
Parizek, R. R. and R. V. Ramani (1996). Longwall Coal Mines: Pre-Mine Monitoring and Supply Replacement Alternatives. Legislative Initiative Program 181-90-2658
, The Pennsylvania State University: 195.
Peng, S. (1992). Surface Subsidence Engineering
. Littleton, Colorado, Society for Mining, Metallurgy, and Exploration, Inc.
Peng, S. (2008). Coal Mine Ground Control
. Morgantown, WV, West Virginia University.
Society for Mining, M., and Exploration, Inc. (1992). SME Mining Engineering Handbook. Geomechanics
. Sacramento, CA, Society for Mining, Metallurgy, and Exploration, Inc.
Stoner, J. D., D. R. Williams, et al. (1987). Water Resources and the Effects of Coal Mining, Greene County, Pennsylvania. Water Resource Report
. Harrisburg, PA, Department of Environmental Resources, Bureau of Topographic and Geologic Survey: 166.
Tieman, G. E. and H. W. Rauch (1987). Study of Dewatering Effects at an Underground Longwall Mine Site in the Pittsburgh Seam of the Northern Appalachian Coalfield. Bureau of Mines Information Circular 9137
. Pittsburgh, PA, U.S. Bureau of Mines: 18.
Trevits, M. A. and R. J. Matetic (1991). A Study of the Relationship between Saturated Zone Response and Longwall Mining-Induced Ground Strain. 5th National Outdoor Action Conference on Aquifer Restoration, Ground Water Monitoring, and Geophysical Methods
. Las Vegas, Nevada, Outdoor Action. 5: 1101-1109.
Walker, J. S. (1988). Case Study of the Effects of Longwall Mining Induced Subsidence on Shallow Ground Water Sources in the Northern Appalachian Coalfield. Report of Investigations 9198
, Bureau of Mines & United States Department of the Interior: 17.
Walker, J. S., J. B. Green, et al. (1986). A Case Study of Water Level Fluctuations Over a Series of Longwall Panels in the Northern Appalachian Coal Region. Workshop on Surface Subsidence due to Underground Mining. S. Peng. Morgantown, WV, West Virginia University. 2nd Proceedings: 264-269.

71
Wyrick, G. G. and J. W. Borchers (1981). Hydrologic Effects of Stress-Relief Fracturing In an
Appalachian Valley. Geological Survey Water-Supply Paper 2177
: 50.