the effects of monovalent metal ions on the …staff.ustc.edu.cn/~xdye/54-the effects of monovalent...
TRANSCRIPT

This journal is©The Royal Society of Chemistry 2016 Soft Matter, 2016, 12, 5959--5967 | 5959
Cite this: SoftMatter, 2016,
12, 5959
The effects of monovalent metal ions on theconformation of human telomere DNA usinganalytical ultracentrifugation†
Yating Gao, Sha Wu and Xiaodong Ye*
A human telomere DNA segment (HT-DNA) can fold into a G-quadruplex in the presence of some
monovalent cations. These cations can interact with the phosphate groups of the DNA segment and/or
with the O6 oxygen atom of guanines, which are called non-specific interactions and specific
interactions, respectively. However, until now how these two interactions affect the structure of
HT-DNA has not been well understood. In this study, a combination of analytical ultracentrifugation
(AUC) and circular dichroism (CD) was used to explore the effects of these two interactions on the
structure of a 22-mer single-stranded DNA with a sequence of 50-AGGG(TTAGGG)3-30. The results
showed that the standard sedimentation coefficient (s20,w) of HT-DNA starts to increase when the
concentration of potassium ions (CK+) is higher than 10.0 mM due to the formation of a G-quadruplex
through specific interactions. Whereas, for a control DNA, a higher CK+ value of 1.0 mM was needed for
increasing s20,w due to non-specific interactions. Moreover, potassium ions could promote the
formation of the G-quadruplex much more easily than lithium, sodium and cesium ions, presumably due
to its appropriate size in the dehydrated state and easier dehydration. The molar mass of DNA at
different cation concentrations was nearly a constant and close to the theoretical value of the molar
mass of monomeric HT-DNA, indicating that what we observed is the structural change of individual
DNA chains.
Introduction
Guanine-rich nucleic acids can fold into secondary structurescalled G-quadruplexes, four stranded DNA structures formed bystacked G-tetrad planes connected by eight Hoogsteen hydrogenbonds.1–11 Human telomeres containing tandem repeats ofsequence d(TTAGGG) at their extreme 30-end are the complexesof DNA and proteins located at the ends of the chromosome,which play important roles in protecting chromosomes fromfusion and degradation.12–16 Under near-physiological conditionsin vitro, telomere DNA sequences can fold into G-quadruplexes,which have shown abilities to interfere with cell function andmay have a relationship with cell cancerization.17,18 Until now,numerous methods have been used to analyze the structure of thehuman telomeric G-quadruplex in vitro, such as high-resolutionsolution state NMR,5,8–10,19 single crystal diffraction,20 moleculardynamics (MD) simulations,21–23 circular dichroism (CD),7,22,24–26
fluorescence,7,27 differential scanning calorimetry (DSC),28,29
mass spectrometry,30,31 photon correlation spectroscopy,32
atomic force microscopy (AFM),33–35 analytical ultracentrifugation(AUC)7,36–39 and so on.
The structure and stability of the human telomeric G-quadruplexare determined by the concentration24 and sequence9,21 of DNA andthe nature and concentration of cations in solutions,7–9,25,40,41
ligands26,42 and cosolvents.10,30 Among these conditions, cationsplay an important role. For example, HT-DNA can fold into an anti-parallel G-quadruplex structure in the presence of sodium ionswhile it forms a hybrid G-quadruplex in potassium ion solutions.4,8,9
The increase in the concentration of cations can lead to an increasein the stability of the G-quadruplex as revealed by DSC and CDmelting curves.28,32 In order to understand the effect of cations onthe G-quadruplex in detail, two interactions should be consideredseparately, the specific interactions and non-specific interactions.The specific interactions referring to the interactions betweenthe G-quadruplex and cations in the center of a G-quartet orcoordinated between two G-quartets are strongly related to thehydration extent and the size of the cations,2,43 which areanalogous to those found in host–guest systems such as thecrown ethers.44 These inner cations are all dehydrated ions andcan stabilize the negative electrostatic potential created by theguanine O6 oxygen atoms within the quadruplex core.22,45
Hefei National Laboratory for Physical Sciences at the Microscale,
Department of Chemical Physics, University of Science and Technology of China,
Hefei, Anhui 230026, China. E-mail: [email protected]
† Electronic supplementary information (ESI) available. See DOI: 10.1039/c6sm01010e
Received 1st May 2016,Accepted 10th June 2016
DOI: 10.1039/c6sm01010e
www.rsc.org/softmatter
Soft Matter
PAPER
Publ
ishe
d on
10
June
201
6. D
ownl
oade
d by
Uni
vers
ity o
f Sc
ienc
e an
d T
echn
olog
y of
Chi
na o
n 06
/07/
2016
14:
18:5
5.
View Article OnlineView Journal | View Issue

5960 | Soft Matter, 2016, 12, 5959--5967 This journal is©The Royal Society of Chemistry 2016
Besides the specific interactions, owing to the polyelectrolytenature of HT-DNA, it is surrounded by a cloud of counterions,which make up the non-specific interactions with HT-DNA. Thenon-specific interactions should also have an influence on thestructure of the G-quadruplex.25 However, until now only a fewresults about the effects of these two different interactionsbetween cations and G-quadruplexes on the structure ofguanine-rich telomere DNA have been reported. For example,using a fluorescent indicator to study the linkage between the K+
binding and folding of HT-DNA with a sequence of 50-AGGGTTAGGGTTAGGGTTAGGG-30, Chaires et al. found that three K+
ions bind to each HT-DNA chain when the concentration of freeK+ ions is 5 mM and the number increases to 8–10 when thepotassium ions concentration is 20 mM.46 Nevertheless, theyalso mentioned that this method cannot distinguish specificand non-specific binding from each other.
Analytical ultracentrifugation (AUC) is a powerful method tostudy the structural and hydrodynamic properties of nucleicacids.7,36–39,47–53 In a centrifugation field with a suitable rotationvelocity, the instrument records the sedimentation and diffusionprocesses of nucleic acids. The standard sedimentation coefficient(s20,w), hydrodynamic radius (Rh) and weight-average molecularweight (Mw) can be determined. Thus, AUC can be used tocharacterize the influence of cations on the conformationalchange of nucleic acids. In an interesting precedent, Le et al.showed that the sedimentation coefficient of two G-quadruplex-forming sequences increases with the K+ ions.54 They mentionedthat the low sedimentation coefficients at a low potassiumconcentration (25 mM) can be attributed to hydrodynamicnon-ideality.54 Thus, it is difficult to distinguish the contributionof a shift from a non-ideal solution to an ideal solution and fromspecific and non-specific potassium binding.54 In this study, witha combination of AUC and CD, we investigated the effectsof different salts on the conformation of a human telomericDNA sequence 50-AGGG(TTAGGG)3-30 (HT-DNA) with 10.0 mMtris(hydroxymethyl) aminomethane(Tris) to decrease the non-ideality. Due to the specific interactions, HT-DNA starts to foldfrom a random coil to a G-quadruplex structure when theconcentration of potassium ions (CK+) is larger than 10.0 mM.When CK+ reaches 1.0 mM, the folding of HT-DNA is completeand the non-specific interactions start to work. Furthermore,the effects of lithium, sodium and cesium ions on the for-mation of quadruplex structures of HT-DNA were also studied.The results show that K+ can promote the formation of theG-quadruplex much more easily, presumably due to its appropriatesize and easy dehydration.
Experimental sectionPreparation of DNA aqueous solutions
A 22-mer HT-DNA and a control DNA with sequences of50-AGGGTTAGGGTTAGGGTTAGGG-3 0 and 50-TTATCTATGCTGTTACTCTGACTC-30 were synthesized and purified using highperformance liquid chromatography (HPLC) by Sangon BiologicalEngineering Technology and Services (Shanghai, China). The most
important criterion for choosing the control DNA is that thecontrol DNA cannot form a secondary structure in our study.Oligonucleotides were used as received and dissolved in 10.0 mMtris(hydroxymethyl)aminomethane (Tris)–HCl buffer solution(pH = 7.5) to give a stock solution with a concentration ofB50 mM. The DNA stock solution was heated to 95 1C for5 min, and then slowly cooled down to room temperature.The stock solution was stored at �20 1C for future use. Theconcentrations of DNA were determined at 260 nm using aUV-vis spectrophotometer (UV-2802PCS, UNICO, Shanghai)with appropriate molar extinction coefficients at 260 nm(228.5 mM�1 cm�1 for HT-DNA, and 216.1 mM�1 cm�1 forcontrol DNA, the values are calculated at http://biophysics.idtdna.com/UVSpectrum.html). Ultra-pure Milli-Q water with aresistivity of 18.2 MO cm used in all experiments was purified byfiltration through a Millipore Gradient system after distillation.Tris(hydroxymethyl) aminomethane (Tris) (99%), concentratedhydrochloric acid (37.5%), lithium chloride (LiCl, 99%), sodiumchloride (NaCl, 99%), potassium chloride (KCl, 99%) and cesiumchloride (CsCl, 99%) from Sinopharm were used as received. TheDNA solutions for sedimentation velocity and circular dichroismexperiments were diluted from the DNA stock solution by 10.0 mMTris–HCl buffer solutions with appropriate concentrations of salts(LiCl, NaCl, KCl or CsCl).
Circular dichroism (CD)
CD spectra were recorded on a JASCO J-810 spectrometer usinga 1 mm path length quartz cuvette. The final concentration ofthe oligonucleotide was 8.0 mM in 10.0 mM Tris–HCl buffersolution (pH = 7.5) with different concentrations of salts. For eachsample, the measurements were performed at room temperaturefrom 200 to 320 nm with a scanning rate of 100 nm min�1 andeach final spectrum was the average of three scans. The scans ofthe buffer alone containing the same concentration of salt weremeasured under the same experimental conditions and used asthe background correction.
Sedimentation velocity experiments
Sedimentation velocity (SV) experiments were performed on aProteomelab XL-A/I analytical ultracentrifuge (Beckman CoulterInstruments) with an An-60 Ti 4-hole rotor assembled by threecells and a counterbalance. UV-vis absorbance optics was usedin this study to monitor the sedimentation and diffusionprocesses of DNA. Before each measurement, a volume of400 mL of DNA solution with different concentrations of saltsand a 410 mL of corresponding buffer without DNA as thereference were loaded into the cell assembled by a two-sector,charcoal-filled Epon centerpiece and two quartz windows. Allexperiments were conducted at 20.0 1C with a rotational speedof 58 000 rpm at a wavelength range of 260 to 300 nm. Thecriterion for selecting the appropriate wavelength is that theabsorbance should be in the range of 0.5 and 1.0. About 250 scansfor each cell were collected during each SV experiment andanalyzed by SEDFIT using a continuous distribution c(s) modelwhich can separate the effects of diffusion and sedimentation ofthe solute.55–57 In the SEDFIT software, the maximum entropy
Paper Soft Matter
Publ
ishe
d on
10
June
201
6. D
ownl
oade
d by
Uni
vers
ity o
f Sc
ienc
e an
d T
echn
olog
y of
Chi
na o
n 06
/07/
2016
14:
18:5
5.
View Article Online

This journal is©The Royal Society of Chemistry 2016 Soft Matter, 2016, 12, 5959--5967 | 5961
regularization which follows the CONTIN method provided byProvencher58,59 is used to solve the Lamm equation (eqn (1)).
@c
@t¼ 1
r
@
@rr �D@c
@r� o2r2sc
� �(1)
where c, r, t, o, s and D are the concentration of the solute,radial distance from the axis of rotation, sedimentation time,angular velocity, sedimentation coefficient and diffusioncoefficient, respectively. With the combination of the Svedbergequation and the Stokes–Einstein equation:
M ¼ s � kB �NA � TD � 1� �n � rsð Þ (2)
D ¼ kB � Tf¼ kB � T
6pZRh(3)
we can obtain the information of molar mass M and hydro-dynamic radius Rh, where the kB, NA, T, rs, �n, f and Z refer to theBoltzmann constant, Avogadro’s number, absolute temperature,solvent density, partial specific volume of the solute, frictionalcoefficient, and solvent viscosity, respectively. Herein, we measuredthe value of the partial specific volume (�n) of DNA in differentsalt solutions by the density contrast sedimentation velocityaccording to Schuck et al.60 The measured values of �n are0.55 ml g�1 for K/DNA, Na/DNA, Li/DNA and Tris/DNA and0.47 ml g�1 for Cs/DNA when the concentration of CsClis higher than 1.0 mM, which are similar to the earlierreports.36,61–63 To eliminate the effect of different solvents onthe sedimentation coefficient, the experimental sedimentationcoefficient (s20,exp) can be easily converted to the standardconditions (s20,w) by means of eqn (4)64
s20;w ¼ s20;expZ20;sZ20;w
!1� �nr20;w1� �nr20;s
!(4)
where s20,exp and s20,w are the experimental sedimentationcoefficient and the standard sedimentation coefficient in waterat 20.0 1C, respectively. Z20,s, Z20,w, r20,s and r20,w are the viscosityand density of solvent and water at 20.0 1C, respectively.
Results and discussionThe effect of potassium ions on the conformation of HT-DNA
Both nuclear magnetic resonance (NMR) and laser light scattering(LLS) can be used to determine the structural and hydrodynamicproperties of DNA, while the concentration needed in theseexperiments is relatively high. DNA chains may form dimers,trimers and multimers at high concentrations, and thus it isdifficult to study a single-molecule behavior with these twotechniques.9,32 Moreover, the fluorescence method can be usedto study the single molecular behavior because of its highsensitivity, however, the labeling with extrinsic fluorophoresor the substitutions of 2-aminopurine for adenine bases mightinfluence the structural properties of DNA.22,27,65 In this study,we use analytical ultracentrifugation (AUC) to study the hydro-dynamic properties of human telomere DNA (HT-DNA) indifferent salt solutions as AUC is a powerful technique to
investigate the solution properties of biomacromolecules with-out labeling.7,36–39,47–53,66–69 After loading sufficient data toSEDFIT (version 14.1),55,66 we chose the continuous distributionc(s) model with maximum entropy regularization to fit the dataand the standard sedimentation coefficients (s20,w), diffusioncoefficients (D) and weight-average molecular weights (Mw)can be obtained. Fig. 1 shows typical standard sedimentationcoefficient distributions of HT-DNA and control DNA in 10.0 mMTris–HCl buffer solutions (pH = 7.5) with different concentrationsof potassium ions (K+), where the concentration of each DNA waskept at 2.0 mM. Each unimodal distribution of s20,w with amolecular weight (Mw) of about 7.0 � 103 g mol�1 indicates asingle-molecule behavior. Moreover, both s20,w of control DNAand HT-DNA increase with the concentration of K+, butthe change in s20,w of HT-DNA is larger than that for controlDNA because of the additional conformational change from arandom coil to the G-quadruplex structure.
To determine the structural change of HT-DNA with theincreasing concentration of KCl, the CD spectra of HT-DNAwith different concentrations of KCl were measured, as shownin Fig. 2. We increased the concentration of HT-DNA to 8.0 mMto obtain a good signal-to-noise ratio in CD measurements.Note that there is no change in the standard sedimentationcoefficient induced by KCl at two concentrations of DNA(2.0 mM and 8.0 mM), as shown in the ESI† (Fig. S1). Fig. 2shows that a strong positive peak near 290 nm with a shoulderpeak around 270 nm and a smaller negative peak around235 nm are observed with the increasing concentration of K+,indicating the formation of a hybrid-type G-quadruplex, whichis consistent with earlier reports.7,9,70,71 For control DNA, the CDspectra do not change with the increasing concentration of K+,indicating no conformational change, as shown in the ESI† (Fig. S2).
Fig. 1 Normalized sedimentation coefficient distribution of (a) HT-DNAand (b) control DNA at different concentrations of KCl, where theconcentrations of HT-DNA and control DNA were 2.0 mM.
Soft Matter Paper
Publ
ishe
d on
10
June
201
6. D
ownl
oade
d by
Uni
vers
ity o
f Sc
ienc
e an
d T
echn
olog
y of
Chi
na o
n 06
/07/
2016
14:
18:5
5.
View Article Online

5962 | Soft Matter, 2016, 12, 5959--5967 This journal is©The Royal Society of Chemistry 2016
Fig. 3(a) shows the influence of the K+ concentration rangingfrom 0 to 1.0 M on the structural change of HT-DNA in detail.As a control, the standard sedimentation coefficient of a randomsequenced-DNA in the presence of different concentrations ofKCl was also measured. We can divide the whole region intothree subregions, respectively. In subregion I, there is no changein s20,w of both HT-DNA and control DNA with the increase in CK+.s20,w of HT-DNA increases with CK+ in subregion II. s20,w of controlDNA only starts to increase in subregion III when the CK+ ishigher than 1.0 mM. It is known that polynucleotides as polyionsexhibit polyelectrolyte properties in aqueous solutions in thepresence of salts, so the counterions will condense onto the
DNA chains to decrease the electrostatic repulsive interactionsbetween phosphate groups of polynucleotides.72,73 Moreover,the increase in the amount of the counterions can lead to anincrease in the degree of adsorption of counterions and thus adecrease in the size of the polyions.74–76 Nevertheless, there isno increase in s20,w of control DNA until the concentration of K+
is above 1.0 mM, as shown in Fig. 3(a). Similarly, Sauer et al.reported that the addition of NaCl has no effect on the counter-ion condensation of a poly(T) when the NaCl concentration issmaller than 1 mM as the solution contains 10 mM sodiumphosphate.77 Thus a small amount of K+ less than 1.0 mMadded into the system containing 10.0 mM Tris has no obviouseffect on the counterion condensation and the standard sedi-mentation coefficient of control DNA. However, s20,w of HT-DNAstarts to increase with CK+ when CK+ is higher than 10.0 mM whichis much smaller than 1.0 mM. For HT-DNA, besides the non-specific electrostatic interaction which weakens the electrostaticrepulsion between nucleotides, specific interactions between thedehydrated cations and O6 of guanine also exist.2,9 The specificinteractions stabilize the G-tetrad formed by four guanines andpromote the formation of the intra-molecular G-quadruplexaccompanying an increase in s20,w with a small K+ concentrationof B10.0 mM, which was also verified by CD experiments.
To visually distinguish the different contributions of specificand non-specific interactions to s20,w of HT-DNA, Fig. 3(b)shows the normalized signals of CD and s20,w. With the increasein K+ concentration the CD signal of HT-DNA increases andlevels off when the concentration of K+ is larger than 1.0 mM,indicating that the folding process is complete, which is similarto the results reported by Chaires et al.46 Thus, the increase ins20,w of HT-DNA in the subregion II is due to the formation ofthe G-quadruplex. In the subregion III, the increase in s20,w ofHT-DNA and control DNA is presumably due to the non-specificinteractions between phosphate groups and K+, which makethe sedimentation of DNA much faster.
The effects of specific cations on the formation of theG-quadruplex
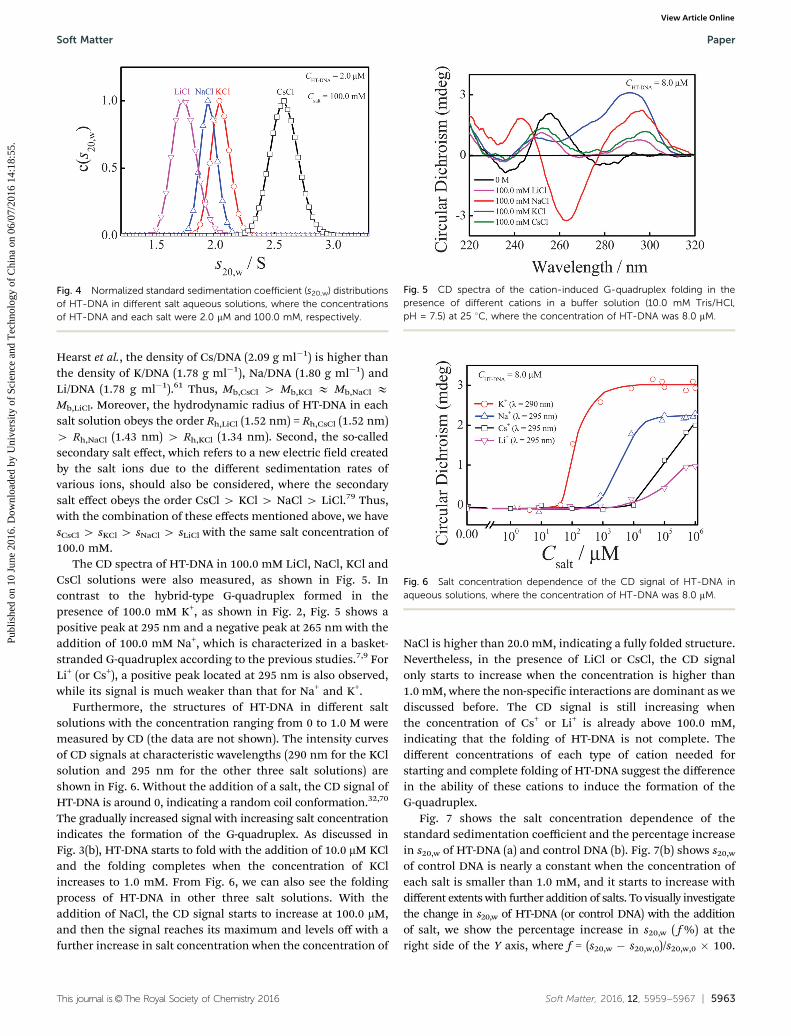
Fig. 4 shows the standard sedimentation coefficient distributionsof HT-DNA in 100.0 mM LiCl, NaCl, KCl and CsCl solutions. Theunimodal distribution indicates a unimolecular behavior ofHT-DNA upon addition of these salts. A significant differencein s20,w in the presence of different salts is observed, which willbe discussed as follows. First of all, from the Svedberg equation,we know that the sedimentation coefficient of macromoleculesis proportional to buoyant mass [Mb = M(1 � �nrs)] divided bythe hydrodynamic radius of the macromolecules. Note thatthe influence of the density and viscosity of the solvent iseliminated by the use of the standard sedimentation coefficient.By fitting the sedimentation data to the continuous distributionc(s) model with SEDFIT, we can obtain the values of Mw and Rh
with the relative standard errors less than 5%.78 Since themolecular weight of cations decreases in the order Cs+ 4K+ 4 Na+ 4 Li+, Mw of HT-DNA decreases in the order Mw,CsCl
(8.0 � 103 g mol�1) 4 Mw,KCl (6.9 � 103 g mol�1) E Mw,NaCl
(7.0 � 103 g mol�1) E Mw,LiCl (6.7 � 103 g mol�1). As reported by
Fig. 2 CD spectra of the K+-induced G-quadruplex of HT-DNA in a buffersolution (10.0 mM Tris–HCl, pH = 7.5) at 25 1C, where the concentration ofHT-DNA was 8.0 mM.
Fig. 3 (a) KCl concentration dependence of the standard sedimentationcoefficient of HT-DNA and control DNA. (b) Normalized CD signal andstandard sedimentation coefficient as a function of KCl concentration,where DCD
CKCl290nm ¼ CD
CKCl290nm � CD0M
290nm; DCD1:0M290nm ¼ CD1:0M
290nm � CD0M290nm;
DsCKCl20;w ¼ s
CKCl20;w � s0M20;w andDs1:0M20;w ¼ s1:0M20;w � s0M20;w.
Paper Soft Matter
Publ
ishe
d on
10
June
201
6. D
ownl
oade
d by
Uni
vers
ity o
f Sc
ienc
e an
d T
echn
olog
y of
Chi
na o
n 06
/07/
2016
14:
18:5
5.
View Article Online
This journal is©The Royal Society of Chemistry 2016 Soft Matter, 2016, 12, 5959--5967 | 5963
Hearst et al., the density of Cs/DNA (2.09 g ml�1) is higher thanthe density of K/DNA (1.78 g ml�1), Na/DNA (1.80 g ml�1) andLi/DNA (1.78 g ml�1).61 Thus, Mb,CsCl 4 Mb,KCl E Mb,NaCl EMb,LiCl. Moreover, the hydrodynamic radius of HT-DNA in eachsalt solution obeys the order Rh,LiCl (1.52 nm) = Rh,CsCl (1.52 nm)4 Rh,NaCl (1.43 nm) 4 Rh,KCl (1.34 nm). Second, the so-calledsecondary salt effect, which refers to a new electric field createdby the salt ions due to the different sedimentation rates ofvarious ions, should also be considered, where the secondarysalt effect obeys the order CsCl 4 KCl 4 NaCl 4 LiCl.79 Thus,with the combination of these effects mentioned above, we havesCsCl 4 sKCl 4 sNaCl 4 sLiCl with the same salt concentration of100.0 mM.
The CD spectra of HT-DNA in 100.0 mM LiCl, NaCl, KCl andCsCl solutions were also measured, as shown in Fig. 5. Incontrast to the hybrid-type G-quadruplex formed in thepresence of 100.0 mM K+, as shown in Fig. 2, Fig. 5 shows apositive peak at 295 nm and a negative peak at 265 nm with theaddition of 100.0 mM Na+, which is characterized in a basket-stranded G-quadruplex according to the previous studies.7,9 ForLi+ (or Cs+), a positive peak located at 295 nm is also observed,while its signal is much weaker than that for Na+ and K+.
Furthermore, the structures of HT-DNA in different saltsolutions with the concentration ranging from 0 to 1.0 M weremeasured by CD (the data are not shown). The intensity curvesof CD signals at characteristic wavelengths (290 nm for the KClsolution and 295 nm for the other three salt solutions) areshown in Fig. 6. Without the addition of a salt, the CD signal ofHT-DNA is around 0, indicating a random coil conformation.32,70
The gradually increased signal with increasing salt concentrationindicates the formation of the G-quadruplex. As discussed inFig. 3(b), HT-DNA starts to fold with the addition of 10.0 mM KCland the folding completes when the concentration of KClincreases to 1.0 mM. From Fig. 6, we can also see the foldingprocess of HT-DNA in other three salt solutions. With theaddition of NaCl, the CD signal starts to increase at 100.0 mM,and then the signal reaches its maximum and levels off with afurther increase in salt concentration when the concentration of
NaCl is higher than 20.0 mM, indicating a fully folded structure.Nevertheless, in the presence of LiCl or CsCl, the CD signalonly starts to increase when the concentration is higher than1.0 mM, where the non-specific interactions are dominant as wediscussed before. The CD signal is still increasing whenthe concentration of Cs+ or Li+ is already above 100.0 mM,indicating that the folding of HT-DNA is not complete. Thedifferent concentrations of each type of cation needed forstarting and complete folding of HT-DNA suggest the differencein the ability of these cations to induce the formation of theG-quadruplex.
Fig. 7 shows the salt concentration dependence of thestandard sedimentation coefficient and the percentage increasein s20,w of HT-DNA (a) and control DNA (b). Fig. 7(b) shows s20,w
of control DNA is nearly a constant when the concentration ofeach salt is smaller than 1.0 mM, and it starts to increase withdifferent extents with further addition of salts. To visually investigatethe change in s20,w of HT-DNA (or control DNA) with the additionof salt, we show the percentage increase in s20,w ( f %) at theright side of the Y axis, where f = (s20,w � s20,w,0)/s20,w,0 � 100.
Fig. 5 CD spectra of the cation-induced G-quadruplex folding in thepresence of different cations in a buffer solution (10.0 mM Tris/HCl,pH = 7.5) at 25 1C, where the concentration of HT-DNA was 8.0 mM.
Fig. 6 Salt concentration dependence of the CD signal of HT-DNA inaqueous solutions, where the concentration of HT-DNA was 8.0 mM.
Fig. 4 Normalized standard sedimentation coefficient (s20,w) distributionsof HT-DNA in different salt aqueous solutions, where the concentrationsof HT-DNA and each salt were 2.0 mM and 100.0 mM, respectively.
Soft Matter Paper
Publ
ishe
d on
10
June
201
6. D
ownl
oade
d by
Uni
vers
ity o
f Sc
ienc
e an
d T
echn
olog
y of
Chi
na o
n 06
/07/
2016
14:
18:5
5.
View Article Online

5964 | Soft Matter, 2016, 12, 5959--5967 This journal is©The Royal Society of Chemistry 2016
With the addition of 100.0 mM Cs+, K+, Na+ and Li+, the changein s20,w for control DNA is 56.8%, 16.4%, 13.1% and 6.3%,respectively, which is due to the non-specific counterion con-densation by noting that there is no specific interactionsbetween control DNA and salts. The different changes in s20,w
may be due to the different changes in buoyant mass Mb and thesecond salt effect, as mentioned in Fig. 4. For HT-DNA, theminimum concentration of cations required to induce theincrease in s20,w follows the order K+ (B10.0 mM) o Na+
(B100.0 mM) o Cs+ E Li+ (B1.0 mM), i.e. the ability ofcation-induced formation of the G-quadruplex follows the orderK+ 4 Na+ 4 Cs+ E Li+, which is consistent with the CD resultsshown in Fig. 6. Previous reports also showed that the ability ofcations to induce the formation of the G-quadruplex isdifferent.41,80,81 By the use of an ultrafast microfluidic mixer,Liu et al. showed that the folding rate of the G-quadruplexformed from (d(TTAGGG)4) was more rapid in K+ solution thanthat in Na+ solution.40 The dehydrated K+ ion is more suitablefor the G-quartet than Na+, not only because of a better fit size ofdehydrated K+, but also due to the lower energetic cost ofdehydration of K+. Note that it was reported that the dehydratedradius of ions obeys the order Li+ o Na+ o K+ o Cs+.82–85 Theresults obtained from large angle X-ray scattering (LAXS) anddouble difference infrared spectroscopy (DDIR) suggested thatthe smaller lithium ion is more strongly hydrated than Na+,K+ and then Cs+.86 Therefore, it is more difficult for Li+ todehydrate and then bind with the G-quadruplex due to its smallsize and high extent of hydration.72,82 Furthermore, the size ofdehydrated Cs+ is too large to fit the cavity of the G-quartet. Themain interactions between Li+, Cs+ and HT-DNA are non-specific interactions, which are responsible for the increase in
s20,w when the concentration is higher than 1.0 mM, as shown inFig. 7(a). The percentage increase in s20,w of HT-DNA in thepresence of 100.0 mM Cs+, K+, Na+ and Li+ is 69.6%, 33.4%,25.0% and 10.3%, respectively. The changes in s20,w for HT-DNAare more pronounced than that for control DNA, which resultedfrom the additional formation of the G-quadruplex.
The hydrodynamic radius (Rh) is a critical property tocharacterize the effect of cations on DNA. In SV experiments,we can obtain the values of D and Rh by fitting the sedimentationdata with SEDFIT. Fig. 8 shows the changes in Rh of HT-DNA (a)and control DNA (b) with the increase in salt concentration. Asshown in Fig. 8(b), a larger Rh value indicates that the controlDNA with a small concentration of salts adopts a more extendedconformation in the solutions. When the concentration of eachsalt reaches 1.0 mM, Rh decreases with the concentration of salt,which is due to the non-specific interactions. The salt concen-tration where the non-specific interactions start to work is ingood agreement with the value obtained from Fig. 7(b). The salt-induced condensation of DNA is a common phenomenon in theaqueous solutions of polyions. Using fluorescence correlationspectroscopy (FCS), Sauer et al. studied the hydrodynamicproperties of polythymine in the 10 mM sodium phosphatebuffer solution, and they found that the hydrodynamic radius(Rh) remains unchanged when the NaCl concentration is smallerthan 10 mM, and scales with concentration of added NaCl withan exponent a = (�0.11 � 0.01) when the NaCl concentration ishigher than 10 mM.77 Here, Rh scales with the salt concentrationas Rh p Ca with the exponents for these four types of cationsbetween �0.043 and �0.051 and has a weak cation-dependence.Note that the difference between the values of the exponents inour study and the value (�0.11) reported by Sauer et al. may bedue to the different lengths and sequences of DNA samplesand/or the species of buffers.
Fig. 7 Salt concentration dependence of the standard sedimentationcoefficient and the percentage increase in s20,w (f%) of (a) HT-DNA and(b) control DNA in aqueous solutions, where the concentration of eachDNA was 2.0 mM. f% is defined as (s20,w � s20,w,0)/s20,w,0 � 100 and s20,w,0
refers to s20,w of HT-DNA (or control DNA) in the buffer solutions withoutthe addition of these four types of salts.
Fig. 8 Salt concentration dependence of the hydrodynamic radius of(a) HT-DNA and (b) control DNA in aqueous solutions, where the concen-tration of each DNA was 2.0 mM.
Paper Soft Matter
Publ
ishe
d on
10
June
201
6. D
ownl
oade
d by
Uni
vers
ity o
f Sc
ienc
e an
d T
echn
olog
y of
Chi
na o
n 06
/07/
2016
14:
18:5
5.
View Article Online
This journal is©The Royal Society of Chemistry 2016 Soft Matter, 2016, 12, 5959--5967 | 5965
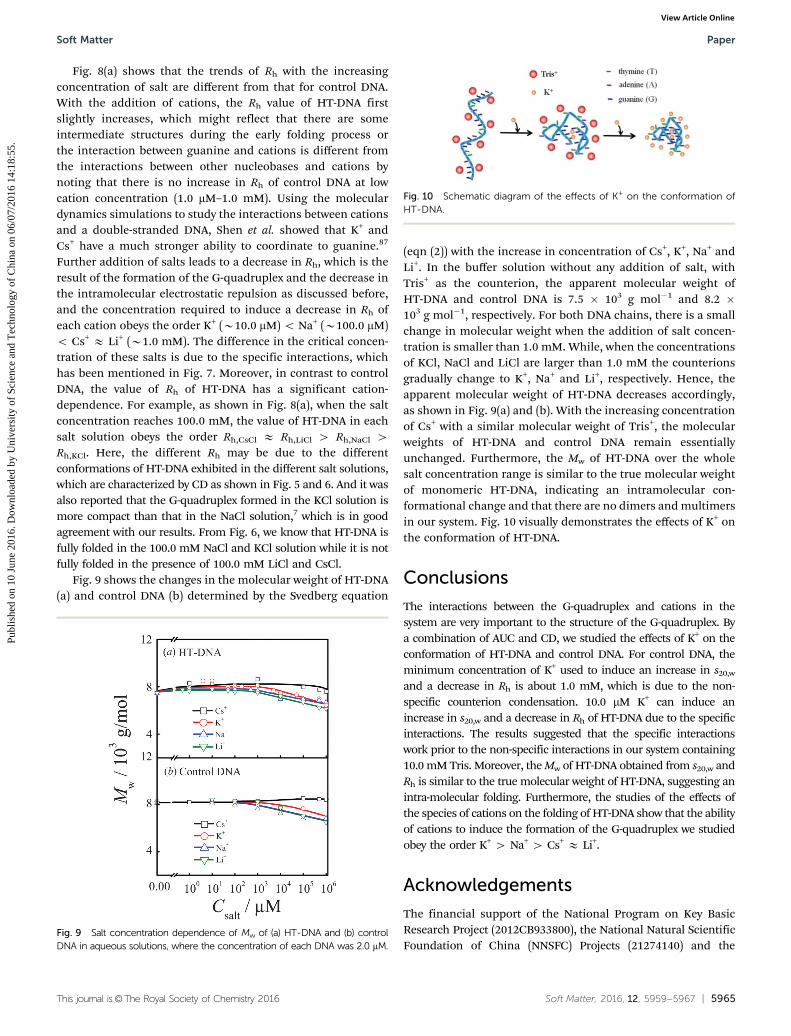
Fig. 8(a) shows that the trends of Rh with the increasingconcentration of salt are different from that for control DNA.With the addition of cations, the Rh value of HT-DNA firstslightly increases, which might reflect that there are someintermediate structures during the early folding process orthe interaction between guanine and cations is different fromthe interactions between other nucleobases and cations bynoting that there is no increase in Rh of control DNA at lowcation concentration (1.0 mM–1.0 mM). Using the moleculardynamics simulations to study the interactions between cationsand a double-stranded DNA, Shen et al. showed that K+ andCs+ have a much stronger ability to coordinate to guanine.87
Further addition of salts leads to a decrease in Rh, which is theresult of the formation of the G-quadruplex and the decrease inthe intramolecular electrostatic repulsion as discussed before,and the concentration required to induce a decrease in Rh ofeach cation obeys the order K+ (B10.0 mM) o Na+ (B100.0 mM)o Cs+ E Li+ (B1.0 mM). The difference in the critical concen-tration of these salts is due to the specific interactions, whichhas been mentioned in Fig. 7. Moreover, in contrast to controlDNA, the value of Rh of HT-DNA has a significant cation-dependence. For example, as shown in Fig. 8(a), when the saltconcentration reaches 100.0 mM, the value of HT-DNA in eachsalt solution obeys the order Rh,CsCl E Rh,LiCl 4 Rh,NaCl 4Rh,KCl. Here, the different Rh may be due to the differentconformations of HT-DNA exhibited in the different salt solutions,which are characterized by CD as shown in Fig. 5 and 6. And it wasalso reported that the G-quadruplex formed in the KCl solution ismore compact than that in the NaCl solution,7 which is in goodagreement with our results. From Fig. 6, we know that HT-DNA isfully folded in the 100.0 mM NaCl and KCl solution while it is notfully folded in the presence of 100.0 mM LiCl and CsCl.
Fig. 9 shows the changes in the molecular weight of HT-DNA(a) and control DNA (b) determined by the Svedberg equation
(eqn (2)) with the increase in concentration of Cs+, K+, Na+ andLi+. In the buffer solution without any addition of salt, withTris+ as the counterion, the apparent molecular weight ofHT-DNA and control DNA is 7.5 � 103 g mol�1 and 8.2 �103 g mol�1, respectively. For both DNA chains, there is a smallchange in molecular weight when the addition of salt concen-tration is smaller than 1.0 mM. While, when the concentrationsof KCl, NaCl and LiCl are larger than 1.0 mM the counterionsgradually change to K+, Na+ and Li+, respectively. Hence, theapparent molecular weight of HT-DNA decreases accordingly,as shown in Fig. 9(a) and (b). With the increasing concentrationof Cs+ with a similar molecular weight of Tris+, the molecularweights of HT-DNA and control DNA remain essentiallyunchanged. Furthermore, the Mw of HT-DNA over the wholesalt concentration range is similar to the true molecular weightof monomeric HT-DNA, indicating an intramolecular con-formational change and that there are no dimers and multimersin our system. Fig. 10 visually demonstrates the effects of K+ onthe conformation of HT-DNA.
Conclusions
The interactions between the G-quadruplex and cations in thesystem are very important to the structure of the G-quadruplex. Bya combination of AUC and CD, we studied the effects of K+ on theconformation of HT-DNA and control DNA. For control DNA, theminimum concentration of K+ used to induce an increase in s20,w
and a decrease in Rh is about 1.0 mM, which is due to the non-specific counterion condensation. 10.0 mM K+ can induce anincrease in s20,w and a decrease in Rh of HT-DNA due to the specificinteractions. The results suggested that the specific interactionswork prior to the non-specific interactions in our system containing10.0 mM Tris. Moreover, the Mw of HT-DNA obtained from s20,w andRh is similar to the true molecular weight of HT-DNA, suggesting anintra-molecular folding. Furthermore, the studies of the effects ofthe species of cations on the folding of HT-DNA show that the abilityof cations to induce the formation of the G-quadruplex we studiedobey the order K+ 4 Na+ 4 Cs+ E Li+.
Acknowledgements
The financial support of the National Program on Key BasicResearch Project (2012CB933800), the National Natural ScientificFoundation of China (NNSFC) Projects (21274140) and the
Fig. 9 Salt concentration dependence of Mw of (a) HT-DNA and (b) controlDNA in aqueous solutions, where the concentration of each DNA was 2.0 mM.
Fig. 10 Schematic diagram of the effects of K+ on the conformation ofHT-DNA.
Soft Matter Paper
Publ
ishe
d on
10
June
201
6. D
ownl
oade
d by
Uni
vers
ity o
f Sc
ienc
e an
d T
echn
olog
y of
Chi
na o
n 06
/07/
2016
14:
18:5
5.
View Article Online

5966 | Soft Matter, 2016, 12, 5959--5967 This journal is©The Royal Society of Chemistry 2016
Fundamental Research Funds for the Central Universities(WK2340000066) is gratefully acknowledged.
Notes and references
1 D. Sen and W. Gilbert, Nature, 1988, 334, 364–366.2 J. R. Williamson, M. K. Raghuraman and T. R. Cech, Cell,
1989, 59, 871–880.3 W. Guschlbauer, J. F. Chantot and D. Thiele, J. Biomol.
Struct. Dyn., 1990, 8, 491–511.4 Y. Wang and D. J. Patel, Structure, 1993, 1, 263–282.5 A. T. Phan and D. J. Patel, J. Am. Chem. Soc., 2003, 125,
15021–15027.6 J. T. Davis, Angew. Chem., Int. Ed., 2004, 43, 668–698.7 J. Li, J. J. Correia, L. Wang, J. O. Trent and J. B. Chaires,
Nucleic Acids Res., 2005, 33, 4649–4659.8 K. N. Luu, A. T. Phan, V. Kuryavyi, L. Lacroix and D. J. Patel,
J. Am. Chem. Soc., 2006, 128, 9963–9970.9 A. Ambrus, D. Chen, J. Dai, T. Bialis, R. A. Jones and
D. Yang, Nucleic Acids Res., 2006, 34, 2723–2735.10 M. C. Miller, R. Buscaglia, J. B. Chaires, A. N. Lane and
J. O. Trent, J. Am. Chem. Soc., 2010, 132, 17105–17107.11 S. Burge, G. N. Parkinson, P. Hazel, A. K. Todd and
S. Neidle, Nucleic Acids Res., 2006, 34, 5402–5415.12 E. H. Blackburn and J. W. Szostak, Annu. Rev. Biochem.,
1984, 53, 163–194.13 E. H. Blackburn, Nature, 1991, 350, 569–573.14 V. L. Makarov, Y. Hirose and J. P. Langmore, Cell, 1997, 88,
657–666.15 E. H. Blackburn, Nature, 2000, 408, 53–56.16 J. L. Mergny, J. F. Riou, P. Mailliet, M. P. Teulade-Fichou and
E. Gilson, Nucleic Acids Res., 2002, 30, 839–865.17 D. Y. Sun, B. Thompson, B. E. Cathers, M. Salazar, S. M. Kerwin,
J. O. Trent, T. C. Jenkins, S. Neidle and L. H. Hurley, J. Med.Chem., 1997, 40, 2113–2116.
18 S. Neidle and G. Parkinson, Nat. Rev. Drug Discovery, 2002, 1,383–393.
19 I. Bessi, H. R. A. Jonker, C. Richter and H. Schwalbe, Angew.Chem., Int. Ed., 2015, 54, 8444–8448.
20 K. Phillips, Z. Dauter, A. I. H. Murchie, D. M. J. Lilley andB. Luisi, J. Mol. Biol., 1997, 273, 171–182.
21 P. Hazel, J. Huppert, S. Balasubramanian and S. Neidle,J. Am. Chem. Soc., 2004, 126, 16405–16415.
22 C. S. Mekmaysy, L. Petraccone, N. C. Garbett, P. A. Ragazzon,J. O. Trent and J. B. Chaires, J. Am. Chem. Soc., 2008, 130,6710–6711.
23 H. Zhu, S. Y. Xiao and H. J. Liang, PLoS One, 2013, 8, e71380.24 R. M. Abu-Ghazalah, S. Rutledge, L. W. Lau, D. N. Dubins,
R. B. Macgregor, Jr. and A. S. Helmy, Biochemistry, 2012, 51,7357–7366.
25 B. G. Kim, Y. L. Shek and T. V. Chalikian, Biophys. Chem.,2013, 184, 95–100.
26 J. Mohanty, N. Barooah, V. Dhamodharan, S. Harikrishna,P. I. Pradeepkumar and A. C. Bhasikuttan, J. Am. Chem. Soc.,2013, 135, 367–376.
27 L. Ying, J. J. Green, H. Li, D. Klenerman and S. Balasubramanian,Proc. Natl. Acad. Sci. U. S. A., 2003, 100, 14629–14634.
28 M. Boncina, J. Lah, I. Prislan and G. Vesnaver, J. Am. Chem.Soc., 2012, 134, 9657–9663.
29 B. Pagano, A. Randazzo, I. Fotticchia, E. Novellino,L. Petraccone and C. Giancola, Methods, 2013, 64, 43–51.
30 A. Marchand, R. Ferreira, H. Tateishi-Karimata, D. Miyoshi,N. Sugimoto and V. Gabelica, J. Phys. Chem. B, 2013, 117,12391–12401.
31 A. Marchand, A. Granzhan, K. Iida, Y. Tsushima, Y. Ma,K. Nagasawa, M. Teulade-Fichou and V. Gabelica, J. Am.Chem. Soc., 2015, 137, 750–756.
32 A. Wlodarczyk, P. Grzybowski, A. Patkowski and A. Dobek,J. Phys. Chem. B, 2005, 109, 3594–3605.
33 Z. Y. Kan, Y. Lin, F. Wang, X. Y. Zhuang, Y. Zhao, D. W. Pang,Y. H. Hao and Z. Tan, Nucleic Acids Res., 2007, 35, 3646–3653.
34 Y. Amemiya, Y. Furunaga, K. Iida, M. Tera, K. Nagasawa,K. Ikebukuroa and C. Nakamura, Chem. Commun., 2011, 47,7485–7487.
35 H. Wang, G. J. Nora, H. Ghodke and P. L. Opresko, J. Biol.Chem., 2011, 286, 7479–7489.
36 L. M. Hellman, D. W. Rodgers and M. G. Fried, Eur. Biophys.J., 2010, 39, 389–396.
37 N. C. Garbett, C. S. Mekmaysy and J. B. Chaires, MethodsMol. Biol., 2010, 608, 97–120.
38 L. Petraccone, C. Spink, J. O. Trent, N. C. Garbett,C. S. Mekmaysy, C. Giancola and J. B. Chaires, J. Am. Chem.Soc., 2011, 133, 20951–20961.
39 H. T. Le, W. L. Dean, R. Buscaglia, J. B. Chaires andJ. O. Trent, J. Phys. Chem. B, 2014, 118, 5390–5405.
40 Y. Li, C. Liu, X. Feng, Y. Xu and B. F. Liu, Anal. Chem., 2014,86, 4333–4339.
41 R. D. Gray and J. B. Chaires, Nucleic Acids Res., 2008, 36, 4191–4203.42 V. Kumar, A. Sengupta, K. Gavvala, R. K. Koninti and
P. Hazra, J. Phys. Chem. B, 2014, 118, 11090–11099.43 N. V. Hud, F. W. Smith, F. A. L. Anet and J. Feigon,
Biochemistry, 1996, 35, 15383–15390.44 H. K. Frensdorf, J. Am. Chem. Soc., 1971, 93, 600–606.45 W. Xu, Q. G. Tan, M. Yu, Q. Sun, H. H. Kong, E. Laesgaard,
I. Stensgaard, J. Kjems, J. G. Wang, C. Wang andF. Besenbacher, Chem. Commun., 2013, 49, 7210–7212.
46 R. D. Gray and J. B. Chaires, Biophys. Chem., 2011, 159, 205–209.47 S. Wu, X. Y. Wang, X. D. Ye and G. Z. Zhang, J. Phys. Chem. B,
2013, 117, 11541–11547.48 M. Trajkovski, M. W. da Silva and J. Plavec, J. Am. Chem.
Soc., 2012, 134, 4132–4141.49 U. Dornberger, J. Behlke, E. BirchHirschfeld and H. Fritzsche,
Nucleic Acids Res., 1997, 25, 822–829.50 T. Laue, Curr. Opin. Struct. Biol., 2001, 11, 579–583.51 M. C. Miller, H. T. Le, W. L. Dean, P. A. Holt, J. B. Chaires
and J. O. Trent, Org. Biomol. Chem., 2011, 9, 7633–7637.52 H. T. Le, M. C. Miller, R. Buscaglia, W. L. Dean, P. A. Holt, J. B.
Chaires and J. O. Trent, Org. Biomol. Chem., 2012, 10, 9393–9404.53 C. Rehm, I. T. Holder, A. Groß, F. Wojciechowski, M. Urban,
M. Sinn, M. Drescher and J. S. Hartig, Chem. Sci., 2014, 5,2809–2818.
Paper Soft Matter
Publ
ishe
d on
10
June
201
6. D
ownl
oade
d by
Uni
vers
ity o
f Sc
ienc
e an
d T
echn
olog
y of
Chi
na o
n 06
/07/
2016
14:
18:5
5.
View Article Online

This journal is©The Royal Society of Chemistry 2016 Soft Matter, 2016, 12, 5959--5967 | 5967
54 H. T. Le, R. Buscaglia, W. L. Dean, J. B. Chaires andJ. O. Trent, Top. Curr. Chem., 2013, 330, 179–210.
55 P. Schuck, Biophys. J., 2000, 78, 1606–1619.56 J. Dam and P. Schuck, Numerical Computer Methods, Pt E,
2004, 384, 185–212.57 P. H. Brown and P. Schuck, Biophys. J., 2006, 90, 4651–4661.58 S. W. Provencher, Comput. Phys. Commun., 1982, 27, 213–227.59 S. W. Provencher, Comput. Phys. Commun., 1982, 27,
229–242.60 P. H. Brown, A. Balbo, H. Y. Zhao, C. Ebel and P. Schuck,
PLoS One, 2011, 6, e26221.61 J. E. Hearst, J. Mol. Biol., 1962, 4, 415–417.62 R. B. J. Vinogard, Biochim. Biophys. Acta, 1965, 108, 18–29.63 G. Cohen and H. Eisenber, Biopolymers, 1968, 6, 1077–1100.64 W. Machtle and L. Borger, Analytical Ultracentrifugation of
polymers and Nanoparticles, Springer, Berlin, 2006.65 P. Alberti and J. L. Mergny, Proc. Natl. Acad. Sci. U. S. A.,
2003, 100, 1569–1573.66 J. Lebowitz, M. S. Lewis and P. Schuck, Protein Sci., 2002, 11,
2067–2079.67 C. Ebel, Methods, 2011, 54, 56–66.68 R. Buscaglia, M. C. Miller, W. L. Dean, R. D. Gray, A. N. Lane,
J. O. Trent and J. B. Chaires, Nucleic Acids Res., 2013, 41,7934–7946.
69 H. Y. Zhao, R. Ghirlando, C. Alfonso, F. Arisaka, I. Attali andD. L. Bain, et al., PLoS One, 2015, 10, e0126420.
70 M. Vorlickova, J. Chladkova, I. Kejnovska, M. Fialova andJ. Kypr, Nucleic Acids Res., 2005, 33, 5851–5860.
71 Y. Xu, Y. Noguchi and H. Sugiyama, Bioorg. Med. Chem.,2006, 14, 5584–5591.
72 G. S. Manning, Q. Rev. Biophys., 1978, 11, 179–246.73 M. D. N. Ngavouka, A. Bosco, L. Casalis and P. Parisse,
Macromolecules, 2014, 47, 8748–8753.74 M. Balastre, F. Li, P. Schorr, J. C. Yang, J. W. Mays and
M. V. Tirrell, Macromolecules, 2002, 35, 9480–9486.75 M. Muthukumar, J. Chem. Phys., 2004, 120, 9343–9350.76 D. Bracha, E. Karzbrun, G. Shemer, P. A. Pincus and R. H.
Bar-Ziv, Proc. Natl. Acad. Sci. U. S. A., 2013, 110, 4534–4538.77 S. Doose, H. Barsch and M. Sauer, Biophys. J., 2007, 93,
1224–1234.78 J. L. Cole, J. W. Lary, T. P. Moody and T. M. Laue, Methods
Cell Biol., 2008, 84, 143–179.79 K. O. Pedersen, J. Phys. Chem., 1958, 62, 1282–1290.80 S. Takenaka and B. Juskowiak, Anal. Sci., 2011, 27, 1167–1172.81 C. C. Hardin, T. Watson, M. Corregan and C. Bailey, Biochemistry,
1992, 31, 833–841.82 J. Kiella, J. Am. Chem. Soc., 1973, 59, 1675–1678.83 J. N. Israelachvili, Intermolecular and Surface Forces, Elsevier,
London, 3rd edn, 2011.84 E. Largy, A. Marchand, S. Amrane, V. Gabelica and
J. L. Mergny, J. Am. Chem. Soc., 2016, 138, 2780–2792.85 Y. Kim, T.-T. T. Nguyen and D. G. Churchill, Met. Ions Life
Sci., 2016, 16, 1–10.86 J. Mahler and I. Persson, Inorg. Chem., 2012, 51, 425–438.87 X. Shen, B. Gu, S. A. Che and F. S. Zhang, J. Chem. Phys.,
2011, 135, 034509.
Soft Matter Paper
Publ
ishe
d on
10
June
201
6. D
ownl
oade
d by
Uni
vers
ity o
f Sc
ienc
e an
d T
echn
olog
y of
Chi
na o
n 06
/07/
2016
14:
18:5
5.
View Article Online