the effects of net fishing: addressing biodiversity and
TRANSCRIPT

The effects of net fishing: addressing biodiversity and bycatch issues in
Queensland inshore waters
by
Ian Halliday1 Janet Ley2, Andrew Tobin3
Rod Garrett4, Neil Gribble4 and David Mayer5
1Queensland Department of Primary Industries, Agency for Food and Fibre Sciences, Fisheries and Aquaculture, Southern Fisheries Centre, PO Box 76, Deception Bay, Qld. 4508, Australia.
2Australain Institute of Marine Sciences, PMB No 3, Townsville Qld 4810. Current Address:Australian Maritime College, Faculty of Fish and Environment, PO Box 21, Beaconsfield TAS 7270
3Queensland Department of Primary Industries, Agency for Food and Fibre Sciences, Fisheries and Aquaculture, Oonoomba Research Centre PO Box 1085 Townsville 4801 Current Address: CRC Reef Centre, James Cook University, Townsville 4812.
4Queensland Department of Primary Industries, Agency for Food and Fibre Sciences, Fisheries and Aquaculture, Northern Fisheries Centre, PO Box 5396 Cairns, 4870.
5Queensland Department of Primary Industries, Agency for Food and Fibre Sciences, Queensland Beef Industry Institute, Locked Mail Bag 4, Yeerongpilly, 4105.
FRDC Project No. 97/206
October 2001 ISBN 0 7345 0150 1

ii
QO01022 ISSN 0727-6281 AGDEX 475/10 ISBN 0 7345 0150 1
Information contained in this publication is provided as general advice only. For application to specific circumstances, professional advice should be sought.
The Department of Primary Industries, Queensland, has taken all reasonable steps to ensure that the information contained in this publication is accurate at the time of production. Readers should ensure that they make appropriate inquiries to determine whether new information is available on the particular subject matter.
ISBN 0 7345 0150 1 ª The State of Queensland, Department of Primary Industries, and the Fisheries Research and Development Corporation, 2001.
Copyright protects this publication. Except for purposes permitted by the Copyright Act, reproduction by whatever means is prohibited without prior written permission of the Department of Primary Industries, Queensland, and the Fisheries Research and Development Corporation. Inquiries should be addressed to:
Southern Fisheries Centre Department of Primary Industries PO Box 76 Deception Bay Qld 4508

iii
CONTENTS
1. NON-TECHNICAL SUMMARY ................................................................................................................1
2. BACKGROUND...............................................................................................................................................4
3. NEED ...................................................................................................................................................................6
4. OBJECTIVES ...................................................................................................................................................7
5. ACHIEVEMENT OF OBJECTIVES .........................................................................................................8
6. CATCH CHARACTERIS TICS OF QUEENSLAND INSHORE NET FISHERIES ................ 10
6.1 INTRODUCTION.............................................................................................................................................10 6.2 METHODS FOR DETERMINING CATCH COMPOSITION OF QUEENSLAND INSHORE FISHERIES.............10
6.2.1 Logbook program............................................................................................................................ 10 6.2.2 Observer Program........................................................................................................................... 11 6.2.3 Data Analysis ................................................................................................................................... 11
6.3 RESULTS OF OBSERVER AND LOGBOOK PROGRAMS..............................................................................11 6.3.1 Southern Logbook Returns............................................................................................................. 11 6.3.2 Sea Mullet Fishery in Southern Queensland.............................................................................. 12
6.3.2.1 Logbook Program in the Sea Mullet Fishery .................................................................................12 6.3.2.2 Observer Program in the Sea Mullet Fishery.................................................................................14 6.3.2.3 Seasonality of catch in Sea Mullet Fishery ....................................................................................16
6.3.3 Whiting Fisheries in Southern Queensland................................................................................. 17 6.3.3.1 Logbook Program in the Whiting Fishery......................................................................................18 6.3.3.2 Observer Program in the Whiting Fishery .....................................................................................19 6.3.3.3 Seasonality of bycatch in the Whiting Fishery...............................................................................21
6.3.4 Small Mackerel Fisheries in Southern Queensland................................................................... 23 6.3.4.1 Logbook Program in the southern Small Mackerel Fishery...........................................................23 6.3.4.2 Observer Program in the southern Small Mackerel Fishery ..........................................................24
6.3.5 Tropical East Coast Barramundi Fishery................................................................................... 26 6.3.5.1 Logbook Program in the East Coast Barramundi Fishery..............................................................26 6.3.5.2 Observer Program in the East Coast Barramundi Fishery .............................................................26
6.3.6 Tropical East Coast “Mixed Estuary” Fishery.......................................................................... 28 6.3.6.1 Logbook Program in the East Coast “Mixed Estuary” Fishery......................................................28 6.3.6.2 Observer Program in the East Coast “Mixed Estuary” Fishery .....................................................29 6.3.6.3 Mesh Effects...................................................................................................................................30
6.3.7 Gulf of Carpentaria Set Net Barramundi and “Mixed Estuary” Fisheries........................... 31 6.3.7.1 Logbook Program in the Gulf of Carpentaria Barramundi Fishery ...............................................32 6.3.7.2 Observer Program in the Gulf of Carpentaria Barramundi Fishery ...............................................33 6.3.7.3 Logbook Program in the Gulf of Carpentaria Mixed Estuary Fishery...........................................34 6.3.7.4 Observer Program in the Gulf of Carpentaria Mixed Estuary Fishery...........................................34 6.3.7.5 Locality and Seasonal Effects in Gulf of Carpentaria Fisheries. ...................................................35
6.4 DISCUSSION OF BYCATCH IN NET FISHERIES..........................................................................................38
7. FATE OF FINFISH DISCARDED FROM NET CATCHES ........................................................... 41
7.1 METHODS FOR DETERMINING THE FATE OF DISCARDED BYCATCH......................................................41 7.2 RESULTS OF FATE OF DISCARDED BYCATCH..........................................................................................42
7.2.1 Southern Fish Species..................................................................................................................... 42 7.2.2 Tropical Inshore Net fisheries....................................................................................................... 43
7.2.2.1 Observed fate of discarded fish from Tropical East Coast Fisheries .............................................43 7.2.2.2 Observed fate of discarded fish in the Gulf of Carpentaria Fisheries ............................................44
8. FISHERY-INDEPENDENT SAMPLING.............................................................................................. 46
8.1 METHODS......................................................................................................................................................46 8.1.1 Site Selection Procedures............................................................................................................... 46 8.1.2 Characteristics of the research nets............................................................................................. 46 8.1.3 Sampling periods............................................................................................................................. 46 8.1.4 Sampling Regime ............................................................................................................................. 47 8.1.5 Checking Nets................................................................................................................................... 49

iv
8.1.6 Fish Removal and Identification................................................................................................... 49 8.1.7 Design of sampling program......................................................................................................... 49 8.1.8 Environmental Parameters............................................................................................................ 49 8.1.9 Statistical Analysis .......................................................................................................................... 50 8.1.10 Model development and testing..................................................................................................... 51 8.1.11 Multivariate Analyses..................................................................................................................... 51
8.2 RESULTS OF INTENSIVE FISHERY INDEPENDENT SURVEY.....................................................................52 8.2.1 Overall Catch................................................................................................................................... 52 8.2.2 Environmental Conditions............................................................................................................. 52 8.2.3 Variance in Fish Catch................................................................................................................... 56
8.3 FISHERY INDEPENDENT DISCUSSION ........................................................................................................80 8.3.1 Comparison of Six Riverine Estuaries......................................................................................... 80 8.3.2 Value of Long Term Fishery Replenishment Zones................................................................... 84
9. BENEFITS ...................................................................................................................................................... 87
10. INTELLECTUAL PROPERTY ............................................................................................................... 87
11. FURTHER DEVELOPMENT................................................................................................................... 88
12. STAFF .............................................................................................................................................................. 88
13. ACKNOWLEDGMENTS ........................................................................................................................... 89
14. LITERATURE............................................................................................................................................... 90
15. APPENDICES ................................................................................................................................................ 94

v
FIGURES
Figure 1: Sea mullet fishery catch compositions for (a) voluntary logbook catch, (b) bycatch composition from logbook returns, (c) observed catch and (d) bycatch compositon from observer data. Note differences and breaks in scales.....................................................................................................................13
Figure 2: Seasonal changes in mean catch rates (± 1 S.E.) for target and bycatch species within the sea mullet fishery. Note the changes in scale for each species. ......................................................................17
Figure 3: Whiting fishery catch composition for (a) voluntary logbook from 471 net shots (b) voluntary logbook bycatch, (c) observed catch from 31 net shots and (d) observed catch bycatch composition. .............................................................................................................................................................................19
Figure 4: Seasonal changes in mean catch rates (± 1 S.E.) for target and bycatch species within the whiting fishery. Note differences in scale for all species..........................................................................22
Figure 5: Small mackerel fishery catch breakdowns for (a) logbook returns catch (b) logbook bycatch composition (c) observer catch and (d) observer bycatch composition..................................................24
Figure 6: Catch composition for: a East Coast barramundi logbook program., b. East Coast barramundi observer program, c. East Coast mixed estuary logbook program and d. East Coast mixed estuary observer program..............................................................................................................................................28
Figure 7: Mean (+/- 95% CLs) catch rates (fish/m/hr) of bycatch for each mesh category recorded from the tropical east coast observer program. .....................................................................................................30
Figure 8: Dominance plots of mesh size effect on bycatch composition observed in the east-coast barramundi and mixed estuary fisheries. Mixed estuary fish are targeted with small mesh and barramundi with the medium, large and mixed mesh categories. Table 8 lists in decreasing order of dominance the ten most abundant bycatch species.....................................................................................31
Figure 9: Catch composition from a. Gulf of Carpentaria barramundi logbook program, b. Gulf of Carpentaria barramundi observer program and c. Gulf of Carpentaria mixed estuary observer program (no logbook data was collected by fishers targeting mixed estuary fish. ...............................33
Figure 10: Mean (+/- 95% CLs) catch rates (fish/m/h) of bycatch recorded for each sampling event recorded from the Gulf of Carpentaria. S: southern gulf; N: northern gulf; R: river; F: foreshore. Hashed bars represent samples where mixed estuary fish were targeted; clear bars where barramundi was targeted. ................................................................................................................................36
Figure 11: Dominance plots showing the relative contribution of market and bycatch components of the total catches recorded in the observer program for tropical set net fisheries targeting A. GoC barramundi, B. GoC mixed estuary, C. EC barramundi and D. EC mixed estuary (Market = solid dots and lines; Bycatch = hollow dots and broken lines). .........................................................................37
Figure 12: Map of study area showing pairs of open and closed riverine estuaries: North: Russell/Mulgrave (closed) versus Hull (open); Middle: Haughton (closed) vs Barrattas (open); South: Yellow Gin (closed) vs Nobbies Inlet (open). ................................................................................50
Figure 13: Monthly rainfall by station (South: Home Hill, Middle: Giru, North average of Tully and Babinda). Source: Australian Bureau of Meteorology (2000). .................................................................55
Figure 14: Average/trip temperature, salinity and dissolved oxygen concentrations recorded by datalogger with readings taken every five minutes while nets were fishing at the downstream sites. A. Northern rivers Russell River closed to net fishing = circles, Hull River open to net fishing = triangle. B. Haughton River closed to net fishing = circles, Barrattas River open to net fishing = triangles. C. Yellow Gin Creek closed to net fishing = circles, Nobbies Inlet open to net fishing = triangles..............................................................................................................................................................55
Figure 15: Length-frequency histograms for fish caught in each net-type used in..........................................56 Figure 16: Diversity indices (± 1 SE) and overall abundance (± 1 SE) for catch in the 152 mm mesh nets.
Significant effects (P < 0.001) were consistent among sites and for all trips. .......................................57 Figure 17: a. Total biomass (all species) (± 1 SE), caught in the 152 mm mesh nets where significant
effects of fishing were found. Letters indicate significant differences for LSD = 0.05. .....................58 Figure 18: Length-frequency of barramundi caught with 152 mm mesh nets. Dashed line indicates
minimum legal length. Note change in scale on some figures. ................................................................59 Figure 19: Biomass (± 1 SE) of queenfish and estuary whalers caught in the 152 mm mesh nets. Letters
indicate significant differences for LSD = 0.05..........................................................................................60 Figure 20: Abundance of estuary whalers caught in the 152 mm mesh nets showed significant effects (P <
0.001) of fishing. Circles = Closed, Triangles = Open..............................................................................60 Figure 21: Abundances (± 1 SE) of blue threadfin and banded grunter caught in 152 mm mesh nets.
Significant effects of fishing were found for blue salmon (P < 0.04) but not for banded grunter (P < 0.32). Significant three-way interactions were found among the spatial factors (fishing, position,

vi
region, P < 0.05) for both of these commercial species. Letters indicate significant differences for LSD = 0.05. .......................................................................................................................................................61
Figure 22: (a) Dendrogram showing group average clustering of 12 sites based on the twenty most abundant species caught in the 152mm mesh nets. Shading delineates groups at a similarity of 57%; (b) MDS ordination (stress = 0.15) of 12 sites based on twenty most abundant species. Boundaries and shaded areas indentify by cluster; (c) MDS ordination (stress = 0.15) of 12 sites based on twenty most abundant species grouped by open vs closed to net fishing. Bubble plots of average abundance per site for (d) barramundi, (e) king threadfin, (f) queenfish, (g) soapy jew, (h) blue threadfin, (i) estuary whaler and (j) giant trevally. The symbol codes for sites are: N = North, M = Middle, S = South, O = Open, C = Closed, D = Downstream, U = Upstream. .....................................64
Figure 23: Catches in the 102 mm mesh nets had significant effects of fishing (P < 0.01) for several community indicators (a – e). Levels at sites closed to net fishing were generally greater than open sites. Letters indicate significant differences for LSD = 0.05. .................................................................65
Figure 24: Catches (± 1 SE) in the 102 mm mesh nets for a.diamond scale mullet abundance b. ponyfish abundance, c. diamond scale mullet biomass and d. ponyfish biomass were greater in the closed than open systems. Letters indicate significant differences for LSD = 0.05..........................................66
Figure 25: Total abundance (± 1 SE) and total biomass (± 1 SE) of barramundi caught by site in the 102 mm mesh nets. In all cases, closed rivers had significantly greater abundances than open systems. Letters indicate significant differences for LSD = 0.05.............................................................................68
Figure 26: Length-frequency of barramundi sampled using 102 mm mesh nets, comparing open versus closed systems. Dashed line indicates minimum legal length..................................................................69
Figure 27: Seasonal variation in the abundances of barramundi caught in the 102 mm mesh nets for the six rivers sampled. Triangles = Open, Circles = Closed............................................................................69
Figure 28: Seasonal abundance of blue threadfin caught in the 102 mm mesh nets by river. Triangles = Open, Circles = Closed....................................................................................................................................70
Figure 29: Abundance of spotted grunter and banded grunter caught in 102 mm mesh nets by river and position. Letters indicate significant differences for LSD = 0.05............................................................70
Figure 30: (a) Dendrogram showing group average clustering of 12 sites based on the twenty most abundant species caught in the 102 mm mesh nets. Shading delineates groups at a similarity of 65%; (b) MDS ordination (stress = 0.08) of 12 sites based on twenty most abundant species. Boundaries and shaded areas identified by cluster; Bubble plots of average abundance per site for (c) Leiognathus equulus, (d) Scomberoides tala and (e) Megalops cyprinoides. Three symbol codes for sites are: N = North, M = Middle, S = South, O = Open, C = Closed, D = Downstream, U = Upstream. ...........................................................................................................................................................71
Figure 31: Catches (± 1 SE) in the 51 mm mesh nets showed no significant differences between closed and open sites. Significant two way interaction (Region x Fishing) are shown in the catches of Arius spp. and Eleutheronema tetradactylum. Letters indicate significant differences for LSD = 0.05. ....................................................................................................................................................................74
Figure 32: Catches (± 1 SE) in the 51 mm mesh nets showed no significant differences between closed and open sites. Temporal variations were significant for total abundance and abundance of Thryssa hamiltoni, Valamugil cunnesius, Liz subviridis and Arius spp. Triangles = Open, Circles = Closed. .............................................................................................................................................................................74
Figure 33: (a) Dendrogram showing group average clustering of 12 sites based on the twenty most abundant species caught in the 51mm mesh nets. Shading delineates groups at a similarity of 53%; (b) MDS ordination (stress = 0.11) of 12 sites based on twenty most abundant species. Boundaries and shaded areas indentify by cluster. Bubble plots are MDS ordinations overlaid with the average abundance per site for (c) Liza subviridis, (d) Thryssa hamiltoni and (e) blue threadfin. Three symbol codes for sites are: N = North, M = Middle, S = South, O = Open, C = Closed, D = Downstream, U = Upstream. ..........................................................................................................................75
Figure 34: Catches of the most abundant species caught in the multipanel (19/25/32 mm mesh) nets. Temporal variation generated inconsistencies in fishing effects among the regions. Triangles = Open, Circles = Closed....................................................................................................................................76
Figure 35: (a) Dendrogram showing group average clustering of 12 sites based on the twenty most abundant species caught in the multipanel nets. Shading delineates groups at a similarity of 58%; (b) MDS ordination (stress = 0.07) of 12 sites based on twenty most abundant species. Boundaries and shaded areas indentify by cluster. Bubble plots are MDS ordinations overlaid with the average abundance per site for (c) Liza subviridis, (d) Herklotsichthys castelnaui and (e) Thryssa hamiltoni. Three symbol codes for sites are: N = North, M = Middle, S = South, O = Open, C = Closed, D = Downstream, U = Upstream...........................................................................................................................79

vii
Tables
Table 1: Summary of southern voluntary logbook returns by targeted species from April 1998 to July 2000. ...................................................................................................................................................................12
Table 2: Sea mullet fishery: species composition and discarding rates from 818 net shots reported in the voluntary logbook program, and from 79 net shots in the observer program on the sub-tropical east coast of Queensland. TL = total length, CW = carapace width, NR = Non-regulated, P = Protected species ................................................................................................................................................................15
Table 3: Whiting fishery: species composition and discarding rates from 471 net shots reported in the voluntary logbook program, and from 31 net shots in the observer program on the sub-tropical east coast of Queensland. TL = Total Length, CW = Carapace Width, NR = Not Regulated, P = Protected. ...........................................................................................................................................................20
Table 4: Small mackerel fishery: species composition and discarding rates from 166 net shots reported in the voluntary logbook program, and from 19 net shots in the observer program on the sub-tropical east coast of Queensland. TL = Total Length, CW = Carapace Width, CL = Carapace Length, NR = Not Regulated, P = Protected.........................................................................................................................25
Table 5: East coast barramundi fishery: species composition and discarding rates from 95 net shots reported in the voluntary logbook program, and from 127 net shots in the observer program on the tropical north-east coast of Queensland. TL = Total Length, CW = Carapace Width, CL = Carapace Length, NR = Not Regulated, P = Protected...............................................................................................27
Table 6: East coast “mixed estuary” fishery : species composition and discarding rates from 2 net shots reported in the voluntary logbook prgram, and from 23 net shots in the observer program on the tropical north-east coast of Queensland. TL = Total Length, CW = Carapace Width, CL = Carapace Length, NR = Not Regulated, P = Protected................................................................................................29
Table 7: Summary of mesh categories, target species and number of net shots observed in the tropical east coast fisheries. The number of bycatch species observed, their percentage contribution to the total catch and the correlation coefficients of bycatch catch rates to market catch rates are listed. ...........30
Table 8: Decreasing order of dominance the ten most abundant bycatch species within the East Coast barramundi and “mixed” fisheries.................................................................................................................31
Table 9: Gulf of Carpentaria barramundi fishery: species composition and discarding rates from 259 net shots reported in the voluntary logbook program, and from 254 net shots in the observer program in the tropical Gulf of Carpentaria, Queensland. TL = Total Length, CW = Carapace Width, CL = Carapace Length, NR = Not Regulated, P = Protected..............................................................................34
Table 10: Gulf of Carpentaria mixed estuary fishery: species composition and discarding rates from 30 net shots in the observer program in the Gulf of Carpentaria, Queensland. TL = Total Length, CW = Carapace Width, CL = Carapace Length, NR = Not Regulated, P = Protected.....................................35
Table 11: Summary of the locations, dates, target species and number of replicate net shot samples collected by the Gulf of Carpentaria observer program. The number of bycatch species, their contribution to the total catch and correlation coefficients (CC) of bycatch catch rates to market catch rates are given.........................................................................................................................................36
Table 12: The ten most abundant bycatch species observed at each location in decreasing order of abundance for dominance plots of Gulf of Carpentaria barramundi and mixed estuary fisheries. ....37
Table 13: Regulated species observed caught in the tropical inshore net fisheries showing size limits, % of each species discarded due to non-conformance to these limits, the total number of fish captured and the % of discarded fish that were alive when returned to the water. ................................................44
Table 14: Summary of site evaluations for riverine estuaries selected for use in the fishery-independent sampling program.............................................................................................................................................47
Table 15: Specifications of the gill nets used in the fishery-independent study. (Note the 19, 25 and 32 mm mesh panels were hung end to end to make one continuous multipanel net of 38.1 m long). ....48
Table 16: Dates and site sampling sequences of the 13 fishery-independent sampling trips. After the second trip, a rest day was incorporated into the sampling program (dates shown shaded). Abbreviations are: Sth, southern rivers; Mid, middle rivers; Nth, northern rivers; O, open to commercial net fishing; C, closed to commercial net fishing; Q, quarter moon; NEW, new moon..48
Table 17: Comparison of species numbers, abundance and biomass for the six estuarine river systems sampled in the fishery-independent study....................................................................................................53
Table 18: Summary of environmental conditions for each of the river systems in the fishery-independent study as measured using a Datasonde3 datalogger. The number of samples varied due to the deployment of only one hydrolab on some of the trips..............................................................................54
Table 19: Total catch for 152 mm nets for all 13 sampling periods during the fishery independent study. .............................................................................................................................................................................57

viii
Table 20: Summary of split plot analysis of variance for catch in the 152 mm mesh nets with Fishing (F), Position (P) and Region (R) as main effects, and Tripno (T) as repeated effect. Interactions abbreviated as F*P etc. Significance of effects designated as *** for P < 0.001; ** for P < 0.01; * for P < 0.05. .......................................................................................................................................................62
Table 21: Comparisons of groups identified by cluster analysis by the top three discriminating species based on SIMPER analyis of species data. ..................................................................................................63
Table 22: Catch composition for 102 mm mesh nets from all sites on all sampling trips during the fishery independent sampling......................................................................................................................................66
Table 23: Summary of split plot analysis of variance for catch in 102 mm mesh nets with Fishing (F), Position (P) and Region (R) as main effects, and Trip no (T) as repeated effect. Interactions abbreviated as F*P etc. Significance of effects designated as : *** for P < 0.001; ** for P < 0.01; * for P < 0.05.....................................................................................................................................................67
Table 24: Total catch from the 51 mm mesh nets from all sites on all sampling trips during the fishery-independent sampling......................................................................................................................................72
Table 25: Summary of split plot analysis of variance for catch in 51 mm mesh nets with Fishing (F), Position (P) and Region (R) as main effects, and Tripno (T) as repeated effect. Interactions abbreviated as F*P etc. Significance of effects designated as : *** for P < 0.001; ** for P < 0.01; * for P < 0.05.....................................................................................................................................................73
Table 26: Total catch in multipanel (19/25/32 mm mesh) nets for all catch within the fishery-independent survey.................................................................................................................................................................77
Table 27: Summary of split plot analysis of variance for catch in Multipanel (19/25/32 mm mesh) nets with Fishing (F), Position (P) and Region (R) as main effects, and Tripno (T) as repeated effect. Interactions abbreviated as F*P etc. Significance of effects designated as : *** for P < 0.001; ** for P < 0.01; * for P < 0.05. ...........................................................................................................................78
Table 28: Details of tagged sportfish recaptured in the research gill nets. Source of tags and details: Bill Sawynok, Sportfish Tagging Coordinator, Australian National Sportfishing Association Queensland........................................................................................................................................................85
Appendices
Appendix 1: Total catch by species for rivers closed to commercial net fishing, versus open rivers (all nets combined). .................................................................................................................................................94

1 Non-technical summary
1. Non-technical summary
97/206 The effects of net fishing: addressing biodiversity and bycatch issues in Queensland inshore waters.
PRINCIPAL INVESTIGATOR: Mr Ian Halliday ADDRESS: Queensland Department of Primary Industries
Agency for Food and Fibre Sciences Fisheries and Aquaculture Southern Fisheries Centre PO Box 76 Deception Bay Qld. 4508 Telephone 07 38179530 Fax 07 38179555
PRINCIPAL CO-INVESTIGATOR Dr Janet Ley * ADDRESS: Australian Institute of Marine Science
PMB No 3 Townsville Qld 4810
*CURRENT ADDRESS Australian Maritime College Faculty of Fish and Environment PO Box 21 Beaconsfield TAS 7270
OBJECTIVES
1. To establish proportions of target catch and bycatch caught in inshore net fisheries along the Queensland east-coast and the Gulf of Carpentaria.
2. To characterise the bycatch component of net fisheries in terms of species composition, seasonal abundance, habitat type and mesh size.
3. To determine the fate of fish discarded from net catches. 4. To establish the effects of net fishing on biodiversity through intensive comparative
studies of areas closed and open to commercial net fishing 5. To provide management advice on possible sustainability and biodiversity indicators
and on changes in netting practices needed to reduce impacts on bycatch species and biodiversity.
NON TECHNICAL SUMMARY
Outcomes Achieved Inshore gill netting was shown to have low bycatch rates with high proportions of the fish caught being marketed. This has allowed a greater understanding of the inshore commercial net fisheries of Queensland and their impacts on a range of fish communities. This information should allow fisheries managers to more confidently assess the impacts of commercial gill netting when considering the sustainability of these fisheries.
Four methods of gathering information on the effects of net fishing were employed to determine the possible impacts of net fishing in estuarine systems. These were:

2 Non-technical summary
1. a voluntary logbook filled in by commercial fishers recording bycatch and retained marketed catch;
2. an observer program that was used to extend and validate returns from the voluntary logbooks;
3. fate trials for determining short term mortality of discarded net-caught fish; and 4. a fishery independent study looking for detectable differences between fish
communities in rivers that are open to commercial net fishing and those in rivers that are closed to commercial net fishing.
Seven of Queensland’s inshore net fisheries were examined. These included the southern sea mullet, whiting and small mackerel fisheries, the northern east-coast barramundi and mixed estuarine fisheries, and the Gulf of Carpentaria barramundi and mixed estuarine fisheries. Logbook and observer data were in close agreement indicating that the catch information returned by fishers participating in the voluntary logbook program was reliable.Bycatch was low in these net fisheries relative to other commercial fisheries. Bycatch, as a percentage of the total number of fish caught, was < 20 % for the fisheries examined except the whiting fishery where it was 28% of the total catch. Bycatch consisted of a multitude of species with abundances generally dominated by two or three bycatch species. Catches of undersized regulated fish were low with < 6 % of the total catch in all fisheries being individuals smaller than the legal length.
Fate trials were conducted on four species of fish commonly caught and discarded from southern whiting net fisheries. These included undersized yellowfin bream Acanthopagrus australis (< 230 mm TL), summer whiting Sillago ciliata (< 230 mm TL), dusky flathead Platycephalus fuscus (< 300 mm TL) and the silverbiddy, Gerres oyeana. These fish were caught in commercial whiting net operations and placed in cages for a period of three days. No bream died (n=48) during this experiment. Summer whiting (n = 178, mortalities = 12% ± 5%) and flathead (n = 58, 19% ± 10%) showed higher mortalities with silverbiddies having the highest mortality rates (n = 197, 67% ± 4%) after three days. Observations on the release condition of fish from within the tropical net fisheries indicates that some fish species have high mortalities before discarding while others are much more hardy to net capture.
Fishery independent sampling was carried out on the tropical Queensland east coast between Bowen and Cairns in three pairs of rivers. Each pair consisted of a river open to commercial gill netting and a similar system closed to commercial netting. Data were collected from two sites within each river (upstream and downstream) every second month from March 1998 to March 2000. Univariate analysis of the fishery independent data indicated that there were a small number of significant effects of net fishing on species that are commonly harvested. Catch rates of barramundi Lates calcarifer, queenfish Scomberoides commersonianus, estuary whalers Carcharhinus leucas and blue threadfin Eleuthronema tetradactylum, in 152 mm mesh nets indicated significantly decreased abundances in rivers open to net fishing. However, these patterns were confounded by the regional and seasonal factors considered in the analysis. Conversely, no detectable differences between open and closed rivers could be found for fish species caught in 51 mm mesh size and multipanel (19, 25 and 32 mm) mesh size nets. Seasonal factors had the greatest influence on the numbers of small fish caught.

3 Non-technical summary
Multivariate analysis showed no detectable differences between rivers open and closed to commercial fishing in the overall community structure. This was consistent for the following data sets: 102 mm mesh net catch data , 51 mm mesh net catch data and the multi-panel net catch data. There were significant regional effects on the species of fish likely to be caught. The 152 mm mesh net catch data showed significant differences between the community structures of the rivers open and those closed to commercial netting and among regions. The significant fishing effect with this mesh was expected because 152 mm is the minimum mesh size allowed for use by the commercial net fishery in Queensland’s east coast rivers and was confined to differences in the abundances of targeted species in this fishery (ie barramundi, blue threadfin and queenfish).
Gill nets are highly selective in their ability to capture targeted species. Damage to physical environments is minimal as nets are either fished actively, being hauled across the substratum by hand, or set via anchors to passively fish a fixed position on the sea floor. Marketable catch from within these gill netting operations is high with low discard rates. The discarded component of the catch consists of a large number of species, many of which are discarded alive. These highly selective fisheries were not found to be affecting fish species that were not within the catching range of the nets allowed. Generally, the smaller the mesh size of the gill nets used in a fishery the greater the number of fish that were caught. As not all fish are marketed, particularly small ones, the bycatch component of the catch increased with decreasing mesh size.
KEYWORDS: gill netting, biodiversity, Queensland, fishery, fate, bycatch, estuaries.

4 Background
2. Background
The resource managers of Australian net fisheries, conservation managers and fisheries biologists have identified a critical need for objective scientific information on the quantity and types of bycatch caught in net fishing operations and its effect on biodiversity in inshore waters. If data were available on the total catch of net fisheries, decisions on fisheries management would be greatly improved. Information on net fisheries bycatch and impacts on biodiversity would be widely applicable in Australia, delivering comprehensive and unbiased inputs into the on-going debate about the effects of inshore net fishing. This project provides essential baseline data for management decisions concerning inshore net fisheries and associated ecosystems along the Queensland east and Gulf of Carpentaria coasts.
Most fish species caught by commercial, recreational and indigenous fishers in Australia are dependent upon an estuarine habitat during part or all of their life cycle (Pollard 1976, Dredge et al. 1977, Quinn 1992). Estuarine fishing typically occurs in areas tha t contain diverse fish faunas and, sometimes, a range of icon species, such as barramundi, dugong and marine reptiles.
Fishing gear is size-selective for target species in some but not all fisheries, especially in multi-species fisheries. Target species, mesh size and fishing area all play an important role in determining the amount of bycatch caught in commercial fisheries (Alverson et al. 1994, Gray et al. 2000). Bycatch refers to individuals caught that are of no immediate value to the fisher and are returned to the water. Bycatch may include the juveniles of marketable fish as well as non-marketable fish, invertebrates, marine reptiles and marine mammals. High profile species such as sea turtles, dugong, dolphins and crocodiles are occasionally caught in net fishing operations and must be released as they are protected species.
The inshore commercial net fisheries of the Queensland east coast and Gulf of Carpentaria have an estimated wharf side value of $30 million per year (Queensland Fisheries Management Authority, QFMA 1995) with 1029 licences being held (Williams 1997). The principal species taken in these net fisheries are sea mullet (Mugil cephalus), whiting (Sillago spp.), tailor (Pomatomus saltatrix ), bream (Acanthopagrus australis) and flathead (Platycephalidae) in southern Queensland and barramundi (Lates calcarifer), king threadfin (Polydactylus macrochir) and blue threadfin (Eleutheronema tetradactylum) in northern Queensland. The fresh fish produced from these fisheries is used almost exclusively in domestic markets with mullet roe being the only significant export. The Queensland Fisheries Service, Resource Management Division (formally Queensland Fisheries Management Authority, QFMA) collects logbook information on the part of the catch that is marketed. This compulsory logbook system has no provision for collecting data on bycatch.
The effects of net fishing in Queensland inshore waters and the problems of bycatch and resource allocation are highly contentious issues that are becoming more prominent in debates among concerned sectors of society. In the absence of this information, much of the debate relates to the need for imposition of precautionary management measures to sustain the integrity of the resource. The precautionary principles being advocated usually demand a curtailment of commercial activities and diminished access to fishing grounds.

5 Background
An assessment of the likely impacts that net fishing operations have on the biodiversity of inshore marine ecosystems has been attempted in this project. This has been done by characterising commercial net catches in terms of species composition, seasonal and relative abundance, habitat, life cycle stages present, the fate of discarded bycatch, and comparisons of areas open and closed to commercial net fishing using fishery independent techniques.
This project commenced in September 1997. Co- incidentally, in response to reported declines of the Queensland east-coast dugong (Dugong dugong) population, a series of Dugong Protection Areas were instigated along the east coast during 1997. An unfortunate consequence of this process was the alienation of commercial fishers from management agencies and government collectively. This alienation flowed on to research initiatives, with many inshore commercial net fishers being unwilling to participate in voluntary data-gathering programs. We were successful, in part, in overcoming this impediment by making use of existing networks and research partnerships.

6 Need
3. Need
There is a critical need for information to guide management decisions about inshore fisheries resources, and to address rising industry, conservation and public concern about the impact of net fishing on the sustainability and biodiversity of ecosystems and habitats associated with the fishery.
Information on the effect of gill net fishing on bycatch and biodiversity in Australia is extremely limited. While some data exist on the marketed catch from gill nets, the quantity and nature of bycatch remains virtually unknown. There is little information on the total catch characteristics of net fisheries, the proportions of species caught, and the proportion of the resource harvested each year. Similarly, little is known about the fate of fish discarded from nets, information that would help to characterise the impact of net fishing on biodiversity.
This project addresses the urgent need for information on: the total catch composition from net fishing, fate of discarded fish bycatch, impact on protected species and impact on biodiversity. Baseline data collected through both fishery-dependent and independent methods can provide a basis for long term monitoring of the fishery and will enhance the interpretation of existing commercial catch records. These data also help meet the requirements of the ‘National Strategy for Conservation of Australia’s Biological Biodiversity’ of: a) improving the knowledge base of fisheries, b) improving fisheries management and c) assessing and minimising the impact of commercial fishery practices on non-target
and bycatch species, ecosystems and genetic diversity.

7 Objectives
4. Objectives
1. To establish proportions of target catch and bycatch caught in inshore net fisheries along the Queensland east-coast and the Gulf of Carpentaria.
2. To characterise the bycatch component of net fisheries in terms of species composition, seasonal abundance, habitat type and mesh size.
3. To determine the fate of fish discarded from net catches.
4. To establish the effects of net fishing on biodiversity through intensive comparative studies of areas closed and open to commercial net fishing
5. To provide management advice on possible sustainability and biodiversity indicators and on changes in netting practices needed to reduce impacts on bycatch species and biodiversity.

8 Observer and Logbook Program
5. Achievement of objectives
Establish proportions of target catch and bycatch caught in inshore net fisheries along the Queensland east coast and the Gulf of Carpentaria.
Information on the proportions of target catch and bycatch were collected for seven inshore net fisheries operating in Queensland waters. The proportion of the total catch, in numbers of fish, represented by the “target” species fluctuated widely between the fisheries (sub-tropical sea mullet 84%, whiting 35%, mackerel 68%, and tropical East Coast (EC) barramundi 39%, EC mixed estuary 64%, Gulf of Carpentaria (GoC) barramundi 36%, GoC threadfin 74%,). The “mixed species” nature of all these fisheries is evident from the high proportion of the catch that is marketed. Recorded levels of bycatch for the sub-tropical gill net fisheries targeting sea mullet (7%), whiting (28%) and mackerel (15%) together with the tropical fisheries targeting EC barramundi (16%), EC mixed estuary (15%), GoC barramundi (13%) and GoC threadfin (13%) were generally low.
Characterise the bycatch component of net fisheries in terms of their species composition, seasonal abundance, habitat type and mesh size.
In subtropical gill net catches, bycatch rates were variable with increased bycatch rates in smaller mesh nets. Generally, two or three species dominated the bycatch. Catch rates of most market and bycatch species increased during winter in the sea mullet and whiting fisheries. The small mackerel fishery is seasonal in operation. The composition of bycatch in the GoC fisheries displayed variability between locations but was largely dominated by catfish (Arius spp.) and bony bream (Nematolosa erebi). Samples collected throughout the fishing year indicated bycatch rates may fluctuate considerably on the temporal scale. Bycatch composition of the EC fisheries also displayed considerable variability, with mesh size an important factor in determining catch rates of bycatch fish.
Establish the effects of net fishing on biodiversity through intensive comparative studies of areas closed and open to commercial net fishing.
Fishery- independent sampling of rivers open and closed to net fishing was unable to detect any changes in fish biodiversity between open and closed rivers. The study found that net fishing did significantly reduce the abundance of species most commonly targeted for market in these areas (ie. barramundi, blue threadfin and queenfish), however no detectable differences were found due to net fishing on other species. No differences were found to indicate that net fishing had an effect on small fish within these systems. Regional and seasonal differences were evident for many of the marketed species within these systems.
Provide management advice on possible sustainability and biodiversity indicators and on changes in netting practices needed to reduce impacts on bycatch species and biodiversity.
Our study found that net fishing did not impact on fish biodiversity. Providing management advice to reduce the impact of net fishing on bycatch is difficult, because

9 Observer and Logbook Program
we found the catches of fish other than targeted marketable species were low. Few nonmarketable species are caught in large enough numbers to be able to direct a change in practice to eliminate them from the catch. Recommendations on the effect of increases in size limits, particularly for southern estua rine species, are discussed in terms of the need to increase the minimum mesh size in some fisheries to allow undersized regulated fish species to pass through the meshes without causing high mortalities of these fish.

10 Observer and Logbook Program
6. Catch Characteristics of Queensland Inshore Net Fisheries
6.1 Introduction
Two methods of gathering information on the catch composition of inshore gill nets were used. These were: 1. a voluntary logbook filled in by commercial fishers and which recorded retained
marketed catch and bycatch; and 2. an observer program that was used to extend and validate logbook returns.
Bycatch was defined to be animals caught by nets that were not retained for legal sale or use for some other economic benefit (eg. as bait fo r crab potting). This included individuals of marketable species above or below the regulated size limits, nonmarketable fish species, and protected species. In each of the programs listed above, net caught specimens were assigned to one of two catch categories • Retained – any animal retained for sale or for later use as bait (mainly crab pot bait) • Discarded – any animal released because it was protected under legislation (such as
female mud and blue swimmer crabs, grey nurse sharks), was regulated by a minimum or maximum size limit, or was of no marketable value to the fisher.
6.2 Methods for determining catch composition of Queensland inshore fisheries.
6.2.1 Logbook program
Compulsory logbook catch data completed by fishers and returned to the Queensland Fisheries Service, Resource Management Division (formerly Queensland Fisheries Management Authority, QFMA) contain figures for the retained and sold components of the catch only. To determine the quantities and species composition of the non-reported portion of the commercial net catch, standard data sheets were distributed to interested fishers who were asked to complete one entry (one day or night of fishing) per week. The data sheets included the following fields: date, location fished, target species identification, length and mesh size of net(s) fished, the number and/or weight of each species captured and associated fate (kept or released), and the details of any incidental capture of protected species and their condition on release. Fishers were asked to send completed log sheets to the Principal Investigator at Southern Fisheries Centre once per month in return post envelopes that were provided. A reward of a $5 scratch lotto ticket was provided for each monthly return.
The logbook program was focused on areas where project staff were based (Brisbane and Townsville) and targeted seven fisheries: the subtropical mullet, whiting and small mackerel fisheries, the tropical east coast barramundi and “mixed estuary” fisheries, and the Gulf of Carpentaria barramundi and “threadfin” fisheries.
As the logbook program was reliant on the voluntary participation of commercial fishers, structuring the data collection program on the basis of season, location and gears was not possible. All data were obtained opportunistically and were relatively unstructured.

11 Observer and Logbook Program
6.2.2 Observer Program
The primary objective of the observer program was to validate the logbook returns with commercial fishers participating in the logbook program and to characterise the catch and bycatch components in detail. Again, because this part of the project was reliant on fishers agreeing to provide access to on-board observations of their fishing methods and catches the sampling regime was opportunistic and unstructured.
For each fishing event observed, all animals captured were identified to species level with numbers and/or weights together with the fate of each individual recorded. Other variables recorded by the observers on site included fishing location, target species identification, fishing practice (set netting, ring netting etc) and gear used (mesh size, net length and soak time). Observers also monitored and recorded the incidental capture of protected species on the fishing grounds.
6.2.3 Data Analysis
Individual species catch rates from the logbook program were used for the analysis of seasonality within the southern sea mullet and whiting fisheries on a per net shot basis. All data were ln(x + c), ( where x = catch rate/metre of net, c = lowest non-zero catch rate/2) transformed to allow for the extremely low catch rates for many of the species. Analysis of variance with unbalanced treatment structures (Genstat 5) was used to analyse catch rates from within these fisheries. Bias corrected back transformations were performed using e(x+residual ms/2)-c x net length used in the fishery to give an average catch/net shot for each species (x = ln transformed mean number of fish/metre of net; c = lowest non-zero catch rate/2).
For analyses of tropical fisheries, observer data was adjusted for fishing procedure (ie. soak time and net length) and used to indicate the susceptibility of particular species to different types of fishing gear in different areas, and to determine which fishing gears and/or methods may need to be considered for modification.
The results from the logbook and observer programs were used to identify candidate species and fish sizes for fate trials (see Section 7).
6.3 Results of Observer and Logbook Programs
6.3.1 Southern Logbook Returns
Logbook information was reported by 9 fishers who returned data for periods of between 1 and 28 months from April 1998 to July 2000. A total of 1 648 net shots targeted at ten species of fish were reported (Table 1). At least 103 species of animal including fish, reptiles, birds, crustaceans and cephalopods were reported as being caught. A total of 369 362 individual animals were reported caught, of which 314 236 (85.1%) were kept for marketing or bait and 55 076 (14.9%) were discarded as bycatch. Targeting of sea mullet, sand whiting and small mackerels constituted 88% of the fishing effort reported, and the features of these fishery catches are examined in more detail in the following sections.

12 Observer and Logbook Program
Table 1: Summary of southern voluntary logbook returns by targeted species from April 1998 to July 2000.
Species Common name Number of net shots
Mugil cephalus sea mullet 818 Sillago ciliata sand whiting 471
Scomberomorus sp. mackerel 166 Carcharinidae shark 69 Pomadasys sp. grunter bream 50
Acanthopagrus australis yellowfin bream 32 Hemiramphidae gar 30
Pomatomus saltatrix tailor 5 Siganus sp. rabbitfish 5
Platycephalus fuscus dusky flathead 2
6.3.2 Sea Mullet Fishery in Southern Queensland
The Fishery
The sea mullet (Mugil cephalus) gill net fishery in Queensland has about 400 fishers actively catching this species each year (Williams 1997). The majority of the catch is taken in southern Queensland (from Bundaberg to the NSW border) with about 10% of the annual catch caught in waters as far north as Townsville. Monthly production is about 80 t of fresh fish that is sold in local seafood markets. During the autumn and early winter, sea mullet are also sought for their roe as this brings a higher price to fishers (up to $6/kg for roe fish compared with $1 -$2/kg for the fresh fish market). To target fish for the roe market, fishers increase the mesh size of their nets from 75 mm to 87 mm or 102 mm, as the valuable female fish are generally larger than male fish (Virgona et al. 1998). Fishers employ active fishing techniques that involve sighting schools of mullet in shallow water. Once the schools are sighted, fishers set their net around the school and almost immediately begin to hand haul the net back into the boat. Numerous spatial and temporal closures exist in this fishery (Queensland Fisheries Act 1995) with input restrictions on the length of net used, limited mesh sizes and output restrictions in the form of minimum legal sizes on many of the species caught (Table 2).
6.3.2.1 Logbook Program in the Sea Mullet Fishery
Total Catch Composition
Voluntary logbook data was returned by 7 fishers targeting sea mullet with catches from 818 net shots recorded. At least 68 species were reported, including 5 species of crab, at least 58 species of fish, at least 2 species of reptile, 1 species of bird and 2 species of cephalopod (Table 2). Twenty-two species comprising 93.1% of the total catch were retained for market or bait to be used in other fishing operations. A bycatch rate of 6.9% was reported. The target species, sea mullet Mugil cephalus, dominated the catches representing 84% of the total catch. Other marketable species contributed a further 8.4% with sand whiting Sillago ciliata (2.2%), yellowfin bream Acanthopagrus australis (1.8%), dusky flathead Platycephalus fuscus (1.3%) and tailor Pomatomus saltatrix (1.0%) being the only species that contributed more than 1% of the total catch (Figure 1a).
Reported discards from the sea mullet fishery catch were dominated by undersized yellowfin bream (< 23cm total length,TL) representing 2.0% of the total catch, and

Sea M
ullet
Yellowfin
Bream
Tailor
Dusky F
lathead
Flat ta
il Mulle
t
Other M
arket
Yellow fin
Bream
Mud Cra
b
Other R
egulate
d Disca
rd
Yellow fin
Bream
Mud Cra
b
Blue sw
immer C
rab
Sea M
ullet
Tarw
hine
Summer W
hiting
Other Re
gulated
Shoveln
osed R
ay Catfish
Discard
Sea M
ullet
Summer W
hiting
Yellowfin
Bream
Dusky F
lathead
Tailor
Other M
arket
Yellow fin
Bream
Mud Crab
Other Regu
lated
Discard
Yellow fin
Bream
Mud Crab
Blue sw
immer C
rab
Sea M
ullet
Other R
egulate
d Catf
ish
Stingra
y
Shoveln
osed R
ay
Silverb
iddy
Discard
0
5
80
85
90
Perc
enta
ge o
f To
tal C
atch
0
5
10
15
20
25
30
35
Perc
enta
ge o
f B
ycat
ch
a. b. Marketed Catch
Discarded Bycatch
Regulated Bycatch
Unregulated Bycatch
0
5
80
85
90
Perc
enta
ge o
f To
tal C
atch
0
5
10
15
20
25
30
35
Per
cent
age
of B
ycat
ch
c. d. Marketed Catch
Discarded Bycatch
Regulated Bycatch
Unregulated Bycatch
13 Observer and Logbook Program
undersized (< 150 mm carapace width, CW) or female mud crabs Scylla serrata (1.2%). Twenty species of regulated fish were discarded comprising 1.5% of the total catch (Table 2). The remaining 2.3% of the catch was made up of 31 species of fish some of which were occasionally marketed. A total of 152 marine turtles were reported in the vicinity of commercial fishers while carrying out their fishing activities. All turtles were reported to have been released alive with a number reported to have been feeding on fish caught in the net during the fishing operation. Three sea snakes, Hydrophis sp. (condition at release unknown) and 2 shags, Phalacrocorax sp. (released alive) were also reported.
Regulated Species Reported as Bycatch from Sea Mullet Logbook Program
Undersized yellowfin bream (28.6% of bycatch component in Figure 1d) were the most abundant species within the bycatch component. The discarding rate of this species was relatively high with 53% of all yellowfin bream caught being less than the legal size of 230 mm TL (Table 2). Mud crabs (17.3% of bycatch component) and blue swimmer crabs Portunus pelagicus (8.4% of bycatch component) were discarded at a high rate (Table 2). Ninety-eight percent of the total number of mud and blue swimmer crabs caught were discarded because they were either males less than minimum legal size or were female. Undersize sea mullet (< 30 cm TL), at 7.7% of the bycatch, was the only other regulated species that contributed more than 1% to the total bycatch. Undersized dusky flathead (1.0%), sand whiting (0.7%), and tailor (0.3%) were discarded at low rates (Figure 1b).
Figure 1: Sea mullet fishery catch compositions for (a) voluntary logbook catch, (b) bycatch composition from logbook returns, (c) observed catch and (d) bycatch compositon from observer data. Note
differences and breaks in scales.
Unregulated Species Reported as Bycatch from Sea Mullet Logbook Program
Catfish, Arius spp, although not marketed for food, were occasionally kept for crab pot bait, and were discarded at a rate of 8.4% of the total bycatch (Figure 1d). All other species that were not marketed individually comprised less than 1% of the total catch.

14 Observer and Logbook Program
After catfish, dasyatidid stingrays (5% of bycatch component) and shovel-nosed rays Rhinobatus batillum (4.1% of bycatch component) were the most abundant bycatch in sea mullet net catches. The remaining 12.3% of the bycatch comprised 25 species of fish and 3 crab species. Of these, 18 individual species were represented by less than 1% of the total bycatch (Figure 1b).
6.3.2.2 Observer Program in the Sea Mullet Fishery
Total Catch Composition
The fishing activities of 5 commercial fishers were observed in the program resulting in detailed catch records from 79 net shots. A total of 15 146 individual animals from at least 48 species were observed. They included 43 fish species, 1 cephalopod, three crab species and marine turtles (Table 2). Twenty-eight species comprising 94.4% of the total catch were retained for market. Sea mullet dominated, comprising 86.9% of the total catch. Other species that contributed to the marketable catch were yellowfin bream (2.2%), tailor (1.8%), dusky flathead (1.1%) and flat tailed mullet Liza subviridis (0.9%). The remaining 23 marketed species comprised 1.6% of the total catch, all of which individually represented < 0.5% of the total catch (Figure 1c). Discarded bycatch was low, representing 5.6% of the total catch. Fourteen species of regulated bycatch were discarded with undersized yellowfin bream (1.7%) and undersized male (< 150 mm carapace width) and female mud crabs (0.9%) dominant. The remaining 12 species contributed a further 2% of the total catch. Discarded fish of no economic value comprised 0.9% of the total catch. A total of 18 marine turtles were observed to be encircled by nets. All were released alive. Marine turtles caught in these actively fished nets were usually not entangled in the meshes but were encircled by the net and could not swim away from the area. This brief entrapment appears to have little adverse effect on the turtles which freely feed on fish caught in the net while they are encircled (Ian Halliday, personal observation).
Regulated Species Observed in Sea Mullet Bycatch
Undersized yellowfin bream (representing 31.3% of the observed bycatch, Figure 1b) were the most numerous species within the bycatch component. The discarding rate of this species was relatively high with 44% of all bream caught (n = 596) being undersized. Mud crabs (16.4% of the bycatch component) and blue swimmer crabs (13.5% of the bycatch component) were discarded at a high rate (97%) because individuals were either males less than the minimum legal size (< 150 mm carapace width) or were female. Sea mullet (5.9%), tarwhine Rhabdosargus sarba (4.6%), and sand whiting Sillago ciliata (3.1%) were the other main species contributing to the bycatch of regulated fish species (Figure 1d). The 7.8% attributed to other regulated bycatch comprised 11 species of fish all of which were represented by < 20 individuals each.
Unregulated Species Observed in Sea Mullet Bycatch
Shovelnosed rays Rhinobatus batillum (5.9% of bycatch component) and catfish Arius spp. (3.9% of bycatch component) were the most commonly caught unregulated species; the majority of individuals were released alive. The remaining 7.6% of the bycatch was comprised of 19 species of fish. Fifteen of these species each represented less than 1% of the discarded bycatch.

15 Observer and Logbook Program
Table 2: Sea mullet fishery: species composition and discarding rates from 818 net shots reported in the voluntary logbook program, and from 79 net shots in the observer program on the sub-tropical east coast
of Queensland. TL = total length, CW = carapace width, NR = Non-regulated, P = Protected species
COMMON NAME SPECIES NAME SIZE LIMIT LOGBOOK DATA (818 NET SHOTS) OBSERVER DATA (79 NET SHOTS )
(cm) RETAINED DISCARD % DISCARD RETAINED DISCARD % DISCARD
Sea Mullet Mugil cephalus > 30 TL 135352 851 0.6 13144 50 0.4 Sand Whiting Sillago ciliata > 23 TL 3477 77 2.2 60 26 30.2 Yellowfin Bream Acanthopagrus australis > 23 TL 2835 3177 52.8 332 264 44.3 Dusky Flathead Platycephalus fuscus > 30 TL 2141 106 4.7 160 12 7.0 Tailor Pomatomus saltatrix >30 TL 1593 35 2.2 272 13 4.6 Flat tailed Mullet Liza subviridis NR 1340 0 137 0 0 Dart Trachinotus russelli NR 965 17 1.7 0 1 100 Catfish Arius spp. NR 573 937 62.1 0 33 100 Bony Bream Nematolosa come NR 434 170 28.2 0 0 Striped Scat Selenotoca multifasciata NR 326 193 37.2 14 6 30.0 Trevally Carangidae NR 141 22 13.5 0 3 100 Grunter Pomadasys sp. >35 TL 123 66 35.0 44 4 8.3 Longtom Tylosurus sp. NR 175 78 30.8 0 3 100 Drummer Kyphosus sp. NR 86 0 0 0 0 King Threadfin Polydactylus macrochir > 40 TL 46 1 2.1 0 0 Mud Crab Scylla serrata > 15 CW 44 1916 97.8 5 138 96.5 Ludderick Girella tricuspidata > 23 TL 37 1 2.6 2 0 0 Squid Sepioteuthis sp. NR 37 1 2.7 3 0 0 Tiger Mullet Liza argentea NR 37 0 1 0 0 Mangrove Jack Lutjanus argentimaculatus > 35 TL 35 89 71.8 4 14 77.8 Diamond Scale Mullet Liza vaigiensis NR 32 6 15.7 0 1 100 Shark Carcharhinus sp. NR 26 6 18.6 0 0 Giant Herring Elops sp. NR 25 0 0 0 0 Tarwhine Rhabdosargus sarba > 23 TL 21 45 68.3 1 39 97.5 Blue swimmer crab Portunus pelagicus > 15 CW 20 936 97.9 4 114 96.6 Wolf Herring Chirocentrus dorab NR 20 0 0 0 0 Rabbitf ish Siganus sp. NR 19 104 84.6 0 1 100 Jew Sciaenidae > 45 TL 18 34 65.4 1 1 50.0 Blue Threadfin Eleutheronema tetradactylus > 40 TL 18 17 48.6 0 0 Queenfish Scomberoides sp. NR 18 0 0 0 0 Estuary Cod Epinephelis sp. > 35 <120 TL 9 42 82.4 1 13 92.9 Blubberlip Plectorhinchus sp. NR 9 13 59.1 1 3 75.0 Tarpon Megalops cyprinoides NR 7 32 82.1 0 3 100 Shovelnosed Ray Rhinobatus batillum NR 4 456 99.1 4 50 92.6 Bonefish Albula neoguinaica NR 4 58 93.6 0 0 Milkfish Chanos chanos NR 4 0 0 0 0 Black Bream Acanthopagrus berda > 23 TL 2 0 3 0 0 Octopus Octopus NR 2 0 0 0 0 Black Sole Achlyopa nigra NR 1 182 99.5 0 11 100 Moses Perch Lutjanus russelli > 1 40 97.6 0 1 100 Tripletail Lobotes surinamensis NR 1 0 0 0 0 Parrotfish Scaridae NR 1 0 0 0 0 Yellowtail Kingfish Seriola lalandi > 50 TL 1 0 0 0 0 Golden-Lined Whiting Sillago analis > 23 TL 0 0 3 3 50.0 Bar-tailed Flathead Platycephalus endrachtensis > 30 TL 0 0 2 0 0 Tongue sole Pseudorhombus sp. NR 0 0 2 0 0 Trumpter Whiting Sillago maculata NR 0 0 1 1 50.0 Soapy Jew Nibia soldado > 45 TL 0 0 1 1 50.0 Blue-Tailed Mullet Valamugil seheli NR 0 0 1 0 0
Stingray Dasyatididae NR 0 558 100 0 11 100 Silverbiddy Gerres oyeana NR 0 312 100 2 2 50.0 Love Crab Thalamita crenata NR 0 202 100 0 1 Ponyfish Leiognathus sp. NR 0 87 100 0 0 Moon Crab Unidentified NR 0 35 100 0 0 Diamondfish Monodactylus argenteus NR 0 32 100 0 4 100 Bulls eye Priacanthus sp. NR 0 32 100 0 0 Flicker Mullet Mugil georgii NR 0 31 100 80 3 3.6 Moonfish Mene maculata NR 0 27 100 0 0 Barramundi Lates calcarifer > 58 <120TL 0 24 100 0 1 100 Rock Crab Xanthidae NR 0 15 100 0 0 Scad Decapterus sp. NR 0 10 100 0 0 Stonefish Synanceia horrida NR 0 7 100 0 0 Emperor Lethrinus sp. > 40 TL 0 4 100 0 0 Striped Seapike Sphyraena obtusata NR 0 4 100 0 0 Silver Perch Bidyanus bidyanus > 30 TL 0 2 100 0 0 Herring Herklotsichthys sp. NR 0 2 100 0 0 Grey mackerel Scomberomorus semifasciatus > 50 TL 0 1 100 0 2 100 Grass Sweetlip Lethrinus fletus > 30 TL 0 1 100 0 0 Conger Eel Muraenesox cinereus NR 0 1 100 0 0 Angelfish Pomacanthus sp. NR 0 1 100 0 0 Mackerel Scomberomorus sp > 50 TL 0 1 100 0 0 Blue-Spotted Stingray Dasyatis kuhlii NR 0 0 0 6 100 Tripodfish Triacanthidae NR 0 0 0 2 100 Golden Trevally Gnathanodon speciosus NR 0 0 0 1 100 Banded Wobbegong Orectolobus ornatus NR 0 0 0 1 100 Tongue Sole Pseudorhombus arius NR 0 0 0 1 100
Turtle Unidentified P 0 152 100 0 18 100 Shag Phalacrocorax sp. P 0 2 100 0 0 Sea snake Hydrophis sp. P 0 3 100 0 0
Total number of fish 150060 11097 14284 862 Percentage of Total Catch 93.1 6.9 93.3 5.7

16 Observer and Logbook Program
6.3.2.3 Seasonality of catch in Sea Mullet Fishery
Returned logbook data on catches within the sea mullet fishery indicated that there were only 5 species that were caught in sufficiently large numbers to allow statistical analysis for seasonal changes in catch rates to be carried out. Of these, three were size regulated marketable fish (sea mullet, yellowfin bream and tailor) while the others (sea mullet, yellowfin bream, blue swimmer crabs and mud crabs) were all discarded because of being under the regulated size or female.
Marketable sea mullet catch rates increase significantly (LSD P < 0.05) from spring (160 – 26 fish/net shot) until autumn (396 – 42 fish/600 m net shot) (Figure 2a). Catch rates increase as sea mullet form aggregations in estuaries during autumn prior to their winter spawning run (Virgona et al. 1998). In conjunction with the increased catch rates of legal sized sea mullet a significantly higher catch rate (LSD P < 0.05) of undersized sea mullet occurs during summer and autumn in this fishery (Figure 2d). This increase although significant constitutes a very low catch rate of about 1 fish per shot. During the winter the catches of undersized sea mullet decrease as fishers concentrate effort on the larger spawning run fish by increasing the mesh size used allowing undersized fish to escape.
Catch rates of marketable yellowfin bream (>23cm TL) increased significantly (LSD P < 0.05) during winter in the sea mullet fishery. Yellowfin bream form schools during winter with spawning occurring mainly on surf bars from June to August (Pollock 1982). There is little difference in the catch rates for spring, summer and autumn when about 4-5 fish/shot are caught. This catch rate doubles during winter to about 10 fish/shot (Figure 2b). Undersized yellowfin bream discarded as bycatch had significantly increased catch rates (LSD P < 0.05) reported during summer. These catch rates are similar to catch rates for marketable yellowfin bream reaching 9.4 – 2.0 fish/shot (Figure 2e). Changes in mesh size by fishers during winter may effectively decrease the bycatch of undersized yellowfin bream by allowing more to escape through the net meshes while still catching the larger bream.
Tailor catch rates increase significantly (LSD P < 0.05) from spring until winter (Figure 2c). These catch rates although significantly higher in winter were still quiet low with the winter catch rate being slightly more than 1 fish/shot. Tailor spawning patterns are similar to sea mullet in that they form large schools and move northward along ocean beaches during their spawning run (Pollock 1984). This schooling allows fishers to sometimes sight and directly target tailor in estuarine areas adjacent to ocean beaches. There are often a few tailor that travel with the mullet schools during this time of year. Increasing the mesh sizes of nets to target sea mullet during autumn and winter may not effectively decrease the catch rates of tailor because of their body morphology and their tendency to bite the net to get through rather than swimming through the mesh. Most of the tailor caught during the observer program were found with net meshes stuck between their teeth, so were “bridled” rather than being gill meshed.

Sprin
g
Summer
Autumn
Winter
Sprin
g
Summer
Autumn
Winter
Sprin
g
Summer
Autumn
Winter
Spring
Summer
Autumn
Winte
r Sp
ring
Summer
Autumn
Winter
Spring
Summer
Autumn
Winter
Sprin
g
Summer
Autumn
Winter
Marketable Catch
c. Marketable Tailor a. Marketable Sea Mullet b. Marketable Yellowfin Bream
100 3
Fish
/ Sh
ot 12
0 00
Fish
/ Sh
ot
500 215
Fish
/ sh
ot 400 1.5 300 9
1.0 200 6
0.5
Discarded bycatch
e. Undersize Yellow fin Bream d. Undersize Sea Mullet 5
1.00 4
00
Fish
/ Sh
ot
Fish
/ Sh
ot0.75
Fish
/ Sh
ot
3 0.50 2
10.25
f. Blue swimmer Crab g. Mud Crab
2 3
2.5 1.5
Fish
/ Sh
ot 2.0
1.51.0 1.0
0.5 0.5
00
17 Observer and Logbook Program
Figure 2: Seasonal changes in mean catch rates (± 1 S.E.) for target and bycatch species within the sea mullet fishery. Note the changes in scale for each species.
Undersized male and female blue swimmer crab catch rates were significantly higher (LSD P < 0.05) in autumn (2.2 – 0.5 crabs /shot) than in winter and spring (0.7 – 0.2 crabs/shot) (Figure 2f). Undersized male and female mud crabs had significantly higher catch rates reported during summer (5.3 – 1.1 crabs/shot) with decreased catch rates occurring during winter (1.0 – 0.2 crabs/shot) (Figure 2g). Blue swimmer and mud crabs are attracted to nets that have fish caught in them and often become entangled by their legs and claws while feeding.
6.3.3 Whiting Fisheries in Southern Queensland
The Whiting Fishery
The whiting fishery in Queensland has about 250 fishers recording catches each year and produces approximately 250 t of product (Williams 1997). Netting operations in the whiting fishery are conducted in two different ways. One involves setting a small mesh net (usually 51 mm mesh and up to 800 m long) along the edge of a bank at the low tide mark when the tide is about half down. The water then drains off the bank bringing the fish down from within the shallows and into the net. The second method is to actively

18 Observer and Logbook Program
use a small mesh net to form a ring, usually over intertidal or shallow sub-tidal areas. The net is then hand hauled and the fish within the ring captured by meshing.
6.3.3.1 Logbook Program in the Whiting Fishery
Total Catch Composition
Logbook sheets were returned from 7 commercial fishers fishing in the whiting fishery and represented 471 net shots. A total of 149,784 individuals from at least 54 species of animal were captured including at least 47 species of fish, 3 crab species, 2 cephalopods and 2 marine reptiles (sea snake and marine turtle) (Table 3). Thirty-one species were retained for market or as bait comprising 71.9% of the total catch. Summer whiting (55.5%) dominated the marketable catch. Two species, herring Herklotsichthys koningsbergeri (2.9%) and silverbiddies Gerres oyeana (2.8%), that are sometimes sold or retained as bait by commercial fishers, comprised a further 5.7% of the total catch. Three regulated species, dusky flathead (2.3%), sea mullet (1.9%) and yellowfin bream (1.6%) together with the unregulated species of flicker mullet Mugil georgii (1.6%) and flat tailed mullet Liza subviridis (1.5%), comprised the majority of the remaining marketed catch. The remaining 22 species retained for market comprised 1.8% of the total catch. Bycatch was reported at 28.1% with silverbiddies (18.5%) and flicker mullet (1.6%) dominating the bycatch (Figure 3a). Although both of these unregulated species are sometimes sold as bait, they often contribute major portions of the discarded bycatch. Twelve species of fish were included in the other regulated species discarded because of size restrictions with sand whiting (1.3%) and yellowfin bream (1.1%) dominating. Twenty-three species were caught but not marketed being exclusively discarded as bycatch. Sixty-four marine turtles were reported in the vicinity of commercial fishers while carrying out their fishing activities. All were reported to have been released alive with many reported to have been feeding on fish caught within the nets during the fishing operation. Two unidentified sea snakes were also reported, but their release condition is unknown.
Regulated Species Reported as Bycatch from Whiting Fishery Logbook Program
Regulated species discarded as bycatch made up 15.4% of the total discards. No individual species dominated the bycatch with sand whiting (4.5%), yellowfin bream (3.8%) and dusky flathead (2.9%) representing over two thirds of the bycatch of regulated species (Figure 3b). Blue swimmer crabs (1.6%) were discarded at a high rate, 99.5% of the total number caught (Table 3). Sea mullet (1.2%) were the only other regulated species that contributed more than 1% to the total bycatch.
Unregulated Species Reported as Bycatch from Whiting Fishery Logbook Program
Silverbiddies dominated the unregulated discards within the whiting fishery, being two thirds (65.9%) of the bycatch. This species was occasionally kept as bait. Other bait species that were sometimes kept but usually discarded included flicker mullet Mugil georgii (5.8%) and herring Herklotsichthys koningsbergeri (2.6%). The dasyatidid stingrays listed in the catch were usually not entangled by the net but rather surrounded by it. These stingrays were able to escape from the net after the fishers began hauling it

19 Observer and Logbook Program
from the water and are rarely landed into the boat. The remaining bycatch consisted of 23 species, none of which contributed more than 0.05% of the total bycatch.
6.3.3.2 Observer Program in the Whiting Fishery
Total Catch Composition
A total of 31 net shots by 5 different commercial fishers were observed. A combined total of 19,482 fish from 55 species of animal were captured including 50 species of fish, 2 species of crab, 2 cephalopods and marine turtles (Table 3). Thirty-six species comprising 72.5% of the total observed catch were retained for market. Six species, sand whiting (35.0%), silverbiddies (22.4%), flat-tailed mullet Liza argentea (4.4%), flicker mullet Mugil georgii (3.2%), dusky flathead (2.8%) and tailor (1.0%)
Summer W
hiting
Silverb
iddy
Flat ta
il Mulle
t
Flicker
Mulle
t
Dusky F
lathead
Other M
arket
Silverb
iddy
Summer W
hiting
Other R
egulate
d Disca
rd
Summer W
hiting
Yellow fin
Bream
Dusky F
lathead
Mud Crab
Blue sw
immer Crab
Other R
egulate
d
Silverb
iddy
Flicker
Mulle
t Herri
ng
Stingra
y
Yellow tai
l Pike
Other D
iscard
Summer W
hiting
Herring
Silverb
iddy
Dusky F
lathead
Sea M
ullet
Other M
arket
Silverb
iddy
Flicker
Mulle
t
Other Regu
lated
Discard
Summer W
hiting
Yellow fin
Bream
Dusky F
lathead
Mud Cra
b
Blue swimmer C
rab
Other Regu
lated
Silverb
iddy
Flicke
r Mulle
t Herri
ng
Stingra
y
Yellow tail
Pike
Other D
iscard
Discarded Bycatch Unregulated Bycatch
65 a. 70 b. Regulated Bycatch60 Marketed Catch
Perc
enta
ge o
f To
tal C
atch
Pe
rcen
tage
of
Tota
l Cat
ch
Perc
enta
ge o
f B
ycat
ch
Perc
enta
ge o
f B
ycat
ch55
50
20
15
10
5
65
10
5
0 0
10
c. Marketed Catch
Discarded Bycatch
10
5 5
0 0
30
Unregulated Bycatch
d.40 40
Regulated Bycatch35 35
30
25 25
20 20
15 15
Figure 3: Whiting fishery catch composition for (a) voluntary logbook from 471 net shots (b) voluntary logbook bycatch, (c) observed catch from 31 net shots and (d) observed catch bycatch composition.
(Figure 3c) dominated the marketable catch. The difference in relative catch frequency of silverbiddies between the observer and logbook data (Figure 3a and c) arose from one fisher in the observer program having a local market for silverbiddies while the other fishers discarded them. This created a false impression in the observer data that silverbiddies are marketed at a reasonably high rate when they generally are not. The remaining 20 species, totalling 4.7% of the total catch, were retained for market. Bycatch was estimated at 27.5% with silverbiddies (10.8%), sand whiting (2.7%), flicker mullet (2.4%), yellowfin bream (2.2%), and dusky flathead (2.2%) dominating. No other bycatch species represented more than 1% of the total catch. Nineteen species were caught but not marketed, being exclusively bycatch. Ten sea turtles were observed being encircled by nets in this fishery during the program, and all were released alive.

20 Observer and Logbook Program
Table 3: Whiting fishery: species composition and discarding rates from 471 net shots reported in the voluntary logbook program, and from 31 net shots in the observer program on the sub-tropical east coast
of Queensland. TL = Total Length, CW = Carapace Width, NR = Not Regulated, P = Protected.
COMMON NAME SPECIES NAME SIZE LIMIT LOGBOOK DATA (471 N ET SHOTS) OBSERVER DATA (31 N ET SHOTS) (cm ) RETAINED DISCARDED % DISCARD RETAINED DISCARDED % DISCARD
Sand Whiting Sillago ciliata > 23 TL 83160 1898 2 6806 533 7 Herring Herklotsichthys koningsbergeri NR 4400 1513 0 192 100 Silverbiddy Gerres oyeana NR 4217 27795 87 4359 2108 33 Dusky Flathead Platycephalus fuscus > 30 TL 3377 1209 26 548 424 44 Sea Mullet Mugil cephalus > 30 TL 2782 506 15 78 25 24 Yellowfin Bream Acanthopagrus australis > 23 TL 2405 1612 40 276 433 61 Flat tailed Mullet Liza subviridis NR 2275 13 1 860 0 0 Flicker Mullet Mugil georgii NR 2351 2432 629 475 43 Tailor Pomatomus saltatrix > 30 TL 832 218 21 196 61 24 Dart Trachinotus russelli NR 678 4 1 0 0 Tiger Mullet Liza argentea NR 377 0 0 10 0 0 Squid Sepioteuthis sp. NR 174 0 0 69 0 0 Scad Decapterus sp. NR 127 0 0 0 0 Cuttlefish Sepia sp. NR 110 3 3 15 0 0 Sand Mullet Myxus elongatus NR 108 0 0 2 0 0 Trumpter Whiting Sillago maculata NR 70 9 11 168 0 0 Wolf Herring Chirocentrus dorab NR 45 8 15 0 0 Gar Hemirhamphus quoyi NR 37 0 0 35 0 0 Shark Carcharinidae NR 28 0 0 4 0 0 Trevally Carangidae NR 26 41 62 12 6 33 Grunter Pomadasys sp. > 30 TL 19 50 73 0 0 Mud Crab Scylla serrata > 15 CW 13 293 96 3 155 98 Queenfish Scomberoides sp. NR 9 2 18 0 3 100 Blue swimmer crab Portunus pelagicus > 15 CW 4 694 99 0 155 100 Striped Scat Selenotoca multifasciata NR 4 72 95 0 0 Australian Bonito Sarda australis NR 4 0 0 0 0 Ludderick Girella tricuspidata > 23 TL 2 0 0 0 0 Black Sole Achlyopa nigra NR 1 52 98 0 16 100 Mackerel Scomberomorus sp > 45 TL 1 3 75 0 0 Golden Trevally Gnathanodon speciosus NR 1 1 50 0 0 Golden-lined Whiting Sillago analis > 23 TL 0 0 12 0 0 Blue-Spot Mullet Valamugil seheli NR 0 0 9 0 0 Diamond Scale Mullet Liza vaigiensis NR 0 0 6 5 46 Giant Herring Elops sp. NR 0 0 5 2 29 Tarpon Megalops cyprinoides NR 0 0 5 1 17 Tongue Sole Pseudorhombus sp. NR 0 0 4 15 79 Bar-tailed Flathead Platycephalus endrachtensis > 30 TL 0 0 3 7 70 Estuary Cod Epinephalus sp. > 35 < 120 0 0 1 1 50 Mangrove Jack Lutjanus argentimaculatus > 35 Tl 0 0 1 0 0
Stingray Dasyatididae NR 0 919 100 0 166 100 Striped Seapike Sphyraena obtusata NR 0 706 100 0 154 100 Shovelnosed Ray Rhinobatus batillum NR 0 494 100 0 124 100 Longtom Tylosurus sp. NR 0 368 100 0 104 100 Catfish Arius spp. NR 0 346 100 0 14 100 Ponyfish Leiognathus sp. NR 0 232 100 0 0 Trumpeter Pelates sp. NR 0 152 100 0 6 100 Threadfin Salmon Polydactylus sp. NR 0 149 100 0 30 100 Eel-tailed Catfish Plotosus lineatus NR 0 105 100 0 35 100 Tripodfish Triacanthidae NR 0 98 100 0 1 100 Goatfish Upeneus sp. NR 0 47 100 0 5 100 Rabbitfish Siganus sp. NR 0 36 100 0 5 100 Pink Eyed Mullet Trachystoma petardi NR 0 20 100 0 0 Moses Perch Lutjanus russelli > 25 Tl 0 14 100 0 7 100 Grass Sweetlip Lethrinus fletus > 30 Tl 0 9 100 0 15 100 Diamondfish Monodactylus argenteus NR 0 7 100 0 0 Bone fish Albula neoguinaica NR 0 6 100 0 0 Red Bullseye Priacanthus sp. NR 0 4 100 0 0 Grinner Saurida sp. NR 0 4 100 0 0 Love Crab Thalamita crenata NR 0 3 100 0 0 Blue Threadfin Eleutheronema tetradactylum > 40 TL 0 2 100 0 5 100 Stonefish Synanceja horrida NR 0 1 100 0 0 Tarwhine Rhabdosargus sarba > 23 TL 0 0 0 20 100 Rat tail ray Gymnura australis NR 0 0 0 11 100 Pufferfish Arothon hispidus NR 0 0 0 10 100 Blue-Spotted Stingray Dasyatis kuhlii NR 0 0 0 7 100 Snapper Pagrus auratus > 30 Tl 0 0 0 4 100 Estuary Stingray Dasyatis fluviorum NR 0 0 0 2 100 Reticulate Whipray Himantura uarnak NR 0 0 0 2 100 Northern Sand Flathead Platycephalus arenarius NR 0 0 0 2 100 Long-Horned Cowfish Lactoria cornuta NR 0 0 0 1 100 Fan-Bellied Leatherjacket Monocanthus chinensis NR 0 0 0 1 100
Turtle Unidentified P 0 64 100 0 10 100 Sea snake Unidentified P 0 2 100 0 0
Total number of fish 107635 42149 14115 5357 Percentage of Total Catch 71.9 28.1 72.5 27.5
Regulated Bycatch Observed in the Whiting Fishery
Due to the small mesh size of whiting nets (usually 51 mm), higher numbers of undersized regulated fish were caught than observed in the sea mullet fishery. Thirteen

21 Observer and Logbook Program
species of fish and two species of crab were discarded as regulated species. Of these sand whiting (10.0% of the bycatch component), yellowfin bream (8.1% of the bycatch component), and dusky flathead (7.9% of the bycatch component) were the most abundant species. All other regulated species contributed less than 1% of the total bycatch discards.
Unregulated Bycatch Observed in the Whiting Fishery
Nineteen species were discarded as unregulated bycatch. Of these, silverbiddies (39.4% of bycatch component) and flicker mullet (8.9% of bycatch component) were the most abundant. Herring, stingrays, striped seapike Sphyraena obtusata and longtoms Tylosurus sp. were the only other species to be represented by more than 1% of the total bycatch. (Figure 3d).
6.3.3.3 Seasonality of bycatch in the Whiting Fishery.
Returned logbook data on catches within the whiting fishery indicated that there were 7 species caught in sufficient numbers to allow analysis of catch rates for seasonal trends. For marketable fish, seasonality in catches were estimated for sand whiting, sea mullet, yellowfin bream and dusky flathead. Catches of discarded undersized sand whiting, yellowfin bream, dusky flathead, blue swimmer and mud crabs were also investigated. The silverbiddy was the only unregulated species caught consistently enough to allow for investigation into seasonal changes in catch rates.
Catch rates of marketable sand whiting were significantly higher (LSD, P < 0.05) in autumn and winter (~350 – 70 fish/shot) than in spring and summer (Figure 4a). This increase is associated with a significant increase (LSD, P < 0.05) in the catch rates of undersized whiting during winter when compared with other seasons (Figure 4e). Whiting have a cylindrical body form that allows this fishery to be highly selective in the size of the fish that are caught by changes in mesh size (Kennelly and Gray 2000). As 51 mm mesh nets are currently used in this fishery and the majority of the targeted catch is in the size range of 210-240 mm fork length, any increase in the legal size for this fish would require changes in the current legislation to increase the minimum mesh size to maintain the currently low catch rates of undersized whiting.
Marketable yellowfin bream catch rates are about 5 – 2 fish/shot from spring until autumn and then significantly increase (LSD, P < 0.05) during winter to 12.4 – 2.3 fish/shot (Figure 4b). This increase is mirrored by the catch rates of undersized yellowfin bream that are relatively stable from spring to autumn at < 3 fish/shot but increase to 11.1 – 2.1 fish/shot in winter (Figure 4f). These higher catch rates during winter are most probably associated with the schooling/spawning behaviour of this species (see mullet section, page 18).
The catch rates of legal size dusky flathead (>300 mm TL) within the whiting fishery were significantly higher (LSD, P < 0.05) during winter (44.8 – 10.7 fish/shot) than all other seasons (Figure 4d). Catch rates of undersized dusky flathead also increase significantly (LSD, P < 0.05) during the winter (10.0 – 2.3 fish/shot) compared with the summer and autumn catches (~2.0 – 0.8 fish/shot) (Figure 4g). Flathead are demersal and feed on fish and crustaceans in intertidal areas on the high tide (Dredge 1976). They

22 Observer and Logbook Program
are often caught in the whiting nets, particularly when intertidal banks are drained off, by their protruding opercular spines or by their mouthparts. This entangling capture means that changes in net mesh size would not have a dramatic effect on the catches of legal sized flathead but decreases in catch rates for juvenile fish may occur.
Catches of marketable sea mullet from within the whiting fishery are significantly higher in summer (24.5 – 9.8 fish/shot) than in all other seasons (Figure 4c). This increase could be a result of summer migrations of sea mullet called “hard gut runs” (Virgona et al. 1998). The sea mullet that move in these runs are sexually immature and can move considerable distances without feeding. They are often seen travelling northward along surf beaches, within 10 metres of the shore, in extremely long thin schools. These schools are often only 6 or 7 fish wide with the whole school taking many hours to pass a single point. These schools move from one estuary to another presumably in the search for feeding grounds. The lean condition that they are in due to travelling long distances appears to make them more susceptible to capture in the small mesh whiting nets than at other times of the year.
Sprin
g
Summer
Autumn
Winter
Sprin
g
Summer
Autumn
Winte
r
Spring
Summer
Autumn
Winter
Spring
Summer
Autumn
Winter
Spring
Sum
mer
Autumn
Winter
Sprin
g
Summer
Autumn
Winter
Spring
Sum
mer
Autumn
Winter
Sprin
gSum
mer
Autumn
Winte
r
Spring
Summer
Autumn
Winter
Sprin
gSum
mer
Autumn
Winte
r
Marketable Catch
0
100
200
300
400
500
Fish
/ Sh
ot
0
4
8
12
16
20
Fish
/ Sh
ot
a. Marketable Whiting b. Marketable Yellowfin Bream
c. Marketable Dusky Flathead d. Marketable Sea Mullet 4060
50
0 0
30
Fish
/ Sh
ot
Fish
/ Sh
ot
40 30 20 20
1010
Fish
/ Sh
ot
Fish
/ Sh
ot
Discarded Bycatch
e. Undersized Whiting f. Undersized Yellowfin Bream g. Undersized Dusky Flathead
20 15 15
12 1215
Fish
/ Sh
ot
9 9 10
6 6 5 3 3
0 0 0
h. Silverbiddy i. Blue swimmer Crab j. Mud Crab
0 100 200 300 400 500
600
Fish
/ Sh
ot
0
1
2
3
4
Cra
bs /
Shot
0
0.5
1.0
1.5
2
Cra
bs /
Shot
Figure 4: Seasonal changes in mean catch rates (± 1 S.E.) for target and bycatch species within the whiting fishery. Note differences in scale for all species.

23 Observer and Logbook Program
Blue swimmer crab and mud crab catch rates within the whiting fishery show an opposite pattern to those recorded for the sea mullet fishery. Significantly higher catch rates for discarded crabs of both species are shown to occur during winter than in summer and autumn as in the sea mullet fishery (Figure 4I and j). Catch rates of both species of crabs is low with the highest catch rates for blue swimmer crabs being 3.1 – 0.6 crabs/shot and 1.0 – 0.1 crabs/shot for mud crabs
Of the unregulated species caught and discarded in the whiting fishery, only silverbiddies were caught in sufficient numbers to allow analyses of seasonal patterns in catch. Silverbiddies are small dorso-ventrally-flattened fish of similar body morphology to bream. These fish attain a maximum size of about 230 mm total length (Kailola et al. 1993) and are highly susceptible to “gilled” capture in 51 mm mesh nets. Silverbiddies are sometimes marketed as food or bait; however, these markets are disjointed and service an irregular demand. For this reason all reported catches of silverbiddies whether sold or discarded were pooled and included in a single analysis. High catch rates of silverbiddies were reported during winter (Figure 4h) with mean catches of 431 – 126 fish/shot being reported. These catch rates decrease through spring and reach the lowest levels during summer (40 – 21 fish/shot). Of all the bycatch species in the whiting fishery, the silverbiddy appears to be one species for which markets should be developed as catch rates are high and the majority of the catch is currently discarded.
6.3.4 Small Mackerel Fisheries in Southern Queensland
The Small Mackerel Fishery
Small mackerel fisheries in southern Queensland target two species, school mackerel (Scomberomorous queenslandicus) and spotted mackerel (S. munroi). About 100 fishers participate in this fishery annually with the number fluctuating markedly over the past 10 years (Williams 1997). The mackerel fishery in southern Queensland is highly seasonal, normally lasting from spring until summer. Two forms of fishing occur in this fishery. The first method is similar to the mullet fishery with fishers sighting schools of mackerel and setting their nets in a ring surrounding the school. This method is usually restricted to sheltered embayments. The second is a set net fishery where nets are set in a fixed position perpendicular to the shoreline off the surf beaches and allowed to passively fish for up to 3 hrs. Nets are usually 600 m long and have a mesh size of 112 mm to 137 mm.
6.3.4.1 Logbook Program in the southern Small Mackerel Fishery
Total Catch Composition
Logbook sheets were returned from 4 commercial fishers with a total of 166 net shots recorded. A total of 4 690 individuals from at least 45 species of fish were captured (Table 4). Of the total catch, 90.3% were reported as being retained for market. School and spotted mackerel were the most abundant fish caught in this fishery contributing a combined total of 75.2% of the total catch (Figure 5a). Dart Trachinotus russelli (7.2%) and carcharinid sharks (3.5%) were the only other marketable species that contributed more than 1% of the total catch. A further 20 species totalling 4.5%were retained for market. Bycatch was reported at 9.7% with lantern fish (Family: Myctophidae) (3.3%) and scads Decapterus sp.(1.8%) dominating. Discarding of regulated species was low

24 Observer and Logbook Program
(0.4%) with 8 spanner crabs Ranina ranina, 7 blue swimmer crabs and 3 snapper Pagrus auratus, being discarded. Twenty species were caught but not marketed, being exclusively discarded as bycatch.
Mackerel
Bo
nito
Dusky F
lathead
Other M
arket
Lante
rn Fish
Scad
Other R
egulate
d Disca
rd
Snapp
er Tai
lor
Other R
egulate
d
Lantern
Fish Sca
d
Shoveln
osed R
ay Discard
Mackerel
Dart
Shark
Other M
arket
Lante
rn Fish
Scad
Other R
egulate
d Disca
rd
Other R
egulate
d
Lantern
Fish Sc
ad
Bulls ey
e
Stingr
ay
Catfish
Stripe
d Butte
rfish
Bonito
Shovel
nosed
Ray Disc
ard
a. 4580
40Marketed Catch
b. Regulated Bycatch
Unregulated Bycatch
Perc
enta
ge o
f T
otal
Cat
ch
Perc
enta
ge o
f T
otal
Cat
ch 75
Perc
enta
ge o
f Byc
atch
Pe
rcen
tage
of
Byc
atch 35
70 30 Discarded Bycatch
2515
20
10 15
10 5
5
0 0
80 c. 55 d. Regulated Bycatch50Marketed Catch75
45 70 40 Unregulated BycatchDiscarded Bycatch65 35
3060
1510
10 5 5
0 0
Figure 5: Small mackerel fishery catch breakdowns for (a) logbook returns catch (b) logbook bycatch composition (c) observer catch and (d) observer bycatch composition.
Regulated Species Reported as Bycatch from the Small Mackerel Logbook Program
Regulated species discarded as bycatch make up 0.4% of the total discards (Figure 5b) (Table 4).
Unregulated Species Reported as Bycatch from the Small Mackerel Logbook Program
Lantern fish (33.8% of the bycatch component) and scads (19.0% of the bycatch component) dominated the unregulated discards within the mackerel fishery. Scads were occasionally kept as bait but more often than not were discarded. Of the remaining 18 species, only bulls eyes Priacanthus sp.(1.03%) contributed more than 1% to the total bycatch (Figure 5b).
6.3.4.2 Observer Program in the southern Small Mackerel Fishery
Total Catch Composition
Observer data were collected from the fishing activities of one fisher in the mackerel fishery covering 19 net shots. A total of 459 fish were caught from at least 23 species (Table 4). Of the total catch 83.7% were retained for market. The small mackerel Scomberomorus queenslandicus was the most abundant fish caught in this fishery contributing 72.7% of the total catch (Figure 5c). Australian Bonito Sarda australis (3.1%), dusky flathead (3.0%) and spotted mackerel Scomberomorus munroi (2.0%) were the only other marketable species that individually contributed more than 1% of the total catch. Eight other species were retained for market totalling 2.8% of the total catch. Bycatch was 16.3% with lantern fish Family: Myotophidae (8.8%) and scads

25 Observer and Logbook Program
Decapterus sp. (4.6%) dominating. Both of these unregulated species are small and occur seasonally in large numbers within the fishing grounds. These fish were never “gilled” and became entangled within the net by their mouthparts. Two speciments each of tailor Pomatomus saltatrix and snapper Pagrus auratus were discarded because of size limit regulations.
Table 4: Small mackerel fishery: species composition and discarding rates from 166 net shots reported in the voluntary logbook program, and from 19 net shots in the observer program on the sub-tropical east
coast of Queensland. TL = Total Length, CW = Carapace Width, CL = Carapace Length, NR = Not Regulated, P = Protected
COMMON NAME SPECIES NAME SIZE LIMIT (cm)
LOGBOOK DATA (166 N ET SHOTS) RETAINED DISCARD % DISCARD
OBSERVER DATA (19 N ET SHOTS) RETAINED DISCARD % DISCARD
Mackerel unidentified Scomberomorus sp > 50 TL 2655 0 0 0 0 School Mackerel Scomberomorus queenslandicus > 50 TL 796 0 0 332 0 0 Dart Trachinotus russelli NR 340 0 0 0 0 Shark unidentified Charcharinidae NR 163 2 1 2 0 0 Spotted Mackerel Scomberomorus munroi > 50 TL 74 0 0 9 0 0 Queenfish Scomberoides sp. NR 34 0 0 0 0 Dusky flathead Platycephalus fuscus > 30 TL 29 0 0 14 0 0 Bonito Sarda australis NR 22 13 37 14 0 0 Snapper Pagrus auratus > 30 TL 20 3 13 1 2 67 Grey Mackerel Scomberomorus semifasciatus > 50 TL 20 0 0 0 0 Tailor Pomatomus saltatrix > 30 TL 19 0 0 0 2 100 Blubber lip Plectorhinchus sp NR 19 0 0 6 0 0 Scad Decapterus sp. NR 12 86 88 0 21 100 Wolf herring Chirocentrus dorab NR 9 9 50 0 1 100 Grass sweetlip Lethrinus fletus > 30 TL 7 1 13 0 0 Grunter Pomadasys sp. > 30 TL 6 0 0 0 0 Blue swimmer crab Portunus pelagicus > 15 CW 3 7 70 0 0 Trevally Carangidae TR 2 6 75 1 1 50 Estuary Cod Epinephalus sp. > 35 < 120 TL 2 0 0 0 0 Amberjack Seriola dumerili NR 2 0 0 0 0 Shovelnosed ray Rhinobatus batillum NR 1 12 92 0 2 100 Parrotfish Scaridae NR 1 0 0 1 0 0 Samson fish Seriola hippos NR 1 0 0 0 0 Yellowtail kingfish Seriola lalandi > 50 TL 1 0 0 0 0 Mackerel Tuna Euthynnus affinis NR 0 0 2 0 0 Bar tailed flathead Platycephalus endrachtensis > 30 TL 0 0 1 0 0 Hammerhead shark Sphyrna sp. NR 0 0 1 0 0
Lantern fish Myctophidae NR 0 153 100 0 40 100 Bullseye Priacanthus sp. NR 0 47 100 0 1 100 Stingray Dasyatididae NR 0 28 100 0 0 Catfish Arius sp. NR 0 15 100 0 1 100 Stripey butterfish Selenotoca multifasciata NR 0 14 100 0 0 Diamond fish Monodactylus argenteus NR 0 10 100 0 0 Spanner crab Ranina ranina > 10 CL 0 8 100 0 0 Grinner Saurida sp. NR 0 8 100 0 1 100 Tripod fish Triacanthidae NR 0 6 100 0 0 Tarpon Megalops cyprinoides NR 0 5 100 0 0 Moonfish Mene maculata NR 0 5 100 0 1 100 Black Trevally Siganus sp. NR 0 4 100 0 0 Giant herring Elops sp. NR 0 2 100 0 0 Milkfish Chanos chanos NR 0 2 100 0 0 Red spot Crab Portunus sanguinolentus NR 0 2 100 0 0 Herring Herklotsichthys sp. NR 0 1 100 0 0 Silver Toadfish Lagocephalus scleratus NR 0 1 100 0 0 Leatherjacket Monacanthidae NR 0 1 100 0 0 Banded Wobbygong Orectolobus ornatus NR 0 1 100 0 1 100 Black sole Achlyopa nigra NR 0 1 100 0 0 White spotted shovelnosed ray Rhynchobatus djiddensis NR 0 0 0 1 100
Total number of fish 4237 453 384 75 Percentage of Total Catch 90.3 9.7 83.7 16.3
Regulated Bycatch Observed in the Small Mackerel Fishery
Regulated species discarded as bycatch made up 0.9% of the total discards. Only two individuals of both tailor and snapper were caught that were discarded (Table 4).
Unregulated Bycatch Observed in the Small Mackerel Fishery
Two species of fish, lantern fish Family:Myotophidae (53.3% of bycatch component) and scads Decapterus sp (28.0% of the bycatch component) dominated the discarded

26 Observer and Logbook Program
component of the catch. A further nine species were caught and discarded at low rates with only 1 or 2 individuals of each species being caught.
6.3.5 Tropical East Coast Barramundi Fishery
The Fishery
The tropical east coast (EC) barramundi gill net fishery operates in the estuarine and shallow coastal waters extending from Cape York south to the southern extent of the species range around the Mary River in southern Queensland. There are about 210 boats that report catching barramundi on the east coast each year with annual production of about 160 t (Williams 1997).
The EC barramundi seasonal closure extends for three calendar months from November 1st to February 1st each year. Each commercial net endorsement allows a fisher to operate 3 nets totalling no more than 360 m in length when fishing within creeks or rivers, or 600 m when fishing foreshores. Monofilament gill nets are used exclusively with mesh size restricted to between 150 and 215 mm for river netting operations. The product of the fishery is predominantly “iced, gilled and gutted” with large whole fish generally meeting more market resistance than smaller fish. Apart from in the far northern region of the state, most fishing effort occurs close to towns or regional centres. Fishing is predominantly conducted over-night and the product landed the next morning. Fishing generally occurs from sunset to sunrise with soak times varying between 2 and 6 hrs.
6.3.5.1 Logbook Program in the East Coast Barramundi Fishery
Five commercial fishers participated in the logbook program with catches from 95 net shots being recorded. A total of 2 362 fish from 32 species and 93 mud crabs (Scylla serrata) were captured (Table 5). Of the total catch, 79.6% was retained for market. The four most abundant species captured were all marketed species - barramundi Lates calcarifer (23.4%), blue threadfin Eleutheronema tetradactylum (19.2%), king threadfin Polydactylus macrochir (8.9%) and queenfish Scomberoides commersonianus (7.5%) (Figure 6a). The remaining 14 species retained for market represented a further 15.6% of the total catch. Bycatch was estimated at 20.4% with undersized barramundi (< 580 mm TL) (5.2%), mud crab (3.9%) and catfish Arius spp. (3.5%) dominant. Twelve species were captured but not marketed being exclusively bycatch. Fish and crabs released due to non-conformance to regulated size limits represented 9.5% of the total catch.
6.3.5.2 Observer Program in the East Coast Barramundi Fishery
Total Catch Composition
Four commercial fishers participated in the program resulting in a total of 127 net shots being observed. A combined total catch of 1 581 fish from 45 species, 31 mud crabs and four turtles from three species were captured (Table 5). Of the total catch, 84.0% was retained for market. The five most abundant species captured were all marketed species

27 Observer and Logbook Program
Table 5: East coast barramundi fishery: species composition and discarding rates from 95 net shots reported in the voluntary logbook program, and from 127 net shots in the observer program on the tropical north-east coast of Queensland. TL = Total Length, CW = Carapace Width, CL = Carapace
Length, NR = Not Regulated, P = Protected.
COMMON NAME SPECIES NAME SIZE LIMIT LOGBOOK DATA (95 NET SHOTS) OBSERVER DATA (127 NET SHOT)S (cm ) RETAINED DISCARD % DISCARD RETAINED DISCARD % DISCARD
Barramundi Lates calcarifer > 58 <120 TL 553 122 18 621 28 4 Blue Threadfin Eleutheronema tetradactylum > 40 TL 454 4 1 263 3 1 King Threadfin Polydactylus macrochir > 40 TL 211 1 0.5 54 0 0 Queenfish Scomberoides commersonnianus NR 177 1 0.5 134 0 0 Shark unspecified Carcharhinus spp NR 117 36 24 0 0 Sea Mullet Mugil cephalus > 30 TL 76 0 0 3 0 0 Pumpkinhead Trachinotus blochii NR 70 0 0 7 0 0 Grunter Bream Pomadasys kaakan > 30 TL 53 0 0 112 0 0 Diamond Scale Mullet Liza vaigiensis NR 44 9 17 6 0 0 Dusky Flathead Platycephalus fuscus > 30 TL 35 2 5 18 0 0 Tripletail Lobotes surinamensis NR 27 0 0 13 0 0 Giant Trevally Caranx ignobilis NR 19 6 24 0 0 Fingermark Lutjanus johnii > 35 TL 13 0 0 10 0 0 Catfish Arius spp. NR 11 83 88 9 28 76 Mangrove Jack Lutjanus argentimaculatus > 35 TL 6 0 0 6 0 0 Moonfish Drepane punctata NR 4 5 56 0 15 100 Yellowfin Bream Acanthopagrus australis > 23 TL 3 0 0 0 0 Shovelnose – Giant Rhinobatos typus NR 2 18 90 0 2 100 Blubberlip Plectorhinchus gibbosus NR 2 3 60 0 9 100 Parrotfish Scarid sp. NR 1 0 0 0 0 Barracuda Sphyraena barracuda NR 1 0 0 2 0 0 Bull Shark Carcharhinus leucas NR 0 9 100 55 15 21 Mud Crab Scylla serrata > 15 CW 0 93 100 7 24 77 Wolf Herring Chirocentrus dorab NR 0 0 1 0 0 Gold Spot Cod Epinephilus coioides > 35 <120 TL 0 0 1 0 0 Black Spot Cod Epinephilus malabaricus > 35 < 120 TL 0 0 1 0 0 Bartail Flathead Platycephalus indicus > 30 TL 0 0 1 0 0 Black Jew Protonibea diacanthus > 45 TL 0 0 1 0 0 Giant Seapike Sphyraena jello NR 0 0 1 0 0 Mullet - Bluetail 1 Valamugil buchanani NR 0 6 100 1 0 0 Mullet - Bluetail 2 Valamugil seheli NR 0 0 1 0 0 Soapy Jew Nibea soldado > 45 TL 0 34 100 0 47 100 Diamond Trevally Selenotoca multifasciatus NR 0 20 100 0 18 100 Stingray Dasyatididae NR 0 15 100 0 1 100 Striped Scat Alectes indicus NR 0 7 100 0 18 100 Cownosed Ray Rhinoptera neglecta NR 0 3 100 0 1 100 Grouper Epinephilus lanceolatus > 35 < 120 TL 0 2 100 0 1 100 Scalloped Hammerhead Sphyrna lewini NR 0 1 100 0 17 100 Black Pomfret Parasromateus niger NR 0 1 100 0 0 Wide Sawfish Pristis micrdon NR 0 1 100 0 0 Batfish Platax orbicularis NR 0 0 0 8 100 Toadfish Arothron hispidus NR 0 0 0 5 100 Winghead Shark Eusphyra blochii NR 0 0 0 4 100 Long Nosed Shark Carcharhinus brevipinna NR 0 0 0 2 100 Bony Bream Nematalosa erebi NR 0 0 0 1 100 Tripod Fish Tripodichthys augustifrons NR 0 0 0 1 100 Grey Nurse Shark Carcharias taurus P 0 0 0 1 100 Golden Trevally Gnathanodon speciosus NR 0 0 0 1 100 Long Jaw Mackerel Rastrelliger kanagurta NR 0 0 0 1 100 Milk Shark Rhizoprionodon acutus NR 0 0 0 1 100 White Spot Shovelnose Rhynchobatus djiddensis NR 0 0 0 1 100 Spotted Scat Scatophagus argus NR 0 0 0 1 100
Loggerhead Turtle Caretta caretta P 0 0 0 1 100 Green Turtle Chelonia mydas P 0 0 0 2 100 Flatback Turtle Natator depressus P 0 0 0 1 100
Total number of fish 1879 483 1328 198 Percentage of Total Catch 79.6 20.4 87.0 13.0
- barramundi Lates calarifer (39.3%), blue threadfin Eleutheronema tetradactylum (16.6%), queenfish Scomberoides sp. (8.5%), grunter bream Pomadasys kaakan (7.1%) and king threadfin Polydactylus macrochir (3.4%) (Figure 6b). The remaining 16 species retained for market or bait represented a further 9.0% of the total catch numbers. Bycatch was estimated at 14.0% with soapy jew Nibea soldado (3.0%), catfish Arius spp.(1.8%) and undersized barramundi Lates calcarifer (<580 mm TL) (1.8%) dominant. Another twenty-two species were captured but were not marketed being exclusively bycatch.
Fish and crabs released due to non-conformance to regulated size limits represented 3.5% of the total catch and included one protected grey nurse shark (Carcharius taurus) that was released alive. The two green turtles (Chelonia mydas), one flatback turtle

Barramund
i
Blue Th
readfin
Queenfis
h
Banded
Grunter
Bull Sha
rk
Other M
arket
Regulate
d Relea
sed
Soapy
Jew
Catfish
Other D
iscard
Barramund
i
Blue Th
readfin
King Thr
eadfin
Queenfis
h Sh
ark
Other M
arket
Regulate
d Relea
sed
Catfish Sh
ark
Other D
iscard
Blue Thre
adfin
Dusky F
lathead
Catfi
sh
Sea M
ullet
Queenfis
h
Other M
arket
Regulate
d Relea
sed
Sliteye
Shark
Herr
ing
Other D
iscard
Blue Th
readfin
Dusky F
lathead
Sea M
ullet
Banded
Grunter
King Th
readfin
Other M
arket
Regulate
d Relea
sed
Soapy
Jew
Catfish
Other Disca
rd
45 a. 45
40 Marketed Catch 40
b. Marketed Catch
Discarded Bycatch
Perc
enta
ge o
f To
tal C
atch
Pe
rcen
tage
of
Tot
al C
atch
Perc
enta
ge o
f To
tal C
atch
Pe
rcen
tage
of
Tota
l Cat
ch
35 35
30 30Discarded Bycatch 25 25
20 20
15 15
10 10
5 5
0 0
45 c. 45
40
Discarded Bycatch
40
d. Marketed Catch
Discarded Bycatch
Marketed Catch
35 35
30 30
25 25
20 20
15 15
10 10
5 5
0 0
28 Observer and Logbook Program
(Natator depressus) and one loggerhead turtle (Caretta caretta) were all released alive after being observed entangled in nets.
Figure 6: Catch composition for: a East Coast barramundi logbook program., b. East Coast barramundi observer program, c. East Coast mixed estuary logbook program and d. East Coast mixed estuary
observer program.
6.3.6 Tropical East Coast “Mixed Estuary” Fishery
The Fishery
The tropical mixed estuary fishery operates year round and is not restricted by the seasonal barramundi closure. Gill nets of mesh sizes between 100 and 115 mm are used to target the blue and king threadfins (Eleutheronema tetradactylum and Polydactylus macrochir), grunter bream (Pomadasys kaakan) and dusky flathead (Platycephalus fuscus). Fishing occurs exclusively on foreshores, as gill nets set within estuarine or riverine waters are restricted to a minimum mesh size of 150 mm. In the fishery, set nets are fixed in static positions with soak times averaging between 4 and 5 hrs. About 200 boats report landing these four species on the east coast with annual production being about 100 t of blue threadfin, 75 t of king threadfin, 12 t of grunter bream and 50 t of dusky flathead (Williams 1997). The majority of the dusky flathead catch is caught in the south of the state with only about 10% of the annual production attribut able to the tropical east coast mixed estuary fishery (Williams 1997).
6.3.6.1 Logbook Program in the East Coast “Mixed Estuary” Fishery
Logbook sheets were returned from 1 commercial fisher with only 2 net shots recorded. This fishery was severely impacted with the introduction of Dugong Protection Areas and as such many of the fishers working in it were unwilling to participate in the program. A combined total of 90 fish from nine species were captured (Table 6). Of the total catch, 81.1% were retained for market with blue threadfin (36.7%), dusky flathead

29 Observer and Logbook Program
(13.3%), sea mullet (12.2%) and grunter bream (12.2%) the dominant species (Figure 6c). A further 2 species were retained for market representing 5.6% of the total catch. Bycatch was estimated at 18.9% with catfish Arius spp. (10.0%), striped butterfish Scatophagus multifasciatus (3.3%) and steelback Leptobramma mulleri (3.3%) dominant. Three species were captured but not marketed being exclusively bycatch. Fish released due to non-conformance to regulated size limits represented 2.2% of the total catch.
6.3.6.2 Observer Program in the East Coast “Mixed Estuary” Fishery
The fishing activities of 2 commercial fishers were observed resulting in a total of 23 net shots being recorded. A combined total of 504 fish from 26 species were captured (Table 6). Of the total catch, 84.7% was retained for market, with blue threadfin (46.6%), dusky flathead (41.7%), catfish (5.8%), sea mullet (3.6%) and queenfish (2.8%) the dominant species (Figure 6d). A further seven species representing 9% of the total catch numbers were retained for market. Bycatch was estimated at 15.3% with undersized blue threadfin (3.0%) and barramundi (2.8%) being the most abundant. Eleven species were captured but not marketed being exclusively bycatch. Fish released due to non-conformance to regulated size limits represented 6.0% of the total catch.
Table 6: East coast “mixed estuary” fishery : species composition and discarding rates from 2 net shots reported in the voluntary logbook prgram, and from 23 net shots in the observer program on the tropical
north-east coas t of Queensland. TL = Total Length, CW = Carapace Width, CL = Carapace Length, NR = Not Regulated, P = Protected
COMMON NAME SPECIES NAME SIZE LIMIT LOGBOOK DATA (2 SHOTS) OBSERVER DATA (23 SHOTS) (cm) RETAINED DISCARDED %DISCARD RETAINED DISCARDED % DISCARD
Blue Threadfin Eleutheronema tetradactylum > 40 TL 33 0 0 235 15 6 Dusky Flathead Platycephalus fuscus > 30 TL 12 0 0 74 2 3 Sea Mullet Mugil cephalus > 30 TL 11 0 0 18 0 0 Grunter Bream Pomadasys kaakan > 30 TL 11 0 0 8 1 11 King Threadfin Polydactylus macrochir > 40 TL 5 0 0 6 0 0 Barramundi Lates calcarifer > 58 <120 TL 1 2 67 1 14 93 Catfish Arius spp. NR 0 3 100 29 0 0 Queenfish Scomberoides commersonnianus NR 0 0 14 3 18 Steelback Leptobramma mulleri NR 0 0 14 0 0 Yellowfin Bream Acanthopagrus australis NR 0 0 7 2 22 Tripletail Lobotes surinamensis NR 0 0 7 0 0 Diamond Scale Mullet Liza vaigiensis NR 0 0 6 0 0 Striped Butterfish Scatophagus multifasciatus NR 0 3 5 0 0 Mangrove Jack Lutjanus argentimaculatus > 35 TL 0 0 2 0 0 Whiting Sillago analis > 23 TL 0 0 1 0 0
Soapy Jew Nibea soldado > 45 TL 0 9 100 0 0 Sliteye Shark Loxodon macrorhinus NR 0 0 0 12 100 Bony Bream Nematalosa erebi NR 0 0 0 7 100 Giant Shovelnose Rhinobatos typus NR 0 0 0 5 100 Scalloped Hammerhead Sphyrna lewini NR 0 0 0 3 100 Moonfish Drepane punctata NR 0 0 0 3 100 Winghead Shark Eusphyra blochii NR 0 0 0 2 100 Tripod Fish Tripodichthys augustifrons NR 0 0 0 2 100 Hamiltons Anchovy Thryssa hamiltoni NR 0 0 0 2 100 Grinner Synodus spp. NR 0 0 0 2 100 Bony Bream Nematolosa come NR 0 0 0 1 100 Tufted Sole Dexillichthys muelleri NR 0 0 0 1 100
Total number of fish 73 17 427 77 Percentage of Total Catch 81.1 18.9 84.7 15.3
No marine mega-fauna was observed captured by fishers targeting “mixed estuary” fishes. No dugong or dolphins were captured or sighted within the vicinity of the fishing activities observed on the tropical north-east coast. However, as this data set is very small when compared to the number of participants in the fishery it is difficult draw any meaningful conclusions from this result.

30 Observer and Logbook Program
6.3.6.3 Mesh Effects
Four net mesh categories were defined from the fishing activities observed on the tropical east-coast. Three mesh categories were recorded while observing fishing activities targeting barramundi (medium and large mesh categories together with the mixture category when medium and large mesh nets were fished together), with an additional mesh category recorded from fishing activities targeting “mixed estuary”.
The number of bycatch species and the proportion of the total catch varied little between mesh categories (Table 7). The lowest proportion of bycatch was observed in the catches of the large mesh category (11.7%) with the highest proportion (16.6%) observed in the medium mesh category. Reasonably strong positive correlations between catch rates of bycatch and market fish were estimated for the small, large and mixture mesh categories with a weak negative correlation estimated for the medium mesh category. Mean catch rates of bycatch decreased with increasing mesh size (Figure 7) indicating the larger mesh sizes selectively captured fe wer numbers of bycatch fish.
Table 7: Summary of mesh categories, target species and number of net shots observed in the tropical east coast fisheries. The number of bycatch species observed, their percentage contribution to the total catch
and the correlation coefficients of bycatch catch rates to market catch rates are listed.
MESH CATEGORY MESH SIZE (MM)
TARGET # NET SHOTS
% BYCATCH
# BYCATCH SPECIES
CC
SMALL 102 – 114 Mixed Estuary 22 15.3 17 0.446
MEDIUM 152 – 178 Barramundi 51 16.6 14 -0.036
LARGE 191 – 216 Barramundi 42 11.7 16 0.405
MIXTURE 152 – 216 Barramundi 34 15.0 16 0.602
.008
.006
.004
.002
0.000
Mesh Category
Mea
n (+
/- 9
5% C
Ls)
Cat
ch R
ate
Small Medium Large Mixture
Figure 7: Mean (+/- 95% CLs) catch rates (fish/m/hr) of bycatch for each mesh category recorded from the tropical east coast observer program.

31 Observer and Logbook Program
The species dominance plots of bycatch composition were similar for the three mesh categories used to target barramundi (Figure 8) with no single species clearly dominating the bycatch (Table 8). Conversely, the small mesh category used by fishers targeting “mixed estuary” fish demonstrated a strong dominance by regulated (undersized) barramundi.
Table 8: Decreasing order of dominance the ten most abundant bycatch species within the East Coast barramundi and “mixed” fisheries.
SMALL MESH MEDIUM MESH LARGE MESH MIXED MESH Barramundi Soapy Jew Shark Shark Shark Shark Pufferfish Barramundi Blue Threadfin Catfish Catfish Soapy Jew Queenfish Barramundi Moonfish Scat Moonfish Pufferfish Batfish Diamond Trevally Shovelnose Blubberlip Scat Moonfish Bony Bream Scat Stingray Catfish Bream Batfish Shovelnose Blue Threadfin Grinner Moonfish Tripodfish Blubberlip Flathead Diamond Trevally Grouper Batfish
Small Mesh (102 - 127m).3 Medium Mesh (152 - 178mm)
Large Mesh (191 - 216mm) Mixed Mesh (152 - 216mm)
.2
.1
0.0
Log Species Rank
% D
omin
ance
1 2 3 4 5 6 7 8 9 101112131415
Figure 8: Dominance plots of mesh size effect on bycatch composition observed in the east-coast barramundi and mixed estuary fisheries. Mixed estuary fish are targeted with small mesh and barramundi with the medium, large and mixed mesh categories. Table 8 lists in decreasing order of dominance the ten
most abundant bycatch species.
6.3.7 Gulf of Carpentaria Set Net Barramundi and “Mixed Estuary” Fisheries
The Gulf of Carpentaria (GoC) inshore gill net fishery operates in the estuarine and shallow coastal waters extending from Slade Point on Cape York Peninsula to the Queensland-Northern Territory border. Management is administered by a combination of input and output controls including limited licensing (around 90 licences exist currently), closed seasons and areas, vessel and gear restrictions, and minimum and

32 Observer and Logbook Program
maximum size limits. Annual production from the GoC fishery is about 380 t of barramundi, 50 t of blue threadfin, 150 t of king threadfin and 15 t of grunter bream (Williams 1997).
A sliding seasonal closure of 3½ lunar cycles (beginning 7 days prior to the first major spawning moon, usually the October full moon) protects spawning aggregations of barramundi during the monsoon season. During the open fishing season, increased catchability occurs when fish become more mobile and form predictable aggregations. Each commercial net endorsement allows a fisher to operate 6 nets totalling no more than 360 m in length when fishing within creeks or rivers, or 600 m when fishing foreshores. Monofilament gill nets are used exclusively with mesh size restricted to between 162.5 and 245 mm, though market demand for small fillet product has resulted in most fishing being conducted with 162.5 and 178 mm mesh nets. Specific net characteristics such as make, colour and strength of monofilament line strength, net length and depth, and mesh hanging ratio vary with individual fisher preferences.
Operators use arrays of static gill nets to catch target species. Nets are generally set perpendicular to riverbanks or foreshores and anchored securely at both ends. Fishing occurs 24 hrs a day with soak times varying between 4 to 12 hrs depending on water temperature, tidal cycles and catch rates. Market product is generally frozen fillet form, which is sold on the domestic market usually interstate.
Though the primary target of the fishery is barramundi (Lates calcarifer), various other species are also targeted at times. Most notable are the king threadfin (Polydactylus macrochir), blue threadfin (Eleutheronema tetradactylum) and grunter bream (Pomadasys kaakan). The GoC mixed estuary fishery is operated in a similar fashion as the east coast “mixed fishery”. See Section 6.3.5 for an explanation of net setting methods. The net mesh sizes used in the GoC mixed estuary fishery are restricted to those used in the GoC barramundi fishery and the seasonal closure also applies.
6.3.7.1 Logbook Program in the Gulf of Carpentaria Barramundi Fishery
Only one fisher returned logbook data with 259 net shots being recorded. A combined total of 3 222 fish from 17 species, three mud crabs (Scylla serrata), and two estuarine crocodiles (Crocodylus porosus) were captured (Table 9). Fish from twelve species were retained for market and represented 86.0% of the total catch. Five species dominated the marketable catch; barramundi (48.1%), golden catfish Arius thalassinus (19.4%), king threadfin (6.1%), queenfish (4.5%), and blue threadfin (4.2%) (Figure 9a). The remaining seven species retained for market represented a further 3.7% of the total catch. Bycatch was estimated at 14.0% with catfish Arius spp. (3.8%) and shark Carcharhinus spp. (3.7%) the dominant species. Five species were caught but not marketed being exclusively bycatch. Fish and crabs released due to non-conformance to regulated size limits represented 1.6% of the total catch.

Barramund
i
King Th
readfi
n
Pomfret
Blue Th
readfin
Queenfis
h
Other M
arket
Regulate
d Rele
ased
Catfish
Herring
Other D
iscard
Barramund
i
Golden
Catfish
King Th
readfin
Queenfi
sh
Blue Tr
eadfin
Other M
arket
Regulate
d Relea
sed
Catfish Sha
rk
Other Disca
rd
King Th
readfin
Blue Th
readfin
Jewelfis
h
Bull Sh
ark
Barramund
i
Other M
arket
Regulate
d Relea
sed
Catfish
Steelb
ack
Other Disca
rd
55 a. 50 Marketed Catch
50 45
Perc
enta
ge o
f Tot
al C
atch45 40
40 Discarded Bycatch 35 35
b.
Discarded Bycatch
Marketed Catch
Perc
enta
ge o
f T
otal
Cat
ch30
25 30
25
20 20
1515 1010
55
0 0
0
5 10
15 20
25 30
35 40
45
50 55
Perc
enta
ge o
f Tot
al C
atch
c.
Discarded Bycatch
Marketed Catch
33 Observer and Logbook Program
Figure 9: Catch composition from a. Gulf of Carpentaria barramundi logbook program, b. Gulf of Carpentaria barramundi observer program and c. Gulf of Carpentaria mixed estuary observer program (no
logbook data was collected by fishers targeting mixed estuary fish.
6.3.7.2 Observer Program in the Gulf of Carpentaria Barramundi Fishery
The fishing activities of 4 commercial fishers were observed resulting in a total of 254 net shots being recorded. A combined total of 10,072 fish from 57 species, seven mud crabs, one turtle (Natator depressus) and five estuarine crocodiles (Crocodylus porosus) were captured (Table 9). Fish from twenty-two species were retained for market representing 86.9% of the total catch. Five species dominated the marketable catch; barramundi (36.1%), king threadfin (21.9%), black pomfret Parastromateus niger (8.0%), blue threadfin (5.7%) and queenfish (5.7%) (Figure 9b). The remaining 17 market species represented a further 9.8% of the total catch. Bycatch was estimated at 13.1% with catfish Arius spp. (5.6%) and bony bream Nematalosa erebi (2.0%) being the dominant species. No other species represented more than 1% of the total catch by number. Thirty-five species were captured but not marketed being exclusively bycatch. Fish and crabs released due to non-conformance to regulated size limits represented 1.4% of the total catch. The five estuarine crocodiles (Crocodylus porosus) and one flatback turtle (Natator depressus) were released alive after being observed entangled in nets.

34 Observer and Logbook Program
Table 9: Gulf of Carpentaria barramundi fishery: species composition and discarding rates from 259 net shots reported in the voluntary logbook program, and from 254 net shots in the observer program in the tropical Gulf of Carpentaria, Queensland. TL = Total Length, CW = Carapace Width, CL = Carapace
Length, NR = Not Regulated, P = Protected
COMMON NAME SPECIES NAME SIZE LIMIT LOGBOOK DATA (259 NET SHOTS) OBSERVER DATA (254 NET SHOTS) (cm) RETAINED DISCARDED % DISCARD RETAINED DISCARDED % DISCARD
Barramundi Lates calcarifer > 60 < 120 TL 1550 380 19.7 3631 45 1.5 Golden Catfish Arius thalassinus NR 624 0 0 240 0 0 King Threadfin Polydactylus macrochir > 60 TL 197 6 3.0 2201 69 3 Queenfish Scomberoides commersonianus > 45 TL 144 16 10.0 569 0 0 Blue Threadfin Eleutheronema tetradactylum > 40 TL 137 1 0.7 570 7 1 Jewelfish Nibea squamosa > 45 TL 72 4 5.3 172 9 5 Black Jew Protonibea diacanthus > 60 < 120 TL 18 0 0 53 0 0 Black Pomfret Parastromateus niger NR 17 31 64.6 801 0 0 Grunter Bream Pomadasys kaakan > 6 0 0 245 6 2 Shark unspecified Carcharhinus spp. NR 5 119 96 58 57 50 Mud Crab Scylla serrata > 15 CW 1 2 67 5 2 29 Giant Seapike Sphyraena jello NR 1 0 0 0 2 100 Bull Shark Carcharhinus leucas NR 0 0 134 0 0 Pumpkinhead Trachinotus blochii NR 0 0 25 0 0 Steelback Leptobramma mulleri NR 0 8 100 20 0 0 Flagtail Flathead Platycephalus indicus > 30 TL 0 0 4 3 43 Diamond Scale Mullet Liza vaigiensis NR 0 0 4 0 0 Scalloped Hammerhead Sphyrna lewini NR 0 0 4 0 0 Fingermark Lutjanus johnii > 35 TL 0 0 3 0 0 Wide Sawfish Pristis microdon NR 0 4 100 2 25 93 Tripletail Lobotes surinamensis NR 0 0 2 0 0 Goldspot Cod Epinephilus coioides > 35 < 120 TL 0 0 2 0 0 Spanish Mackerel Scomberomorus commerson > 75 TL 0 0 2 0 0 Grey Mackerel Scomberomorus semifasciatus > 50 TL 0 0 2 0 0
Catfish unspecified Arius spp. NR 0 137 100 0 560 100 Bony Bream Nematalosa erebi NR 0 62 100 0 232 100 Spotted Scat Scatophagus argus NR 0 22 100 0 49 100 Winghead Shark Eusphyra blochii NR 0 0 0 95 100 Giant Shovelnose Ray Rhinobatos typus NR 0 0 0 34 100 Spotted Eagle Ray Aetobatus narinari NR 0 0 0 28 100 Striped Scat Selenotoca multifasciatus NR 0 0 0 15 100 Spotted Shovelnose Ray Rhynchobatus djiddensis NR 0 0 0 14 100 Diamondfish Monodactylus argenteus NR 0 0 0 14 100 Moonfish Drepane punctata NR 0 0 0 7 100 Giant Herring Elops australis NR 0 0 0 7 100 Narrow Sawfish Anoxypristis cuspidata NR 0 0 0 6 100 Soapy Jew Nibea soldado > 30 TL 0 0 0 6 100 Wolf Herring Chirocentrus dorab 0 0 0 3 100 Tarpon Megalops cyprinoides NR 0 0 0 3 100 Striped Catfish Plotosid spp. NR 0 0 0 3 100 Bluetail Mullet Valamugil seheli NR 0 0 0 2 100 Milk Shark Rhizoprionodon acutus NR 0 0 0 2 100 Dwarf Sawfish Pristis clavata ???? 0 0 0 2 100 Giant Hammerhead Sphyrna mokarran NR 0 0 0 2 100 Catfish Cinetodus froggatti NR 0 0 0 1 100 Stingray Dasyatididae NR 0 0 0 1 100 Black Bream Acanthopagrus berda > 23 TL 0 0 0 1 100 Catshark Atelomycterus spp. NR 0 0 0 1 100 Giant Trevally Caranx ignobilis NR 0 0 0 1 100 Milkfish Chanos chanos NR 0 0 0 1 100 Tufted Sole Dexillichthys muelleri NR 0 0 0 1 100 Batfish Ephippid spp. NR 0 0 0 1 100 Leopard Whipray Himantura undulata NR 0 0 0 1 100 Tawny Nurse Shark Nebrius ferrugineus NR 0 0 0 1 100 Lemon Shark Negaprion acutidens NR 0 0 0 1 100 Archerfish Toxotes chatareus NR 0 0 0 1 100 Longtom Tylosurus crocodilus NR 0 0 0 1 100 Mangrove Jack Lutjanus argentimaculatus > 35 TL 0 0 0 1 100
Flatback Turtle Natator depressus P 0 0 0 1 100 Saltwater Crocodile Crocodylus porosus P 0 2 100 0 5 100
Total Number of fish 2772 450 8749 1323 Percentage of total catch 86.0 14.0 86.9 13.1
6.3.7.3 Logbook Program in the Gulf of Carpentaria Mixed Estuary Fishery.
No commercial fishers participated in this part of the project.
6.3.7.4 Observer Program in the Gulf of Carpentaria Mixed Estuary Fishery.
The fishing activities of 2 commercial fishers were observed while targeting mixed estuary fish with a total of 30 net shots observed. A combined total of 1 315 fish from 23 species and two marine turtles of two species (Chelonia mydas and Natator

Table 10: Gulf of Carpentaria mixed estuary fishery: species comp osition and discarding rates from 30 net shots in the observer program in the Gulf of Carpentaria, Queensland. TL = Total Length, CW =
Carapace Width, CL = Carapace Length, NR = Not Regulated, P = Protected COMMON AME
King Threadfin
PECIES AME
Polydactylus macrochir
SIZE LIMIT BSERVER ATA (cm) RETAINED DISCARDED
> 60 TL 663 9
HOTS% DISCARD
1 Blue Threadfin Eleutheronema tetradactylum > 40 TL 314 0 0 Jewelfish Nibea squamosa > 45 TL 91 0 0 Bull Shark Carcharhinus leucas NR 29 0 0 Barramundi Lates calcarifer > 60 < 120 TL 14 4 22 Steelback Leptobramma mulleri NR 9 54 86 Shark unspecified Carcharhinus spp. NR 9 0 0 Black Pomfret Parastromateus niger NR 6 0 0 Black Jew Protonibea diacanthus > 60 < 120 TL 3 0 0 Tripletail Lobotes surinamensis NR 2 0 0
Catfish Arius spp. NR 0 76 100 Eagle Ray Aetobatus narinari NR 0 17 100 White Spot Shovelnose Rhynchobatus djiddensis NR 0 3 100 Wide Sawfish Pristis microdon NR 0 2 100 Grey Nurse Shark Carcharius taurus P 0 2 100 Giant Shovelnose Rhinobatos typus NR 0 1 100 Milk Shark Rhizoprionodon acutus NR 0 1 100 Frogfish Cinetodus froggatti NR 0 1 100 Stingray Dasyatididae NR 0 1 100 Bombay Duck Harpodon translucens NR 0 1 100 Bluetail Mullet Valamugil seheli NR 0 1 100 Toad Fish Tetradontid spp. NR 0 1 100 Grouper Epinephelus lanceolatus > 35 < 120 TL 0 1 100
Green Turtle Chelonia mydas P 0 1 100 Flatback Turtle Natator depressus
Total Number of fish Percentage of total catch
P 0
1140 86.6
1 100
177 13.4
N S N O D (30 S )
35 Observer and Logbook Program
depressus) were captured (Table 10). Ten species were retained for market and represented 86.6% of the total catch. King threadfin and blue threadfin dominated the marketable catch representing 50.4% and 23.9% of the total catch respectively (Figure 9c). The remaining eight species retained for market contributed a further 12.4% to the total catch. Thirteen species were recorded as bycatch with catfish Arius spp. (5.8%) and steelback Leptobrama mulleri (4.1%) the dominant species. Fish released due to non-conformance to regulated size limits represented 1.2% of the total catch and included two protected grey nurse sharks Carcharius taurus that were both released alive. The two marine turtles observed caught in nets set by fishers targeting mixed estuary fish were released alive. No crocodiles, dugong or dolphins were captured or sighted within the vicinities of the fishing activities observed.
6.3.7.5 Locality and Seasonal Effects in Gulf of Carpentaria Fisheries.
Observers conducted twelve trips collecting information on GoC river fishing targeting barramundi and foreshore fishing targeting mixed estuary fish. Temporally displaced samples were collected from some locations though not others, with the number of net shots observed also varying between trips (Table 11). The bycatch component of the total recorded catch varied between trips with a low of 4.2% in the South River 2 location and a high of 29.9% at North Foreshore 2. The highest number of bycatch species (18) was recorded at North Foreshore 2, while only two bycatch species were recorded at North River 1. Correlations between catch rates of bycatch fish and catch rates of market fish did not display a consistent pattern between samples. For both samples collected from fishers targeting mixed estuary fish, catch rates of bycatch species were negatively correlated with the catch rates of market fish (Table 11). Conversely, 8 of 10 samples collected from fishers targeting barramundi had positive correlations, although most were weakly correlated, with the remaining two displaying weakly negative correlations.

36
SF 1
: May
98
SF 2 : A
ug 98
SR 1 :
Jun 9
8
SR 1 :
Jul 99
SR 1 : F
eb 00
SR 2 : Ju
l 98
SR 3 : Ju
l 98
NR 1 : Sep
98
NR 1 : Aug
99
NF 1 : S
ep 98
NF 1 : A
ug 99
NF 2 : S
ep 98
Mea
n (+
/- 9
5% C
Ls)
Cat
ch R
ate
0.000
.005
.010
.015
Samples
Observer and Logbook Program
Table 11: Summary of the locations, dates, target species and number of replicate net shot samples collected by the Gulf of Carpentaria observer program. The number of bycatch species, their contribution to the total catch and correlation coefficients (CC) of bycatch catch rates to market catch rates are given.
LOCATION DATE TARGET # NET % # BYCATCH CC SHOTS BYCATCH SPECIES
South Foreshore 1 May 1998 Mixed Estuary 22 8.8 9 - 0.13 South Foreshore 2 Aug 1998 Mixed Estuary 8 21.5 8 - 0.56 South River 1 June 1998 Barramundi 33 11.7 7 0.65
July 1999 Barramundi 33 14.1 8 0.14 Feb 2000 Barramundi 72 10.1 12 0.40
South River 2 Aug 1998 Barramundi 6 4.2 7 0.21 South River 3 Aug 1998 Barramundi 18 14.4 6 0.19 North River 1 Sept 1998 Barramundi 6 12.2 2 - 0.07
Aug 1999 Barramundi 32 14.5 14 0.28 North Foreshore 1 Sept 1998 Barramundi 20 9.1 9 0.32
Aug 1999 Barramundi 14 29.9 12 - 0.07 North Foreshore 2 Sept 1998 Barramundi 20 16.9 18 0.12
Variability was observed in the catch rates of bycatch between locations and between times for locations sampled more than once (Figure 10). The lowest mean catch rates of bycatch were estimated for trips undertaken during June and July, the coolest months of the year. Higher rates of bycatch were estimated for trips undertaken during the warmer months. Given this seasonal variability, catch rates generally remained at around a level of 0.001 and 0.003 fish/metre/hour.
Figure 10: Mean (+/- 95% CLs) catch rates (fish/m/h) of bycatch recorded for each sampling event recorded from the Gulf of Carpentaria. S: southern gulf; N: northern gulf; R: river; F: foreshore. Hashed
bars represent samples where mixed estuary fish were targeted; clear bars where barramundi was targeted.

% D
omin
ance
A . B. .5
.4
.3
.2
.1
0.0
C. D. .5
.4
.3
.2
.1
0.0
1 2 3 4 5 6 7 8 9 101 112 1 2 3 4 5 6 7 8 9 101 112
Log Species Rank
37 Observer and Logbook Program
Figure 11: Dominance plots showing the relative contribution of market and bycatch components of the total catches recorded in the observer program for tropical set net fisheries targeting A. GoC barramundi,
B. GoC mixed estuary, C. EC barramundi and D. EC mixed estuary (Market = solid dots and lines; Bycatch = hollow dots and broken lines).
Table 12: The ten most abundant bycatch species observed at each location in decreasing order of abundance for dominance plots of Gulf of Carpentaria barramundi and mixed estuary fisheries.
South River 1 South Foreshore 1 South Foreshore 2 North Foreshore 2 June 1998 July 1999 Feb 2000 May 1998 Aug 1998 Sept 1998
Bony Bream Catfish Catfish Catfish Steelback Catfish Catfish Bony Bream Bony Bream Eagle Ray Catfish Eagle Ray Sawfish King Threadfin King Threadfin King Threadfin Shovelnose Scat Barramundi Scat Barramundi Barramundi Stingray Grunter Scat Barramundi Scat Shark Pufferfish Barramundi King Threadfin Soapy Jew Shovelnose Sawfish Mullet Blue Threadfin Soapy Jew Blue Threadfin Soapy Jew Grouper Bombay Duck Moonfish
Stingray Giant Herring Shovelnose Shovelnose Sawfish Sawfish Gar Giant Herring
North River 1 North Foreshore 1 South South River 2 River 3
Sept 1998 Aug 1999 Sept 1998 Aug 1999 Aug 1998 Aug 1998
Catfish Catfish Catfish Shark Catfish Catfish Barramundi Bony Bream Shovelnose Catfish Batfish Barramundi
Shark Sawfish Shovelnose Barramundi Sawfish Diamondfish Shark Sawfish Bony Bream Scat Scat Barramundi Mullet King Threadfin Barracuda Barramundi King Threadfin Scat Archerfish Soapy Jew Stingray Wolf Herring Sole Sawfish Shovelnose
The composition of bycatch indicated selective capture by the gears used. In all

38 Observer and Logbook Program
samples, the two most abundant species represented at least 60% of the total bycatch (Figure 11). Catfish were the most abundant bycatch species in nine of the twelve samples collected (Table 12). Bony bream Nematalosa erebi (the second most abundant bycatch species overall) were a consistent bycatch component at South River 1. Regulated species released (mostly undersized barramundi and king threadfin) contributed to the bycatch of most samples, though representing only a minor proportion of the total bycatch.
6.4 Discussion of Bycatch in Net Fisheries
The low bycatch rates within the inshore gill net fisheries of Queensland indicate that the targeting of specific species is effective. As each species for market is generally targeted using particular mesh sizes, the effects of differing mesh sizes on the catch rates within each fishery could not be determined. It is interesting to note that the bycatch levels within all the net fisheries are similar (7 – 28%) even though the size ranges of species targeted differ considerably.
From the logbook and observer data it can be seen that the sea mullet fishery is effective at targeting the desired species and good use is made of some of the other estuarine fish that are also caught in large numbers. Bycatch rates are low and are comprised of many species that occur only occasionally in catches. Previous studies of sea mullet fisheries have shown through both fishery-dependent and fishery- independent methods (Hale et al. 1996, Pierce et al. 1998) that targeting of sea mullet schools is one of the most effective means of catching this species. Even with low reported bycatch rates within the fishery in Florida, where sea mullet as a percentage of total catch was calculated at 99% (Hale et al. 1996) and between 16-100% (Pierce et al. 1998), the fishery was closed due to legislation effectively banning gill net fishing throughout the state due to a community-based referendum with bycatch of sport fish as the major issue (see Hale et al. 1996 for a description of events). Based on this outcome, it would appear that it is necessary to change the public image of commercial net fisheries if they are to continue to exist in the future. The misconceptions generated in the general public of how effectively net fishers can target their selected species have become one of the major problems facing the commercial industry. The low bycatch rates and high proportion of marketable species caught in the Queensland fisheries, as demonstrated by our study, should provide a more informed basis on which the effects of net fishing on ecological systems can be debated.
The Queensland whiting fishery catches a greater number of fish species and a higher proportion of bycatch than the sea mullet fishery. The whiting fishery can be considered to be a true “mixed species” fishery. Fishers target whiting as this is the highest priced fish that they catch in southern Queensland waters, but they also expect to catch bream, sea mullet, dusky flathead and tailor of marketable quality. Along with these species there are a number of other species caught that are not targeted (such as tarpon, estuary cod and gar) that are often sold if caught. Silverbiddies are marketed in considerable quantities in NSW where about 150 t per annum are sold (Pease 1999). This represents an area where potential markets for Queensland product could be further developed. If a consistent demand for this species eventuated this would result in an approximate 40% decrease in the bycatch currently discarded in this fishery. Developing markets for

39 Observer and Logbook Program
stingrays, that are currently not utilitised at all, has the potential of reducing the amount of bycatch taken within this fishery even further.
The inshore net fisheries of southern Queensland tend to have increased catch rates during the autumn and winter and significant increases occur in the catch rates of many of the marketable species. This increase occurs at the time when there is an influx of spawning sea mullet, whiting, yellowfin bream and tailor into the lower reaches of estuaries. Increased catches in dusky flathead during winter, may be related to their increased access to littoral zones during winter night-time spring tides and is probably not related to reproductive behaviour as flathead spawn in similar areas during summer (Dredge 1976).
Another possible factor for this increase could be the preference of many fishers to fish at night. Night fishing is preferred for a number of reasons, including better product quality, interactions with the general public and the recreational fishing community are minimised and catch rates at night are generally higher than during the day. It may be that another factor is the influencing catch rates during winter is the height of the tide at night. In southern areas of Queensland the tidal range usually causes the highest night time high tide of the year to be during winter and the highest day-time tides to occur during the summer. These spring tides in winter allow a much greater access to the littoral zone during the night attracting more fish into these areas to feed. Greater numbers of fish on the banks increases the number of fish available to be caught while net fishing in these areas. During the summer, with lower night-time high tides than in winter, fish access to the littoral zone is restricted and not as many fish occupy these areas. The added effect of fish that are schooling as part of their spawning behaviour with many congregating in or around the mouths of estuaries to spawn, would provide opportunities for greater catch rates to occur.
If Queensland’s fisheries managers consider implementing an increased size limit on species such as yellowfin bream (currently 23 cm TL) sand whiting (23 cm TL) and dusky flathead (currently 30 cm TL) aligning with New South Wales legislation, there would be a good argument for an increase in the minimum mesh size used to target whiting as most whiting caught are at or just above the legal size. Kennelly and Gray (2000) showed that increasing the mesh size in the bunt and cod-end of whiting seine nets from 50 to 57mm resulted in significant increases in the length frequency of whiting caught with significant decreases in the proportion of undersized sand whiting caught. These authors did warn that such an increase in mesh size may increase the bycatch of undersized regulated species if fishers were not directly targeting sand whiting (Sillago ciliata). Management intervention to increase the minimum size of bream and flathead would also warrant consideration of the effect that this would have on the harvest fishery production.
In the tropical Queensland net fisheries our investigations showed that the fishing gears and methods employed by the fishers were selective in harvesting the nominated target species. The East Coast (EC) and Gulf of Carpentaria (GoC) inshore set net fisheries are commonly referred to as barramundi fisheries, but would be better described as multi-species fisheries as barramundi is often not the only species actively targeted. Along with barramundi, three other species are actively targeted during the fishing year– the king and blue threadfins, Polydactylus macrochir and Eleutheronema tetradactylum, and grunter bream Pomadasys kaakan. When the catch of these “additional” target

40 Observer and Logbook Program
species is considered, both the tropical EC and GoC fisheries display highly selective characteristics. Similarly, the catches of fishers targeting “mixed estuary” on the EC or in the GoC also display high selectivity. The dominance of catches by market species is better highlighted when the relatively low representation of the bycatch species in net catches is considered (Figure 8, Figure 11).
The low rates of bycatch that were established for each of the Queensland net fisheries indicates that levels of bycatch and its composition should not be an issue in relation to ecological impacts of the fisheries concerned. Generally, catch rates of bycatch are low when compared with other commercial fisheries including northern Australian prawn trawling bycatch to target weight ratios of between 3.3:1 (Harris and Poiner 1990) and 21:1 (Pender 1992) and estuary seine netting where 44% of individuals are discarded (Gray et al.). Six of the seven fisheries that were investigated would be ranked in the ten lowest “observed numbers-based discard ratios other than shrimp” as reported by the FAO (Alverson et al. 1994).
The Environment Protection and Biodiversity Conservation Act which came into place in July 2000 requires that all fisheries which export their product are examined with respect to the sustainability of the target species, bycatch species and their impacts on the environment. Sea mullet roe is the only product exported from the net fisheries examined and the sea mullet fishery that will need to meet the requirements of this Act if the export of roe is to continue. This highly targeted fishery is part of a long term monitoring project carried out by the Queensland Fisheries Service measuring the age structure of the sea mullet catch for use in age based stock assessments, has low levels of bycatch and has little impact on the environment. These sources of information should allow the sea mullet fishery to substantially meet the requirements of this Act.
Catches of protected species within all observed net fisheries was low with no capture resulting in immedia te death. We would consider that net fishing is not a major threat to any of the species encountered during the observer program however in cases where species are considered to be endangered a more directed approach to estimating the actual catch rates should be undertaken.
The issue with bycatch is often that many undersized fish of the targeted species are caught and discarded dead as a result of the capture process. Although discarding of undersized individuals was low in all the net fisheries examine we attempted to establish estimates of the fate, after discarding, of some of the more abundant species caught in these net fisheries. This was done using the undersized regulated fish and bycatch species from within the whiting fishery (this was the only fishery examined where large enough quantities of undersized fish were caught to conduct meaningful trials) with some estimates of the immediate fate of fish discarded from within the other fisheries examined during observer trips.

41 Fate Trials
7. FATE OF FINFISH DISCARDED FROM NET CATCHES
7.1 Methods for determining the fate of discarded bycatch
Fate trials were conducted to determine the mortality of individuals after capture and subsequent discarding. Fish species used in the fate trials were determined from information on bycatch species collected in the logbook and observer programs. This information precluded the use of any of the northern species in these experiments due to the very low catch rates recorded for those species of interest (undersized fish of commercial and/or recreational importance such as barramundi, blue threadfin, king threadfin, dusky flathead and grunter bream, see Chapter 6 Tables 5, 6, 9 and 10). In lieu of dedicated fate trials for northern species, the condition (alive or dead) of all net caught regulated fish was recorded at the time of release during the observer program.
In contrast, higher bycatch rates of a number of regulated species within the southern net fisheries allowed sufficient numbers to be obtained for fate trials. Fish of four species, yellowfin bream Acanthopagrus australis, dusky flathead Platycephalus fuscus, sand whiting Sillago ciliata, and silverbiddy Gerres oyeana were collected on three occasions from the catch of a commercial fisher targeting sand whiting in Tin Can Bay, Queensland. One net, 800 m long and 51 mm mesh size was set about 3 hrs after high tide along the line of the low water mark on the edge of seagrass and sandbanks. After most of the water had drained off the bank, fish were collected from the net starting at one end and working towards the other.
As this experiment was designed to estimate the mortality of fish after their removal from a net by commercial operators, only the commercial fisher removed fish from the net. This usually involved the fish being forced headfirst through the meshes of the net and then being pulled free. Fish removed from the net were measured and undersized fish of the desired species as well as silverbiddies were transferred into a 200 litre holding tank half filled with water. Water exchange was carried out about every 15 minutes by replacing half of the water in the holding tank with clean water bucketed into the tank. Once approximately ¼ of the net had been cleared (30 minutes), fish from the holding tank were transferred into specially designed holding cages placed on the substratum below the low tide level. Sites were carefully selected to allow the holding cages to be placed in areas of low current flow and minimal exposure to prevailing south-east winds minimising their exposure to wave action. Fish were placed in these cages at a maximum stocking rate of 10 fish per cage for the yellowfin bream, summer whiting, and flathead and at 20 fish per cage for silverbiddies. Each cage contained only the one species. During each collection the number of each species of fish used varied and therefore the numbers of cages used in the experiment for each species differed between trips.
Two types of holding cages were used during this experiment. One type was made of a cylindrical steel frame 900 mm in diameter and 400 mm deep and covered with 5 mm square plastic mesh. This type of cage sunk to the bottom resting on the substratum. The other cage type floated, had PVC framing and was covered with 1 mm mesh with overall dimensions being the same as for the sinking cage type. Over the three days of each experiment, each cage was checked daily and any dead or near dead fish removed. Experiments were carried out during February, April and July 2000 to determine seasonal influence on the mortality rates with changes in water temperatures. Water

42 Fate Trials
temperature and tidal height were recorded every 5 minutes using a Vemco datalogger placed in the bottom of one of the sinking cages over the three days of each experiment.
These data were analysed using a linear regression with a maximal model of site (time in net)+ fish length + cage type + season. Because of the unbalanced nature of the sample numbers over different times, higher order interactions were not analysed. For yellowfin bream, whiting and dusky flathead the model was reduced to season as all other factors did not significantly improve the percentage of variability explained. All major factors were included in the analysis of silverbiddy data.
Cage trials to determine the fate of discarded bycatch were carried out under “Animal Ethics Approval No: BRIBIE/24/1999”.
7.2 Results of Fate of Discarded Bycatch
7.2.1 Southern Fish Species
During the three day fate trials no undersized yellowfin bream died (n = 48 cumulative number over all three times). Undersized dusky flathead had estimated three day mortalities of 19 ± 10% (n = 58), undersized sand whiting 12 ± 5% (n = 178) and silverbiddies an estimated rate of 67 ± 4% (n = 197). Mortality rates of silverbiddies were, cage type, size and seasonally dependent. Mortality rates were highest for small silverbiddies during winter with lower mortalities occurring in the sunken cages. Undersized yellowfin bream, whiting and flathead did not show any length, cage type or seasonal variation in their mortality rates after discarding from the nets. Although no control experiments were conducted caging effects appeared small. With mortality rates expected to increase as a result of caging effect the relatively low mortality rates for sand whiting and dusky flathead indicate that for some species at least this caging effect was not large.
The survival of all the yellowfin bream indicated that post-release mortalities due to capture and handling are probably low. This is important as about half the yellowfin bream caught in the sea mullet and whiting fisheries are discarded because they are under the legal size. Broadhurst et al. (1999) reported negligible mortalities in yellowfin bream 30 days after simulated escape from a Nordmore-grid guiding panel designed to exclude bycatch from trawl fisheries. Many of the yellowfin bream were removed from gill nets tail- first as their body morphology makes gilled fish easier to remove this way rather than forcing the whole fish forwards through the net. Bream caught in net fisheries are unlikely to experience the same physical stresses as trawl caught fish. The static use of gill nets does not cause crushing of each individual as the net is hauled and a reduced time out of the water probably help reduce this mortality.
Mortality rates of undersized dusky flathead caught in gill nets were estimated at 19 – 10% of discarded fish. Discarding rates of undersized flathead peak in winter with 10 – 2 fish/shot and are much lower, 2-5 fish/shot, for the other seasons (Figure 4g). Mortalities may be higher than this over a longer time period as abrasions and scale loss caused by removal from the net were evident in all fish surviving the three day trial.
Mortalities of discarded undersized sand whiting were estimated to be 8-17%. Undersized sand whiting were reported to be discarded at 2-7% (Table 3). Highest catch

43 Fate Trials
rates of undersized whiting were recorded during winter with an estimated 15 – 3 fish/shot caught. During other seasons, between 1-5 fish/shot were caught. Kennelly and Gray (2000) estimated a 40% mortality rate for undersized summer whiting (< 25 cm FL in NSW) held in laboratory conditions for 24 days after being caught and gilled in 50 mm mesh nets. These authors noted that the greatest mortality rates were recorded between the 5th and 11th days of the experiment by which time 36.3% had died. This higher rate of mortalities occurred at a time long after our experiment was terminated. It is feasible that the mortality rate of sand whiting would have continued to increase had our experiment been run for a longer time period as abrasion and scale loss from around the maximum girth of net caught whiting was evident in all individuals caged.
Silverbiddies showed considerably higher three day mortalities than any of the three regulated fish species investigated. With high three-day mortalities of 67 – 4% it would appear that the majority of silverbiddies caught and then discarded in the whiting fishery would die soon after release. With winter catches of this species being high (430 – 126 fish/shot) it would appear that better use could be made of these net captures. Being soft bodied, with scales that are easily shed and being susceptible to gill meshing in a 51 mm net many of the silverbiddies removed from the net are already in poor condition or dead. Silverbiddies held in the cages were observed to shed many scales presumably because of their continued contact with the sides of the cage while daily checks on fish condition were carried out.
7.2.2 Tropical Inshore Net fisheries
Though dedicated fate trials were not conducted on fish species discarded from the tropical net fisheries, observed on board commercial vessels recorded the condition of every fish released because of legal size constraints or because of the species protected status. Some patterns worthy of mention were observed within bycatch composition of both the EC and GoC fisheries.
For the barramundi and mixed estuary fisheries observed on the east coast, four categories of mesh size were defined and their effects on bycatch composition and bycatch catch rates were investigated. Within the GoC, the fishing activities observed were mostly conducted with nets of 165 and 178 mm mesh size with a minor amount of fishing effort with larger mesh nets (216 mm) occurring irregularly. As such, mesh size was considered to remain fixed between locations, times and target species allowing the effect of each of these factors on bycatch composition to be considered.
The commercial fishers who voluntarily participated in this project did so on the condition that absolute catch rates of market species and the specific locations fished would be confidential. As such, any discussion of market catch components do not present absolute catch rate information, and the locations where fishing was observed will be referred to as general areas.
7.2.2.1 Observed fate of discarded fish from Tropical East Coast Fisheries
In the EC barramundi fishery, a total of 31 captured fish from two species were returned to the water as regulated individuals (Table 13). None of the three regulated blue threadfin captured were alive when released, while all but one of the 28 regulated

44 Fate Trials
barramundi were live when released. The discard rates (proportion of the total number of fish from each species captured that had to be released due to non-conformance to size limits) of both species was very low (4.3% of the barramundi caught and 1.1% for the blue threadfin (Table 13)). The twenty-four mud crabs observed entangled in nets were all released alive. A single grey nurse shark (a protected species in Australian waters) was released alive after being observed entangled in a net.
Thirty regulated fish from three species were captured during the observed target fishing for mixed estuary species on the Queensland East Coast (Table 13). All 15 of the blue threadfin captured were dead when released, while all 14 barramundi and the single grunter bream were live when released. Discard rates were low for blue threadfin (6.0%) and grunter bream but high for barramundi (93.3%).
Table 13: Regulated species observed caught in the tropical inshore net fisheries showing size limits, % of each species discarded due to non-conformance to these limits, the total number of fish captured and the
% of discarded fish that were alive when returned to the water.
SPECIES SIZE LIMITS % DISCARD # REGULATED % ALIVE AT
EC BARRAMUNDI
Min Max FISH RELEASE
Lates calcarifer 58 120 4.3 28 96.4 Eleutheronema tetradactylum 40 na 1.1 3 0Scylla serata 15 77 24 100Carcharias taurus Protected 100 1 100
EC MIXED ESTUARY Eleutheronema tetradactylum 40 na 6.0 15 0Lates calcarifer 58 120 93.3 14 100 Pomadasys kaakan 30 na 11.1 1 100
GoC BARRAMUNDI Polydactylus macrochir 60 na 3.0 69 36.2Lates calcarifer 60 120 1.2 45 88.9Nibea squamosa 45 na 5.0 9 55.6Eleutheronema tetradactylum 40 na 1.2 7 0Pomadasys kaakan 40 na 2.4 6 100Platycephalus indicus 30 na 20.0 1 100Lutjanus argentimaculatus 35 120 100 1 100
GOC MIXED ESTUARY Polydactylus macrochir 60 na 1.3 9 22.2Lates calcarifer 60 120 22.2 4 75.0 Epinephelus lanceolatus 35 120 100 1 100Carcharias taurus Protected 100 2 100
7.2.2.2 Observed fate of discarded fish in the Gulf of Carpentaria Fisheries
In the GoC barramundi fishery, a total of 138 fish from seven species were returned to the water as regulated individuals. The discard rates of each of the regulated species was generally very low (Table 13), with regulated king threadfin and barramundi the most frequently captured. The survival rates recorded displayed species specificity with the blue and king threadfins recording the lowest survival rates (36.2% and 0% respectively, Table 13). Undersized barramundi were much more robust to capture in the nets with 88.9% of fish alive when released.

45 Fate Trials
Fishers captured 14 individuals from three species that were size-regulated fish when targeting mixed estuary species in the Gulf of Carpentaria (Table 13). Of the 9 undersized king threadfin caught only two were released from the net and returned to the water alive. Four barramundi were captured with one fish exceeding the maximum size limit. This fish was tagged and released alive by the fisher. One of the three under sized barramundi was dead when returned to the water. One Queensland Grouper that also exceeded the maximum size limit for the species was captured and released alive. Two captured grey nurse sharks were also released alive from the netsFrom the direct observation of the fate of discards it is clear that softer bodied fish with small scales (blue threadfin, king threadfin and jewelfish) are likely to have high mortality caused by the capture process alone. This indicates that future stock assessments of threadfins should take the discarding rates as added fishing induced mortality. This is in direct contrast to more robust species with large scales, such as barramundi and banded grunter, that have a high probability of being discarded alive. Estimating the post-release mortality for barramundi would require a directed fishing independent study to collect undersized fish with gill nets as commercial catches rates of undersized barramundi are too low for sufficient numbers to be collected for valid trials to be carried out. Very few specimens of protected species were observed caught with all being released alive.

46 Fishery Independent Survey
8. FISHERY-INDEPENDENT SAMPLING
8.1 Methods
8.1.1 Site Selection Procedures
Our design objective was to collect samples that were as similar as possible except for the fact that they were from commercially gill netted versus not commercially gill netted rivers. Extraneous sources of variation were minimised in the design process. Primary temporal sources of variation were identified as tidal cycles/moon phases, seasons, and known spawning seasons of target fish species. Spatial sources of variation included rainfall distribution patterns, proximity to offshore features, latitudinal changes in tidal range, and catchment features. These parameters interacted across the study area (Figure 12) generating a complex set of environmental conditions.
Closed river systems selected as candidate rivers were all pre-existing and had been closed to commercial netting for a minimum of 5 years. Paired river systems (open and closed) were selected using the physical characteristics of their catchments. These were: (1) area of catchment/length of main channel, (2) land elevations, (3) direction of river course with respect to the coast, (4) land use and extent of native riparian habitat, and (5) extent and characteristics of mangrove wetlands. One pair of rivers in three geographic regions (north, middle and south) were selected. The three geographic regions were distinguished from one another by average annual rainfall (Table 14).
8.1.2 Characteristics of the research nets.
In each study system, two identical “fleets” of gill nets were used to sample upstream and downstream sites simultaneously. Each “fleet” consisted of two identical/replicate 102 mm and 152 mm mesh nets, together with a single 51 mm mesh net and a smaller mesh multi-panel net. The multi-panel net comprised panels of 19 mm, 25 mm and 32 mm mesh joined end to end to make one continuous net. Each net was constructed by hanging the mesh panels on 12 mm cored float and lead line. The cored lead line weighed 0.4 kilograms/metre, and was sufficiently heavy to ensure each net fished from the substrate to the surface at each site. The cored float line was supplemented with small torpedo floats at a spacing of 1.5 metres. Specifications of nets are given in Table 15. All research activities were carried out under “General Fisheries Permit No: 5900”, “General Fisheries Permit No: PRM00686F” and “Animal Ethics Approval No: BRIBIE/22/1999”.
8.1.3 Sampling periods
Survey sampling was undertaken every second month from March 1998 until March 2000 and unfortunately could not be uniformly structured with respect to lunar phase (Table 16). The Bowen to Cairns region has a semi-diurnal tidal cycle with the unusual characteristic of having larger high tides at night during the summer months and larger high tides during the day throughout the winter months. As effective sampling with fixed gill nets is not possible during large tidal flows, the “best set” of neap tides available within each second calendar month was chosen for the sampling.

47 Fishery Independent Survey
8.1.4 Sampling Regime
On each sampling day, the replicate 102 mm and 152 mm mesh nets were set at each of the upstream and downstream sites from a research netting vessel between 1430 and 1500 hrs. Soak time for these large mesh nets was ~6 hrs with all nets being retrieved as close to 2100 hrs as possible. Large mesh nets were set predominantly off deep eroded banks with a distance of at least 100 m between each net, so the possible competition or interaction between the nets was assumed to be negligible. Where possible, the nets were also staggered from opposing banks at the sites. One end of the net was fixed securely to the bank (usually by the float line being tied to the base of a large mangrove), the net was then deployed perpendicularly to the bank (and hence, tidal flow). The outer end of the net was fixed in position by attaching an anchor and chain with 15 m of line to the float rope allowing the mesh panels to be vertically suspended in the water. Light-sensitive strobe lights marked the extreme ends of all nets in the hours of darkness. During each sampling trip we tried to maintain a high degree of site fidelity by setting all nets as near as possible to the same location.
In order to avoid catching excessively large catches of shoaling bait-fishes, such as clupeids and engraulids, the 51 mm and multi-panel nets were “fished” for one hour either side of dusk. For the daytime soak, both nets were set between 1630 and 1700 hrs and retrieved between 1730 and 1800 hrs. The nets were re-set for the night-time soak between 1830 and 1900 hrs, with final retrieval between 1930 and 2000 hrs.
Table 14: Summary of site evaluations for riverine estuaries selected for use in the fishery-independent sampling program.
Criteria Units Russell Hull Haughton Barrattas Yellow Gin Nobbies Inlet
Region North North Middle Middle South South Commercial net fishing policy
Closed Open Closed Open Closed Open
Sampling locations Side branch west of confluence of Rivers
& Maturo Inlet
West branch & lower main branch
Main channel Short Cut & main
channel Sugarloaf & Saltwater
Creek branches Cape Creek
Latitude Deg/Min S 17o 14' 18o 00' 19o 15' 19o 25' 19o 45' 19o 50' Longitude Deg/Min E 145o 58' 146o 05' 147o 08' 147o 17' 147o 35' 147o 45'
Basin name Basin Russell-Mulgrave Tully Haughton Haughton Don Don
Receiving waters Coral Sea Coral Sea Bowling Green Bay
Bowling Green Bay Upstart Bay Upstart Bay
Aspect of Flow upstream to down west - east nw to se south to north south to north west to east south to north
Main navigable channel
kilometres 7 9 15 10 15 12
Obstructions low weir low weir low weir
Maximum Elevations
metres 250 100 50 50 50 50
Topography Rolling hills Rolling hil ls Flat Flat Flat Flat
Land use Sugar cane / National
Park Sugar cane / National
Park Cattle grazing /
sugar cane Cattle grazing / sugar
cane Cattle grazing / sugar
cane Cattle grazing /
sugar cane
Native communities Rainforest Rainforest
Dry eucalypt / salt flats / intermittent
lagoons
Dry eucalypt / salt flats / intermittent
lagoons
Dry eucalypt / salt flats / intermittent
lagoons
Dry eucalypt / salt flats /
intermittent lagoons
Mangrove habitat Diverse Diverse Rhizophora / Avicennia
Rhizophora / Avicennia
Rhizophora / Avicennia
Rhizophora / Avicennia
Wetland width in km at:
1 km from mouth 0.5 1 4 3 1.5 1
3 km from mouth 2.5 2.5 2.5 2.5 2.4 3 10 km from mouth na na 2.5 0.5 fringe fringe

Table 15: Specifications of the gill nets used in the fishery-independent study. (Note the 19, 25 and 32 mm mesh panels were hung end to end to make one continuous multipanel net of 38.1 m long).
Mesh Size Ply # meshes # meshes Hanging Fishing Depth Fishing Length (mm / inches) deep long Ratio (m) (m)
152 6 40 33 650 0.4 4.6 38.5 102 4 24 50 500 0.4 4.7 21.2 51 2 16 50 950 0.5 2.2 24.1 32 1 ¼ 12 100 700 0.6 2.5 12.7 25 1 8 100 910 0.6 2.0 13.2 19 ¾ 6 100 1120 0.6 1.5 12.2
Table 16: Dates and site sampling sequences of the 13 fishery-independent sampling trips. After the second trip, a rest day was incorporated into the sampling program (dates shown shaded). Abbreviations are: Sth, southern rivers; Mid, middle rivers; Nth, northern rivers; O, open to commercial net fishing; C,
closed to commercial net fishing; Q, quarter moon; NEW, new moon.
Trip No. 1 Date:
Location: Moon:
16-Mar-98 Sth-O
17-Mar-98 Sth-C
18-Mar-98 Mid-O
19-Mar-98 Mid-C
20-Mar-98 Nth-O
21-Mar-98 Nth-C LAST Q
2 13-May-98 Nth-C
14-May-98 Nth-O
15-May-98 Mid-C
16-May-98 Mid-O
17-May-98 Sth-O
18-May-98 Sth-C
LAST Q 3 27-Jul-98
Mid-O 28-Jul-98
Mid-C 29-Jul-98
Sth-O 30-Jul-98
Sth-C 31-Jul-98
FIRST Q
1-Jul-98 Nth-O
2-Jul-98 Nth-C
4 23-Sep-98 Nth-C
24-Sep-98 Nth-O
25-Sep-98 26-Sep-98 Sth-O
27-Sep-98 Sth-C
28-Sep-98 Mid-O
29-Sep-98 Mid-C FIRST Q
5 19-Nov-98 Mid-C NEW
20-Nov-98 Mid-O
21-Nov-98 Sth-O
22-Nov-98 Sth-C
23-Nov-98 24-Nov-98 Nth-C
25-Nov-98 Nth-O
6 18-Jan-99 Sth-O NEW
19-Jan-99 Sth-C
20-Jan-99 Mid-C
21-Jan-99 Mid-O
22-Jan-99 23-Jan-99 Nth-C
24-Jan-99 Nth-O
7 5-Mar-99 Sth-O
6-Mar-99 Sth-C
7-Mar-99 Mid-O
8-Mar-99 Mid-C
9-Mar-99 10-Mar-99 Nth-C LAST Q
11-Mar-99 Nth-O
8 4-May-99 Nth-C
5-May-99 Nth-O
6-May-99 7-May-99 Mid-C
8-May-99 Sth-O
9-May-99 Mid-O LAST Q
10-May-99 Sth-C
9 17-Jul-99 Nth-C
18-Jul-99 Nth-O
19-Jul-99 20-Jul-99 Sth-O
FIRST Q
21-Jul-99 Sth-C
22-Jul-99 Mid-O
23-Jul-99 Mid-C
10 13-Sep-99 Nth-C
14-Sep-99 Nth-O
15-Sep-99 16-Sep-99 Mid-C
17-Sep-99 Mid-O
18-Sep-99 Sth-O
FIRST Q
19-Sep-99 Sth-C
11 9-Nov-99 Mid-O
10-Nov-99 Mid-C
11-Nov-99 Sth-O
12-Nov-99 Sth-C
13-Nov-99 14-Nov-99 Nth-C
15-Nov-99 Nth-O FIRST Q
12 10-Jan-00 Sth-O
11-Jan-00 Sth-C
12-Jan-00 Mid-C
13-Jan-00 Mid-O
14-Jan-00
FIRST Q
15-Jan-00 Nth-C
16-Jan-00 Nth-O
13 9-Mar-00 Sth-O
10-Mar-00 Mid-C
11-Mar-00 Sth-C
12-Mar-00 Mid-O
13-Mar-00
FIRST Q
14-Mar-00 Nth-C
15-Mar-00 Nth-O
48 Fishery Independent Survey

49 Fishery Independent Survey
8.1.5 Checking Nets
The replicate large mesh nets were checked for the presence of fish in the meshes every 1 to 1.5 hrs after setting. This check frequency enabled captured animals to be released alive after processing. On each net check, the entire length of each net was “run” from the research vessel with all captured animals removed. Checking of each net was most effectively achieved by hand-hauling the vessel along the net. This method prevented dragging or moving the net from the fixed position.
As the smaller mesh nets were “fished” for discrete periods, checking was achieved by retrieving the nets back aboard the research vessel and removing all captured animals by hand.
8.1.6 Fish Removal and Identification
In order to minimise the effects of the research netting on the fish fauna present at the sites, as many as possible of the captured fish were released after identification and measuring. To prevent unnecessary damage to the fish, net shears were used to cut any tight meshes that were caught behind the operculum. Most species of fish captured could be identified in the field. In cases of uncertainty, photographs were taken or a specimen retained for later identification in the laboratory.
8.1.7 Design of sampling program
The final design (Figure 12) integrated the dynamics associated with the six selected rivers into four spatial and temporal factors: • Region. Three regions defined by environmental factors that changed across the
latitudinal gradient, including rainfall, tidal range, and distance to the Great Barrier Reef: (a) northern sector (Cardwell to Cairns), (b) middle (Giru to Cardwell), (c) southern (Bowen to Giru).
• Fishing. Two fishing policies relative to commercial net fishing closures: (a) rivers closed to commercial net fishing versus (b) rivers open to commercial net fishing.
• Position. Two sites in each river encompassing habitat changes along the estuarine gradient: (a) upstream sites near the source of freshwater inflow (5 – 7 km from the mouth), and (b) downstream sites within 1 km of the mouth.
• Trip. Bimonthly sampling encompassing the temporal variation expected in the region over at least two years.
Throughout the text the spatial factors above are used to reference each site (ie north – open –upstream (Hull River) = NOU, north – closed – downstream (Russell River) = NCD, middle – closed-downstream (Haughton River) = MCD, mid-open-upstream (The Barrattas) = MOU, south-closed-upstream (Yellow Gin Creek) = SCU and south-opendownstream (Nobbies Inlet) = SOD.
8.1.8 Environmental Parameters
During the first year of sampling a HYDROLAB� datasonde 3 datalogger was deployed at the downstream site of each river during sampling that recorded water temperature, salinity and dissolved oxygen at 5 minute intervals. During the second year of sampling, two dataloggers were used in each river one at the upstream and one at the downstream site.

Cairns Russell/Mulgrave Rrs (cl)
Hull R (o)
Townsville
Haughton R (cl)
The Barrattas (o) Yellow Gin Creek (cl)
Nobbies Inlet (o)
0 400 Bowen
Kilometres Mackay
50 Fishery Independent Survey
Figure 12: Map of study area showing pairs of open and closed riverine estuaries: North: Russell/Mulgrave (closed) versus Hull (open); Middle: Haughton (closed) vs Barrattas (open); South:
Yellow Gin (closed) vs Nobbies Inlet (open).
8.1.9 Statistical Analysis
The range of mesh sizes used in the research gill nets effectively targeted different segments of the fish species population, and analyses were conducted separately for each mesh size. The experimental design was a complete factorial structure with three geographic regions (north, middle, south), two fishing policies regarding commercial net fishing (open, closed), two positions along the estuarine gradient (upstream, downstream), 13 points in time (bimonthly), with two replicates each time (n = 312 samples). All 3-way interactions were estimated with 4 and 5-way interactions pooled into the respective error lines. Key variables chosen for analyses were: diversity measures (four indices and number of species), total abundance and total biomass of all fish, and abundance and biomass of the 20 most common species. Calculations of diversity indices were made using the PRIMER version 5.2.2 computer software package and the following indices used.
Margelef Species Richness Index d = S - 1 / ln N Shannon-Wiener Diversity Index: H' = - �i pi(ln pi) Pielou's Evenness Index J' = H'(observed) / H' max
Simpson's dominance Index SI = �i pi 2

51 Fishery Independent Survey
In these equations for diversity measures, symbols represent: number of species (S); number of individuals (N); and proportion of total species count arising from the ith species (pi). These measures of diversity are the most commonly used indicators of community conditions in ecology (Clarke and Warwick 1994).
8.1.10 Model development and testing
Prior to analyses, catch data (fish per sample) were natural log (x + 0.5) transformed and biomass data (grams per sample) were square root (x + 0.5) transformed (Yamamura 1999). The post-analysis residuals were inspected graphically, and checked for skewness, normality and homogeneity of variances. Some problems remained due to an inflated zero-class for some species, but these analyses were accepted as they represent true data patterns, which were largely accommodated by the fitted model. In reporting results, main effect and interaction means were all back-transformed from the natural log and square root scales (with the bias-correction adjustment, Kendall et al. 1983) to the original scale (fish per sample).
Consistently across these data sets for different mesh sizes, split-plot analyses of repeated measures over time (using AREPMEASURES in Genstat, Payne et al. 1993) showed a reasonably degree of autocorrelation. The Greenhouse-Geisser epsilon averaged 0.35, and this overall value was applied as a constant correction factor to the degrees of freedom below the split (ie for time related factors) (Greenhouse and Geiser 1959). This factor was applied to all analyses (rather than using individual epsilons, as these tended to be inconsistent).
For the final model, the covariate soak time was added. It was included for all models to provide a consistent adjustment method for all reported means. Adequate degrees of freedom existed to accommodate this. Exploratory analyses trialed a second covariate, tide phase. This had little correlation with catch rates and caused estimation problems due to its partial aliasing with other design factors, and so was omitted in the final model.
Post hoc multiple comparison tests were conducted for all F-tests which were significant at the 5% level. The LSD (Least Significant Difference) multiple comparison method was used to compare each treatment mean to every other treatment mean (Milliken and Johnson 1992).
8.1.11 Multivariate Analyses
Multivariate statistics were used to identify patterns among the sites based on assemblages of fishes caught by each mesh type us ing PRIMER version 5.2.2. The square root of abundance for the 20 most abundant species averaged over time (n = 12 sites) was used in the analyses for each net type. A similarity matrix based on Bray-Curtis indices representing species abundances was calculated. These values were used in cluster analyses, using group average linking, to separate spatial groups. Significance of these spatial groups was tested using one way analysis of similarities (ANOSIM). SIMPER analysis was carried out to identify the species determining the spatial groups. For each species this analysis calculates the ratio of average contribution to similarity between groups to the standard deviation of similarity between groups. The higher the

52 Fishery Independent Survey
value of the discrimination index the more useful the species is for discriminating between groups.
Multidimensional scaling (MDS) was used to ordinate and view the spatial relationships identified in the cluster analysis. MDS is a procedure that iteratively rearranges points from the similarity matrix to generate graphs that can be visually inspected for gradients along the axes and clusters among sites. The MDS procedure uses established techniques of numerical optimisation to compress coordinates from higher to lower multidimensional space while still maintaining the relationships in the original higher dimensional matrix to the maximum degree possible (Clarke and Warwick 1994). A matrix representing 20 species at 12 sites would generate a plot in 20 dimensions, and thus be impossible to visually inspect and evaluate for patterns. The MDS procedure produces a 2 - or 3-dimensional graph based on the original relationships in 20 dimensional space and then calculates a measure of goodness of fit (or stress) between the original and reduced configurations of points. The lower the stress value the better the fit. If the stress level was less than 0.20, the plots were inspected for the possible influences of the three main effects (region, fishing, and position).
8.2 Results of Intensive Fishery Independent Survey
8.2.1 Overall Catch
The cumulative total catch in all nets from the 13 sampling trips was 24 908 fish, with one-third more specimens caught in the closed rivers than in the open rivers (Appendix 1). Furthermore, of the 10 350 kg of fish caught, the biomass from closed systems was twice that caught in the open systems. The number of species (141 overall) was not significantly different between rivers open to net fishing (111 species) versus closed systems (129 species). The three most abundant species in rivers closed to net fishing were Herklotsichthys castelnaui, Lates calcarifer, and Thryssa hamiltoni. In the open rivers, H. castelnaui was also most abundant, followed by T. hamiltoni, and Arius spp.
The total number of species caught in an individual river ranged from 75 at Yellow Gin Creek (south closed) to 94 in the Russell River (north closed) (Table 17). Abundance ranged from 3,304 fish netted in Nobbies Inlet (south open) to 5,607 in the Russell River (north closed). Biomass ranged from a low of 738 kg again at Nobbies Inlet (south open) to a high of 2,757 kg in the Haughton River (mid closed).
8.2.2 Environmental Conditions
Water temperature remained above 20o C throughout the period, with no north to south differences detected over the 400 km study area (Table 18). The water temperature ranged by about 12o C in all the rivers. Highest salinities were recorded at the southern sites, decreasing through the middle region and being lowest in the north. Upstream sites were consistently lower than downstream salinities. Salinity patterns reflect the gradient in rainfall conditions from the rainy north to the drier south as recorded at rain gauges near the study sites (Figure 13). Each pair of rivers lies within a similar rainfall

Table 17: Comparison of species numbers, abundance and biomass for the six estuarine river systems sampled in the fishery-independent study.
Region Fishing River Position No. Abundance Biomass (kg) Species
North Closed Russell Upstream 63 2,978 939
Downstream 78 2,629 1,149
All 94 5,607 2,088
North Open Hull Upstream 58 2,284 603
Downstream 61 1,192 334
All 78 3,476 938
Middle Closed Haughton Upstream 61 2,292 1,885
Downstream 65 1,368 872
All 85 3,660 2,757
Middle Open Barrattas Upstream 59 1,879 803
Downstream 64 1,981 636
All 77 3,860 1,439
South Closed Yellow Gin Upstream 57 2,341 1,497
Downstream 63 2,624 894
All 75 4,965 2,390
South Open Nobbies Upstream 59 1,278 379
Downstream 76 2,062 359
All 90 3,340 738
53 Fishery Independent Survey
region, and this design feature is reflected in the observed salinity trends. Similar temporal patterns were evident between pairs of rivers within regions over most of the months. Salinity fell dramatically in direct response to storms and at the onset of the rainy season (Figure 14 a, b & c).
Following major storm events, we observed run-off laden with silt from the surrounding catchments washing into the rivers. Consequently, oxygen levels occasionally dropped below the 4 mg/L concentration level considered critical to survival of fishes and other fauna and fish kills were observed (e.g. March 1999) (Table 14).

Table 18: Summary of environmental conditions for each of the river systems in the fishery-independent study as measured using a Datasonde3 datalogger. The number of samples varied due to the deployment of only one hydrolab on some of the trips.
Region Fishing River Position Temperature Salinity Dissolved Oxygen (mg/L) Average Minumum Maximum Samples Average Minumum Maximum Samples Average Minumum Maximum Samples
North Closed Russell Upstream 25.8 22.6 29.6 159 12.4 0.2 34.1 159 7.1 3.4 14.3 91 Downstream 25.9 22.8 29.1 48 16.3 0.6 34.1 48 6.1 4.6 7.6 32
North Open Hull Upstream 26.4 23.3 29.8 48 12.3 0.1 26.3 48 5.4 3.6 6.5 32 Downstream 26.4 20.9 30.8 152 17.2 0.1 31.0 152 5.8 4.3 7.4 72
Middle Closed Haughton Upstream 27.8 23.8 31.8 48 15.5 0.2 36.9 48 6.2 4.8 8.6 32 Downstream 27.0 20.0 31.1 160 25.7 3.9 39.2 160 5.6 4.3 6.6 80
Middle Open Barrattas Upstream 28.0 23.7 31.3 48 17.6 0.6 37.4 48 5.5 3.2 9.2 32 Downstream 27.2 22.8 30.9 152 24.4 3.6 38.6 152 6.9 2.7 13.1 80
South Closed Yellow Gin Upstream 27.5 23.8 31.3 48 18.0 0.5 40.6 48 6.1 4.6 8.1 32 Downstream 26.0 22.5 30.8 144 28.2 3.0 39.0 144 6.3 1.8 13.6 80
South Open Nobbies Upstream 27.4 23.0 31.3 48 29.8 12.3 41.4 48 5.4 3.4 8.2 32 Downstream 26.6 21.6 31.5 160 33.6 16.7 42.7 160 6.1 2.9 13.0 94
Overall 26.8 20.0 31.8 20.9 0.1 42.7 6.0 1.8 14.3

Jan 98
Feb 9
8
Mar 98Apr 9
8
May 98Jun
98 Jul 98
Aug 98Sep
98Oct 9
8Nov
98Dec 9
8Jan
99Fe
b 99
Mar 99Apr 9
9
May 99Jun
99 Jul 99
Aug 99Sep
99Oct 9
9Nov
99Dec 9
9Jan
00Fe
b 00
Mar 00
Jan 98
Feb 9
8
Mar 98Apr 9
8
May 98Jun
98 Jul 98
Aug 98Sep
98Oct 9
8Nov
98Dec 9
8Jan
99Fe
b 99
Mar 99Apr 9
9
May 99Jun
99 Jul 99
Aug 99Sep
99Oct 9
9Nov
99Dec 9
9Jan
00Fe
b 00
Mar 00
Jan 98
Feb 9
8Mar 9
8Apr
98
May 98Jun
98 Jul 98
Aug 98Sep
98Oct 9
8Nov
98Dec 9
8Jan
99Fe
b 99Mar 9
9Apr
99
May 99Jun
99 Jul 99
Aug 99Sep
99Oct 9
9Nov
99Dec 9
9Jan
00Fe
b 00Mar 0
0
0
200
400
600
800
1000
1200
1400
1600
1800
2000
Rai
nfal
l (m
m)
a. North
0
100
200
300
400
500
600
700
800 R
ainf
all (
mm
) b. Mid
0
100
200
300
400
500
600
700
800
Rai
nfal
l (m
m)
c. South
Figure 13: Monthly rainfall by station (South: Home Hill, Middle: Giru, North average of Tully and Babinda). Source: Australian Bureau of Meteorology (2000).
Dis
solv
ed O
xyge
n Sa
linity
Te
mpe
ratu
re (C
)
20
22
24
26
28
30
32
34
0
7
14
21
28
35
42
a. North b. Mid c. South
9
8
7
6
5
4
3
2
1
0
Mar
98
May
98
Jul 9
8Se
p 98
Nov
98
Jan
99M
ar 9
9M
ay 9
9Ju
l 99
Sep
99N
ov 9
9Ja
n 00
Mar
00
Mar
98
May
98
Jul 9
8Se
p 98
Nov
98
Jan
99M
ar 9
9M
ay 9
9Ju
l 99
Sep
99N
ov 9
9Ja
n 00
Mar
00
Mar
98
May
98
Jul 9
8Se
p 98
Nov
98
Jan
99M
ar 9
9M
ay 9
9Ju
l 99
Sep
99N
ov 9
9Ja
n 00
Mar
00
55 Fishery Independent Survey
Figure 14: Average/trip temperature, salinity and dissolved oxy gen concentrations recorded by datalogger with readings taken every five minutes while nets were fishing at the downstream sites. A. Northern
rivers Russell River closed to net fishing = circles, Hull River open to net fishing = triangle. B. Haughton River closed to net fishing = circles, Barrattas River open to net fishing = triangles. C. Yellow Gin Creek
closed to net fishing = circles, Nobbies Inlet open to net fishing = triangles.

56 Fishery Independent Survey
8.2.3 Variance in Fish Catch
The mesh size of the research nets dictated the size portion of the overall population sampled (Figure 15). Catch in the multipanel nets was comprised of 13 750 fish from 91 species, with the majority of fish in the 50 -100 mm fork length (FL) range. Over 65% of the fish numbers caught in these fine mesh nets were Herklotsichthys castelnaui and Thryssa hamiltoni. The 51 mm mesh nets caught 3 560 fish from 62 species, mostly in the range 150 – 300 mm FL. Most of the fish caught in these nets were from the families Mugilidae and Ariidae. Catches in the 102 mm mesh nets were dominated by catfish (Arius spp.) and barramundi (Lates calcarifer), and the overall catch of 5 916 fish was from 68 species, most in the 150 to 500 mm size range. Barramundi dominated the catch in the 152 mm mesh nets. The 1 682 fish sampled in these large mesh nets were from 52 species representing a wide range of fish sizes, peaking in abundance in the 600 to 800 mm length range. Due to these selective sampling features, further analyses were conducted on catches from each mesh size separately.
Multipanel n = 13,750
0
500
1000
1500
2000
2500
3000
3500
2 inch n = 3,560
Fre
quen
cy
0
100
200
300
400
500
600
700
4 inch n = 5,916
0
50
100
150
200
250
300
6 inch n = 1,682
0
10
20
30
40
50
10 50 100
150
200
250
300
350
400
450
500
550
600
650
700
750
800
850
900
950
1000
Length Category (mm)
Figure 15: Length-frequency histograms for fish caught in each net-type used in the fishery-independent study pooled for all rivers.
152 mm mesh Nets. The broad size range of fish (150 – 1520 mm) captured in these large mesh nets included massive, deeper bodied species. Of the 52 species caught, the seven most abundant represented over 72% of the total catch. Taxa included sharks, barramundi, trevally, grunters, threadfins, scats and the occasional ray (Table 19).

Fishery Independent Survey 57
Total abundance and species diversity were significantly greater (P < 0.001) in the closed than open systems for all comparisons (Table 20, Figure 16). Although the statistical analysis indicated a significant interaction among spatial factors (Fishing*Position*Region, P < 0.001), closed rivers had significantly greater biomass for each pair of systems than the open rivers (Figure 17a).
Table 19: Total catch for 152 mm nets for all 13 sampling periods during the fishery independent study.
Family Species Abundance Biomass (gr)
Length Range (mm)
Family Species Abundance Biomass (gr)
Length Range (mm)
Centropomidae Lates calcarifer 527 2,141,627 385-1020 Elopidae Elops australis 3 2,584 440-461 Ariidae Arius spp. 156 267,511 215-735 Sphyrnidae Sphyrna lewini 3 2,270 356-470 Carcharhinidae Carcharhinus leucas 144 148,356 590-1520 Carangidae Scomberoides tala 3 1,693 311-395 Polynemidae Eleutheronema tetradactylum 143 226,416 240-900 Tetraodontidae Tetraodontidae 2 4,100 420 Carangidae Scomberoides
commersonianus 140 284,612 355-990 Platycephalidae Platycephalus fuscus 2 3,240 590-660
Ephippidae Drepane punctata 110 52,938 200-380 Haemulidae Pomadasys argenteus 2 2,615 280-520 Sciaenidae Nibea soldado 72 22,337 220-400 Mugilidae Valamugil buchanani 2 2,357 370-440 Polynemidae Polydactylus macrochir 69 351,575 438-860 Platycephalidae Platycephalus indicus 2 1,658 500 Carangidae Caranx ignobilis 48 55,501 256-545 Haemulidae Pomadasys sp. 2 679 265-285 Haemulidae Pomadasys kaakan 44 92,922 283-630 Echeneidae Echeneis naucrates 2 16 143-157 Carangidae Trachinotus blochi 24 48,878 290-720 Serranidae Epinephelus lanceolatus 1 13,001 1000 Leiognathidae Leiognathus equulus 21 3,899 160-235 Dasyatidae Himantura granulata 1 5,821 600 Mugilidae Liza vaigiensis 20 61,937 500-650 Sphyraenidae Sphyraena barracuda 1 5,195 1160 Haemulidae Plectorhynchus gibbosus 19 55,299 365-680 Dasyatidae Himantura sp. 1 3,545 500 Carcharhinidae Carcharhinus sp. 13 11,971 650-1000 Carangidae Gnathanodon speciosus 1 2,156 520 Scatophagidae Scatophagus argus 13 9,144 255-340 Chanidae Chanos chanos 1 1,156 430 Mugilidae Mugil cephalus 12 30,987 480-620 Rhinobatidae Aptychotrema rostrata 1 885 750 Megalopidae Megalops cyprinoides 11 11,967 320-490 Dasyatidae Himantura uarnak 1 883 300 Scatophagidae Scatophagus multifasciatus 9 4,679 220-345 Ephippidae Platax orbicularis 1 869 315 Lutjanidae Lutjanus johnii 8 22,697 515-880 Sparidae Acanthopagrus berda 1 505 270 Tetraodontidae Arothron hispidus 8 17,222 320-515 Ephippidae Platax novemaculeatus 1 436 232 Carangidae Alectis indicus 8 7,537 265-500 Carcharhinidae Rhizoprionodon acutus 1 368 575 Lutjanidae Lutjanus argentimaculatus 6 10,406 405-520 Chirocentridae Chirocentrus dorab 1 360 445 Tetraodontidae Arothron reticularis 6 9,040 300-442 Clupeidae Nematalosa come 1 323 235 Stromateidae Parastromateus niger 6 7,510 300-360 Sciaenidae Otolithes ruber 1 318 320 Myliobatidae Aetobatus narinari 6 6,763 390-540 Ephippidae Platax teira 1 316 205
Total 1682 4,021,081
a. Margalef's Species Richness Index
1.0 0.8
0.7
b. Shannon-Wiener Diverstiy Index
0.4 0.3
0.20.2 0.1
0 0
Open Closed Open Closed
1.2 1
0.9
J' pe
r sa
mpl
e D
per
sam
ple
0.8
Fish
per
sam
ple
H' p
er sa
mpl
e
0.6
0.5
0.4
0.6
d. Total Abundance
0.2 2
0.1 1
0 0
Open Closed Open Closed
c. Pielou's Evenness Index 0.8 8
0.7 7
0.6 6
0.5 5
0.4 4
0.3 3
Figure 16: Diversity indices (± 1 SE) and overall abundance (± 1 SE) for catch in the 152 mm mesh nets. Significant effects (P < 0.001) were consistent among sites and for all trips.

Gra
ms
per
sam
ple
Gra
ms
per
sam
ple
30000
24000
18000
12000
6000
0
5
4
Fish
per
sam
ple
3
2
1
0
20000
16000
12000
8000
4000
0
Open Closed Open Closed Open Closed Open Closed Open Closed Open Closed
Open Closed Open Closed Open Closed Open Closed Open Closed Open Closed
a. Biomass all species
b. Abundance of Barramundi
c. Biomass of Barramundi
abc a
f
d
c c bc ab
ef
g
g
de
abc e
a cd cde
g g
de f
bcd ab
h
ab
cd
a bc bc
f
bc bc ab
g
ef de
Open Closed Open Closed Open Closed Open Closed Open Closed Open Closed
Upstream Downstream Upstream Downstream Upstream Downstream
South Region Mid Region North Region
58 Fishery Independent Survey
Figure 17: a. Total biomass (all species) (± 1 SE), caught in the 152 mm mesh nets where significant effects of fishing were found. Letters indicate significant differences for LSD = 0.05.
Nine species were selected for detailed analysis due to their high abundance. The ANOVA results indicated highly significant (P < 0.001) effects of fishing for three species (barramundi, estuary whalers Carcharinus leucus and queenfish Scomberoides commersonianus) and in each case, closed systems had greater abundance and biomass levels. For barramundi, the most abundant species caught in the 152 mm mesh nets, closed rivers consistently had greater abundance and biomass levels (Figure 17b and c). Although barramundi less than 750 –800 mm were commonly captured in both open and closed rivers, very few barramundi larger than 800 mm were caught in the open rivers (Figure 18).

Tot
al N
umbe
r T
otal
Num
ber
Tot
al N
umbe
r T
otal
Num
ber
Tot
al N
umbe
r T
otal
Num
ber 30 Open
24 Closed North Upstream
12
6
0
40
30
18
Mid Upstream
20
10
0
12
9
6
3
0
50
40
30
20
10
0
12
9
6
3
0
12
South Upstream
North Downstream
Mid Downstream
9 South Downstream
6
3
0
430-
480
481-
530
531-
580
581-
630
631-
680
681-
730
731-
780
781-
830
831-
880
881-
930
931-
980
> 9
81
Total Length (mm)
59 Fishery Independent Survey
Figure 18: Length-frequency of barramundi caught with 152 mm mesh nets. Dashed line indicates minimum legal length. Note change in scale on some figures.
For queenfish and estuary whalers, spatial variations generated some inconsistent patterns among open versus closed systems (Figure 20). In most comparisons, however, closed systems had greater numbers and biomass (Figure 19 a and b). The occurrence of estuary whalers was highly seasonal (Figure 20). In the northern and middle region rivers, abundances increased in January 1998; but in January 1999 the peak abundance occurred in the southern closed river alone (Yellow Gin). These peaks in abundance were the result of the seasonal pattern of pupping and use of these riverine systems as nursery areas with few sharks being caught at other times of the year. The observed effect of fishing in this case may be an artefact of the sampling design as the times that these small sharks were caught in all samples was during the annual commercial netting closure (from November to February see Section 6.3.4.1). Therefore it is reasonable to assume that the seasonal changes in abundance were much greater than the effect of fishing on this species.

Gra
ms p
er sa
mpl
eG
ram
s pe
r sa
mpl
e
2000
1600
1200
800
400
0
1200
900
600
300
0
Open Closed Open Closed Open Closed Open Closed Open Closed Open Closed
a. Biomass: Queenfish
b. Biomass: Estuary Whaler
b
a
c
d
c
b
ab
f
ab
cd
e
bc
d
ab a bcd
a a a aa a
ab ab
Open Closed Open Closed Open Closed Open Closed Open Closed Open Closed
Upstream Downstream Upstream Downstream Upstream Downstream
South Region Mid Region North Region
60 Fishery Independent Survey
Figure 19: Biomass (± 1 SE) of queenfish and estuary whalers caught in the 152 mm mesh nets. Letters indicate significant differences for LSD = 0.05.
Mar 98
May 98
Jul 98
Sep
98Nov
98 Jan
99
Mar 99
May 99
Jul 99
Sep 99
Nov 99
Jan 00
Mar 00
Mar 98
May 98
Jul 98
Sep
98Nov
98 Jan
99
Mar 99
May 99
Jul 99
Sep 99
Nov 99
Jan 00
Mar 00
Mar 98
May 98
Jul 98
Sep 98
Nov 98
Jan 99
Mar 9
9
May 99
Jul 99
Sep 99
Nov 99
Jan 00
Mar 0
0
0
0.5
1.0
1.5
2
Fish
/ s
ampl
e
a. North
0
0.5
1.0
1.5
2.0
2.5
3
Fish
/ sa
mpl
e
b. Mid
0
0.5
1.0
1.5
2.0
2.5
3
Fish
/ s
ampl
e
c. South
Figure 20: Abundance of estuary whalers caught in the 152 mm mesh nets showed significant effects (P < 0.001) of fishing. Circles = Closed, Triangles = Open.

61 Fishery Independent Survey
Gra
ms p
er sa
mpl
e G
ram
s per
sam
ple
2
1.5
1.0
0.5
0
0.5
0.4
0.3
0.2
0.1
0
Open Closed Open Closed Open Closed Open Closed Open Closed Open Closed
Open Closed Open Closed Open Closed Open Closed Open Closed Open Closed
a. Blue Threadfin Abundance
b. Banded Grunter Abundance
ab a
abc
cd
bc
c
ab
c
b
e
d
cd
ab
a
abab
a ab
ab ab
ab
ab ab ab
Upstream Downstream Upstream Downstream Upstream Downstream
South Region Mid Region North Region
Figure 21: Abundances (± 1 SE) of blue threadfin and banded grunter caught in 152 mm mesh nets. Significant effects of fishing were found for blue salmon (P < 0.04) but not for banded grunter (P < 0.32).
Significant three-way interactions were found among the spatial factors (fishing, position, region, P < 0.05) for both of these commercial species. Letters indicate significant differences for LSD = 0.05.
For blue threadfin Eleutheronema tetradactylum, an important market species, effects of fishing were significant (P = 0.044), but inconsistently among the sites (Figure 20). One sampling site (south-closed-upstream) had high abundances of this species during the winter (Figure 21a). Banded grunter Pomadasys kaakan, showed a similar abundance pattern: ie among all the sampling sites, two had very high numbers (Figure 21b). Both of these sites were located in the southern region, with one site closed (upstream) and the other open (downstream).

Table 20: Summary of split plot analysis of variance for catch in the 152 mm mesh nets with Fishing (F), Position (P) and Region (R) as main effects, and Tripno (T) as repeated effect. Interactions abbreviated as F*P etc. Significance of effects designated as *** for P < 0.001; ** for P < 0.01; * for P < 0.05.
Net – Data type Parameter
152 mm mesh - Diversity Indices Margelef Species Richness
Fishing
***
Position Region
***
Spatial Parameters F*P F*R P*R F*P*R Tripno
*
T*F Temporal/Temporal*Spatial Parameters
T*P T*R T*F*P
*
T*F*R T*P*R
Shannon-Wiener Diversity *** ** * *
Pielou's Evenness Simpson's Dominance
*** ** *
*
Total species *** *
152 mm mesh - Abundance Data Total Abundance *** * * * Arius spp. ** ** ** ** *
Carcharhinus leucas Eleutheronema tetradactylum
*** *
*** **
** ***
** *
*** **
* * *
Lates calcarifer Leiognathus equulus
*** * *** *
*** * * *
Liza vaigiensis Nibea soldado
* * *
* * * *
Pomadasys kaakan Scomberoides commersonianus ***
*** **
** **
* *
152 mm mesh - Biomass Data Total catch *** ** * *** * Arius spp. ** *** ** ** *** * *** **
Carcharhinus leucas Eleutheronema tetradactylum
*** *** ** **
** *
* ***
* * * *
Lates calcarifer Leiognathus equulus
*** *** ** *
*** * *
Liza vaigiensis Nibea soldado
* *
* * *
Pomadasys kaakan Scomberoides commersonianus ***
*** ***
** ***
* **

Table 21: Comparisons of groups identified by cluster analysis by the top three discriminating species based on SIMPER analyis of species data.
Comparison of Probability from Main Contributing Species (discrimination value) Abundance Data ANOSIM test
152mm mesh net Cluster G1 vs G2 0.029 Barramundi (3.49), King threadfin (3.33) Queenfish (1.89) G2 vs G3 0.036. Barramundi (2.06), Soapy Jew (2.30), Queenfish (1.89) G1 vs G3 0.008. King threadfin (2.30), Blue threadfin (1.62), Estuary whaler (1.62)
Open vs Closed 0.017 Queenfish (1.77), Giant trevally (1.77), Barramundi (1.57)
102mm mesh net Cluster North vs 0.002 Leiognathus equulus (4.69), Scomberoides tala (3.22), Megalops cyprinoides (2.13) Middle/South combined
51mm mesh net Cluster G1 vs G2 0.002 Liza subviridis (2.09), Thryssa hamiltoni (1.79), Blue threadfin (1.71) G2 vs G3 0.143 n.s. G1 vs G3 0.167 n.s.
Multi panel net Cluster G1 vs G2 0.002 Liza subviridis (2.33), Herklotsichthys castelnaui (1.68) Thryssa hamiltoni (1.58)
63 Fishery Independent Survey
Fish Community Distribution Patterns from 152 mm Mesh Net Catches
Cluster analysis (Figure 22a) and the resulting MDS ordinations of the 20 most abundant species caught in the 152 mm mesh nets indicated that three groups of sites could be distinguished in the data. One group contained four sites open to net fishing (G1), the second, three sites closed to net fishing (G2) and the third, a combination of both open and closed sites (G3) at a Bray-Curtis similarity of 57% (Figure 22b). Pairwise ANOSIM showed that these three groups were significantly different in the abundances of fish caught (Table 21). Pairwise SIMPER analysis of the three groups (G1 vs G2, G2 vs G3 and G1 vs G3) showed that higher abundances of barramundi in G2 were a major contributor to the differences between G2 and both G1 and G3 with a discrimination index of 3.49 and 2.06 for each comparison respectively. Figure 22d shows the relative catch of barramundi in all 12 sites clearly indicating that the sites within G2 contained the highest abundances of barramundi. When comparing G1 versus G2, high discrimination indices were also found for king threadfin (3.33) and queenfish (1.89) both occurring in higher abundances in the G2 group of sites (Figure 22e and f). Comparing G2 and G3, barramundi (2.06), soapy jew (2.30) and queenfish (1.89) had the highest discrimination indices with barramundi and queenfish being more abundant in G2 and soapy jew having higher abundances in the G3 group of sites (Figure 22g). In the G1 vs G3 comparison, king threadfin (2.30), blue threadfin (1.62) (Figure 22h) and estuary whalers (1.62) (Figure 22i) had the highest discrimination indices. All three of these species occurred in greater abundances in the G3 group of sites.
Comparisons between sites open and closed to commercial fishing using ANOSIM indicated that there was a significant difference (P = 0.017) between the catches (Figure 22c). SIMPER analysis showed that queenfish Scomberoides commersonianus (1.77), giant trevally Caranx ignobilis (1.77) and barramundi (1.57) had the highest discrimination indices with all species being caught in greater abundances in the closed sites (Figure 22f, j and d).
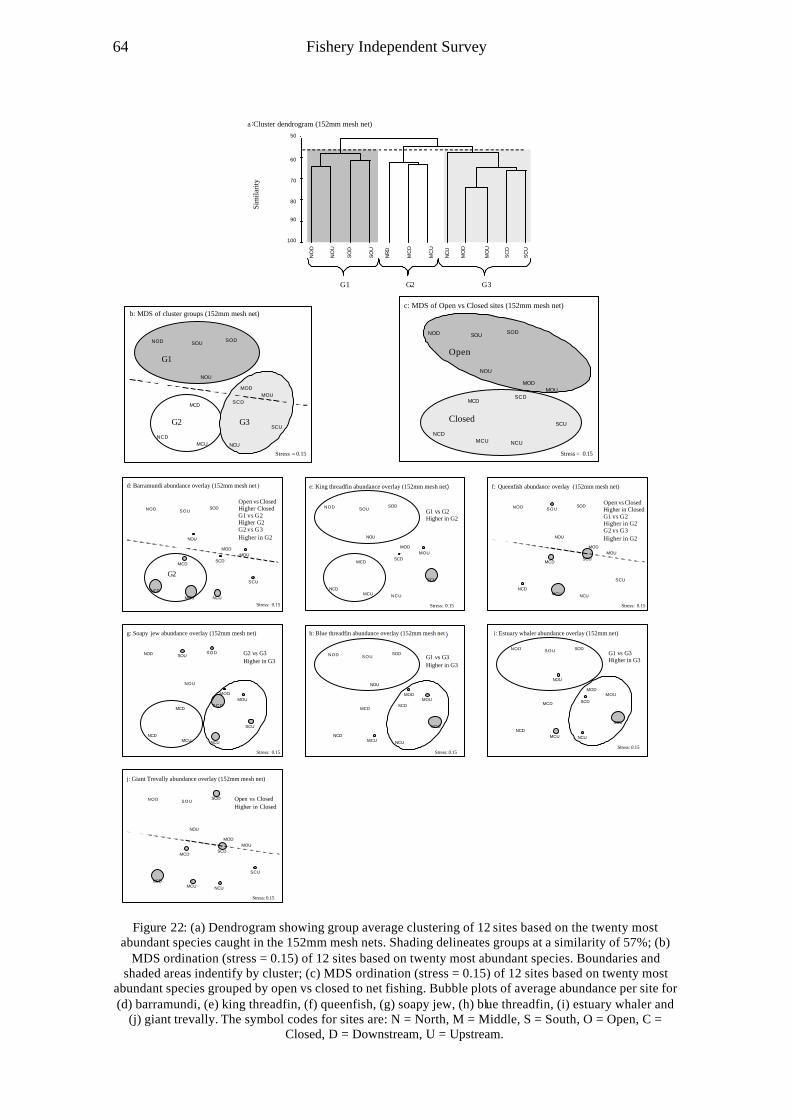
a:Cluster dendrogram (152mm mesh net) 50
100
90
80
70
60
Sim
ilarit
y
NO
D
NO
U
SO
D
SO
U
NR
D
MC
D
MC
U
NC
U
MO
D
MO
U
SC
D
SC
U
G1 G2 G3
c: MDS of Open vs Closed sites (152mm mesh net) b: MDS of cluster groups (152mm mesh net)
MOD MOU
NOD
NOU
SODSOU
Open
MCD
MCU NCD
MOD MOU
NCU
SCD
SCU
NOD
NOU
SODSOU
Stress = 0.15
G1
G3G2
MCD
MCU NCD
NCU
SCD
SCU
Stress = 0.15
Closed
d: Barramundi abundance overlay (152mm mesh net ) e: King threadfin abundance overlay (152mm mesh net) f: Queenfish abundance overlay (152mm mesh net)
NOD
NOU
SODSOU
Open vs Closed SOD
Open vs Closed NODSOD Higher Closed Higher in ClosedNOD SOUG1 vs G2 SOU
G1 vs G2 Higher G2 G2 vs G3
G1 vs G2 Higher in G2 Higher in G2 G2 vs G3
Higher in G2 NOU Higher in G2NOU
MCD
MCU
NCD
G2
MOD MODMOD
MCD
MCU NCD
MOU MOUMOU SCDSCDSCD MCD
SCUSCU SCU
NCD
NCU MCU NCUNCU
Stress: 0.15 Stress: 0.15 Stress: 0.15
g: Soapy jew abundance overlay (152mm mesh net) h: Blue threadfin abundance overlay (152mm mesh net ) i: Estuary whaler abundance overlay (152mm net)
Stress: 0.15
NCD
Stress: 0.15
NCU
MOD MOU
MCU
NOD
NOU
SODSOU
NCD
SCD
SCU
Stress: 0.15
j: Giant Trevally abundance overlay (152mm mesh net)
MOD MOU
NOD
NOU
SODSOU Open vs Closed
Higher in Closed
MOD MOU
NOD
NOU
SODSOU
NCU
SCD
SCU
SODNOD SOU G2 vs G3 G1 vs G3 G1 vs G3 Higher in G3Higher in G3 Higher in G3
MOD MOU
MCD
MCU
NOU
NCD
NCU
S C D
SCU
MCD MCD
MCU
MCD
MCU NCD
SCD
SCU
Stress: 0.15
NCU
64 Fishery Independent Survey
Figure 22: (a) Dendrogram showing group average clustering of 12 sites based on the twenty most abundant species caught in the 152mm mesh nets. Shading delineates groups at a similarity of 57%; (b)
MDS ordination (stress = 0.15) of 12 sites based on twenty most abundant species. Boundaries and shaded areas indentify by cluster; (c) MDS ordination (stress = 0.15) of 12 sites based on twenty most
abundant species grouped by open vs closed to net fishing. Bubble plots of average abundance per site for (d) barramundi, (e) king threadfin, (f) queenfish, (g) soapy jew, (h) blue threadfin, (i) estuary whaler and
(j) giant trevally. The symbol codes for sites are: N = North, M = Middle, S = South, O = Open, C = Closed, D = Downstream, U = Upstream.

102 mm mesh Nets. The species sampled with 102 mm mesh nets included some of the same taxa that dominated the 152 mm mesh nets, including barramundi, blue threadfin, and trevally (Table 22). Slender-bodied species were also caught such as soapy jew Nibea soldado, tarpon Megalops cyprinoides, mullets Family: Mugilidae, and milkfish Chanos chanos, as were shorter-bodied fish with substantial spines such as catfish Arius spp., archer fish Toxotes chatareus and ponyfish Leiognathus equulus. The catches from these nets are not typical of the commercial catches from within the open systems as 152 mm mesh nets are the smallest mesh size allowed to be fished in these areas (see Section 6.3.4).
Catches in the 102 mm mesh nets showed significant differences between rivers open to commercial netting and those closed to commercial netting for Margelf species richness (P < 0.01), Shannn-Wiener diversity (P < 0.001) and total number of species (P < 0.001), but Pielou’s eveness and Simpson dominance measures were only significantly different with respect to the position within the river (Table 23). Overall diversity, abundance and biomass were greater in the closed systems for each pair of systems, with the exception of the mid-down comparison (Figure 23a - e). Among the 8 species selected for detailed analysis, diamond scale mullet Liza vaigiensis was consistently more abundant in the closed sites (Figure 24a and c). Catches of ponyfish Leiognathus equulus in the closed sites were significantly greater than in open sites (Figure 24b and d). This species showed a high degree of sites selectivity with abundances being orders of magnitude higher in the northern sites.
Spec
ies p
er sa
mpl
e Fi
sh p
er s
ampl
e 60
45
30
15
0
10
8
6
4
2
0
a. Abundance all species
b. Number of species
e. Shannon-Wiener Diversity
a a
d
c bc bc
bc
a bc b
d
c
a
ef
a
b
def
c c b b b
c
bc bc a
f bcd de e
ab de e
cdab
a
ef
g
bcd bc def f
b cde
a b
d
bc
bc d a
g c cd
f b a
cd e f
c. Biomass all species
d. Margalef's Species Richness
H' p
er s
ampl
e G
ram
s per
sam
ple
50000
40000
30000
20000
10000
0
3
D' p
er sa
mpl
e
2
1
0
2
1.5
1.0
0.5
0
Open Closed Open Closed Open Closed Open Closed Open Closed Open Closed
Upstream Downstream Upstream Downstream Upstream Downstream
South Region Mid Region North Region
Figure 23: Catches in the 102 mm mesh nets had significant effects of fishing (P < 0.01) for several community indicators (a – e). Levels at sites closed to net fishing were generally greater than open sites.
Letters indicate significant differences for LSD = 0.05.
65 Fishery Independent Survey

66 Fishery Independent Survey
0
0.2
0.4
0.6
0.8
1.0
1.2
Fish
per
sam
ple
0
1
2
3
4
5
6
7
8
Fish
per
sam
ple
a. Diamond scale mullet abundance b. Ponyfish abundance
a a a a
b
c
Open Closed Open Closed Open Closed Open Closed
South Mid North
0
300
600
900
1200
1500
Gra
ms
per
sam
ple
0
300
600
900
1200
1500
Gra
ms
per
sam
ple
c. Diamond scale mullet biomass d. Ponyfish biomass
a a a a
b
c
Open Closed Open Closed Open Closed Open Closed
Mid NorthSouth
Figure 24: Catches (± 1 SE) in the 102 mm mesh nets for a.diamond scale mullet abundance b. ponyfish abundance, c. diamond scale mullet biomass and d. ponyfish biomass were greater in the closed than open
systems. Letters indicate significant differences for LSD = 0.05.
Table 22: Catch composition for 102 mm mesh nets from all sites on all sampling trips during the fishery independent sampling.
Family Species Abund ance
Biomass (gr)
Length Range (mm)
Family Species Abundan ce
Biomass (gr)
Length Range (mm)
Ariidae Arius spp. 1,537 1,351,470 190-620 Sparidae Acanthopagrus australis 5 1,680 220-250
Centropomidae Lates calcarifer 1,057 1,648,670 290-820 Gerreidae Gerres abbreviatus 5 1,331 185-220
Leiognathidae Leiognathus equulus 785 122,659 75-215 Sphyraenidae Sphyraena jello 4 11,615 114-1430
Polynemidae Eleutheronema tetradactylum 297 402,645 220-635 Toxotidae Toxotes sp. 4 1,387 250-260
Scia enidae Nibea soldado 271 125,171 215-475 Soleidae Achlyopa nigra 4 927 195-230
Mugilidae Liza vaigiensis 256 411,675 280-650 Carangidae Carangidae 3 1,417 295-305
Haemulidae Pomadasys argenteus 247 112,664 165-495 Chirocentridae Chirocentrus dorab 3 1,319 405-495
Haemulidae Pomadasys kaakan 232 140,923 160-530 Carangidae Trachinotus blochi 3 1,095 193-290
Megalopidae Megalops cyprinoides 192 222,391 175-525 Tetraodontidae Arothron manilensis 3 637 195-240
Carangidae Scomberoides commersonianus 192 128,667 230-705 Sphyraenidae Sphyraena sp. 3 371 105-395
Carangidae Caranx ignobilis 118 64,760 25-1040 Mugilidae Valamugil seheli 2 4,542 455-535
Mugilidae Mugil cephalus 105 133,537 325-580 Tetraodontidae Arothron reticularis 2 3,317 380-386
Polynemidae Polydactylus macrochir 102 254,228 340-740 Mugilidae Valamugil sp. 2 2,784 420-625
Carangidae Scomberoides tala 55 33,950 280-510 Platycephalidae Platycephalus indicus 2 2,595 510-645
Toxotidae Toxotes chatareus 55 22,814 230-320 Carangidae Scomberoides sp. 2 2,241 380-515
Mugilidae Valamugil buchanani 31 66,078 400-600 Carcharhinidae Carcharhinus ambionensis 2 1,161 670
Lutjanidae Lutjanus argentimaculatus 30 26,321 300-430 Serranidae Epinephelus coioides 2 1,115 355-362
Chanidae Chanos chanos 29 31,292 265-510 Sillaginidae Sillago analis 2 762 320-333
Scombridae Scomberomorus semifasciatus 23 12,325 315-440 Batrachoididae Halophryne diemensis 2 638 235-285
Lutjanidae Lutjanus johnii 19 14,141 190-615 Sciaenidae Sciaenidae 2 564 285
Engraulidae Thryssa hamiltoni 19 1,771 165-225 Gerreidae Gerres filamentosus 2 379 200
Ephippidae Drepane punctata 18 3,961 130-320 Leptobramidae Leptobrama mulleri 2 322 250-260
Scatophagidae Scatophagus multifasciatus 17 3,606 140-212 Teraponidae Mesopristes argenteus 2 261 155-240
Monodactylidae Monodactylus argenteus 17 2,025 145-180 Serranidae Epinephelus lanceolatus 1 4,947 730
Mugilidae Mugilidae 16 27,794 410-490 Sphyraenidae Sphyraena barracuda 1 4,135 1,060
Scatophagidae Scatophagus argus 15 4,818 150-335 Stromateidae Parastromateus niger 1 1,664 355
Lactariidae Lactarius lactarius 14 5,491 210-385 Rhinobatidae Aptychotrema rostrata 1 1,101 505
Sparidae Acanthopagrus berda 12 4,030 220-265 Mugilidae Valamugil cunnesius 1 1,044 380
Tetraodontidae Arothron hispidus 9 11,512 240-485 Serranidae Epinephelus malabaricus 1 831 390
Carcharhinidae Carcharhinus leucas 9 9,708 630-1200 Carcharhinidae Rhizoprionodon acutus 1 766 510
Mugilidae Liza subviridis 9 4,485 198-390 Carangidae Caranx sexfasciatus 1 755 335
Haemulidae Plectorhynchus gibbosus 8 16,040 245-610 Haemulidae Pomadasys sp. 1 607 335
Clupeidae Nematalosa come 8 2,893 210-315 Carangidae Caranx bucculentus 1 548 275
Platycephalidae Platycephalus fuscus 6 6,730 495-640 Centropomidae Psammoperca waigiensis 1 522 340
Elopidae Elops australis 6 5,120 320-506 Carangidae Carangoides hedlandensis 1 303 226
Carangidae Trachinotus bailloni 6 2,603 235-320 Siganidae Siganus lineatus 1 290 225
Leiognathidae Leiognathus sp. 6 30 80 Bothidae Pseudorhombus sp. 1 245 220
Clupeidae Nematalosa erebi 5 3,106 265-350 Gerreidae Gerres oyena 1 220 210
Toxotidae Toxotes jaculatrix 5 2,508 250-285
Total 5,916 5,505,049

Table 23: Su mmary of split plot analysis of variance for catch in 102 mm mesh nets with Fishing (F), Position (P) and Region (R) as main effects, and Trip no (T) as repeated effect. Interactions abbreviated as F*P etc. Significance of effects designated as : *** for P < 0.001; ** for P < 0.01; * for P < 0.05.
Net - Data type Parameter Fishing Position Region
Spatial Parameters F*P F*R P*R F*P*R Tripno T*F T*P
Temporal/Temporal*Spatial Parameters T*R T*F*P T*F*R T*P*R
102 mm mesh - Diversity Margelf Species Richness Shannon-Wiener Diversity
** ***
*** **
** ***
* *
*
Pielou's Evenness Simpson Dominance
*** *
* **
* * * *
Total species
102 mm mesh - Abundance Data
*** ** *** ** *** *** ** * **
Total Abundance Arius sp.
*** *** ***
*** *** *** **
** *** ***
**
Eleutheronema tetradactylum Lates calcarifer
* ***
** ***
* ** *
** *** *
* ** *
Leiognathus equulus Liza vaigiensis
* **
** **
*** * *** *
*
Nibea soldado Pomadasys argenteus * ***
*** ***
* * *
*
Pomadasys kaakan
102 mm mesh - Biomass Data
** *
Total Catch Arius sp.
*** *** ***
*** *** *** **
* * ***
** *
*
Eleutheronema tetradactylum Lates calcarifer
** ***
* *
** ***
** *** ***
*** ***
** *** ***
Leiognathus equulus Liza vaigiensis
** **
*** **
*** *
** *** *
Nibea soldado Pomadasys argenteus * ***
*** ***
* *
Pomadasys kaakan *** *

68 Fishery Independent Survey
Abundance and biomass of barramundi were greater in the closed rivers than in the open rivers for all comparisons except at the mid-downstream pair of sites which had similar numbers (Figure 25 a and b). The majority of barramundi caught in the 102 mm mesh nets were less than the legal size limit of 580 mm (Figure 26). Closed systems had greater numbers for all size classes quite consistently, but barramundi abundance varied widely over the study period (Figure 27). For example, at the mid-closed site where we consistently caught numerous barramundi (> 20 per trip), the September 1999 catch of this species was zero.
For blue threadfin, a valuable commercial and recreational species, statistically significant effects of fishing (P = 0.042) were confounded by complex spatial and temporal patterns (Table 23). The middle region had higher abundances in the open river sites during May 1998 and March 1999 when peak abundances were caught (Figure 28). Conversely, the southern region had higher levels in the closed system during the peak months of May 1998 and July 1999. Notably, however, abundances in the southern region were about 4 times the level in the middle region. Significantly lower numbers of blue threadfin were caught in the northern region than elsewhere.
1 2
1 0
8
6
4
2
0
2 0 0 0 0
1 5 0 0 0
1 0 0 0 0
5 0 0 0
0
Open Closed Open Closed Open Closed Open Closed Open Closed Open Closed
Open Closed Open Closed Open Closed Open Closed Open Closed Open Closed
a. Barramundi abundance
b. Barramundi biomass
a b
c
d
c
a a
e
a
c c c
a
de dede
f
e
a
bc cd
b
a
b
Upstream Downstream Upstream Downstream Upstream Downstream
South Region Mid Region North Region
Gra
ms p
er sa
mpl
e Fi
sh p
er sa
mpl
e
Figure 25: Total abundance (± 1 SE) and total biomass (± 1 SE) of barramundi caught by site in the 102 mm mesh nets. In all cases, closed rivers had significantly greater abundances than open systems. Letters
indicate significant differences for LSD = 0.05.

0
6
12
18
24
30
Tot
al N
umbe
r
0
20
40
60
80
100
Tot
al N
umbe
r
0
6
12
18
24
30
Tot
al N
umbe
r
0
6
12
18
24
30
Tot
al N
umbe
r
0
10
20
30
40
50
Tot
al N
umbe
r
0
10
20
30
40
50
Tot
al N
umbe
r
North Upstream
Mid Upstream
South Upstream
North Downstream
Mid Downstream
South Downstream
Open
Closed
280-
330
331-
380
381-
430
431-
480
481-
530
531-
580
581-
630
631-
680
681-
730
731-
780
781-
830
Total Length (mm)
Figure 26: Length-frequency of barramundi sampled using 102 mm mesh nets, comparing open versus closed systems. Dashed line indicates minimum legal length.
Mar 98
May 98
Jul 98
Sep 98
Nov 98
Jan 99
Mar 99
May 99
Jul 99
Sep 99
Nov 99
Jan 00
Mar 00
Mar 98
May 98
Jul 98
Sep 98
Nov 98
Jan 99
Mar 99
May 99
Jul 99
Sep 99
Nov 99
Jan 00
Mar 0
0
Mar 98
May 98
Jul 98
Sep 98
Nov 98
Jan 99
Mar 99
May 99
Jul 99
Sep 99
Nov 99
Jan 00
Mar 0
0
0
3
6
9
12
Fish
/ sa
mpl
e
a. North
0
4
8
12
16
20
Fish
/ sa
mpl
e
b. Mid
0
3
6
9
12
Fish
/ sa
mpl
e
c. South
69 Fishery Independent Survey
Figure 27: Seasonal variation in the abundances of barramundi caught in the 102 mm mesh nets for the six rivers sampled. Triangles = Open, Circles = Closed.

Mar 98
May 98
Jul 98
Sep 98
Nov 98
Jan 99
Mar 99
May 99
Jul 99
Sep 99
Nov 99
Jan 00
Mar 00
Mar 98
May 98
Jul 98
Sep 98
Nov 98
Jan 99
Mar 99
May 99
Jul 99
Sep 99
Nov 99
Jan 00
Mar 00
Mar 98
May 98
Jul 98
Sep 98
Nov 98
Jan 99
Mar 99
May 99
Jul 99
Sep 99
Nov 99
Jan 00
Mar 00
0
0.25
0.50
0.75
1
Fish
/ s
ampl
e
a. North
0
1
2
3
4
5 Fi
sh /
sam
ple
b. Mid
0
2
4
6
8
10
Fish
/ s
ampl
e
c. South
Figure 28: Seasonal abundance of blue threadfin caught in the 102 mm mesh nets by river. Triangles = Open, Circles = Closed.
Fish
per
sam
ple
Gra
ms
per
sam
ple
5
4
3
2
1
0
3
2.5
2.0
1.5
1.0
0.5
0
Open Closed Open Closed Open Closed Open Closed Open Closed Open Closed
a. Spotted Grunter abundance
b. Banded Grunter abundance
cd
ab
e
f
a
cd
abc
d
abc
abc bcd bcd
abc
ab
abc
ab
bc
ab a
ab
ab
abc
de
a
Open Closed Open Closed Open Closed Open Closed Open Closed Open Closed
Upstream Downstream Upstream Downstream Upstream Downstream
South Region Mid Region North Region
Figure 29: Abundance of spotted grunter and banded grunter caught in 102 mm mesh nets by river and position. Letters indicate significant differences for LSD = 0.05.
70 Fishery Independent Survey

a: Cluster dendrogram (102mm net) b: MDS of cluster groups (102mm net)
Sim
ilarit
y
50
60
70
80
90
100
NO
D
NC
D
NO
U
NC
U
MC
D
SO
D
SO
U
MC
U
MO
D
SC
D
MO
U
SC
U
Stress: 0.08
NOD
NOU
NCD
NCU
MODMOU
MCD
MCU
SOD SOU
SCD
SCU
G1
G2
G1 G2
c: Leiognathus equulus abundance overlay (102mm net) d: Scomberoides tala abundance overlay (102mm net) e: Megalops cyprinoides abundance overlay (102mm net)
NOU
NCD
NCU
NCD
G1 vs G2 G1 vs G2 G1 vs G2 Higher in G1 Higher in G1 NOUHigher in G1
NOU NCU
NCDNCU
NCD
NODNOD
SCU SOU
MOU MOD SCU
SOD SOU
MOU MOD SCU
SND SNU
MOU MOD
SCD SOD
SYD SCD MCD
MCD MCD MCU
MCU MCU
Stress: 0.08 Stress: 0.08 Stress: 0.08
71 Fishery Independent Survey
For the two species of commercially exploited haemulids caught in the research nets (spotted grunter Pomadasys argenteus and banded grunter Pomadasys kaakan), differences between closed and open river were not statistically significant (Table 23). The distribution patterns for spotted grunter were complex, with one site (mid-upclosed) producing most of the catch (Figure 29a). Similarly, banded grunter were widely distributed but markedly abundant at only two sites (south-open-upstream, south-closeddownstream) (Figure 29b).
Fish Community Distribution Patterns from 102 mm Mesh Net Catches
Cluster analysis (Figure 30a) and the resulting MDS ordinations of the 20 most abundant species caught in the 102 mm mesh nets showed a clear separation between the northern region (G1) and the southern and middle regions at a Bray-Curtis similarity of 65%. The middle and southern regions formed a single mixed group that could not be further separated (Figure 30b). ANOSIM analyses of the northern vs middle/southern groups showed significant differences (P = 0.002) between the groups (Table 21). SIMPER analysis revealed that Leiognathus equulus, Scomberoides tala and Megalops cyprinoides had the highest discrimination indices (4.69, 3.22, 2.13 respectively) These species were most abundant in the northern sites (Figure 30c, d and e). It is interesting to note that in all three of these species, very few if any individuals were caught outside of the northern region. ANOSIM of open vs closed sites did not reveal any significant differences.
Figure 30: (a) Dendrogram showing group average clustering of 12 sites based on the twenty most abundant species caught in the 102 mm mesh nets. Shading delineates groups at a similarity of 65%; (b)
MDS ordination (stress = 0.08) of 12 sites based on twenty most abundant species. Boundaries and shaded areas identified by cluster; Bubble plots of average abundance per site for (c) Leiognathus
equulus, (d) Scomberoides tala and (e) Megalops cyprinoides. Three symbol codes for sites are: N = North, M = Middle, S = South, O = Open, C = Closed, D = Downstream, U = Upstream.

72 Fishery Independent Survey
51 mm mesh Nets. Hamilton’s anchovy Thryssa hamiltoni and bony bream Nematalosa come were abundant in catches of the 51 mm mesh nets. These nets were especially effective at catching mullet, comprising over half the catch (Table 24). Significant effects of fishing could not be detected for any of the parameters analysed (Table 25). Inconsistent patterns and temporal variation occurred for all key parameters and species as exemplified by the patterns in catfish and blue salmon (Figure 32). Temporal patterns in abundance were significant for total abundance of all species, as well as abundance of Thryssa hamiltoni, Valamugil cunnesius, Liza subviridis and Arius spp. (Figure 32).
Table 24: Total catch from the 51 mm mesh nets from all sites on all sampling trips during the fishery-independent sampling.
Family Species Abundance Biomass (gr) Length Range (mm)
Family Species Abundance Biomass (gr)
Length Range (mm)
Engraulidae Thryssa hamiltoni 683 65,048 140-240 Teraponidae Terapon jarbua 5 374 150-155
Mugilidae Valamugil cunnesius
552 75,187 119-330 Carangidae Caranx sexfasciatus 5 332 130-150
Mugilidae Liza subviridis 518 83,485 155-352 Mugilidae Mugil cephalus 4 950 221-248
Ariidae Arius spp. 374 101,766 160-419 Clupeidae Herklotsichthys koningsbergi
4 233 130-140
Clupeidae Nematalosa come 295 20,218 100-220 Lutjanidae Lutjanus russelli 4 219 140-158
Mugilidae Valamugil buchanani
272 43,949 170-370 Haemulidae Pomadasys argenteus 4 181 130-150
Mugilidae Valamugil seheli 119 25,932 180-308 Clupeidae Anodontostoma chacunda
4 141 105-130
Clupeidae Herklotsichthys castelnaui
80 3,759 73-150 Sillaginidae Sillago analis 3 545 240-280
Polynemidae Eleutheronema tetradactylum
74 32,086 170-515 Polynemidae Polynemus heptadactylus
3 485 140-212
Centropomidae Lates calcarifer 66 43,719 215-590 Scombridae Scombridae 3 14 68-72
Leptobramidae Leptobrama mulleri
58 7,777 177-300 Scatophagidae Scatophagus argus 2 726 225-235
Elopidae Elops australis 46 14,498 234-480 Lutjanidae Lutjanus argentimaculatus
2 378 155-260
Sciaenidae Nibea soldado 37 5,431 170-320 Gerreidae Gerres oyena 2 101 118-125
Leiognathidae Leiognathus equulus
35 3,926 75-220 Batrachoididae Halophryne diemensis
2 97 132-142
Sillaginidae Sillago sihama 34 5,115 208-280 Leiognathidae Gazza achlamys 2 56 100-112
Mugilidae Valamugil sp. 32 3,552 171-295 Congridae Muraenesox cinereus 1 3,278 1,330
Scombridae Scomberomorus semifasciatus
29 6,851 195-372 Ephippidae Platax batavianus 1 2,545 426
Gerreidae Gerres filamentosus
24 923 103-160 Polynemidae Polydactylus macrochir
1 2,544 565
Clupeidae Nematalosa erebi 23 1,400 100-165 Gobiidae Periophthalmus sp. 1 981 200
Carangidae Scomberoides tala 19 4,029 198-395 Tetraodontidae Arothron reticularis 1 937 320
Sphyraenidae Sphyraena jello 17 7,898 305-538 Belonidae Tylosurus crocodilus 1 405 580
Haemulidae Pomadasys kaakan 17 927 152-170 Belonidae Tylosurus sp. 1 347 574
Carangidae Scomberoides commersonianus
13 1,845 147-465 Siganidae Siganus guttatus 1 196 200
Carangidae Caranx ignobilis 11 1,754 111-392 Teraponidae Mesopristes argenteus
1 185 210
Sphyraenidae Sphyraena barracuda
9 3,496 350-505 Carangidae Scomberoides tol 1 101 230
Platycephalidae Platycephalus fuscus
9 3,380 265-520 Toxotidae Toxotes jaculatrix 1 82 155
Platycephalidae Platycephalus indicus
9 3,125 300-420 Sparidae Acanthopagrus berda 1 74 140
Chirocentridae Chirocentrus dorab
7 2,038 300-515 Lutjanidae Lutjanus sp. 1 56 160
Carangidae Scomberoides lysan
6 512 185-210 Sciaenidae Sciaenidae 1 55 197
Mugilidae Liza vaigiensis 5 6,029 204-580 Scorpaenidae Notesthes robusta 1 38 150
Megalopidae Megalops cyprinoides
5 1,026 190-330 Leiognathidae Gazza sp. 1 37 110
Sillaginidae Sillago ciliata 5 915 250-270 Siganidae Siganus lineatus 1 24 102
Plotosidae Paraplotosus albilabris
5 824 255-268 Monodactylidae Monodactylus argenteus
1 14 80
Chanidae Chanos chanos 5 637 179-250
Total 3,560 599,792

Table 25: Summary of split plot analysis of variance for catch in 51 mm mesh nets with Fishing (F), Position (P) and Region (R) as main effects, and Tripno (T) as repeated effect. Interactions abbreviated as F*P etc. Significance of effects designated as : *** for P < 0.001; ** for P < 0.01; * for P < 0.05.
Net - Data type Parameter
51 mm mesh - Diversity Indices Margelef Species Richness
Fishing Position Region Spatial Parameters
F*P F*R P*R F*P*R Tripno
***
T*F T*P Temporal/Temporal*Spatial Parameters
T*R T*F*P T*F*R T*P*R
Shannon-Wiener Diversity ***
Pielou's Evenness Simpson Dominance
** *
Total No. Species * ***
51 mm mesh - Abundance Data Total Abundance ** *** * Arius spp. * ** *
Eleutheronema tetradactylum Lates calcarifer
**
Liza subviridis Nematalosa come
* *** ***
* * *
Thryssa hamiltoni Valamugil buchanani
* *** * *
Valamugil cunnesius Valamugil seheli
* ** * *
51 mm mesh - Biomass Data Total Abundance ** *** * Arius spp. * *
Eleutheronema tetradactylum Lates calcarifer
*
Liza subviridis Nematalosa come
*** *
** *** ***
* **
Thryssa hamiltoni Valamugil buchanani ***
* * *
Valamugil cunnesius Valamugil seheli
* ** * *

a. Total number of species 6 25
5 c 20 bc
b. Total abundance
a
b b
a a
ab
Open Closed Open Closed Open Closed
Fish
per
sam
ple
Spec
ies
per
sam
ple
ab abc abc3 a
4
Fish
per
sam
ple
Fish
per
sam
ple
15
2
5 1
0 0
Open Closed Open Closed Open Closed
Mid South Mid NorthSouth North
10
c. Catfish abundance 4 2
c
d. Blue threadfin abundance
a
ab
b
a a a
Open Closed Open Closed Open Closed
South Mid
bc2
3 1.5
1.0
ab ab ab 1 a 0.5
0 0
Open Closed Open Closed Open Closed
South Mid North North
Figure 31: Catches (± 1 SE) in the 51 mm mesh nets showed no significant differences between closed and open sites. Significant two way interaction (Region x Fishing) are shown in the catches of Arius spp.
and Eleutheronema tetradactylum. Letters indicate significant differences for LSD = 0.05.
Fish
per
sam
ple
Fish
per
sam
ple
Fish
per
sam
ple
Fish
per
sam
ple
Fish
per
sam
ple 4 a.Thryssa hamiltoni
3
2
1
0
5 b. Valamugil cunnesius4
3
2
1
0
5 c. Liza subviridis
4
3
2
1
0
3 d. Ariusspp.
2
1
0
Mar
98
May
98
Jul 9
8
Sep
98
Nov
98
Jan
99
Mar
99
May
99
Jul 9
9
Sep
99
Nov
99
Jan
00
Mar
00
0
10
20
30 e. Total abundance
74 Fishery Independent Survey
Figure 32: Catches (± 1 SE) in the 51 mm mesh nets showed no significant differences between closed and open sites. Temporal variations were significant for total abundance and abundance of Thryssa hamiltoni, Valamugil cunnesius, Liz subviridis and Arius spp. Triangles = Open, Circles = Closed.

NC
U
MO
U
MC
U
MC
D
SC
U
MO
D
SC
D
NC
D
NO
U
NO
D
SO
D
SO
U
a: Cluster dendrogram (51mm net)
NOD
NOU
SOD
SOU
NCD
NCU
MOD
MOU
MCD
MCU
SCD
SCU
Stress: 0.11
b: MDS of cluster groups (51mm net)
G1
G2
G3
4 0
6 0
8 0
100
Sim
ilarit
y
G3 G1 G2
c: Thryssa hamiltoni abundance overlays (51mm net) d : Liza subvirid s abundance overlay (51mm net) e: Eleutheronema tetradactylum abundance overlay (51mm net)
G1 vs G2 G1 vs G2
MOU
MCU G1 vs G2
MOU
MCU Higher in G2 Higher in G1 Higher in G1
MOU
MCU
MOD SCD
MOD
NCD NCDMCD MCD
SCU
MCD
SCU SCU NOU
NCD
NOU NOUNCU NCU NCU
MOD SCD SCD
NOD NOD NOD S O D S O D S O D
SOU SOU
Stress: 0.11 Stress: 0.11 Stress: 0.11
SOU
75 Fishery Independent Survey
Fish Community Distribution Patterns for 51 mm Mesh Net Catches
Cluster analysis (Figure 33a) and the resulting MDS ordinations of the 20 most abundant species caught in the 51mm mesh nets showed separation into three different regions at a Bray-Curtis similarity of 53%. The first group (G1) contains all the middle region sites as well as the two southern closed sites. The second (G2) contains three northern sites and the two southern open sites, while the third (G3) is a single northern site (Figure 33b). Pairwise ANOSIM analyses of G1 vs G2 indicated that there was a significant difference (P = 0.002) with the other combination of G2 vs G3 and G1 vs G3 not being significantly different (Table 21). SIMPER analysis of G1 and G2 groups revealed that Liza subviridis (2.09), Thryssa hamiltoni (1.79) and blue threadfin (1.71) had the highest discrimination indices. Figure 33c, d and e show the relative abundances between sites for these three species with Liza subviridis and blue threadfin being more abundant in G1 while Thryssa hamiltoni was caught in higher abundances in the G2 sites. ANOSIM of open vs closed sites did not reveal any significant differences.
Figure 33: (a) Dendrogram showing group average clustering of 12 sites based on the twenty most abundant species caught in the 51mm mesh nets. Shading delineates groups at a similarity of 53%; (b)
MDS ordination (stress = 0.11) of 12 sites based on twenty most abundant species. Boundaries and shaded areas indentify by cluster. Bubble plots are MDS ordinations overlaid with the average abundance per site for (c) Liza subviridis, (d) Thryssa hamiltoni and (e) blue threadfin. Three symbol codes for sites
are: N = North, M = Middle, S = South, O = Open, C = Closed, D = Downstream, U = Upstream.

Multipanel (19/25/32 mm mesh) Nets. The catch in the multipanel nets were dominated by Herklotsichthys castelnaui (over half the catch) (Table 26). However, 90 other species were caught, far more than in any of the other nets. Herrings, ambassids, anchovies, silverbiddies, longtoms and juvenile mullet were all abundant. As with the 51 mm mesh nets, no detectable differences could be found between rivers closed and open to commercial gill netting (Table 27). For the single species showing significant differences between rivers closed and open to net fishing, Escualosa thoracata, significant seasonal and regional differences in abundance were evident (Figure 34). Regional differences in abundance were significant for 7 of the 9 species examined however abundances of each species peaked at different times of the year (Figure 34).
Fish
per
sam
ple
Fish
per
sam
ple
Fish
per
sam
ple
Fish
per
sam
ple
Fish
per
sam
ple
Fish
per
sam
ple 1 a.Escualosa thoracata
0.75
0.50
0.25
0
150 Herklotsichthys castelnauib.
100
50
0
5 c. Leiognathus equulus
4
3
2
1
0
5
4
3
2
1
0
20
15
10
5
0
400
300
200
100
0
Ambassis vachellid.
Thryssa hamiltonie.
f. Total abundance
Mar
98
May
98
Jul 9
8
Sep
98
Nov
98
Jan
99
Mar
99
May
99
Jul 9
9
Sep
99
Nov
99
Jan
00
Mar
00
76 Fishery Independent Survey
Figure 34: Catches of the most abundant species caught in the multipanel (19/25/32 mm mesh) nets. Temporal variation generated inconsistencies in fishing effects among the regions. Triangles = Open,
Circles = Closed.

Table 26: Total catch in multipanel (19/25/32 mm mesh) nets for all catch within the fishery-independent survey.
Biomass Length Length Family Species Abundance (gr) Range Family Species Abundance Biomass (gr) Range
(mm) (mm)
Clupeidae Herklotsichthys castelnaui
7,414 75,333 49-125 Chirocentridae Chirocentrus dorab 4 977 373-410
Engraulidae Thryssa hamiltoni 1,561 20,274 42-215 Carangidae Scomberoides tol 4 38 83-105
Leiognathidae Leiognathus equulus 542 2,369 21-205 Engraulidae Thryssa baelama 4 22 67-100
Ambassidae Ambassis vachelli 536 1,201 32-67 Leiognathidae Gazza sp. 4 22 50-65
Clupeidae Nematalosa come 457 5,524 44-198 Ambassidae Ambassis spp. 4 16 53-58
Mugilidae Valamugil cunnesius 444 8,070 54-223 Tetraodontidae Chelonodon patoca 4 16 48-53
Belonidae Strongylura strongylura 328 13,462 220-450 Leiognathidae Leiognathus blochi 4 5 35-40
Clupeidae Escualosa thoracata 248 1,032 58-84 Leptobramidae Leptobrama mulleri 3 467 199-273
Mugilidae Liza subviridis 223 4,486 52-245 Mugilidae Valamugil buchanani 3 234 120-203
Hemiramphidae Arrhamphus sclerolepis 213 7,120 58-230 Belonidae Strongylura sp. 3 117 220-391
Clupeidae Anodontostoma chacunda
200 1,405 42-101 Chanidae Chanos chanos 3 80 120-125
Clupeidae Sardinella brachysoma 179 1,217 50-95 Polynemidae Polynemus heptadactylus
3 27 74-92
Polynemidae Eleutheronema tetradactylum
177 8,553 80-405 Haemulidae Pomdasys maculatum 3 20 66-74
Ambassidae Ambassis gymnocephalus
151 656 35-74 Tetraodontidae Marilyna pleurosticta 3 17 60-65
Leiognathidae Leiognathus brevirostrus 143 387 20-65 Gerreidae Gerres acinaces 3 14 42-65
Engraulidae Stolephorus sp. 89 536 68-95 Scombridae Scombridae 3 14 68-72
Ariidae Arius spp. 77 23,350 151-410 Gerreidae Gerres oblongus 3 10 42-55
Sillaginidae Sillago sihama 75 1,524 87-180 Carangidae Caranx sexfasciatus 3 8 45-61
Engraulidae Stolephorus commersoni 72 519 70-121 Belonidae Tylosurus crocodilus 2 1,467 703-722
Haemulidae Pomadasys kaakan 59 2,522 48-505 Platycephalidae Platycephalus fuscus 2 1,280 460
Hemiramphidae Zenarchopterus buffonis 48 682 53-240 Lutjanidae Lutjanus argentimaculatus
2 1,074 260-355
Mugilidae Valamugil seheli 45 1,692 65-345 Hemiramphidae Hyporhamphus regularis 2 75 195-218
Leiognathidae Leiognathus splendens 42 104 32-56 Clupeidae Nematalosa erebi 2 23 65-85
Mugilidae Valamugil sp. 37 274 61-95 Lutjanidae Lutjanus russelli 2 20 85-86 Haemulidae Pomadasys argenteus 31 2,686 65-325 Carangidae Gnathanodon speciosus 2 11 58-69
Carangidae Scomberoides commersonianus
21 9,959 46-755 Scatophagidae Scatophagus multifasciatus
2 7 42-53
Clupeidae Sardinella albella 20 188 47-115 Apogonidae Apogon hyalosoma 2 6 60
Engraulidae Stolephorus nelsoni 18 73 57-95 Leiognathidae Secutor insidiator 2 3 31-43
Leiognathidae Gazza minuta 17 32 21-60 Congridae Muraenesox cinereus 1 2,171 1,250
Carangidae Scomberoides ly san 15 162 73-142 Dasyatidae Himantura uarnak 1 2,066 410
Gerreidae Gerres filamentosus 15 89 43-85 Belonidae Tylosurus punctatus 1 516 145
Leiognathidae Leiognathus sp. 13 32 35-61 Dasyatidae Himantura toshi 1 509 245
Gerreidae Gerres abbreviatus 12 800 44-170 Serranidae Epinephelus malabaricus
1 264 270
Gerreidae Gerres oyena 11 51 46-63 Belonidae Strongylura incisa 1 130 485
Atherinidae Atherinidae 10 41 64-75 Teraponidae Mesopristes argenteus 1 106 185
Leiognathidae Secutor ruconius 10 20 26-45 Belonidae Strongylura leiura 1 49 330
Leiognathidae Leiognathus bindus 9 41 35-70 Trichiuridae Trichiurus lepturus 1 34 210
Elopidae Elops australis 8 2,446 127-455 Carangidae Carangidae 1 30 120
Clupeidae Herklotsichthys koningsbergi
8 460 130-145 Hemiramphidae Zenarchopterus gilli 1 19 200
Sphyraenidae Sphyraena jello 7 2,320 355-414 Lutjanidae Lutjanus johnii 1 8 78
Hemiramphidae Hemiramphus robustus 7 217 184-284 Ambassidae Ambassis nalua 1 7 70
Centropomidae Lates calcarifer 6 4,114 170-475 Hemiramphidae Zenarchopterus sp. 1 5 163
Sphyraenidae Sphyraena barracuda 6 2,127 250-545 Carangidae Caranx ignobilis 1 4 57
Plotosidae Paraplotosus albilabris 6 857 240-260 Gobiidae Glossogobius biocellatus 1 4 69
Platycephalidae Platycephalus indicus 6 751 80-340 Leiognathidae Leiognathus semifasciatus
1 4 51
Scombridae Scomberomorus semifasciatus
6 228 76-245 Leiognathidae Gazza achlamys 1 3 57
Carangidae Scomberoides tala 6 42 76-102 Cynoglossidae Paraplagusia unicolor 1 2 62
Hemiramphidae Hemiramphidae 5 297 130-235 Sparidae Acanthopagrus berda 1 2 38
Hemiramphidae Hyporhamphus quoyi 5 134 185-192 Gerreidae Gerres macrosoma 1 1 42
Leiognathidae Leiognathus daura 5 12 35-47 Leiognathidae Gazza insidiator 1 1 30
Sciaenidae Nibea soldado 4 1,063 195-315
Total 13,750 223,538
77 Fishery Independent Survey

Table 27: Summary of split plot analysis of variance for catch in Multipanel (19/25/32 mm mesh) nets with Fishing (F), Position (P) and Region (R) as main effects, and Tripno (T) as repeated effect. Interactions abbreviated as F*P etc. Significance of effects designated as : *** for P < 0.001; ** for P < 0.01; * for P < 0.05.
Net - Data Type Spatial Parameters Temporal/Temporal*Spatial Parameters Parameter Fishing Position Region F*P F*R P*R F*P*R Tripno T*F T*P T*R T*F*P T*F*R T*P*R
Multpanel Net - Diversity Margelef Species Richness * *** * Shannon-Wiener Diversity * ** * Pielou's Evenness Simpson's Dominance * Total No. species * *
Multi - Abundance Data Total abundance * *** Ambassis vachelli *** * Eleutheronema tetradactylum *** ** *** * * Escualosa thoracata * *** ** ** ** * * Herklotsichthys castelnaui *** ** * * Leiognathus equulus *** Liza subviridis ** * Nematalosa come ** ** ** * Strongylura strongylura * * ** * Thryssa hamiltoni ** ** *
Multi - Biomass Data Total abundance *** * Ambassis vachelli ** * Eleutheronema tetradactylum *** *** Escualosa thoracata *** ** * * * Herklotsichthys castelnaui *** ** * Leiognathus equulus * * Liza subviridis * ** * * Nematalosa come ** * *** * Strongylura strongylura ** * Thryssa hamiltoni * *

Fish Community Distribution Patterns for Multipanel Net Catches
Cluster analysis (Figure 35a) and the resulting MDS ordinations of the 20 most abundant species caught in the multipanel nets showed all sites within the northern region (G1) separated from a combined set of all middle and southern region sites (G2) at a Bray-Curtis similarity of 58%. The middle and southern regions formed a single mixed group that could not be further separated (Figure 35b). ANOSIM analysis of the northern vs middle/southern groups showed significant differences between the groups (P = 0.002). SIMPER analysis revealed that Liza subviridis (2.33), Herklotsichthys castelnaui (1.68) and Thryssa hamiltoni (1.58) had the highest discrimination indices between the two groups (Table 21). Abundances of Liza subviridis (Figure 35c) and Thryssa hamiltoni (Figure 35d) were highest in the middle/southern region while Herklotsichthys castelnaui (Figure 35e) had higher abundances in the northern region. ANOSIM of open vs closed sites did not reveal any significant differences.
a: Cluster dendrogram (Multipanel data)
Sim
ilarit
y
50
60
70
80
90
100
NC
U
NC
D
NO
D
NO
U
MC
D
SO
U
MO
D
SC
D
SO
D
SC
U
MO
U
MC
U
b: MDS of cluster groups
MBD
MBU
MHaD
MHaU
NHuD
NHuU
SNDSNU
NRD
NRU
SYD
SYU
G1
G2
Stress: 0.07
G1 G2
c: Liza subviridis abundance overlay (Multipanel net) d : Herklotsichthys castelnaui abundance overlay (Multipanel) e: Thryssa hamiltoni abundance overlay (Mutipanel net)
MBD
MBU
MHaD
MHaU
NHuD
NHuU
SNDSNU
NRD
NRU
SYD
SYU
MBD
MBU
MHaD
MHaU
NHuD
NHuU
SNDSNU
NRD
NRU
SYD
SYU
G1 vs G2 G1 vs G2 G1 vs G2 Higher in G2
MBD
MBU
MHaD
MHaU
NHuD
NHuU
SNDSNU
NRD
NRU
SYD
SYU
Higher in G2 Higher in G1
Stress: 0.07 Stress: 0.07 Stress: 0.07
79 Fishery Independent Survey
Figure 35: (a) Dendrogram showing group average clustering of 12 sites based on the twenty most abundant species caught in the multipanel nets. Shading delineates groups at a similarity of 58%; (b) MDS ordination (stress = 0.07) of 12 sites based on twenty most abundant species. Boundaries and
shaded areas indentify by cluster. Bubble p lots are MDS ordinations overlaid with the average abundance per site for (c) Liza subviridis, (d) Herklotsichthys castelnaui and (e) Thryssa hamiltoni. Three symbol codes for sites are: N = North, M = Middle, S = South, O = Open, C = Closed, D = Downstream, U =
Upstream

80 Fishery Independent Survey
8.3 Fishery Independent Discussion
8.3.1 Comparison of Six Riverine Estuaries
Direct Effects. The overall trends of the research surveys indicated that riverine estuaries closed to commercial net fishing had higher diversity, biomass and relative abundance of large but not of small fish. Although fishing effects were detected for some commercially important species captured by the large survey nets (152 mm mesh), similar fishing effects were not detected in the catches of smaller survey nets.
Although the research surveys demonstrated overall fishing effects for barramundi, queenfish, estuary whalers and blue threadfin, consistency of the fishing effect between distinct geographical regions (varying in environmental conditions) surveyed were only present for barramundi and queenfish. Further, eight of the nine most abundant species surveyed by the 152 mm mesh nets, demonstrated significant regional trends in abundance. Fishing effects were not demonstrated in the catches of the small mesh survey nets, similar distinct regional patterns in abundance were observed for some species.
Very few of the differences the surveys detected between open and closed systems can be directly attributed to the removal of certain components of fish populations by commercial gill net fishing operations. This pattern was consistent for barramundi and queenfish however it was somewhat more complicated when estuary whalers, which are highly seasonal and abundant during the commercial net fishing closure is in force, and blue threadfin which are seasonal and abundant in only one region, are considered.
Barramundi in the 600 - 800 mm size classes were commonly caught at all sites with larger fish (> 800 mm) being caught predominantly in the rivers closed to net fishing. The majority of barramundi in the 600 – 800 range are immature or male (Garrett 1997, Milton et al. 1998) with a small proportion having completed sex reversal to female (Davis 1986). The removal of large barramundi (> 900 mm) from within a system may reduce the available spawners from within an area (Milton et al. 1998) but it may also reduce the predation on small barramundi by removing large cannibalistic predators (Griffin 1988). Barramundi are highly fecund and recruitment into river systems depends large ly on the successful spawning of highly localised populations (Davis 1986). Spawning aggregations occur just before the onset of the wet season at estuarine river mouths, and juveniles can subsequently take advantage of the aquatic habitat that results from flooding (Davis 1986). As they grow, barramundi occupy several habitat types throughout the estuarine system, including temporary supralittoral habitats, billabongs, tidal creeks, and open channels (Russell and Garrett 1983, Davis 1986). A critical factor in maintaining recruitment is assuring that enough females are present in the spawning aggregations. In recognition of the need to protect these critical components of the populations, specific regulations have been developed. In addition to minimum size limits of 580 mm on the Queensland east coast, maximum legal size limits of 1 200 mm are in effect in Queensland (ie to protect large females) (Williams 1997). Furthermore, seasonal closures for harvesting barramundi along the Queensland coast are in effect during the time when barramundi spawning is predicted to take place (Fisheries Regulation 1995).

81 Fishery Independent Survey
Queenfish were less abundant in the commercially fished rivers. Rarely targeted, this species is often part of the mixed catch from these net fisheries that are frequently marketed (Yearsley et al. 1999). Although their life history is not well documented, larger individuals are common on offshore reefs (Randall et al. 1997). They ranged from 46 to 990 mm fork length in our sampling nets, indicating possible nursery use of the riverine systems. This result coincides with findings from north-western Queensland where, based on large catch rates and similar size ranges (30 to 950 mm), the Embley River estuary was identified as a nursery ground for this species (Blaber et al. 1989). Queenfish were consistantly more abundant in the river closed to commercial gill netting. The majority of the queenfish caught in the 152 mm mesh nets died before they could be released. This indicates that net fishing has the potential to impact on the larger size classes of the populations regardless of whether they are retained for market or discarded.
Estuary whalers are distributed in tropical seas around the world and are common in estuarine rivers (Compagno 1984). As live-bearers, females give birth to their young at the mouths of estuarine rivers. The newborn sharks generally proceed to upstream habitats, but their body shape and size at birth (550 mm fork length) make these sharks easily caught in large mesh gill nets. Catch in the 152 mm nets was seasonal, localised and mostly comprised of sharks in their first year of life. The differential peaks among the rivers during January may indicate that different rivers are used for pupping from year to year, but that young sharks can be expected to regularly peak in abundance during January. The occurrence of these small sharks in the estuaries coincides with the commercial netting closure meaning that the rapid decrease in abundance of these small sharks is most likely linked with their behaviour than their removal by gill nets.
Substantial quantities of blue threadfin (~ 80 t per year) are marketed by commercial net fishers in the Queensland east coast fishery (about half the weight of the barramundi catch, Williams 1997). The significantly higher abundances of blue threadfin caught in our 152 mm mesh nets in closed rivers indicated that net fishing may contribute to this decrease in abundance in the open rivers. Little work has been conducted on this species, but blue threadfin are known to reach sexual maturity as males at about 200 mm fork length and then undergo sex reversal from male to female (Garrett 1997). Due to the 400 mm total length minimum legal size limit, the commercial catch is mainly composed of females. The net sizes used in the river fishery (minimum of 150 mm in rivers) effectively selects against small blue salmon (< 400 mm TL) however this species tends to become bridled in the net meshes and most are dead if discarded (see Section 7.2.2.1). Commercial catch is mostly concentrated in the estuaries in the middle to southern parts of Queensland, explaining our higher catch rates for the southern and middle regions. In both sampling years, our catch peaked (16 fold) in the southern-closed system in the dry cool season, corresponding with the time of peak commercial catch (Garrett 1997). It is clear from our survey results that blue threadfin have complex seasonal distribution patterns probably attributable to spawning behaviour and specific habitat preferences. These habitat preferences are illustrated by the finding that blue salmon were one of only a few species that were caught in the full range of our nets. Juvenile blue salmon were only caught in three of our sites, middle open, middle closed and southern closed. The majority (96%) of adult fish caught was caught at these same sites. The highest abundances of juvenile blue threadfin caught in the multipanel net were during March and May 2000. A more directed study into the life cycle and habitat preferences of blue threadfin based around the mid-open, mid-closed and southern

82 Fishery Independent Survey
closed sites would provide clarification of the specific environmental needs ofr this species.
The weight of commercially caught banded grunter (10 – 15 t per year) is about 10% of the barramundi tonnage sold from the east coast fishery (Garrett 1997). Although no significant differences between sites open and closed to commercial gill netting were found for this species, significant regional differences in abundance were evident. As with blue threadfin, particular sites produced higher catches of banded grunter regardless of fishing policy. As banded grunter were also more abundant in our more southerly sites and with peak commercial catch occurring south of the study area, further investigation of the effects of commercial net fishing on banded grunter would best be conducted in more southern locations.
In summary, direct effects of commercial net fishing were observed for few of the species of commercially targeted fish in the open systems. Sur vey results indicated that four of six species marketed by net fishers had significantly greater abundance and biomass levels in the closed rivers. Of the four species only two, barramundi and queenfish, showed consistent patterns across all regions (ie higher abundance in rivers closed to commercial netting). For estuary whaler the differences in abundance between open and closed rivers occur at a time when no commercial fishing occurs making it likely that this result is an artefact of our sampling regime. Blue threadfin are highly site specific with low catches of undersized fish that are dead when discarded.
Indirect Effects. One of the most widely expressed concerns about intensive and selective fishing activities is that they will lead to imbalances in ecosystem function, and this has ramifications for non-target species (Jennings and Kaiser 1998). Thus, we tested two hypotheses concerned with indirect effects of fishing. Firstly, we hypothesised that other predatory species may take advantage of available prey and therefore be more abundant in the rivers where substantial numbers of barramundi, queenfish, sharks and blue threadfin were selectively removed by net fishing. In estuaries, top level consumers tend to be opportunistic and have overlapping diets (McHugh 1967). Among the competing predators, three species were sufficiently abundant for statistical comparison between open and closed systems: ie Arius spp., P. kaakan and Nibea soldado. However, contrary to our hypothesis, none of these species were consistently more abundant in the open rivers than in rivers closed to commercial netting. None of the competitor taxa listed in Table 20 were sampled in large enough numbers for statistical analysis. Due to the selectivity of gill nets and the non-susceptibility of to net capture some piscivorous estuarine fish species because of their behaviour, they may not have appeared or were rarely encountered in our samples. Lutjanids, sparids and serranids seldom range far from the structure provided by mangrove prop roots and snags (Sheaves 1993 and 1996), and thus rarely encounter set gill nets. Despite this lack of data, our results appear consistent with the views expressed in a major recent review of published studies on the effects of fishing by Jennings and Kaiser (1998). Based on relevent studies in a range of marine ecosystems (but not including estuaries or reefs), these authors concluded that compensatory species replacements seldom occur in response to fishing a particular species guild. Thus, our results may be interpreted as supporting and extending this conclusion for Queensland’s tropical estuaries.

83 Fishery Independent Survey
For the second indirect effect of fishing tested, we had hypothesized that by reducing numbers of upper level consumers through fishing, abundances of their prey might increase. If this were true, we would have expected to find grater abundances of prey species in the open systems using the smaller mesh nets. However, we found no evidence that prey numbers were higher in the open rivers than in rivers closed to net fishing. In several tests of this theory on coral reefs, the results obtained were similar to ours: reduced abundances of piscivorous target species did not correspond with any detectable increase in the abundance of their prey (see review in Jennings and Kaiser, 1998). In studies of the consequences of predator removal in freshwater systems, strong cascading effects from top predators to lower trophic levels have been empirically demonstrated (Carpenter et al. 1985, Power 1990). Apparently the indirect effects of fishing on coral reef and estuarine fish communities are less easily discerned, are less predictable, and may be smaller than in strictly freshwater systems.
If there had been any effect of increased predation in the closed systems, we expected to detect the effect for several reasons. Firstly, diets of barramundi gradually change from penaeid prawns when they are small (200 to 400 mm TL), to mostly fish at larger sizes (400 – 1200 mm TL) (Davis 1985). Ninety-one percent of the barramundi caught in all nets were in this larger size class, and so likely to be mainly piscivorous. Secondly, the prey fishes consumed were most likely to be dominated by engraulids, clupeids, mugillids, and ariids (Davis 1985), the same taxa that were most abundant in our small mesh nets. Perhaps the difference in numbers of predators between open and closed rivers was not great enough to generate detectable differential effects on their main prey. Independently of predation, numbers of the short- lived planktivorous fishes capable of rapid population growth such as clupeids and engraulids may be more closely linked with availability of their food supply, mainly zooplankton (Robertson and Duke 1990). In such riverine estuaries, zooplankton abundances respond to changes in physical forcing functions (eg tidal state, input of freshwater) which are relatively unpredictable (McKinnon and Klumpp 1998). The asynchronous variations in peak abundances of baitfish species observed in our study may well be the result of these dynamics differentially affecting the various species. Thus, contrary to our original hypothesis, the number of predators removed by commercial net fishing did not measurably affect prey abundance levels. The reverse is probably also true: numbers of prey are probably not a limiting factor for populations of barramundi and similar piscivores in these riverine estuaries.
Thus, both hypotheses concerning the indirect of effects net fishing tested false. Neither abundances of prey or abundances of alternative competitors were greater in the commercially fished. Marine ecosystems are said to be well adapted to fluctuations in component species (Jennings and Kaiser 1998). The fishing pressure imposed on our study systems may cause population depletion that is well within the range of variation experienced within the ecosystem naturally. However, as observed in other fished systems, a threshold can be reached where further removals of critical population components from a particular stock leads to an irreversible shift in ecosystem structure and function. Responses to such gross population losses can be switches in species composition to less valuable alternatives (Steele 1998)
Regional effects. Aside from fishing, region had the biggest effect on the spatial distribution patterns of abundant species. The northern region, in particular, was distinctly different from the middle and southern regions. The northern rivers, located in

84 Fishery Independent Survey
steep rainforest-dominated catchments, supported numerous large ponyfish Leiognathus equulus but fewer catfish and barramundi. In contrast, the southern rivers that were associated with flatter eucalypt forest catchments, supported numerous catfish and barramundi. Variation in the aquatic and floodplain habitats may have contributed to variation in the fish communities inhabiting the rivers. Firstly, downstream salinities were lower in the northern rivers and the distribution of estuarine fishes may be strongly influenced by salinity conditions (Sheaves 1998). Other factors such as primary and secondary productivity may also explain the observed differences in the fish assemblages. Secondly, in the flatter topography of the southern systems, expansive floodplains provide alternative habitats that become available to mobile riverine biota when the rivers overflow during floods. These seasonally accessible habitats increase the nursery area for species like barramundi; in contrast, the northern rivers with steeper catchments have only limited wetlands and waterholes suitable as juvenile habitat (Dunstan 1959).
8.3.2 Value of Long Term Fishery Replenishment Zones
This study indirectly addressed one of the main questions involving the integration of fisheries and ecosystems management objectives: what happens to biota in reserves protected from all types of harvest? The effectiveness of reserves has received much attention in the recent ecological and fishery management literature (Bohnsack 1993, Allison et al. 1998, Lauck et al. 1998, Murray et al. 1999). Empirical evidence from several case studies demonstrates that reserves can harbour more diversity, higher abundance, and notably different community structures (see Allison et al. 1998). The current study supports the notion that commercial closures could benefit the noncommercial fishery within the reserve. Because we were able to show differences in abundance for some of the target species among replicate protected estuaries; our results may significantly strengthen the case in favour of the effectiveness of no-harvest reserves. The lower abundances of large legal size fish in the systems open to commercial net fishing may not only be due to capture by nets but also because of recreational catches. Although not measured as part of this study, it was observed that recreational effort in closed rivers was higher than in rivers open to commercial netting, however some recreational effort did occur in all rivers sampled. Given the selectivity of gill nets allowed to be used in rivers on the east coast of Queensland it would appear that differences in the abundances of undersized commercially targeted species between sites are not caused by the commercial netting in these areas. Very few of the fish caught in nets smaller than 152 mm mesh would have been captured in these large nets because of their size. In the tropical Queensland rivers studied, closed rivers may serve as stock refugia where numbers of spawning individuals are greater, more larger females potentially produce more eggs, and suitable habitat is present juveniles can survive to a reproductive age. This would all lead to an enhanced level of recruitment to the fishery within the closure,that may possibly extend to areas outside the closure.
To protect and enhance fishery resources, a frequently promoted initiative is to establish permanent reserves in which all resources are protected from all forms of fishing and other harvesting. In such reserves, biodiversity can return to a more natural condition (Bohnsack 1993). Our study did not include sites closed to all types of exploitation, but fishery- independent surveys in locations closed to both recreational and commercial fishing for 25 years in Florida showed greater abundance and larger size classes of all

85 Fishery Independent Survey
exploitable species than did adjacent fished areas (Johnson et al. 1999). Thus, establishing no-take estuarine refugia in Queensland may benefit the broad range of species targeted by both commercial fishers and recreational anglers (eg Lutjanidae, Serranidae, Centropomidae, Polynemidae, Haemulidae) in adjacent fishing grounds.
Table 28: Details of tagged sportfish recaptured in the research gill nets. Source of tags and details: Bill Sawynok, Sportfish Tagging Coordinator, Australian National Sportfishing Association Queensland.
Tag no. Species Tagging Details Recapture Details
Original Release Total Recapture Recapture Recapture Mesh Total Condition River Date Length Mon-Yr River Position Length
mm mm
Z02707 Lates calcarifer Russell Apr-90 455 Jul-98 Russell Down 6 830 Live
K25895 Scomberoides commersonianus
Haughton Feb-98 500 Sep-98 Haughton Down 6 603 Dead
J16216 Lates calcarifer Haughton Aug-98 430 Sep-98 Haughton Up 6 460 Live
J02395 Lutjanus argentimaculatus
Wallace Creek Sep-98 375 Nov-98 Yellow Gin Down 4 380 Live
K1304 0 Lates calcarifer S. Johnstone Oct-98 520 Mar-99 Russell Down 6 766 Live
J16207 Lates calcarifer Ross River Mar-99 450 May-99 Haughton Up 4 455 Live
J27233 Lates calcarifer Haughton May-99 450 Jul-99 Haughton Up 4 445 Live
K15080 Lates calcarifer Russell Apr-95 540 Sep-99 Russell Down 6 830 Live
JO7490 Lates calcarifer Haughton Apr-98 430 Nov-99 Haughton Up 4 565 Live
K87241 Lates calcarifer Haughton Sep-98 530 Nov-99 Haughton Up 4 635 Live
J44893 Lates calcarifer Unknown Unknown Unk Mar-00 Barrattas Up 4 560 Live
J17448 Lates calcarifer Unknown Unknown Unk Mar-00 Russell Down 6 635 Live
In our study we did not address the question of whether areas closed to net fishing potentially affect surrounding fishing grounds. Such an exercise would have involved conducting a concurrent program of tagging and recovery considered beyond the scope and resources of this project. Two of the ten barramundi tagged by recreational fishers (as part of the Queensland ANSA/SUNTAG tagging program) and recaptured in our nets, were shown to have travelled from elsewhere (Table 28). Barramundi are more likely to migrate along the coastline if continuous suitable habitat (eg. numerous creeks, rivers, and extensive mangrove wetlands) occurs in the intervening coastal area (Russell and Garrett 1983). Some movements are likely to occur between closed and open rivers designated as pairs in the current study, especially for the southern and middle regions because of their close proximity and relatively unmodified coastal habitats. Tagging results from the study of a 25-year closure to all forms of fishing in Florida verified substantial fish movements from unfished to fished areas, and documented several catches of trophy-sized gamefish by anglers “fishing the edge” of the refuge (Johnson et al. 1999). A system of commercial netting closures is already in place in Queensland estuarine rivers, however there are very few areas totally protected under Queensland legislation. Thus, an approach that merits further consideration is the upgrading some of these already partially closed areas to areas totally protected from all forms of fishing throughout the tropical coast. Such a network could help maintain a flow of commercially and recreationally targeted species into the fished systems.

86 Fishery Independent Survey
Evidence from our surveys suggests that unique conditions exist within individual estuarine ecosystems that generate especially beneficial habitats suitable for particular species. For example, the mid-closed river (Haughton) featured far more barramundi than any other rivers sampled. Similarly, the south-closed river (Yellow Gin) produced many more blue threadfin. Other systems appeared to be particularly well-suited to production of haemulids. Ident ifying the habitat features associated with these distribution patterns would generate criteria for implementing a reserve network strategy with multi-species benefits.
In summary, riverine estuaries open to commercial net fishing had lower diversity, biomass and abundances of larger predatory fish species targeted by the fishery than rivers closed to commercial netting. These effects were similar over a wide range of habitat and environmental conditions with different associated fish assemblages. The findings represent some of the first objective scientific information about the effects of gill net fishing on fish communities in tropical Australian estuaries. Establishing the impacts of net fishing on fish populations outside particular river systems is an important area of research that should be undertaken, if an understanding of the overall effects in connected habitats is to be achieved. From the data presented in this study it is apparent that the use of gill netting is one of the most environmentally sensitive forms of fishing used in commercial fisheries. The ability of fishers using these apparatus to capture high proportions of targeted and marketable catches using techniques that are non-destructive to habitats, and have no detectable effect on the overall species diversity of particular areas indicate that efforts to achieve further meaningful reductions in bycatch should be focused on developing markets for only a few select species.

Benefits 87
9. Benefits
The project:
• Provided observer validated information on the bycatch rates and species composition of seven inshore commercial gill net fisheries in Queensland.
• Demonstrated that commercial net fishing operations are very effective at targeting marketable species without having major impacts on bycatch species. Very little of the catch is not marketed and interactions with protected wildlife species were uncommon with no deaths reported or observed.
• Made available information on the proportion of bycatch taken in Queensland net fisheries, essential for understanding the scope of the bycatch issue. This will allow more informed management decisions when catch allocation and biodiversity issues are being debated. It will also provide the commercial industry with a factual basis to defend a currently weak position due to the lack of data on their impacts.
• Made available information on the fate of fish discarded from net catches at least in the short term. These data will directly benefit all state fisheries where similar species and netting methods occur.
• Identified some species where market development opportunities should be sought to further reduce bycatch within the fishery.
• Provided information on the effect of net fishing on inshore biodiversity and options for diminishing unacceptable impacts. These will assist in reviewing current net fishing practices and development of codes of practice.
• Data gathered will be of benefit to the current Queensland stock assessment programs (TRAP and Queensland Fisheries Service, Long Term Monitoring Program) by providing an extended data base.
• Provided information to educate stakeholders about the effects of net fishing allowing a rational debate in resource management decisions, especially those involving bycatch reduction and the maintenance of biodiversity.
• Identified necessary research investigations that should be undertaken to obtain the necessary ecosystem wide understanding of fishery impacts.
10. Intellectual property
Results from this project will be published in a wide variety of scientific and popular journals as well as in open discussions with managers and the general public. Articles will contain information useful in the development of commercial netting practices and improve the current knowledge base on gill netting and its potential affects on sustainability of this fishery. No patents are expected from this project.

88 Further Development
11. Further development
Potential future developments building on the information gathered in this project would be to:
• Examine the impacts of net fishing outside the immediate systems in which they occur.
• Develop new markets for currently underutilized bycatch species.
• Examine the why certain locations maintain higher populations of particular species with a view to protecting specific habitats for particular species.
• Monitor areas where extended closures to all types of fishing provide the opportunity to examine post-closure changes in population structures of key species and the effectiveness of the closures at enhancing fisheries outside of the closure area.
• Develop a model to predict how the introduction of a system of closures may function in ensuring the future of associated fisheries.
Comment. If a viable and sustainable barramundi fishery is to be maintained in the northern coast places such as the Haughton River, Barrattas River and Yellow Gin Creek should be viewed as a “safety deposit box”. Many of the areas that were traditionally barramundi strongholds have become less productive in a fisheries sense while increasing the production of agricultural commodities. With further habitat modification and restriction of access to wet lands barramundi populations will continue to decline. The Haughton River has the highest abundances of many of the fish species commonly caught during the fishery independent study and would be a prime example of the value of maintaining continuity of access to juvenile and adult barramundi habitat. Protection of the surrounding habitats will be the most important aspect of maintaining a healthy barramundi population in the future.
12. Staff
Ian Halliday (80%) Principal QDPI, AFFS 1st Sept 1997 to Investigator Fisheries 31st Dec 2000
Janet Ley (100%)
Andrew Tobin (100%)
Research Scientist
Fisheries Biologist
AIMS
QDPI, AFFS
1st Sept 97 to 20th July 2000 27th Jan 1998 to
Fisheries 31st Dec 2000 Paul Dixon (50%) Senior Fisheries
Technician AIMS 1st Sept 97 to
20th July 2000 Rod Garrett (10%) Principal Fisheries QDPI, AFFS 1st Sept 1997 to
Biologist Fisheries 31st Dec 2000 Neil Gribble (10%) Senior Fisheries QDPI, AFFS 1st Sept 1997 to
Biologist Fisheries 31st Dec 2000 David Mayer (5%) Principal Scientist QDPI, AFFS 1st Sept 1997 to
Beef 31st Dec 2000

89 Acknowledgments
13. Acknowledgments
This study was funded by Fisheries Research and Development Corporation (Project No. 97/206.
We thank all the commercial fishers who participated and contributed to the logbook and observer programs by providing information on their catches and access to their vessels. Special thanks goes to Malcolm Campbell for his invaluable help in collecting fish for use in the fate trials. Complementary net fishing bycatch data was collected by FRDC Project No. 95/049. The efforts of Dr. Neil Gribble and fishery observer Sterling Peverell are gratefully acknowledged.
Field and technical assistance was provided by a large number of AIMS and QDPI staff all of whom made the fishery- independent study possible.
We would also like to thank Roland Griffin, Mike Potter and Mike Dredge for critically reviewing and providing comments on the report.

90 Literature
14. Literature
Allison, G. W., J. Lubchenco, and M. H. Carr (1998). Marine reserves are necessary but not sufficient for marine conservation. Ecological Applications 8(1): S72 – S78.
Alverson, D. L., M. H. Freeberg, S. A. Murawski and J. G. Pope (1994). A global assessment of fisheries bycatch and discards. FAO Fisheries Technical Paper 339, 233 pp.
Australian Bureau of Meteorology. Monthly Rainfall Bulletin. Queensland Regional Office.
Blaber, S. J. M., D. T. Brewer, and J. P. Salini (1989). Species composition and biomasses of fishes in different habitats of a tropical northern Australian estuary: their occurrence in the adjoining sea and estuarine dependence. Estuarine, Coastal and Shelf Science 29: 509-531.
Bohnsack, J. A. (1993). Marine reserves: they enhance fisheries, reduce conflicts, and protect resources. Oceanus Fall: 63-71.
Broadhurst, M. K., D. T. Baker and S. J. Kenelly (1999). Scale- loss and survival of juvenile yellowfin bream, Acanthopagrus australis, after simulated escape from a nordmore-grid guiding panel and release from capture by hook and line. Bulletin of Marine Science. 64(2): 255-268.
Carpenter, S. R., J. F. Kitchell, and J. R. Hodgson (1985). Cascading trophic interactions and lake productivity: fish predation and herbivory can regulate lake ecosystems. BioScience 35(10): 634 –639.
Clarke, K. R. and R. M. Warwick (1994). Change in marine communities: an approach to statistical analysis and interpretation. National Environmental Research Council, UK. Plymouth Marine Laboratoy. 144 p.
Compagno, L. J. V. (1984). FAO Species catalogu. Vol 4. Sharks of the world. An annotated and illustrated catalogue of sharks species known to date. 249p.
Davis, T. L. O. (1985). The food of barramundi, Lates calcarifer (Bloch), in coastal and inland waters of Van Dieman Gulf and the Gulf of Carpentaria, Australia. Journal of Fish Biology 26: 669-682.
Davis, T. L. O. (1986). Biology of wildstock Lates calcarifer in northern Australia. p 22-29. In Management of Wild and Cultured Sea Bass/Barramundi (Lates calcarifer). J.W. Copland and D.L. Grey Eds. Australian Centre for International Agricultural Research.
Dredge, M. C. L. (1976). Aspects of the ecology of three estuarine dwelling fish in south-east Queensland. Unpublished M.Sc. Thesis, University of Queensland. 122 pp.

Literature 91
Dredge, M. C. L., H. Kirkman and M. Potter (1977). A short term biological survey Tin Can Inlet/Great Sandy Strait. CSIRO Division of Fisheries and Oceanography. Report No.68. 31 pp.
Dunston, D. J. (1959). The barramundi Lates calcarifer (Bloch) in Queensland waters. CSIRO Division of Fisheries and Oceanography Technical Paper No. 5. 22 pp.
FishBase (2000). Species summary for Liza vaigiensis, Squaretail Mullet. www.fishbase.org, ICLARM.
Garrett, R. (1997). Barramundi (Lates calcarifer). In "Queensland's Fisheries Resources Current Condition and Recent Trends 1988 - 1995". (Ed. L. E. Williams.) pp. 56 9. Queensland Department of Primary Industries, Brisbane.
Gray, C. A., S. J. Kennelly, K. E. Hodgson, C. J. T. Ashby and M. L. Beatson (2001). Retained and discarded catches from commercial beach-seining in Botany Bay, Australia. Fisheries Research. 50: 205-219.
Greenhouse, S. W. and S. Geisser (1959). On methods in the analysis of profile data. Psychometrika 32(3): 95-112.
Griffin, R. K. (1988). A comparison of exploited and unexploited seabass Lates calcarifer populations in two rivers in the Northern Territory, Australia. Asian Fisheries Science 1: 107-115.
Hale, Marty M., Ralph J. Schuler Jr. and Joe E. Crumpton. (1996). The St. Johns River, Florida freshwater striped mullet gill net catches: Catch composition, status, and recommendations. Proceedings of the Annual Conference of Southeastern Association of Fish and Wildlife Agencies. 50: 98-106.
Jennings, S. and M. J. Kaiser (1998). The effects of fishing on marine ecosystems. Advances in Marine Biology 34:203-352.
Johnson, D. R., N. A.Funicelli, and J. A. Bohnsack (1999). Effectiveness of an existing estuarine no-take fish sanctuary within the Kennedy Space Center, Florida. North American Journal of Fisheries Management 19: 436-453
Kailola, P. J., M. J. Williams, P. C. Stewart, R. E. Reichelt, A. McNee and C. Grieve (1993). Australian Fisheries Resources. Bureau of Resource Sciences, Department of Primary Industries abd Energy, Fisheries Research and Development Corporation, Canberra, Australia.
Kendall, M., A. Stuart and J. K. Ord. (1983). The Advanced Theory of Statistics (Volume 3, 4th edition). Griffin, London.
Kennelly, S. J. and C. A. Gray (2000). Reducing the mortality of discarded undersize sand whiting Sillago ciliata in an estuarine seine fishery. Marine and Freshwater Research. 51: 749-753.

92 Literature
Lauck, T., C. W. Clark, M. Mangel, and G. R. Munro (1998). Implementing the precautionary principle in fisheries management through marine reserves. Ecological Applications 8 (1) S72 – S78.
McHugh, J. L. (1967). Estuarine Nekton. in Lauff, G. H. Estuaries. American Association for the Advancement of Science. Wahington DC 581-620.
McKinnon, A. D. and D. W. Klumpp (1998). Mangrove zooplankton of north Queensland, Australia. Hydrobiologia 362: 127-143.
Milliken, G. A. and D. E. Johnson (1992). Analysis of Messy Data. Chapman & Hall, Melbourne 473 p.
Milton, D. A., D. Die, C. Tenakanai, and S. Swales (1998). Selectivity for barramundi (Lates calcarifer) in the Fly River, Papua New Guinea: implications for managing gill-net fisheries on protandrous fishes. Marine and Freshwater Research 49: 499506.
Murray, S. N., R. F. Ambrose, J. A. Bohnsack, L. W. Botsford, M. H. Carr, G. E. Davis, P. K. Dayton, D. Gotchall, D. R. Gunderson, M. A. Hixon, J.Lubchenco, M. Mangel, A. MacCall, D. A. McArdle, J. C. Ogden, J. Roughgarden, R. M. Starr, M. J. Tagner and M. M. Yoklavich (1999). No-Take reserves: Sustaining fishery populations and marine ecosystems. Fisheries 24 (11): 11-25.
Payne, R. W., Lane, P. W., Digby, P. G. N., Harding, S. A., Leech, P. K., Morgan, G. W., Todd, A. D., Thompson, R., Tunnicliffe Wilson, G., Welham, S. J. and White, R. P. (1993). Genstat 5 Release 3 Reference Manual. Clarendon Press, Oxford.
Pease, B. C. (1999). A spatially oriented analysis of estuaries and their associated commercial fiseries in New South Wales, Australia. Fisheries Research. 42: 6786.
Pierce, D. J., J. E. Wallin and B. Mahmoudi (1998). Spatial and temporal variations in the species composition of bycatch collected during a striped mullet (Mugil cephalus) survey. Gulf of Mexico Science. 1: 15-27.
Pollard, D. A. (1976). Estuaries must be protected. Australian Fisheries 6:6-10.
Pollock, B. R. (1982). Movements and migrations of yellowfin bream, Acanthopagrus australis, in Moreton Bay, Queensland as determined by tag recoveries. Journal of Fish Biology. 20(3), 245-252.
Pollock, B. R. (1984). The tailor fishery at Fraser Island and its relation to the life-history of the fish. Proceedings of the Royal Society of Queensland. 95, 23-28.
Power, M. E. (1990). Effects of fish in river food webs. Science 250:811-814.
Quinn, R. H. (1992). Fisheries Resources of Moreton Bay Region. Queensland Fisheries Management Authority. 52 pp.

Literature 93
Randall, J. E., G. R. Allen and R. C. Steene (1997). Fishes of the Great Barrier Reef and Coral Sea. Crawford House Publishing Pty Ltd. 557 pp.
Robertson, A. I. and N. C. Duke (1990). Recruitment, growth and residence time of fishes in a tropical Australian mangrove system. Estuarine, Coastal and Shelf Science. 31: 723-743.
Russell, D. J. and R. N. Garrett (1983). Use by juvenile barramundi, Lates calcarifer (Bloch), and other fishes of temporary supralittoral habitats in a tropical estuary in northern Australia. Australian Journal of Marine and Freshwater Research 34:805811.
Sheaves, M. J. (1993). Patterns of movement of some fishes within an estuary in tropical Australia. Australian Journal of Marine and Freshwater Research 44: 867880.
Sheaves, M. (1996). Habitat-specific distributions of some fishes in a tropical estuary. Marine and Freshwater Research 47: 827-30.
Sheaves, M. (1998). Spatial patterns in estuarine fish faunas in tropical Queensland: a reflection of interaction between long-term physical and biological processes. Marine and Freshwater Research 49: 31-40.
Steele, J. H. (1998). Regime shifts in marine ecosystems. Ecological Applications (8(1): S33-S36.
Virgona, J., K. Deguara, D. Sullings, I. Halliday and K. Kelly (1998). Assessment of the stocks of sea mullet in New South Wales and Queensland waters. Fisheries Research and Development Corporation Project No 94/206. Pp. 104.
Williams, L. E. (1997). Queendsland’s Fisheries Resources: Current Condition and Trend 1988-1995. Information Series QI97007. Department of Primary Industires, Queensland 101p.
Yamamura, K. (1999). Transformation using (x+0.5) to stabilize the variance of populations. Res. Pop. Ecol. 41, 229-234.
Yearsley, G. K., P. R. Last and R. D. Ward (1999). Australian Seafood Handbook: an Identification Guide to Domestic Species. CSIRO Marine Research, Australia. 461 p.

Appendices
15. Appendices
Appendix 1: Total catch by species for rivers closed to commercial net fishing, versus open rivers (all nets combined).
Family Abundance Weight (gr)
Species Closed Open Closed Open
Carcharhinidae (whaler sharks)
Carcharhinus 2 ambionensis
0 1,161 0
Carcharhinus leucas 122 31 126,126 31,938 Carcharhinus sp. 13 0 11,971 0 Rhizoprionodon acutus 0 2 1,134
Sphyrnidae (hammerhead sharks) Sphyrna lewini 0 3 0 2,270
Rhinobatidae (shovelnosed Ray)
Aptychotrema rostrata 1 1 1,101 885 Dasyatidae (stingrays)
Himantura granulata 1 0 5,821 0 Himantura sp. 1 0 3,545 0 Himantura toshi 1 0 509 0 Himantura uarnak 1 1 883 2,066
Myliobatidae (eagle rays)
Aetobatus narinari 1 5 1,387 5,377 Clupeidae (herrings, sardines)
Anodontostoma 61 chacunda
143 664 882
Escualosa thoracata 83 165 358 674 Herklotsichthys 4,366 castelnaui
3,128 50,530 28,562
Herklotsichthys 0 koningsbergi
12 0 693
Nematalosa come 250 511 13,848 15,110 Nematalosa erebi 27 3 4,428 101 Sardinella albella 8 12 62 126 Sardinella brachysoma 80 99 531 686
Engraulidae (anchovies)
Stolephorus commersoni 52 20 383 136 Stolephorus nelsoni 0 18 0 73 Stolephorus sp. 79 10 477 59 Thryssa baelama 3 1 18 4 Thryssa hamiltoni 1,115 1,148 40,557 46,537
Chirocentridae (wolf herrings)
Chirocentrus dorab 7 8 2,085 2,609 Megalopidae (tarpon)
Megalops cyprinoides 125 83 145,724 89,660 Elopidae (giant herring)
Elops australis 25 38 9,170 15,477 Muraenesocidae (pike congers)
Muraenesox cinereus 2 0 5,449 0 Chanidae (milkfish)
Chanos chanos 25 13 21,066 12,099 Ariidae (sea catfish)
Arius sp. 1,112 1,032 963,432 780,665 Plotosidae (eeltail catfish)
Paraplotosus albilabris 0 11 0 1,681 Batrachoididae (toadfishes)
Halophryne diemensis 4 0 735 0 Belonidae (long toms)
Strongylura incisa 0 1 0 130 Strongylura leiura 0 1 0 49 Strongylura sp. 0 3 0 117 Strongylura strongylura 199 129 7,800 5,661 Tylosurus crocodilus 0 3 0 1,872 Tylosurus punctatus 0 1 0 516 Tylosurus sp. 0 1 0 347
Family Abundance Weight (g)
Species Closed Open Closed Open
Hemiramphidae (halfbeaks)
Arrhamphus sclerolepis 122 91 4,233 2,888 Hemiramphidae 5 0 297 0 Hemiramphus robustus 6 1 190 27 Hyporhamphus quoyi 1 4 20 114 Hyporhamphus regularis 1 1 27 48 Zenarchopterus buffonis 14 34 189 494 Zenarchopterus gilli 1 0 19 0 Zenarchopterus sp. 1 0 5 0
Atherinidae (silversides, hardyheads)
Atherinidae 0 10 0 41 Scorpaenidae (scorpion fish)
Notesthes robusta 1 0 38 0 Platycephalidae (flatheads)
Platycephalus fuscus 10 9 9,585 5,045 Platycephalus indicus 8 11 4,709 3,420
Centropomidae (barramundi, sandbass)
Lates calcarifer 1,226 430 2,975,304 862,826 Psammoperca 1waigiensis
0 522 0
Ambassidae (glassfish)
Ambassis 119gymnocephalus
32 533 123
Ambassis nalua 1 0 7 0 Ambassis spp. 3 1 12 4 Ambassis vachelli 203 333 523 678
Serranidae (rock-cod, groper)
Epinephelus coioides 0 2 0 1,115 Epinephelus lanceolatus 1 1 4,947 13,001 Epinephelus 1malabaricus
1 831 264
Teraponidae (trumpeter, tiger perch)
Mesopristes argenteus 4 0 552 0 Terapon jarbua 0 5 0 374
Apogonidae (cardinal fish) Apogon hyalosoma 0 2 0 6
Sillaginidae (whitings)
Sillago analis 5 0 1,307 0 Sillago ciliata 5 0 915 0 Sillago sihama 44 65 2,662 3,977
Echeneidae (remora)
Echeneis naucrates 2 0 16 0
Carangidae (trevally, queenfish) Alectis indicus 4 4 2,096 5,441 Carangidae 2 2 472 975 Carangoides 0hedlandensis
1 0 303
Caranx bucculentus 1 548 Caranx ignobilis 106 72 83,998 38,021 Caranx sexfasciatus 7 2 953 142 Gnathanodon speciosus 2 1 11 2,156 Scomberoides 290commersonianus
76 352,628 72,454
Scomberoides lysan 17 4 492 182 Scomberoides sp. 2 0 2,241 0 Scomberoides tala 59 24 25,827 13,887 Scomberoides tol 2 3 19 120 Trachinotus bailloni 5 1 2,330 273 Trachinotus blochi 25 2 41,504 8,470
94

Appendices 95
Family Abundance Weight (g)
Closed Open Closed Open
Lactariidae (false trevally)
Lactarius lactarius 14 0 5,491 0 Leiognathidae (ponyfish)
Gazza achlamys 3 0 59 0 Gazza insidiator 0 1 0 1 Gazza minuta 2 15 7 25 Gazza sp. 5 0 59 0 Leiognathus bindus 9 41 Leiognathus blochi 4 0 5 0 Leiognathus brevirostrus 77 66 154 232 Leiognathus daura 5 0 12 0 Leiognathus equulus 833 550 83,737 49,116 Leiognathus semifasciatus
0 1 0 4
Leiognathus sp. 10 9 21 41 Leiognathus splendens 20 22 41 63 Secutor insidiator 0 2 0 3 Secutor ruconius 10 0 20 0
Lutjanidae (snappers, sea -perch, jacks) Lutjanus argentimaculatus
25 15 24,622 13,557
Lutjanus johnii 11 17 13,468 23,379 Lutjanus russelli 0 6 0 239 Lutjanus sp. 1 0 56 0
Gerreidae (silver biddies)
Gerres abbreviatus 1 16 2 2,130 Gerres acinaces 1 2 8 6 Gerres filamentosus 26 15 1,011 381 Gerres macrosoma 1 0 1 0 Gerres oblongus 1 2 3 7 Gerres oyena 9 5 261 111
Haemulidae (grunts) Plectorhynchus gibbosus 16 11 50,102 21,236 Pomadasys argenteus 190 94 74,322 43,823 Pomadasys kaakan 194 158 115,885 121,409 Pomadasys sp. 3 0 1,286 0 Pomdasys maculatum 3 0 20 0
Sparidae (bream)
Acanthopagrus australis 3 2 1,086 594 Acanthopagrus berda 12 3 3,414 1,198
Sciaenidae (jewfish)
Nibea soldado 195 189 78,509 75,492 Otolithes ruber 0 1 0 318 Sciaenidae 0 3 0 619
Monodactylidae (diamond fish)
Monodactylus argenteus 14 4 1,673 366 Leptobramidae (beach salmon)
Leptobrama mulleri 37 26 4,903 3,663 Toxotidae (archer fish)
Toxotes chatareus 31 24 13,040 9,773 Toxotes jaculatrix 4 2 1,583 1,007 Toxotes sp. 2 2 815 572
Family
Species
Abundance
Closed Open
Weight (g)
Closed Open
Ephippidae (batfish, sickle fish) Drepane punctata 72 Platax batavianus 0 Platax novemaculeatus 0 Platax orbicularis 1 Platax teira 0
Scatophagidae (scat, butterfish)
Scatophagus argus 22 Scatophagus 12 multifasciatus
Mugilidae (mullets)
Liza subviridis 415 Liza vaigiensis 218 Mugil cephalus 97 Mugilidae 16 Valamugil buchanani 136 Valamugil cunnesius 606 Valamugil seheli 71 Valamugil sp. 38
Sphyraenidae (barracuda)
Sphyraena barracuda 3 Sphyraena jello 11 Sphyraena sp. 2
Polynemidae (threadfin salmon) Eleutheronema 462 tetradactylum Polydactylus macrochir 146 Polynemus 4 heptadactylus
Gobiidae (gobies)
Glossogobius biocellatus 0 Periophthalmus sp. 1
Siganidae (spinefoot, rabbitfish) Siganus guttatus 1 Siganus lineatus 1
Trichiuridae (hairtail) Trichiurus lepturus 1
Scom bridae (mackerel)
Scomberomorus 32 semifasciatus Scombridae 0
Stromateidae (pomfret)
Parastromateus niger 7 Bothidae (flounder)
Pseudorhombus sp. 0 Cynoglossidae (sole)
Paraplagusia unicolor 1 Soleidae (sole)
Achlyopa nigra 2
Tetraodontidae (toadfish, puffers) Arothron hispidus 9 Arothron manilensis 2 Arothron reticularis 2 Chelonodon patoca 3 Marilyna pleurosticta 3 Tetraodontidae 0
56
1
1 0
1
8
16
335
63 24
0
172
391
95 33
14
17
1
229
26
2
1 0
0
1
0
26
6
0
1
0
2
8
1
7
1
0 2
32,370
0
0 869
0
11,319
3,875
45,878
367,136 138,527
27,794
52,668
52,662
9,569 4,061
9,608
13,077
31
511,008
499,153
231
0 981
196
290
34
10,291
0
9,174
0
2
450
15,768
383
2,559
12
17 0
24,528
2,545
436 0
316
3,369
4,416
46,578
112,505 26,947
0
59,949
31,639
22,598 2,548
5,345
8,756
339
158,693
109,193
281
4 0
0
24
0
9,113
28
0
245
0
477
12,966
253
10,734
4
0 4,100
Totals 51 families 141 total species
(129 closed, 111 open) 14,232 10,676 7,235,506 3,113,954