the effects of ocean acidification and eutrophication on
TRANSCRIPT

Western University Western University
Scholarship@Western Scholarship@Western
Electronic Thesis and Dissertation Repository
4-21-2014 12:00 AM
The Effects of Ocean Acidification and Eutrophication on the The Effects of Ocean Acidification and Eutrophication on the
Growth, Lipid Composition and Toxicity of the Marine Growth, Lipid Composition and Toxicity of the Marine
Raphidophyte Heterosigma Akashiwo. Raphidophyte Heterosigma Akashiwo.
Julia Rose Matheson, The University of Western Ontario
Supervisor: Dr. Charles G. Trick, The University of Western Ontario
A thesis submitted in partial fulfillment of the requirements for the Master of Science degree in
Biology
© Julia Rose Matheson 2014
Follow this and additional works at: https://ir.lib.uwo.ca/etd
Part of the Algae Commons, Aquaculture and Fisheries Commons, Bioresource and Agricultural
Engineering Commons, Lipids Commons, Marine Biology Commons, Organismal Biological Physiology
Commons, Physiology Commons, and the Plant Biology Commons
Recommended Citation Recommended Citation Matheson, Julia Rose, "The Effects of Ocean Acidification and Eutrophication on the Growth, Lipid Composition and Toxicity of the Marine Raphidophyte Heterosigma Akashiwo." (2014). Electronic Thesis and Dissertation Repository. 1983. https://ir.lib.uwo.ca/etd/1983
This Dissertation/Thesis is brought to you for free and open access by Scholarship@Western. It has been accepted for inclusion in Electronic Thesis and Dissertation Repository by an authorized administrator of Scholarship@Western. For more information, please contact [email protected].

i
THE EFFECTS OF OCEAN ACIDIFICATION AND EUTROPHICATION ON THE GROWTH, LIPID COMPOSITION, AND TOXICITY OF THE MARINE
RAPHIDOPHYTE HETEROSIGMA AKASHIWO.
(Thesis format: Monograph)
by
Julia Rose Matheson
Graduate Program in Biology
A thesis submitted in partial fulfillment of the requirements for the degree of
Master of Science
The School of Graduate and Postdoctoral Studies The University of Western Ontario
London, Ontario, Canada
© Julia R. Matheson 2014

ii
Abstract
Anthropogenic forcing, such as ocean acidification caused by rising carbon dioxide
emissions, and eutrophication due to increased nutrient loadings in run-off, are causing
major changes to the biogeochemistry of the oceans. As a consequence, coastal
phytoplankton are susceptible to altered biogeochemical environments. This study
examined the effect of a lower pH and increased levels of nutrients on the common
coastal harmful alga, Heterosigma akashiwo. Growth rates, maximal cell yields, neutral
lipid accumulation and toxicity of cells grown under various pH and nutrients regimes
were measured. Heterosigma akashiwo growth was near maximal when grown at lower
pH levels. There was a strong correlation between macronutrient concentration (nitrogen
and phosphorus) and physiological responses such as cell yield, toxicity, and neutral lipid
accumulation. Cells cultured on ammonium were less toxic that cells supplied with either
nitrate or urea as a nitrogen source. Neutral lipid accumulation and cell toxicity varied
under different environmental regimes but did not co-vary, indicating that
polyunsaturated fatty acid production was not the mechanism of toxicity. Based on the
ecophysiological profile, H. akashiwo will be both present and toxic in the future
nutrient-rich, acidified coastal ocean waters.
Keywords
Heterosigma akashiwo, Raphidophyceae, harmful algal blooms, HABs, toxicity, neutral
lipids, RTgill-W1 assay, Nile Red assay, eutrophication, ocean acidification.
iii
Acknowledgments
I would first like to acknowledge my supervisor Dr. Charlie Trick, for his immeasurable
contributions to my knowledge of marine phytoplankton and coastal processes. His
support throughout this process has been a beacon of light that has shone through the
darkness of my uncertainties, and shaped me into the researcher I am today.
To my advisory committee: Dr. Amarjeet Bassi, Dr. Mark Bernards, and Dr. Denis
Maxwell, thank you for providing your unique perspectives on my work and causing me
to reflect and make my project more robust than before.
I could not have completed this thesis without the training and support provided by my
lab mates, who took time out of their own research to help me with mine. To Brian
Sutton-Quaid, Jace McLaughlin, Scott McCain, Cayla Bronicheski, Melissa Raffoul and
Katrina Laurent, I owe you my sincerest gratitude. I also extend this thanks to Dr. Irena
Creed and the Creed lab members who provided valued input along the way. Lastly, I
acknowledge the assistance that NCB 4th floor lab members provided me. Thank you to
Yan, Avery, Dimitre, Meg, Anica, and everyone else who was willing to lend an ear or a
hand. Thank you Jenn, Bry, Jace, Chris, Joy and Jordan for your help during my writing.
Thank you to Dr. William Cochlan, Julian Herndon, Chris Ikeda, Dr. Mark Wells, the
HAB lab team, and the BIOS MO group for shaping my knowledge of theory and
analytical techniques pertaining to my thesis.
To the members of CES/the Environment & Sustainability collaborative program, thank
you for widening my perspectives, and supporting my passion for preserving our
environment. A special thanks to Dr. Shrubshole, Christie, Marnie & Holly.
Lastly, I would like to thank my friends and family for their continuous support over the
last two years. To my parents, who were always willing to provide me with a warm
home-cooked meal when needed, to my nanny for her constant generosity, and to my
poppy for reading/discussing my work. Thank you Josh for your professional pipette tip
filling skills that you were able to demonstrate time and time again.

iv
Table of Contents
Abstract ........................................................................................................................................................... ii Acknowledgements ......................................................................................................................................... iii Table of Contents ............................................................................................................................................. iv List of Figures .................................................................................................................................................. vi List of Tables ................................................................................................................................................ viii Acronyms and Abbreviations .......................................................................................................................... ix CHAPTER 1: INTRODUCTION
1.1 The Anthropocene ......................................................................................................... 1 1.2 The Future Ocean .......................................................................................................... 1
1.2.1 Ocean Carbon Chemistry ............................................................................... 2 1.2.1.1 Ocean Acidification ....................................................................... 3
1.2.1.1 Iron ............................................................................... 5 1.2.2 Ocean Eutrophication .................................................................................... 5
1.2.2.1 Nitrogen ......................................................................................... 6 1.2.2.2 Phosphorus ..................................................................................... 7 1.2.2.3 The Importance of the Nitrogen to Phosphorus Ratio ................... 7
1.2.3 Combined Impacts of Ocean Acidification and Coastal Eutrophication ....... 8 1.3 Harmful Algal Blooms (HABs) ..................................................................................... 8
1.3.1 Heterosigma akashiwo ................................................................................... 9 1.3.1.1 Heterosigma Bloom Events ........................................................ 10 1.3.1.2 H. akashiwo in the Salish Sea ...................................................... 11
1.3.2 Heterosigma akashiwo Growth ................................................................... 12 1.3.2.1 Unbalanced Growth ..................................................................... 13
1.3.3 Lipid Accumulation in Heterosigma akashiwo ........................................... 14 1.3.3.1 Quality Food Source .................................................................... 15 1.3.3.2 Algal Biofuels .............................................................................. 15 1.3.3.3 Toxic EFAs .................................................................................. 17
1.3.4 Heterosigma akashiwo Toxicity .................................................................. 18 1.3.4.1 Toxicity and Unbalanced Growth ................................................ 18
1.4 Study Statement ........................................................................................................... 19 1.4.1 Hypothesis ................................................................................................... 20 1.4.2 Objectives .................................................................................................... 20
CHAPTER 2: METHODS
2.1 Culture Preparation ....................................................................................................... 22 2.1.1 Isolate & Stock Culture Conditions .............................................................. 22
2.1.1.1 Cell Isolate .................................................................................... 22 2.1.1.2 Culture Conditions ........................................................................ 22
2.1.2 pH Adjustment & Maintenance .................................................................... 23 2.1.3 Inoculum ....................................................................................................... 23 2.1.4 Iron & pH Treatments ................................................................................... 23 2.1.5 Nitrogen & pH Treatments ........................................................................... 24 2.1.6 N:P & pH Treatments ................................................................................... 25
2.2 Experimentation ............................................................................................................ 26 2.2.1 Growth Measurements .................................................................................. 26
2.2.1.1 Daily Measurements of Cell Density ............................................ 26 2.2.1.2 Determination of Growth Rates .................................................... 26
v
2.3 Cell Assays ................................................................................................................... 27
2.3.1 Neutral Lipid Analysis: Nile Red Assay ...................................................... 27 2.3.1.1 Nile Red Assay: Algal Sample Preparation .................................. 27 2.3.1.2 Nile Red Assay: Modifications to SOP ........................................ 28 2.3.1.3 Nile Red Assay: Analysis ............................................................. 28
2.3.2 Toxicity Analysis: RTgill-W1 Cytotoxicity Assay ...................................... 28 2.3.2.1 Rainbow Trout Gill Cell Line Maintenance ................................. 28 2.3.2.2 Rainbow Trout Gill Cell Line Harvesting .................................... 29 2.3.2.3 RTgill-W1 Assay Preparation ....................................................... 29 2.3.2.4 RTgill-W1 Assay Algal Sample Preparation ................................ 30 2.3.2.5 RTgill-W1 Assay .......................................................................... 31
2.4 Data Analysis ................................................................................................................ 32 CHAPTER 3: RESULTS
3.1 Preliminary Experimentation ........................................................................................ 33 3.1.1 Determination of Peak Cell Yield, Neutral Lipid Accumulation and Toxicity ......................................................................................................... 33 3.1.2 Verification of Experimental pH Values ...................................................... 33
3.2 Specific Growth Rates of Heterosigma akashiwo 513 ................................................. 34 3.3 Maximal Cell Yields of Heterosigma akashiwo 513 .................................................... 37 3.4 Peak Neutral Lipid Accumulation in of Heterosigma akashiwo 513 ........................... 40 3.5 Heterosigma akashiwo 513 Toxicity ............................................................................ 42 3.6 Correlations Between Nutrients, pH and Physiological Responses ............................. 44 3.7 Nitrogen, Phosphorus, Neutral Lipids and Toxicity in H. akashiwo 513 ..................... 47 3.8 Nitrogen Concentrations and Heterosigma akashiwo 513 ........................................... 49
3.8.1 Specific Growth Rates .................................................................................. 49 3.8.2 Maximal Cell Yields ..................................................................................... 51 3.8.3 Peak Neutral Lipid Accumulation ................................................................ 53 3.8.4 Toxicity ......................................................................................................... 55
CHAPTER 4: DISCUSSION
4.1 Future Heterosigma akashiwo Bloom Formation ........................................................ 57 4.1.1 Specific Growth Rates .................................................................................. 57 4.1.2 Maximal Cell Yields ..................................................................................... 59
4.2 Impacts of Heterosigma akashiwo in the Future Ocean ............................................... 62 4.2.1 Neutral Lipid Accumulation in Heterosigma akashiwo ............................... 62
4.2.1.1 Implications of Altered Neutral Lipid Accumulation ................... 63 4.2.2 Heterosigma akashiwo Toxicity ................................................................... 64
4.2.2.1 Heterosigma akashiwo: Variable Toxicity ................................... 64 4.2.2.2 Heterosigma akashiwo: The Toxic Compound ............................ 65
4.3 N/P Concentration: A Regulator of H. akashiwo Physiology ...................................... 66 4.4 Heterosigma akashiwo HABs in the Future Ocean ...................................................... 67 4.5 Implications of Future HAB Presence .......................................................................... 68 4.6 Conclusion: The Big Picture ......................................................................................... 69
REFERENCES .............................................................................................................................. 70 CURRICULUM VITAE ............................................................................................................... 79

vi
List of Tables
Table 2.6 Concentrations of nitrate and phosphate in batch cultures of Heterosigma akashiwo…...………………………………………………………………….…………25
Table 3.6 Spearman’s rank correlation coefficients of dependent variables (growth rate, cell yield, neutral lipid accumulation, and toxicity) by independent (iron, nitrogen, and phosphorus concentrations, and pH) and dependent variables…………………………..46

vii
List of Figures Figure 1.2.1 The ocean carbon chemistry of atmospheric carbon dioxide dissolving into sea surface waters, reacting with water to form carbonic acid, bicarbonate/carbonate ions, and hydrogen ions, resulting in lowered pH………………………………………………3
Figure 1.3.2.1 A cell receiving sufficient inputs of photosynthetic reagents (light and CO2) and nutrients (based on the acquisition rate / cell quota) to support balanced cell growth (A) and insufficient nutrients resulting in unbalanced growth (B)………………14
Figure 3.1.2 The pH of acid/base titrated cultures of Heterosigma akashiwo 513 grown in ESAW + f/2 media with the addition of HEPES buffer at concentrations of 0 mM, 10 mM, 15 mM and 20 mM over a 21-day period……………………………..……………34
Figure 3.2 Specific growth rates of H. akashiwo grown in medium adjusted to a range of pH treatments (8.2 initially with no buffer; 8.1, 7.8 and 7.4), and (A) iron concentrations (11 µM and 0.1 µM), (B) nitrogen to phosphorus ratios (1:1, 3:1, 6:1, 12:1, 15:1, 24:1 and 48:1), and (C) nitrogen sources (nitrate, ammonium, and urea)…………………………36
Figure 3.3 Maximal cell yields of H. akashiwo grown in medium adjusted to a range of pH treatments (8.2 initially with no buffer; 8.1, 7.8 and 7.4), and (A) iron concentrations (11 µM and 0.1 µM), (B) nitrogen to phosphorus ratios (1:1, 3:1, 6:1, 12:1, 15:1, 24:1 and 48:1), and (C) nitrogen sources (nitrate, ammonium, and urea)…………………………39
Figure 3.4 Peak neutral lipid accumulation (as a percentage of the standard chemically defined lipid concentrate; CDLC) in H. akashiwo grown in medium adjusted to a range of pH treatments (8.2 initially with no buffer; 8.1, 7.8 and 7.4), and (A) iron concentrations (11 µM and 0.1 µM), (B) nitrogen to phosphorus ratios (1:1, 3:1, 6:1, 12:1, 15:1, 24:1 and 48:1), and (C) nitrogen sources (nitrate, ammonium, and urea)…………………………41
Figure 3.5 Peak toxicity in H. akashiwo grown in medium adjusted to a range of pH treatments (8.2 initially with no buffer; 8.1, 7.8 and 7.4), and (A) iron concentrations (11 µM and 0.1 µM), (B) nitrogen to phosphorus ratios (1:1, 3:1, 6:1, 12:1, 15:1, 24:1 and 48:1), and (C) nitrogen sources (nitrate, ammonium, and urea)………………………....43
Figure 3.6 Principal component analysis of the correlations between independent (iron, nitrogen, and phosphorus concentrations and pH) and dependent variables (growth rate, cell yields, neutral lipid accumulation, and toxicity) tested on Heterosigma akashiwo 513………………………………………………………………………………………..45
Figure 3.7 Peak neutral lipid accumulation (as a percentage of the chemically defined lipid concentrate standard) (top) and peak toxicity (bottom) in Heterosigma akashiwo at pH 8.2 and 7.4 across nitrogen (A&C) and phosphorus (B&C) concentrations…………48
Figure 3.8.1 Specific growth rates of H. akashiwo grown in medium adjusted to a range of pH treatments (8.2 initially with no buffer and 7.4), and nitrogen concentrations of (A) 10 µM and 100 µM N (12:1 N:P) (B) 200 µM and 880 µM N (24:1 N:P)………………50

viii
Figure 3.8.2 Maximal cell yields of H. akashiwo grown in medium adjusted to two different pH treatments (8.2 initially with no buffer and 7.4), and nitrogen concentrations of (A) 10 µM and 100 µM N (12:1 N:P) (B) 200 µM and 880 µM N (24:1 N:P)…….....52
Figure 3.8.3 Peak neutral lipid accumulation (as a percentage of the standard chemically defined lipid concentrate; CDLC) in H. akashiwo grown in medium adjusted to two different pH treatments (8.2 initially with no buffer and 7.4), and nitrogen concentrations of (A) 10 µM and 100 µM N (12:1 N:P) (B) 200 µM and 880 µM N (24:1 N:P)…….…54
Figure 3.8.4 Peak toxicity in H. akashiwo grown in medium adjusted to a pH of 8.2 (initially with no buffer) and 7.4, and nitrogen concentrations of (A) 10 µM and 100 µM N (12:1 N:P) (B) 200 µM and 880 µM N (24:1 N:P)…………………………………...56

ix
Acronyms and Abbreviations
ANOVA analysis of variance
CDLC chemically defined lipid concentrate
EBUS eastern boundary upwelling system
EDTA Ethylenediaminetetraacetic acid
EFA essential fatty acids
ESAW enriched seawater artificial water
HAB harmful algal bloom
HCl hydrochloric acid
HEPES 4-(2-hydroxyethyl)-1-piperazineethanesulfonic acid
L-15 Leibovitz L-15 medium
NaOH sodium hydroxide
pH -log [H+]
pHi initial pH of the culture
ppm parts per million
PUFA polyunsaturated fatty acid
SOP standard operating protocol
TAG triacylglyceride

x
“In the end we will conserve only what we love; we will love only what we understand; and we will understand only what we have been taught.”
~ Baba Dioum, 1968
“Don't blow it – good planets are hard to find.” ~ Quoted in Time Magazine, 1996
1
CHAPTER 1: INTRODUCTION 1.1 The anthropocene Anthropogenic activities are having profound effects on the Earth and its systems
(Steffen et al., 2011). Ecosystems are exhibiting dramatic changes on a variety of scales,
from nutrient levels to population dynamics (Rockström et al., 2009; Hallegraeff, 2010).
Climate patterns are becoming increasingly extreme and unpredictable (IPCC, 2012).
Since this is such a recent occurrence in the Earth’s history, the body of accompanying
research is still in its infancy (Corfee-Morlot et al., 2007). In order to prevent further
degradation and loss, there is a pressing need to understand the influence of
anthropogenic activities on ecosystems (IPCC, 2007). In response, researchers have
begun to answer such questions using a variety of approaches, from laboratory-based
hypothesis testing to field-based observational studies, each with their own merit (Glibert
and Burkehold, 2006; Hallegraeff, 2010). One major Earth system that is being
negatively impacted by human activities and negatively affecting human activities as a
result, is the ocean (Royal Society, 2005).
1.2 The future ocean The oceans have a great capacity to buffer against change; as such they have
remained relatively stable since the last ice age (Zeebe, 2012). The future ocean,
however, may bear few similarities to the ocean of today. Industrialization, intensified
agriculture practices and coastal development are directly impacting oceans via the
release of nutrient-rich run-off into coastal waters (Cloern, 1999). This “cultural
eutrophication” is contributing to massive algal blooms, and subsequent hypoxic “dead
zones” (Rosenberg and Loo, 1988). Carbon emissions, a defining feature of the current

2
anthropogenic era, have caused atmospheric levels of carbon dioxide to rise (Doney et al.,
2009). The ocean serves as one of the largest carbon reserves on Earth, absorbing nearly
one third of all carbon dioxide emissions (Zeebe, 2012). However, the ocean’s capacity to
absorb excess carbon is reducing with each increment of intensification of global carbon
emissions (Royal Society, 2005). When this tipping point is breached, it would require in
the order of 10,000 years or more for deep mixing to restore our oceans buffering
compounds and sea surface pH to their former state (Royal Society, 2005). One of the
indirect effects of increasing global carbon emissions, with its own set of accompanying
problems, is ocean acidification (Doney et al., 2009).
1.2.1 Ocean carbon chemistry
Atmospheric carbon dioxide levels have risen from ~315 ppm to almost 400 ppm
since 1960, and are predicted to increase to ~750 ppm by 2100 (IPCC, 2007). As
atmospheric CO2 concentrations climb, increased oceanic uptake via dissolution into
seawater causes an increased concentration of CO2 throughout much of the upper ocean
(Denman et al., 2011). This results in the production of the intermediary carbonic acid
(H2CO3) followed by bicarbonate (HCO3-), carbonate (CO3
2-), and hydrogen ions (H+).
The overall result of this change in seawater-chemistry is a shift towards increased
oceanic H+ concentrations (lower pH) (Shi et al., 2010) (Figure 1.2.1).

3
Figure 1.2.1 The ocean carbon chemistry of atmospheric carbon dioxide dissolving into sea surface waters, reacting with water to form carbonic acid, bicarbonate/carbonate ions, and hydrogen ions, resulting in lowered pH.
1.2.1.1 Ocean acidification Since the industrial revolution, mean global surface water pH has decreased by
0.1 pH units (Denman et al., 2011). Based on various carbon dioxide emission regimes,
from conservative to business-as-usual emission scenarios, pH could drop by another
0.10 to 0.35 units by the year 2100 (Orr et al., 2005). This represents a 30 to 105%
increase in ocean acidity, respectively. It is important to emphasize that these declines in
pH are averaged global values. Certain coastal upwelling regions, like the eastern
boundary upwelling systems (EBUS) off the west coast of North America, are already
experiencing levels of ocean acidification predicted for surface waters at the end of this
century (Feely et al., 2008). Seasonal decreases in pH to ~ 7.7 or less have already been
recorded in such CO2–rich, nutrient-replete upwelling systems, and the pH of these
upwelling regions could drop to as low as 7.4 by the end of the century (Feely et al.,
2008).
4
Although reduced rates of calcification (shell-deterioration of calcareous marine
organisms) are most commonly associated with ocean acidification, lower pH can impact
other aspects of marine biogeochemistry such as the cycling of nutrients and their
interaction with biological organisms. Ocean water pH influences bioavailability of
macronutrients and trace metals, which impact the marine food chain (Royal Society,
2005). For instance, when pH sensitive nutrients, like iron, are limiting to most species of
phytoplankton, an increase caused by acidification could have a severe impact on species
composition and population dynamics.
The composition of the phytoplankton population can also change based on
alterations in the pH-associated levels of inorganic carbon. Certain species may not be
influenced by pH-induced carbon concentrations, should they possess a carbon
concentrating mechanism (CCM)(Raven et al., 2011). CCMs allow for the concentration
of carbon dioxide around the RuBisCO enzyme, allowing for higher photosynthetic
efficiency (Reinfelder, 2010). CCMs also contain a putative HCO3- transporter, which
serves as an additional source of inorganic carbon within the cell (Raven et al., 2011).
More acidic ocean contains more CO2 and HCO3-, so cells with a CCM are less likely to
experience carbon-limitation (Reinfelder, 2010). However, recent investigation has
shown a reduced affinity for carbon in CCM-containing algae grown under high CO2 and
in some cases, a loss of expression of the CCM (Raven, 2010; Raven et al., 2011). This
could translate to algal species that lack a CCM being more likely to out compete those
with a CCM, who could lose their competitive advantage, under high CO2 conditions
(Reinfelder, 2010).

5
1.2.1.1.1 Iron
Iron is required in many cellular structures that enable nitrogen use within the cell
(Raven, 1988). Its oxidation-reduction properties allow iron to facilitate electron
transport. Iron based enzymes (ferredoxins) are also able to reduce inorganic nitrogen
species (nitrate and nitrite) to provide phytoplankton with a usable nitrogen supply
(Morel et al., 1991).
In most of the ocean, iron is also the micronutrient that limits the growth of
phytoplankton (Boyd et al., 2007). The majority of Fe(III) are either bound by chelators
or found within the highly insoluble neutral tri-hydroxy species Fe(OH)3 (Shi et al.,
2010). Iron uptake rates in some phytoplankton have been shown to drop by 10-20 %
when the pH drops from ~8.4 to ~7.4, which could be due to natural iron scavenging
ligands being less effective chelators at low pH values (Shi et al., 2010). However, for
ambient organisms that do not produce iron-organic ligands, a drop in pH from 8.1 to 7.8
will increase the solubility of iron in the ocean waters, increasing bioavailability
(Breitbarth et al., 2009).
1.2.2 Ocean eutrophication
The concentration of macronutrients (nitrogen and phosphorus) in the open ocean
is very minimal compared to most freshwater ecosystems (Hecky et al., 1993). However,
the concentration tends to increase in coastal regions, and zones of extreme upwelling
(Capone and Hutchins, 2013). This phenomenon can cause coastal ocean waters to
become nutrient-rich, fueling the growth of primary producers (Rosenberg and Loo,
1988).

6
1.2.2.1 Nitrogen
Agricultural fertilizers, effluent, and atmospheric deposition all lead to increasing
levels of nitrogen in coastal waters (Davidson et al., 2012). Nitrogen has an essential role
in the formation of amino acids, proteins and chlorophyll a, and as such, cellular
requirements are also high. Although nitrogen (N2) makes up ~78% of the atmosphere,
phytoplankton are unable to fix this into a useable form, making nitrogen the most
limiting macronutrient in ocean waters. Oceanic nitrogen is normally present in the form
of ammonium (NH4+), nitrate (NO3
-) or urea (CH4N2O) (Flynn and Butler, 1986). The
concentration of nitrogen, found as nitrate, ammonium, and urea, in the open ocean are 0-
50 µM N, 0-2 µM N, and 0-1 µM N respectively, while the concentrations that can be
found in coastal waters are 500 µM N, 600 µM N, and 25 µM N respectively (Collos &
Berges, 2004).
In terms of dissolved inorganic nitrogen, ammonium is readily useable by
phytoplankton, however nitrate needs to be further reduced to nitrite (NO2-) and then
ammonium before it can be assimilated into the cell. Organic nitrogen can most often be
found as urea, which after being transported through the cell membrane, is divided into
ammonia (NH3) and CO2 (Tamminen & Irmisch, 1996; Rukminasari & Redden, 2011).
Approximately 70% of nitrogen fertilizers now contain urea in place of inorganic
nitrogen sources (Gilbert, 2006).
In addition to increased nutrient loadings, recent studies examining the effects of
ocean acidification on the oceanic nitrogen cycle have reported that a drop in pH results
in lower rates of nitrification (Beman et al, 2011). Nitrification involves the oxidation of
ammonium to nitrite and then nitrate by marine bacteria (Huesemann et al., 2002). Over

7
30% of marine primary production is supported by nitrification that occurs within the
uppermost 80 m of the water column (Yool et al., 2007). As such, when pH levels
decrease, there are lower rates of nitrification, and hence more ammonium available
(Beman et al, 2011). There is a subsequent need for a better understanding of the
influences of changes in coastal nitrogen inputs, as well as pH and nitrification rates on
the phytoplankton community.
1.2.2.2 Phosphorus
Phosphorus (P) commonly enters marine aquatic systems via sewage, phosphorus-
based detergents, fertilizers and manure. Over 75% of phosphorus loadings to coastal
zones have been attributed to anthropogenic sources, with the remainder being a result of
natural weathering processes (Harrison et al., 2010). The average open ocean surface
water concentration of inorganic phosphorus is ~0.015 µM P, while average coastal
concentrations range from 0.2-2.0 µM P (Benitez-Nelson, 2000; McLaughlin et al.,
2004).
Algal cells are able to attain P via the uptake of phosphate (PO43-), which is
essential for the synthesis of a wide range of macromolecules including nucleic acids,
proteins and ATP. Increased P-loadings into the system can skew the ratio of N:P, which
can trigger unbalanced growth within phytoplankton (Davidson et al., 2012). On the other
hand, P-limitation has been proven to trigger toxin production in certain species of
phytoplankton (Fu et al., 2008; Fu et al., 2010; Sun et al., 2011; Hardison et al. 2013).
1.2.2.3 The importance of the nitrogen to phosphorus (N:P) ratio
Anthropogenic inputs of nitrogen and phosphorus have been shown to
“artificially” control the ratio of N to P in coastal waters. The global ocean average ratio

8
and cellular requirement of N:P according to Redfield (1953) should be approximately
16:1. There is, however, notable variation in elemental ratios between marine species.
This means that a different phytoplankton may have the ability dominate, based on their
cellular requirements and the environmental ratio of N:P. This has led many to believe
that algal dominance, and toxin production of certain types of phytoplankton are
governed by N:P, while levels of nitrogen are responsible for overall bloom formation.
1.2.3 Combined impacts of ocean acidification and coastal eutrophication
Ocean acidification and coastal eutrophication also exert synergistic effects on
ocean biogeochemistry. Ocean water pH influences bioavailability of macronutrients and
trace metals. When pH sensitive micronutrients, like iron, are currently considered
limiting to most species of phytoplankton, an increased bioavailability, caused by
acidification, can have a severe impact on species dynamics (Breitbarth et al., 2009;
Royal Society, 2005). This change in nutrient availability can alter both organism
physiology and community structure, which can allow for the proliferation of certain
toxic algal species such as H. akashiwo (Fu et al., 2008; Fu et al., 2010; Sun et al., 2011;
Hardison et al., 2013).
1.3 Harmful algal blooms (HABs)
Modern day harmful algal bloom (HAB) events are a consequence of modified
coastal environments (Anderson et al., 2002; Kudela et al., 2008; Davidson et al., 2012).
During HAB events, members of the phytoplankton community that exert adverse effects
on the surrounding ecology replace the naturally occurring phytoplankton community
(Smayda, 1997). The presence of HAB species may result in an alteration of the natural
food chain, a change in water quality and/or the presence of a marine toxin (Anderson et

9
al., 2002; Horner et al., 1997; Van Dolah, 2000). These alterations can negatively
influence the relationship between humans and coastal resources (Khan et al., 1997;
Tiffany et al., 2001; Kempton et al. 2008). While there have been reports of HAB events
for hundreds of years, modern day HABs are generally thought to be the result of human
modification of coastal water quality (Quayle, 1969; Hallegraeff, 1993).
There is a general consensus that the frequency of HAB events has increased over
the last few decades (Smayda, 1990; Hallegraeff, 2010). Factors that are often implicated
in this increased frequency include coastal eutrophication (Anderson et al., 2002; Kudela
et al., 2008) and increased deposition of novel nitrogen to coastal waters (e.g., urea-based
fertilizers) (Glibert et al., 2005; 2006). Other large-scale factors include climate change,
the stabilization of coastal surface waters, and the general increase in human population
and the subsequent rise in run-off from coastal societies. Some researchers propose that
the increased frequency of HAB reports is due primarily to the “observer effect” – there
are more people watching the coastal waters and reporting incidents now. To illustrate
this point, the 1st International Meeting of HABs in 1972 drew 15 researchers, while the
14th International HABs Meeting in 2010 had over 450 attendees. Whether there are more
observers or more environmental outbreaks remains to be determined. There is, at
present, no single factor that describes the increased frequency of HAB events.
1.3.1 Heterosigma akashiwo
Heterosigma akashiwo causes red tides throughout the world and is a grave
concern for natural and penned fisheries. Heterosigma akashiwo can be found in
temperate coastal waters worldwide, and has been observed off the coast of all continents
other than Antarctica. Heterosigma akashiwo is classified in the class Raphidophyceae,

10
order Chattonellales and family Chattonellaceae (Throndsen, 1997). Hetero is Greek for
‘different,’ sigma is Greek for ‘curves,’ and akashiwo is Japanese for ‘red sea water’
(Throndsen, 1997). Heterosigma akashiwo is appropriately named based on its cellular
appearance of variable shape, which has been described as ranging from potato-like to
lumpy or cornflake-like, and its characteristic red discolouration of the coastal waters of
Japan (Horner, 2002). As the cells range in size from 10-25 µm in length, 8-15 µm in
width and are ca. 4 µm thick, H. akashiwo is a nanoplankton (Smayda, 1998). A single
cell contains up to 95 chloroplasts, a high number relative to other phytoplankton species
(Smayda, 1998).
Despite its fragile cell wall and ~10-20 µm diameter, H. akashiwo (Hada) Hada
ex Y. Hara & M. Chihara is a marine raphidophyte capable of producing dense golden-
brown toxic blooms (Hara & Chihara, 1987). This particular species has two
heterodynamic flagella – appendages able to move independently of one another – that
allow vertical migration in the water column (Band-Schmidt et al., 2004).
1.3.1.1 Heterosigma bloom events
H. akashiwo blooms have been associated with the mortality of cultivated fish in
the coastal regions of many countries, including Canada (Haigh and Taylor, 1990), the
United States of America (Horner et al., 1997), Japan (Honjo, 1993), China (Tseng et al.,
1993), Australia (Ajani et al., 2001), New Zealand (Chang et al., 1993), Denmark,
Sweden, Chile, and Brazil (Honjo, 1993). More recently, blooms have also been observed
along the coasts of the southwestern United States of America (Herndon, 2003) and
Mexico (Band-Schmidt et al., 2004). Its fish-killing, or ichthyotoxic, mechanism remains
somewhat ambiguous, despite previous scientific investigations (Ono et al., 2000; Twiner
11
et al., 2001; Fredrickson et al., 2011).
1.3.1.2 H. akashiwo in the Salish Sea
In some locations, there have been well-documented increases in the negative
effects of this particular HAB species. In the Salish Sea region, the species Heterosigma
akashiwo forms nearly mono-specific blooms – meaning they are the dominant species
contributing to the bloom.
The Salish Sea is an estuarine system that includes the Juan de Fuca Strait, the
Strait of Georgia and Puget Sound, and is bordered by British Columbia (Canada),
Washington State (United States of America), and the Pacific Ocean. The surface waters
in this region span ca. 18,000 km2 and the Salish Sea drainage basin is ca. 110,000 km2
(Jarvis et al., 2008). Heterosigma akashiwo has been documented in this region since
1976, with reported increases in bloom frequency and densities beginning in the year
2000 and continuing to present (Gains and Taylor, 1986; Rensel et al., 2010). This region
is part of the Eastern Boundary Upwelling System and receives nutrient-rich, acidified
inputs from coastal wind-driven upwelling during summer and fall months (Feely et al.,
2008). The pH in the Salish Sea varies seasonally from as low as 7.6 to 8.5. Nutrient-rich
waters, in the form of run-off, also enter the system from the Fraser River, which drains
into the Strait of Georgia. The seasonal drop in pH and enrichment of nutrients from deep
waters make this region an ideal study zone for changes in global ocean acidification and
eutrophication of coastal waters forecasted for the end of the century. It is interesting to
note that blooms of H. akashiwo have been on the rise in this region (Rensel et al., 2010).
Deemed the most significant fish-killing HAB species in Pacific Northwest
coastal waters, H. akashiwo has caused massive aquaculture fish kills and associated loss

12
in revenue (Rensel et al., 2010). Heterosigma akashiwo may have a direct influence on
the survivorship of natural salmon populations, as there was a strong correlation between
bloom events in the Strait of Georgia, BC and survival rates of Fraser River sockeye
salmon (Rensel et al., 2010). Nearly 650 million Atlantic salmon have been killed by a
lone harmful algal bloom event (Rensel, 1995). In terms of economic impact, the annual
estimated cost of HABs to the United States of America is $50 million (Anderson et al.,
2000). This is listed as moderate, and takes into account public health costs, losses to the
tourism industry, monitoring and management, as well as aquaculture losses.
1.3.2 Heterosigma akashiwo growth
The response of raphidophyte species to increased carbon dioxide concentrations/
lower pH was the subject of a recent investigation (Fu et al., 2010). Higher CO2
concentrations, resulting in lower pH, could increase phytoplankton growth and/or affect
inter-species competition (Fu et al., 2008). Heterosigma akashiwo were found to have
stimulated growth under elevated CO2 concentrations alone, while the dinoflagellate
Prorocentrum minimum experienced no significant change (Fu et al., 2008). Future ocean
conditions (lowered pH and/or increased temperature) were shown to promote significant
increases in growth rates of H. akashiwo compared to controls (Fu et al., 2008; Sun et al.,
2011).
Experiments modelling future ocean conditions, with respect to both pH and
temperature, show the elemental composition of H. akashiwo shifting towards a lower
cellular P requirement (Fu et al., 2008; Sun et al., 2011). Under high temperature and low
pH conditions, the elemental ratios of N:P and C:P both increased, while C:N remained
relatively similar when compared to the control (Fu et al., 2008). Variation in elemental
13
ratios between marine species means that a H. akashiwo could dominate, based on their
cellular requirements.
The paradox of the eutrophication situation is that, despite the large supply of
nitrogen available to coastal phytoplankton, growth-limitation can occur if levels of P are
unable to support growth. Phosphate (PO43-) can effectively limit growth when nitrogen
inputs are in excess (Rudek et al., 1991). Based on contemporary food production needs –
requiring heavy applications of N-based fertilizers – coastal N input is increasing much
faster than P (8x and 3x respectively) (Smil, 2001). Cells are able to cope with minor
disruptions to phosphorus supplies by dipping into cellular reserves of polyphosphates
(Harrison et al., 1990). However, if environmental P continues below cell subsistence
quota for too long, growth may be negatively affected (Harrison et al., 1990).
1.3.2.1 Unbalanced growth
Balanced growth occurs when all cellular components are manufactured at a
steady rate that is relative to one another allowing for maximum rates of cell division
(Prescott et al., 1999) (Figure 1.3.2.1 A). The unbalanced growth model, however, is
based on the comparative rates of carbon, nitrogen and phosphorus acquisition, relative to
the acquisition of energy from photosynthesis. This is analogous in nature to the “Redox
Balance” proposed by Maxwell et al. (1995). Unbalanced growth results in the
differential rates of production of certain cellular components relative to others (Prescott
et al., 1999). This can take place when the rate of incorporation of nutrients into the cell
is less than the division rate of the cell. Unbalanced growth scenarios have been shown to
result in differential cellular composition of H. akashiwo, specifically with regards to
lipid production (Fuentes-Grünewald et al., 2012).

14
1.3.3 Lipid accumulation in Heterosigma akashiwo
When phytoplankton photosynthesize, the resulting cellular constituents are
carbohydrates, protein, and lipids. Cells that are undergoing balanced growth tend to
allocate the majority of photosynthetically derived resources towards protein (~50%), and
carbohydrate (~40%) production, with lipids accounting for a relatively small proportion
(~10%) (Geider & La Roche, 2002). The lipids produced in this scenario are mainly
structural, membrane polar lipids, and their accumulation remains quite constant over
time. If growth becomes unbalanced, however, the phytoplankton will shift production
towards much greater proportions of lipids (~50%), and lesser amounts of carbohydrates
(~30%), and proteins (~20%) (Geider & La Roche, 2002). Lipids in the cell undergoing
unbalanced growth are primarily neutral lipids (triacylglycerol or TAG), which are highly
variable in terms of accumulation (Hu, 2008). These are high carbon energy stores,
within the cytoplasm, that are utilized to sustain metabolic requirements when needed
(Fuentes-Grünewald et al., 2012). These shifts in cellular composition can impact other
marine organisms, as they rely upon phytoplankton as a food source. Cellular
Figure 1.3.2.1 A cell receiving sufficient inputs of photosynthetic reagents (light and CO2) and nutrients (based on the acquisition rate / cell quota) to support balanced cell growth (A) and insufficient nutrients resulting in unbalanced growth (B).

15
composition also has an impact on biofuel production strategies (Sharma et al, 2012).
Most recently investigated, cellular composition could also alter the production of
allelopathic and/or toxic agents (Ikawa, 2004).
1.3.3.1 Quality food source
Phytoplankton account for 45% of the earth’s primary production, and are the
base of the oceanic food web. As such, their presence is required to provide energy that
supports the proliferation of higher trophic levels (Rossoll et al., 2012). One of the unique
roles of phytoplankton is the synthesis of essential fatty acids (EFAs). Marine predators
are not able to generate essential fatty acids de novo, and rely upon bioaccumulation from
their diet (Igarashi et al. 2007).
Long chain polyunsaturated fatty acids (PUFAs), such as omega-3 and -6 fatty
acids, can effectively control the growth and reproductive health of organisms of a higher
trophic level (Veloza, 2005). Humans can be considered part of this trophic system, and
are recommended to consume fish, supplements, etc. to acquire omega-3 and -6 fatty
acids. Polyunsaturated fatty acids are non-constitutive, fluctuating components of neutral
lipids (Hu, 2008). Production of PUFAs varies over space and time, in that they
accumulate during conditions of environmental stress (Liu et al., 2008). As such, ocean
acidification and nutrient modification can lead to unbalanced growth, which impacts the
production of PUFAs in phytoplankton, affecting their quality as a food source for marine
organisms (Rossoll et al., 2012).
1.3.3.2 Algal biofuels
The lipid composition of phytoplankton is of particular interest to those in the
field of third-generation biofuel development. Biofuels are currently harvested from food

16
crops such as oil palm, coconut, and rapeseed. The issues that arise with this form of
biofuel are the dilemma of fuel versus food – should food crops be used for fuel for the
affluent as opposed to a food source for those in need – and the large amount of resources
(fertilizers, fresh water, etc.) and acreage required to grow the crops (Singh et al., 2011).
Algal biofuels are unique in their ability to yield oil volumes per acre that are in the range
of an order of magnitude greater than the most efficient food crops (Hu, 2008; Singh et
al., 2011). Additionally, they can be grown in seawater, which reduces the strain on fresh
water resources.
Heterosigma akashiwo, and other raphidophytes, are capable of producing
relatively rapid yields (0.55 divisions per day) of high biomass productivity (185,000
cells mL-1) (Fuentes-Grünewald et al., 2012). Studies examining H. akashiwo
productivity against both neutral lipid content and lipid profiles justify its use in the algal
biofuel industry (Doan et al., 2011; Fuentes-Grünewald, 2012). An emerging field of
research has discovered that modification of abiotic parameters can enhance neutral lipid
(oil) production in microalgae. Modification of nutrient inputs, light, temperature, and
salinity have been shown to alter neutral lipid levels (Hu, 2008; Fuentes-Grünewald et al.,
2012). Increased neutral lipid production allows for higher yields of biodiesel, and
manipulation of abiotic parameters is a part of the most cost-effective and simplistic ways
to accomplish this (Fuentes-Grünewald et al., 2012). The influences of pH and nutrient
speciation on neutral lipid production have only just begun to be examined (Singh et al.,
2011).

17
1.3.3.3 Toxic EFAs
Marine microalgal essential fatty acids (EFAs) have been shown to exert negative
allelopathic effects on other algal species, inhibiting growth, reproductive success, and/or
survival (Ikawa, 2004). In this sense, EFAs could be controlling which algal species is
dominant in the marine phytoplankton community, while also exerting toxic effects on
other marine organisms, notably fish species.
PUFAs in particular are known to increase phospholipid membrane permeability
at concentrations of an order of magnitude lower than saturated fatty acids (Castaing et
al., 1993). This may be the mechanism through which Heterosigma akashiwo exerts toxic
effects on marine finfish and allelopathic effects on co-occurring marine organisms.
Fibrocapsa japonica, another raphidophyte, was found to produce high concentrations of
PUFAs, which caused mortality in brine shrimp (Artemia salina), inhibition of Allivibrio
fischeri bioluminescence, as well as mortality in European seabass (Dicentrarchus
labrax) (Pezzolessi, 2010). Okaichi (1989) found two PUFAs were produced
corresponding to the death of yellowtail within a bloom of yet another raphidophyte,
Chattonella antiqua. The PUFAs were described as stearidonic acid (18:4(n-3)) – an
omega-3 polyunsaturated fatty acid – and hexadecatetraenoic acid (16:4(n-3)) (Okaichi,
1989). The PUFAs had an adverse interaction with the mucosal lining of the fish gill
cells, which resulted in swelling, reduced gas exchange, lack of oxygen, and asphyxiation
(Toyoshima et al., 1989). The proposed mechanism of toxicity – gill cell interaction – is
important when selecting an appropriate bioassay to gauge algal toxicity.

18
1.3.4 Heterosigma akashiwo toxicity
The exact mechanism of Heterosigma ichthyotoxicity has yet to be determined.
Proposed mechanisms involve the release of a brevetoxin-like compound, or more
recently, the production of EFAs, specifically PUFAs (Haque & Onoue, 2002; Okaichi,
1989). For the purposes of this study, the primary focus of toxicity research will be to
investigate possible regulators of the toxic mechanism in question and secondly, to
determine if the toxic response correlates to PUFA accumulation.
The most common regulator of H. akashiwo toxicity is thought to be the
disruption of cell growth caused by the depletion of a given macronutrient, in relation to
the others (Twiner et al., 2001; Fu et al., 2010; Fredrickson et al., 2011). The primary
macronutrients that limit the growth of the cells include nitrogen and phosphorus (Glibert
& Burkholder, 2006). Over the last two decades, each element has been implicated as the
toxicity inducer (Fu et al., 2010; Kudela et al., 2008). Recently, low iron availability
within HAB events has been considered the stimulus of toxin production (Ling & Trick,
2010). The rationale is that the low availability of iron in coastal waters regulates the
efficiency of nitrogen use, and alters the competitive ability of the species. The exact
trigger(s) of toxicity has yet to be confirmed.
1.3.4.1 Toxicity & unbalanced growth
The balance between macronutrient availability and iron might suggest that
toxicity is caused by an unbalanced growth scenario, rather than the absolute nutrient
deficiency (Ling & Trick 2010; Powers et al. 2012). This model moves our attention
away from the view that toxins are predatory molecules and towards the idea that toxins
are waste products of cell growth (Trick, 2012).

19
Another aspect of unbalanced growth and H. akashiwo toxicity relates to ocean
acidification. If the relative supply of N, P, and Fe control the balance of cellular
metabolites, the acidification of coastal waters – and the corresponding alteration of the
nutrient biogeochemical cycles discussed earlier – may strongly influence H. akashiwo
toxicity.
Fu et al. (2010) demonstrated that a toxic species of dinoflagellate, Karlodinium
veneficum, produced more of the toxic compound karlotoxin (KmTx-1) under lower pH
conditions, especially when paired with nutrient limitation of phosphorus. Similar results
were obtained for the harmful bloom diatom, Pseudo-nitzschia multiseries, which
produced elevated levels of domoic acid under both acidified P-limited and acidified Si-
limited conditions (Sun et al., 2011; Tatters et al., 2012).
1.4 Study statement
Changes to phytoplankton physiology in response to the potentially interactive
effects of pH and nutrient levels have been demonstrated (Fu et al., 2010; Sun et al.,
2011; Tatters et al., 2012). This thesis focused on gaining a better understanding of the
effect that factors predicted for the future ocean have on a common coastal HAB genus,
Heterosigma. The main objectives were to determine if modelled future ocean conditions
of low pH, higher nitrogen, and variable iron would adversely affect the ecological
importance of this genus. I used the cellular growth rate to assess if the genus has the
capacity to grow under the predicted new ocean conditions. Toxicity levels indicated if
there would be adverse effects of the genus in the water column. An assessment of the
neutral fatty acids provided insight into two critical aspects of Heterosigma ecology: are
neutral fatty acids the mechanism of fish-killing potential and are levels of neutral fatty
20
acids indicative of a species that would supply fatty acids to the fecundity of the next step
in the food chain (zooplankton) (Fu et al., 2010; Sun et al., 2011; Fuentes-Grünewald et
al., 2012). Results from this thesis are critical to understanding the consequences of
Heterosigma in the water column, and will influence natural food web dynamics
(including the domination of this genus as a HAB), fish-rearing aquaculture and biofuel
industries.
1.4.1 Hypothesis
The main hypothesis of this study is that Heterosigma akashiwo will remain a
potential HAB species under the new ocean conditions. To remain a potential HAB
species, this genus must maintain its growth rate and nutrient-use efficiency, decrease
levels of neutral lipid levels to reduce the consumption by zooplankton, and increase its
toxicity under novel nutrient-rich conditions and lower pH values projected for future
ocean waters.
1.4.2 Objectives
In order to test the above hypothesis, multiple objectives were established. The
first objective was to measure the change in growth rate and cell yield across a suite of
nutrient (nitrogen, phosphorus, and iron) concentrations and pH levels (7.4, 7.8, 8.1).
This will help predict H. akashiwo bloom frequency and intensity in future nutrient-rich,
acidic ocean waters.
The second objective was to detect how changing nutrient and pH regimes will
alter the neutral lipid content of H. akashiwo. Cells with higher amounts of neutral lipids
could be a lower quality food source and indicate an inability to support marine

21
ecosystem productivity, lowering predation. They also indicate PUFA production, which
has been linked to both allelopathy and ichthyotoxicity.
The third objective was to gauge the toxicity of H. akashiwo under altered
nutrient and pH conditions using a RT-gillW1 assay. As this HAB species exhibits
variable toxicity, it is critical to examine under modelled future ocean conditions.

22
CHAPTER 2: METHODS 2.1 Culture Preparation 2.1.1 Isolate & stock culture conditions
2.1.1.1 Cell isolate
Heterosigma akashiwo isolate 513 was chosen for this study. This isolate was
originally collected from the waters of Puget Sound, Washington, USA, where this
species is common and has a history of finfish devastation. The isolate was maintained in
the Northwest Fisheries Service Center and was given the designation NWFS 513. The
alga has been maintained as a unialgal, non-axenic strain.
2.1.1.2 Culture conditions
Stock cultures were grown at 10% (v/v) inoculum in 1 L Erlenmeyer glass flasks.
Flasks contained 270 mL of autoclave sterilized (to 135 ˚C and 30 psi over 60 minutes)
nutrient enriched artificial seawater (ESAW) medium with specified modifications as
implemented by Herndon and Cochlan (2007), and 30 mL of inoculum (Harrison et al.
1980; Berges et al. 2001). All flasks were autoclaved prior to use, after being fitted with
cheesecloth-wrapped non-absorbent cotton stoppers, which were then covered with
aluminium foil. Cultures were grown at 19 °C under cool white fluorescent light, at a
constant irradiance of 65-80 µmol photons m-2s-1. Irradiance was measured using a
Quantum Scalar Laboratory 2100 irradiance sensor (Biospherical Instruments, San
Diego, CA). Stock cultures were maintained in exponential phase by subculturing every
4-5 days.

23
2.1.2 pH adjustment & maintenance
For all experimental treatments 4-(2-hydroxyethyl)-1-piperazineethanesulfonic
acid (HEPES) buffer was added to the media at a final concentration of 20 mM in order
to maintain desired pH (Harrison & Berges, 2005). Sodium hydroxide (2 M NaOH) and
hydrochloric acid (4.1M HCl) were titrated into the media to attain the experimental pH
levels of 8.1, 7.8 or 7.4, representing current average global ocean pH, global average
ocean pH projected for 2100, and the pH of surface waters in the Eastern boundary
upwelling system (EBUS) projected for 2100, respectively (IPCC, 2007). The flasks were
swirled by hand throughout the titration process. A Thermo ScientificTM OrionTM 2-Star
Benchtop pH meter was used to measure pH levels during titration. The buffered and
titrated media was allowed to attain homogeneity for approximately 1 hour at 19 °C, prior
to inoculation.
2.1.3 Inoculum
Stock cultures of H. akashiwo 513 in stationary phase were used as inoculum for
all experiments. This growth phase was chosen to reduce the transfer of nutrients.
Inoculation was performed under aseptic conditions in a laminar flow hood, using a
serological pipette, and added until the final culture volume was inoculated to 10% (v/v).
Stock cultures were gently swirled prior to inoculation, and experimental cultures were
gently swirled post-inoculation.
2.1.4 Iron & pH treatments
All media stocks were chelated using ethylenediamine tetra-acetic acid (EDTA) to
facilitate the modification of the original ESAW iron levels for the purposes of this
experiment (Price et al. 1988/1989). The volume of modified ESAW salts amended with

24
f/2 nutrients was then divided evenly into two separate allotments and enriched with
ferric chloride to attain the desired level of iron. A ferric chloride (FeCl3) concentration
of 0.1 µM was used for iron-deplete treatments, and 11 µM was used for iron-replete
treatments. These values were selected based on preliminary work done by Ling and
Trick (2010) and Bronicheski (2014) involving Heterosigma growth characterization
over a wide range of iron concentrations. A 270 mL volume of media was added to each
1 L flask and buffered and titrated, with the exception of the controls, which remained
without HEPES at the medium’s ambient pH of 8.2. Flasks were then inoculated with 30
mL of culture that had been grow in either iron-replete or deplete conditions for 10+ days
(at least 8 generations) to adjust to their respective treatment conditions. Each treatment
was repeated 3 times, for a total of 20 samples per experiment. The experiment was
conducted in triplicate, non-concurrently.
2.1.5. Nitrogen & pH treatments
Modified ESAW salts with f/2 nutrient medium were enriched with one of nitrate
(as NaNO3), ammonium (as NH4Cl), or urea (as CH4N2O) as the source of nitrogen.
Nitrogen concentrations were maintained at 10 µM N across all three nitrogen sources, in
a constant 12:1 ratio of nitrogen to phosphorus. Standard ESAW + f/2 medium ferric
chloride concentration of 11 µM of was used. A 270 mL volume of media was added to
each 1 L flask and buffered and titrated, with the exception of the controls, which
remained without HEPES at the ambient media pH of 8.2. Flasks were then inoculated
with 30 mL of inoculum that had been grow in ESAW + f/2 media enriched with nitrate
(as NaNO3), ammonium (as NH4Cl), or urea (as CH4N2O) for 3+ days (at least 6
generations) to be better conditioned to their respective treatment conditions. Each

25
experimental treatment was executed in triplicate, for a total of 30 samples per
experiment. The experiment was also performed with non-concurrent triplicates.
2.1.6 N:P and pH treatments
Modified ESAW salts with f/2 nutrients medium was divided into seven separate
Nalgene containers and enriched with nitrate (NaNO3) and phosphate (as NH2PO4H2O)
to yield N:P ratios of 1:1, 3:1, 6:1, 12:1, 15:1, 24;1 and 48:1. Nitrate and phosphate
concentrations used are given in Table 2.1.6.
Table 1.1.6 Concentrations of nitrate and phosphate in batch cultures of Heterosigma akashiwo.
N:P Ratio NO3- [µM] PO4
3- [µM] 1:1 100 100 3:1 100 33.2 6:1 100 16.7 12:1 100 8.33 15:1 125 8.33 24:1 200 8.33 48:1 400 8.33
Nitrogen levels were adjusted to maintain biomass in all treatments, and to ensure
any changes were due to N:P ratios rather than nitrogen shortage (an uncommon
occurrence in coastal waters). The standard media ferric chloride concentration of 11 µM
was used. A 125 mL volume of media was added to each 500 mL flask and buffered and
titrated to a pH of 7.4. The controls, which remained without HEPES, contained 125 mL
of ambient media at a pH of 8.2. Flasks were then inoculated with 25 mL of H. akashiwo
513 inoculum that had been grown in ESAW + f/2 media enriched with 125 µM of nitrate
and 8.33 µM phosphate (15N:1P) for 3+ days (at least 6 generations) to adjust to the
treatment closest to Redfield’s ratio (16N:1P). Each experimental treatment was run in

26
triplicate, for a total of 42 samples per experiment. The experiment was also performed
with non-concurrent triplicates.
2.2 Experimentation
2.2.1 Growth
2.2.1.1 Daily measurements of cell density
Immediately following inoculation, all flasks were swirled to allow for a
ubiquitous distribution of H. akashiwo cells, and approximately 1.5 mL was aseptically
sub-cultured from each, using a serological pipette, into a 1.7 mL microcentrifuge tube.
In preparation for cell counts, 0.5 mL of each sample was removed from the initial
microcentrifuge tube, after being gently mixed with a pipette, and placed into a new
microcentrifuge tube. This tube was subsequently loaded onto a C6 Flow Cytometer (BD
AccuriTM) and 50 µL of sample was run through the flow cytometer. C6 Analysis
Software (BD AccuriTM) allowed for gating and cell density measurements of H.
akashiwo – through the use of quadrat lines applied to a histogram of measured
chlorophyll a fluorescence versus particle size. Cell densities (given as number of cells
per 50 µL) were converted to cells per millilitre of sample and recorded. This was
performed for each triplicate of a given treatment, and averaged to attain daily growth
values. The entire process was repeated once every 24 hours (± 2 hours) over the course
of the iron & pH experiments, and once every 12 hours (± 2 hours) for the duration of
nitrogen & pH and N:P & pH experiments.
2.2.1.2 Determination of growth rates Log transformed cell density measurements were plotted against time to establish
the time of maximum rate of change of cells (the exponential growth phase). The slope of

27
the line during the exponential phase was used to calculate the growth rate using the
following equation:
𝜇 =ln (𝑁!𝑁!
)
𝑡! − 𝑡!
where 𝜇 is the specific growth rate (measured in divisions per day [d-1] and N1 and N2 are
the averaged cell counts at t1 and t2 (measured in days) (Fu et al. 2008; Guillard, 1973).
2.3 Cell assays
2.3.1 Neutral lipid analysis: Nile red assay
The Nile red assay was used to measure the level of neutral lipids produced per H.
akashiwo cell during growth experiments. Nile red (9-diethylamino-5H-
benzo[α]phenoxazine-5-one) selectively stains intracellular lipid droplets (neutral lipids),
causing them to fluoresce (Greenspan et al., 1985). Fluorescence was then measured on a
fluorescence spectrophotometer and used as a semi-quantitative estimate of neutral lipid
production. The standard operating protocol (SOP) developed by Bjornsson (2009) was
followed, with modifications outlined below.
2.3.1.1 Nile red assay: algal sample preparation
All flasks were swirled to allow for a ubiquitous distribution of H. akashiwo cells,
and approximately 1.5 mL was aseptically subcultured from each, using a serological
pipette, into a 1.7 mL microcentrifuge tube. This was repeated once every 24-hours over
the course of the growth experiments.

28
2.3.1.2 Nile red assay: modifications to SOP
Stock aliquots of the 5% (v/v) standard solution of chemically defined lipid
concentrate (CDLC) (MPN: AK8993-0100, Akron Biotechnology, LLC.) were stored in
the dark at -20°C. Experimental samples were diluted 1:5 in ESAW + f/2 in the 96-well
deep well plate (DWP) (MPN: 82006-448, VWR®). A final sample volume of 200 µL
was transferred from the 96-well DWP to a clear 96-well plate using a mechanical multi-
channel pipette. The outer wells were not used to avoid edge effect evident during
preliminary tests. Plates were read on a Cary Eclipse Varian fluorescence
spectrophotometer fitted with a multi-well plate attachment.
2.3.2.3 Nile red assay: analysis
Raw fluorescence units (RFUs) of the acetone and sample control wells were
subtracted from the corresponding nile red acetone solution and sample wells. Values
were then standardized per cell and then normalized using the 5% (v/v) CDLC standard.
Although this method does not indicate total amounts of neutral lipids per cell, it is able
to demonstrate relative neutral lipid accumulation.
2.3.2 Toxicity analysis: RTgill-W1 cytotoxicity assay
2.3.2.1 Rainbow trout gill cell line maintenance
The Rainbow trout gill cell line (RTgill-W1) assay was used to determine the
level of toxicity expressed by H. akashiwo cells grown under a given treatment. Rainbow
trout (Onchorhunchus mykiss) gill cells – from a continuous cell line – were purchased
from the American Type Culture Collection (ATCC) and maintained in the dark at 18oC.
Cells were grown in sterile Leibovitz’s L-15 medium (MPN: 10-045-CV, Corning
cellgro® Mediatech), supplemented with 10% (v/v) Fetal Bovine Serum (MPN: 1500-

29
100, Seradigm) and 2% (v/v) antiobiotic/antimycotic (MPN: A5955, Sigma-Aldrich)
solution to form L-15 complete. Gill cells were initially grown in sterile plug 25 cm2
treated tissue culture flasks (MPN: 353108, BD Flacon®). Cells were observed under an
Axiovert 100 TV (Zeiss) inverted microscope to determine the degree of cell confluence,
according to Dayeh et al. (2003). Once gill cells had formed a confluent monolayer, they
were aseptically transferred into larger 75 cm2 tissue culture flaks (BD Flacon® MPN:
353136).
2.3.2.2 Rainbow trout gill cell line harvesting
In preparation for the gill cell assay, confluent 75 cm2 flasks were harvested and
concentrated. Cells were first exposed to 1.5 mL of 0.53 mM EDTA Versene solution
(MPN: 17-711E, BioWhittaker® Reageants Lonza) for 1 minute, which was then
aspirated off and replaced with 3 mL of Trypsin solution (0.25% in Hank’s balanced salt
(HBS) solution) (MPN: 25-052-CI, Corning cellgro® Mediatech) for 4 minutes. Five
millilitres of L-15 complete were added to the flasks, and cells were gently detached
using a serological pipette. Cells were then collected in a sterile 15 mL centrifuge tube
(MPN: 352196, Falcon®) and immediately centrifuged at 200xg for 4 minutes at ~12oC
in a Beckman Coulter Avanti J-251 centrifuge. The supernatant was then aspirated from
the tube, leaving ~0.5 mL of solution to avoid disputing the cell pellet. Cells were then
resuspended in 7-10 mL of L-15 complete.
2.3.2.3 RTgill-W1 assay preparation
In order to determine cell concentrations, 0.5 mL of cellular solution was
transferred to a 1.7 mL microcentrifuge tube and counted using a Haemocytometer. In

30
order to run the bioassay, gill cells concentrations were adjusted to 2 x 10⁶ cells mL-1
with the addition of L-15 complete.
Two hundred microliters of the density-adjusted gill cell solution was pipetted into a
clear 96-well plate, with the exception of 3 interior wells (to serve as “no cell” controls)
and all outer wells (to eliminate edge-effects) that were filled with 200 µL of L-15
complete alone. The lidded 96-well plate was then allowed to incubate for 2-3 days in the
original incubation conditions, until cells were deemed confluent.
2.3.2.4 RTgill-W1 assay algal sample preparation
In order to collect algal samples for the assay, 45 mL of culture was sampled from
each treatment flask, and place into a sterile 50 mL centrifuge tube (MPN: 352070,
Falcon®). This was done twice for each culture, first when a given treatment entered late
exponential growth phase, and then again once the cells entered early stationary growth
phase. Samples were then spun down at 2000xg at 15oC for 5 minutes in a Beckman
Coulter Avanti J-251 centrifuge. The majority of the supernatant was decanted from the
pellet and placed in a sterile 50 mL Falcon tube and stored at -20 oC. Approximately 1mL
of the supernatant was left in the original tube to allow for resuspension of the pellet.
After cells were resuspended, they were transferred to a sterile 1.7 mL microcentrifuge
tube and stored at -20 oC until further analysis.
While the gill cells were growing to confluence in 96-well plates, the frozen algal
samples were thawed at room temperature, in order to lyse the cells. A total of two
freeze-thaw cycles were performed to ensure complete cell lysis. Previous research has
shown that Heterosigma toxicity in vitro requires both fractured cell wall and periplasmic
components (Ling, 2006; Powers et al., 2012). Samples were centrifuged at 10,000xg for
31
3 minutes at 20oC in a bench top microcentrifuge. The majority of the supernatant was
aspirated from the pellet and 1 mL of L-15 experimental (ex) was added. L-15ex
contained the same nutrients, vitamins, and salts as L-15 complete, but was not amended
with FBS or antibiotics. The pellet was then resuspended and diluted with more L-15ex
to a concentration of 200,000 cells mL-1.
2.3.2.5 RTgill-W1 assay
Procedures were followed as described by Dorantes-Aranda et al. (2011) and
Dayeh et al. (2003). The 96-well microplate with a confluent monolayer of prepared
RTgill-W1 cells was rinsed twice with 100 µL of L-15ex to remove any L-15 complete.
The gill cells were then exposed to 200 µL of the previously prepared algal exposure
solution, or a 3% hydrogen peroxide solution control (shown to elicit complete toxicity).
The plate was then sealed with sterile Parafilm M®, lidded, and placed back into the
incubation area (18oC in the dark) for a 24-hour exposure period. Following exposure, all
wells were rinsed twice with 100 µL, and then exposed to a 100 µL solution of 5% (v/v)
PrestoBlue™ (MPN: A-13262, Life Technologies) in L-15ex. PrestoBlue™ is a
fluorescent dye that contains resazurin. Plates were again sealed with sterile Parafilm M®,
lidded, and placed back into the incubation area (18oC in the dark) this time for a 2-hour
exposure period.
Fluorescence readings were taken after a 2-hour incubation in the dark on a
fluorescence spectrophotometer plate reader (Agilent Technologies, Santa Clara, CA).
Metabolically active cells reduce resazurin to resofurin, which fluoresces (emission 590
nm) when exposed to green light (excitation 540 nm). This fluorescence measurement
represents gill cell viability in the presence of H. akashiwo. A lack of fluorescence,

32
relative to the positive control, can be used as indicator of toxicity. Raw fluorescence
units (RFUs) were converted to gill cell viability in relation to controls using the
following equation described by Dayeh et al. (2003):
GC Viability % = (!"#. !"#!!" !"## !"#$%"&) !"#$%&# (!"#$%&'( !"#$%&'" !"#$%"&!!" !"## !"#$%"&)
2.4 Data Analysis
Two-way ANOVAs were used to detect main effects and interaction effects and
post-hoc Tukey’s Tests were used to determine differences between groups. Principal
component analysis and Spearman’s rank order correlation coefficient were used to
assess correlation between dependent and independent variables across experiments.
Statistical analysis was performed using Microsoft Excel 14.3 (Microsoft,
Redmond, Washington, USA), GraphPad PRISM® 6.0 (GraphPad Software, San Diego
California USA), JMP 11.1 (SAS Institute Inc., Cary, NC, USA), and SPSS 21 (SPSS
IBM, New York, USA).

33
CHAPTER 3: RESULTS 3.1 Preliminary experimentation 3.1.1 Determination of peak cell yield, neutral lipid accumulation, and toxicity Maximal cell yield, neutral lipid accumulation, and toxicity data was selected for
presentation in this thesis. Peak neutral lipid accumulation was found to occur during the
transition between late exponential and stationary phase sampled (data not shown).
Toxicity also peaked during this period of growth (Ling and Trick, 2010).
3.1.2 Verification of experimental pH values Preliminary experimentation allowed for minimal testing of pH during growth
experiments, in an effort to maintain culture volume needed for bioassays. Figure 3.1
illustrates that cultures of Heterosigma akashiwo (isolate 513), buffered and titrated to
pH levels of 7.4, 7.8, and 8.1, all held ± 0.11 pH units over a 21-day period. The pH of
the culture that was left at the initial ambient media of 8.2 and not treated with HEPES
buffer was allowed to fluctuate naturally over the course of the growth experiment. Over
the first four days, the pH in the non-buffered treatments rose above 9.0 and then dropped
back down to approximately 8.7 by day 7. The pH fluctuated around 8.7 until day 12
when it dropped to 8.2 by day 16, where it remained for the remainder of the experiment.

34
Figure 3.1.2 The pH of acid/base titrated cultures of Heterosigma akashiwo 513 grown in ESAW + f/2 media with the addition of HEPES buffer at concentrations of 0 mM, 10 mM, 15 mM and 20 mM over a 21-day period.
3.2 Specific growth rates of Heterosigma akashiwo 513
Specific growth rates were measured to gauge the success of Heterosigma
akashiwo under different nutrient and pH regimes possible by the year 2100. Specific
growth rates of Heterosigma akashiwo 513 grown at 880 µM N and 24:1 N:P were not
altered by pH (F=0.4965, df=3,8, p=0.6948; post-hoc Tukey’s test) but were influenced
by iron concentration (F=107.3, df=3,8, p<0.0001; post-hoc Tukey’s test), with the 11
µM FeCl3 treated cultures achieving a specific growth rate almost double that of those
grown at 0.1µM FeCl3 (Figure 3.2 A). However, there was a significant effect of both pH
(F=17.77, df=1,28, p<0.001; post-hoc Tukey’s test) and N:P (F=6.897, df=6,28,
p<0.0001; post-hoc Tukey’s test) on the specific growth rate of H. akashiwo 513 grown
at 100-400 µM N and 11 µM FeCl3 (Figure 3.2 B). The highest growth rates were
attained at an N:P ratio of 12:1 and a pH of 7.4 (4.43 d-1, SD± 0.31, n=6), and the lowest
0 2 4 6 8 10 12 14 16 18 20 227.27.47.67.88.08.28.48.68.89.09.2
Day
pH
pH of Titrated Cultures (HET513 in ESAW (f/2) Media)
Across HEPES Concentrations
pHi 8.2; Without HEPES
pH 8.1; [10µM] HEPES
pH 8.1; [15µM] HEPES
pH 8.1; [20µM] HEPES
pH 7.8; [10µM] HEPES
pH 7.8; [15µM] HEPES
pH 7.8; [20µM] HEPES
pH 7.4; [10µM] HEPES
pH 7.4; [15µM] HEPES
pH 7.4; [20µM] HEPES

35
were grown at an N:P ratio of 48:1 and an initial pH of 8.2 (2.30 d-1, SD± 0.35, n=6)
(Figure 3.2 B). When H. akashiwo 513 were grown at 10 µM N, 11 µM FeCl3 and 12:1
N:P the pH did not significantly impact growth rates, but the form of nitrogen did
(F=18.94, df=2,24, p<0.0001; post-hoc Tukey’s test), with nitrate yielding the highest
specific growth rates across pH treatments (Figure 3.2 C).

36
11µM
0.1µM
0
1
2
3
4
5
6
Iron Concentration
Spec
ifc G
row
th R
ate
(d-1
) pHi 8.2pH 8.1pH 7.8pH 7.4
a aa a
b b b b
1:1 3:1 6:1 12:1
15:1
24:1
48:1
0
1
2
3
4
5
6
N:P Ratio
Spec
ifc G
row
th R
ate
(d-1
) pHi 8.2pH 7.4
a
abc ab
c
a ababc
bc
*
Nitrate
Ammonium
Urea
0
1
2
3
4
5
6
Nitrogen Source
Spec
ifc G
row
th R
ate
(d-1
) pHi 8.2pH 8.1pH 7.8pH 7.4
a
b b
A
B
C
Figure 3.2 Specific growth rates of H. akashiwo grown in medium adjusted to a range of pH treatments (8.2 initially with no buffer; 8.1, 7.8 and 7.4), and (A) iron concentrations (11 µM and 0.1 µM), (B) nitrogen to phosphorus ratios (1:1, 3:1, 6:1, 12:1, 15:1, 24:1 and 48:1), and (C) nitrogen sources (nitrate, ammonium, and urea). Values were determined by flow cytometer during the exponential growth phase, and indicate the average of duplicated triplicate samples (n=6), with error bars indicating one standard deviation and lettering/asterisks representing statistically significant differences between treatments.

37
3.3 Maximal cell yields of Heterosigma akashiwo 513
Maximal cell yields were measured as an indicator of Heterosigma akashiwo
densities possible in the future ocean, which could indicate the extent of a given bloom
event. These were measured along with specific growth rates, in order to better theorize
the future occurrence and intensity of H. akashiwo bloom events. Maximal cell yields of
H. akashiwo 513 grown at 880 µM N and 24:1 N:P were significantly impacted by pH
(F=10.59, df=3,31, p<0.0001; 2-way ANOVA & post-hoc Tukey’s test) but were not
influenced by iron concentration (F=1.656, df=1,31, p=0.2077; 2-way ANOVA & post-
hoc Tukey’s test), with the most acidified iron-rich cultures achieving the lowest
maximal cell yield (159,584 cells mL-1, SD±5023, n=6), and the most alkaline iron-rich
achieving the highest maximal cell yield (339,160 cells mL-1, SD± 11936, n=6) (Figure
3.3 A). There was a significant effect of pH (F=218.1, df=1,40, p<0.001; post-hoc
Tukey’s test), N:P (F=79.83, df=6,40, p<0.0001; post-hoc Tukey’s test), as well as an
interaction effect of the two (F=39.61, df=6,40, p<0.001; post-hoc Tukey’s test) on the
maximal cell yields of H. akashiwo grown at 100-400 µM N and 11 µM FeCl3 (Figure
3.3 B). The highest cell yields were attained at an N:P ratio of 48:1 and an initial pH of
8.2 (103,733 cells mL-1, SD± 9002, n=6), and the lowest were grown at an N:P ratio of
12:1 and a pH of 7.4 (13,097 cells/mL, SD± 3308, n=6) (Figure 3.3 B). These maximum
and minimum values were attained under the differing treatments, as were the maximum
and minimum specific growth rates. When H. akashiwo were grown at 10 µM N, 11 µM
FeCl3 and 12:1 N:P the main effects of pH (F=14.10, df=3,68, p<0.0001, post-hoc
Tukey’s test) and nitrogen source (F=7.830, df=2,68, p=0.0009, post-hoc Tukey’s test)
were significant. There was also a significant interaction effect (F=2.244, df=6,68,

38
p=0.0492, post-hoc Tukey’s test) between the main effects, with a trend of increasingly
acidified treatments resulting in lower maximal cell yields under each nitrogen source
tested (Figure 3.3 C).

39
Figure 3.3 Maximal cell yields of H. akashiwo grown in medium adjusted to a range of pH treatments (8.2 initially with no buffer; 8.1, 7.8 and 7.4), and (A) iron concentrations (11 µM and 0.1 µM), (B) nitrogen to phosphorus ratios (1:1, 3:1, 6:1, 12:1, 15:1, 24:1 and 48:1), and (C) nitrogen sources (nitrate, ammonium, and urea). Values were determined by flow cytometry during stationary growth phase, and indicate the average of duplicated triplicate samples (n=3), with error bars indicating one standard deviation and lettering representing statistically significant differences between treatments (with asterisks denoting significant differences between pH values within a given treatment).
11µM
0.1µM
01×
105
2×10
53×
105
4×10
5Iron Concentration
Cel
l Yie
ld (c
ells
/mL)
pHi 8.2pH 8.1pH 7.8pH 7.4
a
b
c
a
d
b
1:1 3:1 6:1 12:1
15:1
24:1
48:1
0.0
5.0×
104
1.0×
105
1.5×
105
N:P Ratio
Cel
l Yie
ld (c
ells
/mL)
pHi 8.2pH 7.4
a
b
a
* * * * *
Nitrate
Ammonium
Urea
0.0
5.0×
103
1.0×
104
1.5×
104
Nitrogen Source
Cel
l Yie
ld (c
ells
/mL)
pHi 8.2pH 8.1pH 7.8pH 7.4b
aa
bb ba
A
B
C

40
3.4 Peak neutral lipid accumulation in Heterosigma akashiwo 513
Peak neutral lipid accumulation within Heterosigma akashiwo was measured as
an indicator of changes to essential fatty acid composition possible in the future ocean,
which could alter marine ecosystems, be it negatively or positively. They could
negatively impact marine organisms if they are a component of the toxic/allelopathic
mechanism. As shown in Figure 3.4 A, peak neutral lipid accumulation in Heterosigma
akashiwo 513 grown at 880 µM N and 24:1 N:P was not significantly impacted by either
pH or iron concentration (F=0.8520, df=3,40, p=0.4738; F=3.460, df=1,40, p=0.0702;
post-hoc Tukey’s test), with all values less than 0.5%. The peak accumulation of neutral
lipid increased in H. akashiwo 513 grown at 100-400 µM N and 11 µM FeCl3, with
values ranging from 0.23% to 4.05% (Figure 3.4 B). The effects of pH and N:P, and the
interaction of both factors (F=13.57, df=1,28, p=0.010; F=36.71, df=6,28, p<0.0001;
F=5.068, df=6,28, p=0.0012; post-hoc Tukey’s test) significantly influenced peak neutral
lipid accumulation in these cells, with the highest peak neutral lipid accumulations
attained at N:P ratios of 24:1 and 48:1, indicative of P-limitation (Figure 3.4 B). When H.
akashiwo 513 were grown at 10 µM N, 11 µM FeCl3 and 12:1 N:P the effects of pH and
nitrogen source were not statistically significant (F=0.4511, df=3,14, p=0.7205;
F=0.5888, df=2,14, p=0.5682; post-hoc Tukey’s test), with the greatest enhancement in
neutral lipid accumulation shown in the most acidified culture grown with nitrate as the
N-source (3.36%, SD±0.43, n=3) (Figure 3.4 C).
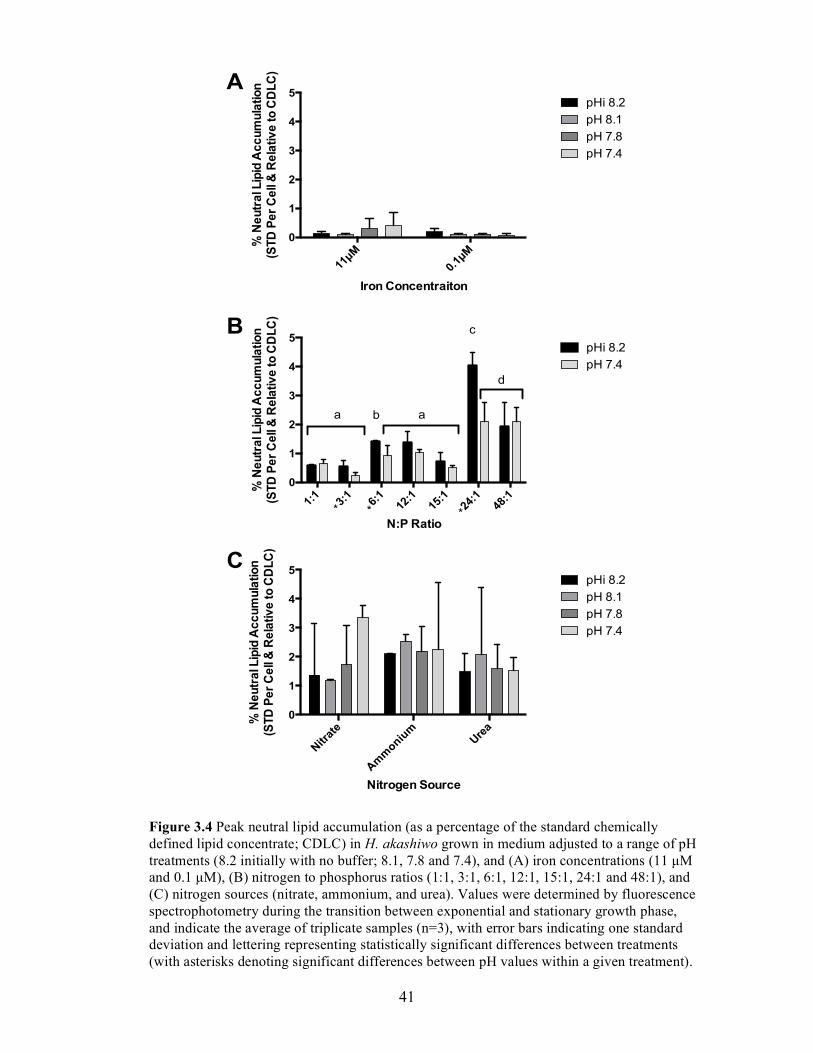
41
Figure 3.4 Peak neutral lipid accumulation (as a percentage of the standard chemically defined lipid concentrate; CDLC) in H. akashiwo grown in medium adjusted to a range of pH treatments (8.2 initially with no buffer; 8.1, 7.8 and 7.4), and (A) iron concentrations (11 µM and 0.1 µM), (B) nitrogen to phosphorus ratios (1:1, 3:1, 6:1, 12:1, 15:1, 24:1 and 48:1), and (C) nitrogen sources (nitrate, ammonium, and urea). Values were determined by fluorescence spectrophotometry during the transition between exponential and stationary growth phase, and indicate the average of triplicate samples (n=3), with error bars indicating one standard deviation and lettering representing statistically significant differences between treatments (with asterisks denoting significant differences between pH values within a given treatment).
11µM
0.1µM
0
1
2
3
4
5
Iron Concentraiton
% N
eutr
al L
ipid
Acc
umul
atio
n (S
TD P
er C
ell &
Rel
ativ
e to
CD
LC)
pHi 8.2pH 8.1pH 7.8pH 7.4
1:1 3:1 6:1 12:1
15:1
24:1
48:1
0
1
2
3
4
5
N:P Ratio
% N
eutr
al L
ipid
Acc
umul
atio
n (S
TD P
er C
ell &
Rel
ativ
e to
CD
LC)
pHi 8.2pH 7.4
a
**
c
d
*
ab
Nitrate
Amm
onium
Urea
0
1
2
3
4
5
Nitrogen Source
% N
eutr
al L
ipid
Acc
umul
atio
n (S
TD P
er C
ell &
Rel
ativ
e to
CD
LC)
pHi 8.2pH 8.1pH 7.8pH 7.4
A
B
C

42
3.5 Heterosigma akashiwo 513 toxicity
The toxic effect of Heterosigma akashiwo on Rainbow trout gill cell lines was
measured as an indicator of ichthyotoxicity under possible future ocean nutrient and pH
regimes, which could greatly impact natural finfish populations as well as aquaculture
facilities. As shown in Figures 3.4 A and B, Heterosigma akashiwo 513 toxicity from
cells grown at 880 µM N (A), and 400-100 µM N (B) was above 87.7% toxicity under all
iron concentrations, N:P ratios, and pH values tested, indicating that these cells were
highly toxic. Toxicity was not significantly impacted by pH in either experiment, and was
not impacted by iron concentration or N:P ratio (F=2.489, df=3,40, p=0.0742; F=1.444,
df=1,28, p=0.2396; F=0.3192, df=1,40, p=0.5752; F=0.5088, df=6,28, p=0.7964; post-
hoc Tukey’s test). Again, toxicity was very high across every variable tested in
experiment A and B, ranging from 87.7% to 97.7%. Toxicity was generally lower when
H. akashiwo 513 was grown at 10 µM N, 11 µM FeCl3 and 12:1 N:P (Figure 3.5 C),
ranging from 43.9% to 76.4%. The effect of nitrogen source on peak toxicity measured in
H. akashiwo 513 was statistically significant (F=10.14, df=2,60, p=0.0002; post-hoc
Tukey’s test), with ammonium resulting in lower toxicity than nitrate or urea (Figure 3.5
C).

43
Figure 3.5 Peak toxicity in H. akashiwo grown in medium adjusted to a range of pH treatments (8.2 initially with no buffer; 8.1, 7.8 and 7.4), and (A) iron concentrations (11 µM and 0.1 µM), (B) nitrogen to phosphorus ratios (1:1, 3:1, 6:1, 12:1, 15:1, 24:1 and 48:1), and (C) nitrogen sources (nitrate, ammonium, and urea). Values were determined by fluorescence spectrophotometry during the transition between exponential and stationary growth phase, and indicate the average of triplicate samples (n=6), with error bars indicating one standard deviation and lettering representing statistically significant differences between treatments.
11µM
0.1µM
0
20
40
60
80
100
120
Iron Concentration
% G
ill C
ell D
eath
(S
TD to
+ a
nd -
Con
trol
s) pHi 8.2pH 8.1pH 7.8pH 7.4
1:1
3:1
6:1
12:1
15:1
24:1
48:1
0
20
40
60
80
100
120
N:P Ratio
% G
ill C
ell D
eath
(S
TD to
+ a
nd -
Con
trol
s) pHi 8.2pH 7.4
Nitrat
e
Amm
onium
Urea
0
20
40
60
80
100
120
Nitrogen Source
% G
ill C
ell D
eath
(S
TD to
+ a
nd -
Con
trol
s) pHi 8.2pH 8.1pH 7.8pH 7.4
ab b ab
A
B
C

44
3.6 Correlations between nutrients, pH and physiological responses In order to gain a better understanding of the relationship between nutrient
concentrations (nitrogen and phosphorus) and pH, and growth rates, cell yields, peak
neutral lipid content, and peak toxicity in Heterosigma akashiwo, correlations were first
examined using a principal component analysis (Figure 3.6). The PCA was used to
transform multidimensional data (many variables and interactions) to 2-D data, while
retaining the majority of the data story. Figure 3.6 A shows data that was used to identify
the two-principal components. Figure 3.6 B gives a clear picture of which variables are
related, and the nature of the relationship. Toxicity appears to be negatively correlated
with neutral lipid production (Figure 3.6 B). Macronutrient concentrations and cell yield
seem to be positively correlated with toxicity, and pH does not appear to bear strong
relationships with any other variables (Figure 3.6 B).
From the apparent relationships shown above, Spearman’s rank correlation
coefficient for non-parametric, non-linear variables was then utilized to ascribe values to
these relationships (Table 3.6). As expected, the strongest relationships existed between
macronutrient concentrations and cell yields (N: ρ=0.9391, p<0.0001; P: ρ=0.8114,
p<0.0001; Table 3.6). There were also strong relationships between macronutrient
concentrations and both neutral lipids (N: ρ= -0.6761, p<0.0001; P: ρ= -0.7900,
p<0.0001) and toxicity ((N: ρ=0.7125, p<0.0001; P: ρ=0.7116, p<0.0001; Table 3.6).

45
Figure 3.6 Principal component analysis of the correlations between independent (iron, nitrogen, and phosphorus concentrations and pH) and dependent variables (growth rate, cell yields, neutral lipid accumulation, and toxicity) tested on Heterosigma akashiwo 513. Two components were used to map correlations (eigenvalues > 1 are retained), accounting for a cumulative 62.8% of the variance. The score plot (A) is a standard interpretive aid showing raw component data, while the loading plot (B) shows normalized data.
A B

46
Table 3.6 Spearman’s rank correlation coefficients of dependent variables (growth rate, cell yield, neutral lipid accumulation, and toxicity) by independent (iron, nitrogen, and phosphorus concentrations, and pH) and dependent variables. Asterisks denote statistically significant correlation coefficients. Spearmans’s ρ values are depicted visually in the last column.
Variable by)Variable Spearman)ρ P)ValueGrowth'Rate [Iron] 0.5586 0.0006*Growth'Rate [Nitrogen] 80.1848 0.2954Growth'Rate [Phosphorus] 80.0090 0.9596Growth'Rate pH 80.1061 0.5502Cell'Yield [Iron] 80.4652 0.0056*Cell'Yield [Nitrogen] 0.9391 <.0001*Cell'Yield [Phosphorus] 0.8114 <.0001*Cell'Yield pH 0.2049 0.245Cell'Yield Growth'Rate 80.1870 0.2897%'Neutral'Lipids [Iron] 0.5212 0.0016*%'Neutral'Lipids [Nitrogen] 80.6761 <.0001*%'Neutral'Lipids [Phosphorus] 80.7900 <.0001*%'Neutral'Lipids pH 0.0063 0.9716%'Neutral'Lipids Growth'Rate 0.1352 0.446%'Neutral'Lipids Cell'Yield 80.6811 <.0001*%'Toxicity [Iron] 80.2747 0.1159%'Toxicity [Nitrogen] 0.7125 <.0001*%'Toxicity [Phosphorus] 0.7116 <.0001*%'Toxicity pH 0.0824 0.6432%'Toxicity Growth'Rate 0.1812 0.3052%'Toxicity Cell'Yield 0.6843 <.0001*%'Toxicity %'Neutral'Lipids 80.5271 0.0014*
81.0' 80.5' 0.0' 0.5' 1.0'
Sperman's)correla5on)coefficient)
47
3.7 Nitrogen, phosphorus, neutral lipids and toxicity in H. akashiwo 513
Although the positive relationship between macronutrient concentration and cell
yields was expected, the negative correlation with neutral lipids and the positive
relationship with toxicity were not preconceived. In an attempt to gain a better
understanding of the nature of these relationships, nitrogen and phosphorus
concentrations were plotted separately against peak neutral lipid accumulation and peak
toxicity in Figure 3.7. Figure 3.7 A indicates that peak neutral lipid accumulation is
higher in more alkaline waters, between 100 and 400 µM N, with a similar less extreme
trend exhibited at pH 7.4. Figure 3.7 B shows that concentrations of phosphorus lower
than 1 µM result in the highest peak neutral lipid accumulation, while at pH 8.2 this value
shifts to somewhere between 1 and 10 µM P. In terms of peak toxicity, there seems to be
a rapid increase between 0 and 100 µM N where it remains above 90% toxicity for all
other concentrations tested (Figure 3.7 C). Phosphorus presented a parallel trend between
0 and 20 µM, with a very slight dip in toxicity possible between 20 and 100 µM P (Figure
3.7 D).

48
% Neutral Lipids & % Toxicity vs. [Nitrogen] & [Phosphorous]%
Neu
tral L
ipid
Con
tent
(S
TD re
lativ
e to
CD
LC)
% T
oxic
ity
(Gill
cell d
eath
rela
tive
to -
and
+ co
ntro
ls)
-1
0
1
2
3
4
50
60
70
80
90
100
0 100 200 300 400 500 600 700 800 0 20 40 60 80 100Nitrogen Concentration (μM) Phosphorus Concentration (μM)
pH
pH 7.4 pHi 8.2
Where(10 rows excluded)
Figure 3.7 Peak neutral lipid accumulation (as a percentage of the chemically defined lipid concentrate standard) (top) and peak toxicity (bottom) in Heterosigma akashiwo at pH 8.2 and 7.4 across nitrogen (A&C) and phosphorus (B&C) concentrations. A cubic spline, with lambda 0.05, has been applied over individual data points.
A B
C D

49
3.8 Nitrogen concentrations and Heterosigma akashiwo 513
In order to better assess the impact of nitrogen concentration on H. akashiwo 513
physiology, experimental treatments grown under identical iron concentrations, N:P
ratios, nitrogen sources, and pH values with different concentrations of nitrogen were
selected across all experiments and compared against each other. Suitable treatments
were grown under 11 µM FeCl3, with nitrate as the N-source, at pH values of 7.4 and 8.2,
with an N:P ratio of 12:1 or 24:1, with 10/100 µM N or 200/880 µM N respectively.
3.8.1 Specific growth rates
Specific growth rates were measured across nitrogen concentrations of 10 µM and
100 µM (Figure 3.8.1 A), as well as 200 µM and 880 µM (Figure 3.8.1 B), to gauge how
Heterosigma akashiwo persistence could be altered under nutrient and pH regimes
possible for the future ocean. Specific growth rates of Heterosigma akashiwo 513 grown
at 10 µM/100 µM N and 12:1 N:P were not impacted by pH or nitrogen concentration
(F=0.9706, df=1,8, p=0.5053; F=2.944, df=1,8, p=0.1245; post-hoc Tukey’s test; Figure
3.8.1 A), however these were influenced by nitrogen concentration (F=17.60, df=1,6,
p=0.0057; post-hoc Tukey’s test) when grown at 24:1 N:P under 200 µM/880 µM N
(Figure 3.8.1 B). Specific growth rates appear to decrease with increasing nitrogen
concentration (Figure 3.8.1 B).

50
10µM
100µ
M0
1
2
3
4
5
Nitrogen Concentraiton
Spe
cifc
Gro
wth
Rat
e (d
-1) pHi 8.2
pH 7.4
200u
M
880u
M0
1
2
3
4
5
Nitrogen Concentraiton
Spe
cifc
Gro
wth
Rat
e (d
-1) pHi 8.2
pH 7.4a
b
A
B
Figure 3.8.1 Specific growth rates of H. akashiwo grown in medium adjusted to a range of pH treatments (8.2 initially with no buffer and 7.4), and nitrogen concentrations of (A) 10 µM and 100 µM N (12:1 N:P) (B) 200 µM and 880 µM N (24:1 N:P). Values were determined by flow cytometry during the exponential growth phase, and indicate the average of triplicate samples (n=3), with error bars indicating one standard deviation and letters indicating statistically significant differences between groups (α=0.05).

51
3.8.2 Maximal cell yields
Maximal cell yields were measured across nitrogen concentrations of 10 µM and
100 µM (Figure 3.8.2 A), as well as 200 µM and 880 µM (Figure 3.8.2 B), in an effort to
gauge how Heterosigma akashiwo persistence could be altered under high nutrient and
low pH regimes possible for the future ocean. Cell yields of Heterosigma akashiwo 513
grown at 10µM/100µM N and 12:1 N:P were significantly impacted by pH and nitrogen
concentration (F=138.7, df=1,15, p<0.0001; F=249.2, df=1,15, p<0.0001; post-hoc
Tukey’s test; Figure 3.8.2. A). Specific growth rates were also significantly influenced by
pH and nitrogen concentration (F=769.8, df=1,9, p<0.0001; F=466.2, df=1.9, p<0.0001;
post-hoc Tukey’s test) when grown at 24:1 N:P under 200 µM/880 µM N (Figure 3.8.2
B). Maximal cell yields decrease with pH and increase with increasing nitrogen
concentration (Figure 3.8.2).

52
10uM
100u
M
01×
105
2×10
53×
105
4×10
5
Nitrogen Concentraiton
Cel
l Yie
ld (c
ells
/mL)
pHi 8.2pH 7.4
abc abd
bc
200u
M
880u
M
01×
105
2×10
53×
105
4×10
5
Nitrogen Concentraiton
Cel
l Yie
ld (c
ells
/mL)
pHi 8.2pH 7.4
a a
b
c
A
B
Figure 3.8.2 Maximal cell yields of H. akashiwo grown in medium adjusted to two different pH treatments (8.2 initially with no buffer and 7.4), and nitrogen concentrations of (A) 10 µM and 100 µM N (12:1 N:P) (B) 200 µM and 880 µM N (24:1 N:P). Values were determined by flow cytometry during stationary growth phase, and indicate the average of triplicate samples (n=3), with error bars indicating one standard deviation and letters indicating statistically significant differences between groups (α=0.05).

53
3.8.3 Peak neutral lipid accumulation Neutral lipid accumulation within Heterosigma akashiwo was measured across
nitrogen concentrations to indicate changes in essential fatty acid composition possible in
the future ocean, which could alter marine ecosystem food chains. Again, although they
have a positive role in the development of the food chain, these compounds could also
negatively impact marine organisms if they function as toxic/allelopathic agents. Neutral
lipid accumulation in H. akashiwo 513 grown at 10/100 µM N and 12:1 N:P were not
significantly impacted by either pH or nitrogen concentrations (F=2.595, df=1,6,
p=0.158; F=5.392, df=1,6, p=0.0592; post-hoc Tukey’s test; Figure 3.8.3 A), with values
ranging from 1.01% to 3.36% (SD ±0.12; SD ±0.43, n=3). This was not the case for H.
akashiwo 513 grown at the higher nitrogen concentrations (200 µM/880 µM N at 24:1
N:P), which were significantly impacted by pH, nitrogen concentration, as well as the
interaction of the two (F=16.78, df=1,14, p=0.0011; F=184.6, df=1,14, p<0.0001;
F=28.92, df=1,14, p<0.0001; post-hoc Tukey’s test) and ranged from 0.13% to 4.05%
(SD ±0.06; SD ±0.43, n=3; Figure 3.8.3 B). Decreased nitrogen concentration resulted in
increased neutral lipid accumulation in this experiment, which was most pronounced in
the cultures at pH 8.2 (Figure 3.8.3 B).

54
10uM
100u
M0
1
2
3
4
5
Nitrogen Concentraiton
% N
eutr
al L
ipid
Acc
umul
atio
n (S
TD P
er C
ell &
Rel
ativ
e to
CD
LC)
pHi 8.2pH 7.4
200u
M
880u
M0
1
2
3
4
5
Nitrogen Concentraiton
% N
eutr
al L
ipid
Acc
umul
atio
n (S
TD P
er C
ell &
Rel
ativ
e to
CD
LC)
pHi 8.2pH 7.4
a
b
c
c
A
B
Figure 3.8.3 Peak neutral lipid accumulation (as a percentage of the standard chemically defined lipid concentrate; CDLC) in H. akashiwo grown in medium adjusted to two different pH treatments (8.2 initially with no buffer and 7.4), and nitrogen concentrations of (A) 10 µM and 100 µM N (12:1 N:P) (B) 200 µM and 880 µM N (24:1 N:P). Values were determined by fluorescence spectrophotometry during the transition between exponential and stationary growth phase, and indicate the average of triplicate samples (n=3), with error bars indicating one standard deviation and letters indicating statistically significant differences between groups (α=0.05).

55
3.8.4 Toxicity
The toxic effect of H. akashiwo grown on different nitrogen concentrations was
measured as an indicator of ichthyotoxicity under possible future ocean nutrient-rich and
low pH regimes, which could greatly impact natural finfish populations as well as
aquaculture facilities. As shown in Figures 3.8.4 A and B, peak H. akashiwo 513 toxicity
from cells grown at 10-100 µM N (A), and 200-880 µM N (B) was above 78.7% toxicity
under all iron concentrations, N:P ratios, and pH values tested, indicating that these cells
were highly toxic. However, after further examination, the only statistically significant
differences in toxicity lie between H. akashiwo grown at 10 µM and 100 µM N (F=9.370,
df=1,14, p=0.0085; Figure 3.8.4 A). This could indicate that nitrogen concentrations must
reach a certain threshold (lower than 10 µM N in this case) before cells become toxic to
the Rainbow trout gill cells, and then again before cells become highly toxic to the gill
cells. Toxicity was not significantly impacted by pH in either experiment, and remained
highly toxic across the higher nitrogen concentrations of 200 µM and 880 µM N
(F=0.3012, df=1,14, p=0.5981; F=0.007168, df=1,14, p=0.9337; F=1.837, df=1,14,
p=0.1968; post-hoc Tukey’s test; Figure 3.8.4).

56
10uM
100u
M0
20
40
60
80
100
120
Nitrogen Concentraiton
% G
ill C
ell D
eath
(R
elat
ive
to +
and
- C
ontr
ols)
pHi 8.2pH 7.4
a b
200u
M
880u
M0
20
40
60
80
100
120
Nitrogen Concentraiton
% G
ill C
ell D
eath
(R
elat
ive
to +
and
- C
ontr
ols)
pHi 8.2pH 7.4
A
B
Figure 3.8.4 Peak toxicity in H. akashiwo grown in medium adjusted to a pH of 8.2 (initially with no buffer) and 7.4, and nitrogen concentrations of (A) 10 µM and 100 µM N (12:1 N:P) (B) 200 µM and 880 µM N (24:1 N:P). Values were determined by fluorescence spectrophotometry during the transition between exponential and stationary growth phase, and indicate the average of triplicate samples (n=3), with error bars indicating one standard deviation and letters indicating statistically significant differences between groups (α=0.05).

57
CHAPTER 4: DISCUSSION
4.1 Future Heterosigma akashiwo bloom formation The first aim of this study was to characterize the growth of H. akashiwo cultured
under various nutrient and pH regimes possible in the future ocean. This information can
be used to help predict the frequency and intensity of potentially harmful blooms of H.
akashiwo in the future. It was initially predicted that H. akashiwo would be able to
maintain their presence in the future, and continue to form blooms in coastal waters.
4.1.1 Specific growth rates In this study, it was shown that the highest specific growth rates were achieved
under iron-rich treatments (11 µM FeCl3), with nitrate as the source of nitrogen, at an N:P
ratio of 12:1 and low nitrogen concentration (100 µM N) (Figure 3.2B). Specific growth
rates were impeded at low iron concentrations (0.1 µM FeCl3), with ammonium or urea
as the nitrogen source, and at an N:P ratio of 48:1 (Figure 3.2). These trends can be
explained by iron requirements for photosynthesis, nitrogen usage, as well as balanced
versus unbalanced growth, which will be discussed further on in this section (Raven,
1988). Specific growth rates also declined with increasing nitrogen/phosphorus
concentrations, which was not expected (Figure 3.2B). Even though the growth rates
were slower in these cases, they remained above 2 divisions per day (except in the case of
low iron), indicating that they would still proliferate (Figure 3.2). Average maximum in
situ growth rates for phytoplankton were found to be 3.0-3.6 divisions per day (diel-
adjusted) and laboratory culture average maximum growth rates are generally less than 3
divisions per day (Furnas, 1990).
58
Iron was also shown to exert a large control on specific growth rates, which was
expected due to its classification as a micronutrient (Figure 3.2A). Cellular iron
requirements are significantly higher than concentrations typically recorded in the surface
ocean (concentration factor of ca. 62,000 within autotrophic phytoplankton versus ocean
waters) (Twining et al., 2004). Iron enables cellular use of inorganic nitrogen in the form
of nitrate, as it is an essential component of nitrate/nitrite reductase (Raven, 1988; Wells
et al., 1995). A lack of iron can therefore co-limit nitrogen and cause lower growth rates
(Sunda and Huntsman, 1995), which the results showed (Figure 3.2A). Continued
acidification of coastal waters can increase the bioavailability of iron, which would
increase specific growth rates of phytoplankton (Breitbarth et al., 2009).
It was interesting to note that nitrate promoted a higher growth rate than
ammonium – the more readily useable form of nitrogen (Figure 3.2C). Previous work
conducted by Herndon and Cochlan (2007) found that H. akashiwo grew faster on
ammonium and urea compared to nitrate. It should be noted that it was a different isolate
of H. akashiwo (CCMP 1912). Other factors such as temperature, and nitrogen
concentration make comparisons ploblematic as well (Herndon and Cochlan, 2007; Miki,
1983 as cited by Okaichi, 2003). For example, a study by Miki (1983) found that
temperature influenced whether phytoplankton grew faster with nitrate (>17 °C) or
ammonium (<17 °C) as the nitrogen source. In a warmer future ocean, nitrate could be
the preferred N-source for H. akashiwo.
The results of the N:P manipulation experiment suggest that heavy nitrogen
inputs, which could occur as a result of anthropogenic coastal nutrient loadings, into the
system can hamper growth rates (Figure 3.2B). This could be explained by excess

59
nitrogen fueling cell growth, but the proportionate lack of P limiting growth – unbalanced
growth. When we examine resultant cell yields under the same treatment, however, they
are the highest of any N:P ratio tested (Figure 3.3B). This points to nitrogen promoting
high cell yields that are undergoing balanced growth until there is inadequate carbon to
support such a high cell yield.
It should also be noted that because Heterosigma akashiwo lack a carbon
concentrating mechanism (CCM), carbon-limitation is possible. Some toxic algal species
have evolved CCMs that allow algae to uptake bicarbonate (HCO3-) otherwise, like H.
akashiwo, they rely solely upon dissolved carbon dioxide uptake (Nimer et al. 1997).
Bicarbonate is the much more abundant form of dissolved carbon in the ocean accounting
for 90%, while less than 1% remains as dissolved carbon dioxide (Doney et al., 2009).
Carbon-limitation due to high biomasses attained through increases in nutrient loadings
or ocean acidification increasing bioavailability of micronutrients could be possible in
future waters. Other algal species that have this carbon concentrating mechanism could
possibly outcompete H. akashiwo in this scenario, albeit in future surface waters with
higher CO2(aq) the CCM would have a diminished importance.
4.1.2 Maximal cell yields The other component of H. akashiwo growth examined was maximal cell yield, or
peak biomass. The finding that biomass was highest under high nutrient conditions (iron,
nitrogen and phosphorus) at high N:P ratios (as discussed above) (Figure 3.3) can be
explained by the balanced growth model. Increasing cell yields with increased
concentrations of iron, nitrogen, and phosphorus were expected, as the lack of any of
these nutrients can be extremely limiting to growth (Figure 3.3). This link between algal

60
blooms formation and high nutrient concentration has been clearly established (Schindler,
1974; Anderson et al., 2002; Glibert and Burkholder, 2006). There was also an interesting
trend of decreased cell yields across all three nitrogen sources, as pH decreased, in the
low nitrogen experiment (Figure 3.3C). This could be caused by cells experiencing N-
limitation earlier under more acidic conditions that are more carbon-rich, and able to fuel
faster rates of cell division. As such, more acidic open ocean waters that are N-limited
could see slight drops in overall biomass into the future.
In terms of N:P ratios, higher amounts of N promoted greater cell yields (Figure
3.3B). Again, this is logical due to the abundance of N to fuel growth. These cultures
eventually suffered P-limitation, which could have been delayed due to high cellular
reserves of P compared to N (Harrison et al., 1990). In situ N:P ratios vary relatively
slowly, and large changes in nutrient inputs are required to shift the N:P ratio in coastal
environments (Davidson et al., 2012). Departures from Redfield’s ratio have not been
classed as a defining characteristic of bloom formation in natural environments
(Davidson et al., 2012).
Although nitrogen source did affect growth rates, it was not found to significantly
affect cell yields (Figure 3.2C; 3.3C). This can be explained by the overall nitrogen
concentration being the same across the different nitrogen source treatments. They may
utilize one source faster than others, but in the end they will attain the same cell yield.
Future waters with the same level of fertilizer inputs as today, with more of them being
urea-based, may grow more slowly but will still be able to attain similar maximal
biomasses. This would impact the speed at which the bloom appears, and preventative

61
measures (such as the relocation of aquacultural pens) could be taken with these slower
growing blooms.
Cell yields were found to be almost inversely proportional to growth rates (Figure
3.6) in most cases. This could be due to carbon-limitation prematurely impeding growth
in balanced, nutrient-replete cultures. Insufficient carbon dioxide, a necessary reactant for
photosynthesis, would prevent cells from attaining higher cell yields that would normally
be possible under the same N/P/Fe concentrations in the presence of dissolved carbon.
The overall finding regarding growth was that no modelled parameter negatively
influenced growth to the extent that H. akashiwo would not be present in future coastal
waters (Figure 3.3). A natural bloom population density of 1,000,000 cells mL-1 has been
found to cause a very visible colouration of surface waters (Trainer, 2012). None of the
batch cultures in this study reached similarly high bloom densities, which is considered
one limitation of laboratory batch culture experiments, unable to perfectly mimic natural
conditions. Similar experiments performed in situ, with a constant renewal of nutrients
(through coastal loadings, upwelling, H. akashiwo movement in the water column, etc.)
could very well attain densities higher than 1,000,000 cells mL-1.
Species dynamics and community structure could also allow for the proliferation
of H. akashiwo in the future ocean. The growth of other co-occurring species – like the
dinoflagellate Prorocentrum minimum – has been shown to be negatively impacted by
more acidic, warmer conditions, which was not the case with H. akashiwo that
experienced increased growth under the same conditions (Fu et al., 2008). Population
reductions in co-occurring species could reduce pressure for resources (light, nutrients,
etc.) and further enhance the success of H. akashiwo. Despite any limitations of this

62
study, it is fair to predict Heterosigma akashiwo will have a continued presence in future
ocean waters.
4.2 Impacts of Heterosigma akashiwo in the future ocean
Since it is likely that H. akashiwo will retain the ability to form blooms in the
future, it is important to determine the nature of these blooms, in terms of their effect on
the surrounding marine community. H. akashiwo could have a positive effect, via an
increased production of neutral lipids (EFAs) that can accumulate under certain
environmental conditions. The effect could also be negative if blooms become
increasingly toxic to marine life through allelopathy or ichtyotoxicity (Ikawa, 2004).
These toxic agents have been labelled as PUFAs in Fibrocapsa japonica, another
member of the class Raphidophycaea (Pezzolessi, 2010). By monitoring neutral lipid
accumulation in tandem with toxicity, we gain a better idea of whether this is also the
case for H. akashiwo.
4.2.1 Neutral lipid accumulation in Heterosigma akashiwo Results from this study showed that peak neutral lipid accumulation was not
significantly affected by iron concentration or pH (Figure 3.4A). This can be explained
by a high nitrogen concentration (880 µM), later found to have a dominant control on
neutral lipid production, which could have masked any significant differences caused by
iron availability or pH.
The highest amounts of neutral lipid accumulation occurred in the most alkaline,
P-limited cultures and the lowest accumulations occurred in the most acidic, N-limited
cultures (Figure 3.4B). This lower neutral lipid accumulation at a lower pH could be
attributable to lower cellular P requirements, which have been documented to occur

63
under lower pH conditions in H. akashiwo (Fu et al., 2008). The fact that neutral lipid
accumulation decreased with pH is concerning, as this could translate to less EFAs
available to sustain marine food chains.
Nitrogen source was not found to significantly impact neutral lipid accumulation
(Figure 3.4C). The key finding with respect to neutral lipid accumulation was the fact that
it appears to be primarily governed by nitrogen/phosphorus concentrations. When
nitrogen concentrations were examined across experiments, in treatments with other
experimental variables being equal, it became apparent that lower nitrogen concentrations
corresponded to higher accumulations of neutral lipids (Figure 3.8.3). A drastic decline in
neutral lipid production was also evident with increasing concentration of phosphorus
(Figure 3.7B).
My suggested reasoning is that high nutrient cultures experienced dissolved
inorganic carbon (DIC)-limitation prior to N, P, or Fe-limitation and would not have
accumulated carbon-rich energy stores in the form of TAGs, or neutral lipids, as they
were undergoing balanced growth. This will be expanded upon in more detail in section
4.3.
4.2.2.1 Implications of altered neutral lipid accumulation
The implications of altered nutrient levels and pH within marine ecosystems are
that H. akashiwo could be a less nutritious food source for higher trophic levels under
increasingly eutrophic/acidic conditions, as they have been shown to produce less neutral
lipids or EFAs (Figure 3.8.3).
The algal biodiesel industry could also be impacted by these findings. It seems as
though adding less N to the system increases neutral lipid accumulation (a high-value

64
source of energy). Heterosigma akashiwo grown at low N (10 µM), as nitrate,
accumulated nearly twice as many neutral lipids under the most acidified treatment (pH
7.4) (Figure 3.4C). This could mean that much less N would need to be added into the
system to attain the same neutral lipid yields, so long as the culture was acidified (a cost-
effective and simple adjustment).
4.2.2 Heterosigma akashiwo toxicity
An initial examination of toxicity data reveals that almost every treatment applied
elicited a very strong toxic response, shown by gill cell death following a 24-hour
exposure period (Figure 3.5). In order to investigate toxicity results in this study, it is
important to understand that in nature blooms of H. akashiwo are variably toxic. Within
this section, treatments that were found to elicit a variable toxic response will be
examined, followed by strong correlations between variables tested/measured and
toxicity, to determine what the toxic compound could be, and when H. akashiwo HABs
are most likely to be toxic.
4.2.2.1 Heterosigma akashiwo: variable toxicity The lowest peak toxicity was exerted by H. akashiwo grown with ammonium as
the nitrogen source (Figure 3.5C). This is a particularly interesting finding, as H.
akashiwo are toxic to fish, which excrete large amounts of ammonia. This leads to the
idea of a possible interaction between finfish defences, and the ichthyotoxic H. akashiwo.
This finding has possible implications for the aquaculture industry, in that the addition of
ammonium to areas of high-density netted fish could potentially prevent the induction of
toxicity in H. akashiwo.
65
4.2.2.2 Heterosigma akashiwo: the toxic compound The toxic component of H. akashiwo has yet to be determined. There exist two
streams of thought; that it is a brevetoxin-like compound, or a PUFA. Other members of
the algal class Raphidophyceae (Chattonella and Fibrocapsa) have been examined, and
were found to produce toxic brevetoxins in the case of certain Chattonella spp., and toxic
PUFAs in the case of Fibrocapsa (Pezzolesi et al., 2010; Haque & Onoue, 2002). By
examining the variable accumulation of neutral lipids in H. akashiwo alongside its
variable toxicity, a case could be made if there was a positive correlation, for toxic
PUFAs being the mechanism of ichthyotoxicity.
Since the results showed a negative correlation between peak neutral lipid
accumulation and peak toxicity, this could point to the toxic component of H. akashiwo
being a brevetoxin-like compound rather than a PUFA (Figure 3.6B & Table 3.6). It is
possible that the toxic component is a metabolic derivative of EFAs, rather than the
PUFA itself, and was not measured in these experiments.
Another explanation would be that a brevetoxin-like compound is being produced
by H. akashiwo. A recent study examining toxicity within the dinoflagellate Karenia
brevis found that brevetoxin production, and ensuing toxicity, increased dramatically
during periods of nitrate and phosphate limitation (Hardison et al. 2013). This is
inconsistent with the toxicity results from this study, which found increasing toxicity as
concentrations of nitrate and phosphate reduced (Figures 3.7C/D). From this, it seems
questionable that H. akashiwo are producing a brevetoxin-like compound, similar to
Chattonella species (Haque & Onoue, 2002).

66
An alternate theory is that the toxic compound is more similar in structure to that
of a karlotoxin than a brevetoxin. Karlotoxins are polar lipids, which were not measured
during this study. They exert haemolytic, cytotoxic, and ichthyotoxic effects on
surrounding marine life (Deeds et al., 2002).
4.3 N/P concentration: a regulator of H. akashiwo physiology
Cells grown under high concentrations of nitrogen/phosphorus had lower specific
growth rates and attained higher cell yields (Figures 3.8.1 & 3.8.2). If we recall
Redfield’s ratio of 106C:16N:1P, these cells would undergo dissolved inorganic carbon
(DIC) limitation prior to nitrogen/phosphorus-limitation. H. akashiwo have been found to
fully utilize 100 µM N before DIC-limitation occurs (Cochlan, 2013). Carbon-limitation
would prevent the accumulation of neutral lipids during the transition period between
exponential and stationary growth phase. Cells could, however, be producing the carbon-
rich brevetoxin (C49H70O13) under balanced growth with high nutrient conditions, while
maintaining a low level of accumulated neutral lipids. This suggests that a brevetoxin is a
natural component of H. akashiwo. Toxicity was greater than 88% across all experiments
with concentrations of nitrogen higher than 100 µM N, while neutral lipid accumulation
increased with lower concentrations of nitrogen (Figures 3.8.4B & 3.8.3B). The
experiment with the lowest concentration of nitrogen/phosphorus, generated some of the
highest specific growth rates and lowest cell yields (Figures 3.8.1A & 3.8.2A). These
cells had significantly lower toxicity, and high neutral lipid accumulation (Figures 3.8.4A
& 3.8.3A). When cells experience unbalanced growth, due to nutrient-limitation, they
accumulate higher amounts of neutral lipids, since they are still receiving reactants
necessary for photosynthesis. Cells store this carbon as neutral lipids within the

67
cytoplasm. The least toxic of the treatments within this low nitrogen experiment had
ammonium as the N-source (Figure 3.4C). Since H. akashiwo readily uptake ammonium
in this nitrogen-source experiment, but require multiple enzymatic processes to convert
nitrate or urea into a useable form, this could account for the differential toxicity and
neutral lipid production. In all pH treatments but 7.4, ammonium-grown cells
accumulated a higher amount of neutral lipids, and exhibited lower toxicity than nitrate or
urea (Figures 3.3C & 3.4C). I propose that N was used at a faster rate when provided as
ammonium, and thus, these cultures became nutrient-limited well before the others.
In summary, nitrogen and phosphorus concentrations were found to be a major
control of specific growth rates, cell yields, neutral lipid accumulation, and toxicity in H.
akashiwo under iron-replete conditions. Unbalanced growth due to N/P-limitation
resulted in the accumulation of neutral lipids and lower toxicity. Cell undergoing
balanced growth, interrupted by C-limitation, did not have a chance to accumulate neutral
lipids and toxicity was higher. This points to the notion that the toxin is a natural
component of H. akashiwo undergoing balanced growth.
4.4 Heterosigma akashiwo HABs in the future ocean In the future ocean we expect to see higher amounts of nutrients due to
anthropogenic nutrient-loadings and lower pH attributable to increased carbon dioxide
emissions (Anderson et al., 2002; Royal Society, 2005; Doney et al., 2009; Hallegraeff,
2010; Zeebe et al., 2012). Based on the results of this study, these conditions could cause
slower growth rates, yet higher cell yields of H. akashiwo. Cell densities over 1,000,000
cells mL-1 constitute a visibly dense algal bloom for this species. This points to a
continued likelihood of N/P fuelled bloom events. The other important factor to examine

68
is the variable toxicity of H. akashiwo, as these bloom events can be toxic to marine life.
The results of this study suggest nearly complete toxicity at concentrations of nitrogen
higher than 100 µM and phosphorus greater than 8.3 µM (Figures 3.7C/D) that could
very well be the case in a eutrophic coastal area of the ocean. This could mean almost
exclusively toxic blooms of H. akashiwo in future eutrophic coastal ocean waters. Based
on my proposed model of physiology and toxicity at high nutrient concentrations, I would
expect to see more H. akashiwo toxic blooms that would be most toxic once they
experience DIC-limitation, due to localised drawdown of carbon during a natural bloom
event. More acidic waters could provide more DIC initially, however this would merely
delay the inevitable limitation, due to a lack of a carbon concentrating mechanism within
H. akashiwo (Nimer et al. 1997).
4.5 Implications of future HAB presence The future ocean environment would be a suitable location for H. akashiwo,
possibly exerting dominance over co-occurring HAB species. Not only do the cells grow
exceptionally well but lower rates of EFAs may restrict their consumption by primary
consumers. This study also points to H. akashiwo becoming increasingly toxic, with a
high potential to cause devastating fish kills within areas with aquaculture operations.
Industry should pair with government to create strong legislation governing allowable
nutrient inputs. Excessive use of synthetic-N fertilizers should be reconsidered. If nothing
is done to manage the problem, we will continue to see a loss of fish landing revenue
within coastal waters, and other negative effects on coastal communities.

69
4.6 Conclusion: the big picture
Anthropogenic activities have large-scale effects on biogeochemical systems,
such as carbon dioxide emissions driving ocean acidification, and fertilizer run-off
resulting in coastal ocean eutrophication. These large-scale processes dictate a suite of
interactions among living organisms, seawater chemistry, and nutrient cycles that could
exert negative or positive changes as we proceed into the unknown future. Increased
formation of highly toxic H. akashiwo HABs that are of a lesser nutritional value to the
marine food chain seems to be a distinctive possibility in the future ocean. This would be
controlled by increased nutrient loadings of nitrogen and phosphorus and increased
bioavailability of iron through ocean acidification. In this instance, our negative impact
on the Earth has come back to negatively impact our aquaculture operations, coastal
communities, and health. Efforts to drastically reduce carbon dioxide emissions, such as
algal biofuel production, and regulation/reduction of nutrient inputs into natural systems
needs to be a top priority at all levels of governance.
70
References Ajani, P., Hallegraeff, G. and Pritchard, T. 2001. Historic overview of algal blooms in marine and estuarine waters of New South Wales, Australia. Proc. Linn. Soc. N.S.W., 123: 1-22. Anderson, D.M., Hoagland, P., Kaoru, Y. and White, A.W. 2000. Estimated annual economic impacts resulting from harmful algae blooms (HABs) in the United States. WHOI Tech. Rept. No. 2000-11. Woods Hole, MA.: Department of Biology and Marine Policy Center, Woods Hole Oceanographic Institution. Anderson, D.M., Glibert, P.M. and Burkholder, J.M. 2002. Harmful algal blooms and eutrophication: nutrient sources, composition, and consequences. Estuaries, 25:704-726. Band-Schmidt, C.J., Morquecho, L., Hernandez-Becerril, D.U., Reyes-Salinas, A. and Bravo-Sierra, E. 2004. Raphidophyceans on the coasts of Mexico. Hydrobiologia, 515: 79-89.
Beman, J.M., Chow, C.E., King, A.L., Feng, Y., Fuhrman, J.A., Andersson, A., Bates, N.R., Popp, B.N. and Hutchins, D.A. 2010. Global declines in oceanic nitrification as a consequence of ocean acidification. PNAS, 108(1): 208-213. Benitez-Nelson, C.R. 2000. The biogeochemical cycling of phosphorus in marine systems. Earth-Science Reviews, 51: 109-135. Berges, J.A., Franklin, D.J., and Harrison, P.J. 2003. Evolution of an artificial seawater medium: improvements in enriched seawater, artificial water over the last two decades. J. Phycol. 37: 1138 (correction addition (2004) 40:619). Bjornsson, W. 2009. Semi-quantitative estimate of intracellular lipid content using the plate reader and Nile Red. Standard Operating Procedure (SOP), Cellana Biofuels, Kona, Hawaii. Boyd, P.W., Jickells, T., Law, C.S., Blain, S., Boyle, E.A., Buesseler, K.O., Coale, K.H., Cullen, J.J., De Baar, H.J.W., Follows, M., Harvey, M., Lancelot, C., Levasseur, M., Owens, N.P.J., Pollard, R., Rivkin, R.B., Sarmiento, J., Schoemann, V., Smetacek, V., Takeda, S., Tsuda, A., Turner, S. and Watson, A.J. 2007. Mesoscale iron enrichment experiments 1993-2005: synthesis and future directions. Science, 315: 612-617.
Breitbarth, E. et al. 2009. Ocean acidification affects iron speciation in seawater. Biogeosciences Discuss., 6: 6781-6802.
Bronicheski, C.M. 2014. Growth of the Marine Fish-Killing Phytoflagellate, Heterosigma Akashiwo Under Emerging Coastal Regimes: Temperature, Eutrophication and Ocean Acidification. (Masters Thesis) University of Western Ontario - Electronic Thesis and Dissertation Repository. Capone, D.G. and Hutchins, D.A. 2013. Microbial biogeochemistry of coastal upwelling regimes in a changing ocean. Nature Geoscience, 6: 711-717. Castaing, M., Camplo, M. and Kraus, J.L. 1993. Structural requirements for unsaturated fatty acids and fatty alcohols to induce optimal biological responses: An approach using model membranes. Res. Commun. Chem. Path. Pharmacol., 81: 131-150.

71
Chang, F.H., Pridmore, R. and Boustead, N. 1993. Occurrence and distribution of Heterosigma cf. akashiwo (Raphidophyceae) in a 1989 bloom in Big Glory Bay, New Zealand, pp. 675-680. In T.J. Smayda, Y. Shimizu [eds.], Toxic Phytoplankton Blooms in the Sea. Elsevier, Amsterdam. Cloern, J.E. 1999. The relative importance of light and nutrient limitation of phytoplankton growth: a simple index of coastal ecosystem sensitivity to nutrient enrichment. Aquatic Ecology, 33: 3-16. Cochlan, W.P. 2013. Personal communication, Romberg Tiburon Center and Department of Biology, San Francisco State University, CA, USA. Collos, Y. and Berges, J.A. 2004. Nitrogen metabolism in phytoplankton. In Marine Ecology. in Encyclopedia of Life Support Systems (EOLSS), Developed under the Auspices of the UNESCO, Eolss Publishes, Oxford, UK. Corfee-Morlot, J., Maslin, M. and Burgess, J. 2007. Global warming in the public sphere. Phil. Trans. R. Soc. A., 365: 2741-2776.
Davidson, K., et al. 2012. Harmful algal blooms: How strong is the evidence that nutrient ratios and forms influence their occurrence? Estuarine, Coastal and Shelf Science, 115: 399-413.
Dayeh, V.R., Schirmer, K., Lee, L.E.J. and Bols, N.C. 2003. Rainbow trout gill cell line microplate cytotoxicity test. In Curr. Protoc. Toxicol. 1.5.1–1.5.17. Deeds, J.R., Terlizzi, D.E., Adolf, J.E. and Stoecker, D.K. 2002. Toxic activity from cultures of Karlodinium micrum (= Gyrodinium galatheanum)(Dinophyceae)- a dinoflagellate associated with fish mortalities in an estuarine aquaculture facility. Harmful Algae, 1: 169-189. Denman, K., Christian, J.R., Steiner, N., Pörtner, H-O. and Nojiri, Y. 2011. Potential impacts of future ocean acidification on marine ecosystems and fisheries: current knowledge and recommendations for future research. ICES J. Mar. Sci. 68: 1019–1029. Doan, T.T.Y., Sivaloganathan, B. and Obbard, J.P. 2011. Screening of marine microalgae for biodiesel feedstock. Biomass and Bioenergy, 35: 2534-2544. Doney, S.C., Fabry, V.J., Feely, R.A., Kleypas, J.A. 2009. Ocean acidification: The other CO2 problem. Annu. Rev. Mar. Sci. 1: 169-92. Dorantes-Aranda, J.J., Waite, T.D., Godrant, A., Rose, A.L., Tovar, C.D., Woods, G.M. and Hallegraeff, G.M. 2011. Novel application of a fish gill cell line assay to assess ichthyotoxicity of harmful marine microalgae. Harmful Algae, 10:366-373. Feely, R.A., Sabine, C.L., Hernandez-Ayon, J.M., Ianson, D. and Hales, B., 2008. Evidence for upwelling of corrosive “acidified” water onto the continental shelf. Science, 320: 1490-1492. Feely, R.A., Klinger, T., Newton, J.A., Chadsey, M., Busch, D.S., Friedman, C.S., Ruesink, J., Waldbusser, G., Alin, S.R., Krembs, C. and Roberts, M. 2012. Scientific summary of ocean acidification in Washington State marine waters. Washington Shellfish Initiative Blue Ribbon Panel on Ocean Acidification. NOAA OAR Special Report.

72
Flynn, K.J. and Butler, I. 1986. Nitrogen sources for the growth of marine microalgae: role of dissolved free amino acids. Mar. Ecol. Prog. Ser. 34: 281-304. Fredrickson, K.A., Strom, S.L., Crim, R. and Coyne, K.J., 2011. Interstrain variability in physiology and genetics of Heterosigma akashiwo (Raphidophyceae) from the west coast of North America. J. Phycol. 47:25-35. Fu, F.-X., Zhang, Y., Warner, M.E., Feng, Y., Sun, J. and Hutchins, D.A., 2008. A comparison of future increased CO2 and temperature effects on sympatric Heterosigma akashiwo and Prorocentrum minimum. Harmful Algae, 7: 76-90. Fu, F.-X., Place, A.R., Garcia, N.S., and Hutchins, D.A., 2010. CO2 and phosphate availability control the toxicity of harmful bloom dinoflagellate Karlodinium veneficum. Aquat. Microb. Ecol. 59: 55-65. Fuentes-Grünewald, C. 2012. Dinoflagellates as feedstock for biodiesel production. In R. Gordon & J. Seckbach (Eds.), The Science of Algal Fuels SE - 13 (Vol. 25, pp. 233–254 LA – English). Springer Netherlands. Fuentes-Grünewald, C., Garcés, E., alacid, E., Sampedro, N., Rossi, S. and Camp, J. 2012. Improvement of lipid production in the marine strains Alexandrium minutum and Heterosigma akashiwo. Journal of Industrial Microbial Biotechnology, 39: 207-216. Furnas, M.J. 1990. In situ growth rates of marine phytoplankton: approaches to measurement, community and species growth rates. Journal of Phytoplakton Research, 12(6): 1117-1151. Gaines, G. and Taylor, F.J.R. 1986. A mariculturist’s guide to potentially harmful marine phytoplankton of the Pacific coast of North America. Marine Resources Section, Fisheries Branch, B.C. Ministry of Environment, Information Report 10, prepared by Dept. of Oceanography, University of British Columbia, Vancouver, B.C., pp. 49 and appendicies. Geider, R. and La Roche, J. 2002. Redfield revisited: variability of C:N:P in marine microalgae and its biochemical basis, European Journal of Phycology, 37:1, 1-17. Glibert, P. M., Seitzinger, S., Heil, C. A., Burkholder, J. M., Parrow, M. W., Codispoti, L. A., and Kelly, V. 2005. Eutrophication. Oceanography, 18(2): 198. Glibert, P. M., Harrison, J., Heil, C., and Seitzinger, S. 2006. Escalating worldwide use of urea–a global change contributing to coastal eutrophication. Biogeochemistry, 77(3): 441-463. Glibert, P.M. and Burkholder, J.M. 2006. The complex relationships between increases in fertilization of the Earth, coastal eutrophication, and proliferation of harmful algal blooms. Ecological Studies, 189: 341-354. Greenspan, P., Mayer, E.P. and Fowler, S.D. 1985. Nile red: A selective fluorescent stain for intracellular lipid droplets. Journal of Cell Biology, 100: 965-73. Guillard, R.R.L. 1973. Division rates, p. 289-311. In Stein, J.R. [eds.], Handbook of Phycological Methods—Culture Methods and Growth Measurements. Cambridge University Press.

73
Haigh, R. and Taylor, F.J.R. 1990. Distribution of potentially harmful phytoplankton species in the northern Strait of Georgia, British Columbia. Can. J. Fish. Aquat. Sci. 47: 2339-2349. Hallegraeff, G. M. 1993. A review of harmful algal blooms and their apparent global increase. Phycologia, 32(2): 79-99. Hallegraeff, G. M. 2010. Ocean climate change, phytoplankton community responses, and harmful algal blooms: A formidable predictive challenge. Journal of Phycology, 46(2): 220-235. Haque, S.M. and Onoue, Y. 2002. Variation in toxin compositions of two harmful raphidophytes Chattonella antiqua and Chattonella marina, at different salinities. Environ. Toxicol. 17: 113-118. Hara, Y. and Chihara M. 1987. Morphology, ultrastructure and taxonomy of the raphidophycean alga Heterosigma akashiwo. Bot. Mag. Tokyo. 100: 151–163. Hardison, D.R., Sunda, W.G., Shea, D. and Litaker, R.W. 2013. Increased toxicity of Karenia brevis during phosphate limited growth: Ecological and evolutionary implications. PLoS ONE, 8(3): e58545. Harrison, J. A., Bouwman, A. F., Mayorga, E. and Seitzinger, S. 2010. Magnitudes and sources of dissolved inorganic phosphorus inputs to surface fresh waters and the coastal zone: A new global model. Global Biogeochemical Cycles, 24(1) 1-16. Harrison, P. J. and Berges, J.A. 2005. Chapter 3. Marine culture media. p. 21-33. In R. A. Andersen [ed.], Algal Culturing Techniques. Elsevier. Harrison, P.J., Thompson, P.A., and Calderwood, G.A. 1990. Effects of nutrients and light limitation on the biochemical composition of phytoplankton. Journal of Applied Phycology, 2: 45-56. Harrison, P. J., Waters, R.E. and Taylor, F.J.R. 1980. A broad spectrum artificial seawater medium for coastal and open ocean phytoplankton. J. Phycol. 16: 28-35. Hecky, R.E., Campbell, P. and Hendzel, L.L. 1993. The stoichiometry of carbon, nitrogen, and phosphorus in particulate matter of lakes and oceans. Limnol. Oceanogr. 38(4): 709-724. Herndon, J. 2003. Nitrogen uptake by the raphidophyte Heterosigma akashiwo: A laboratory and field study. Master of Arts Thesis, San Francisco State University, San Francisco, California. Herndon, J. and Cochlan, W.P. 2007. Nitrogen utilization by the raphidophyte Heterosigma akashiwo: Growth and uptake kinetics in laboratory cultures. Harmful Algae, 6: 260-270. Honjo, T. 1993. Overview on bloom dynamics and physiological ecology of Heterosigma akashiwo. pp.33-41. In Smayda, T. J. and Shimizu, Y. Y. [eds.], Toxic Phytoplankton Blooms in the Sea. Elsevier, Amsterdam. Horner, R., Garrison, D. and Plumley, F. 1997. Harmful algal blooms and red tide problems on the US west coast. Limnol Oceanogr. 42: 1076-1088. Horner, R.A., 2002. A Taxonomic Guide to Some Common Marine Phytoplankton. Biopress Ltd., Bristol. 195 pp.

74
Hu, Q. 2008. Biofuel from algae: Technical challenges and opportunities. Laboratory for algae research & biotechnology. Arizona State University Polytechnic Campus. Presented at the Scripps Institute of Oceanography. Huesemann, M.H., Skillman, A.D. and Crecelius, E.A. 2002. The inhibition of marine nitrification by ocean disposal of carbon dioxide. Marine Pollution Bulletin, 44: 142-148. Ikawa, M. 2004. Algal polyunsaturated fatty acids and effects on plankton ecology and other organisms. UNH Center for Freshwater Biology Research, 6(2): 17-44. Igarashi, M., Demar, J.C., Ma, K.Z., Chang, L., Bell, J.M. and Rapoport, S.I. (2007). Docosahexaenoic acid synthesis from alpha-linolenic acid by rat brain is unaffected by dietary n-3 PUFA deprivation. Journal of Lipid Research, 48: 1150-1158. IPCC (Intergovernmental Panel on Climate Change) 2007. A report of working group I of the Intergovernmental Panel on Climate Change. Summary for policy makers and technical summary. IPCC Secretariat, World Meteorological Association, Geneva. Available at www.ipcc.ch/pdf/assessment-report/ar4/wg1/ar4-wg1-spm.pdf IPCC. 2012. Summary for Policymakers, pp 1-19. In Field, C.B., V. Barros, T.F. Stocker, D. Qin, D.J. Dokken, K.L. Ebi, M.D. Mastrandrea, K.J. Mach, G.-K. Plattner, S.K. Allen, M. Tignor, and P.M. Midgley [eds.]. Managing the Risks of Extreme Events and Disasters to Advance Climate Change Adaptation. A Special Report of Working Groups I and II of the Intergovernmental Panel on Climate Change. Cambridge University Press, Cambridge, UK, and New York, NY, USA. Jarvis, A., Reuter, H.I., Nelson, A. and Guevara, E. 2008. Hole-filled seamless SRTM data V4, International Centre for Tropical Agriculture (CIAT), available from http://srtm.csi.cgiar.org. Kempton J., Keppler C. J., Lewitus A., Schuler A. and Wilde S. 2008. A novel Heterosigma akashiwo (Raphidophyceae) bloom extending from a South Carolina bay to offshore waters. Harmful Algae, 7 (2): 235-240. Khan S., Arakawa O., and Onoue Y. 1997. Neurotoxins in a toxic red tide of Heterosigma akashiwo (Raphidophyceae) in Kagoshima Bay, Japan. Aquac. Res. 28(1): 9-14. Kudela, R.M., Lane, J.Q. and Cochlan, W.P. 2008. The potential role of anthropogenically derived nitrogen growth of harmful algae in California, USA. Harmful Algae, 8: 103-110. Ling, C. and Trick, C.G. 2010. Expression and standardized measurement of hemolytic activity in Heterosigma akashiwo. Harmful Algae, 9: 522-529. Ling, C. 2006. Expression and regulation of haemolytic activity in Heterosigma akashiwo. (Masters Thesis) University of Western Ontario - Thesis and Dissertation Repository. Liu, Z.Y., Wang, G.C., and Zhou, B.C. 2008. Effect of iron on growth and lipid accumulation in Chlorella vulgaris. Bioresour. Technol. 99(11): 4717-4722. Maxwell, D.P., Laudenbach, D.E. and Huner, N.P.A. 1995. Redox regulation of light-harvesting complex II and cab mRNA abundance in Dunaliella salina. Plant Physiol. 109: 787-795.

75
McLaughlin, K., Silva, S., Kendall, C., Stuart-Williams, H. and Paytan, A. 2004. A precise method for the analysis of δ18O of dissolved inorganic phosphate in seawater. Limnol. Oceanogr.: Methods, 2: 202-212. Miki, K. 1983. Analysis of phytoplankton growth and environmental succession using a continuous culture system. M.S. Thesis. University of Tsukuba, 66 pp. (in Japanese) as cited in Okaichi, T. [ed.], Red Tides. Terra Scientific Publishing Co., Tokyo. Morel, M.M.F., Reuter, J.G. and Price, N.M. 1991. Iron nutrition of phytoplankton and its possible importance in the ecology of ocean regions with high nutrients and low biomass. Oceanography, 4(2): 56-61. Nimer, N.A., Iglesias-Rodriguez, M.D. and Merrett, M.J. 1997. Bicarbonate utilization by marine phytoplankton species. J. Phycol. 33: 625-631. Okaichi, T. 1989. Red tide problems in the Seto Inland Sea, Japan, 137-142. In Okaichi,T., Anderson, D.M. & Nemoto, T. [eds.], Red Tides: Biology, Environmental Science, and Toxicology. Elsevier. Ono, K., Khan, S. and Onoue, Y. 2000. Effects of temperature and light intensity on the growth and toxicity of Heterosigma akashiwo (Raphidophyceae). Aquac. Res. 31: 427-433. Orr, J. C., Fabry, V. J., Aumont, et al. 2005. Anthropogenic ocean acidification over the twenty-first century and its impact on calcifying organisms. Nature, 437: 681-686. Pezzolesi, L. et al. 2010. Toxicity evaluation of Fibrocapsa japonica from the Northern Adriatic Sea through a chemical and toxicological approach. Harmful Algae, 9: 504-514. Powers, L., Creed, I.F. and Trick, C.G., 2012. Sinking of Heterosigma akashiwo results in increased toxicity of this harmful algal bloom species. Harmful Algae, 13: 95-104. Prescott, L.M., Harley, J.P. and Klein, D.A. 1999. Chapter 6: Microbial growth. In Microbiology 4/e. McGraw-Hill Higher Education, New York, NY, USA. Price, N.M., Harrison, G.I., Hering, J.G., Hudson, R.J., Nirel, P.M.V. and Palenik, B. 1988/1989. Preparation and chemistry of the artificial algal culture medium Aquil. Biological Oceanography, 6: 443-461. Quayle, D. B. 1969. Paralytic shellfish poisoning in British Columbia. Bull. 168, Fish. Res. Bd. Canada, 68pp. Raven, J.A. 1988. The iron and molybdenum use efficiencies of plant growth with different energy, carbon and nitrogen sources. New. Phytol., 109: 279-287. Raven, J.A. 2010. Inorganic arbon acquisition by eukaryotic algae: four current questions. Photosynth. Res. 106: 123-134. Raven, J.A., Giordano, M., Beardall, J. and Maberly, S.C. 2011. Algal and aquatic plant carbon concentrating mechanisms in relation to environmental change. Photosynth. Res. 109: 281-296.

76
Redfield, A.C. (1958) The biological control of chemical factors in the environment. American Scientist, 46: 205-221. Reinfelder, J.R. 2010. Carbon concentrating mechanisms in eukaryotic marine phytoplankton. Annu. Rev. Mar. Sci., 3: 291-315. Rensel, J. 1995. Harmful algal blooms and finfish resources in Puget Sound. In R.M. Stickland (ed.): Puget Sound Research ’98; Proceedings of the Water Quality Action Team. Puget Sound. Olympia, WA, p.422-429. Rensel, J.J.E., Haigh, N. and Tynan, T.J. 2010. Fraser river sockeye salmon marine survival decline and harmful blooms of Heterosigma akashiwo. Harmful Algae, 10: 98-115. Rockström, J.W., Steffen, K., Noone, Å., Persson, F.S., Chapin, III, E., Lambin, T.M., Lenton, M., Scheffer, C., Folke, H., Schellnhuber, B., Nykvist, C.A., De Wit, T., Hughes, S., van der Leeuw, H., Rodhe, S., Sörlin, P.K., Snyder, R., Costanza, U., Svedin, M., Falkenmark, L., Karlberg, R.W., Corell, V.J., Fabry, J., Hansen, B., Walker, D., Liverman, K., Richardson, P., Crutzen, and Foley, J. 2009. Planetary boundaries: exploring the safe operating space for humanity. Ecology and Society, 14(2): 32. Rosenberg, R. and Loo, L-O. 1988. Marine eutrophication induced oxygen deficiency: effects on soft bottom fauna, western Sweden. Ophelia, 29: 213-225. Rossoll, D., Bermudez, R., Hauss, H., Schulz, K.G., Riebesell, U., et al. 2012. Ocean acidification-induced food quality deterioration constrains trophic transfer. PLoS ONE, 7(4): e3473. Royal Society (Great Britain). 2005. Ocean acidification due to increasing atmospheric carbon dioxide. The Royal Society (Great Britain) Other. Royal Society, London, pp. vi;43-44. Rudek, J., Paerl, H.W., Mallin, M.A. and Bates, P.W. 1991. Seasonal and hydrological control of phytoplankton nutrient limitation in the lower Neuse River estuary, North Carolina. Marine Ecology Progress Series, 75: 133-142. Rukmanisari, N. and Redden, A. 2011. Growth response of natural phytoplankton to enrichment of urea and other forms of dissolved nitrogen. African Journal of Environmental Science and Technology, 5(12): 1100-16. Schindler, D.W. 1974. Eutrophication and recovery in experimental lakes: implications for lake management. Science, 184(4139): 897-899. Sharma, K.K., Schuhmann, H. and Schenk, P.M. 2012. High lipid induction in microalgae for biodiesel production. Energies, 5: 1532-1553. Shi, D., Xu, Y., Hopkinson, B.M. and Morel, F.M.M. 2010. Effect of ocean acidification on iron availability to marine phytoplankton. Science, 327: 676-679. Singh, A., Nigam, P.S. and Murphy, J.D. 2011. Renewable fuels from algae: an answer to debatable land based fuels. Bioresource Technology, 102: 10-16.
77
Smayda, T. 1990. Novel and nuisance phytoplankton blooms in the sea: evidence for a global epidemic, p. 29–40. In E. Graneli, B. Sundstrom, L. Edler, and D. M. Anderson [eds.], Toxic Marine Phytoplankton. Elsevier, New York. Smayda, T.J. 1997. What is a bloom? A commentary. Limnol. Oceanogr., 42(5, part 2): 1132-1136. Smayda, T.J. 1998. Ecophysiology and bloom dynamics of Heterosigma akashiwo (Raphidophyceae), pp. 113-131. In D.M. Anderson, A.D. Cembella and G.M. Hallegraeff [eds.] Physiological Ecology of Harmful Algal Blooms, NATO ASI Series G: Ecological Sciences, Vol. 41, Springer, Berlin. Smil, V. 2001. Enriching the Earth: Fritz Haber, Carl Bosch, and the Transformation of World Food. The MIT Press, Cambridge, U.K. Steffen, W., Grinevald, J., Crutzen, P. and McNeill, J. The anthropocene: conceptual and historical perspective. Phil. Trans. R. Soc. A. 369(1938): 842-867. Sun, J., Hutchins D. A., Feng Y., Seubert E. L., Caron D. A. and Fu F.-X. 2011. Effects of changing pCO2 and phosphate availability on domoic acid production and physiology of the marine harmful bloom diatom Pseudo-nitzschia multiseries. Limnol. Oceanogr. 56(3): 829-840. Sunda, W.G. 2006. Trace metal and harmful algal blooms, pp. 203-214. In E. Granéli and J.T. Turner [eds.], Ecology of Harmful Algae. Ecological Studies, Vol. 189. Springer-Verlag Berlin/Heidelberg. Sunda,W.G. and Huntsman, S.A. 1995. Iron uptake and growth limitation in oceanic and coastal phytoplankton, Mar. Chem. 50(1–4): 189-206. Tamminen, T. and Irmisch, A. 1996. Urea uptake kinetics of a midsummer planktonic community on the SW coast of Finland. Marine Ecology Progress Series, 130: 201-11. Tatters, A.O, Fu, F.X. and Hutchins, D.A. 2012. High CO2 and silicate limitation synergistically increase the toxicity of Pseudo-nitzschia fraudulente. PLoS ONE, 7(2): 1-7. Throndsen, J. 1997. The planktonic marine flagellates, pp. 591-730. In S.R. Tomas [ed.], Identifying Marine Phytoplankton. Academic Press. San Diego, USA. Tiffany M.A., Barlow S.B., Matey V.E. and Hulbert S.H. 2001. Chattonella marina (Raphidophyceae), a potentially toxic alga in the Salton Sea, California. Hydrobiologia, 466(8): 187-194. Toyoshima, T., Shimada, M., Ozaki, H.S., Okaichi, T. and Murakami, T.H. 1989. Histological alterations to gills of the yellowtail Seriola quinqueradiata, following exposure to the red tide species Chattonella antigua, pp. 439-442. In T. Okaichi, D.M. Anderson, T. Nemoto [eds.], Red Tides: Biology, Environmental Science, and Technology. Elsevier. Trainer, V. 2012. Personal communication, HAB Program Manager, NOAA Fisheries, Seattle, Washington, USA. Trick, C.G. 2012. [Unpublished] Plenary Presentation. Gordon Research Conference 2012.

78
Tseng, C.K., Zhou, M.J. and Zou, J.Z. 1993. Toxic phytoplankton studies in China, pp. 347-352. In T.J. Smayda, Y. Shimizu [eds.], Toxic Phytoplankton Blooms in the Sea. Elsevier, Amsterdam. Twiner, M. J. J., Dixon, S.J. and Trick, C.G., 2001. Toxic effects of Heterosigma akashiwo do not appear to be mediated by hydrogen peroxide. Limnol. Oceanogr. 46: 1400-1405. Twining, B.S., Baines, S.B., Fisher, N.S. and Landry, M.R. 2004. Cellular iron contnets of plankton during the Southern Ocean Trion Experiment (SOFeX). Deep-Sea Research I, 51: 1827-1850. Van Dolah, F.M. 2000. Marine algal toxins: origins, health effects and their increased occurrence. Environmental Health Perspectives. 108: 133-141. Veloza, A.J. 2005. The transfer of essential fatty acids by marine phytoplankton. Thesis. The Faculty of the School of Marine Science, The College of William and Mary.
Wells, M.L., Price, N.M. and Bruland, K.W. 1995. Iron chemistry in seawater and its relationship to phytoplankton- a workshop report. Mar. Chem. 48: 157-182. Yool, A., Martin, A.P., Fernández, C. and Clark, D.R. 2007. The significance of nitrification for oceanic new production. Nature. 447: 999–1002. Zeebe, R. 2012. History of seawater carbonate chemistry, atmospheric CO2 and ocean acidification. Annu. Rev. Earth Planet. Sci. 40:141-65.

79
Curriculum Vitae JULIA R. MATHESON
EDUCATION Master of Science in Biology, Physiology & Biochemistry 2014 Collaboration with the Centre for Environment & Sustainability University of Western Ontario, London, ON, Canada Bachelor of Science, Honors Specialization in Environmental Science 2011 University of Western Ontario, London, ON, Canada RELATED WORK EXPERIENCE Teaching Assistant 2012 - 2014 Departments of Biology and Environmental Science Courses: Ecosystem Health, Environmental Science, Marine Biology Field Course University of Western Ontario, London, ON, Canada Research Assistant 2012 Department of Biology in collaboration with the Lake Naivasha Sustainability Project University of Western Ontario, London, ON, Canada Environmental Engineering Technologist Assistant 2011 The City of Brantford, Department of Environmental Engineering Brantford, ON, Canada AWARDS Award of Excellence Scholarship, University of Western Ontario 2014 Best Presentation, Earth Day Colloquium, UWO 2013 Award of Excellence Scholarship, University of Western Ontario 2013 Western Graduate Research Scholarship, University of Western Ontario 2012-2014 Dean’s Honor List, University of Western Ontario 2009-2011 PUBLICATIONS Submitted Laurent, K.L., Matheson, J.R., Enanga, E.M., Verschuen, D., Creed, I.F. & Trick, C.G. Looking to the past for present answers: historical insights to the productivity of Lake Naivasha, Kenya and the answers that paleolimnology can provide. Submitted to: EcoHealth (Special Issue). CONTRIBUTIONS Oral Presentations Matheson. J.R., Cochlan, W.P. & Trick, C.G. (2014) Multiple stressors on the potential toxicity of Heterosigma akashiwo, a fish-killing flagellate in the Salish Sea. Salish Sea Conference 2014, Seattle, Washington, USA.

80
Matheson, J.R. & Trick, C.G. (2014) How ocean acidification will alter the growth, physiology and toxicity of the marine phytoplankton Heterosigma akashiwo. Gananoque Environmental Sciences and Engineering Conference 2014, Gananoque, ON, Canada. Matheson, J.R. & Trick, C.G. (2013) The effects of ocean acidification on the growth, physiology, and toxicity of Heterosigma akashiwo. Biology Graduate Research Forum 2013, University of Western Ontario, London, ON, Canada. Matheson, J.R. (2013) “Toxic Tides”. 10th Annual Earth Day Colloquium, University of Western Ontario, London, ON, Canada. Matheson, J.R. & Trick, C.G. (2013) Are increasing levels of CO2 causing algae to become toxic? 3-Minute Thesis Competition, School of Graduate and Postdoctoral Studies, University of Western Ontario, London, ON, Canada. Poster Presentations Matheson, J.R. & Trick, C.G. The fate of the marine raphidophyte Heterosigma akashiwo in the future ocean: How will effects of ocean acidification and eutrophication affect its growth, neutral lipid levels and toxicity? Environment & Sustainability Showcase 2014, UWO, London, ON, Canada. Matheson, J.R. & Trick, C.G. The effects of ocean acidification on the growth and toxicity of Heterosigma akashiwo. Biology Graduate Research Forum 2012, UWO, London, ON, Canada. COMMITTEES Committee for Sustainability in the Western Community, University of Western Ontario Society of Graduate Students, Sustainability Committee, University of Western Ontario Environment and Sustainability Society, University of Western Ontario Society of Biology Graduate Students, Seminar Committee, UWO Society of Biology Graduate Students, Social Committee, University of Western Ontario