the effects of personality type on engineering student ... · pdf filethe effects of...
TRANSCRIPT
THE EFFECTS OF PERSONALITY TYPE ONENGINEERING STUDENT PERFORMANCE AND ATTITUDES*
R.M. FelderDepartment of Chemical Engineering
North Carolina State University
G.N. FelderDepartment of Physics
Stanford University
E.J. DietzDepartment of Statistics
North Carolina State University
Abstract
The Myers-Briggs Type Indicator® (MBTI) was administered to a group of 116 students taking theintroductory chemical engineering course at North Carolina State University. That course and foursubsequent chemical engineering courses were taught in a manner that emphasized active and cooperativelearning and inductive presentation of course material. Type differences in various academicperformance measures and attitudes were noted as the students progressed through the curriculum. Theobservations were generally consistent with the predictions of type theory, and the experimentalinstructional approach appeared to improve the performance of MBTI types (extraverts, sensors, andfeelers) found in previous studies to be disadvantaged in the engineering curriculum. The conclusion isthat the MBTI is a useful tool for helping engineering instructors and advisors to understand their studentsand to design instruction that can benefit students of all types.
I. INTRODUCTION
People have different learning styles that are reflected in different academic strengths,weaknesses, skills, and interests. Given the almost unlimited variety of job descriptions withinengineering, it is safe to say that students with every possible learning style have the potential to succeedas engineers. They may not be equally likely to succeed in engineering school, however, since theyrespond differently to different instructional approaches and the predominant mode of instruction favorssome learning styles over others.1–3 Understanding learning style differences is thus an important step indesigning balanced instruction that is effective for all students.
Probably the best-known instrument used to assess learning styles is the Myers-Briggs TypeIndicator (MBTI).4 Studies of type effects in engineering education have been carried out by a consortiumof eight universities and the Center for Applications of Psychological Type5,6 and by Rosati.7-9 In all ofthese studies, introverts, intuitors, thinkers, and judgers generally outperformed their extraverted, sensing,feeling, and perceiving counterparts. (These terms will be explained shortly for readers who may not befamiliar with the MBTI.) Rosati subdivided his population according to gender and general level ofacademic proficiency and noted that the strongest type differences in performance and retention wereobserved for academically weak male students..
An opportunity to augment the findings of these studies arose in the context of a longitudinalstudy carried out at North Carolina State University. One of the authors (RMF) taught five chemicalengineering courses in five consecutive semesters to a cohort of students, beginning with the introductorychemical engineering course taught in the first semester of the sophomore year. The courses were taughtusing an instructional approach that differed in several ways from the one traditionally used inengineering education. The latter is essentially deductive, proceeding from theory to applications, while
* Journal of Engineering Education, 91(1), 3–17 (2002).

2
the experimental courses were taught more inductively, using applications and experimental results tomotivate presentations of more abstract theoretical and mathematical material. The experimental coursesalso used a mixture of lectures and active learning experiences in class and a combination of individualand team-based (cooperative) assignments, as opposed to the usual approach, which is based almostexclusively on formal lecturing and individual assignments. An immense quantity of data was collectedin the longitudinal study, much of which has been presented and discussed elsewhere.10–14
Early in the first experimental course, the students all completed Self-Scoring Form G of theMyers-Briggs Type Indicator.15 Various measures of the students’ academic performance, attitudestoward their instruction in both the experimental and non-experimental courses, and career goals andambitions were correlated with their MBTI type preferences. Type differences in categorical variableswere subjected to two-sided Fisher exact tests, and differences in numerical variables were subjected toWilcoxon rank-sum tests.
One of the goals of the study was to test the degree to which the performance and attitudes of thestudents were consistent with expectations based on type theory and with the prior studies of type effectsin engineering education. The extent of the agreement would provide an indication of the efficacy of theMBTI as a diagnostic tool for instructors and counselors. Another goal was to determine whether theinstructional approach used in the experimental course sequence improved the performance of studentswith specific type preferences in a manner consistent with the following expectations based on typetheory:
1. The extensive use of active and cooperative learning in the experimental courses should help bothextraverts and feelers, who would not be expected to respond well to traditional instruction thatdiscourages interactions among students.
2. The inductive nature of the experimental course instruction should help sensors, who tend to bedisadvantaged when abstract material is not firmly anchored to real-world experience.
The principal results are summarized in this paper. Section II reviews the basic elements of theTheory of Psychological Type that forms the basis of the MBTI and summarizes results from the priorstudies of type effects in engineering education. Section III contains demographic data and MBTIpreferences of the students in the experimental group, along with data on type differences in their SATscores, freshman year grades, and scores on the Learning and Study Strategies Inventory®. Sections IVand V respectively summarize type differences in the academic performance of the students and in studentattitudes and goals. Section VI synthesizes the results and draws inferences regarding the effectiveness ofthe MBTI as a tool for understanding engineering students and designing effective instruction for them.
A report of all of the observed type differences would be encyclopedic; we will therefore confinethe discussion primarily to differences that were significant at the 0.1 level or less (designated withasterisks in the data tables).
II. PSYCHOLOGICAL TYPE AND ENGINEERING EDUCATION
A. A Brief Review of Type Theory
The Myers-Briggs Type Indicator measures preferences on four scales derived from Jung’sTheory of Psychological Types. People are classified in terms of their preference for
• introversion (I) (interest flowing mainly to the inner world of concepts and ideas) orextraversion (E) (interest flowing mainly to the outer world of actions, objects, and persons);
• sensing (S) (tending to perceive immediate, real, practical facts of experience and life) orintuition (N) (tending to perceive possibilities, relationships, and meanings of experiences);
• thinking (T) (tending to make judgments or decisions objectively and impersonally) orfeeling (F) (tending to make judgments subjectively and personally);

3
• judging (J) (tending to live in a planned and decisive way) orperceiving (P) (tending to live in a spontaneous and flexible way).
An individual’s type is expressed as one of sixteen possible combinations of these preferences. Forexample, an ENTP would have a preference for extraversion, intuition, thinking, and perception. Apreference for one or the other category of a dimension may be mild or strong.
Students with different type preferences tend to respond differently to different modes ofinstruction.4,16 Extraverts like working in settings that provide for activity and group work; introvertsprefer settings that provide opportunities for internal processing. Sensors like concrete learningexperiences and clearly defined expectations and dislike instruction heavy in abstractions like theoriesand mathematical models; intuitors like instruction that emphasizes conceptual understanding and de-emphasizes memorization of facts, rote substitution in formulas, and repetitive calculations. Thinkers likelogically organized presentations of course material and feedback related to their work; feelers likeinstructors who establish a personal rapport with them and feedback that shows appreciation of theirefforts. Judgers like well-structured instruction with clearly defined assignments, goals, and milestones;perceivers like to have choice and flexibility in their assignments and dislike having to observe rigidtimelines.
Professionals in every field must function in all type modalities to be fully effective, and the goalof education should therefore be to provide balanced instruction. Students should be taught sometimes inthe style they prefer, which keeps them from being too uncomfortable for learning to occur, andsometimes in their less preferred mode, which helps them develop the diverse strengths they will need tofunction effectively in their careers. Unfortunately, traditional higher education is not structured toprovide this balance, and severe mismatches commonly occur between the teaching styles of instructorsand the learning styles of their students, with detrimental effects on the academic performance of thestudents and on their attitudes toward their education.1–4,16
B. Type Effects in Engineering Education
In 1980, a consortium consisting of eight universities and the Center for Applications ofPsychological Type was formed to study the role of personality type in engineering education. Introverts,intuitors, and judgers generally outperformed their extraverted, sensing, and perceiving counterparts inthe population studied.5,6 In work done as part of this study, Godleski17 reported on grades in four sectionsof the introductory chemical engineering course at Cleveland State University taught by three differentinstructors. The emphasis in this course is on setting up and solving a wide variety of problems ofincreasing complexity, with memory and rote substitution in formulas playing a relatively small role.Intuitors would be expected to be at an advantage in this course, and the average grade for the intuitors inall sections was indeed higher than that for the sensors. Godleski obtained similar results for othercourses that emphasize more intuitive skills, while in the few “solid sensing” courses in the curriculum(such as engineering economics) the sensors scored higher.
Besides being less comfortable than intuitors with abstract material are, the sensors in Godleski’sstudies may have fared more poorly than the intuitors because problem-solving speed is an importantdeterminant of test grades in many engineering courses. Myers18 claims that time-bound tests putintuitors at an advantage due to the tendency of sensing types to reread test questions several times beforeattempting to answer. Wankat and Oreovicz19 observe that if memorization and recall are important,sensing types should perform better, while if analysis is required, intuitive students should have anadvantage.
In a longitudinal study carried out at the University of Western Ontario by Rosati,7–9 malestudents with preferences for introversion, intuition, thinking, and judging were found to be more likely tosucceed in the first year of the engineering curriculum than were their extraverted, sensing, feeling andperceiving counterparts. Rosati also observed that introverts, thinkers, and judgers were more likely thanextraverts, feelers, and perceivers to graduate in engineering after four years, but sensors were more likely

4
than intuitors to do so. These findings only applied to male students at the low end of the academicspectrum: students who came into engineering with strong predictors of success were equally likely tosucceed, regardless of their type, and Rosati found no statistically significant filtering by type among thefemale students.
III. PROFILE OF THE EXPERIMENTAL COHORT
The experimental group consisted of 116 students who took the MBTI near the beginning of theFall 1990 semester. The students were 70% male and 30% female; 84% percent were white, 6% African-American, 5% Asians or Asian-American, 3% Native American, and 2% Hispanic.
MBTI type distributions are shown in Table 1. The population distributions are similar to thosefound for 3786 male and 698 female undergraduate engineering students in an eight-universityconsortium.6 There were roughly equal numbers of extraverts and introverts, sensors outnumberedintuitors and judgers outnumbered perceivers by ratios of roughly 3:2, and thinkers substantiallyoutnumbered feelers among both males and females with the overall ratio being roughly 7:3. ST was byfar the predominant function, accounting for over 40% of both the male and female populations.
A. SAT Scores and Freshman Year Grades
SAT scores were available for 100 students in the study. The only statistically significant typedifference in average SAT scores was between sensors and intuitors on the SAT-Math test (645 forintuitors, 615 for sensors, p=.07). The intuitors also outscored the sensors on the SAT-Verbal test by 533to 511 and perceivers outscored judgers on the SAT-Math test by 642 to 619, but these differences werenot statistically significant. Extraverts and introverts scored almost identically on both the mathematicsand verbal tests.
Several significant type differences in freshman year academic performance were observed. Inoverall first-year GPA, intuitors outperformed sensors (3.38 to 3.17, p=.09), thinkers outperformed feelers(3.34 to 3.09, p=.05), and judgers outperformed perceivers (3.37 to 3.10, p=.02). The same typedifferences were observed in calculus, physics, and chemistry grades. Introverts outperformed extravertsin overall GPA, but the difference was not statistically significant (3.32 to 3.20, p=0.17). The fact that thejudgers outscored the perceivers despite the latter group’s generally higher SAT scores suggests that taskorientation and persistence may count for more than scholastic aptitude in overcoming the challenges ofthe difficult first year of engineering.
B. Learning and Study Strategies
Table 2 summarizes student responses to the Learning and Study Strategies Inventory20 (LASSI)and briefly defines the nine scales of the inventory. A high score is desirable on each scale of theinventory: for example, if Student A scores higher than Student B on the ATT scale, it indicates thatStudent A has a more positive attitude toward school and education.
Extraverts scored higher than introverts on every scale of the LASSI, with the differences beingstatistically significant (p<.1) for general attitudes, anxiety level (a high score indicates low anxiety),concentration, information processing, use of study aids, and self-testing. Judgers scored significantlyhigher than perceivers in motivation to study, time management (p<.001), concentration, selecting mainideas, use of study aids, and self-testing. The extravert-introvert differences are surprising, since nothingin type theory suggests that extraverts should be better than introverts at such things as time on task andself-testing; in fact, one might expect the opposite. A study to determine whether this result generalizesor (as is likely) is just an artifact of this particular population would be worthwhile.
IV. TYPE DIFFERENCES IN ACADEMIC PERFORMANCE
As previously noted, Rosati7–9 observed type differences for students at the lower end of theacademic spectrum and no discrimination by type for the better students. Prompted by these findings, weused as a measure of academic aptitude the Admissions Index (AI)—a quantity computed on the basis of

5
an entering student’s SAT scores, high school grade-point average, and standing in his or her high schoolgraduating class—and computed certain results separately for students with AI>3.0 and AI<3.0. We willuse the terms “stronger students” and “weaker students” to designate these two groups, acknowledgingthat some individuals within the latter group were quite strong academically and conversely for theformer group.
Table 3 shows cumulative grade point averages by type preference in the freshman year (S90), atthe end of the first semester of the sophomore year (F90), and at the end of each of the second, third, andfourth years of college. The first-year figures do not include transfer students, who completed part or allof their initial year at some other institution and entered N.C. State in their second year.
In the experimental chemical engineering courses, we examined type differences in several courseperformance measures: (i) average grade (A=4.0); (ii) percentage passing (defined as getting the grade ofC or better required to take the next course in the sequence), and (iii) percentage receiving A’s. Selectedresults for each of the five courses of the experimental sequence are shown in Tables 4–6. (We shouldnote that given the large number of statistical comparisons in Table 4, some differences would beexpected to be statistically significant just by chance. Some of the differences shown in Table 4 to besignificant could thus represent Type I errors.)
Many of the noteworthy course grade differences observed were in the first course in theexperimental sequence, CHE 205 (Chemical Process Principles), which has the somewhat deservedreputation of being the filter for the chemical engineering curriculum. The course material and problem-solving methods introduced in this course are totally new to most students, many of the assignedproblems are very long (especially when the students do not adopt a systematic approach to solvingthem), and the tests emphasize understanding rather than memorization. The passing percentages inexperimental courses past the first one were close to 100% in all type categories and so are not reported inthe tables.
Besides taking the five experimental courses taught by Dr. Felder, the students in theexperimental group took as many as seven other chemical engineering courses taught by other professors.In three of the latter courses—two laboratory courses and the capstone design course—the grades werebased entirely on team projects that did not include individual assessment and so provide no basis fordetermining type effects on individual performance. The other four courses were taught in a traditionalmanner, with little or no active or cooperative learning. Two of them—CHE 315 (Thermodynamics I)and CHE 316 (Thermodynamics II)—were taken in the third year of the curriculum, and the other two—CHE 425 (Chemical Process Control) and CHE 450 (Chemical Process Design I)—were taken in thefourth year. Table 7 shows performance data for these courses.
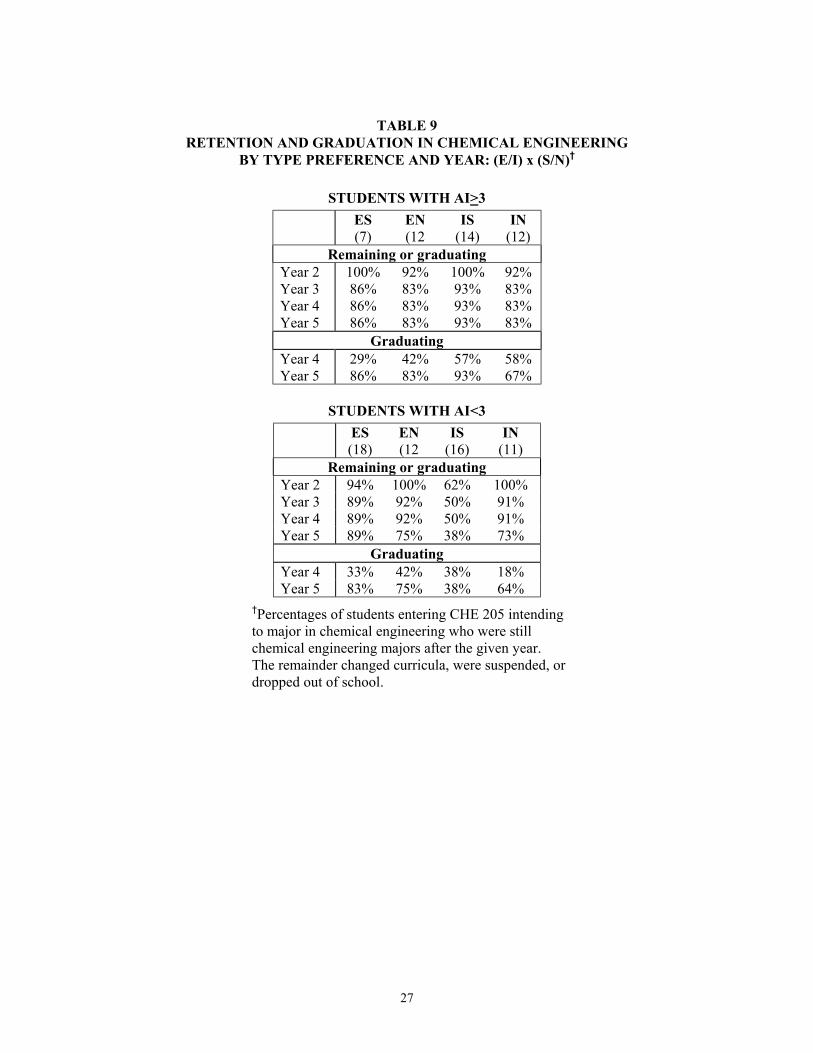
Some of the students who enrolled in CHE 205 never intended to major in chemical engineering,but were in curricula such as pulp and paper technology that required them to take the course. Tables 8and 9 summarize retention and graduation data for the 105 students who took CHE 205 intending tomajor in chemical engineering.
The sections that follow summarize and discuss the type differences shown in Tables 3–9.
A. Extraverts and Introverts
Among the stronger students, the introverts had a higher average admissions index and a higherfreshman year grade-point average than the extraverts (Table 3), with neither difference being statisticallysignificant. The introverts maintained their advantage throughout college in overall GPA (Table 3),performance in chemical engineering courses (Tables 4 and 7), and (very slightly) retention in thechemical engineering curriculum (Table 8), but with the exception of grades in a single course (CHE315), the differences were not statistically significant. This result (introverts generally doing better thanextraverts but the difference not being significant among stronger students) is consistent with Rosati’sfindings.7–9

6
A completely different picture emerged for the weaker students. The extraverts had a slightlyhigher average admissions index and the average freshman year GPAs were essentially equal for both(Table 3). The two groups performed at significantly different levels in the introductory chemicalengineering course, however, with the extraverts earning almost a full letter grade higher average coursegrade (2.22 vs. 1.41) and passing the course with a grade of C or better at a much higher rate (73% vs.44%) (Table 4). The introverted sensors among the weaker students were particularly at risk. By the endof the fifth year 62% of them had dropped out of chemical engineering, as contrasted with 25% of theextraverted intuitors, 27% of the introverted intuitors, and only 11% of the extraverted sensors (Table 9).This result will be discussed further in the next section.
No prior study has shown extraverts doing better than introverts in an engineering curriculum orindividual course. Two factors might have contributed to the extraverts’ superior performance among theweaker students:
1. The extraverts may have had better motivation and study habits than the introverts. The scores on thelearning and study strategies inventory (Table 2) support this hypothesis. Extraverts scoredsignificantly higher on six of the ten LASSI scales, including attitude and interest in school,concentration and attention to academic tasks, information processing ability, use of study aids, andself-testing.
2. The emphasis on active and cooperative learning in the experimental courses may have negated theusual advantage enjoyed by introverts in the traditional approach to engineering education, whichemphasizes individual work.
The speculation that cooperative learning gave the extraverts an advantage over the introverts isconsistent with type theory. The traditional mode of engineering instruction, which stresses individualeffort and competition for grades, is more compatible with the natural studying tendencies of introvertsthan of extraverts. Introverts taught traditionally might therefore be expected to outperform extraverts, asthey did in the studies of McCaulley et al.6 and Rosati.7–9 In the experimental courses, the mandatedgroup work in most assignments would be comfortable for the extraverts, while the characteristic shynessof many introverts might have caused some of them to be relatively passive in their groups, deprivingthem of the full benefits of cooperative learning.
B. Sensors and Intuitors
Reviewing studies of type effects in education, McCaulley21 reports the sensing-intuitiondifference to be “by far the most important of the preferences.” Godleski17 found that intuitors amongengineering students consistently outperformed sensors except in “real-world” courses like process designand cost estimation, in which the sensors did better. Rosati found that intuitors outperformed sensorsearly in the curriculum,7 but noted that the difference was significant only among academically weakermale students, and he found that sensors were slightly more likely than intuitors to graduate in fouryears.9
The results of our study are generally consistent with these observations, except that a fewnoteworthy differences in course performance were also observed among the stronger students. Thestronger sensors earned a higher grade point average than their intuitive counterparts in their freshmanyear and maintained their advantage thereafter, but the differences were not statistically significant andmight simply reflect the higher admissions index of the sensing group (Table 3). Both types performedcomparably in the introductory course; the intuitors earned higher grades in CHE 311 (Table 4, notsignificant) and CHE 316 (Table 7, significant), arguably the most abstract and mathematical chemicalengineering courses in the curriculum, and the sensors earned higher grades in CHE 225, the least abstractof all the courses (Table 4, significant).
The results for the weaker students were much different. Although the sensors and intuitors hadalmost identical admissions indices, the intuitors maintained significantly higher GPAs than the sensorsthroughout college (Table 3) and did better in every chemical engineering course, with the differences

7
being significant in CHE 205 and CHE 311 (Table 4). As noted previously, introverted sensors generallyearned much lower grades and were much less likely to graduate in chemical engineering than introvertedintuitors, extraverted sensors, and extraverted intuitors. Intuitive judgers earned much higher grades thanintuitive perceivers and both judging and perceiving sensors (Table 6). Sensor/intuitor differences inretention were not statistically significant for either the stronger or the weaker students (Table 8). Amongthe stronger students the retention was higher for the sensors, a result consistent with a finding of Rosati9
and with the sensors’ higher average admissions index and first-year GPA (Table 3).
Prior studies of type effects in engineering education (e.g., Godleski17) suggest that traditionalinstruction in most courses emphasizes the theoretical over the practical and so gives intuitors anadvantage over sensors. The experimental courses were designed to provide greater balance bystrengthening coverage of practical aspects of the course content. The effort may not have been enoughto help the weaker sensors earn grades as high as the intuitors earned, but it may have helped to reducetheir traditionally higher dropout rate. The fact that in their last year 82% of the sensors found theexperimental courses “much more instructive” than their other chemical engineering courses (as opposedto 62% of the intuitors who felt that way) supports this speculation.
The extensive use of cooperative learning in the experimental courses may help to explain therelatively high dropout rate of the introverted sensors early in the curriculum relative to that of theextraverted sensors (Table 9). The generally superior performance of students taught cooperativelyrelative to that of students taught traditionally has been documented in numerous studies,22,23 but toachieve the full benefits of the cooperative learning students must take an active role within their studyteams. Extraverts on cooperative learning teams would characteristically tend to interact with teammates,while many introverts might hang back until they become accustomed to the team interactions, and somemight always remain passive. One might speculate that working in teams helped the extraverted sensorsamong the weak students enough to prevent the high attrition that previous studies have found amongsensors. On the other hand, the more passive introverted sensors did not receive the same benefit and sodid significantly worse than their intuitive counterparts, a result consistent with the prior studies.
C. Thinkers and Feelers
Although thinkers and feelers began college with similar academic credentials, the thinkers in both thestrong and weak categories earned significantly higher grade-point averages in the freshman year andmaintained or increased their advantage thereafter (Table 3). This finding is consistent with those of priorstudies.6–9,17
In chemical engineering course grades and retention in the curriculum, on the other hand, apattern was observed unlike anything observed in the prior studies—namely, the thinker-feelerdifferences were more pronounced among the stronger students. The grade differences between thestronger thinkers and the stronger feelers were particularly dramatic in CHE 205, CHE 315, and CHE 446(Tables 4 and 7); moreover, only 4% of the thinkers left chemical engineering during the five years of thestudy while 11% of the feelers did so after the second year and another 17% did so after the third year(Table 8).
Among the weaker students, no consistent T-F differences were observed: the feelers didmarginally better in some courses (including CHE 205), the thinkers did better in others, and there was noreal difference in the remaining ones (Tables 4 and 7). Surprisingly, there was not much difference inretention between the two groups: by the end of the third year of college more thinkers than feelers hadleft chemical engineering and after five years more feelers than thinkers had left, but the differences werenot significant (Table 8). Most of the feelers among the weaker students who left did so after four years.
It appears from these results that thinkers who dropped out of chemical engineering did soprimarily because of poor grades (an indication being that almost none of the stronger thinkers droppedout), while at least in the first few years feelers left for a variety of reasons, poor grades being just one ofthem. These results are consistent with type theory, which suggests that the relatively impersonal nature

8
of the engineering curriculum would be comfortable for thinkers and problematic for feelers, some ofwhom might be inclined to switch to other curricula even if they were doing well academically.
We have noted elsewhere12 that women in the longitudinal study earned lower grades andsuffered greater losses of confidence and higher attrition rates than men. Table 5 shows that the gendereffect may be strongly mediated by type: the male thinkers only slightly outperformed the female thinkersin the experimental engineering courses but the male feelers considerably outperformed the femalefeelers. In all five experimental courses, only one A was earned by a female feeler! The implication isthat women with a preference for feeling on the MBTI may be particularly vulnerable in engineeringschool, perhaps suggesting the need for a better balance in the curriculum between technical and socialaspects of engineering.
D. Judgers and Perceivers
The large credit-hour requirements and heavy homework loads that characterize the engineeringcurriculum make staying on task and managing time effectively prerequisites to success. Type theorysuggests that judgers—who are characteristically better at both—should on average outperform perceiversin the undergraduate curriculum. This expectation was borne out by many of the results of this study.(The strengths of perceivers, such as flexibility and tendency to avoid premature closure in problemsolving, may provide them with compensatory advantages in research, a hypothesis well worth testing.)
On the LASSI (Table 2), the judgers scored significantly higher than the perceivers in diligenceand self-discipline (MOT), time management (TMT), attention to academic tasks (CON), and severalmeasures related to study skills, and came out about the same as the perceivers on the other scales.Among the stronger students, the judgers began with a higher admissions index, earned a higher averagefirst-year GPA, and steadily increased their advantage as they proceeded through the curriculum, alwaysat a statistically significant level (Table 3). The judgers did better than the perceivers in the chemicalengineering courses as well, but the differences—although consistent and considerable—were onlystatistically significant in CHE 311 among the experimental courses (Table 4) and CHE 315 among thenon-experimental courses (Table 7). The greatest differences were in the percentages of A’s earned bythe stronger judgers and perceivers: the difference was as high as 34% in the experimental courses (52%of the judgers and 18% of the perceivers in CHE 311) and 40% in the non-experimental courses (40% ofthe judgers and none of the perceivers in CHE 450). The retention and graduation rates were also higherfor the stronger judgers, but the differences were not significant (Table 8).
The weaker judgers had the same first-year advantage over their perceiving counterparts, but inYears 2–4 there were almost no J-P differences in GPA or performance in CHE 205 among the weakerstudents. The weaker judgers did substantially better than the weaker perceivers in most of the rest of theremaining chemical engineering courses, however, with average grades almost a half-letter grade higherand much higher percentages of A’s. There were no differences worth noting in retention and graduationof the two groups. An implication of the results for both the stronger and weaker students is that theperceivers were as capable of completing the curriculum as the judgers, but the superior task commitmentand time management skills of the judgers better equipped them to do what it took to earn high coursegrades.
Type Interactions
The interactions between the judging–perceiving preference and the sensing–intuitive dimensionare striking. Of the 116 students for whom grades were recorded in CHE 205, 76% of the intuitivejudgers (NJ), 43% of the intuitive perceivers (NP), 43% of the sensing judgers (SJ), and 31% of thesensing perceivers (SP) completed all five courses in the experimental sequence (Table 6). The results forCHE 205 in particular provide a particularly dramatic illustration of type effects on academicperformance: roughly speaking, the average grade was B for the NJs, B–/C+ for the NPs, C for the SJs,and C–/D+ for the SPs. Ninety percent of the NJs passed the course with a C or better, as opposed to56% of the SPs. The percentage receiving A’s varied from 43% for the NJs to 6% for the SPs. In

9
subsequent courses the NJs consistently performed at the highest level relative to the other type categoriesand the SPs occupied the lowest position in all courses but CHE 312, in which they outscored the NPs.The differences were generally most pronounced among the weaker students.
The large difference between the five-year attrition rates of extraverts (17%) and introverts (48%)with AI<3 may be the most surprising result obtained in this study, considering the consistently superiorperformance of introverts in prior studies of type differences in engineering.7,9 A possible explanation issuggested by the observation that the attrition rate of the introverted sensors was 62% and that of theintroverted intuitors was only 27% (Table 9). Most of the introverts who left were thus sensors, the typepreference historically found to be at greatest risk in engineering.6,17 On the other hand, contrary toexpectations, the extraverted sensors with AI<3 dropped out to an even lower extent (11%) than eitherextraverted intuitors (25%) or introverted intuitors (27%). We can think of no plausible explanation ofthis result.
V. TYPE DIFFERENCES IN ATTITUDES AND PLANS
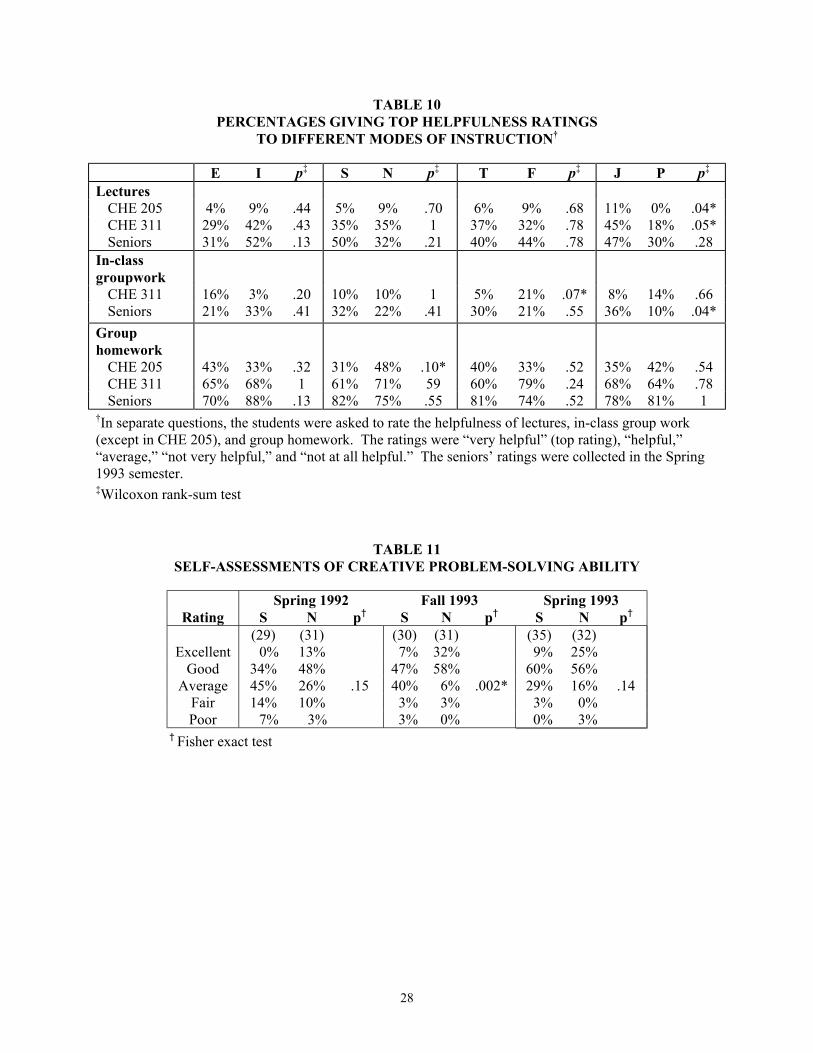
Classes in the experimental courses consisted of lectures with interspersed small group in-classexercises and weekly or (in CHE 205) triweekly group homework assignments. At several stages of thecurriculum the students were asked to rate the helpfulness of each of these modes of instruction. Moststudents responded positively to all three modes, and type differences are seen only in the percentagesgiving each mode the highest possible rating (“extremely valuable” in CHE 205 and CHE 311, and “Veryhelpful” in the senior questionnaire). The modes were rated independently, not competitively, so studentscould give the top rating to any or all of them. The students who remained in the experimental coursesequence generally viewed both lectures and group work increasingly positively as they progressedthrough the curriculum (Table 10). Group homework was regarded as most helpful, followed by lecturesand in-class group work.
As juniors and seniors, the students were asked to rate their problem-solving abilities. Therewere no noteworthy type differences in ratings of ability to solve routine engineering problems, butsignificant differences emerged when sensors and intuitors rated their abilities to solve problems requiringcreativity, with higher percentages of intuitors consistently giving themselves high ratings (Table 11).
In both their sophomore and senior years, the students were asked about their preferred careerenvironments, with the choices being large corporation, small firm, university or research facility, andpublic service. Table 12 shows the responses of sensors and intuitors, the only type dimension thatyielded noteworthy differences. As juniors and seniors, the students were asked about their post-graduation plans (graduate school immediately or later, enter a profession, or take a year off) andresponded as shown in Table 13, and the seniors were asked to rate the importance of severalcharacteristics of their first job, with the results shown in Table 14.
The students were also asked in their junior and senior years to choose the most probableexplanations of their doing (a) better and (b) worse than expected in the course they were then taking.Possible attributions of success were either internal (real ability or hard work) or external (help fromsomeone else, group work, or luck), and possible attributions of failure were also internal (lack ability,don’t work hard enough) or external (course too demanding, personal problems, tests/grading unfair).Although type differences in attributions might have been anticipated,24 none were observed.
A. Extraverts and Introverts
The differences in the attitudes of extraverts and introverts toward the different modes ofinstruction used in the experimental courses (Table 10) are revealing. Throughout the study, higherpercentages of introverts found lectures extremely helpful to their learning, a result consistent with typetheory. On the other hand, the two groups underwent a shift in time regarding their attitudes to groupwork. As juniors, a moderate percentage of extraverts (16%) and almost no introverts (3%) found in-classgroup work very helpful; as seniors, the percentage of extraverts rose slightly to 21% and that ofintroverts increased by an order of magnitude to 33%. Similarly, as sophomores the percentage of

10
extraverts who found group homework very helpful (43%) was greater than the percentage of introverts(33%); the two groups were roughly the same as juniors (65% of the extraverts and 68% of theintroverts); and as seniors, more of the introverts found group homework very helpful (88% of theintroverts and 70% of the extraverts).
These results have several possible interpretations.
1. Disproportionate numbers of introverts hostile to group work were among those who dropped outof the experimental course sequence between the sophomore and senior years.
2. Early in the study the introverts were characteristically less comfortable than the extraverts withgroup work, but over time familiarity with their classmates and with the process overcame theirobjections. Eventually many of them came to appreciate that group work—which they (unlikethe extraverts) would have been inclined to avoid if given the choice—helped their mastery ofdifficult engineering course material.
3. The introverts recognized that they were building an important skill that they tended to be weakin.
The data do not allow us to assess the validity of each of these interpretations, as much as we would liketo believe the second and third ones.
As Table 14 shows, having job security was very important to more introverts (62%) thanextraverts (43%) and having the chance to do socially important or beneficial work was either veryimportant or fairly important to more extraverts (97%) than introverts (72%). Having opportunities forteamwork was of roughly equal importance to both types, although the extraverts might have beenexpected to find this feature more attractive. This result may reflect the introverts’ increasingly positiveresponse to group work as they progressed through the sequence of experimental courses.
B. Sensors and Intuitors
While both sensors and intuitors appreciated the benefits of cooperative learning, there weresignificant differences in their perceptions of the principal benefits of this instructional approach. In CHE311, 52% of the 31 sensors and only 16% of the 31 intuitors felt that the greatest benefit was helpingthem complete the homework, while 74% of the intuitors and 48% of the sensors felt that the greatestbenefit was helping them understand the class material. (The remaining 10% of the intuitors thought thegreatest benefit was helping them prepare for the tests.) The different response patterns of the two groupsare consistent with type theory.
One noteworthy sensor-intuitor difference emerged when seniors were asked how instructive theexperimental courses were compared to other chemical engineering courses they had taken. Theresponses of the 35 sensors and 32 intuitors were as follows.
Much more instructive: S – 83%, N – 62%
Somewhat more instructive: S – 17%, N – 22%
About equally instructive: S – 0%, N – 16%
No students thought the experimental courses were less instructive. The difference between the sensingand intuitive responses is significant at the .03 level (Fisher exact test). These results may reflect thetraditionally heavy emphasis on theory and mathematical modeling in the chemical engineering coursestaken outside of the experimental sequence. Sensors tend to be uncomfortable with abstraction, and thedeliberate attempt to balance the concrete and the abstract in the experimental courses might have madethose courses relatively appealing to them. Some of the intuitors—who are more comfortable withabstraction—might have been expected to find the non-experimental courses comparable in instructionalvalue to the experimental courses, as proved to be the case.
11
Self-ratings of creative problem-solving ability were consistently higher for intuitors than forsensors (Table 11), another result consistent with type theory. The ratings for both types rose from thesecond semester of the junior year (Spring 1992), when 61% of the intuitors and only 34% of the sensorsrated themselves as “excellent” or “good,” to the second semester of the senior year (Spring 1993), when81% of the intuitors and 69% of the sensors put their creative problem-solving abilities in one or the othercategory. Practice and feedback in such problems was a regular feature of the experimental courses,which might account for the rise in self-ratings observed for both groups.
As both sophomores and seniors, a majority of the sensors indicated a desire to work for a largecorporation while substantially higher percentages of the intuitors in both years wanted to work for asmall firm, a university or research facility, or in public service (Table 12). Intuitors were more inclinedthan sensors to go to graduate school immediately or eventually (71% vs. 59% as juniors, 54% vs. 39%as seniors).
Meeting or exceeding employers’ expectations in their careers was very important to moresensors (81%) than intuitors (52%), and having a high salary was very important to twice as many sensors(32%) as intuitors (16%) (Table 14). Perhaps the most pronounced and predictable difference in Table 14had to do with the opportunity to do creative/innovative work, which was very important to more thanthree times as many intuitors (65%) as sensors (19%). Having good relations with coworkers wasconsidered very important by all but one sensor (97%) and by three-quarters of the intuitors (74%). Theabsences of certain differences are also noteworthy. Having well defined tasks that don’t changefrequently might have been expected to appeal more to sensors than intuitors and having variety in jobtasks might have been expected to be more appealing to intuitors, but neither expectation was realized.
C. Thinkers and Feelers
The only significant attitude difference observed between thinkers and feelers was that as seniors,thinkers were more inclined than feelers to go to graduate school (53% vs. 27%) (Table 13). Apredictable but not statistically significant difference was that feelers attached greater importance thanthinkers to doing socially important/beneficial work (Table 14).
Surprisingly, no noteworthy T-F differences were found in the rated helpfulness of group work(Table 10) or the rated importance in the senior year of meeting or exceeding employers’ expectations,having opportunities for teamwork, and having good relations with coworkers. We might speculate thatsome feelers to whom these considerations were very important dropped out of the curriculum before thesurveys were administered, which could account in part for the absence of the expected differencesamong the seniors.
D. Judgers and Perceivers
More judgers than perceivers found lectures extremely helpful to their learning (Table 10), withthe differences early in the curriculum being statistically significant. This result is consistent with typetheory, considering the high level of structure associated with lectures. An interesting type difference wasthat 28% of the judgers and only 5% of the perceivers in the senior year believed they did more than theirfair share in group work, while 13% of the judgers and 29% of the perceivers believed they did less thantheir fair share. Whether these different beliefs were justified is an intriguing but unanswerable question.
A characteristic type difference was in the number of students planning to take a year off aftergraduation before either going to graduate school or getting a job (Table 13). As might be expected,judgers did not find this option attractive: only one of them selected it in the junior year and none did inthe senior year. On the other hand, 10% of the perceiving juniors favored it and the figure went up to14% in the senior year, more than double the value for any other type preference.
The principal judger-perceiver differences in criteria for job satisfaction (Table 14) were meetingor exceeding employers’ expectations (judgers–76%, perceivers–48%) and having job security (judgers–61%, perceivers–38%).
12
VI. INFERENCES AND CONCLUSIONS
Engineers may work in experimental or theoretical research, design, development, planning,production, marketing, sales and service, economics, and management. Individuals with differentlearning styles may be more naturally skilled or comfortable in certain of these functions than in others,but individuals of all styles can flourish in any of them.
Moreover, to function successfully as an engineer in any capacity, individuals must develop skillscharacteristic of all learning style categories. For example, they must approach some tasks carefully,systematically, and observantly, attending to small details and replicating measurements or calculationsenough to have confidence in the results. This is the characteristic approach of the sensor: intuitors canlearn to do it, but it does not come naturally to them. Engineers must also go beyond the immediacy ofthe data, attempting to understand it in light of current knowledge about the subject and exploring itspossible implications. Intuitors are characteristically far more inclined to do that sort of thing thansensors are, although sensors can learn to do it. Similarly, engineers should make decisions taking intoaccount both logic and regulations (as thinkers tend to do) and subjective human considerations (asfeelers tend to do), and so on.
The point of using learning styles in teaching is therefore not to determine each student’spreferred instructional approach (visual or verbal, concrete or abstract, etc.) and teach exclusively in thatmanner. It is rather to “teach around the cycle,” making sure that every style is addressed to some extentin the instruction. If this is done, then all students will be taught in a manner that (1) addresses theirpreferences part of the time, keeping them from becoming so uncomfortable that they cannot learn, and(2) requires them to function in their less preferred modes part of the time, helping them to develop skillsin those modes.3 Which of the dozens of existing learning style models is used as a basis for theinstructional design is almost irrelevant. As long as each category of the chosen model is addressed partof the time, the teaching is certain to be more effective than it is when some categories are routinelyignored.
The questions that we wished to examine in this study are first, is the Myers-Briggs TypeIndicator an effective tool for assessing engineering students’ learning style preferences, and second, doesan active, cooperative, and inductive instructional model successfully correct the biases of the traditionalinstructional model against students with specific preferences? We will discuss each question in turn.
A. Efficacy of the Myers-Briggs Type Indicator for Characterizing Engineering Students
While the results of this study cannot be said to formally validate the Myers-Briggs TypeIndicator as a personality type or learning style assessment tool for engineering students, many of themare consistent with expectations based on type theory.4 To name a few,
• Intuitors performed significantly better than sensors in courses with a high level of abstractcontent and the contrary was observed in courses of a more practical nature.
• Thinkers consistently outperformed feelers in the relatively impersonal environment of theengineering curriculum, and feelers were more likely to drop out of the curriculum even if theywere doing well academically.
• Faced with the heavy time demands of the curriculum and the corresponding need to managetheir time carefully, judgers consistently outperformed perceivers.
• Extraverts reacted more positively than introverts when first confronted with the requirement thatthey work in groups on homework.
• The majority of sensors intended to work as engineers in large corporations while a much higherpercentage of intuitors planned to work for small companies or to go to graduate school and workin research.

13
• Intuitors were three times more likely than sensors to give themselves top ratings for creativeproblem-solving ability and to place a high value on doing creative or innovative work in theircareers.
• Feelers placed a higher value on doing socially important or beneficial work in their careers thanthinkers did.
• As seniors, 14% of the perceivers and none of the judgers planned to take a year off followinggraduation before committing themselves to a career direction.
There were very few results that contradicted expectations from type theory, and most of those were inthe nature of differences that might have been expected to show up in the data but did not. Ourconclusion is that the MBTI effectively characterizes differences in the ways engineering studentsapproach learning tasks, respond to different forms of instruction and classroom environments, andformulate career goals.
This is not to say that the MBTI provides a picture of students complete enough to predict theirsuccess or failure in a given course or curriculum. No learning style model or assessment tool can makethat claim. How students perform in a course is determined by an uncountable number of factors,including motivation for taking the course, understanding of the course prerequisites, attitude toward thesubject, native intelligence, current physical and emotional condition, self-confidence, concurrentacademic and nonacademic demands on their time, personal rapport with the instructor and withclassmates, and compatibility between their learning style and the instructor’s teaching style. The fourletters of a student’s MBTI profile may offer useful clues about the last of these factors but nothing morethan that, and even the clues are open to question. The fact that a student has a strong preference forsensing over intuition, for example, provides little indication of his or her ability to function in anintuitive mode—or in a sensing mode, for that matter. Furthermore, important aspects of learning styleare not directly addressed by the MBTI, including preference for visual or verbal presentation ofinformation or inclination to approach learning tasks in a sequential (or linear or left-brained) or global(or holistic or random or right-brained) manner, preferences that are addressed by other assessment tools.3
In short, we believe that the MBTI can provide useful insights into students’ learning strengthsand weaknesses, but we strongly caution against using it to discourage a student from pursuingengineering or any other curriculum or career. Such a use is unwarranted and unethical.
B. Efficacy of the Experimental Instructional Approach
Prior studies of type effects in engineering education have shown that introverts typicallyoutperform extraverts, intuitors outperform sensors, thinkers outperform feelers, and judgers outperformperceivers.6,7–9,17 Our hypotheses were that using active group exercises in class and cooperative learninggroups for homework would help overcome the extraverts’ and feelers’ historical disadvantage, and usingan inductive teaching approach (progressing from the concrete to the abstract and anchoring theoreticalcourse material with real-world examples whenever possible) would do the same for the sensors.
If the study data support these hypotheses (as in fact they do), an obvious question is whether it isbecause the experimental instruction helped the historically disadvantaged types or hurt the advantagedtypes. The extensive research base supporting active, cooperative, and inductive teaching methods19,22,23
and the fact that the graduation rate in engineering of the experimental cohort was significantly greaterthan that for a traditionally-taught comparison group14 suggest the validity of the former interpretation.
Comparisons of the academic performance of the extraverts and introverts suggest that theexperimental instruction did indeed eliminate the historical advantage enjoyed by introverts inengineering education. Among the students at greatest risk (with admissions indices less than 3.0), theextraverts and introverts had almost identical grade-point averages in their first year of college, but morethan half of the introverts and only about one-quarter of the extraverts earned D’s or F’s in the firstchemical engineering course. The extraverts who remained in the experimental sequence either

14
outperformed the remaining introverts or performed at a comparable level in subsequent chemicalengineering courses. After five years of college, 80% of the extraverts who began the experimentalcourse sequence had graduated in chemical engineering while roughly half of the introverts in the cohorthad dropped out of the curriculum.
The introductory chemical engineering course generally functions as a curricular filter: if studentspass it with a grade of C or better, the chances are good that they will complete the rest of the curriculum.We have speculated that in their initial exposure to group work in the first course, the academicallyweaker introverts were likely to be less active in their groups, receiving fewer of the learning benefitsknown to be provided by cooperative learning21 and earning lower grades than the extraverts. Later in thecurriculum, the introverts who survived the first course were more comfortable with group work andappreciative of its benefits (as their survey responses indicated), and so neither group had an advantageover the other.
We cannot attribute the superior performance of the extraverts in the introductory course entirelyto the use of cooperative learning in that course: scores on the Learning and Study Strategies Inventoryindicate that coming into the course the extraverts on average had greater study skills and better attitudestoward school. Recall, however, that introverts have outperformed extraverts in all prior studies of typeeffects in engineering education and that the systematic use of group work is the only feature of theinstructional approach in this study that could be expected to favor extraverts over introverts. Theseobservations lend strong support to the hypothesis that cooperative learning was a major contributingfactor to the extraverts’ superior performance, if not the primary factor.
The degree to which the experimental approach leveled the playing field for sensors and intuitorsis less clear. The academically weaker intuitors as a group did significantly better than their sensingcounterparts in the first year of college and continued to earn higher grades in most chemical engineeringcourses. There was essentially no noteworthy difference in attrition, however; and the four-yeargraduation rate of the weaker sensors was actually higher than that for the intuitors. Moreover, 100% ofthe sensors rated the experimental courses as more instructive than other chemical engineering coursesthey had taken while 84% of the intuitors did so, a statistically significant difference. In summary, whilewe may not have proved that the experimental instructional approach successfully overcame the biastoward intuitors that characterizes the traditional approach in engineering, we feel justified in claimingthat it represents a step in the right direction.
A different set of issues arises from a comparison of the grade distributions and retention rates ofthinkers and feelers. First, the difference in chemical engineering course grades appears to be stronglygender-related: male feelers did as well as or better than male and female thinkers, but female feelersconsistently earned lower grades than students in the other three categories. Second, the attrition ofthinkers tended to be closely related to academic performance and limited almost entirely to the weakerstudents, while both strong and weak feelers dropped out, and the strong ones tended to do so early in thecurriculum. The implication is that feelers who drop out are as likely to do because they don’t like thecourses as for reasons of academic difficulty.
A likely cause of a negative attitude toward engineering in feelers—especially female feelers—isthe relatively impersonal nature of the engineering curriculum.21 In practice, engineering is rich insocially important applications, and communication and interpersonal skills are often more important forcareer success than technical knowledge, especially after the first job. These ideas are not wellcommunicated in the traditional engineering curriculum, however, which could account for a large part ofthe chronic difficulty in recruiting and retaining women in engineering. Incorporating a broader range ofmaterial related to environmental engineering, biotechnology, and engineering ethics into the lectures andhomework problems would probably have made the course a better learning experience for all of thestudents and might have made the subject more appealing to the feelers.
We had hoped that the use of cooperative learning in the experimental courses would make theclasses more supportive to feelers in general and women in particular, and indeed it may have; however,
15
cooperative learning can be a two-edged sword for women in engineering, some of whom are discountedor ignored within their groups.12 One way of improving the situation for women might be to avoid teamsconsisting of one woman and two or three men25; another would be to orient the students at the beginningof the course to the problems faced by women and minorities in engineering.
The advantage of the judgers over the perceivers observed in previous studies was also observedin this one, but only through grade differences that were at most marginally significant. Among thestronger students a higher percentage of perceivers than of judgers left chemical engineering but thedifference was not significant, and there was virtually no difference between the attrition rates of judgersand perceivers among the weaker students. Modifications in instruction to accommodate the needs ofperceivers would include giving more open-ended problems that require flexible thinking—includingdesign problems—and possibly training sessions in effective time management techniques.21
A final step that might be taken by instructors would be to become familiar through workshops orself-study with the strengths and weaknesses of students of all MBTI types and the teaching methods towhich students of each type respond best. It is not necessary to know the profiles of the individualstudents in a class to make use of this information; it suffices to know that students of all types areprobably represented. If instructors try to address each type category at least part of the time, the chancesare good that the quality of their teaching will improve.
ACKNOWLEDGMENTS
This work was supported by National Science Foundation Undergraduate Curriculum DevelopmentProgram Grants USE-9150407-01 and DUE-9354379 and by the SUCCEED Coalition (NSF CooperativeAgreement EEC-9727411). We acknowledge with gratitude the contributions of Lynne Baker-Ward tothe student survey design and the statistical analyses performed by Meredith Mauney, Diane Hall, andCralen Davis.
16
REFERENCES
1. Felder, R.M., and L.K. Silverman, “Learning and Teaching Styles in Engineering Education,”Engineering Education, vol. 78, 1988, pp. 674–681.
2. Felder, R.M., “Reaching the Second Tier: Learning and Teaching Styles in College ScienceEducation,” Journal of College Science Teaching, vol. 23, no. 5, 1993, pp. 286–290.
3. Felder, R.M., “Matters of Style,” ASEE Prism, vol. 6, no. 4, pp.18–23.
4. Lawrence, G., People Types and Tiger Stripes, 3rd Edition, Center for Applications of PsychologicalType, Gainesville, FL, 1994.
5. McCaulley, M.H., E.S. Godleski, C.F. Yokomoto, L. Harrisberger, and E.D. Sloan, “Applications ofPsychological Type in Engineering Education,” Engineering Education, vol. 73, 1983, pp. 394–400.
6. McCaulley, M.H., G.P. Macdaid, and J.G. Granade, “ASEE-MBTI Engineering Consortium: Reportof the First Five Years,” Proceedings,1985 ASEE Annual Conference, ASEE, 1985.
7. Rosati, P., “Student Retention from First-Year Engineering Related to Personality Type,”Proceedings,1993 Frontiers in Education Conference, IEEE, 1993.
8. Rosati, P., “Psychological Types of Canadian Engineering Students,” Journal of Psychological Type,vol. 41, 1997, pp. 33–37.
9. Rosati, P., “A Personality Type Perspective of Canadian Engineering Students,” Proceedings,Annual Conference of the Canadian Society of Civil Engineering, CSCE, 1999.
10. Felder, R.M., K.D. Forrest, L. Baker-Ward, E.J. Dietz, and P.H. Mohr, “A Longitudinal Study ofEngineering Student Performance and Retention. I. Success and Failure in the Introductory Course,”Journal of Engineering Education, vol. 82, no. 1, 1993, pp. 15-21.
11. Felder, R.M., P.H. Mohr, E.J. Dietz, and L. Baker-Ward, “A Longitudinal Study of EngineeringStudent Performance and Retention. II. Differences between Students from Rural and UrbanBackgrounds,” Journal of Engineering Education, vol. 83, no. 3, 1994, pp. 209-217.
12. Felder, R.M, G.N. Felder, M. Mauney, M., C.E. Hamrin, Jr., and E.J. Dietz, “A Longitudinal Study ofEngineering Student Performance and Retention. III. Gender Differences in Student Performance andAttitudes, Journal of Engineering Education, vol. 84, no. 2, 1995, pp. 151–174.
13. Felder, R.M., “A Longitudinal Study of Engineering Student Performance and Retention. IV.Instructional Methods and Student Responses to Them,” Journal of Engineering Education, vol. 84,no. 4, 1995, pp. 361–367.
14. Felder, R.M., G.N. Felder, and E.J. Dietz, “A Longitudinal Study of Engineering StudentPerformance and Retention. V. Comparisons with Traditionally-Taught Students,” Journal ofEngineering Education, vol. 87, no. 4, 1998, pp. 469-480.
15. Myers, I.B., and M.H. McCaulley, Manual: A Guide to the Development and Use of the Myers-BriggsType Indicator, Consulting Psychologists Press, Palo Alto, CA, 1985.
16. Felder, R.M., (a) “Meet Your Students. 1. Stan and Nathan,” Chemical Engineering Education, vol.23, no. 2, 1989, pp. 68–69; (b) “Meet Your Students. 4. Jill and Perry,” Chemical EngineeringEducation, vol. 25, no. 4, 1991, pp. 196–197; (c) “Meet Your Students. 5. Edward and Irving,”Chemical Engineering Education, vol. 28, no. 1, 1994, pp. 36–37; (d) “Meet Your Students. 6. Tonyand Frank,” Chemical Engineering Education, vol. 29, no. 4, 1995, pp. 244–245.
17. Godleski, E.S., “Learning Style Compatibility of Engineering Students and Faculty,” Proceedings,1984 Frontiers in Education Conference, IEEE, 1984.
18. Myers, I.B., Gifts Differing, Consulting Psychologists Press, Palo Alto, CA, 1980.

17
19. Wankat, P., and F. Oreovicz, Teaching Engineering, McGraw-Hill, New York, 1993, p. 253.
20. Weinstein, C.E., LASSI Users Manual, H&H Publishers, Clearwater, FL, 1987.
21. McCaulley, M.H., “The MBTI and Individual Pathways in Engineering Design,” EngineeringEducation, vol. 80, 1990, pp. 537–542.
22. Johnson, D.W., R.T. Johnson, and K.A. Smith, Active Learning: Cooperation in the CollegeClassroom, 2nd Edition, Interaction Book Company, Edina, MN, 1998.
23. Springer, L., M.E. Stanne, and S. Donovan, “Effects of Small-Group Learning on Undergraduates inScience, Mathematics, Engineering, and Technology: A Meta-Analysis,”<http://www.wcer.wisc.edu/nise/CL1/CL/resource/R2.htm>, 1998.
24. Thomson, N.F., and M.J. Martinko, “The Relationship between MBTI Types and AttributionalStyle,” Journal of Psychological Type, vol. 35, 1995, pp. 22–30.
25. Felder, R.M., and R. Brent, Cooperative Learning in Technical Courses: Procedures, Pitfalls, andPayoffs, ERIC Document Reproduction Service, ED-377038, 1994.

18
LIST OF TABLES
1. MBTI Type Distributions
2. Learning and Study Strategies Inventory Scores
3. Cumulative GPA by Type Preference and Semester
4. Grades in Experimental CHE Courses
5. Grades in Experimental CHE Courses: T/F x Male/Female
6. Grades in Experimental CHE Courses: (S/N x J/P)
7. Grades in Non-Experimental CHE Courses
8. Retention and Graduation in Chemical Engineering by Type Preference and Year
9. Retention and Graduation in Chemical Engineering by Type Preference and Year: (E/I x S/N)
10. Percentages Giving Top Helpfulness Ratings to Different Modes of Instruction
11. Self-Assessments of Creative Problem-Solving Ability
12. Preferred Career Environments
13. Post-Graduation Plans
14. Seniors’ Requirements for Job Satisfaction

19
TABLE 1MBTI TYPE DISTRIBUTIONS
Females (n=34)ISTJ 26.5% ISFJ 5.9% INFJ 5.9% INTJ 5.9%ISTP 0.0% ISFP 2.9% INFP 0.0% INTP 2.9%ESTP 2.9% ESFP 0.0% ENFP 14.7% ENTP 0.0%ESTJ 14.7% ESFJ 11.8% ENFJ 2.9% ENTJ 2.9%
50.0% E – 50.0% I64.7% S – 35.3% N 44.1% ST 20.6% SF55.9% T – 44.1% F 11.8% NT 23.5% NF76.5% J – 23.5% P
Males (n=82)ISTJ 18.3% ISFJ 4.9% INFJ 1.2% INTJ 8.5%ISTP 4.9% ISFP 1.2% INFP 2.4% INTP 11.0%ESTP 8.5% ESFP 2.4% ENFP 7.3% ENTP 6.1%ESTJ 9.8% ESFJ 4.9% ENFJ 1.2% ENTJ 7.3%
47.6% E – 52.4% I54.9% S – 45.1% N 41.5% ST 13.4% SF74.4% T – 25.6% F 32.9% NT 12.2% NF56.1% J – 43.9% P
Total (n=116)ISTJ 20.7% ISFJ 5.2% INFJ 2.6% INTJ 7.8%ISTP 3.4% ISFP 1.7% INFP 1.7% INTP 8.6%ESTP 6.9% ESFP 1.7% ENFP 9.5% ENTP 4.3%ESTJ 11.2% ESFJ 6.9% ENFJ 1.7% ENTJ 6.0%
48.3% E – 51.7% I57.8% S – 42.2% N 42.2% ST 15.5% SF69.0% T – 31.0% F 26.7% NT 15.5% NF62.1% J – 37.9% P

20
TABLE 2LEARNING AND STUDY STRATEGIES INVENTORY SCORES
ScaleE
(55)I
(57) p†J
(71)P
(41) p†
ATT 33.8 31.2 .02* 32.8 31.9 .42MOT 32.3 31.7 .54 33.2 29.9 .001*TMT 25.1 24.5 .55 26.2 22.3 .001*ANX 26.9 24.0 .03* 25.2 25.8 .71CON 28.2 26.2 .06* 28.1 25.5 .02*INP 29.7 26.9 .006* 28.1 28.6 .61SMI 19.5 18.9 .38 19.6 18.5 .09*STA 26.9 23.9 .06* 25.5 23.7 .08*SFT 26.9 25.2 .09* 26.7 24.9 .08*TST 31.1 29.5 .14 30.6 29.6 .35
ATT: Attitude and interest in schoolMOT: Motivation, diligence, self-discipline, willingness to work hardTMT: Use of time management principles for academic tasksANX: Anxiety about school performanceCON: Concentration and attention to academic tasksINP: Information processing (ability to supply meaning and organization to new
information)SMI: Selecting main ideas and recognizing important informationSTA: Use of study aids (highlighting, underlining, writing summaries,...)SFT: Self-testing, reviewing, preparing for classesTST: Test-taking strategies and preparing for tests
† Wilcoxon rank-sum test

21
TABLE 3CUMULATIVE GPA BY TYPE
PREFERENCE AND SEMESTER
STUDENTS WITH AI>3E I p† S N p† T F p† J P p†
AIa
(n)3.19(19)
3.25(26)
.16 3.27(21)
3.18(24)
.04* 3.23(27)
3.21(18)
.80 3.26(28)
3.16(17)
.03*
GPA S90b
(n)3.50(18)
3.63(26)
.27 3.64(21)
3.52(23)
.32 3.66(27)
3.45(17)
.08* 3.65(28)
3.45(16)
.10*
F90c 3.34 3.56 .12 3.55 3.39 .24 3.59 3.28 .02* 3.58 3.27 .03* S91 3.31 3.53 .12 3.54 3.35 .21 3.57 3.24 .02* 3.58 3.20 .01* S92 3.31 3.52 .13 3.51 3.37 .31 3.54 3.27 .05* 3.58 3.20 .01* S93 3.34 3.55 .11 3.55 3.39 .22 3.57 3.30 .04* 3.60 3.23 .004* (n) (19) (26) (21) (24) (27) (18) (28) (17)
STUDENTS WITH AI<3E I p† S N p† T F p† J P p†
AIa
(n)2.62(28)
2.51(24)
.17 2.58(32)
2.56(20)
.74 2.59(39)
2.53(13)
.50 2.61(30)
2.52(22)
.21
GPA S90b
(n)3.02(28)
2.99(24)
.88 2.88(32)
3.21(20)
.05* 3.13(39)
2.65(13)
.01* 3.12(30)
2.86(22)
.13
F90c 3.01 2.63 .02* 2.71 3.05 .04* 2.91 2.60 .09* 2.84 2.81 .83 S91 3.01 2.56 .01* 2.66 3.03 .04* 2.89 2.58 .09* 2.79 2.81 .92 S92 2.97 2.57 .02* 2.66 2.99 .06* 2.84 2.60 .20 2.80 2.74 .71 S93 3.00 2.60 .02* 2.68 3.00 .08* 2.86 2.64 .25 2.84 2.75 .62 (n) (35) (32) (43) (24) (50) (17) (42) (25)
†Wilcoxon rank-sum testaAdmissions index (predicted grade-point average prior to enrollment in college)bGPA following the Spring 1990 semestercGPA following the first semester of the study (Fall 1990)

22
TABLE 4GRADES IN EXPERIMENTAL CHE COURSES
STUDENTS WITH AI>3
E I p† S N p† T F p† J P p†
CHE 205 (19) (26) (21) (24) (27) (18) (28) (17)Avg. Grade (A=4) 2.95 3.19 .46 3.14 3.04 .76 3.41 2.61 .01* 3.25 2.82 .20% A’s 42% 42% ≅1 48% 38% .56 48% 33% .37 50% 29% .22% pass (A,B,C) 84% 92% .64 90% 88% ≅1 100% 72% .01* 93% 82% .35CHE 225 (14) (23) (18) (19) (25) (12) (25) (12)Avg. Grade 3.14 3.52 .16 3.61 3.16 .08* 3.48 3.17 .27 3.52 3.08 .12% A’s 43% 61% .33 61% 47% .52 56% 50% ≅1 64% 33% .16CHE 311 (14) (20) (17) (17) (22) (12) (23) (11)Avg. Grade 3.00 3.15 .63 2.94 3.24 .33 3.18 2.92 .40 3.26 2.73 .09*% A’s 43% 40% ≅1 29% 53% .30 45% 33% .72 52% 18% .08*CHE 312 (13) (19) (15) (17) (22) (10) (22) (10)Avg. Grade 3.46 3.47 .96 3.67 3.29 .12 3.55 3.30 .35 3.55 3.30 .35% A’s 54% 58% ≅1 67% 47% .31 64% 40% .27 64% 40% .27CHE 446 (12) (17) (14) (15) (20) (9) (20) (9)Avg. Grade 3.25 3.41 .56 3.36 3.33 .93 3.50 3.00 .08* 3.40 3.22 .55% A’s 50% 47% ≅1 43% 53% .72 60% 22% .11 50% 44% ≅1
STUDENTS WITH AI<3
E I p† S N p† T F p† J P p†
CHE 205 (37) (34) (46) (25) (53) (18) (44) (27)Avg. Grade 2.22 1.41 .02* 1.50 2.44 .01* 1.79 1.94 .71 1.86 1.78 .81% A’s 14% 12% ≅1 4% 28% .007* 15% 6% .43 14% 11% ≅1% pass (A,B,C) 73% 44% .02* 50% 76% .04* 55% 72% .27 59% 59% ≅1CHE 225 (21) (13) (17) (17) (25) (9) (22) (12)Avg. Grade 2.95 2.54 .26 2.76 2.82 .87 2.96 2.33 .12 3.00 2.42 .12% A’s 39% 44% .81 18% 29% .69 29% 11% .39 32% 8% .21CHE 311 (18) (14) (16) (16) (25) (7) (19) (13)Avg. Grade 2.39 2.43 .93 2.06 2.75 .09* 2.40 2.43 .96 2.63 2.08 .19% A’s 11% 21% .63 12% 19% ≅1 20% 0% .56 21% 8% .62CHE 312 (17) (12) (14) (15) (23) (6) (18) (11)Avg. Grade 3.06 2.83 .45 2.86 3.07 .48 2.96 3.00 .91 3.06 2.82 .44% A’s 35% 17% .41 14% 40% .22 30% 17% .65 33% 18% .63CHE 446 (15) (11) (13) (13) (20) (6) (18) (8)Avg. Grade 2.87 2.73 .59 2.62 3.00 .12 2.90 2.50 .18 2.94 2.50 .10*% A’s 13% 9% ≅1 0% 23% .22 16% 0% .55 17% 0% .53†Wilcoxon rank-sum test for average grade, Fisher exact test for percentages

23
TABLE 5GRADES IN EXPERIMENTAL CHE COURSES: T/F x MALE/FEMALE
Thinkers FeelersMale Female Male Female
AI (49)2.77
(17)3.07
(18)2.86
(13)3.02
CHE 205 Average grade (A=4) % A’s
(58)2.4328%
(19)2.2626%
(20)2.5030%
(15)1.937%
CHE 225 Average grade (A=4) % A’s
(38)3.2745%
(11)3.0936%
(14)3.0050%
(7)2.430%
CHE 311 Average grade (A=4) % A’s
(36)2.8131%
(10)2.7040%
(12)3.0033%
(7)2.290%
CHE 312 Average grade (A=4) % A’s
(35)3.3151%
(10)3.0030%
(10)3.4050%
(6)2.830%
CHE 446 Average grade (A=4) % A’s
(30)3.2037%
(9)3.2244%
(9)3.1122%
(6)2.330%

24
TABLE 6GRADES IN EXPERIMENTAL CHE COURSES: (S/N x J/P)
STUDENTS WITH AI>3
SJ SP NJ NPCHE 205 (17) (4) (11) (13)Avg. Grade (A=4) 3.35 2.25 3.09 3.00% A’s 53% 25% 45% 31%CHE 225 (15) (3) (10) (9)Avg. Grade 3.67 3.33 3.30 3.00% A’s 67% 33% 60% 33%CHE 311 (14) (3) (10) (9)Avg. Grade 3.07 2.33 3.56 2.88% A’s 36% 0% 78% 25%CHE 312 (13) (2) (9) (8)Avg. Grade 3.62 4.00 3.44 3.12% A’s 62% 100% 67% 25%CHE 446 (12) (2) (8) (7)Avg. Grade 3.33 3.50 3.50 3.14% A’s 42% 50% 62% 43%
STUDENTS WITH AI<3
SJ SP NJ NPCHE 205 (34) (12) (10) (15)Avg. Grade 1.53 1.42 3.00 2.07% A’s 6% 0% 40% 20%CHE 225 (13) (4) (9) (8)Avg. Grade 2.92 2.25 3.11 2.50% A’s 23% 0% 44% 12%CHE 311 (10) (6) (9) (7)Avg. Grade 2.40 1.50 2.89 2.57% A’s 20% 0% 22% 14%CHE 312 (10) (4) (8) (7)Avg. Grade 2.90 2.75 3.25 2.86% A’s 20% 0% 22% 14%CHE 446 (10) (3) (8) (5)Avg. Grade 2.70 2.33 3.25 2.60% A’s 0% 0% 38% 0%

25
TABLE 7GRADES IN NON-EXPERIMENTAL CHE COURSES
STUDENTS WITH AI>3
E I p‡ S N p‡ T F p‡ J P p‡
CHE 315 (18) (24) (20) (22) (27) (15) (27) (15)Avg. Grade (A=4) 2.72 3.33 .07* 3.10 3.05 .87 3.33 2.60 .03* 3.30 2.67 .07*% A’s 39% 50% .54 45% 45% ≅1 56% 27% .11 56% 27% .11CHE 316 (16) (23) (19) (20) (26) (13) (26) (13)Avg. Grade 3.12 3.43 .20 3.05 3.55 .03* 3.31 3.31 ≅1 3.38 3.15 .36% A’s 38% 52% .52 32% 60% .11 50% 38% .73 64% 33% .16CHE 425 (13) (19) (16) (16) (22) (10) (22) (10)Avg. Grade 3.77 3.63 .48 3.62 3.75 .52 3.68 3.70 .93 3.64 3.80 .43% A’s 77% 68% .70 62% 81% .43 73% 70% ≅1 68% 80% .68CHE 450 (8) (14) (11) (11) (15) (7) (15) (7)Avg. Grade 2.75 3.14 .32 3.00 3.00 ≅1 3.00 3.00 ≅1 3.20 2.57 .12% A’s 25% 29% ≅1 36% 18% .64 27% 29% ≅1 40% 0% .12
STUDENTS WITH AI<3
E I p‡ S N p‡ T F p‡ J P p‡
CHE 315 (28) (17) (24) (21) (35) (10) (26) (19)Avg. Grade 2.75 2.41 .26 2.58 2.67 .78 2.57 2.80 .51 2.81 2.37 .13% A’s 11% 18% .66 8% 19% .40 17% 0% .31 15% 11% ≅1CHE 316 (28) (15) (20) (23) (33) (10) (25) (18)Avg. Grade 2.43 2.47 .91 2.35 2.50 .52 2.36 2.70 .36 2.64 2.17 .13% A’s 11% 13% ≅1 4% 20% .17 12% 10% ≅1 12% 11% ≅1CHE 425 (19) (12) (16) (15) (24) (7) (19) (12)Avg. Grade 2.79 3.25 .22 2.88 3.07 .61 3.04 2.71 .46 3.11 2.75 .35% A’s 21% 42% .25 19% 40% .25 33% 14% .64 37% 17% .42CHE 450 (16) (9) (14) (11) (20) (5) (17) (8)Avg. Grade 2.62 2.00 .05* 2.29 2.55 .41 2.40 2.40 ≅1 2.53 2.12 .22% A’s 12% 0% .52 7% 9% ≅1 10% 0% ≅1 12% 0% ≅1‡Wilcoxon rank-sum test for average grade, Fisher exact test for percentages

26
TABLE 8RETENTION AND GRADUATION IN CHEMICAL
ENGINEERING BY TYPE PREFERENCE AND YEAR†
STUDENTS WITH AI>3E
(19)I
(26)p‡ S
(21)N
(24)p‡ T
(27)F
(18)p‡ J
(28)P
(17)p‡
Remaining or graduatingYear 2 95% 96% ≅1 100% 92% .49 100% 89% .16 96% 94% ≅1Year 3 84% 88% .69 90% 83% .67 96% 72% .03* 93% 76% .18Year 4 84% 88% .69 90% 83% .67 96% 72% .03* 93% 76% .18Year 5 84% 88% .69 90% 83% .67 96% 72% .03* 93% 76% .18
GraduatingYear 4 37% 58% .23 48% 50% ≅1 59% 33% .13 54% 41% .54Year 5 84% 88% ≅1 90% 75% .25 89% 72% .24 89% 71% .23
STUDENTS WITH AI<3E
(30)I
(27)p‡ S
(34)N
(23)p‡ T
(43)F
(14)p‡ J
(35)P
(22)p‡
Remaining or graduatingYear 2 97% 78% .04* 79% 100% .03* 88% 86% ≅1 83% 95% .23Year 3 93% 67% .02* 74% 91% .17 79% 86% .71 77% 86% .50Year 4 90% 67% .05* 71% 91% .10* 77% 86% .71 77% 82% .75Year 5 83% 52% .02* 65% 74% .57 70% 64% .75 69% 68% ≅1
GraduatingYear 4 37% 30% .38 35% 30% .78 33% 36% ≅1 34% 32% ≅1Year 5 80% 48% .02* 62% 70% .58 67% 57% .53 66% 64% ≅1†Percentages of students entering CHE 205 intending to major in chemical engineering who were stillchemical engineering majors after the given year. The remainder changed curricula, were suspended, ordropped out of school.‡Wilcoxon rank-sum test
27
TABLE 9RETENTION AND GRADUATION IN CHEMICAL ENGINEERING
BY TYPE PREFERENCE AND YEAR: (E/I) x (S/N)†
STUDENTS WITH AI>3ES(7)
EN(12
IS(14)
IN(12)
Remaining or graduatingYear 2 100% 92% 100% 92%Year 3 86% 83% 93% 83%Year 4 86% 83% 93% 83%Year 5 86% 83% 93% 83%
GraduatingYear 4 29% 42% 57% 58%Year 5 86% 83% 93% 67%
STUDENTS WITH AI<3ES(18)
EN(12
IS(16)
IN(11)
Remaining or graduatingYear 2 94% 100% 62% 100%Year 3 89% 92% 50% 91%Year 4 89% 92% 50% 91%Year 5 89% 75% 38% 73%
GraduatingYear 4 33% 42% 38% 18%Year 5 83% 75% 38% 64%
†Percentages of students entering CHE 205 intendingto major in chemical engineering who were stillchemical engineering majors after the given year.The remainder changed curricula, were suspended, ordropped out of school.
28
TABLE 10PERCENTAGES GIVING TOP HELPFULNESS RATINGS
TO DIFFERENT MODES OF INSTRUCTION†
E I p‡ S N p‡ T F p‡ J P p‡
LecturesCHE 205 4% 9% .44 5% 9% .70 6% 9% .68 11% 0% .04*CHE 311 29% 42% .43 35% 35% 1 37% 32% .78 45% 18% .05*Seniors 31% 52% .13 50% 32% .21 40% 44% .78 47% 30% .28
In-classgroupwork
CHE 311 16% 3% .20 10% 10% 1 5% 21% .07* 8% 14% .66Seniors 21% 33% .41 32% 22% .41 30% 21% .55 36% 10% .04*
Grouphomework
CHE 205 43% 33% .32 31% 48% .10* 40% 33% .52 35% 42% .54CHE 311 65% 68% 1 61% 71% 59 60% 79% .24 68% 64% .78Seniors 70% 88% .13 82% 75% .55 81% 74% .52 78% 81% 1
†In separate questions, the students were asked to rate the helpfulness of lectures, in-class group work(except in CHE 205), and group homework. The ratings were “very helpful” (top rating), “helpful,”“average,” “not very helpful,” and “not at all helpful.” The seniors’ ratings were collected in the Spring1993 semester.‡Wilcoxon rank-sum test
TABLE 11SELF-ASSESSMENTS OF CREATIVE PROBLEM-SOLVING ABILITY
Spring 1992 Fall 1993 Spring 1993Rating S N p† S N p† S N p†
(29) (31) (30) (31) (35) (32)Excellent 0% 13% 7% 32% 9% 25%
Good 34% 48% 47% 58% 60% 56%Average 45% 26% .15 40% 6% .002* 29% 16% .14
Fair 14% 10% 3% 3% 3% 0%Poor 7% 3% 3% 0% 0% 3%
† Fisher exact test

29
TABLE 12PREFERRED CAREER ENVIRONMENT
S N p†
Sophomores (n=63) (n=49) Large corporation 79% 45% Small firm 11% 29% .001* University or research facility 8% 24% Public service 2% 2%Seniors (n=35) (n=31) Large corporation 69% 48% Small firm 20% 16% .19 University or research facility 9% 23% Public service 3% 12%
† Fisher exact test
TABLE 13POST-GRADUATION PLANS
JuniorsE
(29)I
(31)p† S
(29)N
(31)p† T
(44)F
(16)p† J
(40)P
(20)p†
Grad. School – immediately 45% 39% 31% 52% 45% 31% 48% 30% – later 17% 29% .65 28% 19% .07* 25% 19% .54 20% 30% .33Enter profession 34% 26% 41% 19% 25% 44% 30% 30%Take a year off 3% 6% 0% 10% 5% 6% 2% 10%
SeniorsE
(34)I
(33)p† S
(35)N
(31)p† T
(48)F
(19)p† J
(46)P
(21)p†
Grad. School – immediately 30% 24% 18% 38% 32% 16% 29% 24% – later 18% 18% .88 21% 16% .25 21% 11% .24 16% 24% .06*Enter profession 45% 55% 59% 41% 43% 68% 56% 38%Take a year off 6% 3% 3% 6% 4% 5% 0% 14%† Fisher exact test

TABLE 14SENIORS’ REQUIREMENTS FOR JOB SATISFACTIONE
(30)I
(32)p† S
(31)N
(31)p† T
(46)F
(16)p† J
(41)P
(21)p†
Importance of meeting/exceeding employer expectationsVery 67% 66% 81% 52% 65% 69% 76% 48%Fairly 30% 31% ≅1 19% 42% .04* 30% 31% ≅1 22% 48% .07*Not very/not 3% 3% 0% 6% 4% 0% 2% 5%
Importance of well defined tasks that don’t change frequentlyVery 0% 0% 0% 0% 0% 0% 0% 0%Fairly 20% 44% .11 32% 29% .79 30% 31% ≅1 34% 24% .56Not very/not 80% 60% 67% 71% 70% 69% 66% 76%
Importance of high salaryVery 30% 19% 32% 16% 20% 38% 29% 14%Fairly 60% 66% .57 58% 68% .28 65% 56% .33 58% 71% .42Not very/not 10% 15% 10% 16% 15% 6% 12% 15%
Importance of variety in job tasksVery 50% 31% 48% 32% 39% 44% 42% 38%Fairly 43% 59% .40 45% 58% .58 52% 50% .91 51% 52% ≅1Not very/not 7% 9% 6% 10% 9% 6% 7% 10%
Importance of good locationVery 20% 28% 26% 23% 22% 31% 27% 19%Fairly 57% 41% .63 52% 45% .80 48% 50% .56 46% 52% .74Not very/not 23% 31% 22% 33% 31% 18% 27% 29%
Importance of doing creative/innovative workVery 43% 41% 19% 65% 48% 25% 39% 48%Fairly 50% 50% ≅1 65% 35% .001* 48% 56% .11 49% 52% .28Not very/not 7% 9% 16% 0% 4% 18% 12% 0%
Importance of job securityVery 43% 62% 55% 52% 52% 56% 61% 38%Fairly 57% 28% .02* 42% 42% ≅1 41% 44% .80 37% 52% .15Not very/not 0% 9% 3% 6% 6% 0% 2% 10%
Importance of opportunity for teamworkVery 47% 47% 52% 42% 46% 50% 51% 38%Fairly 40% 41% ≅1 39% 42% .78 39% 44% .84 37% 48% .66Not very/not 13% 12% 10% 16% 15% 6% 12% 14%
Importance of enjoyable workVery 90% 97% 97% 90% 96% 88% 98% 86%Fairly 10% 3% .34 3% 10% .61 4% 12% .28 2% 14% .11Not very/not 0% 0% 0% 0% 0% 0% 0% 0%
Importance of doing challenging workVery 37% 41% 35% 42% 35% 50% 39% 38%Fairly 60% 56% .89 65% 52% .27 63% 44% .23 59% 57% ≅1Not very/not 3% 3% 0% 6% 2% 6% 2% 5%
Importance of doing socially important/beneficial workVery 30% 34% 26% 39% 35% 50% 29% 38%Fairly 67% 38% .01* 55% 48% .48 63% 44% .23 51% 52% .51Not very/not 3% 28% 19% 13% 2% 6% 20% 10%
Importance of good relations with coworkersVery 87% 84% 97% 74% 85% 88% 88% 81%Fairly 13% 16% ≅1 3% 26% .03* 15% 12% ≅1 12% 19% .71Not very/not 0% 0% 0% 0% 0% 0% 0% 0%
† Fisher exact test
30