the effects of plant-based diets on diabetes mellitus
TRANSCRIPT

1
THE EFFECTS OF PLANT-BASED DIETS ON DIABETES MELLITUS PREVENTION AND MANAGEMENT:
A REVIEW OF THE LITERATURE
By Haley Peterson
A Senior Project submitted In partial fulfillment of the requirements for the degree of
Bachelor of Science in Nutrition
Food Science and Nutrition Department California Polytechnic State University
San Luis Obispo, CA
March 2017

2
ABSTRACT The prevalence of diabetes has dramatically increased over the last few decades, and there are currently no indications of it slowing down. Additionally, there is no consensus on which dietary treatment is most appropriate to control blood glucose and facilitate long-term weight loss. This review analyzes how vegetarian diets may be viable options for certain individuals in reducing the risk of and managing diabetes mellitus (DM). Publications were evaluated for comparison of low-fat vegetarian and/or vegan diets and the effects on the prevention and management of DM. Findings from studies that measured blood glucose, HgA1C, and body weight indicate a strong association between reducing the risk of developing and managing DM by following a low-fat vegetarian or vegan diet. While some of the measured values did not reach statistical significance between the intervention and control groups, no harmful effects were noted by following a low-fat vegetarian diet. Although more research is needed, minimal harm has been shown in adopting a low-fat vegetarian diet. Therefore, this review concludes that clinicians may consider recommending a low-fat vegetarian diet to clients with diabetes as a way to manage the disease.

3
Introduction
Current type 2 diabetes mellitus (T2DM) rates indicate that 382 million adults aged 20-70
years worldwide are afflicted with the disease and projections for the future suggest that number
will only increase, with some estimates at 592 million worldwide by 2035 (Ardisson, Korat,
Willett, & Hu, 2014). In the US, T2DM is associated with increased morbidity, mortality, and
healthcare costs, which increase concern for the economic burden of the disease. Type 2 diabetes
mellitus is caused by the body’s ineffective use of insulin which has many etiologies such as
lifestyle behaviors, genetics, and environmental factors.
Although lifestyle modification and medical nutrition therapy are considered the
keystones of T2DM prevention and treatment, there is no consensus on which dietary treatment
is most appropriate to control blood glucose and facilitate long-term weight loss. Several plant
foods, such as whole grains, fruits, and vegetables, are associated with a lower risk of T2DM,
while certain animal foods, such as red and processed meats, are positively associated with
T2DM risk (Khazrai, Defeudis & Pozzilli, 2013). Additionally, the recently released 2015
Dietary Guidelines Advisory Committee report recommends shifting away from intake of certain
animal foods and moving towards a plant-rich diet (Sitija et al., 2016). The purpose of this
literature review is to examine the effectiveness of a vegetarian diet on the prevention and
management of T2DM. This review is designed to evaluate the potential for recommending a
vegetarian diet for effective T2DM prevention and management.
This literary review was conducted using PubMed’s MeSH database (keywords: type 2
diabetes mellitus and vegetarian diets). Original research papers were chosen based on study
design, size of cohort, credibility and quality of research, and definition of “vegetarian diet.”

4
Type 2 Diabetes Mellitus Overview
Diabetes mellitus refers to a group of diseases characterized by chronic elevation of
blood glucose. Glucose is the body’s preferred source of energy. There are several categories of
the diabetes mellitus: type 1, type 2, gestational diabetes, and prediabetes. The former two are
chronic conditions that are irreversible, while the latter two have the potential to be reversed
under a change in status and/or proper management.
History of Diabetes:
Diabetes has a long history that dates back to the 14th century BCE. An Egyptian
physician in 1552 BCE mentioned frequent urination as a symptom for somebody who presented
with a diabetes-like condition (Swidorski, 2014). Further descriptions of “sugary” urine were
noted from 500 BCE. In the 1st Century AD, the Greeks describe the disease as a “melting down
of the flesh and limbs into urine,” (Swidorski, 2014). Until the 11th century, the diagnosis of
diabetes (meaning “to go through, or siphon”) was often made by “water tasters” who drank the
urine of those suspected of having diabetes. Mellitus, the Latin word for honey, was added to the
term “diabetes” in the 11th century (Swidorski, 2014).
In 1776, a physician named Dobson observed that for some people, diabetes was fatal in
less than five weeks and for others, it was a chronic condition (Swidorski, 2014). This was the
first time that a distinction between type 1 and type 2 diabetes mellitus had been made
(Swidorski, 2014). In 1921, insulin was “discovered” after a de-pancreatized dog was
successfully treated with insulin (Swidorski, 2014). The following year, insulin began to be mass
produced in North America, and by 1944, a uniform insulin syringe was developed and diabetes
management became more standardized (Swidorski, 2014). In 1959, two major types of diabetes

5
were formally recognized: type 1 (insulin-dependent) diabetes and type 2 (non-insulin-
dependent) diabetes (Swidorski, 2014).
Prevalence & Healthcare Costs
Since diabetes became a household name as early as the 1950’s, the disease has become
more prevalent, resulting in consequential healthcare costs. Figure 1 depicts the population
percentage by state of the prevalence of diabetes.
Over the last 70 years, the prevalence of diabetes has skyrocketed in the United States
(Centers for Disease Control and Prevention [CDC}, 2014). As shown in Figure 2, fewer than 3
FIGURE 1. Map of the United States indicating age-adjusted percentage of adults with diagnosed diabetes. The categorical shadings of the states are as follows: the lightest shaded states have a population of 5.1-6.3% with diabetes (Montana, Idaho, Colorado, etc.). The next darkest shaded states have a population of 6.4-7.7% with diabetes (Alaska). The next darkest shaded states have a population of 7.8-9.4% with diabetes (Oregon, Washington, Arizona, Nevada, etc.). The darkest shaded states have a population between 9.5-15.2% with diabetes (California, Texas, Louisiana, etc.). From Centers for Disease Control and Prevention (2014).

6
million people were diagnosed with diabetes in 1958 (CDC, 2016). In 2014, an estimated 26
million Americans had diabetes and over 8 million of those people were undiagnosed (CDC,
2014). Another 79 million Americans are categorized as “pre-diabetic” and are at risk of
developing diabetes in the next ten years if appropriate lifestyle changes are not made (CDC,
2014). In the United States, diabetes effects 14.3% of the adult population with a
disproportionate number of African American, Latino, Asian, and Native Americans effected by
the disease (Papathakis, 2016a).
In congruence with the increase in diabetes over the last 70 years, a subsequent rise in
healthcare costs has been associated with the disease. From 2007 to 2012, a 41% increase in total
costs of diagnosed diabetes rose from $174 billion to $245 billion (American Diabetes
Association [ADA], 2015). The total estimated costs in 2012 due to diabetes were estimated at
FIGURE 2. The number and percentage of the US population with diagnosed diabetes from 1958 to 2014. From the Centers for Disease Control Division of Diabetes Translation (2016).
7
$245 billion dollars with $176 billion in direct medical costs and $69 billion in reduced
productivity (ADA, 2015). Of those costs, the largest components of medical expenditures are
hospital inpatient care (43% of total medical cost), prescription medications to treat
complications of diabetes (18%), and anti-diabetic agents and diabetes supplies (12%) (ADA,
2015). People with diagnosed diabetes incur average medical expenditures approximately 2.3
times higher than those without diabetes (ADA, 2015). Diabetics spend an average of $13,700
per year in medical expenditures, of which about $7,900 is attributed directly to the disease
(ADA, 2015).
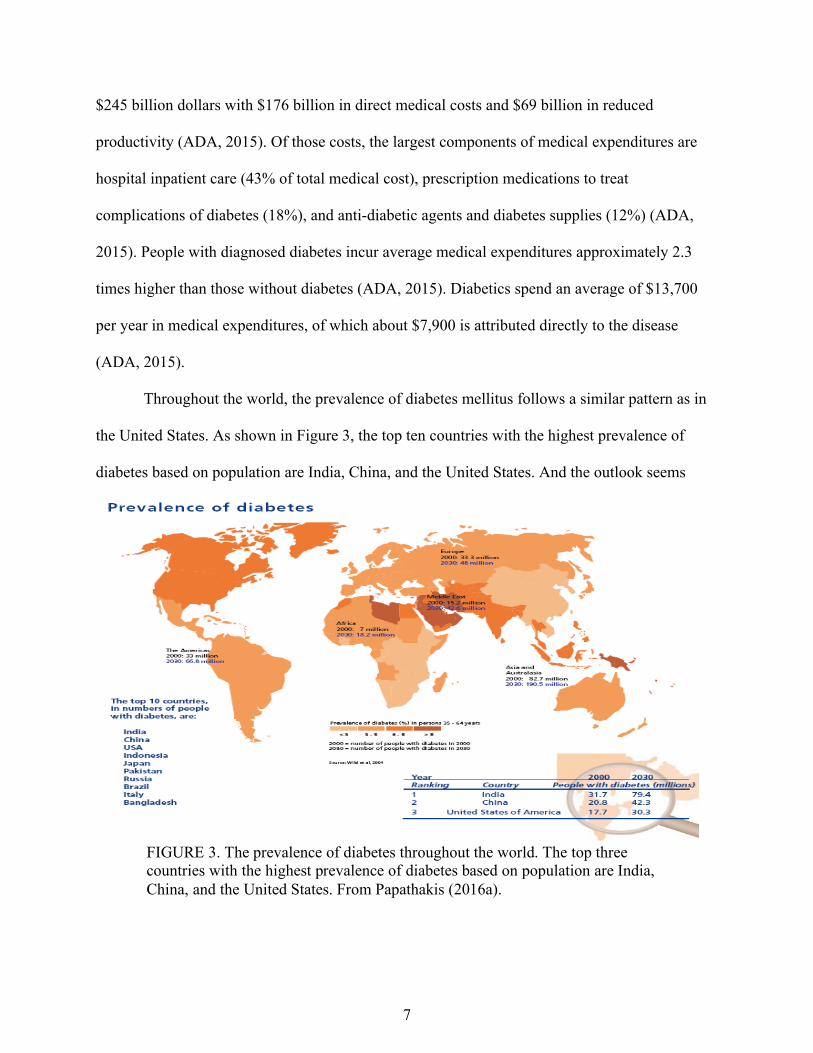
Throughout the world, the prevalence of diabetes mellitus follows a similar pattern as in
the United States. As shown in Figure 3, the top ten countries with the highest prevalence of
diabetes based on population are India, China, and the United States. And the outlook seems
FIGURE 3. The prevalence of diabetes throughout the world. The top three countries with the highest prevalence of diabetes based on population are India, China, and the United States. From Papathakis (2016a).

8
grim with estimates of the prevalence more than doubling in most regions of the world by 2030.
These numbers are correlated with the rise in obesity of the last few decades. In the United
States, more than 60% of the population is classified as overweight or obese. Figure 4 shows the
rise in percentage of overweight and obesity among adults aged 20 years and over, by sex, in the
United States from 1988-1994 and
2009-2012 (Papathakis, 2016a).
The complications that arise from
obesity, including diabetes,
cardiovascular disease, and stroke,
further lead to increased healthcare
costs and an overall burden on
society and individuals.
Role of Insulin:
The pancreas plays a major role in
maintaining blood glucose by hormone production in the islet cells. Alpha (a) cells produce
glucagon which acts on the liver to stimulate glycolysis in order to raise the body’s blood sugar.
Beta (b) cells in the pancreas produce insulin which counteracts the response of glucagon and
initiates uptake of glucose into cells from the blood, thus lowering blood sugar. Cells that are
non-insulin dependent include the brain, liver, and muscles; all other body cells rely on insulin to
stimulate glucose uptake to be used in intracellular metabolic processes (Gropper, Groff &
Smith, 2009).
The initial phases of digestion of food begin in the mouth with the breakdown of some
carbohydrate (CHO) by salivary amylase. Once swallowed, the bolus of food enters the stomach
FIGURE 4. Overweight and obesity among adults aged 20 years and over, by sex: United States, 1988-1994 through 2009-2012. From Papathakis (2016a).

9
where most of the digestion process occurs. Enzymes such as pancreatic amylase, gastric lipase,
and pepsinogen are secreted and further catabolize the bolus into the constituents of the
macronutrients (amino acids, monosaccharides, and fatty acids). Upon digestion, the components
are absorbed in the gastrointestinal tract and enter the blood stream. As shown in Figure 5, the
absorbed glucose raises the blood sugar which stimulates the b-cells of the pancreas to secrete
insulin, which binds to membrane-bound receptors on the cell surface.
The binding of the insulin causes a conformational change in the receptor which initiates
a signal cascade in the cell that prompts the GLUT-4 glucose transporters to translocate from the
cytoplasm to the cell membrane (Gropper et al., 2009). The GLUT-4 transporter enables glucose
to move from the extracellular space into the cytoplasm of the cell to be used in metabolic
processes, subsequently lowering blood sugar levels and providing energy for the cells to
function (Gropper et al., 2009).
FIGURE 5. Mechanism of glucose uptake into a cell via insulin response. From McGuire & Beerman (2009).
10
Insulin is an anabolic hormone that controls CHO, protein, and fat storage. In CHO
metabolism, glucose is transported in the cells when blood glucose is high. If the amount of
glucose in the cells exceed the amount needed for metabolic processes, lipogenesis is triggered
and the glucose is stored as fat in adipocytes (Gropper et al., 2009). The excess glucose can also
be stored as glycogen in muscle and liver cells for use when metabolic needs exceed what is
available in the body, such as during exercise, for example. In protein metabolism, insulin acts as
an active transport of amino acids from blood to muscle cells and other tissues to promote
protein synthesis and produce a positive nitrogen balance. During fat metabolism, insulin
stimulates fatty acid synthesis in the liver and storage as triglycerides via the GLUT-4 transporter
(Gropper et al., 2009).
Definitions, Risk Factors, and Diagnosis of Diabetes:
Type 1 Diabetes Mellitus (T1DM). Approximately 1.25 million Americans are living with
type 1 diabetes mellitus (JDRF, 2017) and it accounts for 5-10% of all diagnosed cases of
diabetes (Nelms, Sucher, & Lacey, 2016). This form of diabetes develops most frequently in
adolescents and is usually diagnosed in early adulthood (Papathakis, P., 2016a; Nelms, Sucher,
& Lacey, 2016). The development of T1DM is related to a cell-mediated autoimmune response
causing a gradual decline in b-cell function in the pancreas, resulting in the insulin deficiency
(Nelms, Sucher, & Lacey, 2016). Due to the lack of insulin production, glucose is unable to be
transferred into cells for energy (Nelms, Sucher, & Lacey, 2016). The insufficient secretion of
insulin can lead to chronic elevation of blood sugar, or hyperglycemia, which can result in
complications such as cardiovascular disease, neuropathy, nephropathy, retinopathy, cataracts,
and infections (Gropper, et al., 2009).

11
The initial signs and symptoms of the disorder are caused by uncontrolled high blood
sugar and may include frequent urination (polyuria), excessive thirst (polydipsia), excessive
hunger (polyphagia), fatigue, blurred vision, tingling or loss of sensation in the extremities, and
weight loss (Papathakis, P., 2016a). If T1DM goes uncontrolled and undiagnosed, life-
threatening consequences may occur, such as diabetic ketoacidosis (Papathakis, P., 2016a;
Nelms, Sucher, & Lacey, 2016).
Type 2 Diabetes Mellitus (T2DM). In the United States and worldwide, about 90-95% of
all diagnosed cases of diabetes are type T2DM (Nelms, Sucher, & Lacey, 2016). The disease
occurs most frequently in adults, but is being diagnosed with increasing frequency in children
and adolescents as well (Nelms, Sucher, & Lacey, 2016). Gender distribution of T2DM is equal,
but prevalence increases with age (Nelms, Sucher, & Lacey, 2016). Other risk characteristics for
T2DM include obesity, family history, history of festational DM, impaired glucose metabolism,
and physical inactivity (Nelms, Sucher, & Lacey, 2016).
The development of T2DM is caused by a combination of abnormal insulin secretion and
insulin resistance, and the condition is considered to be polygenic with multiple factors
contributing to its development (Nelms, Sucher, & Lacey, 2016). Unlike T1DM, the pancreas in
individuals with T2DM is fully functional in the early stages of the disease. The b-cells,
however, may stop producing insulin after a certain point in the disease’s progression which
could lead to insulin deficiency and thus glucose intolerance (PubMed Health, 2017).
Type 2 diabetes is often accompanied by severe and life-threatening complications
similar to T1DM, particularly cardiovascular disease, retinopathy, nephropathy, and neuropathy
(Nicholson, et al., 1999). The common treatments for T2DM often include prescriptions of oral
medications, recommendations of physical activity, nutrition education, and diet management

12
guidance (National Institute of Diabetes and Digestive and Kidney Diseases [NIDDKD], 2017b).
Additionally, individuals with T2DM are encouraged to lose weight as necessary, cease
smoking, distribute carbohydrate intake throughout the day, engage in physical activity, decrease
fat intake, monitor blood glucose, and add medications as needed (Papathakis, 2016b; PubMed
Health, 2017; Khardoi, 2017).
Diagnosis of Diabetes Mellitus: One of four criteria must be met in order to diagnose an
individual with diabetes, as shown in Figure 6.
Glycosylated hemoglobin assays (HgbA1C) measure the amount of glucose bound to
hemoglobin protein (Nelms, Sucher, & Lacey, 2016). The higher the glucose concentration in the
blood, the more hemoglobin is glycated, thus making this a valid test to measure the degree of
long-term hyperglycemia (Nelms, Sucher, & Lacey, 2016). Red blood cells have an average life
span of 120 days, so a measure of HgbA1C can measure the average glucose concentration for
the previous 2-3 months (Nelms, Sucher, & Lacey, 2016). With the standardization of the test, a
HgbA1C of ³6.5% is used as a mode of diagnosis (Nelms, Sucher, & Lacey, 2016). This test
Criteria for Diagnosis of Diabetes Mellitus
HgbA1C ³6.5% using standardized laboratory measures OR
Fasting plasma glucose ³126 mg/dL (7.0 mmol/L) OR
Symptoms of diabetes plus random plasma glucose concentration ³200 mg/dL (11.1 mmol/L)
OR 2-hour post-prandial glucose ³200 mg/dL (11.1 mmol/L)
during an oral glucose tolerance test (OGTT)
Figure 6. Criteria for diagnosis of diabetes mellitus. Adapted from Nelms, Sucher, & Lacey (2016).

13
serves not only as a diagnostic test of diabetes, but also as a crucial component of monitoring
long-term glycemic control (Nelms, Sucher, & Lacey, 2016).
Controlling blood glucose levels is beneficial for individuals with diabetes.
Hyperglycemia can cause inflammation in the blood vessels and result in the potentially fatal
complications described briefly before. Hypoglycemia can also cause potential problems such as
dizziness, confusion, or fainting (Spero, 2016). Table 1 highlights the recommendations for
blood glucose levels for before and after meals for people with and without diabetes:
TABLE 1. Blood Glucose Recommendations
Fasting:
Non-diabetic 70-99 mg/dL (3.9-5.5 mmol/L)
ADA recommendation for diabetics 80-130 mg/dL (4.5-7.2 mmol/L)
2-Hours Post-Prandial
Non-diabetic < 140 mg/dL (7.8 mmol/L)
ADA recommendation for diabetics < 180 mg/dL (10.0 mmol/L)
Adapted from Diabetes Self-Management (2017).
Medical Treatment of Diabetes Mellitus: For individuals with T1DM, they must depend
on daily administration of exogenous insulin to survive in conjunction with nutrition therapy and
physical activity (Nelms, Sucher, & Lacey, 2016). Treatment of T2DM utilizes a variety of
medications (including insulin), nutrition therapy, and lifestyle changes (Nelms, Sucher, &
Lacey, 2016). The initial steps in treating T2DM are weight loss and increased physical activity,
with the addition of medication in latter stages of disease progression (Nelms, Sucher, & Lacey,
2016). The goals of treatement for both types of diabetes include avoiding hyperglycemia and
inhibiting the development of complications within an acceptable level of treatment side effects
14
(Nelms, Sucher, & Lacey, 2016). The closer to the normal range of blood glucose can be
maintained over the long term, the lower the risk of complications (Nelms, Sucher, & Lacey,
2016).
For nutrition therapy involving diabetes management, there are multiple goals that help
manage diabetes: HgbA1C <7%, blood pressure <140/80 mgHg, LDL cholesterol <100 mg/dL,
triglycerides <150 mg/dL; HDL cholesterol >40 mg/dL for men and >50 mg/dL for women,
achieve and maintain body weight goals, and delay or prevent complication of diabetes (Nelms,
Sucher, & Lacey, 2016). Current diet recommendations to achieve glycemic and metabolic
control include the Mediterranean diet, the DASH diet, vegetarian or vegan diets, as well as low-
fat and low-carbohydrate diets (Nelms, Sucher, & Lacey, 2016). This review focuses on the
health benefits for diabetics by following a vegetarian diet.
Exercise & body weight effect on Insulin Sensitivity: With the correlation between a rise
in obesity and diabetes, the correlation between body weight and insulin sensitivity has been
heavily researched. In the 2011 study by Mason et al., the researchers found that dietary weight
loss, with or without exercise, significantly improved insulin resistance (Mason et al., 2011).
This conclusion has also been found by a growing body of researchers including Duncan et al
(2003), Devlin et al (1987), and Goodyear & Kahn (1998). Exercise is a confounding variable
when examining the effects of diet on the management of diabetes, and should be noted in this
review as a potential contributor to success in reducing insulin resistance.
Plant-Based Diets
People adopt plant-based diets for a variety of reasons including health concerns,
religious convictions, animal welfare, and environmental implications. Furthermore, some
people follow a mostly vegetarian diet because they cannot afford to purchase and eat meat.

15
According to a Harris Interactive poll commissioned by the Vegetarian Resource Group,
approximately six to eight million adults in the United States do not eat any meat, fish, or
poultry. Several million more have eliminated red meat but still eat chicken or fish, and about
two million people have adopted more restrictive vegan diets (Harvard Women’s Health Watch,
2016).
Definitions:
Vegetarian Diets: In general, vegetarianism excludes all animal flesh from the diet (Li,
2013). Foods such as dairy, cheese, eggs, and honey may still be included depending on the
individual’s preference and tolerance. Within the vegetarian diet, there are further restrictions
one may follow: lacto-ovo vegetarians consume diary and eggs, but no meat, poultry, or fish;
lacto-vegetarians consume dairy, but no eggs, meat, poultry, or fish; and ovo-vegetarians
consume eggs, but no meat, poultry, fish, or dairy. Vegan diets not only exclude all meat from
the diet, but also all animal products including dairy, eggs, cheese, honey, and even certain foods
that are processed with animal byproducts, such as gelatin (from animal bones and connective
tissue) and some sugars that are whitened with bone char (Li, 2013).
For this literary analysis, inclusion criteria for clinical trials is established based on
studies defining a vegetarian and/or vegan diet as an experimental variable on development
and/or management of type 2 diabetes mellitus.
History and Background of Vegetarian Diets
Vegetarianism has a long history in most cultures around the world. In ancient Greece,
the mathematician Pythagoras followed a vegetarian diet not only to avoid animal cruelty, but
also because he experienced the health advantages of a meat-free diet (World History of
Vegetarianism, 2016). In eastern religions, abstinence from meat is central to the religious
16
philosophies of Hinduism, Jainism, and Buddhism in addition to following non-violence
practices (World History of Vegetarianism, 2016).
In western religions such as Christianity, vegetarian diets are also prevalent especially in
the Seventh-Day Adventist community. According to the Seventh-Day Adventist church website,
health is considered a gift from a “loving God,” and eating a well-balanced vegetarian diet that
avoids the consumption of meat coupled with intake of legumes, whole grains, nuts, fruits and
vegetables, along with a source of vitamin B12, will promote vigorous health (Seventh-Day
Adventist Church, 2017).
Now in the twenty-first century, vegetarian diets have been gaining popularity especially
because of the environmental issues that have dominated headlines. The massive outbreaks of
food-borne illnesses related to animal products, such as Mad Cow Disease and Salmonella, have
also caused people to turn to vegetarianism as a “safe and healthy alternative” to consuming
meat (World History of Vegetarianism, 2016).
Overall Health Benefits and Concerns of a Vegetarian Diet
Vegetarian diets are typically based on the consumption of whole grains, legumes,
vegetables, fruits, and nuts. This general dietary pattern correlates to having a diet rich in fiber,
magnesium, phytochemicals, antioxidants, vitamins C and E, F3+, folic acid, and n-6
polyunsaturated fatty acids (PUFAs), but low in cholesterol, total fat and saturated fat, sodium,
zinc, vitamins A, B12 and D, and especially n-3 PUFAs (Li, 2013). Compared to omnivores, the
low intake of cholesterol, total fat, sodium, and high intake of phytochemicals, antioxidants and
fiber in vegetarians is associated with health advantages including decreased mortality and
morbidity of non-communicable diseases such as diabetes (Li, 2013). Additionally, vegetarian
diets are likely to have lower total and LDL cholesterol, lower blood pressure, and lower body

17
mass index (BMI), all of which are associated with longevity and a reduced risk for chronic
diseases such as cardiovascular disease, stroke, cancer, and type 2 diabetes (Harvard Women’s
Health Watch, 2016).
Conversely to the numerous health benefits of a vegetarian diet, there are also risks
associated. The nutrients of concern in the diet of vegetarians include vitamin B12, vitamin D,
omega-3 fatty acids, calcium, iron, and zinc (Craig, 2010). According to Nutrition Concerns and
Health Effects of Vegetarian Diets (2010), a vegetarian diet can meet current recommendations
for all of the nutrients listed previously, however the use of supplements and fortified foods may
provide a “useful shield” against deficiency (Craig, 2010).
Vitamin D plays an important role in bone health, immune function, reduction of
inflammation, and reducing the risk of chronic diseases (Craig, 2010). Vitamin D insufficiency
has also been linked to a wide variety of diseases including type 1 diabetes. The main sources of
vitamin D include fatty fish, tuna, mackerel, fortified foods such as orange juice and dairy,
cheese, liver, and egg yolks (National Institutes of Health [NIH], 2016a). These foods are mostly
excluded from vegan and vegetarian diets and supplementation is generally recommended.
Vitamin B12 is essential for DNA and RNA synthesis and is important in maintaining
functional nerve cells (Ehrlich, 2015). Severe deficiency of vitamin B12, which can occur in
vegans and vegetarians if the diet is inadequately planned, may lead to long-term nerve damage
(Ehrlich, 2015). Food sources of vitamin B12 are all animal-based products, such as liver, fish,
beef, milk, yogurt, and eggs (National Institutes of Health, 2016b).
Plant-Based Diets and Type 2 Diabetes Mellitus
As with most scientific trials, methodologies are often varying and therefore may produce
varying results. Studies related to the effects of plant-based diets on diabetes are no exception.

18
However, most recent studies highlight the benefits of adopting a plant-based diet for diabetics
and people at risk for developing diabetes.
Plant-Based Diets and Prevention of T2DM
One of the most notable studies for examining the prevention and development of T2DM
based on diet is the follow up to the Adventist Health Study-2 (Tonstad et al., 2013). The
Adventist Health Study-2 began in 2002 as a prospective study conducted among Adventist
church members in the US and Canada with the purpose of investigating the role of foods in
regard to various forms of cancer (Tonstad et al., 2013).
In the study conducted by Tonstad, et al. (2013), participants (15,200 men and 26,187
women) were grouped as vegan, lacto-ovo vegetarian, pescetarian, semi-vegetarian, or non-
vegetarian as the reference group. A follow-up questionnaire after two years in the initial study
elicited information on the development of diabetes (type 1 or 2 was not specified).
From these results, cases of diabetes developed in 0.54% of vegans, 1.08% of lacto-ovo
vegetarians, 1.29% of pescetarians, 0.92% of semi-vegetarians, and 2.12% of non-vegetarians.
The odds ratio (OR) for diabetes among vegans was 0.383 (95% CI 0.233, 0.629), lacto-ovo-
vegetarians, 0.635 (95% CI: 0.511, 0.789), pescetarians, 0.791 (95% CI 0.572, 1.095), and semi-
vegetarians, 0.477 (95% CI 0.277, 0.722) compared to the non-vegetarian reference group
(Tonstad et al., 2013).
In the final model, adjustment was made for age, BMI, lifestyle, and sociodemographic
factors including gender, ethnicity, income, and education. Vegan, lacto-ovo, and semi-
vegetarian diets were associated with a lower incidence of diabetes, while pescetarian diets were
not associated with lower incident (Tonstad et al., 2013) Table 2 includes the study’s data.

19
The main finding of this study was that vegan, lacto-ovo, and semi-vegetarian diets were
associated with a statistical reduction in risk of diabetes compared to non-vegetarian diets, after
adjusting for BMI and sociodemographic and lifestyle factors (Tonstad et al., 2013). In the study,
there appeared to be an incremental protection as dietary pattern moved from non-vegetarian to
semi-vegetarian to pescatarian to lacto-ovo vegetarian to vegan (Tonstad et al., 2013). The vegan
diet appeared to afford the greatest protection against the development of diabetes, although the
authors warn that the vegan results should be interpreted with care because there were only a
small number of vegans who developed diabetes (Tonstad et al., 2013).
The study further notes that part of the protection associated with vegetarian diets may be
due to the lower BMI of vegetarians compared to non-vegetarians (Tonstad et al., 2013).
Plausible mechanisms have been proposed to explain the protection associated with vegetarian
diets. Fruits and vegetables may contribute to a decreased incidence of T2DM through their low
density, low glycemic load, and high fiber and micronutrient content. Other features of the
vegetarian diet consist of whole grains and legumes which have been shown to improve
TABLE 2. Multiple logistic regression analysis of the relation between diet and diabetes in the total population (n = 41,387).
Adapted from Tonstad et al., (2013).

20
glycemic control, slow the rate of carbohydrate absorption, therefore decreasing the risk of
diabetes (Tonstad et al., 2013).
Strengths of the study include that data were collected prospectively in a well-designed,
established cohort study, which minimizes recall bias. Study results were strengthened due to
measurement of several well-known confounders for diabetes, and after accounting for the
confounders, the associations still remained strong (Tonstad et al., 2013).
Limitations of the study also must be considered when interpreting these findings.
Because screening for blood glucose was not feasible for the large cohort, under-diagnosing of
diabetes is likely. The data are also self-reported, however, the researchers attempted to assess
the consistency of self-reports of diabetes. They confirmed consistency in 97.4% of those who
reported diabetes (Tonstad et al., 2013). Additionally, dietary measurement error is inevitable
and may have resulted in some misclassification. The vegetarian diet was also positively
associated with some lifestyle-related factors (such as physical activity) and inversely associated
with others (smoking), and residual confounding may have remained after adjustment due to
inaccurate measurements (Tonstad et al., 2013).
Plant-Based Diets and Management of T2DM
Most of the studies delving into T2DM and plant-based diets focus on the management of
the disease rather than the prevention. The following studies all identify various relationships
with plant-based diets and their effect on blood glucose control, hemoglobin A1C, and body
weight, all of which are correlated to management of T2DM.
Low-fat Vegan and Vegetarian Diet Studies. Multiple studies have looked into the effects of
plant-based diets on blood glucose control. In the study conducted by Nicholson et al. (1999), the
researchers investigated whether glycemic and lipid control in patients with non-insulin-

21
dependent diabetes (NIDDM) can be significantly improved using a low-fat vegan diet.
Specifically, they intended to see the effects in the absence of recommendations regarding
exercise or other lifestyle changes (Nicholson et al., 1999).
Table 3 indicates that eleven subjects with NIDDM were recruited from the Georgetown
University Medical Center and local community were randomly assigned to a low-fat vegan diet
(n = 7) or a conventional low-fat diet (n = 4) for 12 weeks of intervention (Nicholson et al.,
1999). The researchers note that two additional subjects assigned to the control group failed to
complete the study, and that data were not included in the analysis (Nicholson et al., 1999).
The inclusion criteria for the study were non-insulin-dependent diabetes mellitus, age
greater than 25 years, willingness to attend all components of the study, and residence within
commuting distance of Georgetown University (Nicholson et al., 1999). Exclusionary criteria
included smoking, regular alcohol use, current or past drug abuse, pregnancy, psychiatric illness,
and medical instability (Nicholson et al., 1999). Each subject then completed a medical history
and physical examination, and laboratory specimens were collected for fasting serum glucose
and hemoglobin A1C, among a few other measures irrelevant to this review.
TABLE 2. Baseline Demographic and Clinical Characteristics
From Nicholson et al., (1999).
TABLE 3. Baseline Demographic and Clinical Characteristics

22
The low-fat vegan diet excluded animal products, added oils, sugars, and refined
carbohydrates. The dietary analysis indicated that 10-15% of calories were from protein, <10%
of total calories were from fat, and the remaining calories (~75-80%) were from unrefined
complex carbohydrates (Nicholson et al., 1999). The cholesterol content of the diet was zero. A
vitamin B12 supplement was recommended for subjects planning to continue the diet after the
study’s conclusion, but was not mandatory for the study. The control diet emphasized the use of
fish and poultry, rather than red meat. It was designed to derive 55-60% total calories from
carbohydrate and <30% of calories from fat. Protein intake accounted for ~15% of the diet
(Nicholson et al., 1999). The cholesterol content of the diet was approximately 200mg/day.
During the course of the 12-week study, subjects in both groups were offered prepared
lunch and dinner meals conforming to their respective diets (Nicholson et al., 1999). Also of
importance to the study design is that the diets were not designed to be isocaloric. Participants
were responsible for preparing their own breakfast and were free to add any desired quantities of
foods to their diets at any time of day without caloric restriction, provided they adhered to the
prescribed guidelines (Nicholson et al., 1999). Subjects completed a 3-day dietary record,
including two weekdays and one weekend day, at baseline and 12 weeks. This record served as a
qualitative representation of nutrient intake. The study also included support groups, educational
sessions, and shared meals (Nicholson et al., 1999).
Fasting serum glucose was measure at baseline and biweekly thereafter using an Abbott
Spectrum analyzer, and hemoglobin A1C (HgA1C) was assayed at baseline and 12 weeks using
affinity chromatography (Nicholson et al., 1999). As shown in Table 4, baseline diets were
similar for the two groups. During the course of the study, fat, cholesterol, and protein intakes
decreased substantially for the experimental group, while carbohydrate and fiber intake increased

23
(Nicholson et al., 1999). In the control group, total fat intake remained unchanged, fiber intake
increased, and cholesterol intake decreased (Nicholson et al., 1999).
Additionally, fasting serum glucose values dropped 28% from baseline to the intervention
mean for the experimental group, compared to a 12% decrease in the control group (Nicholson,
et al., 1999). The effect of diet on HgA1C was insignificant. Furthermore, the differences in
weight between baseline and 12 weeks was significant: the experimental group lost an average of
7.2kg over 12 weeks, compared to a mean weight loss of 3.8 kg in the control group (Nicholson
et al., 1999). All of these values are highlighted in Table 5.
TABLE 4. Dietary Characteristics of experimental and control groups at baseline and 12 weeks after intervention
TABLE 5. Clinical Changes from Baseline to 12 Weeks
Adapted from Nicholson et al., (1999).
From Nicholson et al., (1999).

24
Despite the small sample size of this study, the differences between the treatment groups
in the reductions of fasting serum glucose and body weight reached statistical significance
(Nicholson et al., 1999). Additionally, the 7.2kg weight loss experienced by the experimental
group was achieved with no attempt to limit energy intake (Nicholson et al., 1999). The results
of this study are limited by its small sample size and by the fact that the participants may have
been more motivated than other people with diabetes because they volunteered to enroll as study
participants. In summary, the researchers found that use of a low-fat vegan diet was associated
with reductions in fasting serum glucose concentrations and body weight in a 12-week trial
(Nicholson et al., 1999).
The Nicholson study focused on a small cohort for a relatively short duration of
intervention, however, a study similar in methodology, conducted by Barnard et al. (2009),
focused on a larger cohort (n = 99) for 74 weeks. The study intended to compare the effects of a
low-fat vegan diet and conventional diabetes diet recommendations on glycemia, weight, and
plasma lipids (Barnard et al., 2009). Individuals with type 2 diabetes, defined by a fasting blood
glucose concentration >125 mg/dL on two occasions or a prior diagnosis of T2DM treated with
medications for blood glucose control for ³6 months, in the Washington D.C. area were recruited
to complete the study. Exclusionary criteria were a HgA1C <6.5% or >10.5%; use of insulin for
>5 y; smoking, alcohol, or drug abuse; pregnancy; unstable medical status; and current use of a
low-fat vegetarian diet. Hemoglobin A1C was measured with affinity chromatography (Barnard
et al., 2009).
Study participants prescribed a vegan diet (n = 49) were asked to avoid animal products,
“fatty foods” (such as added oils, fried foods, avocados, nuts, and seeds), and favor low-
glycemic index foods, such as beans and green vegetables (Barnard et al., 2009). The vegan diet

25
also obtained ~10% energy from fat, 15% from protein, and 75% from carbohydrate and was
unrestricted on energy intake (Barnard et al., 2009). Conversely, the conventional diabetic diet
was about 15-20% total calories from protein, <7% saturated fat, and 60-70% carbohydrate, and
was individualized based on body weight and blood lipid concentrations (Barnard et al., 2009).
All participants were free living and no meals were provided, but a vitamin B12 supplement was
provided for all participants to be taken every other day (Barnard et al., 2009).
At seven points during the trial, a registered dietitian made unannounced phone calls to
each participant to administer a 24-hour diet recall using a multiple-pass approach (Barnard et
al., 2009). Additionally, multiple 3-day dietary records were completed by each participant using
two weekdays and one weekend day.
From the data, both diets were associated with significant sustained weight reduction (-
4.4kg in the vegan group and -3.0 kg in the conventional diet group) (Barnard et al., 2009).
Furthermore, both diets were associated with reductions in HgA1C. The mean change was
slightly but not significantly greater in the vegan group (Barnard et al., 2009). Among
participants in the vegan group with no changes to diabetes medications, HgA1C had fallen 1.23
by 22 weeks (n = 24) and 0.82 by 74 weeks (n =14) (Barnard et al., 2009). Among medication-
stable participants in the conventional diet group, the HgA1C reduction was 0.38 at 22 weeks (n
= 33) and 0.21 (n = 21) at 74 weeks (Barnard et al., 2009). The study’s authors concluded that
much of the effect of the intervention diets on glycemia appear to be mediated by weight
reduction (Barnard et al., 2009).
The strengths of this study include its randomized design, extended duration, inclusion of
individuals with long-standing diabetes, analysis of dependent measures without regard to
variations in dietary adherence, statistical methods aimed at reducing the effect of medication

26
changes, and applicability outside the research setting (Barnard et al., 2009). The researchers
also considered the study’s weaknesses: changing of medication for diabetics and a smaller
sample size due to limiting analysis to those with no medication changes (Barnard et al., 2009).
In conclusion, individuals with T2DM participating in the study, both low-fat vegan diets and
conventional diabetes diets based on the 2003 ADA guidelines facilitated long-term weight
reduction (Barnard et al., 2009). In analyses controlling for medication changes, the vegan diet
appeared to be more effective for control of blood glucose (Barnard et al., 2009).
The two previous studies highlighted the effects of low-fat vegan diets on T2DM. The
following study compares the effects of a calorie-restricted vegetarian diet and conventional
diabetic diets on subjects with T2DM. In the study conducted by Kahleova et al. (2010), the
researchers directed a 24-week, randomized control trial in which 74 participants with T2DM
were assigned to either the experimental group following a vegetarian diet (n = 37), or the
control group following a conventional diabetic diet (n = 37). Inclusionary criteria were a
diagnosis of T2DM, age 30-70 years, HgA1C between 6-11%, BMI between 25-53 kg/m2, and
willingness to change dietary habits and follow a prescribed exercise program (Kahleova et al.,
2010). Exclusion criteria were HgA1C <6% or >11%, use of insulin, abuse of alcohol or drugs,
pregnancy, lactation, or current use of vegetarian diet (Kahleova et al., 2010).
Both of the study’s diets were designed to be isocaloric and calorie restricted (-500
kcal/day), with calorie intakes based on the measurement or resting energy expenditure of each
subject by indirect calorimetry (Kahleova et al., 2010). In the latter half of the study, the diets
were combined with aerobic exercise. The researchers also incorporated educational sessions to
teach the participants how to compose and prepare their diet, in addition to attending weekly one
hour meetings with lectures and cooking classes (Kahleova et al., 2010). Of note, all meals

27
during the study were provided, and participants were examined at baseline, 12 weeks, and 24
weeks (Kahleova et al., 2010).
The vegetarian diet consisted of ~60% energy from carbohydrates, 15% protein and 25%
fat and focused mostly on including vegetables, grains, legumes, fruits and nuts. Animal
products were limited to a maximum of one portion of low-fat yogurt a day (Kahleova et al.,
2010). This criterion allows for the diet to be classified as vegan since dairy was not heavily
emphasized. The conventional diabetes diet was administered according to the dietary guidelines
of the Diabetes and Nutrition Study Group (DNSG) of the European Association for the Study of
Diabetes (EASD) (Kahleova et al., 2010). The diet contained 50% total energy from
carbohydrates, 20% protein, <30% fat (£7% saturated fat, <200 mg/day of cholesterol)
(Kahleova et al., 2010). The vegetarian meals were provided in two vegetarian restaurants,
whereas the conventional diabetic diet meals were provided at the Institute for Clinical and
Experimental Medicine in Prague. Vitamin B12 was supplemented in both the experimental
group and the control group (50 µg/day) (Kahleova, et al., 2010).
During the first 12 weeks of the study, participants were asked not to alter their exercise
habits, but from weeks 13-24, they were prescribed an individualized exercise plan based on
their history of physical activity and initial examination (Kahleova et al., 2010). Additionally,
participants were asked to continue their pre-existing medication regimens, except when
hypoglycemia occurred repeatedly (Kahleova et al., 2010). In such cases, medications were
reduced by a study physician (Kahleova et al., 2010). All participants were given an Accu-Chek
Go glucometer and were instructed on how to use it. All measurements (plasma glucose, insulin,
c-peptide, HgA1C, plasma lipids) were performed at 0. 12, and 24 weeks on an outpatient basis,

28
after 10- to 12-h overnight fasting with only tap water allowed ad libitum (Kahleova et al.,
2010).
Ninety-two percent of the participants completed the first 12 weeks (95% in experimental
groups and 89% in control group); 84% of participants in each group completed all 24 weeks
(Kahleova et al., 2010). Adherence to the prescribed diet at 24 weeks was high among 55%
participants in the experimental group and 32% in the control group (Kahleova et al., 2010).
Diabetes medication was reduced in cases of repeated hypoglycemia in 43% of participants in
the experimental group and in 5% of participants in the control group (P < 0.001); the difference
between groups was 38% (95% CI 17-58%) (Kahleova et al., 2010).
Additionally, HgA1C fell in both groups during the first 12 weeks (P < 0.001) and
remained reduced after implementation of the exercise program in weeks 13-24 (Kahleova, et al.,
2010). The decrease from baseline to 24 weeks, however, was significant only in the
experimental group (-0.65 ±1%; P = 0.002 vs -0.21 ± 1.1%); and not significant in the control
group. The difference between groups was not statistically significant (Kahleova et al., 2010).
Among participants whose diabetes medications remained unchanged, HgA1C fell by 0.9% in
the experimental group from baseline to 24 weeks (P = 0.002) versus a non-significant decrease
of 0.2% in the control group (P= 0.08) (Kahleova et al., 2010).
Furthermore, body weight decreased in both groups in response to the dietary
interventions (P < 0.001) and it was maintained after the addition of exercise. Weight loss was
greater in the experimental group than in the control group [-6.2 kg (95% CI -6.6 to -5.3) versus
-3.2kg (95% CI -3.7 to -2.5)] (Kahleova et al., 2010). Waist circumference also decreased in both
groups in response to the dietary interventions (P < 0.001), more in the experimental group than
in the control group [-6.4cm (95% CI -7.1 to -5.7) versus -5.3cm (95% CI -5.9 to -4.5)]

29
(Kahleova et al., 2010). Volume of subcutaneous fat and visceral fat also decreased in both
groups after the dietary interventions (P < 0.001), and further decreased in the experimental
group after addition of exercise [4% (95% CI -5.8 to -0.2)] whereas it remained unchanged in the
control group (P = 0.007) (Kahleova et al., 2010).
The study’s authors concluded that a calorie-restricted vegetarian diet increased insulin
sensitivity, reduced body weight, and improved plasma concentrations of adipokines and
oxidative stress markers (two values that were measured in the study, but are not directly
relevant to this literary analysis). The researchers hypothesize that the advantageous effects of a
vegetarian diet may be partly explained by weight loss, especially loss of visceral fat and the
consequent increase in insulin sensitivity (Kahleova et al., 2010).
This study highlights the benefits of two calorie restricted diets, especially noting the
benefits of the vegetarian diet. These benefits may be explained by several possible mechanisms:
higher intake of fiber, lower intake of saturated fat (and higher polyunsaturated and saturated
fatty acid ratio), higher intake of non-heme iron and reduction in iron stores, higher intake of
vegetable protein in place of animal protein, high intake of antioxidants and plant sterols
(Kahleova et al., 2010).
The strengths of this study include the parallel design (in which all participants started
simultaneously), providing all meals for participants, relatively long study duration, and the
measurement of several metabolic variables with results applicable outside of the research setting
(Kahleova et al., 2010). There are limitations to the study design as well: small sample size and
low adherence to diet in control group (Kahleova, et al., 2010).
In conclusion, the results of the study indicate that a vegetarian diet alone or in
combination with exercise is more effective in increasing insulin sensitivity, reducing volume of

30
visceral fat and improving plasma concentrations of adipokines and oxidative stress markers than
a conventional diabetic diet with or without the addition of exercise (Kahleova et al., 2010).
Lastly, the researchers suggest that vegetarian diets may provide a beneficial alternative for
nutritional therapy in T2DM, especially in combination with aerobic exercise (Kahleova et al.,
2010).
Summary and Suggestions for Future Research
Diabetes is a growing pandemic. The rates of prevalence have been increasing for the last
70 years, and there is no indication that they will slow down any time soon (Ardisson, et al.,
2014). Type 2 diabetes is largely attributable to lifestyle choices and behavioral practices that
result in obesity, lack of physical activity, and undesirable food choices related to food and
nutrition knowledge deficit. Behavior modification may be a starting point for management of
T2DM, but the constructed modern environment does not allow for healthy choices to be the
easy choices. A variety of research, however, is being conducted on the prevention and
management of T2DM, especially relating to vegetarian diets.
From recent analysis, vegetarian diets may be viable options for certain individuals in
reducing the risk of and managing diabetes. The studies evaluated in this review focused on
mostly low-fat vegan diets that were implemented in a variety of populations either as part of a
randomized, controlled trial, or a retrospective analysis. With relatively large sample sizes and
applicability outside of the research setting, the results from the studies indicate that low-fat
vegan and vegetarian diets maintain or improve certain biomarkers—such as HgA1C, blood
glucose, insulin sensitivity, and body weight—all of which pertain to diabetes.
These results, however, do not mean that following a vegetarian or vegan diet should be
recommended to all diabetics. Along with proper medications, exercise, and lifestyle factors,

31
adhering to a vegetarian diet may aid in managing the disease. Further evidence is needed in
order to recommend a low-fat vegetarian or vegan diet as the most beneficial eating pattern for
individuals with diabetes. Longer duration trials (> 52 weeks) that have a sample size of at least
100 participants may be beneficial in applying the results to the population at large. Furthermore,
some recent studies include exercise as part of the intervention, which has been shown to
increase insulin sensitivity (Kahleova, et al., 2010). More high-quality studies that reduce the
effect of confounding variables would be beneficial in ascertaining the direct link between diet
and disease state. Additional funding for plant-based diet-related research and the effects on
diabetes would be valuable in order to make further dietary recommendations for individuals
afflicted with the disease.

32
References
American Diabetes Association. (2015). The Cost of Diabetes. Retrieved from
http://www.diabetes.org/advocacy/news-events/cost-of-diabetes.html
Ardisson-Korat, A., Hu, F., & Willett, W. (2014). Diet, lifestyle, and genetic risk factors for type
2 diabetes: a review from the Nurses’ Health Study, Nurses’ Healthy Study 2, and Health
Professional’s Follow-up Study. Current Nutrition Reports, 3(4): 345-354. doi:
10.1007/s13668-014-0103-5.
Barnard, N., Cohen, J., Jenkins D., Turner-McGrievy, G., Gloede, L., Green, A., & Ferdowsian,
H. (2009). A low-fat vegan diet and a conventional diabetes diet in the treatment of type
2 diabetes: a randomized, controlled, 74-week clinical trial. American Journal of Clinical
Nutrition, 89(supplement): 1588S-96S. doi: 10.3945/ajcn.2009.26736H.
Beerman, K., & McGuire, M. (2014). [Figure illustration of insulin’s role in glucose uptake
Figure 4-19, page 147]. Nutritional Sciences: From Fundamentals to Food 2e. Retrieved
from Papathakis Diabetes Mellitus PowerPoint.
Centers for Disease Control and Prevention Division of Diabetes Translation. (2016, April).
Long-term Trends in Diabetes. Retrieved from
https://www.cdc.gov/diabetes/statistics/slides/long_term_trends.pdf
Centers for Disease Control and Prevention. (2014). Diagnosed Diabetes. Retrieved from
https://gis.cdc.gov/grasp/diabetes/DiabetesAtlas.html
Craig, WJ. (2010). Nutrition Concerns and Health Effects of Vegetarian Diets. Nutrition in
Clinical Practice 25(6): 613-620. doi: 10.1177/0884533610385707.
Devlin JT, Hirshman M, Horton ED, Horton ES: Enhanced peripheral and splanchic insulin
sensitivity in NIDDM after single bout of exercise. Diabetes 36:434–439, 1987

33
Duncan GE, Perri MG, Theriaque DW, Hutson AD, Eckel RH, Stacpoole PW: Exercise training,
without weight loss, increases insulin sensitivity and postheparin plasma lipase activity in
previously sedentary adults. Diabetes Care 26:557–562, 2003
Ehrlich, S. (2015). Vitamin B12 (Cobalamin). University of Maryland Medical Center. Retrieved
from http://umm.edu/health/medical/altmed/supplement/vitamin-b12-cobalamin
Goodyear LJ, Kahn BB: Exercise, glucose transport, and insulin sensitivity. Annu Rev Med
49:235–261, 1998
Gropper, S., Groff, J., & Smith, J. (2009). Advanced Nutrition and Human Metabolism 5e.
Canada: Wadsworth Cengage Learning.
Harvard Women’s Health Watch. (2016). Becoming a Vegetarian. Retrieved from
http://www.health.harvard.edu/staying-healthy/becoming-a-vegetarian
JDFR. (2017). Type 1 Diabetes Facts. Retrieved from http://www.jdrf.org/about/fact-
sheets/type-1-diabetes-facts/
Kahleova, H., Matoulek, M., Malinska, H., Oliyarnik, L., Kazdova, T., Neskudla, T., Skoch, A.,
Hajek, M., Hill, M., Kahle, M., & Pelikanova, T. (2010). Vegetarian diet improves
insulin resistance and oxidative stress markers more than conventional diet in subjects
with Type 2 diabetes. Diabetic Medicine. doi: 10.1111/j.1464-5491.2010.03209.x
Khardoi, R. (2017). Diabetes Mellitus Treatment & Management. Medscape. Retrieved from
http://emedicine.medscape.com/article/117853-
treatment?pa=HJIYhcJyENHtFq1V%2FzhrC6QkqMRkFToFZ%2FGZM4x4zLbnzrG%2
FOSWGFTG4wmIFsJiFMvDjorZtwtkZj%2BRg7nkQlvEiL5fM42L%2B9xlMlua7G1g%
3D

34
Khazrai, Y., Defeudis, G., & Pozzilli, P. (2013). Effect of diet on type 2 diabetes mellitus: a
review. Diabetes/Metabolism Research and Reviews 30(Suppl. 1): 24-33. doi:
10.1002/dmrr.2515.
Li, Duo. (2013). Effect of the vegetarian diet on non-communicable diseases. Journal of the
Science of Food and Agriculture 94: 169-173. doi: 10.1002/jsfa.6362.
Lister Hill National Center for Biomedical Communications. (2017). Type 1 Diabetes. Genetics
Home Reference. Retrieved February 13, 2017 from
https://ghr.nlm.nih.gov/condition/type-1-diabetes
Mason, C., Foster-Schubert, K., Imayama, I., Kong, A., Xiao, L., Bain, C., Campbell, K., Wang,
C., Duggan, C., Ulrich, C., Alfano, C., Blackburn, G., McTiernan, A. (2011). Dietary
weight-loss and exercise effects on insulin resistance in postmenopausal women.
American Journal of Preventative Medicine 41(4): 366-375. doi:
10.1016/j.amepre.2011.06.042
National Institutes of Health. (2016a). Vitamin D. Fact Sheet for Health Professionals. Retrieved
from https://ods.od.nih.gov/factsheets/VitaminD-HealthProfessional/#h3
National Institutes of Health. (2016b). Vitamin B12. Fact Sheet for Health Professionals.
Retrieved from https://ods.od.nih.gov/factsheets/VitaminB12-HealthProfessional/#h3
National Institute of Diabetes and Digestive and Kidney Diseases. (2017a). Risk Factors for
Type 2 Diabetes. Retrieved from https://www.niddk.nih.gov/health-
information/diabetes/overview/risk-factors-type-2-diabetes
National Institute of Diabetes and Digestive and Kidney Diseases. (2017b). Managing Diabetes.
Retrieved from https://www.niddk.nih.gov/health-
information/diabetes/overview/managing-diabetes

35
Nelms, M., Sucher, K., Lacey, K. (2016). Nutrition Therapy and Pathophysiology 3e. United
States of America: Cengage Learning.
Nicholson, A., Sklar, M., Barnard, N., Gore, S., Sullivan, R., & Browning, S. (1999). Toward
Improved Management of NIDDM: A Randomized, Controlled, Pilot Intervention Using
a Lowfat, Vegetarian Diet. Preventive Medicine, 29, 87-91.
Papathakis, P. (2016a). Diabetes Mellitus [PowerPoint slides]. Retrieved from PolyLearn.
Papathakis, P. (2016b). Type II Diabetes Mellitus [PowerPoint slides]. Retrieved from
PolyLearn.
PubMed Health. (2017). Type 2 Diabetes. Retrieved from
https://www.ncbi.nlm.nih.gov/pubmedhealth/PMHT0024703/
Ross, R. (2003). Does exercise without weight loss improve insulin sensitivity? Diabetes Care.
Retrieved from http://care.diabetesjournals.org/content/26/3/944#ref-12
Seventh-Day Adventist Church. (2017). Living a healthful life. Vitality Health. Retrieved from
https://www.adventist.org/en/vitality/health/
Sitija, A., Bhupathiraju, S., Rimm, E., Spiegelman, D., Chiuve, S., Borgi, L., Willett, W.,
Manson, J., Sun, Q., & Hu, F. (2016). Plant-Based dietary patterns and incidence of type
2 diabetes in US men and women: results from three prospective cohort studies. Public
Library of Science Medicine 13(6): e1002039. doi: 10.1371/journal.pmed.1002039.
Spero, D. (2016). What is a normal blood sugar? Diabetes Self-Management. Retrieved from
https://www.diabetesselfmanagement.com/blog/what-is-a-normal-blood-sugar-level/
Swidorski, D. (2014). Diabetes History. Retrieved from http://www.defeatdiabetes.org/diabetes-
history/

36
Tonstad, S., Stewart, K., Oda, K., Batech, M., Herring, R.P., & Fraser, G.E. (2013). Vegetarian
diets and incidence of diabetes in the Adventist Health Study-2. Nutrient Metabolism and
Cardiovascular Disease, 23(4): 292-299. doi: 10.1016/j.numed.2011.07.004
World History of Vegetarianism. (2016). The Vegetarian Society of the United Kingdom Limited.
Retrieved from https://www.vegsoc.org/page.aspx?pid=830