the effects of privatization on firms and on social … cataloging-in-publication data provided by...
TRANSCRIPT

Inter-American Development BankBanco Interamericano de Desarrollo
Latin American Research NetworkRed de Centros de Investigación
Research Network Working Paper #R-456
The Effects of Privatization on Firms and onSocial Welfare: The Chilean Case
by
Ronald Fischer*Rodrigo Gutierrez
Pablo Serra*
*Universidad de Chile
May 2003

ii
Cataloging-in-Publication data provided by the Inter-American Development Bank Felipe Herrera Library
The effects of privatization on firms and on social welfare : the Chilean case / by R.Fischer, R. Gutierrez, P. Serra.
p. cm. (Research Network Working papers ; R-456)Includes bibliographical references.
1. Privatization--Chile--Economic aspects. 2. Privatization--Chile--Social aspects. I.Fischer, Ronald. II. Gutierrez, Rodrigo. III. Serra, Pablo. IV. Inter-AmericanDevelopment Bank. Research Dept. V. Latin American Research Network. VI. Series.
338.61 E344--dc21
©2003Inter-American Development Bank1300 New York Avenue, N.W.Washington, DC 20577
The views and interpretations in this document are those of the authors and should not beattributed to the Inter-American Development Bank, or to any individual acting on itsbehalf.
This paper is part of the Latin American Research Network project “Costs and Benefits ofPrivatization in Latin America.” The terms of reference for the project can be found on theinternet at: http://www.iadb.org/res/laresnetwork/studies/st70tor.pdf
The Research Department (RES) produces a quarterly newsletter, IDEA (Ideas forDevelopment in the Americas), as well as working papers and books on diverse economicissues. To obtain a complete list of RES publications, and read or download them pleasevisit our web site at: http://www.iadb.org/res

iii
Abstract
This study analyzes the Chilean privatization process. As it has been a wide-rangingundertaking, we perform an analysis of several industries. After a historic review of theprivatization process, we examine the 37 Chilean state-owned enterprises (SOEs) that wereprivatized from 1981-2000 and for which pre-privatization and post-privatization financial,employment and production data are available. We find that privatized firms enjoyedsignificant improvements in efficiency, but that these gains were no different than thoseexperienced by other private firms in their respective economic sectors. This allows us toconclude that Chilean SOEs were efficient before privatization. In terms of profitability,privatized firms in the regulated sector enjoyed particularly sizeable gains. In fact,employment in those firms increased after privatization, suggesting that they were notoverstaffed under government control. We also show that the profitability in the regulatedsector is due to the more efficient use of physical capital and to the fact that the regulatorswere unable to transfer increased profits to consumers. Next, we examine the effects of theprivatization of social services. We analyze in detail the effects of privatization on theperformance of the telecommunications and electric sectors. We find confirmation of thefact that in the regulated, natural monopoly sectors profits have increased, whereas incompetitive sectors profits have been lower. Nevertheless, regulated firms are fairlyefficient, implying that incentive regulation has been successful. Another dimension of theprivatization process involved infrastructure, successfully franchising the main highwaysand ports. The resultant benefits in terms of reduced transportation costs will increase theefficiency of the economy as a whole. Next we study the effects of the privatization of thepension, health insurance and education systems. We find that privatizing the pensionsystem has been beneficial as pensions can no longer be expropriated by the politicalsystem, and though the system is expensive, costs have fallen lately. The privatization ofthe health insurance system has faced challenges due to the information asymmetries thatplague the industry, but it has had the beneficial effect of exposing inefficiencies in thepublic system and thus creating demand for improvement. Similarly, though theintroduction of school vouchers has not been shown unequivocally to have led to a bettereducation system (though there is some evidence that this is so), it has put pressure on thepublic system to improve. Vouchers would be more effective if parents were informed ofthe results of their children on standardized tests and if public schools were able to dismissbad teachers. Finally, increased competition in higher education has led to improvements inthe quality of the traditional state-financed institutions and to a large increase in thecoverage of higher education.
JEL: L33Keywords: Privatization, Chile.
Corresponding authors: R. Fischer at [email protected] and P. Serra at [email protected]. We wish to
thank Florencio López-de-Silanes for many helpful comments. We also thank Pablo González for assistancewith the analysis of educational reform. Manuel Cruzat and Ángel Gajardo were most helpful in providingdata for Fepasa and Ferronor, respectively.

iv
TABLE OF CONTENTS
1 Introduction 11.1 Privatization of SOEs ........................................................................................................... 31.2 Privatization of Regulated Sectors ....................................................................................... 6
1.2.1 Privatization of Utilities ............................................................................................. 61.2.2 The Privatization of Infrastructure ............................................................................. 71.2.3 The Privatization of Social Services .......................................................................... 8
2 The Performance of Privatized Firms 102.1 A Brief History of the Privatization of Public Enterprises ................................................. 10
2.1.1 The Era of State Intervention ................................................................................... 102.1.2 The First Round of Privatization .............................................................................. 132.1.3 The Crisis of the Early 1980s ................................................................................... 152.1.4 The Privatization of the Historic SOEs (1985-89) ................................................... 182.1.5 Privatization during the 1990s ................................................................................. 19
2.2 Data on Privatized Chilean Firms ....................................................................................... 222.2.1 Data Problems .......................................................................................................... 232.2.2 Treatment of Mergers and Divestitures .................................................................... 252.2.3 Data Adjustments ..................................................................................................... 25
2.3 Effects of Privatization on Chilean Firms .......................................................................... 262.3.1 Profitability .............................................................................................................. 262.3.2 Efficiency ................................................................................................................. 282.3.3 Assets and Investment .............................................................................................. 292.3.4 Productivity .............................................................................................................. 292.3.5 Employment ............................................................................................................. 30
3 Privatization of Regulated Sectors 313.1 The Efficiency of Privatized Utilities ................................................................................. 31
3.1.1 The Privatization Process ......................................................................................... 313.1.2 The Regulatory Framework ..................................................................................... 343.1.3 Evaluation of Privatization in the Regulated Sectors ............................................... 38
3.2 Infrastructure Franchises .................................................................................................... 513.3 Highways and Airports ....................................................................................................... 533.4 Concessions for Port Management and Operation ............................................................. 60
4 Privatization of Social Services 644.1 The Privatization of the Pension System ............................................................................ 65
4.1.1 Evaluation of the Private Pension Fund System ...................................................... 664.2 The Health Insurance System ............................................................................................. 70
4.2.1 An Evaluation of the Private Health Insurance System ........................................... 734.3 Public Education and School Vouchers ............................................................................... 75
4.3.1 An Evaluation of the Reform ................................................................................... 784.3.2 Tertiary Education .................................................................................................... 81
5 Conclusions 83
6 Appendix 93

1. Introduction
The object of this paper is to evaluate the effects of privatization on the efficiency of firms and
institutions in Chile. In the current worldwide trend toward privatization, Chile was one of the
first countries—if not the first—to embark on a privatization program. One of the chief
characteristics of the Chilean privatization process is that it has been all-encompassing. In the
three decades that followed the fall of the government of the socialist President Salvador Allende
(12/1970–9/1973), all the banks and firms that had been acquired or expropriated by the Allende
administration were either privatized or liquidated. Farms that had been expropriated since the
agrarian reform of 1965 were privatized, as well as a majority of the firms that were government-
owned before December 1970.
The military government also privatized the pension system and a part of the health
insurance system. It promoted vouchers for subsidized private schools and allowed free entry of
new institutions into tertiary education (university and other post-high school education). Finally,
the private sector improved or built and undertook the operation of most large infrastructure
projects such as highways, seaports, airports, water reservoirs and even jails. In addition, in a bid
to decentralize government, local governments (municipalities) became responsible for the
lowest level of the public health care system as well as for public schooling.
The privatization effort has been part of a much wider process of economic liberalization
that Chile initiated in 1974. The process represents a major reversal of the policies the country
had followed since the forties, which were characterized by the increasing participation of the
state in the economy (see Galetovic, 1998). In the pre-1974 period, the state played a role not
only through the public firms, but also via regulations and other mechanisms. The government
would set interest rates and exchange rates, as well as regulating almost 3,000 prices for goods
and services. As part of its import substitution strategy, the state protected those sectors deemed
essential. This meant that international trade was restricted by quantitative restrictions as well as
by high, heterogeneous tariffs. All of these mechanisms started to disappear in 1974 with the
country’s shift towards a market economy in which the price system was the main determinant of
resource allocation and the private sector was the centerpiece of the economy. Moreover, in an
effort to reduce the size of the state, many traditional supervisory activities were surrendered to
the private market: private custom agents have taken over some of the duties of the customs
office, private laboratories test new roads and the effluent from water treatment plants and
2
industry, and the courts employ private individuals to run or liquidate bankrupt companies.
Major overhauls of the tax system have simplified it and reduced tax rates.
It is possible to distinguish three main phases of the Chilean privatization process, even
though any chronological division is arbitrary. In the first phase, which covers the period 1974-
1980, 259 firms that were expropriated or illegally taken during the Allende administration were
restored to their original owners. The government also sold or liquidated an additional 118 firms
acquired in the same period (retaining 7 in that category). In addition, 34 of the 65 pre-1970
government-owned firms were also privatized or closed. Nevertheless, at the end of the decade
the government still owned 40 firms, some of them because they were considered of strategic
importance and some because there were no takers. These included all of the major telecom and
electric firms, as well as copper mining companies.
In the second phase, from 1980 to 1989, the state privatized the telecom and electric
firms as well as most of the firms previously considered strategic: the CAP steel works, the flag
carrier LAN, and other major firms. It also finished selling the last few firms that had been
acquired by the socialist government. By 1989, only 16 of the 66 firms dating from the pre-
December 1970 period were still state-owned. During this period, especially in the first years of
the decade, many activities that had been traditionally under the domain of the state, such as the
pension system, health financing and the educational system were privatized, at least partially.
The privatization of SOEs slowed down in the period 1990-2001. However, the
government sold the three main water and sewage companies and completed the privatization of
the electric sector. The distinguishing feature of this period, however, is the privatization—
through concession contracts—of infrastructure management. From 1993 onwards, the main
highways, expressways and airports have been built, maintained and operated by private
investors. The main state-owned ports were also franchised to private firms.
Most analysts ascribe the strong growth of the Chilean economy that began in 1985 (after
a severe crisis in the first half of the decade) to economic liberalization. If we accept this
premise, we may still question the specific contribution of privatization. So many systemic
changes occurred at the same time that it is difficult to evaluate the individual contribution of a
particular policy.1 Nevertheless, Larraín and Vergara (1995) suggest that the rest of the program
1 Some put the emphasis on the pension fund reform while others underscore the role of the 1984 tax reform.

3
would not have been credible in the absence of a privatization process. Moreover, privatization
was important in helping balance the budget and in developing capital markets.2 In this paper,
however, we focus on the direct effect of privatization on the efficiency of privatized sectors and
therefore do not look at the global effects on the rest of the economy.
1.1. Privatization of SOEs
The Chilean privatization of SOEs has been a long-lasting and yet unfinished process. There are
still 38 firms—most of them of economic importance—that remain in public hands. They include
ENAP, the monopoly oil refinery; Codelco, a copper mining concern that is the largest company
in Chile; ENAMI, a copper refinery; Banco del Estado, the fourth largest commercial bank; the
post office; the subway; the Chilean mint; the rail lines; the state lottery; ten ports; Zofri, the free
trade zone; and other minor companies, representing, in all, around 9% of total GDP in 1998.3
The perception that Chile has advanced farther along the privatization route than most other
countries is probably due to the fact that the bulk of traditional infrastructure and social services
have been privatized rather than to the extent to which the state has retired from the productive
sector.
As can be seen from Table 1.1, 125 firms were privatized between 1974 and 2001. Most
of these firms, however, were owned by the state for only a short time and only 65 of these
stayed long enough in public hands to count as true SOEs (see Table 2.1). Most of the firms
acquired during the socialist administration (1970-1973) were privatized by 1978, and by 1983
only one of those firms was still state-owned. At least 55 other firms controlled by the
government have been liquidated. Several of these were only viable while protected by large
tariffs and other non-tariff barriers, and thus became nonviable after the opening of the economy
(Hachette and Luders, 1994). Note also that in the period 1979-1989 many state-owned firms
were created by the breaking up of larger firms, and were later sold.
As compared to later processes (in Mexico, for instance, see La Porta and López-de-
Silanes, 1999), privatization in Chile was not transparent in its early stages. This can be
explained partially by the violent social convulsions that affected Chile in the period 1970-1982. 2 During the 1980s, taxes were reduced and the government was able to finance the transition to a private pensionsystem without going into deficit. Clearly, privatization revenues were not used to delay fiscal adjustment, ashappened in Argentina.

4
This era saw a coup overthrowing the socialist government and bringing in a dictatorship, three
large economic crises (1973, 1975 and 1982), and major structural changes in the economy.
Furthermore, policymakers explored untried policies in the absence of a free press—there is
almost no record of privatizations that took place in the 1970s. Moreover, accounting books
convey little about the value of a firm as inflation rates reached levels of more than 500% in
some years, and bookkeeping regulations were loose and not upgraded until the 1982 crisis.
Therefore, most of the usable data on privatization for Chile corresponds to the firms privatized
since the early 1980s that remained public corporations (i.e., that trade shares on the stock
market), as they were required to publish financial information. More than half of these firms
provide public services and their data are contaminated by the effects of regulation, while the
remaining firms are usually dominant in their markets, or have sizable market shares.
Table 1.1. Nationalization and Privatization of Firms
Number of Firms 1970-73 1974-78 1979-83 1984-89 1990-2001
Beginning of Period 65 179 82 45 44Acquired 113 1 0 0 0Created 1 0 10 29 12Privatized 0 70 14 27 14Liquidated 0 28 20 3 4No Information 0 0 13 0 0End of Period 179 82 45 44 38Notes:1. Does not include Pehuenche, which was privatized as a project (i.e., never
operated as a public firm).2. Includes Corporación del Cobre (Codelco).3. Includes the 10 seaports originating in the breakup of Emporchi.
The most important conclusion we draw in this section is that, contrary to other
documented cases (see La Porta and López-de-Silanes, 1999), most SOEs were fairly efficient
prior to being sold, except perhaps in the sense of overinvestment in the electric sector. As a
matter of fact, employment increased after privatization in most firms. As a result, the behavior
of privatized firms was not substantially improved by privatization and, in fact, by many
measures, investment was lower than average for their sectors after privatization. A second
conclusion is that in the case of several variables of interest, the main divide is that between 3 Shares of state-related firms in GDP were obtained from Hachette (2000).

5
firms operating in a regulated vs. a competitive market. In particular, privatized firms that face
competition have had lower profit rates, with profitabilities that are similar to those of their
respective industries, while firms in the regulated sector have had significantly higher profit rates
than the average for their industries at the 2-digit SIC level. In the case of the regulated sectors,
the effects of privatization may be due to differences in management efficiency or to the
introduction of new regulations on the sector, or to the interplay of those two factors. Thus, it is
necessary to evaluate the regulations in order to understand the impact of privatization.
1.2. Privatization of Regulated Sectors
This section analyzes the Chilean experience with privatization of regulated sectors. It focuses on
the privatization of utilities and social services that occurred in the 1980s and on the private
infrastructure franchises of the 1990s. In these sectors, the government switched from the role of
provider to the role of regulator.
Despite their obvious differences, the utilities and social services sectors share some
important characteristics. First, they face imperfect markets, with failures such as non-
convexities (leading to natural monopolies) and asymmetric information. Second, they produce
“merit” goods or services, which require that the state guarantee access to all of the population.
These privatizations are interesting not only because they represented a shift towards the private
sector; also worth studying are the policies that were introduced in order to deal with market
failures and guarantee universal access and the results—successful or not—of those measures.
Despite the many market imperfections, the military government believed that there were
benefits to be obtained by transferring property to a profit-maximizing private sector as
compared to a bureaucratic public sector. Nevertheless, the government was aware that in some
cases adequate incentives were required in order for privatization to increase welfare. For that
reason, the regulations that were introduced prior to privatization tended to promote competition
whenever it was feasible and to stimulate efficient behavior when competition was impossible.
The government believed that market discipline played an essential role in economic policy, so
much so that one of the first economic laws it introduced (in October 1973) was a thorough
revamping of antitrust legislation.

6
1.2.1. Privatization of Utilities
In this section we analyze the post-privatization performance of regulated utilities, and relate it to
regulatory legislation. We focus on the electric and telecom companies that were privatized in the
1980s.4 The gains in efficiency from privatization derive both from the differential efficiency
between the public and private management as well as from the effect of the rules and
regulations that were imposed on the sector.
During the 1980s Chile reformed and liberalized its electric and telecom sectors. The
process started in the late 1970s with the establishment of new regulatory bodies and the
introduction of new legislation in 1982, and culminated in the privatization of the major firms
between 1985 and 1989. One trait that infrastructure-based sectors share is that competitive
segments coexist with other segments that constitute a natural monopoly. Chile’s policy has been
to introduce competition wherever possible and to regulate non-competitive segments of
industry.
With respect to the Chilean electric sector, the cornerstone of the reform process was the
introduction of competition in the wholesale contract market for energy. The unbundling of
transmission services was a prerequisite for wholesale competition to survive. Thus it was
necessary to introduce the principle of open access to the transmission network. The second
major change was that investment in generation was left to market forces. It was assumed that
existing firms or potential entrants would invest in generation capacity whenever a project had a
return on capital that was commensurate with the sector’s risk. The third major regulatory
innovation was the introduction of incentive regulation to calculate the value added by the
distribution sector. This implies that prices are set so that an efficient distribution company
attains a pre-determined rate of return (Fischer and Serra, 2000). The legislation regulating the
telecommunications sector follows a similar pattern. They allow for free market prices in all
sectors deemed competitive, but regulate rates of basic phone services considered to be local
monopolies. As the local network is considered an essential facility for competitors, the 1982 law
requires local telephone service operators to provide access to their network to any other operator
that requests the service.
4 We do not include the water sanitation companies, which were sold during the late 1990s and for which there is asyet little evidence about their performance.

7
On average, SOEs increased their profitability and efficiency after privatization,
following the trend of the national economy, but the behavior of firms providing regulated
services stood out. Their labor productivity—and consequently their profitability—increased
more than that of the non-regulated firms. Hence, there is some evidence that the incentive
mechanisms worked and provided incentives for efficiency. On the other hand, the high profit
rates of these firms are also evidence of regulatory failure. In fact, the available evidence shows
that a large fraction of the efficiency gains were not transferred to consumers as prescribed by the
regulatory model. Nonetheless this situation has changed in the last five years as regulators have
become more forceful and competition has made its mark even on sectors previously considered
to be natural monopolies.
1.2.2. The Privatization of Infrastructure
Despite the existence of some early plans to franchise infrastructure during the Pinochet
government, it was the democratically elected Aylwin administration that managed to pass a law
allowing private franchises of highways and other infrastructure projects. Due to initial delays
and practical hurdles, it was not until the Frei administration (1994-2000) that the groundwork
was completed and the franchising of infrastructure went into full swing. During the next six
years, most profitable private projects were franchised to national and international firms.
Projects worth more than US$4 billion are operational or are close to being operational. An
additional US$2.5 billion in projects has been auctioned or will be auctioned during the year
2002, but construction has not yet started; another US$650 million is under consideration, but
has not been evaluated in detail.
By the mid-1990s, the government discovered that it faced bottlenecks in seaports—a
serious problem since most Chilean international cargo is transported by sea. There were
multiple private cargo transfer and storage operators at each port, but there was little investment
in equipment and activities were not well coordinated. The government decided to franchise port
terminals (frentes de atraque) to private operators.5 Given the scarcity of ports in Chile due to
geographical reasons, terminals can be considered essential facilities. In order to increase
5 A terminal is an autonomous operational unit within a port that consists of adjoining berthing spaces and theirassociated support and service areas, thereby making it possible to auction the terminals at a port as separate units.

8
efficiency and investment in the ports, the main terminals were auctioned under restrictions on
horizontal and vertical integration designed to prevent monopolization of the ports.
Overall, the program of infrastructure franchising has been successful. There have been
few problems in the highway program, especially as compared to the experience of Mexico,
which eventually cost taxpayers an estimated US$8 billion. By now the country can boast of a
substantially upgraded road infrastructure and lower transport costs. Moreover, since franchise
auctions were open and competitive, tolls (user prices) should be close to average cost, which is
the second-best outcome in the presence of economies of scale. (There are, however, potential
problems with the traffic guarantees the government has included in contracts in order to
facilitate access to loans, since they represent unaccounted for liabilities to government that are
pro-cyclical.) Finally, there have been noticeable improvements in the efficiency of the
privatized ports. The loading and unloading process has become twice as fast in just one year,
having a multiplier effect on transport costs since shorter stays in port mean that more efficient
and more capital-intensive ships can afford to operate from Chile.
1.2.3. The Privatization of Social Services
Social services were privatized starting in the early 1980s. In 1980, the government introduced
legislation that created the private pension fund system. This system is based on compulsory
contributions to individual pension accounts. Workers are required to contribute 10% of their
gross wage income to the pension fund administrator of their choice.6 In 1981 the private health
insurance system was introduced. Again, workers were compelled to contribute 7% of their gross
income to purchase health insurance, either through the public system or through the health
insurance company of their choice.7 In a bid for decentralization of government activities,
municipalities became responsible for primary public health care. Public schools—previously
managed by the state—were also transferred to municipalities, and a voucher system that did not
discriminate between municipal and private schools was introduced to finance primary and high
schools.
6 Pension fund administrators charge average commissions representing 2.5% of the income of contributors, butwhich represent less than 1% of accumulated funds.7 The compulsory health contribution was initially 4% but rose to 7% after a few years.

9
The objective guiding these measures to promote private participation in social services
was two-fold. The first objective was to increase efficiency, especially through competition
among the various participants in a sector. The second was to hand the responsibility for
decisions concerning children’s education or retirement pensions to families. This agenda was
based on a deep-rooted distrust of the role of the state in both social and economic decisions.
However, as these are complex decisions involving a large degree of asymmetric information,
the state has remained a rule-setter and supervisor. The main problem has been the reluctance of
private individuals to acquire the knowledge needed to make informed and rational decisions.8
As a result many individuals do not understand the main aspects that are involved in choosing a
service provider.
Lack of understanding on the part of consumers has led providers to focus their
competitive efforts on marketing and sales rather than on the variables that are relevant from the
point of view of an enlightened policymaker (extent of coverage of a health plan in the case of
the private health insurance system, net rate of return on a pension fund in the case of the private
pension system and quality of schooling in the case of the subsidized private schools).
Nevertheless, important benefits have been gained from the privatization of social services. In
the case of the private pension system, the likelihood of politicians being able to misuse pension
funds is far smaller, increasing the security of pensions. In the case of the health insurance and
the subsidized private schools, competition from the private sector has increased the visibility of
the inefficiencies of public sector, which is under pressure to improve its performance.
The rest of the paper is organized as follows. The next section analyzes the privatization
of state-owned firms, and the effect on their performance, efficiency and other parameters.
Section 3 is devoted to a qualitative assessment of privatization of regulated sectors. First we
analyze the privatized utilities and their sectors in more detail. Then we look at the private
provision of infrastructure through franchises. Section 4 examines the privatization of the social
sector, including health, pensions and education. The last section concludes.
8 Of course, their decisions may be rational in a world where agents have limited rationality.

10
2. The Performance of Privatized Firms
In this section we report the effects of privatization on 37 non-financial firms that were
privatized between 1979 and 1999. During this period 13 additional non-financial firms
were privatized, but the available data for those entities was insufficient. This is
symptomatic of one of negative features of the Chilean privatization process: the lack of
transparency (Hachette and Luders, 1994). There are no public records for privatizations
that occurred during the 1970s. Some of these firms subsequently went bankrupt or became
private corporations (i.e., without publicly-traded shares) and did not publish accounting
information. Therefore, most of the usable data on privatization for Chile corresponds to
the now publicly traded firms that were privatized starting in the early 1980s, as they are
required to publish financial information. Nineteen of the 37 firms in the sample belong to
regulated sectors, so their data is contaminated by the effects of regulation, while the
remainder are usually dominant firms in their markets, or have sizable market shares.9 In
this chapter we report both absolute and normalized (adjusted) changes in various
performance ratios before and after privatization. The normalization allows us to compare
the behavior of privatized firms to the performance of the sector to which they belong.
The next subsection (2.1) describes the history of the nationalization and the
privatization periods. The second subsection (2.2) describes the data and our treatment. The
last subsection (2.3) examines the effects of privatization.
2.1. A Brief History of the Privatization of Public Enterprises
2.1.1 The Era of State Intervention
State participation in the economy has had a long history in Chile, although it has only been
truly significant since 1940. After the crisis of the 1930s (according to Mamalakis, 1976,
Chile was one of the countries that suffered most heavily in the crisis), the country chose an
import substitution strategy and more state intervention. Thirty years later, the government
owned or had a controlling interest in 67 firms, 22 of which were created by law and 45
that were controlled by the Corporación de Fomento (CORFO), a government organization

11
created to promote industrial production (see Table 2.1). These firms operated only in
sectors that the state deemed too important to be left to the market, or which were originally
private firms that had gone bankrupt until government intervention saved them.10
CORFO had been set up in 1939 to spur economic development through the
promotion of investment. It operated through loans and loan guarantees to the private
sector, through research and development of projects and, eventually, through their
implementation. CORFO established firms that were deemed essential for Chile’s
development,11 among them Empresa Nacional de Electricidad (ENDESA, 1944),
Compañía de Acero del Pacífico (CAP, 1946), Industria Azucarera Nacional (IANSA,
1953), Empresa Nacional de Telecomunicaciones (ENTEL, 1964), Petroquímica Chilena
(Petrox, 1967), Sociedad Química y Minera de Chile (Soquimich, 1968), Celulosa
Constitución (Celco, 1969), Celulosa Arauco (1967) and Industrias Forestales SA (Inforsa,
1970). There were minority private shareholders in these firms (43% in the case of CAP).
Corfo was also a minority shareholder in two other firms.
Table 2.1. State-Owned and -Seized Firms
Type of Firm 1970 1973 1983 1990 2000Enterprises 66 251 44 40 37Banks 1 19 2 1 1Seized 0 325 0 0 0
Sources: Hachette and Luders (1994) and Corporación deFomento de la Producción. Data for 2000 compiled by theauthors. The numbers for 1973 includes 37 subsidiaries of CORFOand 112 firms in which CORFO held minority stakes.
Among the firms created by law are Correo y Telégrafos, which has been public
since before independence; Ferrocarriles del Estado, founded in 1851; Línea Aérea
Nacional, created in 1931; Empresa Nacional del Petróleo (Enap), established in 1950; the
Empresa Marítima del Estado, spun off from Ferrocarriles in 1953; the Banco del Estado,
established in 1953 by the merger of state-owned financial institutions established in the 9 Of the 12 companies in the unregulated sector, four are monopolies (CAP, ENAEX, LAN Chile andSoquimich), while COLBUN, ENDESA and GENER represent almost all of the generating capacity in theinterconnected central electric system.10 For example, in 1965, value added in state related firms was just 14.5% of GDP.

12
previous century; Empresa Nacional de Minería, created in 1960; and the Empresa
Portuaria de Chile, split off from the customs office in 1960.
Table 2.2. Number of State-Owned Firms
SOEs 1973 1978 1983 1989 2001State-Owned pre-1970 65 46 32 19 14Acquired 1970 –73 113 34 1 0 0Created 1970 -73 1 1 1 1 0Acquired 1974-78 1 1 0 0Created 1979-83 10 2 1Created 1984-89 22 13Created 1990-2001 10TOTAL 179 82 45 44 38Source: Authors’ computations based on Hachette and Luders(1994) and Corporación de Fomento de la Producción.
A change of policy occurred in the late 1960s when the government began a modest
process of acquiring private firms. Previously, all SOEs had been created by the state itself,
except for those troubled firms unable to repay the CORFO loans. Codelco was established
in 1968 to acquire 50% of the shares of the four largest copper mines (copper represented
more than 80% of all exports). In 1970 Chilectra was acquired by CORFO, which meant
that the state owned the entire electric sector. Moreover, in the period 1965-1970, 22% of
the arable land (4.1 million hectares) was expropriated in a land reform process. Most of
the land was not transferred by deed to the peasants (except for 2,600 hectares), but was
kept in public hands (Rosende and Reinstein, 1986).
The pace of state intervention in the economy accelerated in December 1970 when a
socialist administration took office with the professed aim of creating a vast state-owned
sector. The target was to acquire all firms whose equity exceeded US$500,000 in current
dollars as well as all of the banking sector, the import-export sector and all utilities. A
majority in the Chilean congress opposed this plan, so the executive branch resorted to
administrative measures and legal loopholes. First, CORFO offered to buy shares in any
bank or publicly traded firm. Given the uncertainty of the times, many investors decided to
sell out (see Table 2.2).
11 However, CORFO may have only displaced private investment in those sectors.

13
In the period 1971-1973, CORFO managed to buy a majority share in 113 industrial
firms and 14 banks, as well as a minority shareholding in 68 other firms and 5 banks, while
creating only one new firm (Transmarchilay). Therefore, in September 1973 the state was a
majority controller in 179 firms and 15 banks, and was a minority shareholder in 70 firms
and 4 banks. Another 259 firms were intervened in or nationalized. In this case the
administration used pre-existing legislation that allowed intervention or expropriation of
firms when there was a threat of shortages. The modus operandi was to have a strike at the
firm, which would then be taken over by workers. Since the firm had stopped operations, a
risk of shortage existed, allowing the intervention of the government.
To recapitulate, by September 1973 the government controlled 441 firms and 15
banks, and there were few important companies in private hands (the firms under control of
the state represented almost 40% of GDP). In addition there were 66 agro-industrial plants
built and/or operated by Socoagro, a subsidiary of CORFO. The state owned 8,979
thousand hectares, of which 5,873 had been expropriated in 1971-1973 (Larroulet, 1984),
and the share of the economy in the hands of the state was growing apace.
2.1.2. The First Round of Privatization
After the coup of September 1973, the military government in power began to develop a
strategy of economic liberalization. One of its aspects was the return to the original owners
of the firms in which the government had intervened. During 1974, 202 firms were returned
to their owners and 39 were given back the next year, leaving only 18 firms to be
normalized in the next few years. Hence, most of these firms were returned to their original
owners by 1975, staying in the hands of the government for only a few years, and are
therefore not representative of SOEs.12 At the same time, the land that had been
expropriated was privatized: 28% of the land that had been expropriated illegally was
returned to its original owners, another 52% was divided into small landholdings and sold
to the peasants at subsidized prices (many of the peasants later resold the land), while the
remainder was privatized through public auction or was transferred to the Corporación
Nacional Forestal (Hachette and Luders, 1994).
12 See Sáez (1996) and Meller (1996).

14
Between 1975 and 1977 the government privatized most of the firms that had been
acquired in 1971-1973. Most of the shareholdings in banks were sold in 1976, leaving a
few to be sold in 1976. In the period 1975-1977, 70 state-controlled firms were privatized,
while 28 other firms were closed and their assets auctioned off (see Table 2.3). By 1980, the
state had control over only 10 of the 115 firms acquired by the socialist government. On the
other hand the military dictatorship decided to keep the largest electric and telecom
companies. The same strategic reasons made the military government buy a controlling
interest in the main telephone company in 1974 (thus obtaining control of 100% of the
telecom sector).
Of those SOEs that dated to the period prior to 1970, only 35 were still owned by
the state by the end of the 1970s, with the government having either sold or liquidated 30 of
them. The state retained the 22 companies that had been created by a special law, but the
number of CORFO companies shrank from 44 to 11. CORFO sold all of the firms it had
acquired through debt capitalization and kept only a portion of the companies it had
created. Thus, by the end of the 1970s the state owned the electric utilities, telecoms, the
big mining companies, and a large fraction of the transport industry (railways, two shipping
companies and the national airline) as well as the steel mill. There are 13 firms whose
status is unclear, since they were either liquidated or went bankrupt shortly after
privatization.
Table 2.3. Privatized SOEs
Privatized SOEs 1974-78 1979-83 1984-89 1990-2001pre-1970 SOEs 10 7 10 3Acquired 70 -73 60 7 1 0Created 70 –73 0 0 0 1Acquired 74-78 0 0 1 0Created 79-83 0 8 1Created 84-89 7 7Created 90-2001 2TOTAL 70 14 27 14
Source: Authors’ computations based on Hachette and Luders (1994), andCorporación de Fomento de la Producción.
The larger firms were sold at public auctions, though there were post-auction
negotiations with the auction winners (Hachette and Luders, 1994). The smaller firms were

15
sold directly. Overall, the objective seems to have been to maximize state revenue, which
explains why the government usually offered a controlling interest (generally all of the
shares owned by CORFO), rather than selling small lots of shares in the open market. In the
case of the banks, the government tried to diversify ownership by setting a limit of 1.5% on
holdings, but this limit was raised after being easily evaded by buyers using shell
companies. There were no serious attempts made at attracting foreign investors.
The objective of maximizing revenue from sales led to a policy of lending money to
the buyers. Thus only 10% to 20% of the bid was required immediately, and there was a
one-year grace period, plus seven years for full repayment, with a low (for those times) real
interest rate of 8-12% per year. The government asked for a loan guarantee of 150% of the
loan value, but the guarantee could be in the form of shares in the company. In the case of
the banks, the minimum payment was 20% (on average 23% was paid up front) and the
loan had to be paid in full within two years at a real interest rate of 8%. The government
offered such easy conditions because the private sector was still very undercapitalized due
to the effects of the policies of the early 1970s.
2.1.3. The Crisis of the Early 1980s
Most financial firms, as well as several banks that had been privatized from 1975-79, were
taken over by the state during the economic crisis of 1981-83. Beginning in 1981, several
banks became effectively insolvent because they could not recover loans from troubled
companies, many of them related firms, which were either bankrupt or had suffered severe
losses.13 In November 1981, the government took over four banks and two more the
following year, all of which were later closed. In January 1983, the government had to take
over 8 additional banks that had failed to repay international loans (three of these banks
were later closed down). Ironically, most of the financial institutions that had been
privatized during 1975 and 1976—representing 55% of all financial assets—were again
being run by the state in the early 1980s (Rosende and Reinstein, 1986).
By December 1984, the accumulated losses of the financial sector represented more
than 200% of the sector’s equity and reserves and 18% of GDP (Valenzuela, 1989). In order
13 Related firms are those that belong to the same conglomerate.

16
to continue to have access to international credit markets, the government had to guarantee
all foreign loans of the banks that it had taken over while rescuing local depositors. The
government also took over many non-financial companies, as well as the private pension
funds (AFPs) that were linked to the troubled banks, either because they had unpaid loans
from the banks or because they were owned by the same economic conglomerates
(Rosende and Reinstein, 1986). Between 40 and 90 firms were taken over by the state,
giving rise to the so-called área rara (the “weird sector”). Hence in the 1982 crisis, the
state once more became the controller of many previously privatized firms. This new period
of state control was fairly short-lived and firms were not considered to be truly state-
owned.
The trigger of the crisis may have been international in origin (a large rise in the
prime rate in 1981 plus a moderate fall in the terms of trade), but the impact was amplified
by serious mistakes in economic policy, some of which were related to the privatization
process. The Chilean financial system was sufficiently fragile that the rise in interest rates,
coupled with the stoppage in capital inflows, weakened the new conglomerates, most of
which had high debt-to-asset ratios. The mechanisms used for privatization in the 1970s led
to concentrated property holdings and gave rise to economic groups (conglomerates) that
were highly leveraged (see Sanfuentes, 1984). In many cases, the buyers of banks used
bank deposits to pay the loans incurred in acquiring the banks. When non-financial firms
were privatized in 1976-1977, the new owners of banks also used their clients’ deposits or
loans from other financial institutions to buy the firms. As mentioned, the buyers were
required to put up collateral for 150% of the loan used to buy state-owned firms, but shares
in the firm could be used as collateral. In this way, large and highly indebted conglomerates
were formed.
The lack of regulation in the banking system made it easy to lend money to related
firms and even when restrictions were imposed on related lending, they were easily eluded.
In the case of the two main banks, 21% and 50% of all loans went to conglomerate
members. Bank regulators did not keep track of the quality of the loan portfolios. Ideology
played its part in the lack of regulation, since government economists argued that if the
banks were receiving deposits, private investors must have decided that the projects to
which the banks were loaning money were profitable, and regulation was unnecessary.

17
However, the regulators failed to realize the effect of implicit deposit insurance on their
assumptions. In 1976 depositors in a failing newly privatized bank had been protected from
losses, and this created the perception among depositors of the existence of implicit state
insurance. Moreover, investors in the conglomerates believed that they were too large to
fail (Vergara, 1996). Regulatory changes in order to monitor the quality and supervise the
concentration of bank loans were only put in place in 1982, with a stringent new banking
law introduced in 1986.
In addition to the financial resources from their affiliated banks, the two largest
conglomerates managed mutual funds (82%), insurance companies (53%) and pension
funds (68%) that granted them even more control over the economy (Sanfuentes, 1984).
These institutions would buy shares of firms in the conglomerate, thus raising share prices.
The indebtedness of the conglomerates was due in part to the level of real interest rates in
the period 1975-1981, which was high because of the excessive demands for credit of the
conglomerates in order to buy even more privatized firms. The high real rates were
compensated by capital gains in the stock market. In 1981 the government allowed banks to
contract loans abroad, which led to a rapid increase in indebtedness. Firms that had access
to international loans obtained credit at much lower rates than smaller firms with no access.
In less than two years foreign debt doubled, with the two largest groups holding 52% of the
debt.
Starting in 1985, the banks that had been taken over began to be privatized once
again. Preferred shares representing 70% of equity were sold to new buyers. The banks sold
their bad loans to the central bank and were recapitalized. In return, the central bank
became a claimant on future profits of the banks.14 When selling the two major banks, the
government strove to create a broad-based class of shareholders for two reasons: to provide
stability and to make it more difficult to revert the privatization process. The mechanism
was so-called “popular capitalism”: buyers were only required to put 5% down, while
CORFO gave them a 15-year loan for the remainder. There was a one-year grace period at a
zero real interest rate, a 30% discount for timely repayment of the loan and generous tax
benefits. There was a limit to the number of shares per buyer (and limits were enforced).
Three additional banks were sold to groups of investors.

18
The two main conglomerates had been the owners of the larger AFPs (Provida,
Santa María, San Cristóbal and Alameda), which held 68% of workers’ pension funds. The
two largest (Provida and Santa María) were sold via the popular capitalism scheme (without
the tax benefits). Aetna, which owned 49% of AFP Santa María, bought enough shares to
get control, while the rest went to small buyers. Banker’s Trust bought 40% of the shares in
Provida, with the remaining shares going to small buyers. The other two AFPs were merged
and auctioned under the name of AFP Unión.
After their recapitalization, the government also auctioned the other firms it had
taken over. In most cases, a controlling package was auctioned, but in contrast to the
procedures of the 1970s, the government required that payment be upfront. Local
conglomerates in association with foreign investors bought the major companies. In order
to increase the attraction of the auctions to foreigners, they were allowed to pay with
Chilean bonds that were selling in the market at 60% of par value. Unfortunately, there is
little information about the details of the transactions of that period, as there seem to be no
clear records.
2.1.4. The Privatization of the Historic SOEs (1985-89)
In the period 1985-1989, the government privatized 27 firms and closed down three other
companies, while creating 29 companies by splitting up larger SOEs. Only three of the
SOEs created were entirely new (Zofri, Metro and Cotrisa). In particular, eleven water and
sewage companies were created from the national water works. The firms that were sold in
this period were pre-1970 SOEs or firms that were spin-offs of pre-1970s SOEs that were
created in order to be privatized. The state sold 12 pre-1970s SOEs and 14 firms that were
spin-offs of SOEs, as well as two other firms that were acquired in the 1970s and had been
kept for strategic reasons. Most of the firms sold in this period were utilities and included
13 electric and 3 telecommunications companies.
There were four different privatization mechanisms in this period. The first was via
best price offers for the firm or for controlling packages in open international auctions. The
second mechanism was the auction of non-controlling packages of shares on the stock
14 In other words, the Central Bank exchanged fresh money for a claim on profits.

19
market. A third mechanism was the direct sale of shares to the workers of privatized
companies, public employees, and small investors—the so-called labor and popular
capitalism. Workers and public employees financed the purchases of shares by using their
severance benefits and loans from public institutions at subsidized interest rates. Private
pension funds participated in the privatization process through the acquisition of packages
of shares in the stock market. Finally, public utility users that needed to connect to the
system or increase the capacity of their connection were required to pay for the
infrastructure in return for shares in the company (Bitrán and Sáez, 1994).
2.1.5. Privatization during the 1990s
The first elected government after the military regime (1990-1994) stopped the
privatization process almost completely, in contrast to the second elected government
(1994-2000), which gave new life to the privatization process. From 1994-2001 14
companies were privatized while 4 others were closed down. During the same period 12
new firms were created, 10 of them being subdivisions of Emporchi, the port authority. By
late 2001, 38 firms remained in public hands, of which 14 were pre-1970 SOEs and 24 had
been created after 1980, mainly by splitting up traditional SOEs. The current SOEs include
the largest copper mining company, the oil refinery, 9 regional water and sewage
companies, the post office, the subway, a copper refinery, 10 ports, the post office and a
commercial bank.
Between 1994 and 2000 the government used public auctions to sell all the state-
owned transportation companies: two shipping companies (Empremar and Transmarchilay),
a cargo railway company in the northern part of the country (Ferronor), and the cargo
railway company in the central zone (Fepasa). It also sold the remaining 27% of the
national airline on the stock exchange. Ferronor bought the northern rail system, which
consists of several lines that run from mines in the Andes to ports and carry minerals. It has
been a successful company. Fepasa got the cargo concession in the rail system south of
Santiago, but the lines were kept by the state (which also kept the money-losing passenger
rail system). Unfortunately for this second company, the rail lines were in worse shape than
expected, as was the case with the rolling equipment. Moreover, its holding company had
financial problems and initially Fepasa made some business mistakes. Hence, it is only

20
after several years in private hands that it has been able to achieve positive operational
flows.
Table 2.4. Revenues from Privatization of Chilean Public Enterprises 1985-1989
(Millions of US$)
1985 1986 1987 1988 1989 Total13 Electric Firms 16.4 124.3 393.0 632.5 77.9 1244.13 Telecom Firms 0.9 55.6 35.5 344.0 192.1 628.1Soquimich 4.7 85.4 71.5 60.9 0.0 222.5Cap 12.1 139.5 53.2 0.0 0.0 204.8Ecom 3.2 0.2 0.0 0.0 2.8 6.2IANSA 0.0 8.8 1.0 50.8 8.0 68.6Labchile 0.0 2.8 3.8 18.1 3.1 27.8Schwager 0.0 0.0 6.1 2.2 7.0 15.3Enaex 0.0 13.4 0.0 0.0 0.0 13.4Isegen 0.0 0.0 0.0 0.0 5.6 5.6Lanchile 0.0 0.0 0.0 7.0 75.9 82.9Chilefilms 0.0 0.0 0.0 4.5 0.0 4.5Isevida 0.0 0.0 0.0 0.0 8.8 8.8TOTAL 37.3 430.0 564.1 1120.0 381.2 2532.6Source: CORFO annual reports. In year-end 1995 US$.
During this period, the state also completed the privatization of the electric sector.
Edelnor was privatized in the period 1991-1994. In 1995 Codelco, the state-owned copper
mining company, hived off and then sold its thermal power plant (Tocopilla). A 37.5%
stake in Colbún was sold in 1996. Before the sale just over 15% of Colbún was traded on
the stock market. In December 1997 the government auctioned 4.65% of Colbún in the
stock market, selling its remaining shares in 2001. The government also privatized a radio
company.15
The two most important privatizations of the 1990s were those of the three largest
water and sewage companies. Unlike other public services, the military regime did not
privatize sanitation services. The need to raise rates significantly before it became feasible
to privatize these services was a hindrance to the sale of the water companies. The military
government felt that privatization followed by a substantial price hike would have been
15 The only valuable assets in this company were the rights to the FM spectrum, which were sold separatelyunder allegedly questionable circumstances. The remaining AM frequencies were not valuable and thecompany went bankrupt very shortly thereafter.

21
politically unpopular. In fact, in the late 1980s, water rates were on average less than half of
what was needed to finance provision of the service, with prices covering less than 20% of
outlays in the desertic northern regions. Prior to privatization, however, rates had to be
raised so that the water companies could cover their costs.
Sectoral modernization began in 1977 with the creation of the Servicio Nacional de
Obras Sanitarias (Sendos). This entity absorbed several agencies belonging to different
ministries and made it possible to reduce the workforce from 10,000 to 3,000. Apart from
regulatory responsibilities for the whole sector, Sendos was charged with providing water
services to the regions. In the same year, state-owned water companies were set up based
on pre-existing small companies both in the Santiago Metropolitan Region (Emos) and in
the central zone, or Region V (Esval). In 1989 eleven regional joint-stock companies
affiliated with the state development corporation (CORFO) were created out of Sendos.
In 1988, a new regulatory framework was set up for the sector, closely matching its
electricity sector counterpart. The new rate system allows for the self-financing of efficient
firms. Pricing zones with relatively homogeneous costs were also established. The new
pricing system was introduced gradually in 1990, and charges rose by an average of 90% in
real terms between 1990 and 1994, although by this time the rate adjustment process was
still not complete in all regions. The rise in prices was steeper in areas with higher costs,
exceeding 500% in some cases, and by 1998 average regional water rates ranged from
US$0.43 to US$1.21 per cubic meter. Arrears were cut from 7.9% in 1990 to 2.9% in 1994,
as a result of a business-oriented approach and by the possibility of cutting off service to
customers in arrears. In 1994 the average rate of return on equity among public water
companies was 6.3%.
The Frei administration decided to privatize water companies. However, it wanted
to strengthen the regulatory framework before selling the firms, since it was not totally
satisfied with the way the regulation of privatized public utilities was working. In 1995 the
administration sent a bill to Congress improving the rate settlement process. Congress
approved the bill in December 1997 after a prolonged and heated debate, since it was
assumed that the bill was in preparation for privatization.
The privatization of the water sector began in 1998. Since then the three major
water and sewage companies have been sold. A scheduled rate revision took place in the
22
two major sanitation companies after privatization. The revision resulted in a 20% increase
in the rates of both firms. The increase is more or less in line with the 10% cost of capital
estimated for the sector (the public firms had a 7% rate of return on equity), and the sale
prices reflect these numbers. The privatized firms are investing in sewage treatment plants
and this will lead to further rate hikes. Currently (2002), the government is in the process of
franchising its remaining water and sewage companies.
2.2. Data on Privatized Chilean Firms
Given the history of the privatization process described above, the data are difficult to
obtain in usable form. We excluded from our analysis privatizations that took place
between 1975 and 1979, first, because most firms that were privatized during that period
were managed by the government for only a few years. Furthermore, the political and
economic turbulence of the 1970s renders available information highly idiosyncratic. In
fact, economic data from 1971 to 1973 show significant distortions, and the economic
recovery did not start until 1976. Moreover, accounting standards were laxer and were
changed in 1982. Hence in this paper we focus on the 54 firms privatized from 1979-2001.
Two of these are insurance companies and are thus excluded from the sample, which
includes only non-financial firms. Two water companies that were privatized in 1999 have
also been excluded, since there is only one year of post-privatization data. Of the remaining
50 firms, only 34 are publicly traded on the stock exchange and thus are required to provide
financial information to the public, while the other 16 have no public disclosure
requirements.16 However, we were able to access the information of 3 of the firms in the
latter group (Fepasa, Empremar, Ferronor) and they have been included in the sample.17
This leaves 37 firms for which we have usable data (see Table 2.5).
16 Some of these sixteen firms had never been publicly traded, while others were taken off the stock market(i.e., became private or “closed”) after privatization.17 This is a very slow process, since the firms are not required to provide the information. Obtaining data forEmpremar, Fepasa and Ferronor took almost three months because it required obtaining information not onlyfrom the firms but also from the original state-owned firms, which no longer exist.

23
Table 2.5. Status of Privatized Firms 1983-2000
Status Type NumberPrivatized 54Analyzed 37
Publicly traded 34Privately held 3
Not AnalyzedToo recent 2
Privately held (no data) 13Financial 2
Source: Authors’ computations. One additional firm(Pehuenche), a hydroelectric project at the time ofprivatization, was merged with ENDESA without everhaving operated independently.
2.2.1. Data Problems
The basic source of information is the so-called FECUs, the standardized quarterly reports
that companies with publicly-traded shares (plus some other firms designated by law) must
provide the Chilean Securities and Exchange Commission (SVS). The December FECU
typically includes the annual financial report and other information, including the number
of workers in the firm.18 FECUs have been required for the last 20 years and are available
in digital form.19 Prior to important changes in the accounting standards introduced in
1982,20 the accounting information of firms was not standardized and is thus less
descriptive of the true financial status of firms. An additional source of information was the
annual company reports. However, the data in the annual reports are not standardized, and
are therefore less useful.
There is no source for the following data at the firm level: number of white- and
blue-collar workers, average wages, salary differentials and output price indexes. Another
important data limitation is that there are no readily available physical data, since only the
18 Another interesting source of information at the plant level is the INIA survey, which registers quarterlydata on many of the variables of interest for this study. Unfortunately, secrecy considerations surroundinginformation provided by the National Institute of Statistics (INE), which owns the survey, make it impossibleto use the data for our purposes. The INE refuses to provide information on whether a particular plant wasever privatized, so we were unable to use this rich data source for the present study.19 The digital form does not include the number of workers, which must be reconstructed from the FECUs inpaper form.20 Circular 239, Superintendencia de Valores y Seguros (1982).

24
output of some products are described in the annual reports; the products themselves
change between annual reports; and, finally, we have no price index of these products. As
an example, a steel company might produce steel in ingots and as sheets and bars, iron ore
and other products. Should we assume that physical productivity has gone down because
steel ingots per worker have fallen, or is that due to a change in the demand for ingots as
compared to steel bars and iron ore, for instance?
In principle, one might look at sales per worker as an index of productivity, and we
do this in the paper. However, most of the firms we analyze are either regulated or face very
few competitors, so that prices are not determined in a free market environment. More sales
per employee after privatization could therefore be due either to higher prices or to higher
productivity, or to a combination of both factors. In our analysis, in addition to working
with the whole sample of firms, we analyze the performance of the group of regulated and
unregulated firms. Our definition of a regulated firm is slightly ad hoc: a firm is regulated if
the government, through interventions in the market or though rate regulation, has the
ability to change its profitability.21 This implies that all electric distribution companies are
regulated for our purposes, as are local and long distance telephone companies.22 IANSA,
the sugar refining monopoly, is a doubtful case, since the government sets the price it can
charge for sugar through a price stabilization mechanism known as “bandas”.23 We have
compared the results obtained by assigning IANSA to either group (regulated or
unregulated) and there is no major difference between the two cases.
In order to measure the impact of privatization on firms we exclude the two years
immediately prior to and after privatization. As described in La Porta and López-de-Silanes
(1999), there is a potential cleansing effect in the accounts before the sale of the company,
while the years following privatization could not be representative of the post-privatization
performance if the firm is still undergoing a reorganization process. Hence we compare
years three to five prior to privatization with years three to five post privatization.
Nevertheless, we have examined the data in the three years prior to privatization in order to
get a feeling for the cleansing effect.
21 We have included the electric generating companies among unregulated firms because they sell a largefraction of their energy via unregulated long-term contracts.22 Telex, a long distance operator, was not regulated during the period under consideration.23 IANSA has a powerful lobby among southern landholders.

25
2.2.2. Treatment of Mergers and Divestitures
Using data three to five years prior to and after privatization creates its own set of
problems. Some firms were spun off just a short period before being privatized. For
instance, Chilectra was divided into three firms prior to privatization. Six regional
distribution companies, Colbún and smaller generating companies were spun off from
ENDESA. The problem is that pre-privatization FECUs for the newly independent firms do
not exist and therefore it is not straightforward to determine the change in performance due
to privatization. Similarly, in the case of mergers, we do not have post-privatization
independent FECUs. In these cases we have to rework the data in order to assign the assets
of the original firms to each daughter firm. Conversely, when the firms are merged we have
to “disassemble” the merged firm into its original constituents.
The procedure we follow is to assign the different variables in proportion to their
fraction of the merged firm at the time of privatization. For example, suppose that firm A
splits off from firm Z and both are privatized. In order to obtain data on a variable prior to
privatization, we take the data at privatization and consider the proportions of that variable
for the combined firm. We then assign the data in the combined FECU or variables not in
the FECU (prior to privatization), in those proportions. A similar procedure is used in order
to analyze data for merged firms.
2.2.3. Data Adjustments
In order to eliminate the effect of economic conditions on the performance of firms, we also
present normalized comparisons. Subtracting the average values of the performance ratios
for the two-digit SIC group to which they belong normalizes firm performance ratios.
Although the two-digit decomposition encompasses widely differing industries, going to
more digits in the decomposition would not have been useful, since the firms in question
represent most if not all of the industry at more detailed SIC levels. We have subtracted the
two-digit averages rather than using ratios because of the extreme variations in these ratios,
which would have given excessive weight to some observations. Moreover, the
interpretation is simple: if an adjusted ratio for a privatized firm is negative, the ratio for
that firm is worse than the average of that variable in its (two-digit) sector. Some two-digit

26
average ratios have been treated differently because of the extreme variation in the data. For
example, consider the ratio of net income to sales (or PPE) for a small timber company in
the control group that sells a forest. This is non-operational income, there are very few
sales, and the ratio of net income to sales is astronomical. In these cases we have taken the
sum of net income for firms in the control group and divided it by total sales of the firms in
the control group to obtain a more reasonable result.
2.3. Effects of Privatization on Chilean Firms
We analyze the firms before and after privatization both in terms of absolute performance
and by comparing them to a benchmark given by the average behavior of their sector at the
two-digit level, as mentioned previously. The first part of the analysis in each subsection is
devoted to unadjusted data. Perhaps the most interesting result we obtain is the difference
between the performance of regulated and unregulated firms. The detailed tables and
graphs with the pre- and post-privatization performance appear in the Appendix.
2.3.1. Profitability
Prior to privatization, in contrast to Mexico (see La Porta and López-de-Silanes, 1999),
Chilean SOEs were fairly profitable. That was the case for most of the large SOEs that were
privatized, as shown in Table 2.6, so the firms did not have to go through the large changes
that were required in other countries. However, despite the fact that, on average, privatized
firms were profitable, several smaller firms (and a few large ones such as ENDESA in
1985) did have losses prior to privatization. If anything, at the time there were complaints
that the government was selling the crown jewels. Hence, the scope for efficiency benefits
from privatization was relatively small.

27
Table 2.6. Net Income to Equity, Privatized SOEs
Firm 1970 1974 1979 1983 1986 Year Privat.CAP 10.9 0.5 0.2 0.7 2.3 1986Chilectra 0.5 -3.2 2.6 4.6 – 1986CTC 0.7 -4.1 1.7 11.9 10.9 1987ENDESA 0.3 -4.3 2.4 6.4 4.9 1988ENTEL -0.7 -3.4 12.3 13 35.4 1988IANSA -9.3 12.1 -9.8 -24 5.5 1988Lab. Chile 4.1 7.9 0.5 -196.4 12.8 1989Soquimich -65.3 11.9 -7.9 10.1 30.8 1986Source: Sáez (1996).
Using Table A.1 of the Appendix, which is analogous to the first part of Table IV in
La Porta and López-de-Silanes (1999), we can analyze profitability before and after
privatization. If we consider the profitability variables (operating income to sales (OI/S),
operating income to physical assets (OI/PPE), net income to sales (NI/S) and net income to
physical assets (NI/PPE)), we observe that there seems to be a significant change in the
profitability ratios before and after privatization. In particular, we observe that NI/S rose
from less than 2% to 13% on average and that NI/PPE rose from less than 4% to more than
16%. Moreover, the profitability measures are strongly positive.
This change in profitability, however, is mainly due to the change in the results of
regulated firms.24 While the profitability ratios improve for the group of unregulated firms,
there is enough variation in the results that we cannot show that the change is significant.
The important ratio NI/PPE increases from a low 4% to a fairly reasonable rate slightly
above 12%. By contrast, in the case of regulated firms the change in profitability ratios is
far more important. The ratio NI/PPE rises from 3.5% to 20.5%, and the same pattern of
large increases in profitability of regulated firms occurs for the other profitability ratios.
When we consider adjusted variables (see Table A.4), obtained by normalizing the
profitability ratios by subtracting the average ratio of their sector, we find that the
improvement is less significant. This implies that part of the improvement observed in the
previous paragraph can be largely explained by a simultaneous improvement in the average
profitability of the sector. Nevertheless, the net income ratio NI/PPE for the sample of firms
rises from 1.5% above the average in the sector to almost 10%. What is interesting is that
28
the profitability ratios with respect to sales are not significantly different from those of the
industry as a whole, which seems to indicate that the increased profitability is related to
better use of physical assets, or, alternatively, to overinvestment prior to privatization.
As in the case of non-adjusted variables, most of the change in profitability is due to
the increase in the profitability ratios of the regulated firms. While there is an increase in
adjusted profitability of non-regulated firms after privatization, the increase is insignificant.
Moreover, the profitability of these firms is not significantly different from that of the other
firms in their sector. By contrast, all adjusted profitability ratios except for NI/S increase
significantly after privatization in the group of regulated firms. Moreover, these firms,
which had average profitability similar to that of their sectors, became much more
profitable afterwards, seeming to indicate that the regulators were unable to pass the gains
in efficiency on to consumers.
2.3.2. Efficiency
Efficiency is described by the cost per unit (Cost/Sales) and by the sales to physical assets
(S/PPE) ratio shown in Table A.2. The cost per unit ratio falls by a small but significant
amount at the 10% level for the sample of privatized firms. The S/PPE ratio falls slightly
but insignificantly. Once again, there is a large difference in the behavior of regulated and
non-regulated firms. Cost per unit falls significantly for regulated firms, while it barely
changes for non-regulated firms. Similarly, the S/PPE ratio increases significantly (at 10%)
for the regulated firms, whereas it falls for non-regulated firms.25
When we examine adjusted efficiency ratios (see Table A.5), we observe that there
is no difference between the privatized firms and the cost per unit in their sectors, and there
is no change post-privatization. Moreover, for this ratio there is no difference between
regulated and unregulated firms. Things are different for the S/PPE ratio, since the firms in
the group of privatized firms seem to have much higher ratios than the average for their
sector.
24 As we have mentioned before, IANSA is assumed to be non-regulated, but results do not change if wegroup it among the regulated firms.25 In a personal communication, R. Luders observed that he had not been able to detect improved performancein privatized firms in Hachette and Luders (1994). His explanation was that managers of state owned firmswere ideologically committed to efficiency during the 1980s. For further evidence of this, see Table A.1.

29
2.3.3. Assets and Investment
Table A.3 shows variables related to assets and investment. The average value of the
logarithm of physical assets (the log of the geometric mean of PPE) shows an increase that
is insignificant after privatization. In fact, the change is concentrated in the regulated sector,
where the increase in physical assets is significant. The investment to sales ratio (I/S) fell
significantly (at 10%) after privatization, which seems to imply that firms invested more
productively. Again, the big change lies in the regulated sector, where this variable fell
from a value of 1.92 to 1.43 on average (compared to 1.84 to 1.79 in the non-regulated
sector). An alternative explanation is that SOEs that operated in a competitive setting were
investing efficiently before privatization so there was not that much scope for improvement.
The ratio of investment to physical assets (I/PPE) for the whole set of firms
remained constant, but again there is a difference between regulated and non-regulated
firms. There was an insignificant fall in this ratio for the non-regulated firms and an
increase for regulated firms (again, insignificant). The ratios of investment and physical
assets per employee increased substantially after privatization: workers had access to better
equipment. What is interesting here is that it is in the non-regulated firms that the increase
is significant.
When we consider adjusted ratios (see Table A.6), there are no significant changes
in the behavior before and after privatization. The only important differences are that the
privatized firms are much larger than the average for their sectors and that the I/PPE ratios
are also significantly higher. However, the adjusted results for the I/PPE ratios only hold for
regulated firms.
2.3.4. Productivity
In Table A.2 we have the labor productivity ratios of sales to employees and operating
income to employees. Both these ratios show that productivity increased significantly as
firms became private, as expected. However, once again, most of the change was due to the
behavior of regulated firms, for which sales to employment ratios increased by 88% and
operating income to employment ratios rose by 325%. We were unable to obtain
employment data for all the firms in a sector at the two-digit level, so we have not been
30
able to compare the growth in productivity of privatized firms with the other firms in their
sectors.
We have also examined physical productivity for firms for which we could obtain
measures of physical product (tons, passenger/km, GWh, etc) as shown in Table A.8. We
have used these variables to construct productivity ratios and then we have taken the
percentage difference before and after privatization. The results show that firms increased
their productivity by about 25% on average after privatization, but there is enough variation
in the data that this is not significant for the whole sample, nor for regulated or unregulated
firms separately. However, some caution is required in the use of this data: most firms have
more than one line of production, and therefore a fall in physical productivity on the basis
of one product may mean nothing. As an example, LAN Chile seems to have decreased its
productivity in terms of passenger/km after privatization. However, after privatization, the
firm launched a successful cargo branch, the revenues of which are generally on par with
those of the passenger segment of the company. Therefore, the data in this section may
show that productivity has increased in physical terms, but unless we have the prices of
these different products and their production, this comparison is not very informative.
2.3.5. Employment
As can be seen from Table 2.7, there is no evidence that firms fired workers during the
period 1983-1992, which includes the years in which the firms were privatized. In fact, it
appears that firms took on more workers on aggregate. Moreover, it is clear that SOEs
reduced their employment levels several years before they were privatized (more than three
years in most cases). However, different firms were privatized at different times, and
therefore it is interesting to see if this continues to hold for the complete sample of
privatized firms, considering the time at which they were privatized. To examine this issue,
we use Table A.7. Again, there is no evidence that firms fired workers after privatization.
Employment increased slightly but not significantly after privatization: the average firm
grew from 1,193 to 1,381 employees. Both regulated and unregulated firms grew in size.
Note that on average, non-regulated firms are larger.

31
Table 2.7. Employment Changes in Privatized Firms
Firm 1970 1973 1979 1983 1986 1992 PrivatizedCAP 7,025 11,637 9,321 6,519 6,667 9,643 1986Chilectra* NA 4,250 4,196 3,846 4,133 4,712 1986CTC 5,887 7,252 7,206 6,338 6,938 8,504 1987ECOMa 188 341 333 165 149 NA 1986ENAEX 344 340 394 388 470 NA 1987ENDESA* 6,512 8,504 4,270 2,705 2,905 2,980 1988ENTEL 1,161 1,458 1,236 1,338 1,402 1,748 1988IANSA 2,827 2,881 1,597 1,079 2,027 1,561 1988Lab. Chile 3,608 4,546 2,059 1,372 883 797 1989Soquimich 10,814 10,684 7,109 4,096 4,704 3,242 1986Source: From Sáez (1996). Data for 1992 from FECUs. Data for ENDESA (apartfrom 1970) from Hachette and Luders (1994) (for the principal office, and the lastyear is 1989). Data for Chilectra from Sáez (1996) except for 1986 and 1992. Thoseyears obtained by aggregation of all the firms that were originally part of the firmsin 1980 using data on Hachette and Luders (1994) for 1986. a: ECOM wentbankrupt before 1992.
3. Privatization of Regulated Sectors
3.1. The Efficiency of Privatized Utilities
In this section we provide an assessment of the privatization-cum-regulation process carried
out with respect to electricity and telecommunications companies between 1985 and 1989.
The evaluation considers the aims of the privatization efforts, namely to provide capital for
expansion of utilities that the state was not able to fund at the necessary level, to enhance
the efficiency of enterprises, and to transfer those efficiency gains to consumers. In the
previous section we showed that SOEs increased their profitability and efficiency after
privatization. These changes, however, are in line with those of their corresponding
industries in the case of unregulated firms. But firms that provide regulated services stand
apart. Their profitability increased more than did that of their non-regulated counterparts.
This difference must be attributed to the interplay between privatization and regulation.
3.1.1. The Privatization Process
The government privatized most of the telecom and electricity industries between 1985 and
1989. Some of the smallest companies were sold through public auctions. Larger firms
were privatized through a variety of mechanisms: sale of shares on the stock market, the

32
periodic auction of packages of shares on the stock market, and the direct sale of shares to
employees of privatized firms (labor capitalism), public employees and small investors
(popular capitalism). Pension funds, company employees and foreign investors acquired
most of the shares.
In the late 1970s, the telecommunications industry was dominated by two public
enterprises: CTC, which provided basic telephone service throughout almost the entire
country, and ENTEL, the only international long distance provider.26 The state also owned
two regional local telephone companies (CNT and Telcoy) and Correos y Telégrafos, which
provided telegraph service. In 1982, the government sold Telcoy and CNT via public
bidding, and VTR, a local telegraph operator, acquired both. However, the privatization of
the large telecom firms only started in 1995. By the end of 1987, 25% of the equity of CTC
was in private hands. In 1988 the government sold 45% of the ownership of the company to
a foreign investor. In the case of ENTEL, in 1995 and 1996 the government sold 30% and
3%, respectively, of its shares, most of which were acquired by pension funds. In 1988, the
state further reduced its stake in ENTEL to 37.7%. This time, company workers were the
main purchasers (12.5%). The revenues from the privatization process of the main telecom
firms appear in Table 3.1.
The privatization of the two largest electricity companies (ENDESA and Chilectra)
also started in 1986. In order to create competition in the wholesale electricity market, they
were restructured prior to privatization. The restructuring involved separating distribution
from generation. ENDESA, the largest company, was divided into 14 companies: six
generating companies, six distribution companies, and two small isolated companies
combining generation and distribution in the southern part of the country. Chilectra was
divided into three firms: a generating company, and two distribution companies. Most of
the firms were under private control by 1989. The revenues from the privatization process
of the main telecom firms appear in Table 3.2.
26 These two companies shared the domestic long distance market.

33
Table 3.1. Privatization of Chilean Telecom Companies 1984-1989 (in December 1995 US$ Millions)
Company 1985 1986 1987 1988 1989 TotalENTEL 0.2 36.7 8.4 81.8 105 232.2
CTC 0.7 4.7 27.1 262.2 87.1 381.7Telex 0 14.2 0 0 0 14.2Total 0.9 55.6 35.5 344 192.1 628.1Source: CORFO annual reports
Table 3.2. Privatization of Electric Companies 1984-1989 (in December 1995 US$ Millions)
Sector Company 1985 1986 1987 1988 1989 TotalDistribution
Chilmetro 10 36 83.3 0 0 129.3Chilquinta 2.4 11.1 18.7 0 0 32.2Emec 0 6 7.5 0 0 13.5Emel 0 7.9 0 0 0 7.9Emelat 0 0 9.7 0.9 0 10.6Emelari 0 0 0 0 3.1 3.1Eliqsa 0 0 0 0 4.8 4.8Elecda 0 0 0 0 6.1 6.1
Generation*Endesa 0 0 180.0 585.4 63.8 829.2Pullinque 0 0 62 0 0 62Chilgener 4 22.2 31.8 33.8 0 91.8Pilmaiquen 0 41.1 0 0 0 41.1
IntegratedEdelmag 0 0 0 4,8 0,1 4.9
Total 16.4 124.3 393.0 624.9 77.9 1,236.5Source: CORFO annual reports.Note: * Excludes Pehuenche, which was sold as a project for US$7.6 million.

34
3.1.2. The Regulatory Framework
Some services provided by utilities were considered to be natural monopolies and therefore
the development of regulatory institutions preceded their privatization. Regulatory bodies
were created in the late 1970s for each sector: the National Energy Commission (CNE) and
the Undersecretariat of Telecommunications, respectively. They are responsible for granting
operating licenses, monitoring technical standards, and setting rates for services where
competition is insufficient. Regulation, operation, and, to some extent, policymaking had
previously been in the hands of the SOEs themselves. Moreover, new regulatory legislation
was introduced in 1982. The aims of these laws were to create the conditions for
competition to arise whenever possible, and to guarantee, in cases where there was
insufficient competition, that the efficiency gains expected from privatization would be
transferred to consumers.
Under these rules, concessions to operate utility services are not exclusive, and
objective, non-discriminatory criteria govern the granting of licenses. Only technical
reasons, as in the case of mobile telephony, may limit the number of operators. On the other
hand, legislation mandates that service be provided within the area of the concession,
defines continuity and quality standards, and requires interconnection with other firms
when regulators deem this to be necessary. Rates of regulated services are based on the
long-term marginal cost of a hypothetical efficient firm. Prices are set every four
(electricity distribution) or five (basic telephony) years, and within the price-setting periods
they are indexed to the prices of the main inputs used to provide the service. The separation
of rates from current costs is intended to create an incentive for firms to be efficient.
Chile’s regulations did provide for open access to essential facilities, but did not
regulate access charges at first. Moreover, Chilean legislation does not preclude vertical
integration. Thus, in 1992, Enersis, a holding company that owned distribution companies
supplying 44.4% of the market in the Central Interconnected System (SIC), took control of
the largest power generation company (ENDESA), which in turn owned the main
transmission system. It is fairly well known that regulated monopolies that are vertically
integrated into unregulated segments may have an incentive to sabotage their down-stream
competitors (Beard et al., 2001). Accusations by their competitors that integrated

35
monopolies were discriminatory led to regulatory changes. In 1994 the telecommunications
law was amended to mandate the regulation of access charges to the local telephone
network. In 1997 the Antitrust Commission instructed ENDESA to re-charter its subsidiary
as a public corporation and open its ownership to the participation of other shareholders.
Ultimately, ENDESA sold its transmission subsidiary in 1999.
The Electricity Sector
Electrical sector legislation distinguishes among three distinct activities: generation,
transmission and distribution. Only distribution firms need concessions. Distribution
licenses are granted for indefinite periods, but may be cancelled if the quality of service
falls below the legal standard. Power generating firms and transmission companies within
the same area must interconnect, and they must coordinate their operations through an
economic load dispatch center (CDEC). CDEC aims are to guarantee the most economical
operation of all generating facilities, to guarantee the right of power generation companies
to sell energy at any point in the system, and to safeguard the security of the system. The
specific tasks of CDECs are to plan the short-term operation of the system, handle the
dispatch of electric energy, calculate the spot price of electricity and coordinate major
preventive maintenance of generation units. All plants must be available for dispatch
(refusal to provide energy when requested can lead to severe penalties), unless maintenance
has been scheduled. The optimal operation of the various facilities, independently of
existing supply contracts, calls for transfers of energy to be made between power generators
at the so called spot price, which is the operational (or marginal) cost of the most expensive
plant in operation at a given time.
The Chilean regulatory system distinguishes between large and small customers.
The former group, with maximum power demands above 2MW, is free to negotiate the
terms of their supply with the various generating firms. Small customers, on the other hand,
purchase energy from distribution companies at regulated prices, which are made up of two
components: the node price, at which the distribution firms buy energy from power
generation firms, and the value added of distribution, which pays for distribution services.
Distribution charges are computed for different urban or rural areas in such a way that an
efficient firm operating in an area with those characteristics would make a 10% return on
36
the net replacement value (NRV) of its assets. This charge is calculated as a weighted
average of the findings of outside studies contracted by the industry and CNE, respectively,
with the CNE study accounting for two-thirds of the final figure. These figures are applied
to the real firms to calculate average profit levels for the industry over the NRV of assets. If
these average profit ratios are more than 14% or less than 6%, distribution costs are
adjusted to the nearest of the two ranges.
The node price, in turn, has two components: the price of energy and the price of
peak power. In order to guarantee stable rates for small consumers, the price of energy is
computed every six months as an average of the marginal costs expected over the next 48
months, using projections of demand, fuel prices, water reserve levels, generating plants
under construction and the indicative investment plan drawn up by CNE. The price of peak
power is defined as the annual cost of increasing power during peak hours with the least
expensive type of plant. This cost is increased to take into account the reserve margin (or
security level) of the system.
Large customers (including distribution companies) are required to have contracts
with generating companies. In turn, every power generation company must have the
capacity to meet the yearly energy contracts, bearing in mind potential dry spells that would
affect the hydroelectric plants and the average capacity of thermal generation units. Power
generation firms must also be able to satisfy peak demand, measured as the average gross
hourly demand they have undertaken to supply their customers at the system’s peak times.
A yearly determination is made of power and energy deficits/surpluses incurred by the
generation companies with respect to their supply contracts that would give rise to transfers
between producers. The terms of energy transfer arrangements are negotiated between the
firms, while transfers of peak power are made at the price set by CNE.
Finally, power generating firms pay the marginal cost plus a fee (the “basic” fee) for
the use of the transmission lines. Given that there are significant economies of scale in
building lines, marginal-cost pricing does not allow for recovery of all transmission costs.
The difference between the total cost of a line and the revenue collected through marginal
costs is designated as the basic fee. Then, for each line, the basic fee has to be distributed
among the various power generating firms. The basic fee is negotiated between the
transmission company and the generating company, and disagreements must be settled by
37
arbitration. The assignment of the basic fee cost to a line among the various generating
firms is based on maximum demand at peak demand. The foregoing criteria have no solid
conceptual basis, particularly with respect to the assignment of the entire transmission cost
to the generating firms.
Telecommunications
The legislation governing telecommunications generally provides for free market pricing of
telecommunications services. However, rates are regulated for those services the Antitrust
Commission considers to be provided under conditions of inadequate competition.27 The
telephone companies themselves, on the basis of guidelines set by Subtel (Subsecretaría de
Telcomunicaciones, a department under the Ministry of Transportation and
Telecommunications), carry out the studies that are used to set rates. The companies hand
in these studies to Subtel, which has 120 days to present its objections and
counterproposals. A committee of three experts arbitrates disagreements between the
companies and Subtel, both with respect to guidelines and to objections. The company
appoints one member of the committee, the regulator the second one, and the two parties
agree on the third. Although the regulators make the final decision, they tend to follow the
recommendations of the experts, since the companies are otherwise likely to go to court.
The ambiguities of the 1982 law had created a legal monopoly in the long distance
service market. In 1989, a number of companies applied to Subtel for licenses to operate in
this area. The final decision was not handed down for several years because of the
indecisiveness of the courts as to whether or not vertical integration of local and long
distance service should be allowed. Finally, in 1993, the Antitrust Commission authorized
the participation of local telephone companies in the long distance market. In 1994 the law
was modified in order to introduce competition to long distance though the multi-carrier
system, and following the ruling of the Commission, it imposed restrictions on local
telephone concessionaires that wished to operate in the long distance market. In the first
place, they had to do so through subsidiaries organized as independent joint-stock
27 The law excludes mobile telephony (except for access charges) from the requirement that the AntitrustCommission should decide whether the market is competitive, so user prices are free, independent of theactual competitive conditions.

38
companies, subject to supervision by the Superintendent of Securities and Insurance (the
Chilean counterpart of the Securities and Exchange Commission). The law also required
that local telephone service providers not discriminate among long distance carriers with
respect to quality of service and information on long distance traffic demand. Moreover, the
charges to access the local network were regulated.
In 1988, the government set standards for mobile telephone service, though an early
entrant had had a concession since 1981. The new regulations created two concession areas
for mobile service, with two licenses in each area, to be granted on a first-come, first-served
basis. In November 1996, Subtel granted three nationwide PCS licenses, using a “beauty
contest” in which geographic coverage and speed of implementation were the key bidding
variables. Until 1999, subscribers had had to pay the same fee for both the calls they made
and the calls they received, which was a disincentive to the use of mobile phones. In
February 1999, the regulator introduced a “calling party pays” principle, under which
callers are forced to pay for all charges (including the regulated access charges) when using
mobile phones.28
3.1.3. Evaluation of Privatization in the Regulated Sectors
An assessment of the privatization efforts carried out at electricity and telecommunications
companies between 1985 and 1989 should consider the objectives of the process. As we
have mentioned before, the goals were to increase the efficiency of these firms and to
provide resources for investment in new capacity. Therefore, a complete evaluation of the
privatization-cum-regulation process would require, as a counterfactual, a prediction on
how the privatized firms would have developed had they remained in the public sector.
Here we take a more modest approach. We analyze, for each sector, the post-privatization
evolution of a set of variables, and relate their behavior to the regulatory changes. In
particular, the comparison between regulated utilities and those that operate in competitive
markets makes it possible to draw inferences regarding the effectiveness of the regulatory
system. In some cases, the differences are so significant that inferences can be drawn
despite the obvious limitations of this approach.

39
The Electric Sector
Between 1988 and 2000 electricity generation grew from 16,914 GWh to 39,142 GWh, and
installed capacity rose from 4,016 MW to 10,045 MW. In the Central Interconnected
System (SIC), capacity grew less than electric generation, as peak demand grew at a lower
rate during those years because of the use of peak-demand pricing.29 Moreover, power
generating firms have generally invested earlier than required under the government’s
indicative investment plan. Despite the installation of new capacity ahead of the plan, there
have been periods of energy shortages in the SIC due to the system’s heavy dependence on
hydroelectric power (in some years, such as 1992, 97% of generation is provided by
hydroelectric power). These outages, however, seem to have been caused by regulatory
failures.
Outages are caused by excess demand in relation to supply in especially dry years,
because the inflexibility of the (forward-looking) regulated energy prices for small
customers makes them unresponsive to supply constraints. When those hydrological
conditions are expected, the regulated or node price is set as the outage cost (i.e., the cost to
users of long-run supply failures).30 On the other hand, generating companies must
compensate users in future energy bills by an amount equal to the outage cost times the
amount of undelivered energy. Hence, during a severe drought, the actual price faced by
customers is the outage cost, making users indifferent between reducing their energy
consumption and not having energy, so that, in theory, the supply deficit should be
eliminated.
Unfortunately, this compensation mechanism has never been used. Regulations
(introduced at the suggestion of the largest hydroelectric operator) eliminated these
compensations when the drought is more severe than the driest year that is used in
computing the node price. Moreover, no procedures were introduced to deal with that case.
After the 1998 blackouts the law was modified and now imposes compensations under all
28 The high value of the mobile access charge has played a prominent role in the accusations by the localtelephone company that its competition is being subsidized.29 Initially, the creation in the early 1990s of an independent interconnected system in the northern part of thecountry helped increase the use of existing capacity in that area. However, business mistakes in the late 1990sled to overcapacity and large losses.30 In fact there are several such costs, depending on the severity of the energy deficit.

40
circumstances. In response, generators have not renewed their contracts with distributors to
supply energy at the node price, leading to an impasse.
Labor productivity in the privatized companies has improved considerably. In
ENDESA, the largest generator, power generated per worker rose from 2.2 GWh in 1989 to
18.1 GWh in 2001 (see Table 3.3). If we only consider employees working in the holding
company and in the generation subsidiaries, the power generated per worker rose from 6.3
GWh in 1991 to 28.7 GWh in 2000. Labor productivity in electricity distribution also grew
substantially after privatization. For example, Chilectra, the largest distributor, has more
than doubled its annual sales of electricity since privatization, from 3,612 GWh in 1987 to
9,253 GWh in 2001, and its customer base has grown from 973,000 to 1,289,000. The
number of workers, meanwhile, fell from 2,587 to 722, and the number of clients per
worker grew from 376 in 1987 to 1,785 in 2001. In addition, energy losses fell from 19% to
5.4% in the same period (see Table 3.4).
Table 3.5 shows the node prices in the two main interconnected systems (SIC and
SING), in current dollars and pesos. There has been a clear downward trend in energy
prices since generating firms were privatized. In constant pesos, the drop is approximately
33% for SIC and 73% for SING. This is explained primarily by the decline in the prices of
fuels used at the thermoelectric plants (partly due to the appreciation of the peso), which
play a part in determining marginal prices. In the SIC, the fall has been particularly sharp
from 1997 onwards, owing to the anticipation of the arrival of natural gas supplies from
Argentina (recall that the regulated price of energy is forward-looking). A greater load
factor as a fraction of installed capacity (i.e., the system operates closer to capacity) and the
transfer to consumers of these gains in productivity also help explain the lower prices. The
profits of the main power generating company have increased moderately since
privatization, reaching a peak of 15.7% return on equity (ROE) in 1995 and declining in the
following years. This decline is a result of unfavorable hydrological conditions and the fact
that the installation of more efficient combined-cycle gas turbines and the arrival of natural
gas from Argentina have reduced the economic value of existing plants.31 Note that the fall
31 Chile has no stranded cost principle, so the introduction of new technology may reduce the value of existingpower plants to zero.

41
in profitability in the generating industry led to further labor productivity gains in the late
1990s.
Table 3.3. ENDESA: Investment, Power Generation and Productivity of Labor
Local Workers Labor Prod.aYear Dom. Invest.US$M
Invest. AbroadUS$M
Dom. Gener.GWh All Generationb All Generation
1988 – – 7,420 – – – –1989 110 – 6,649 2,980 – 2.21990 – – 6,608 2,883 – 2.3 –1991 131 – 8,521 2,445 1,357 3.5 6.31992 47 102 10,022 2,347 1,302 4.3 7.71993 107 165 10,627 2,088 1,058 5.1 101994 94 51 11,277 1,970 1,970 5.7 5.71995 180 119 11,783 2,255 1,038 5.2 11.41996 235 391 12,898 1,692 879 7.6 14.71997 415 1,023 13,247 1,674 929 7.9 14.31998 579 462.6 12,188 1,763 980 6.9 12.41999 301 362.4 13,672 1,383 711 9.9 19.22000 145 78 15,346 888c 574 17.3 26.72001 – – 15,741 – – – –Source: Company’s annual reports.Notes: a: In GWh/worker. b: Assumes that 30.5% of employees work in transmission in 1991 and 1992 (the1993 figure). c: The reduction in the labor force is partially explained by the sale of the transmissionsubsidiary.

42
Table 3.4. Chilectra: Sales, Employees, Productivity of Labor and Energy Loss
Year 1987 1988 1989 1990 1991 1992 1993 1994 1995 1996 1997 1998 1999 2000 2001Sales (GWh) 3,612 3,844 4,070 4,230 4,568 5,338 6,476 6,359 6,676 7,256 7,647 8,175 8,425 8,854 9,523Customers 973 1,008 938 935 960 988 1,018 1,064 1,100 1,133 1,169 1,212 1,239 1,262 1,289Employees 2,587 2,565 2,144 2,159 2,125 2,086 1,856 1,823 1,801 1,643 1,662 1,383 1,383 867 722Labor Prod.a 376 393 437 433 452 473 549 587 610 689 703 724 896 1,455 1,785Sales/workerb 1.4 1.5 2 2 2 2.6 3.5 3.5 3.7 4.4 4.6 5.9 6.1 10.2 12,8Energy Losses (%) 19.8 18.8 16 14 13 12 10.6 9.3 9 8.6 7.6 6 5.3 5.2 5,4
Source: Chilectra’s annual reports. Notes: a: Customers per worker. b: GWh.
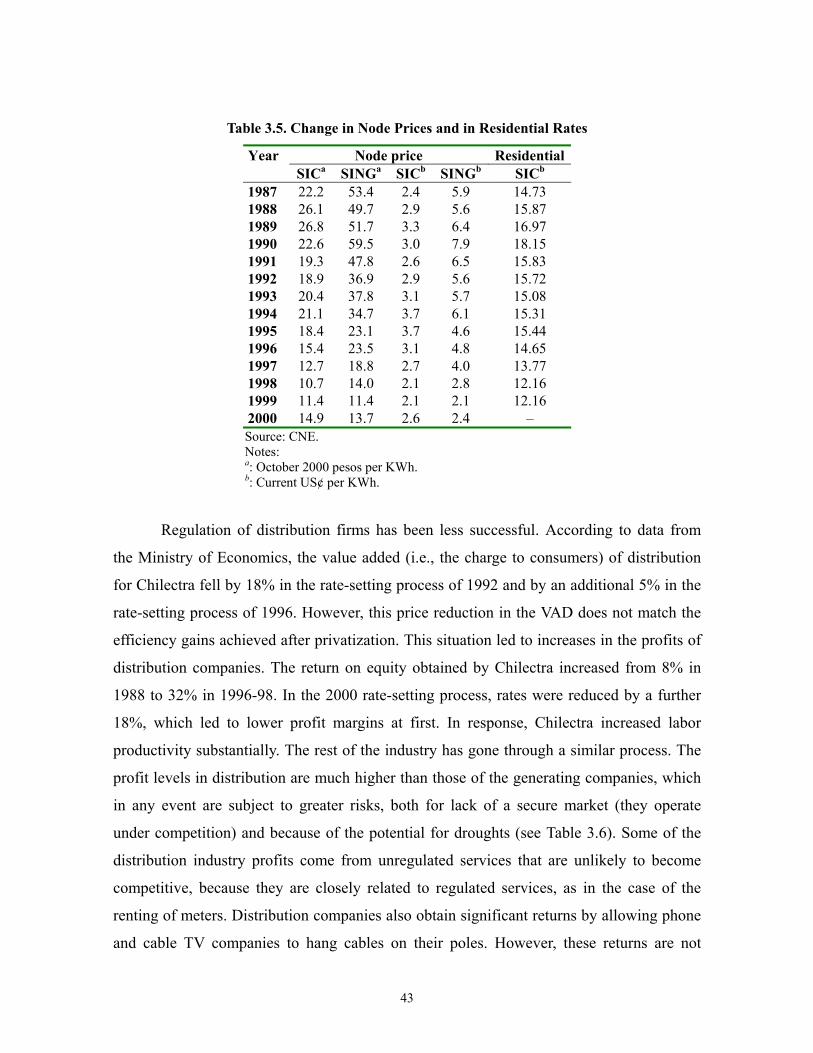
43
Table 3.5. Change in Node Prices and in Residential Rates
Year Node price ResidentialSICa SINGa SICb SINGb SICb
1987 22.2 53.4 2.4 5.9 14.731988 26.1 49.7 2.9 5.6 15.871989 26.8 51.7 3.3 6.4 16.971990 22.6 59.5 3.0 7.9 18.151991 19.3 47.8 2.6 6.5 15.831992 18.9 36.9 2.9 5.6 15.721993 20.4 37.8 3.1 5.7 15.081994 21.1 34.7 3.7 6.1 15.311995 18.4 23.1 3.7 4.6 15.441996 15.4 23.5 3.1 4.8 14.651997 12.7 18.8 2.7 4.0 13.771998 10.7 14.0 2.1 2.8 12.161999 11.4 11.4 2.1 2.1 12.162000 14.9 13.7 2.6 2.4 –Source: CNE.Notes:a: October 2000 pesos per KWh.b: Current US¢ per KWh.
Regulation of distribution firms has been less successful. According to data from
the Ministry of Economics, the value added (i.e., the charge to consumers) of distribution
for Chilectra fell by 18% in the rate-setting process of 1992 and by an additional 5% in the
rate-setting process of 1996. However, this price reduction in the VAD does not match the
efficiency gains achieved after privatization. This situation led to increases in the profits of
distribution companies. The return on equity obtained by Chilectra increased from 8% in
1988 to 32% in 1996-98. In the 2000 rate-setting process, rates were reduced by a further
18%, which led to lower profit margins at first. In response, Chilectra increased labor
productivity substantially. The rest of the industry has gone through a similar process. The
profit levels in distribution are much higher than those of the generating companies, which
in any event are subject to greater risks, both for lack of a secure market (they operate
under competition) and because of the potential for droughts (see Table 3.6). Some of the
distribution industry profits come from unregulated services that are unlikely to become
competitive, because they are closely related to regulated services, as in the case of the
renting of meters. Distribution companies also obtain significant returns by allowing phone
and cable TV companies to hang cables on their poles. However, these returns are not

44
considered when estimating the income of the efficient firm, so, in effect, consumers can
pay more than twice for the same infrastructure.
Telecommunications
Since privatization, the telecommunications sector has experienced rapid growth, as shown
by all indicators. Between 1987 and 2001, the number of lines in service rose by a factor of
almost six, so the line density rose from 4.7 to 23.1 lines per 100 inhabitants (Table 3.7). In
the main local phone company (Telefónica), which accounts for 76% of all subscribers,
average installation time was reduced from 416 days in 1993 to 6 days in 2001, and the
waiting list, which in 1987 included 236,000 people, had been reduced to 32,000 by 2001,
having reached a peak of 314,000 in 1992. Digital commutation rose from 36% in 1987 to
100% in 1993. Long distance traffic also grew significantly. Outgoing international traffic
rose by a factor of 10, from 21.2 million minutes in 1987 to 241.0 million minutes in 2001.
Growth was especially rapid after the introduction of competition in long distance services
(see Table 3.7). The number of lines per worker in the largest telecommunications firm
grew from 74 in 1987 to 845 in 2001 (see Table 3.8).
Table 3.6. Profits of the Main Electric Sector Companies: 1987-2000
Year Distribution (%) Generation (%)Chilectra CGE Chilquinta Saesa ENDESA Gener ElectroAndina Edelnor
1987 – 18.5 8.8 17.6 5.2 3.1 – -7.71988 7.4 19.7 12.4 19.9 13.7 7.8 – -2.81989 21.3 17.8 19.5 25.9 7.7 8.4 – -0.71990 22.9 17.5 19.5 25.2 6.4 9.4 – 3.31991 19.4 16.5 21.7 26.6 10.4 7.4 – 3.01992 17.3 16.7 42.3 24.9 13.5 7.3 – 3.41993 14.5 18.3 15.7 27.1 11.0 8.6 – 3.41994 17.9 17.1 7.9 22.5 15.7 8.4 – 7.21995 27.6 21.1 9.5 24.8 14.5 11.6 – 2.31996 32.1 22.0 19.8 26.3 12.7 9.5 – 0.11997 31.8 20.0 11.8 22.2 9.9 10.3 5.6 2.51998 31.6 20.2 9.3 18.6 3.6 5.9 8.2 2.61999 20.6 16.9 111.3ª 16.4 -13.5 0.8 6.2 -0.92000 16.0 15.3 8.9 29.2 9.1 0.3 8.8 -3.9Source: Authors’ computations from FECUs.Notes: a: Profits of Chilquinta in 1999 include non-recurring profits from sales of shares.

45
This period has also seen the emergence of new services, such as beepers, data
transmission, private networks and the internet. However, the new service that has had the
greatest impact is mobile services. At the end of 1997, 16 years after the entry of the first
operator, there were only 410,000 subscribers. This number rose sharply with the fall in
prices brought about by the entry of new PCS concessionaires. By mid-1998, the number of
subscribers had risen to 650,000. With the introduction of the “calling party pays” system
in February 1999, there was an additional jump in the number of subscribers. By the end of
2001 the number of subscribers had reached 5.3 million.32 This explosion in the number of
mobile phones is partially explained by the high level of the access charge to mobile
companies set by the regulator. This charge was set too high, so mobile phone companies
have been willing to give away the phones in order to benefit from the access charge paid
on incoming calls.
Real residential local telephone charges have increased by about 5% since
privatization (see Table 3.9). However, there was a simultaneous rebalancing of rates,
which makes it difficult to reach definite conclusions about the evolution of charges. Before
1993 phones rates were much higher for business subscribers than for residential clients.
Moreover, clients have benefited from the extension of basic phone zones. In fact, many
calls that were previously considered long distance calls are now considered local calls. In
1993 rates were 8.6% higher than in 1987 as a result of the 1988 rate-setting process. In the
1993 rate-setting process residential rates were further increased by 9.8%. This rate hike
was explained by the need to compensate for the partial elimination of subsidies from long
distance service to local service and the unification of residential and commercial rates.
Starting in 1994, access charges for long distance calls were substantially reduced.
32 The majority of the mobile phones are sold as calling card phones and do not have fixed monthly contracts.

46
Table 3.7. Telecom Statistics (1987-2000)
Year Lines in Servicea Densityb Mobile Phonesa Int. Trafficc
1980 363 – – 8.01985 537 – – 13.41986 558 – – 16.21987 581 4.7 – 21.21988 631 4.9 – 27.51989 689 5.4 4.9 29.91990 864 6.5 13.9 38.81991 1,957 7.8 36.1 47.01992 1,283 9.6 64.4 53.11993 1,521 10.9 85.2 59.51994 1,634 11.6 115.7 63.51995 1,891 13.2 197.3 113.61996 2,264 15.6 319.5 144.21997 2,693 18.3 409.7 198.81998 2,947 20.4 964.2 215.01999 3,109 20.6 2,260.7 210.22000 3,365 22.0 3,401.5 222.52001d 3,581 23.1 5,271.5 241.0Source: Subtel.Notes: a: Thousands. b: Lines /100 inhabitants. c: Million minutes. d: December2001 (estimated).
The 1999 rate-setting process can be considered a turning point. Basic phone rates
were reduced by 11%, at the same time that access charges to the local network were
reduced by an average of 72%. As a result, in 2001 basic phone rates for an average family
were still 5% higher than in 1987, but access charges for long distance calls were much
lower. The deregulation of long distance service in 1994 eliminated the need for rate-setting
in that market. Deregulation coupled with the reduction in access charges to the local
network led to a dramatic fall in long distance rates. This is illustrated by the value of a
one-minute call to the United States, a route that represents 42% of international traffic. In
1987 the average per minute cost of a call to the US was US$1.51. If the regulated rate-
setting process had remained in place, the price today during normal hours would be $2.40,
compared to the current price of about US$0.10.33

47
Table 3.8. Telefónica-CTC: Basic Fixed Phone Statistics
Year Linesa Share Workersb Lines/Workerb Install. Time Waiting Lista
1980 360 99.3 6,911 52 – 1501985 505 94.1 6,894 73 – 1811986 528 94.6 7,219 73 – 2281987 548 94.3 7,414 74 – 2321988 592 93.7 7,518 79 – 2361989 646 93.8 7,366 88 – 2841990 812 94.0 7,530 108 – 3081991 997 94.3 7,994 125 – 2411992 1,213 94.5 7,991 152 – 3141993 1,437 94.5 8,133 177 416.0 1981994 1,545 94.6 7,424 208 208.9 1171995 1,754 92.8 7,449 235 169.8 521996 2,056 90.8 7,073 291 55.4 721997 2,394 88.9 6,898 347 38.6 971998 2,650 89.9 6,917 383 35.4 581999 2,592 83.4 5,649 459 15.4 272000 2,701 80.3 4,639 582 4.3 102001 2,723 76.1 3,223 845 5.7 32
Source: Subtel and CTC annual reports.Notes: a: Thousands. b: Excludes employees working in subsidiaries.
Table 3.9. Monthly Bills: Local Telephone Service for the Average Family (Fixed charge plus variable consumption, including VAT)
Year (May) US$ May 1987 Pesos1987 11.62 9,8531988 11.00 9,1511989 11.24 8,3471990 13.44 9,4751991 15.69 10,2131992 17.75 10,1561993 18.91 10,8171994 19.96 11,7421995 24.36 11,5841996 25.33 11,4891997 25.65 11,9321998 25.11 11,3951999 23.57 11,4322000 19.43 10,1372001 17.11 10,340
Source: National Institute of Statistics (1987-1998), own estimations for 1999-2001.
33 The price drop has not been as sharp on other routes. Carriers pay so-called accountancy rates to theirforeign counterparts for traffic imbalances on international routes. On those routes where outgoing trafficexceeds incoming calls, the marginal cost of providing service should include the accountancy rate.

48
Since long distance companies, as well as other telecom operators, require access to
local networks in order to provide service, it became very important to regulate fees for
access to the public network. In the 1994 rate-setting process, the regulator established the
rule that the access charge for incoming and outgoing domestic long distance calls and
outgoing international calls would be 0.63 times the charge for a local call, which is higher
than the real cost of providing the service. Even worse, the per-minute access charge for
incoming international calls was set at a rate that was 14 times the local rate during normal
hours and 84 times the local rate during reduced-rate hours. High access charges to local
networks, coupled with strong competition in the industry on the part of the market leader,
Telefónica-CTC, meant that many long distance operators had serious financial difficulties
during 1994-1999 regulatory period. The local telephony companies, which were allowed
to operate in the long distance market through subsidiaries, had incentives to charge below
cost on long distance calls, since by lowering rates long distance traffic would increase and
the companies would benefit from the higher revenue arising from access charges to the
local network, a reward that the other long distance companies did not have. In response,
the 1999 rate-setting process reduced access rates by an additional 62.7% on national and
international outgoing calls. In the case of incoming international traffic, the charge was
reduced by 97.5% in normal hours and by 99.6% in off-peak periods (from the previous
high levels). The average reduction in regulated access charges was about 72%.
Prices of mobile telephony have also declined sharply with increased competition.
At the end of 1997, subscribers paid a fixed charge of 15,000 pesos plus 130 pesos per
minute for calls made as well as calls received. The entry of ENTEL PCS in March 1998
led to a marketing war among operators that entailed heavy spending on advertising and
brought about a significant decline in prices. In early 1998, Telefónica-CTC offered 60 free
calling minutes for a fixed monthly charge of 7,080 pesos and billed additional outgoing
minutes at 124 pesos during normal hours and 80 pesos during reduced-rate hours.34 In
addition, customers who signed a two-year contract received the mobile phone for free.
Other plans offered 200 free calling minutes for 16,000 pesos. Clearly, increased
competition significantly reduced rates.
34 The calling party pays principle means that incoming calls are not charged.

49
The profitability of Telefónica-CTC increased after privatization and remained high
until 1997, as shown in Table 3.10. Regulators were unsuccessful in passing Telefónica-
CTC’s efficiency gains on to customers. This state of affairs changed in 1998, as
Telefónica-CTC began to shift investment towards competitive sectors such as mobile
telephony and long distance. Telefónica-CTC was also affected by the rate-setting process
of 1999 that lowered local rates and access charges to the local network. Moreover,
Telefónica-CTC suffered from the devaluation of the peso (20-30%) that began in 1998,
since it had not hedged its dollar-denominated debt. Another negative effect was the decline
in demand growth and the increase in non-paying clients due to the economic slowdown
that began in late 1998. Finally, Telefónica-CTC is responsible for the access charges to
mobile phone companies of its non-paying clients, and these access charges are twenty
times higher than those that Telefónica-CTC can charge.
Telefónica-CTC has implemented a strict cost reduction plan, which has included a
drastic reduction in the number of workers. This cutback is due to the elimination of
inefficiencies in the firm as well as the reduction in planned investment made necessary by
the decline in profitability brought on by the new rates and slower economic growth. This
increase in efficiency allowed the company to achieve modest profits in 2001 after two
years of large losses. Since severance payments are large, part of the explanation for the
losses is the cost of scaling back the level of employment in the company. It is probable that
the company will have higher profits in 2002, as employment in Telefónica-CTC seems to
have stabilized.
The two basic regional telephone companies that are dominant in their respective
areas (Telcoy and CNT) were less affected by the rate-setting process and have maintained
their profit levels. ENTEL is in the opposite situation. While it was a regulated monopoly
provider of long distance services, its rates were much higher than the cost of providing
service, and this allowed it to have profit levels of above 50% for several years.
Deregulation led to dramatic falls in long distance rates and profits (see Table 3.10). In
1998 the company reported losses due to the strong competition in long distance, its
restructuring costs and the cost of entry into the mobile telephony market, where it has
become one of the key players. In 1999 and 2000 the firm showed profits once again, due

50
in part to the asymmetric access rates between the fixed and mobile networks and to its
successful marketing approach in mobile telephony.
Table 3.10. Profits of Telecommunications Enterprises (Return on Equity in %)
Year CTC CNT Telcoy ENTEL Telex BellSouth1987 11.5 20.1 20.5 56.4 – –1988 12.7 26.7 23.9 73.6 – –1989 17.8 18.7 26.2 73.8 57.4 –1990 12.9 20.2 15.6 52.7 21.9 –1991 16.2 22.7 16.7 50.5 14.5 –1992 19.4 29.2 22.8 49.7 28.3 –1993 23.0 30.2 30.4 37.4 58.9 –1994 18.7 24.9 32.2 17.2 16.5 0.01995 17.3 13.7 29.2 8.4 10.2 -70.41996 20.9 21.0 37.3 2.4 5.6 -250.31997 18.7 18.6 39.0 5.1 -29.9 -1.01998 10.8 24.1 47.8 -3.8 -41.5 62.61999 -3.8 24.6 36.3 7.0 -30.1 -3.02000 -8.5 15.7 20.0 6.3 -45.1 1.1
Source: Authors’ figures, based on companies’ annual reports.
In short, the telecom sector has been one of the most active in the last few years and
it is only since 2001 that a slowdown has become noticeable. The increased competition in
the sector has had a favorable effect on consumers, who are spoiled for choice. Even in
local calls, a market that is monopolized in most countries, the market share of Telefónica-
CTC has declined from 94% in 1987 to 76% in the year 2001. There are substantial
unresolved regulatory problems, however. The most important revolve around the
principles that should guide the regulation of access charges. The central issue is that, apart
from the direct effect on the profitability of the company, high access rates present a
negative externality cost on competitors. One dilemma is whether access charges should be
based on costs adjusted for the demand facing a company (since the local monopoly has a
higher phone density, costs are lower)—a principle which Telefónica-CTC claims
represents a subsidy to the competition and the competition deems essential for survival—
or if rates should be symmetric for identical services. The inclusion of fixed costs is also an
issue in this regard: should they be included in the cost calculations? Finally, a further issue
is that time-metering of calls or access may be inappropriate when capacity is not a
constraint (at least for standard telephone calls) due to technological change.

51
The underlying problem is that in the case of access charges, price competition can
break down. Consider a situation in which users value outgoing calls more than incoming
calls and Telefónica-CTC’s access rates are set low, while its smaller rivals have high
regulated rates due to their higher costs. A Telefónica-CTC client would pay the regulated
rate for calls within the Telefónica-CTC network, but a higher rate for calls to Telefónica-
CTC’s rivals. Conversely, a rival’s client faces a cheaper rate to call a Telefónica-CTC
phone. Since Telefónica-CTC is by far the largest company, with 76% of all telephone
lines, most of the other provider’s calls end up on Telefónica-CTC’s network in any case.
Since the competitors pay a low access rate for these calls, they might be able to charge a
low rate for phone service even though their own networks are more expensive. Thus the
rivals can gain market share at the expense of Telefónica-CTC by having high access
charges. Of course, if users also value incoming calls, this incentive to raise access charges
is smaller since clients will not appreciate the fact that people are reluctant to call them
because it is expensive. Nevertheless, on balance, heavy users of outgoing calls are more
attractive to firms than clients who put more weight on incoming calls.
On the other hand, the last mile is an essential facility in telecoms. Cable companies
usually have access to the last mile, but other operators (long distance, mobile telephony,
internet access providers) require access to the local telephone network (or to the cable
network) in order to reach consumers.35 Since Telefónica-CTC faces regulated rates, it has
incentives to become a monopoly in the competitive sectors.36 It can achieve a monopoly
by non-price discrimination against the other operators. In order to reduce this risk and
preserve competition in the other markets, the regulator may prefer to incur the social cost
of having more than one last mile service provider. Which option is better depends on the
extent of economies of phone line density.
3.2. Infrastructure Franchises
By the early 1990s, continuous high growth rates for the preceding years had led to
congestion and severe quality problems in highways, seaports and airports. Even though the
35 A wireless fixed system, WLL, has not been as successful as expected in breaking down the local telephonemonopoly in the last mile.36 See Beard et al. (2001).

52
government had increased the expenditure in infrastructure several times over the
minuscule amounts spent during the 1980s, they were insufficient. Therefore franchising
became the hope for rehabilitating and expanding public infrastructure. In 1992 a franchise
law was passed allowing the private sector to finance and operate highways, airports and
other infrastructure.
Franchises have other advantages in addition to solving the problems of
governments that do not have the resources (financial, managerial and supervisory) to
provide for infrastructure needs.37 First, when the same firm is in charge of construction
and maintenance there are better incentives to invest in non-verifiable quality; second, it is
politically easier to justify cost-based tolls when the project is a private concession; third,
the cost of the project is imposed on users and not on the rest of society; and fourth, there is
a built-in screening mechanism against socially wasteful projects, since a project with a
negative private return will most likely also have a negative social return (i.e., be a white
elephant). Moreover, when franchise auctions are open and competitive, tolls or user prices
should be close to average cost, which is second-best optimal in the presence of economies
of scale.
From 1994 to the present, 32 projects have been auctioned for a total amount of
about US$5.0 billion, of which 18 are already operational. In addition, in 1997 a law was
passed allowing franchises of the infrastructure of public ports. Currently, over 2,000 km of
interurban highways together with the main airports and seaports are privately managed.
Even though the system has been remarkably successful, there are several challenges for
the future. One of these is how to incorporate flexibility in order to react to changed
conditions (for instance, unexpected permanent increases in traffic that require widening a
road or raising the toll) while at the same time keeping a reputation for not renegotiating
contracts when the franchise is losing money or for expropriating money-making
franchises. Another problem is that most of the profitable private projects have been
franchised, and the projects that remain require government subsidies in order to have
interested bidders. The existence of government subsidies, however, negates many of the
advantages of infrastructure franchises and the optimal approach to franchising in this case
37 For more details on these arguments, see Engel et al. (To be published). For a different perspective, seeGómez-Lobo and Hinojosa (2000).

53
is equivalent to the traditional approach of franchising the building of the road out to the
lowest bidder and financing it upfront with public funds (Engel, Fischer and Galetovic,
2002).
3.3. Highways and Airports
The private sector has financed the construction of new highways and airports through
build-operate-transfer (BOT) concessions (see Table 3.11). More recently the government
has extended the range of concession contracts to the building of water reservoirs for
irrigation and to penal complexes (see Tables 3.12 and 3.13).38 In general the auction
process for concessions has operated as follows. The government sets the minimum
technical specifications of the project and grants a concession for 20 or 30 years to the
bidder offering to charge the lowest user price for building, operating and maintaining the
project. Bidders must first go through a technical vetting process that qualifies them to
make an economic bid. A ceiling and a floor price are imposed. If the ceiling is reached, the
bidders compete on the minimum subsidy requested. On the other hand, if the floor price is
reached, the firm that offers the largest payment to the state wins the concession.
The first project, a 42 million dollar tunnel, was put out to tender at the end of 1992,
completed in time at very close to the budgeted cost, and inaugurated in 1995. The most
important franchised highway project has been the improvement of the Pan-American
Highway, with a total investment estimated at US$2.4 billion, and total length of 1,511 km.
The project was divided into 8 segments and put out to tender, with concessions awarded
over a two-year period. The final stretch, adjudicated in May 1998, runs from Santiago to
Talca, with an estimated cost of US$750 million. The concession will last 25 years. Starting
in 1995, the cargo and passenger terminals of the eight main airports were awarded in a
public bidding process. Airport concession-holders have invested about US$271 million, of
which US$200 million were spent in Santiago.
38 There are some doubts about the rationale for this last type of concession contract, since it appears to be ameans of evading the standard budgetary process.

54
Table 3.11. Concessions That Are Operational
Project Name Project Origin Investment(US$M)
Franchise Length(yrs)
Northern access to Concepción Public 214 28Access to Santiago’s Airport Public 9 12La Serena Airport Public 4 10Route 78, Santiago - San Antonio Public 172 23.7Road of La Madera Public 31 25Road Nogales – Puchuncaví Public 12 22Road Santiago – Los Andes Private 131 28Route 5, Chillán – Collipulli Public 192 21Route 5, Los Vilos - La Serena Public 244 25Route 5, Santiago - Los Vilos Public 251 23Route 5, Talca – Chillán Public 171 12.5Route 5, Temuco - Río Bueno Public 211 25Carriel Sur Airport, Concepción Private 25 16.5El Loa Airport, Calama Private 4 12El Tepual Airport, Puerto Montt Public 6 12Iquique Airport Public 6 12El Melón tunnel Public 50 23Source: MOP

55
Table 3.12. Projects under Construction
Name % Built(December 2001)
ProjectOrigin
Bidder’s BudgetedExpense (US$M)
FranchiseLength (yrs)
Cerro Moreno Airport, Antofagasta 100 Private 8 10International Airport, Santiago 100 Public 170 15Punta Arenas Airport 98.95 Public 10 9Santiago-Valparaíso-Viña del Mar highway 77.96 Public 383 25Litoral Central Road 0 Public 67 30Route 5, Collipulli-Temuco 91.79 Public 256 25Route 5, Río Bueno-Puerto Montt 99.3 Public 236 25Route 5, Santiago-Talca and southern access toSantiago
33.78 Public 698 25
North – South urban highway, Santiago 1.08 Public 517 30Costanera Norte urban highway 33.4 Public 405 30El Bato reservoir, Illapel Auctioned 2001 NA 37 25Alternate Melipilla road Auctioned NA 19 25Américo Vespucio South urban highway Auctioned 2001 NA 28 30Américo Vespucio North urban highway, Santiago Auctioned 2001 NA 250 30International road 60 Auctioned January 2002 NA 165 30Route Talcahuano-Penco Auctioned 2001 NA 19 25Group 1 jails (Iquique-La Serena-Rancagua) Auctioned 2001 75 15 to 20Source: MOP.

56
Table 3.13. Projects in Progress
Project Name StatusDec. 2001
Project Cost(US$M)
FranchiseLength (yrs)
AuctionDate
BiddingDate
New Regional Airport, Atacama Call for bids 25 20 October 2001 April 2002Jails, Group 2 (Concepción, Valdivia) Call for bids 50 22 October 2001 May 2002Commuter Rail Melipilla-Santiago-Batuco Call for bids 300 18 July 2002Chiloé Bridge Call for bids 350 Approx. 30 August 2002Airport, Arica NYAa 10 10 June 2002 September 2002Jails, Group 3 (Santiago1, 2, V Region Interior) NYA 80 20 June 2002 October 2002International Airport IV Region NYA 45 20 November 2002Intermediate Tech., Recoleta - Independencia NYA 171 20 June 2002 December 2002Ecological Complex, Santiago NYA 50 30 2nd half, 2002North-West Access Santiago NYA 160 30 1st half, 2002 2nd half, 2002Exchange Stations Quinta Normal, Gran Avenida NYA 60 30 2nd half, 2002 1st half, 2003Land Port, Los Andes NYA 16 25 2nd half, 2002 1st half, 2003Intermediate Highway Ring, El Salto-Kennedy NYA 32 30 2nd half, 2002 1st half, 2003Convento Viejo Reservoir NYA 210 20 to 25 2nd half, 2002 1st half, 2003Improvement Route 5: La Serena-Caldera NYA 105 17 aprox. 2nd half, 2002 1st half, 2003Exchange Stations Pajaritos, Santos Dumont NYA 60 - 1st half, 2003 2nd half, 2003Jails, Group 4 (Santiago 2, Region V) NYA 50 15 to 20 1st half, 2003 2nd half, 2003New Airport Region IX NYA 48 20 to 25 1st half, 2003 2nd half, 2003Maintenance Route 66 NYA 64 18 1st half, 2003 2nd half, 2003
Source: MOPNotes: a: Not yet auctioned.

57
Concessions raise important regulatory issues. There are end-point problems,
especially regarding maintenance close to the end of the concession period. One major
dilemma is posed by the length of infrastructure concessions and the rigidity of the contract
rules. For instance, in cases of congestion, welfare maximization may require increases in
the user fee set in the original contract. The question is how to share the increased income,
since the firm bid on a lower price and unless it gets a fraction of the increased revenue,
prefers to keep the lower price. However, when contracts are expected to be renegotiated,
the benefits of competitive bidding are largely lost, since the firm’s ability to negotiate, or
its lobbying capacity, counts as much or more than its efficiency (Williamson, 1976).
Shortening the concession period is not a solution, since there would not be enough time for
concessionaires to recoup their investments, necessitating government subsidies.
The first infrastructure concession, the Melón Tunnel, illustrates these problems.
Though it had no cost overruns and was built on time, it has not been successful and is
unlikely to recoup the original investment (the firm has been making annual losses of about
US$1.5 million). The successful bidder fell victim to the winner’s curse (fairly common in
a newly-developed system such as infrastructure concessions), having offered to pay
substantially more than the runner-up. They overestimated the demand for the road at the
toll ceiling, since a significant percentage of drivers choose the old alternative road.39 The
winner has claimed that the lower-than-estimated demand is due to the construction of new
alternative roads and is offering to reduce the toll if the government lowers the annual
payment. Such an agreement would almost certainly be socially beneficial in the short run,
but the government has refused to renegotiate on the grounds that it would set a dangerous
precedent for the renegotiation of agreements.
Franchise-holders have discovered that willingness to pay is less than anticipated
when an alternative free route is available, even if an economic computation shows that the
savings in time and wear and tear on the vehicle compensate for the toll. Even in cases in
which alternatives are not competitive at all, demand can be highly variable and depend on
macroeconomic and regional effects. Moreover, the traffic on a specific road depends on
39 The franchise was awarded to the firm that had the highest score on an index that weighed (mainly) the tolland the payment to the government. Due to poor auction design, weights were set such that payments to thegovernment had a higher relative weight, so the bidders set tolls at the ceiling and bid positive payments.
58
the other links in the highway network. Thus, government may affect the demand on a
particular route when it alters the rest of the network, and government flexibility in this
respect is obviously required.40 The government dealt with this problem by introducing
minimum traffic guarantees, which promise that if traffic flows fall below pre-determined
levels (usually equivalent to the toll revenues that would pay 70% of estimated construction
costs), the government will make up the shortfall.
Giving guarantees to concession-holders makes it easier for bidders to obtain loans
in the financial system, which translates into a larger number of bidders and therefore
greater competition. On the other hand, state guarantees have some disadvantages. First,
they increase the chances that projects that are neither privately nor socially profitable will
be undertaken. Private investors might push for higher estimated construction costs so that
the guarantee covers all of their actual construction costs, even though they know that
actual traffic would probably be much lower (given that the guarantee covers 70% of
estimated construction costs). Second, it is inconvenient to eliminate all risks from the
concession-holder during the highway operation period, because it would mean losing the
benefits of private management. Third, guarantees create contingent liabilities for the
government, but are seldom valued and are excluded in the year-to-year budget or counted
as government debt. However, there is a seldom-observed political economy advantage to
guarantees: if traffic falls far below expectations, the government can always point to the
guarantees as a way of reducing the pressure to renegotiate the franchise contract.
In order to avoid some of the problems associated with standard auctions, the
government has been experimenting with a new mechanism advocated by Engel et al. (to
be published) for auctioning infrastructure concessions.41 In their proposal, the regulator
sets the maximum toll that the concession-holder can charge, and then awards the
concession to the firm demanding the least present-value of revenue (PVR) for building and
then operating the highway until the required revenue is collected through toll payments. 40 If the government promised to compensate the franchise-holders for each change in the network that wasclaimed to affect their traffic flows, there would be endless and expensive negotiation of the impact of thechanges. An example of the effects of these restrictions is Orange County’s Riverside Freeway, which isterminally congested because its contract with the private 91 Express Lanes does not allow expansion withoutpermission from the owner of the private franchise. See Engel et al. (To be published).

59
Hence the duration of the concession is endogenous. This auction mechanism reduces the
risk faced by the franchise-holder, because the present value of the total income the
concession-holder will receive is known in advance. This lowers the risk associated with
the time the franchise-holder takes to collect the required sum. The longer the time taken to
collect the desired income, the greater will be the operating and maintenance costs incurred
by the concession-holder.42
An additional advantage of PVR auctions is that they are inherently flexible. Early
termination of a concession is not a problem, if required, for instance, in order to widen the
highway. If the government compensates the operator with the amount remaining to be
collected minus estimated savings on maintenance and operation costs, this is a fair
compensation to the franchise-holder. Hence PVR greatly reduces the scope for
disagreement. The authority could also adjust the toll charged by the franchise-holder to
more closely approximate the optimal toll given the level of congestion.43
The highway linking Santiago and Valparaíso was auctioned using the PVR method.
In February 1998, a Spanish consortium won the concession. It sought a present value
revenue of UF (Unidades de Fomento) 11,938,207, or approximately US$400 million, an
amount it expects to collect in 15 years. The price-cap for the toll is 1,800 Chilean pesos
(about US$3). In this instance, the rules required that bidders seeking a minimum
guaranteed income would have had to pay the government for this guarantee. Remarkably,
two out of four bidders, including the winner, did not seek the guarantee. Thus, in principle,
the state did not assume any risk.
Starting in 1999 the government has awarded four urban highway concessions in
Santiago that represent a total investment of about $1,370 million (two franchises for the
improvement of a road that rings Santiago and two that cross Santiago in the North-South
and East-West directions). Auctioning urban highways has proven more difficult than
41 A similar approach had already been used in the UK when awarding the franchises of the Second SevernBridge and the Queen Elizabeth II Bridge over the Thames. The main difference with the UK approach isthat there were no auctions for the bridges.42 Since maintenance cost is directly related to traffic flow (and its composition), it is possible to reduce thisrisk substantially by bidding for a modified PVR which is computed net of an estimate of the roaddeterioration caused by vehicles. In that case, the only remaining risk is related to operational expenses, whichare minor and can also be accommodated through cost estimates.43 This requires that the contract specify a minimum toll in order to avoid the threat of expropriation of thefranchise-holder.

60
expected. First, in urban highways the range of government decisions influencing traffic is
much broader than in inter-urban highways. For example the construction of access roads,
complementary or substitute routes, the expansion of the subway system, or the
introduction of tolls on congested streets can affect traffic patterns. Moreover, the
construction of highways generates urban problems. For example, the construction of large-
capacity urban expressways can cause the deterioration of the surrounding area. In
Santiago, people living in a well-to-do residential area adjacent to a proposed highway
mounted a strong campaign against its construction. While they could not prevent its
construction, they forced major changes that increased the cost substantially. Ecologists
have opposed urban highways because they believe highways will encourage car use and
thereby increase pollution; instead they favor investing in public transport. While the
argument is correct when the highways are free, this is no longer the case when these
highways have tolls that depend on the level of congestion. The four highways that have
been adjudicated will reduce congestion substantially and the fact that users pay for them
implies that the standard relocation effects of free highways will be dampened.
3.4. Concessions for Port Management and Operation
There are 10 state-owned ports and 22 private ports in Chile. The state-owned seaports
have natural advantages due to their better geographical locations. In general the private
ports are used for bulk cargo, so they need less infrastructure than the state-owned ports,
which tend to specialize in general cargo (normally in containers). This type of cargo
requires calm waters for loading and unloading, so the state-owned ports are usually
protected by extensive works.
Private participation in state-owned ports started in 1981 when private firms were
allowed to perform the duties of loading and unloading ships at the docks, as well as on-
port storage services. This change greatly increased efficiency in cargo handling, making it
unnecessary to invest in expanding these ports, even though previously, under public
operation, the ports were terminally congested. The port authority (Empresa Portuaria de
Chile, or Emporchi), however, retained the management of all state-owned port
infrastructure, that is to say, docking sites and storage facilities (see Mardones, 2000).

61
In the mid-1990s, it became evident that rapid growth in foreign trade would, in the
short term, render inadequate the cargo transfer capacity of state-owned ports. This was
particularly true of ports located in the central zone of the country where, for geographic
reasons, there is little potential for development of new ports. Chile has few well-protected
bays and inlets and most of these lie in the middle of urban centers. Expanding the number
of docking sites at existing ports is possible, at least in the case of the port of San Antonio,
but costly. In addition to these stumbling blocks, a dearth of stacking and storage space at
the ports further compounds problems, since urban growth and sprawl has severely limited
the ability of these port service areas to expand.44 Finally, having multiple private operators
conspired against the coordination of activities and investment in specialized gantry cranes
for containers.
The government feared that inefficient port operations would have a multiplier
effect on the costs of the transportation chain. Ships range from large, fast and expensive
types to slower, more sea worn vessels. Since an efficient ship costs tens of millions of
dollars, from the point of view of a shipping company the main cost of an inefficient port is
not the fees for docking and loading/unloading but rather the capital cost of the ship.
Inefficient ports tend to receive slower, older and smaller ships with higher operational
costs. Hence, even in addition to having high docking and loading/unloading costs,
inefficient ports raise the total transport cost of traded goods by much more and render a
country uncompetitive in the international market for its goods. This was one of the fears of
the Chilean government, since Chile is an open economy that depends on remaining
competitive for its future growth.
The government believed that it was possible to expand the transfer capacity of the
state-owned ports by increasing private participation in port administration and operation.
Moreover, the government began to think of ports as consisting of terminals known as
frentes de atraque, which combine groups of docking sites and storage space that could
function as independent units. A single operator of a terminal, by coordinating activities
and internalizing all the benefits of investment in new equipment, would be the best way of
operating a terminal. Based on this assessment, a bill was introduced in Congress for
modernization of the state-owned port sector, which was enacted on December 1997. The 44 San Antonio is an exception and has been able to expand these support areas.

62
law split Emporchi into 10 different SOEs or port authorities, one for each state-owned
port, which were granted the power to award concessions to multiple or single private
companies for the administration and operation of port infrastructure.
Granting concessions for state-owned port administration and operations posed
certain risks to the sector’s competitiveness. There are only three ports in the central zone
of Chile (Region V), which is where the most of the general cargo enters and leaves the
country. Two of these ports are state-owned (Valparaíso and San Antonio) while one
(Ventanas) is privately owned. Altogether, these three ports are endowed with seven frentes
de atraque, but not all of these are able to berth large vessels. Additionally, it is necessary
to consider that some terminals are especially built for transfer of containers, others for
bulk cargo (where there is no lack of competition), and still others, for standard cargo.
In other countries, large-scale port users, mainly shipping companies, own their own
cargo terminals, because such an arrangement provides operational advantages. In Chile,
however, so few frentes de atraque are available that only a small number of users of
significant size would be able to own their terminal. This would, of course, place other
users at a great disadvantage. Even though regulations make it mandatory for prices to be
made public and set on a non-discriminatory basis, concessionaires can use subtle ways of
discriminating against non-integrated shippers that are difficult to prove and, therefore, to
penalize. These methods include assigning the choice spaces in the holding areas to one
company over another, providing better quality service to one company as compared to
others, using insider information, and manipulating docking reservations.
In drafting the port modernization law (Law 19.542), legislators took into account
the above-mentioned problems and included several clauses for the purpose of safeguarding
competition in the sector. First, the law requires that concessions be awarded through
public auctions and only for up to 30 years. Second, concessionaires must be incorporated
as publicly owned companies that are engaged in a single line of business. Third, the rates
set by concessionaires must be made public and established on a non-discriminatory basis.
Fourth, proposed by-laws and internal regulations for concessions are required as an
integral part of the rules of bidding. These rules must conform to objective technical and
non-discriminatory standards, especially with regard to assignment of spaces and reserve
capacity.
63
The two port authorities in Region V put up for simultaneous public bidding three
out of the six docking areas they owned. Two of these were the frentes de atraque capable
of berthing the largest vessels at each port, while the third was the bulk terminal of San
Antonio. The port authorities, in consultation with the Antitrust Prevention Commission,
imposed additional conditions on concession-holders to prevent risks of abuse of a
dominant position, as provided for by the law. Their conditions included ceilings on
horizontal integration, restrictions on vertical integration, additional rules of transparency,
reserving the right to set maximum prices in order to prevent low bidder turnout, and
quality standards.
The rules specified, for instance, that significant users (defined as those that shipped
more than 15% of the cargo in the region) should not own more than 40% of the stock
and/or voting shares in the firms that operated the port franchises. According to the port
authorities, it was necessary to limit significant users to a minority position in the company
in order to reduce the possibility of discrimination. Concessionaires are required to grant
any interested party expeditious access to information such as cargo contracts, service
priorities, and type of cargo and consignees, so that all of the interested parties would have
the same information. Finally, the port authorities can impose penalties for low quality of
service. Minimum transfer speeds and maximum waiting times for ships are specified in the
concession contracts.
The concessions were awarded in July 1999. In principle, each one was to be
awarded to the bidder that offered the lowest maximum port transfer rate index, which was
an average of 4 transfer charges. Nonetheless, in fairness to private port competitors, the
rules of bidding for each docking front specified a minimum rate floor index. Moreover, the
minimum rate floor has the beneficial effect of creating ex-post rents for the non-integrated
port, which implies that the incentives for underhand integration with a shipper and then
discriminating against its competition are reduced. In the event that more than one bidder
offered the minimum rate index established in the rules, a tie-breaking payment was to be
offered in addition.45 This payment was over and above the leasing payment that was
established in the rules of bidding for the port infrastructure, and was calculated on the
basis of the economic value of the property.

64
The bidding attracted a great deal of interest, and a total of 21 bids were tendered by
consortia made up of leading domestic and foreign companies, of which 19 included the
minimum rate index, plus the additional tie-breaking payment. All terminals were awarded
in the end on the basis of the tie-breaking payment amount. Consequently, the average
rates for port services were reduced by over 10% in the frentes de atraque that were
awarded in concession, and the government was also able to take in revenues of US$267
million, tripling its expectations (see Mardones, 2000).
The results of the first years of operation have also satisfied the government’s
expectations, as can be seen with data for the Port of Valparaíso (Table 3.14). The
efficiency in port services increased substantially. Similarly, the transfer speed at the port
of Iquique increased by 41% in just half a year.46 Finally, at the franchised terminal at San
Antonio, the main port, the transfer velocity rose from 475 tons/hour to 635 tons/hour, an
increase of 34%.47 With respect to the Valparaíso concession, investment in new cranes,
computer software and other equipment during 2001 topped US$8 million, with another
US$27.5 million expected by 2006.
Table 3.14: Valparaíso: Time Spent in Loading and Unloading (U/L)
and Transfer Velocity
1999 2001 2002 (est.) U/L Time (hrs) 45.0 26.3 21.0 Productivity (containers/hr) 25.5 43.7 54.8Source: Empresa Puerto Valparaíso. Loading and unloading timerefers to a Eurosal vessel with 1150 cargo movements.
4. Privatization of Social Services
In 1980, the military government introduced reforms that transferred a substantial portion
of its social security administration to the private sector. That same year, another set of
reforms began to transfer public education to the private sector through a system of implicit
vouchers. The prime objective was to improve efficiency (though there was an ideological
component independent of the efficiency objective), especially through competition in the
45 Ex-ante rents are dissipated via this cash payment. See Engel et al. (2001) for a detailed analysis.46 Report of the President of Empresa Portuaria de Iquique, 2000.47 Source: Empresa Portuaria San Antonio.

65
provision of social services. When the government handed the administration of these
sectors to the private sector, it also gave citizens the responsibility for their decisions
regarding social security and the education of their children. Since these are complex
services with asymmetrical information and strong externalities, the state retained a
supervisory role.
4.1. The Privatization of the Pension System48
One of the more radical reforms was the privatization of the pension system. In 1980 the
government approved a law that created private pension fund administrators (AFPs), which
began operating in July 1981. This new system introduced compulsory savings accounts for
retirement. Workers are required to deposit 10% of their gross wages (with a maximum
amount of 6 UF—around US$150/month) into the AFP of their choice. They can add
voluntary amounts in order to further boost their savings. The AFPs receive a commission
that is charged in addition to the amount that goes to the pension fund. In December 2000,
the commissions varied between 3.55% and 2.24% of the monthly income of a worker,
depending on the income of the worker and the specific policies of the AFP. The state
remained responsible for three specific aspects of social security. First, it regulates and
supervises the AFPs and created a specialized supervisory agency (Superintendencia) for
this task. Second, it pays the pensions of workers that have already retired and also receives
the contributions of the workers that chose to remain in the old pay-as-you-go pension
system. This required the creation of a new institution, the Instituto de Normalización
Previsional (INP). The third obligation is the financing of pensions for those workers whose
savings are not sufficient to finance a minimum monthly pension, as well as even smaller
pensions for those who do not have any resources.
The change from a pay-as-you-go system to a fully-funded, personal system
presented a huge cost to the state during the transition, as it had to continue to pay the
pensions under the old system as well as bonuses representing contributions to the old
pension system for those workers who switched to the new system. At the same time, the
number of active contributors to the pay-as-you-go system fell by 70% as workers
48 For a detailed account of the pension reform see Acuña and Iglesias (2000).

66
switched. The operational deficit of the pay-as-you-go system reached its maximum value
of 8.1% of GDP in 1992, and has been falling ever since, reaching a value of 3.7% in 2001.
The state was able to finance this deficit by reducing expenditures, with the income
received by the sale of state-owned enterprises and by indebtedness, partly to the private
pension system. For example, in November 1984, 43.3% of the assets administered by the
AFPs were government debt. This percentage has been falling and by February 2000, only
34.4% of the funds administered by AFPs were government debt.
4.1.1. Evaluation of the Private Pension Fund System
In order to analyze the effects of the private pension fund system, there are two aspects that
need to be considered. First, there are benefits to the agents that are directly involved: AFPs
and workers. A second possible aspect is the effect of the system on the economy as a
whole. We will concentrate on the first aspect, even though we briefly mention the global
effects of the reform. There is no question that the existence of AFPs, which were fairly
sophisticated investors (buying public debt, bonds and shares) as compared to average
workers or the state, gave a big impetus to the development of a local capital market.
Moreover, their existence made it easier to privatize firms during the second half of the
1980s, and their participation in the privatization process had the effect of distributing the
property of these firms among workers.
It is often mentioned that the private pension system raised the Chilean savings rate,
but the evidence is not conclusive regarding this issue.49 Clearly, the government’s decision
to reduce spending in order to help finance the transition to the new system did have a
positive impact on the national savings rate. However, the reduction in public spending
meant less investment in infrastructure, health and education (see Table 4.5 for spending on
education).
The owners of the pension fund administrators have clearly benefited by high rates
of return on assets, as can be seen in Table 4.1. By the mid-1990s, the AFPs became less
profitable, but this is partly explained by rent dissipation, i.e., an increase in the
competition among AFPs for clients. Sales efforts represented 36% of operational costs of

67
AFPs in 1997 (46% of operational costs if the life insurance premium is excluded). The
competition was so intense that every month 5% of contributors switched AFPs. In 1999, in
a misguided attempt to reduce the sales campaigns and hence lead to lower commissions
for contributors, the government introduced rules that made it more difficult to switch
AFPs. AFPs benefited most from the change as reduced competition led to an increase in
their profitability, given the levels of concentration in the industry. The government is
attempting to reintroduce more competition by opening the system to other financial
institutions.
Table 4.1. Profitability of the Private Social Security Fund Administrators and of the Funds (in %)
Year Administrators Funds1985 17.9 13.41990 56.7 15.61995 21.7 -2.51997 17.5 4.72000 50.2 4.42001 33.8 6.7
Source: Superintendencia de AFP.
The biggest advantage for workers is that they have more security in terms of the
fate of their pension contributions. Under the pay-as-you-go system, politicians used the
pension contributions as a piggy bank to be raided for political purposes. Pensions
depended in many cases on the ability to exert political pressure on the 32 different pension
systems. Even within one of these systems, there was a large degree of discretion in the
amounts a worker could receive in pensions. Hence, it was not uncommon for two workers
who had contributed exactly the same amount to receive vastly different amounts in
pensions. As a consequence of these problems, the system was bankrupt, so there was no
guarantee that the promised pensions could ever be delivered, and in fact the military
government reduced pensions discretionally in order to finance a budget deficit after the
1982 crisis.
49 Other authors attribute the increase in the savings rate to the 1984 tax reform that reduced to 10% theincome tax on retained profits of firms.

68
An often-touted advantage of the AFP system is that it allows for freedom of choice
among administrators. However, workers seem not to respond to the most important
variable in the system: the profitability of their pension savings, which depends, to a large
measure, on the commissions charged. According to a recent survey by the Centro de
Estudios de la Realidad Contemporánea (CERC), after more than 20 years of the system,
only 3% of the workers knew the commissions charged by the AFPs. Among the people
that had switched in the previous year, only 12% answered that they had done so because of
the higher profitability of the fund administered by their new AFP and only 17% said it was
due to the lower level of commissions. This lack of knowledge is the reason that AFPs
compete mainly by rent dissipation through sales efforts.
The members have also benefited from the high rates of return of their savings. On
average, since inception in July 1981 up to December 2001, the average real return on
pension funds has been 10.68%. These high returns are explained in large part by the huge
increase in the value of shares after the AFPs were allowed to invest significant amounts in
the stock market in the early 1990s. The returns have been more modest recently. From
January 1996 to December 2001, the return fell to 5.65%. Given that the AFPs are
constrained in the types and the amounts of instruments they can invest in, it is difficult to
judge the quality of their investment decisions. Moreover, since the law sets penalties for
AFPs whose fund returns fall by more than 2% below the average of the industry—while
there is no compensating benefit when the returns are higher than average (except for
marketing possibilities)—the AFPs tend to invest with herd-like behavior. This explains the
fact that the returns of all AFP funds show very little dispersion. The average returns have
varied from 10.43% to 11.00% annually since inception. In any case, the system has
allowed workers to benefit from the appreciation of the shares. The limits on investment
have been relaxed gradually and hopefully the ability to invest well will become more
important in the future.
The system is costly. As can be seen in Table 4.2, workers have to pay net
commissions (excluding the life insurance premium) in addition to the pension
contribution, which in March 1985 fluctuated between 31.4% and 53.6% of the pension
contribution, a fraction that depended on the income of the worker and the specific AFP. By
December 2001, commissions had fallen to between 15.1% and 27.2% of the worker’s

69
pension contribution. These numbers are very high when compared to the administrative
costs of the public pension fund, which represent 1.4% of the income of the system and 7%
of workers’ contributions. On the other hand, when the commissions in AFPs are measured
in terms of accumulation, they represented 9.1% of the accumulated fund in 1984 and had
fallen to 1% by December 2000. This price is still higher, but getting close to the cost of
similar funds in the US.
In order to know the effective rate of return enjoyed by workers, it is necessary to
subtract the commissions (net of insurance premiums) from the return of the AFPs’ funds.
For the period between July 1981 and December 2001 the effective return was 7.17% for an
individual who earned $105,500. For an individual earning the top rate for compulsory
contributions ($975,760), the effective return was 7.43%. To sum up, almost thirty percent
of the return on the AFPs’ funds went to pay their services. Moreover, the average rate
hides differences between AFPs, since for a low income worker, the effective rate of return
for the period between July 1981 and December 2001 varied from 6.61% to 7.71%—that is,
by more than one percentage point over more than twenty years.
Table 4.2: Commissions of Private Social Security Administrators
Year % of Contributions to the Fund % of Fund Accum.Maximum Minimum Average
Gross Net* Gross Net* Gross Net*1985 63.8 38.6 41.7 16.5 11.6 9.11990 62.3 52.0 31.9 21.6 4.2 2.41995 42.6 34.8 28.4 20.6 1.9 1.22000 36.6 30.2 22.5 16.1 1.5 1.02001 33.8 27.2 21.7 15.1 – –
Source: Superintendencia de AFP.Notes: *: Excludes the life insurance premium, estimated as 2.52% ofgross income for 1985, and 1.03%, 0.78%, 0.64 and 0.67% for the years1990, 1995, 2000 and 2002, respectively.
Over time these numbers have become less striking: from January 1996 to
December 2001 the average effective return was 4.51% for the lowest income workers and
4.66% for those with salaries of 60 UF, which is about 1% lower than the average return for
the fund: 5.65%. These numbers show that the system is becoming less expensive for
workers, probably due to scale economies.
70
Another problem with the system concerns options at retirement. There are severe
restrictions on how the fund can be disposed, the main choice being an annuity lasting for
the life of the pensioner (plus a smaller fraction to a widow), or a system by which the
pensioner receives a set annual fraction of the remaining funds (which can still earn
returns). The second option represents no additional costs for the retired workers, but the
first option, chosen by most pensioners as it eliminates investment risk, could be very
expensive, at times reaching more than 5% of total funds.50 These high commissions led to
intense sales efforts that in turn led to higher costs. The government has introduced
legislation that promises to provide better information on the costs of these annuities to
retiring workers and this has spurred a decline in commissions, which have fallen by almost
half.
4.2. The Health Insurance System51
Another innovation of 1981 was the partial privatization of the health insurance system.
The military government introduced a law-decree that created the private health insurance
firms, the Isapres. All active and retired workers must contribute a fraction of their income
to a health insurance system, but they can choose between one of the 15 open Isapres (four
of them have 67.2% of all policyholders) or the public health insurance system (Fonasa).
At present, the compulsory contribution corresponds to 7% of a worker’s salary, with a
maximum of 4.2 UF (i.e., corresponding to a salary of 60 UF or 975,000 pesos). Before
1981, all workers had to contribute compulsorily to Fonasa even when they did not use its
services due to their low quality or long waiting times. People that are self-employed can
also pay into either system (Isapres or Fonasa) and they represent 5% of the clients of
Isapres.
The biggest difference between the two systems is that Fonasa provides (virtually)
the same benefits to all insureds, independently of the contribution and the number of
dependents. Insureds can choose two different forms of health provision: free choice or
institutional. Under the first type of provision, the insured and his or her dependents can
50 Part of the commission was used to illegally provide cash to the pensioners.51 A complete, though slightly dated, analysis of the private health care system can be found in Fischer andSerra (1996).

71
choose a private health provider (with a contract with Fonasa), while making a co-payment.
In the institutional form, the beneficiaries get healthcare under the public system. In this
case, there are co-payments that increase with the income level and the system is free for
individuals with very low incomes. Since Fonasa serves the very poor without contributions
or co-payments, as well as providing public goods (vaccination programs and health
campaigns, etc.), it receives funding from the state that covers 44% of its expenses. Fonasa
also finances the primary health clinics, which have been under the supervision of the
municipalities since 1981.
Table 4.3. Statistics of the Private Health Insurance System
Year Beneficiaries Isapres Exp. Per Benef.2
Number % of Admin. Profit Health Isapres FonasaPop. Costs Rate1 Visits
1985 545,587 4.5 29.0 66.2 8.36 118.9 –1990 2,108,308 16.0 21.4 40.0 9.04 104.9 37.61995 3,763,649 26.5 20.0 30.9 9.41 147.4 88.31997 3,882,572 26.6 19.0 18.2 10.18 162.7 103.62000 3,092,195 20.3 17.5 12.2 13.12 212.5 118.333
Source: Series Estadísticas, Superintendencia de Isapres. Rodríguez and Tokman(2000). Notes: 1. Profits on equity. 2. In thousands of December 2000 pesos. Excludes thesubsidy of medically absence from work (on average 18% of total costs). Co-paymentsincluded, using data for the year 2000. The expenditure in the Program forComplementary food is excluded from Fonasa. 3. Corresponds to 1999.
The private system is run on a totally different basis: the applicant signs a contract
with an Isapre that specifies the benefits that the applicant and his or her beneficiaries will
receive, which depend on their number, age and sex. Moreover, Isapres are not required to
accept applicants. Clients can improve on their plan by paying additional, voluntary
contributions. In 2000, this voluntary contribution represented 26% of the compulsory
contributions. Those insured under the Isapres must use private health providers. To obtain
the benefits they can either buy a voucher prior to going to a doctor that is affiliated with
the Isapre or pay any doctor and then get a reimbursement from the Isapre. In general, the
reimbursement is not total and when using a voucher the beneficiary normally has a co-
payment. The amount of the co-payment or reimbursement depends upon the specific plan
that the client has contracted with the Isapre. On average, the co-payments represent 14.3%

72
of the compulsory contribution in the private system. There is no information regarding the
non-reimbursed fraction of expenditures of users that do not buy vouchers, but go directly
to their health providers and ask for reimbursement afterwards.
The private system is too expensive for most people. The beneficiaries of the private
system are employed with middle or high incomes and have low levels of health risk. The
7% compulsory contribution is not sufficient to buy into a good plan for lower income
individuals or for potential clients with high health risks. In these cases, the voluntary
contribution in order to get into an appropriate program would be too expensive. For
example, only 7.2% of the beneficiaries are older than 65 (this is an improvement over 4%
in 1990). The CASEN socioeconomic survey of 1988 showed that only 6.7% of the
population older than 65 and only 3.1% of the members of the lowest income quintile were
covered by the Isapre system (compared to 54.2% of the households in the highest income
quintile).
The number of beneficiaries of the Isapre system grew steadily until 1997, when
they represented 26.5% of the population. Since then, the percentage of the population
covered by the system has been decreasing slowly, reaching 20.3% of the population in
2000. There are several reasons for the fall in the number of beneficiaries: i) rising
unemployment rates since 1998, ii) the increased funding for Fonasa (expenditure per
insured has increased 300%) has made it a relatively more attractive system, iii) the 2000
removal of a subsidy to employers that reduced corporate taxes by up to 2% of the salaries
of employees if the employer applied it to collective plans in an Isapre,52 and (iv) the
increased supervision by Fonasa to bar clients of Isapres from getting free services (as
indigents) from the public system (a survey showed that 24% of beneficiaries of the Isapre
system had used the public system).
Another reason for families to move back to the public health system is that Isapre
health plans have become more expensive. The escalation in regulation of the private health
system has increased its costs (and also those of its public counterpart, see Table 4.3).
Furthermore, there has been an increase in both the number of health visits by beneficiaries
52 In a collective plan, the Isapre establishes a contract with a substantial number of workers in the company.The reduction in adverse selection and other expenses implies that the individual price of a plan can be up to30% less than when plans are contracted individually. Employers’ contributions under this subsidy amountedto 3.3% of the revenue of the Isapre system.
73
and in the cost of these visits. Rodríguez and Tokman (2000) have constructed an index of
all the classes of health services, valued at the prices paid by Fonasa to private providers of
medical services under the free choice system. The authors have estimated that this index
has increased by 104% in the period 1990-1999, while total cost (excluding the subsidy for
medical absences from work) increased by 165%, showing that there has been an increase
in the unit cost of medical care of 30%. In the public sector this increase in unit cost has
been much larger at 141%. Total expenditure in Fonasa has increased by 290% in the
period 1990-1999, while the number of individual health services has increased by only
22%. The large increase in unit costs can be interpreted as a loss of efficiency, but it may
also have a component of better quality of care.
4.2.1. An Evaluation of the Private Health Insurance System
The Isapre system was, until the late 1990s, a very profitable system. While the profit on
equity plus reserves was only 12.2% in 2000, it had been significantly higher in the past,
reaching 66.2% in 1985. Higher income households benefited from receiving better health
care in exchange for their compulsory contributions. An overall assessment is difficult,
since there is also the cost to the public health system, which lost the compulsory
contributions of these same households.
The expense per beneficiary in the Isapre system is almost twice as high as in the
public system, even though this difference has decreased over time. This comparison
underestimates the cost of the private health system, because it omits the direct payments of
Isapre clients for the part of their treatment that is not covered by their plan (the data on
expenditure in public health does not include the transfers from municipalities to the
primary health care centers, but this is a relatively small amount). Notice, however, that the
number of health visits does not differ between the two systems. Table 4.4 shows that,
except for the image tests (X-rays, NMR, CAT scans, etc.) the number of health services
does not differ by much between the two systems. In fact, the public system has more
surgeries, which are expensive.
A cursory analysis might suggest that the public system is more efficient. The
problem with that interpretation is that there is a significant difference in the quality of care

74
in the two systems.53 There are some economic principles that suggest that private,
individual health care insurance with free choice of services and providers is more
expensive than public insurance without free choice.54 First, because there is a tendency to
overprovide services: the classical example is the fact that 63.4% of all pregnancies in the
private sector end in a cesarean section, while the average for the public sector with no free
choice is about half that rate.55 Second, the administrative cost of individual insurance
contracts is higher, among other things, because Isapres evaluate the health risks of each
applicant and must ensure that the level of reimbursement and the coverage are appropriate
for his or her particular plan.56 In the year 2000, administrative and marketing expenses
were 17.5% of total revenues, while profits were equivalent to 2.2% of revenues. On the
other hand, Fonasa’s administrative expenses account for only 1.5% of total expenses.
Third, a centralized system may be able to contract services at monopsony prices.
Table 4.4. Health Services Provision per Beneficiary, 1999
Type of Service Fonasa Isapres Difference (%)Doctor Visits 3.85 3.89 1.0Lab. Exams 4.84 3.59 -25.8Image Exams 0.54 0.80 48.1Pathologic Anatomy 0.13 0.14 7.7Surgery 0.12 0.10 -16.7Average Cost* 61,352 59,474 -3.1
Sources: Anuarios Estadísticos Ministerio de Salud, SeriesEstadísticas, and Superintendencia de Isapres.* 1999 pesos. The prices of the Fonasa free choice program are usedin the valuation of services.
One of the main problems of the Isapre system is that plans tend to offer good
coverage for routine health care while offering poor coverage of catastrophic illness, which
is the main object of compulsory health insurance. In the last two years, strong criticism on
this basis has forced the Isapres to offer catastrophic illness insurance. This brand of 53 Another difference could be due to the fact that the aggregates in Table 4.4 may hide differences in thecomposition of services.54 On the other hand, another set of economic principles indicates that public systems are less efficient due tolack of competition.55 Interestingly enough, in the section of the public sector with free choice, the caesarean section rate is thesame as in the private sector. This suggests that free choice by itself leads to overprovision.

75
insurance operates on a system without free choice that takes over all expenses after the
beneficiary’s specified yearly expenditure cap is reached. This approach seems interesting,
but as there is little experience there are no serious evaluations of how it works. In any
case, it is interesting to speculate as to the reasons why clients would choose plans that lack
good coverage for catastrophic illness. One explanation might be that policyholders are
myopic and do not evaluate the costs of illnesses that are rare but for which treatment is
pricey. Second, insureds may move to the public sector if they have an illness that receives
little coverage under their private plan. Third, the system is not transparent, since plans will
claim to pay up to a certain percentage of a standard defined by the Isapre for a given
treatment, but this standard is seldom publicly available.
Another problem is that Isapres try to exclude beneficiaries who develop expensive
illnesses. In an attempt to end this problem, since 1991 the Isapres have been required to
renew the policy of any insured who so desires. However, the Isapres have found a way
around this obligation: they raise the prices of the renewal plans while offering new plans
with similar benefits at the original lower prices to clients that do not represent as high a
risk level. The Superintendencia that supervises Isapres has instituted rules that try to
reduce this type of risk selection, but it runs into the inherent instability of the private
health insurance system. Since low cost policyholders in a given plan are attractive to other
Isapres, there is a tendency to attract them to a plan with similar characteristics (in another
Isapre) but without the expensive individuals. Even if this last problem could be solved,
policyholders and/or their dependents who develop an expensive illness have lost their
ability to switch Isapres, thus losing one of the main advantages of the system: the freedom
of choice between Isapres. Most of these problems arise from the serious information
asymmetries in private health systems (see Fischer and Serra, 1996). There are ways of
reducing these problems, but they are intrinsic to private health insurance systems and
cannot be eliminated from a system that simultaneously has free choice of providers and
asymmetric information.
4.3. Public Education and School Vouchers
56 The Isapres must also ensure against fraud, which occurs when beneficiaries lend their personalidentification cards to non-beneficiaries.
76
The country has gone a long way towards decentralizing its publicly funded educational
system. In 1980, just before the policy reform that initiated the decentralization process, the
Economics Ministry spent 45% of its budget directly. At present, more than 93% of the
budget of the Education Ministry is transferred to local governments or to private or other
autonomous education organizations, as shown in Table 4.5. The main object of the reform
of the educational system was to improve the quality of the state-financed education by
creating competition between education providers. These institutions would compete for
students, as the transfers would be linked to enrollment figures. The government hoped
that competition would be based on the academic excellence of the education
establishments.
Table 4.5. Budget of the Education Ministry
Year Total Subsidies Other Transfers Tertiary EducationAmounts1 % Amounts1 % Amounts1 %
1980 657,317 47,729 7.3 2,582 0.4 246,214 37.51981 739,359 177,892 24.1 4,184 0.6 181,137 24.51985 667,028 301,531 45.2 82,596 12.4 183,979 27.61990 537,247 342,802 63.8 56,602 10.5 101,240 18.81994 803,076 484,509 60.3 117,722 14.7 132,230 16.52000 1,516,003 954,739 63 275,893 18.2 191,860 12.7
Source: Compendio de Información Estadística Educacional Año 2000. Ministerio deEducación, 2001.1. Amounts in millions of 2000 pesos.
The two main elements of the reform of primary and secondary education were: i)
the transfer of state-owned schools from the central government to the local municipalities,
and ii) the establishment of a common subsidy (an implicit voucher) per enrolled student
both at public as well as private nonprofit and for-profit schools. The only requirement for a
school to receive the implicit voucher is that the student be enrolled and attending classes at
the school. In 2000 the amount transferred to primary and secondary schools amounted to
809,006 million pesos. Of this amount, 322,378 million went to the private schools and
486,628 million was assigned to the municipal schools. The municipal schools received
additional funding for infrastructure amounting to 62,319 million pesos from the
municipalities and 56,898 million from the central government. Since 1993 the subsidized

77
private schools have been allowed to receive additional payments from the families of
students, subject to a series of conditions including paying an Education Ministry tax and
setting up a fund for scholarships for families that cannot afford to pay.57 Even though the
municipal schools can also charge additional amounts, those monthly fees are much
smaller. The local and central government funds received directly by the municipal schools
are slightly larger than the amounts received by the private subsidized schools from these
additional fees. González (2002) shows that the private subsidized schools received 68,600
million pesos from these additional fees, while the municipal schools received only 1,400
million.
The reform led to a large increase in the number of subsidized private schools from
1,627 in 1980 to 3,287 in 2000.58 The number of municipal schools fell slightly from 6,370
to 6,250 in the same period. In 1981, only 15.1% of all primary and secondary students
attended the subsidized private system (mainly religious schools) while 37.3% were
enrolled in these schools in 2000. One unintended consequence of the reform has been the
decrease in the rates of truancy, which is easily explained by the inherent characteristics of
the voucher scheme, though it is possible that the system has led to a loosening of the
standards for promotion of students.
Table 4.6. Types of Primary and Secondary Schools
Type of School 1980 1985 1994 2000Public, Centralized 6,370 808 0 0(%) 72.4 8.2 0.0 0.0Municipal 0 5,668 6,221 6,250(%) 0.0 57.8 63.6 58.9Private, Subsidized 1,627 2,667 2,707 3,287(%) 19.0 27 27.7 31.0Private, No Subsidy 802 668 860 1,068(%) 9.1 6.8 8.8 10.1Total 8,799 9,811 9,788 10,605
Source: Compendio de Información Estadística EducacionalAño 2000. Ministerio de Educación, 2001
57 The possibility has existed since 1980, but was scarcely used because 40% of contributions had to go to theEducation Ministry.58 Around 10% of the students belonging to the higher income groups attend purely private schools, whichreceive no subsidy.
78
The growth in the subsidized public sector might have been greater if the value of
the subsidy per student had not been reduced substantially in the mid-1980s. If we set the
real value of the subsidy per student at 100 in 1982, by 1985 the value in real terms had
fallen to 75, and even by 1990, it stood at 76 (see González, 2002). During the 1990s this
fall was reversed, and the real value of the subsidy index reached a value of 104 by 1994.
By 1999, the value was 169, implying that, in real terms, there had been an increase of
almost 70% in the resources per student in one decade. This implies that after the rapid
increase in the number of subsidized private schools of the early 1980s and the stagnation
of the late 1980s, the number of these schools started increasing once again by 1995. In
order to survive the decline in the value of the voucher in the period 1985–1994, the
subsidized private schools increased enrollment by 25%.
4.3.1. An Evaluation of the Reform
There is no question that parents value the freedom of choice, and this is one of the reasons
for the popularity of the new schools. A more complex question is whether the schools
enhance the quality of education. SIMCE tests, which are standardized national tests that
measure achievement of educational standards, shed light on this subject. On average, non-
subsidized private schools do best, subsidized private schools come next (much further
down) and the municipal schools have the worst performance on these tests. However, a
large fraction of the performance gaps across schools can be attributed to the differences in
socioeconomic background (including education) of the parents. In one recent study,
Mizala and Romaguera (2000) show that these variables explain the gap between the
performance of municipal and subsidized private schools on the SIMCE results of fourth
graders in 1996. In the same study, the unexplained difference between non-subsidized
private and subsidized private schools falls to only five points. The explanation for this
residual difference is probably the enormous difference in expenditure between subsidized
and non-subsidized private schools.

79
Table 4.7. SIMCE Test Results, Fourth Grade
Type of School 1988 1990 1992 1994 1996 19961 19991
Municipal 49.25 56.7 63.85 64.43 68.00 240 239Private, Subsidized 56.35 58.8 70.15 70.66 73.65 256 257Private, Non-Subsidized 76.15 80.05 86.05 85.07 85.85 294 300
Source: Ministerio de Educación. 1 Starting in 1999 a new evalution scale is used. The Ministry used an equating technique torecalculate the 1996 results.
However, these results are not robust, since in an analysis of the 1998 SIMCE for
the tenth graders, Mizala and Romaguera (2001) find that the subsidized private schools
had better results than the municipal schools, even after controlling for socioeconomic
variables. In short, it appears that the subsidized private schools have obtained results that
are equal to or better than those of municipal schools, even after accounting for
socioeconomic variables, and at lower government expense. In fact, the subsidized schools
have invested in infrastructure, while the municipal schools have relied on the previously
existing infrastructure of the state schools, and improvements have been financed by the
government. There are various possible explanations for this result. For example, perhaps
private schools have managed to do this because they are more flexible, have more students
per class and are apparently more efficient.59
Some facts point to a more rigid and less efficient municipal school system. The
idea behind the implicit vouchers is that the income of a school would depend primarily on
the number of students, and not on historical criteria of budget assignment. However,
mayors manage the income from vouchers corresponding to all students enrolled in their
municipal school systems, and for political reasons the mayors have refused to lower the
revenue of those schools with fewer students. A second factor is the Estatuto Docente
(Education Statute) of 1991, which made it almost impossible to fire teachers no matter
how bad their performance and set a fixed pay scale that depends on seniority, not merit
(see Beyer, 2000). For the last twelve years, the teachers’ association has managed to thwart
any attempts at evaluating teachers based on the quality of their performance. With respect
to the subsidized private schools, even though the minimum wage established in the statute
59 Since this is an area where ideology plays an important role, it is important to read the evaluations with apinch of salt.

80
applies to them, other conditions do not, and it is possible to fire teachers at the end of the
school year under the standard rules for labor contracts in Chile.
A different explanation for the better results obtained on standardized tests by
subsidized private schools compared to municipal schools is that the former can be
selective, whereas the latter cannot reject students unless they have no openings due to
excess demand for the school.60 Moreover, there might be a selection bias, since parents for
which their children’s education is a higher priority may prefer subsidized private schools.
Since there are so many alternative explanations, perhaps the comparison between
municipal and subsidized private schools is beside the point, as one of the main beneficial
effects of the voucher system has been to increase the awareness of school quality and to
make schools behave more competitively.
The fact that school-level SIMCE results are published has increased the incentives
for schools to compete for the best students, though not necessarily through improvements
in the quality of education. Moreover, prestigious schools can choose their students and
they screen for academic quality, so that standardized tests magnify the contribution of the
highly selective schools to the results.61
The overall results of the reform of 1981 are still unclear. For instance, Hsie and
Urquiola (2001) believe that the effects of the reform have been negative or at best
insignificant. They argue that the median quality of students in municipal schools declined,
as the best students have emigrated to the subsidized private schools. Since they believe
that students’ academic achievements depend upon the quality of their classmates, this
migration was bad for the students that remained (and, by the same token, it was good for
those that left). These authors claim that the loss to the first group is larger than the gain to
those that migrated, based on their finding that in those municipalities in which there is a
higher proportion of private schools, the average results on standardized tests are worse
than the national average. This finding is consistent with an educational production
function that shows better average results from aggregation rather than segregation of 60 See Gauri (1998) and Parry (1996). In a recent survey that examined the 100 schools of each type with thebest educational results, admissions testing occurred in 88% of unsubsidized private schools, 68% ofsubsidized and 22% of public schools.

81
students by ability. However, the inherent weakness of their claim is that it cannot clearly
separate cause from effect, since one among many competing interpretations might be that
there are more students in private schools in a particular municipality because the
municipal schools are worse than average.
Any analysis, moreover, must consider that there are several reasons why
competition between schools—the mechanism through which the quality of schooling was
to improve under the reform—has grown weaker. First, parents lacked objective measures
of school quality: tests equivalent to the SIMCE have been used since the 1980s, but only
in 1995 were these results at the school level published. Second, the Education Statute has
reduced flexibility in the hiring and dismissing of teachers. Third, municipal schools have
been shielded from competition.
4.3.2. Tertiary Education
There have been important changes in tertiary education involving universities, technical
institutes and other centers of post-secondary education. The changes involve financing,
management and the opening of the system to new, private entrants. The objective, once
again, was to improve the quality and efficiency of the system via the introduction of
competition. Once a more permissive environment was created, a large number of new
private universities were founded. Until 1980 there were only two public universities, plus
five state-financed private universities. In 1981 the regional centers of the two state
universities were split into 17 independent universities (three more regional centers became
universities later on). Simultaneously, the government introduced non-discriminatory rules
for creating new private universities without direct state financial support. There are now
39 new private universities, accounting for 32% of all university enrollment in 2000.
The financing of the university system has also changed radically. The education
authorities have channeled more and more resources to primary and secondary education,
as can be seen in Table 4.5. The main reason is that spending in universities is considered
regressive, since the majority of students belong to middle and upper income households.
61 In order to reduce any perverse incentives, in 1996 the Education Ministry introduced the NationalPerformance Evaluation System (SNED), which evaluates a school with respect to its own past history andwhich penalizes schools that expel students.

82
Moreover, there was evidence of a wider divergence between private and social returns on
primary and secondary education, which meant that there was less of a need to subsidize
college education since the benefits were well internalized. As a result of this change, state
financing of the university system was cut from almost 100% in 1980 to around 30% by
2000. Universities were allowed to raise fees to compensate for the reduction in direct
transfers from government. Until 1981 university fees had been nominal. Lower income
students benefited from a system of student loans at subsidized rates (2% in real terms).
These loans enabled students to pay their fees totally or partially, and in the case of very
poor students included small amounts for living expenses.
Table 4.8. Enrollment in Tertiary Education (Number of Students)
Type 1983 1987 1991 1993 1995 1997 1999 2000Universities 108,049 121,219 143,526 188,253 223,889 25,979 286,357 302,572 Traditional 105,341 113,567 114,698 138,267 154,885 175,641 195,372 201,186 Private 2,708 7,652 28,828 49,986 69,004 84,149 90,985 101,386IPa 25,244 29,595 37,376 38,076 40,980 56,972 74,456 79,904 Subsidized 1,772 10,548 6,802 0 0 0 0 0 Private 8 19 30,574 38,076 40,980 56,972 74,456 79,431CFTb 39,702 67,583 65,987 83,245 72,735 54,036 50,821 53,354TOTAL 172,995 218,397 246,889 309,574 337,604 370,798 411,634 435,830Source: Ministerio de Educación.Notes: a: Professional institutes. b: Vocational schools (Centros de formación técnica).
The system through which the state finances the university system was also
reformed in order to introduce competition. Until 1981, the government had made direct
transfers to universities to cover their expenditures. By the year 2000, only 42% of all state
financing of universities was via direct transfers. Another 10% went to the universities via
competitive improvement projects, 24% went to students (16% as student loans and 8% in
grants), 7% went to the universities that attracted the best students (according to the Prueba
de Aptitud Académica, a Chilean version of the SAT), 13% through competitive research
funds and finally 4% as the state contribution for private donations. The new private
universities can only compete for the last three sources of funds, and they have argued that
this is not a level playing field (though they are the main recipients of private donations). In
the future, state-guaranteed student loans will probably be provided to students in the new
private universities.

83
Our evaluation of these changes is positive. First, total enrollment in the university
system grew from 108,049 students in 1983 to 302,572 in the year 2000, vastly increasing
access to the university system—even though students pay substantial fees as compared to
the almost free universities of 1980. Private individuals have dedicated large resources to
university education, compensating for the decline in government support. Second, the
increased competition for public funds and, more recently, for students, has had a salutary
effect on the system. Concern for the needs of students and for the quality of teaching has
increased as the main universities face an increasing challenge from private universities.
An important problem is that there are few objective indicators of the quality of the
different educational institutions that can be used by students when selecting a university.
Most of the research is still carried out in the traditional universities, due to their longer
history and the fact they receive direct funding from the state. However, the traditional
public universities (except those that are linked to the Catholic Church, which face another
threat: many of the new private universities are competing for conservative, Catholic
students) suffer from management problems that may threaten their future. For instance, the
fact that presidents are selected by professors potentially creates conflicts of interest when
it comes to administrative and managerial decisions. Finally, the public universities labor
under an inflexible civil service system, which is another obstacle to good management.
5. Conclusions
This section collects our results and presents some hypotheses that offer consistent
explanations for these results. Unfortunately, the lack of information limits the verifiability
of these hypotheses. First, we find that privatized firms experienced significant
improvements in efficiency, but this improvement is no different than the change
experienced by other private firms in their respective economic sectors. This allows us to
conclude that Chilean SOEs were efficient before privatization, at least if we compare them
to private firms in their respective sectors. Other researchers, including Hachette and
Luders (1994) have noted this previously. This conclusion is consistent with the fact that
employment levels in privatized firms were stable for several years before privatization and
rose afterwards. This is not surprising given that many years prior to privatization, state-

84
owned enterprises (SOEs) had undergone reorganizations that were especially geared
towards reducing the number of workers (see Table 2.7).
Second, we find that there are significant differences between the post-privatization
performance of regulated vs. non-regulated firms. Hence we report separate results for each
group of firms. We give an account of adjusted results, i.e., where we have normalized the
performance of firms with respect to the performance of their economic sectors at the 2-
digit SIU levels. We focus first on the behavior of firms that were not regulated. Results for
this group show no major changes in efficiency measured as unit costs and sales over PPE
after privatization. Since these firms operated in competitive sectors and their efficiency did
not grow compared to other firms in their sectors, adjusted profitability should not show
major changes after privatization, as is the case.
The post-privatization performance of regulated firms is quite different. The
profitability of regulated firms grew after privatization. In fact, the ratio of net income over
PPE (physical assets) rose substantially, while the ratio of income to sales also increased,
though at a more modest rate. These firms enjoyed efficiency gains after privatization, but
those gains are not statistically significant. Similarly, the cost per unit indicator shows a
slight decrease, while the ratio of sales to PPE shows a modest increase. These results are
consistent with efficiency gains due primarily to a more efficient use of capital (and
probably a minor increase in regulated prices). There is some evidence that, prior to
privatization, regulated SOEs had overinvested in physical assets. This implies that
privatization should result in higher profits rates, as observed.
The implication is that Chile’s approach to incentive regulation has paid off,
promoting efficiency in regulated firms. As we have shown, the efficiency improvements in
the regulated sectors that were privatized do not lag behind those of the non-regulated
privatized sectors. On the other hand, regulators have been unable to transfer all these
efficiency gains to consumers. This should not come as a complete surprise. It is well
known that regulation is an imperfect substitute for competition, and Chile is no
exception.62 Moreover, the ability of regulators to transfer gains to consumers has recently
improved substantially.
62 See also the results in Section 2.3.1.

85
There remain, however, aspects of the Chilean regulatory legislation and practice
that should be improved. In particular, the transparency of the rate-setting process should
increase. Currently, regulators in the electricity and telecommunications sectors can
exchange the information used to set rates with the regulated companies; this prevents
consumer organizations from countering the lobbying pressures of the regulated enterprises.
The recent law regarding the water and waste treatment sector takes the opposite approach:
all the information used in setting rates must be made public. However, it is not clear that
this new law has been effective in restraining lobbying while at the same time limiting the
possibility of regulatory takings.
The regulatory process requires improvement in access to information on the
regulated firm. It also necessitates modeling an efficient firm, but this in turn requires
information that is uniquely available to the real firm, since costs depend, among other
factors, on topography, geographic density of customers, and demand. Regulators have
encountered major problems in gaining access to company data, because legislation does
not provide specific penalties for failure to deliver information or for submitting false
information. Currently, when a company refuses to hand over information, the regulator
must go to the courts, where the process is lengthy and penalties are low.
Another lesson that may be learned from the Chilean experience is the importance
of properly regulating essential facilities. The 1982 law had required the dominant local
telephone operators to provide interconnection access for other operators requesting it, with
the cost of access to be negotiated by the parties. However, the negotiation of these charges
led to prolonged lawsuits that made it difficult for new companies to enter the market. The
1994 law solved the problem by regulating all interconnection charges. Similarly, Chilean
legislation guarantees power generating firms access to the transmission system, but the
fact that the largest power generating company owned the transmission system, combined
with the fact that transmission tolls are negotiated, created some problems. In June 1997,
the Antitrust Commission ruled that the power generating company should divest its
transmission assets to an independent company.
Other types of natural monopolies were also privatized: those related to
infrastructure. In those cases, the rate-setting problem was solved by competition for the
field (see Demsetz, 1968), auctioning franchises to the firms that asked for the lowest user

86
fee. It has been a successful system. The main highways have been completely overhauled
and their capacity has increased substantially, reducing internal transportation costs and
making the country as a whole more efficient. There are only a few potential problems.
First, we have unaccounted liabilities due to the traffic guarantees offered by the
government to successful bidders, and, second, franchise-holders might be successful in
lobbying the government for changes in the terms of their contracts. In fact, many
contracts have already been renegotiated because the highway projects were awarded
through agreements that omitted important details and thus had to be revised. This has
meant a substantial (but not overwhelming) increase in the cost of the projects. On the other
hand, the government was able to remain firm when Tribasa (a company that had received
three important highway concessions) failed to complete one of its projects on time, and
this is an encouraging sign.
Seaport franchises have also been successful so far: investment has increased, port
efficiency is higher and ships require much shorter periods for loading and unloading.
There have been no complaints from shipping companies that they are discriminated
against in the franchised ports, so it appears that the horizontal and vertical integration
restrictions on the port operators have served their purpose. Despite these favorable results,
however, it is too soon to have a fair evaluation of the port franchises.
Finally, we consider social services, where there is competition between providers,
but state regulation is required due to information asymmetries. These sectors are also
characterized by the fact that the government either requires workers to buy their services,
or finances them out of public funds, as in the case of education. There have been important
benefits from the privatization of social services. In the case of the private pension system,
the likelihood of politicians being able to misuse pension funds is far lower, increasing the
security of pensions. In the case of health insurance and subsidized private schools,
competition from the private sector has increased the visibility of public sector
inefficiencies, creating pressure for improvement. This does not mean that privatization has
been trouble-free. The main problem has been the reluctance of private individuals to
acquire the knowledge needed to make rational decisions. As a result many individuals do
not understand some of the main aspects that are involved in the rational choice of a
provider of these services.

87
Limited understanding on the part of consumers has led providers to focus more
resources on marketing and sales efforts than on variables that are relevant from the point
of view of an enlightened policymaker (extent of coverage of a health plan in the case of
the private health insurance system, net rate of return on a pension fund in the case of the
private pension system and quality of schooling in the case of the subsidized private
schools). At the same time, regulation has prevented full competition. In private pension
funds, restrictions on portfolio investment and rules that penalize administrators whose
funds perform poorly (apart from the market punishment due to the defection of subscribers
to such a fund) result in all administrators obtaining similar performances on their fund
investments. As a result, competition between administrators has focused on variables that
are not relevant from the point of view of the objectives of the state. Similarly, beneficiaries
of the private health insurance system may prefer plans with little coverage for expensive
but rare diseases because they can always switch to the public system. In terms of
education, parents did not have objective measures of school quality until recently; only
since 1995 were such results published at the school level, and individual student results are
still not provided to the parents. The 1981 Education Statute has reduced flexibility in the
public system. On the other hand, municipal schools have been shielded from competition.
Hence the full gains from privatization have yet to be achieved.
To summarize, privatization has benefited the country, even in the case of the
regulated sectors. Due to market imperfections, it is not always easy to align the interests of
private providers and those of society as a whole. However, regulation has partially
succeeded in this goal, due in part to ongoing fine-tuning. The full benefits of privatization
in regulated sectors, however, will only be attained when citizens become more informed
consumers.

88
References
Acuña, R. and A. Iglesias. 2000. “La reforma a las pensiones.” In: F. Larraín and R.
Vergara, editors. La transformación económica de Chile. Santiago, Chile: Centro de
Estudios Públicos.
Beard, T. R., D. L. Kaserman, and J.W. Mayo. 2001. Regulation, Vertical Integration and
Antitrust. Journal of Industrial Economics XLIX (3): 319–333.
Beyer, H. 2000. “Entre la autonomía y la intervención: La reformas a la educación en
Chile.” In: F. Larraín and R. Vergara, editors. La transformación económica de
Chile. Santiago, Chile: Centro de Estudios Públicos.
Corporación de Fomento de Chile. “Privatización de empresas y activos, 1973-1978.”
Gerencia de Normalización de Empresas. Undated mimeographed document.
Demsetz, H. 1968. “Why Regulate Utilities?” Journal of Law and Economics 11: 55–66.
Engel, E., R. Fischer and A. Galetovic. To be published. “Privatizing Roads: An “Old”
New Approach to Infrastructure Provision.” Regulation.
Engel, E., R. Fischer and A. Galetovic. 2002. “Highway Franchising with Subsidies.”
Unpublished.
Engel, E., R. Fischer and A. Galetovic. 2001. “How to Auction an Essential Facility When
Underhand Integration Is Possible.” NBER Working Paper No. 8146. Washington,
DC, United States: National Bureau of Economic Research.
Fischer, R. and P. Serra. 2000. “Regulation of the Electric Market in Latin America.”
Economía 1(1): 155–198.
Fischer, R. and P. Serra. 1996. “Análisis económico del sistema de seguros de salud en
Chile”. Revista de Análisis Económico (11) 2.
Galetovic, A. 1998. “Desatando a prometeo: Reformas microeconómicas en Chile 1973-
1989”. Perspectivas en política, economía y gestión 2(1): 131–156.
Gauri, V. 1998. School Choices in Chile: Two Decades of Educational Reform. Pittsburgh,
United States: University of Pittsburgh.
Gómez-Lobo, A. and S. Hinojosa. 2000. “Broad Roads in a Thin Country: Infrastructure
Concessions in Chile.” Technical Report 2279. Washington, DC, United States:
World Bank.

89
González, P. 2002. “Estructura institucional, recursos y gestión en el sistema escolar
chileno”. Proyecto: Alcance y resultados de las reformas educativas en Argentina,
Chile y Uruguay.
Hachette, D. 2000. “Privatizaciones: Reforma estructural pero inconclusa”. In: F. Larraín
and R. Vergara, editors. La transformación ecónomica en Chile. Santiago, Chile:
Centro de Estudios Públicos.
Hachette, D. and R. Luders. 1994. La privatización en Chile. Santiago, Chile: Centro
Internacional para el Desarrollo Económico.
Hsie, C-T. and M. Urquiola. 2001. “When Schools Compete, How Do They Compete? An
Assessment of Chile’s Nationwide School Voucher Program.” Princeton and
Cornell Universities. Mimeographed document.
La Porta, R. and F. López-de-Silanes. 1999. “The Benefits from Privatization: Evidence
from Mexico.” The Quarterly Journal of Economics CXIV: 1193–1242.
Larraín, F. and R. Vergara. 1995. Macroeconomic Effects of Privatization: Lessons from
Chile and Argentina. Washington, DC, United States: World Bank.
Larroulet, C. 1984. “Reflexiones en torno al estado empresario en Chile”. Estudios
Públicos (14): 129–151.
Mamalakis, M. J. 1976. The Growth and Structure of the Chilean Economy: From
Independence to Allende. New Haven, United States: Yale University Press.
Mardones, J. L. 2000. “Concesiones portuarias en Chile: Una reforma para crear valor”.
Mimeographed document.
Meller, P. 1996. Un siglo de economía política chilena (1890-1990). Santiago, Chile:
Editorial Andrés Bello.
Mizala, A. and P. Romaguera. 2001. “Factores socioeconómicos explicativos de los
resultados escolares en la educación secundaria en Chile”. El Trimestre Económico
LXVIII(4): 515–549.
Mizala, A. and P. Romaguera. 2000. “School Performance and Choice: The Chilean
Experience.” Journal of Human Resources 35(2): 392-417.
Parry, T. 1996. “Will Pursuit of Higher Quality Sacrifice Equal Opportunity in Education?
An Analysis of the Education Voucher System in Santiago.” Social Science
Quarterly 77(4): 821–41.
90
Rodríguez, J. and M. Tokman. 2000. “Resultados y rendimiento del sector público de salud
en Chile.” CEPAL Serie Financiamiento del Desarrollo. Technical Report 106.
Santiago, Chile: CEPAL.
Rosende, F. and A. Reinstein. 1986. “Estado de avance del programa de reprivatización en
Chile”. Estudios Públicos (23): 251–274. Invierno.
Sáez, R. E. 1996. “Las privatizaciones de empresas en Chile”. In: O. Muñoz G., editor.
Después de las privatizaciones: Hacia el estado regulador. Santiago, Chile:
Dolmen-CIEPLAN.
Sanfuentes, A. 1984. “Los grupos económicos: Control y políticas”. Colección Estudios
Cieplan (15): 131–170.
Valenzuela, M. 1989. “Reprivatización y capitalismo popular en Chile”. Estudios Públicos
(33): 175–217.
Vergara, R. 1996. “Privatización de la banca: La experiencia chilena”. Estudios Públicos
(63): 335–345.
Williamson, O. 1976. “Franchise Bidding for Natural Monopoly–In General and with
Respect to CATV.” Bell Journal of Economics 7: 73–104. Spring.

91
Appendix
Table A.1. Changes in Profitability of Privatized Firms63
Mean Before Mean After t-stat for z-stat for Test forMean Before = 0 Test for
Mean After = 0 Variable N Median Before Median After Change in Mean Change in Median Median Before = 0 Median After = 0
All Firms Oper. income / sales 37 0.1182 0.2051 3.6298 * -2.5459 * 3.6213 * 7.62117033 * 0.0835 0.1512 0.0000 * 5,12E-09 * Oper. income / PPE 37 0.0969 0.2000 2.5620 * -2.9784 * 3.7906 * 4.71294353 * 0.0624 0.1269 0.0000 * 5,12E-09 * Net income / sales 37 0.0172 0.1303 3.2708 * -3.2811 * 0.6074 3.86796676 * 0.0192 0.1459 0.1620 5,42E-07 * Net income / PPE 37 0.0386 0.1636 3.3633 * -3.5189 * 2.8923 * 4.75558994 * 0.0214 0.0968 0.0494 * 6,17E-08 *
Non-Regulated Oper. income / sales 18 0.1113 0.1797 1.2527 -0.9808 1.8682 3.87255987 * 0.0763 0.1294 0.0038 * 0.00065613 * Oper. income / PPE 18 0.1206 0.2139 0.9345 -0.7277 2.4296 * 2.51257924 * 0.0711 0.0788 0.0038 * 0.00065613 * Net income / sales 18 -0.0331 0.0461 0.9706 -1.0124 -0.7044 0.76878742 0.0299 0.0456 0.2403 0.01544189 * Net income / PPE 18 0.0510 0.1273 0.9072 -0.5379 2.1953 * 2.00116015 0.0402 0.0476 0.0481 * 0.00376892 *
Regulated Oper. income / sales 19 0.1247 0.2291 4.7276 * -2.8465 * 4.0062 * 7.96572251 * 0.0872 0.1726 0.0004 * 1,91E-06 * Oper. income / PPE 19 0.0744 0.1868 5.8026 * -3.6347 * 4.4425 * 8.29444141 * 0.0549 0.1649 0.0004 * 1,91E-06 * Net income / sales 19 0.0649 0.2101 5.1091 * -3.3720 * 2.1687 * 9.66191041 * 0.0143 0.2030 0.3238 1,91E-02 * Net income / PPE 19 0.0268 0.1981 4.5417 * -4.2478 * 1.9231 6.76730152 *
0.0019 0.1607 0.3238 1,91E-06 *
63 In this and the following tables, a star (*) indicates a statistically significant value.

92
Table A.2. Changes in Operating Efficiency of Privatized Firms
Mean Before Mean After t-stat for z-stat for Test for Mean Before = 0
Test for Mean After = 0
Variable N Median Before Median After Change in Mean Change in Median Median Before = 0 Median After = 0All Firms Cost per unit 37 0.7049 0.6606 -1.8235 1.2595 22.8569 * 21.9694 *
0.7769 0.7149 0.0000 * 0.0000 *Sales / PPE 37 1.1686 11.157 -0.2074 -1.1838 4.3087 * 7.2498 *
0.5787 0.7487 0.0000 * 0.0000 *Sales / Employees 30 69284.4870 102795.0097 3.9218 * -2.1290 * 5.4755 * 6.5359 *
42013.6095 82924.2615 0.0000 * 0.0000 *Oper. Income /Employees 30 14705.0275 25088.0736 2.8042 * -2.7795 * 2.9264 * 4.2550 *
4087.5993 13788.9867 0.0000 * 0.0000 *Non-Regulated Cost per unit 18 0.6979 0.6747 -0.4239 0.3797 17.4061 * 14.3750 *
0.7234 0.6978 0.0000 * 0.0000 *Sales/PPE 18 1.7011 1.0906 -1.0359 -5.7266 * 3.2401 * 4.2907 *
0.6083 0.6532 0.0000 * 0.0000 *Sales/Employees 12 1.07647.9371 134806.9036 1.3016 -0.4041 4.0110 * 3.7855 *
85164.2136 107110.7778 0.0002 * 0.0032 *Oper. Income/Employees 12 29483.4651 39012.3794 0.8572 -6.2354 * 2.5880 * 2.8487 *
6807.3028 22053.4960 0.0002 * 0.0193 *Regulated Cost per unit 19 0.7116 0.6473 -2.7041 * 1.4159 14.9651 * 16.5470 *
0.8083 0.7257 0.0000 * 0.0000 *Sales / PPE 19 0.6641 1.1394 1.6805 -1.8539 6.3889 * 6.1465 *
0.5589 0.8323 0.0000 * 0.0000 *Sales/Employees 18 43708.8536 81453.7471 4.0624 * -2.9108 * 6.2884 * 8.6217 *
34940.3242 82345.8544 0.0000 * 0.0000 *Oper. Income/Employees 18 4852.7357 15805.2031 5.8470 * -3.8915 * 3.9250 * 6.8893 *
3448.3215 13788.9867 0.0007 * 0.0000 *

93
Table A.3. Changes in Investment and Assets in Privatized Firms
Mean Before Mean After t-statistic for z-stat for Test for Mean Before = 0 Test for
Mean After = 0
Variable N Median Before Median After Change in Mean Change in Median Median Before = 0 Median After = 0 All Firms Log (PPE) 36 16.45 16.76 1.16 -0.77 41.40 * 38.20 * 16.33 16.69 0.00 * 0.00 * Invest / sales 27 1.89 1.58 -1.79 1.60 6.52 * 6.81 * 1.57 1.29 0.00 * 0.00 * Invest / employees 24 133603.72 218207.47 2.54 * -1.51 3.86 * 3.79 * 61850.21 81526.35 0.00 * 0.00 * Invest / PPE 27 0.87 0.86 -0.07 0.94 8.89 * 9.45 * 0.77 0.80 0.00 * 0.00 * PPE / Employees 30 233653.76 330056.51 2.34 * -0.71 2.25 * 2.55 * 60346.70 70591.59 0.00 * 0.00 *Non-Regulated Log (PPE) 17 16.06 16.21 0.23 -0.33 21.99 * 19.98 * 16.03 16.58 0.00 * 0.00 * Invest/sales 11 1.84 1.79 -0.11 0.89 3.21 * 4.64 * 1.54 1.42 0.00 * 0.00 * Invest/employees 6 338457.90 600132.98 2.04 -1.28 3.60 * 3.98 * 304095.08 527720.58 0.02 * 0.02 * Invest/PPE 11 0.84 0.59 -0.79 1.74 3.99 * 7.82 * 0.59 0.61 0.00 * 0.00 * PPE/employees 12 470839.75 670100.97 1.70 -0.75 1.89 2.21 * 173215.30 283717.74 0.00 * 0.00 *Regulated Log (PPE) 19 16.81 17.24 3.52 * -0.83 44.46 * 43.50 * 16.57 17.19 0.00 * 0.00 * Invest/sales 16 1.92 1.43 -2.40 * 1.47 6.26 * 4.91 * 1.61 1.14 0.00 * 0.00 * Invest/employees 15 73002.07 103441.46 0.48 -1.68 6.77 * 5.15 * 52612.12 78829.13 0.00 * 0.00 * Invest/PPE 16 0.89 1.05 1.14 -0.83 10.16 * 8.35 * 0.88 0.97 0.00 * 0.00 * PPE/employees 18 75529.76 103360.21 0.64 -0.85 5.77 * 4.62 * 57560.86 70591.59 0.00 * 0.00 *

94
Table A.4. Changes in Profitability of Privatized Firms (Adj.)
Mean Before Mean After t-stat for z-stat for Test for Mean Before = 0 Test for
Mean After = 0
Variable N Median Before Median After Change in Mean Change in Median Median Before = 0 Median After = 0 All Firms Oper. income/sales 36 -0.05703177 -0.01289240 2.02030182 -1.13749125 -2.09258494 * -0.58857055 -0.05761266 -0.03138287 0.00059662 * 0.12149248 Oper. income/PPE 36 0.02232722 0.10933120 2.11989456 * -1.99342527 * 1.13846309 2.62978203 * -0.00307806 0.02960545 0.20251612 0.06624908 Net income/sales 36 -0.06218277 -0.03550831 0.84809775 -0.39418014 -2.64896279 * -1.35865814 -0.04055416 -0.03288875 0.03262267 * 0.03262267 * Net income/PPE 36 0.01494155 0.09646355 2.28581207 * -1.65555658 1.06828335 3.01145229 * -0.01109800 0.01416823 0.30885966 0.12149248 Non-Regulated Oper. income/sales 18 -0.01700443 0.03011643 1.00790419 -0.41130180 -0.34707857 0.80910461 -0.00721252 0.00052080 0.11894226 0.59273529 Oper. income/PPE 18 0.04085776 0.14104570 1.01449257 -1.01243520 1.12437947 1.77213505 -0.00307806 0.00943712 0.40726471 0.24034119 Net income / sales 18 -0.08798321 -0.04873002 0.56705274 -0.18983160 -2.04944212 -1.01502648 -0.01504578 -0.02428621 0.24034119 0.11894226 Net income / PPE 18 0.02116692 0.08047098 0.76127044 -0.22147020 0.87463926 1.41819608 0.01508835 -2.3359E-05 0.40726471 0.59273529 Regulated Oper. income/sales 18 -0.09705911 -0.05590124 1.82357058 -1.45537559 4.47820215 * 2.89599416 * -0.10852237 -0.07140012 0.00065613 * 0.04812622 * Oper. income/PPE 18 0.00379669 0.07761670 3.46317320 * -1.92995459 0.25431563 3.01215002 * -0.00316603 0.07560160 0.24034119 0.11894226 Net income / sales 18 -0.03638234 -0.02228659 0.47054554 -0.28474740 1.95116580 1.00981806 -0.04427092 -0.03686474 0.04812622 * 0.11894226 Net income / PPE 18 0.00871619 0.11245612 2.93451037 * -1.99323179 * 0.59406803 3.60101665 * -0.01402265 0.07831472 0.11894226 0.04812622 *

95
Table A.5. Changes in Operating Efficiency of Privatized Firms (Adj.)
Mean Before Mean After t-stat for z-stat for Test for Mean Before = 0 Test for
Mean After = 0
Variable N Median Before Median After Change in Mean Change in Median Median Before = 0 Median After = 0 All Firms Cost per unit 36 -0.0017 0.0055 0.2858 -0.1126 -0.0679 0.2343 0.0275 0.0322 0.4340 0.1215 Sales/PPE 36 0.6096 0.6121 0.0093 -1.0812 2.3561 * 4.0088 * 0.1922 0.2864 0.3089 0.0662 Non-Regulated Cost per unit 18 -0.0652 -0.0419 0.4396 -0.6328 -1.7328 -1.0239 -0.0441 -0.0093 0.1189 0.2403 Sales/PPE 18 0.8943 0.4995 -0.6096 -0.3797 1.7690 2.0071 -0.0600 0.1074 0.4073 0.4073 Regulated Cost per unit 18 0.0617 0.0529 -0.3107 0.8226 2.2441 * 2.8640 * 0.1164 0.0548 0.0481 * 0.0038 * Sales / PPE 18 0.3248 0.7248 1.7461 -1.4237 3.1721 * 4.0149 * 0.2820 0.4787 0.1189 0.0481 *
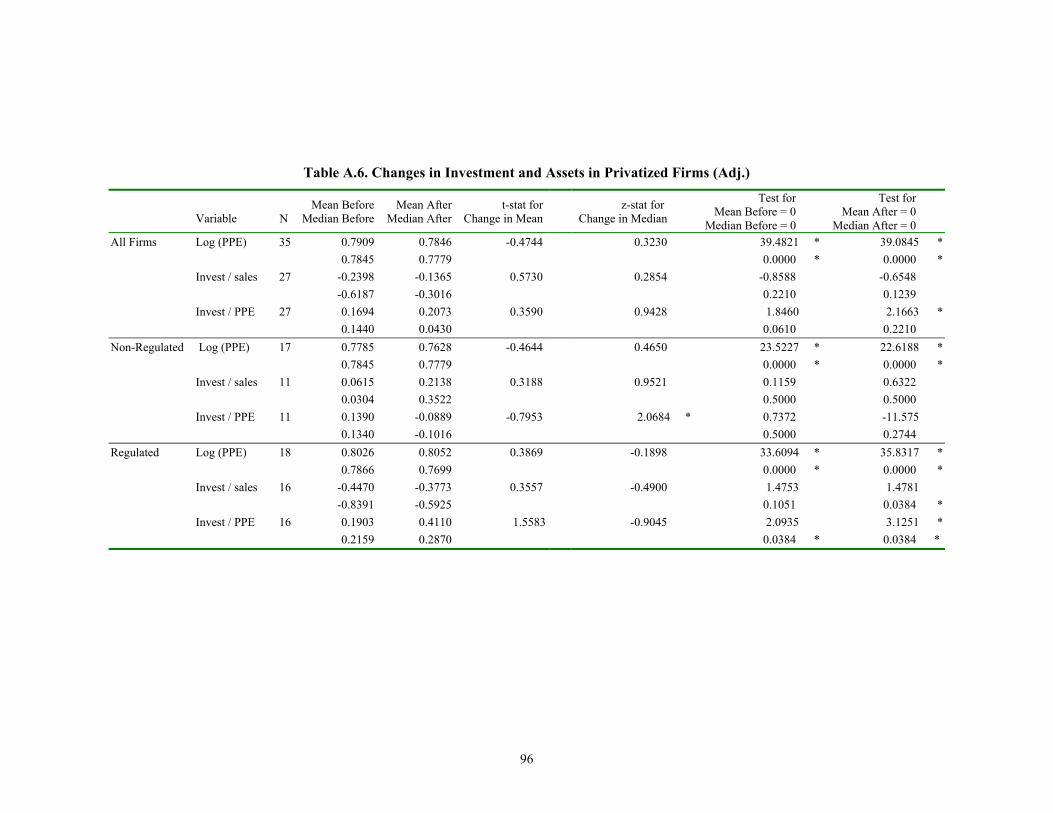
96
Table A.6. Changes in Investment and Assets in Privatized Firms (Adj.)
Variable
N
Mean Before Median Before
Mean After Median After
t-stat for Change in Mean
z-stat for Change in Median
Test for Mean Before = 0
Median Before = 0
Test for Mean After = 0
Median After = 0
All Firms Log (PPE) 35 0.7909 0.7846 -0.4744 0.3230 39.4821 * 39.0845 * 0.7845 0.7779 0.0000 * 0.0000 * Invest / sales 27 -0.2398 -0.1365 0.5730 0.2854 -0.8588 -0.6548 -0.6187 -0.3016 0.2210 0.1239 Invest / PPE 27 0.1694 0.2073 0.3590 0.9428 1.8460 2.1663 * 0.1440 0.0430 0.0610 0.2210 Non-Regulated Log (PPE) 17 0.7785 0.7628 -0.4644 0.4650 23.5227 * 22.6188 * 0.7845 0.7779 0.0000 * 0.0000 * Invest / sales 11 0.0615 0.2138 0.3188 0.9521 0.1159 0.6322 0.0304 0.3522 0.5000 0.5000 Invest / PPE 11 0.1390 -0.0889 -0.7953 2.0684 * 0.7372 -11.575 0.1340 -0.1016 0.5000 0.2744 Regulated Log (PPE) 18 0.8026 0.8052 0.3869 -0.1898 33.6094 * 35.8317 *
0.7866 0.7699 0.0000 * 0.0000 * Invest / sales 16 -0.4470 -0.3773 0.3557 -0.4900 1.4753 1.4781 -0.8391 -0.5925 0.1051 0.0384 * Invest / PPE 16 0.1903 0.4110 1.5583 -0.9045 2.0935 3.1251 * 0.2159 0.2870 0.0384 * 0.0384 *

97
Table A.7. Employment in Privatized Firms
N
Mean Before Median Before
Mean After Median After
t-statistic for Change in Mean
z-stat for Change in Median
Test for Mean Before = 0
Median Before = 0
Test for Mean After = 0
Median After = 0
All Firms 32 1193 1381 1.3374 -0.1880 3.8391 * 3.4071 * 380 360 0.0000 * 0.0000 *Non-Regulated 15 1557 1764 0.6502 -0.1867 3.1965 * 2.7635 * 754 874 0.0000 * 0.0000 *Regulated 17 871 1044 1.2049 -0.3272 2.2127 * 2.0096
179 236 0.0001 * 0.0001 *

98
Table A.8. Physical Productivity
Before After Percent Variation Unit of Measurement Non-Regulated CAP 0.0718 0.0629 -0.1233 Tons of steel forged [MTM/worker] Non-Regulated Colbún 17.0733 Non-Regulated Electroandina 12.4271 Non-Regulated ENDESA 2.6206 3.6677 0.3995 Energy generated [GWh/workers] Non-Regulated Fepasa 0.4554 0.4123 -0.0947 [Millions of tons km/workers] Non-Regulated Ferronor 0.2891 0.5084 0.7584 [Millions of tons km/workers] Non-Regulated Gener 5.7859 4.7388 -0.1810 Energy generated [GWh/workers] Non-Regulated Laboratorios Chile 1394.5421 Non-Regulated LAN Chile 1.7089 1.0008 -0.4144 [Passengers per kilometer/workers] Non-Regulated Pilmaiquén 7.1905 8.6277 0.1999 Energy generated [GWh/workers] Non-Regulated Telex 39.0387 Non-Regulated Mean 0.0778 Median -0.0947 SD 0.4002 N 7 Regulated Chilectra 1.3412 1.7036 0.2702 Energy purchased [GWh/workers] Regulated Chilquinta 0.8038 1.6152 1.0093 Energy purchased [GWh/workers] Regulated CTC 69.3534 151.1731 1.1797 Number of lines in operation [units/workers] Regulated Edelaysén 0.3208 Regulated Edelmag 0.6296 0.8611 0.3676 Energy purchased [GWh/workers] Regulated Elecda 0.9252 1.4479 0.5649 Energy purchased [GWh/workers] Regulated Eliqsa 1.6372 2.0288 0.2391 Energy purchased [GWh/workers] Regulated Emec 1.7957 1.4135 -0.2128 Energy purchased [GWh/workers] Regulated Emel 1.2992 0.8345 -0.3577 Energy purchased [GWh/workers] Regulated Emelari 1.0657 1.6876 0.5836 Energy purchased [GWh/workers] Regulated Emelat 1.5176 1.5749 0.0377 Energy purchased [GWh/workers] Regulated Emos 0.1911 Regulated IANSA 278.0696 266.4219 -0.0419 Sugar produced per worker [metric tons/workers] Regulated Saesa 0.6055 0.9196 0.5188 Energy generated [GWh/workers] Regulated Telefónica del Sur 39.0387 Regulated Mean 0.3466 Median 0.3189 SD 0.4612 N 12 All Firms Mean 0.2475 Median 0.2391 SD 0.4485 N 19

99
Figure A.1. Cost per Unit before and after Privatization, Adjusted and Unadjusted
(a) Cost per unit (mean) (b) Cost per unit (median)

100
(c) Cost per unit adjusted (mean) (d) Cost per unit adjusted (median)
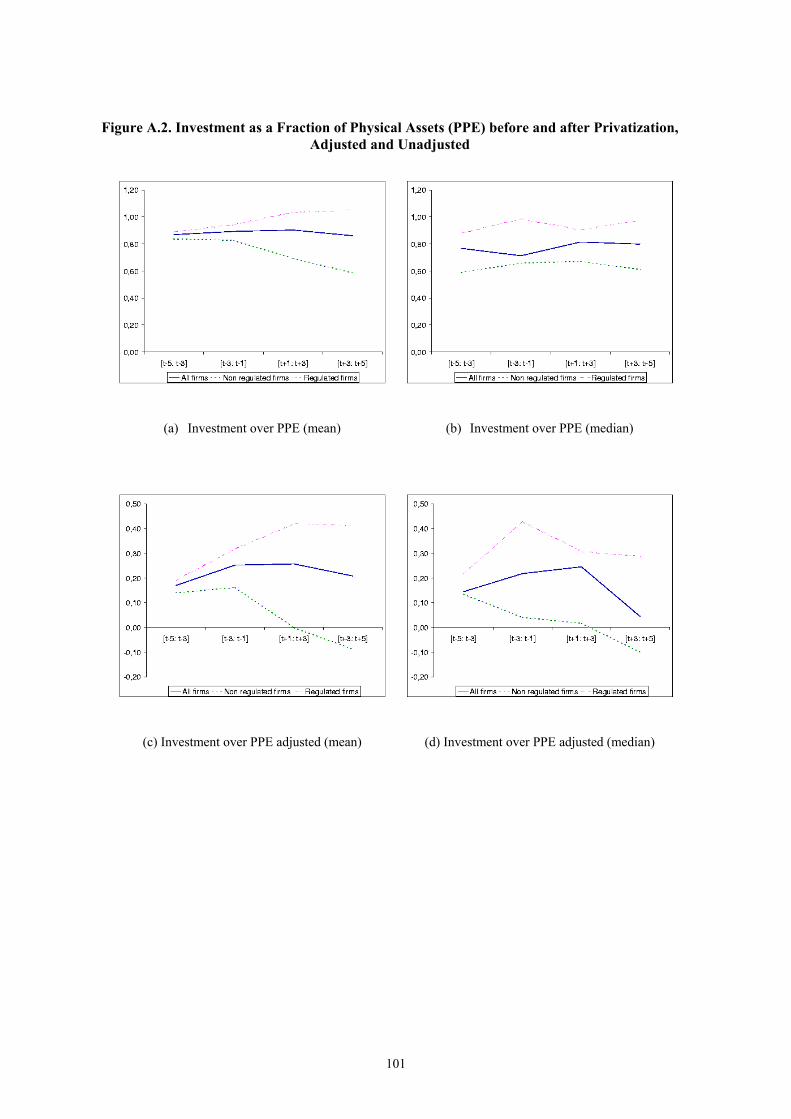
101
Figure A.2. Investment as a Fraction of Physical Assets (PPE) before and after Privatization,Adjusted and Unadjusted
(a) Investment over PPE (mean) (b) Investment over PPE (median)
(c) Investment over PPE adjusted (mean) (d) Investment over PPE adjusted (median)

102
Figure A.3. Investment as a Fraction of Sales before and after Privatization, Adjusted and Unadjusted
(a) Investment over Sales (mean) (b) Investment over Sales (median)
(c) Investment over Sales (mean) (d) Investment over Sales adjusted (median)

103
Figure A.4. Net Income as a Fraction of Physical Assets before and after Privatization, Adjusted and Unadjusted
(a) Net income over PPE (mean) (b) Net income over PPE (median)
(c) Net income over PPE adjusted (mean) (d) Net income over PPE adjusted (median)
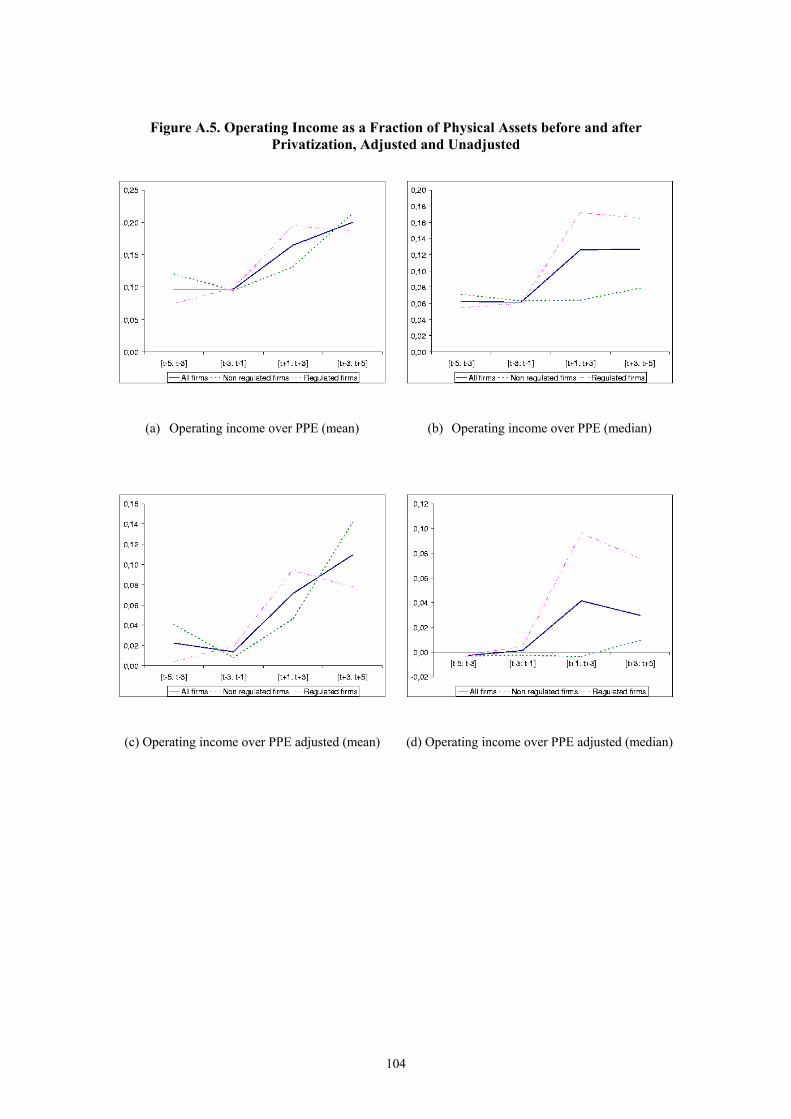
104
Figure A.5. Operating Income as a Fraction of Physical Assets before and afterPrivatization, Adjusted and Unadjusted
(a) Operating income over PPE (mean) (b) Operating income over PPE (median)
(c) Operating income over PPE adjusted (mean) (d) Operating income over PPE adjusted (median)

105
Figure A.6. Operating Income as a Fraction of Sales before and after Privatization,
Adjusted and Unadjusted
(a) Operating income over sales (mean) (b) Operating income over sales (median)
(c) Operating income over sales adjusted (mean) (d) Operating income over sales adjusted (median)