the effects of public terminal policies on air pollution ...eprints.qut.edu.au/2550/1/2493.pdf ·...
TRANSCRIPT

Transport and Communications Bulletin for Asia and the Pacific No.70, 2001
THE EFFECTS OF PUBLIC TRUCK TERMINAL POLICIES ON AIR
POLLUTION IN THE BANGKOK METROPOLITAN AREA
Kiyoshi Takahashi* and Ackchai Sirikupanichkul**
ABSTRACT
The present study was undertaken to examine the potential effects on air pollution
and traffic movement in the city of the three newly established public truck terminals inBangkok. The findings of the study reveal that the patterns of freight movement differ fromone distribution channel to another. These channels are categorized as traditional trade,wholesale and retail markets, and modern trading through chains of superstores andconvenience stores. An estimation of the emission loads from truck transportation wasmade by using empirical models and the geographic information system. The findingsshow that oxides of nitrogen (NOx) are the major emission load generated from trucks(61.73 tons per day), followed by carbon monoxide (CO) (37.72 tons per day). Emissionsof NOx from heavy-duty diesel vehicles (HDDV) are approximately twice as high as thosefrom light-duty diesel trucks (LDDT), despite the fact that the vehicle kilometre travel(VKT) of LDDTs is 7.3 times higher than that of HDDVs. Finally, the potential effects oftruck restriction policies on air pollution after the establishment of public truck terminalsare assessed through simulation studies. The results of simulation show that such truckterminals could help decrease VKT of HDDVs, but would increase VKT of LDDTs.Consequently, the terminals could help reduce emission loads of NOx by 825per cent and Suspended Particulate Matter (SPM) by 860 per cent from their presentlevels. However, emission loads of CO and hydrocarbons (HC) would be higher owing tothe increase in VKT of LDDTs. This increase in levels of CO and HC is not so important,since the number of LDDTs in Bangkok is much smaller than the number of cars, whichgenerate much higher volumes of CO and HC. The current 24-hour truck restriction onthe Outer Ring Road core is more effective in reducing NOx and SPM than that on theInner Ring Road core. Further policies need to be formulated to promote the usage oftruck terminals, which can lead to further reductions of NOx and SPM.
* Associate Professor, School of Civil Engineering, Asian Institute of Technology, P.O. Box 4, Klong Luang, Pathumthani 12120, Thailand. ** Research Associate, School of Civil Engineering, Asian Institute of Technology, P.O. Box 4, Klong Luang, Pathumthani 12120, Thailand.
41

I. OVERVIEW
Most of the freight traffic in Bangkok is generated by conventional wholesale and retail markets, private truck terminals, freight forwarders, factories and modern trade. The conventional wholesale markets are usually located inside the Inner Ring Road core. Most of the markets are categorized by type of goods: flower, vegetables, clothing, and so forth. These markets are under the management of either the Bangkok Metropolitan Administration (BMA) or the private sector. Recently, the construction of inner and outer ring road networks has made it possible to introduce large-scale, modern wholesale markets in suburban areas of Bangkok such as Simoom Muang and Talad Thai. At these markets agricultural products from other regions, are traded. The Government supports and promotes them because of their potentials to reduce the freight traffic volume in central areas of Bangkok. They provide more systematic and larger storage and handling areas for the massive volume of goods from the provinces.
Non-perishable goods such as clothing, groceries and processed foods are traded mainly inside the city. Commercial buildings are utilized as storehouses. Traffic volumes and the frequency of loading and unloading activities generated by these markets are less than those generated by markets of perishable goods, since non-perishable commodities can be kept in storage for longer periods. However, most of the trucks used in the wholesale markets are of medium and large types (6- and 10-wheeled trucks). The major problem of the wholesale markets is the lack of parking space. As a result, some loading and unloading activities take place at the roadside which obstructs the passage of other road users. The construction of multi-storey structures is one solution to the parking problem of these markets, for it could provide more space for parking and cargo storage. Other problems of the markets include poor accessibility and problems caused by truck ban regulations.
The conventional retail markets are scattered all over Bangkok, especially in residential and commercial areas. They are usually open from early morning until midday. Goods are transferred from these markets to vendors, hawkers, restaurants, hotels, hospitals, and supermarkets in small vehicles. Some markets are called “talad nud”, where various commodities such as vegetables, fruits, clothes, plants, pets, and so forth are sold on specific days fixed by the market manager. Several foreign companies have introduced modern trading through chains of superstores and convenience stores. Freight forwarding and logistics systems play an important role in this type of trading. The transport operations serving this type of trading are more efficient than the two other types discussed earlier. Interested readers are referred to Sirikijpanichkul (2000) for more details about freight forwarding and logistics operations in Bangkok.
The rapid economic growth and urban sprawl of Bangkok have resulted in higher volumes of inner city freight transportation. The increased usage of trucks, especially heavy trucks, has a major impact on traffic conditions, road safety and the environment of the city. To address the negative effects of heavy truck movements, the Government has formulated a number of truck operation policies and taken other measures. Time-based truck restrictions, zonal restrictions, and three suburban truck terminals have been introduced in order to restrict heavy trucks from entering the inner city. However, these policies and measures have strengthened the role of smaller trucks and vans in transporting goods in inner Bangkok.
42

The main objective of this study was to examine the effects of the new public truck terminals on air pollution in Bangkok. The paper is organized as follows: the first section provides an overview of present freight transportation arrangements in Bangkok, a statement of the problem and the objectives of the study. The second section is a review of the literature concerning a freight transportation model, an emission model and previous studies. The freight transportation plans and policies for Bangkok are presented in the third section. The results of the estimation of emission loads from existing truck-based freight transportation are presented in the fourth section. The fifth section summarizes the possible effects on emission loads after the introduction of public truck terminals in Bangkok. Finally, conclusions are drawn and some recommendations are presented for consideration by the concerned authorities.
II. LITERATURE REVIEW
A. Freight transportation model
There are differences between the forecasting models used in urban freight transportation planning and the ones used in urban transportation planning, although the process of modelling may be similar. The major problem in developing an urban freight transport demand model is the lack of freight movement data at all spatial levels. The availability of appropriate data directly affects the choice of techniques (Memmott 1983). A number of actors are involved in freight transportion, such as industrial firms, shippers, carriers and logistics service providers, which is another factor that complicates freight transport demand modelling.
There are two basic types of model that can represent traffic flow on road networks: traffic assignment models and traffic simulation models. The traffic assignment models have a limited range of applications owing to their inherent theoretical properties. The simulation models are further classified into two types: micro-simulation models such as NETSIM (network simulator) (Lieberman 1981) and macro-simulation models such as CONTRAM (contiuous traffic assignment model) (Leonard and Gower 1982). Some other types of model were also developed to represent the relationship between performance of road systems and other factors: for example, congestion functions to indicate the relationship between demand and performance of a road system. In this type, link cost function and cost models provide information on the cost of transporting goods by alternative routes, and by using different terminals and different types of vehicle (Jara Diaz 1982).
Most of the freight demand models developed have followed the conventional four-step modelling process, with some adaptations specific to freight, such as the models developed by Van Es in 1982, Kim and Hinkle in 1982, Friesz, Tobin and Harker in 1983 and Harker in 1985 (Ortúzar and Willumsen 1996). The models can be either trip-based or goods-flow based. Boerkamps and Binsbergen (1999) suggest that the trip-based models are not able to evaluate new transport systems. For goods-flow based models, goods flows are modelled based on their production or distribution, or both, and consumption points (shops or consumers). A vehicle-loading model assigns goods flows from origin to comsumption points. Finally, the flows are assigned to the road network.
43

B. Emission model
The diesel engine is a major source of air pollution owing to exhaust emissions of oxides of nitrogen (NOx), carbon monoxide (CO), Suspended Particulate Matter (SPM), sulphur dioxide (SO2) and volatile organic compounds (VOCs). The high levels of NOx emissions from heavy-duty vehicles are explained by the characteristics of diesel engines: they run at higher combustion chamber pressures and temperatures than petrol engines. The conditions of combustion are conducive to high levels of NOx emissions. SPM in diesel exhaust originates mainly from unburned fuel and engine oil (Weaver and Klausmeier 1988 and Conte 1990).
Studies have been carried out to investigate the relationship between road traffic operating conditions and emission loads. Two main emission models developed in the United States of America are currently in use: the Enviromental Protection Agency Mobile Source Emission Factor Model (EPA MOBILE), which is the most widely used, and the California Air Resources Board Emission Factor Model (CARB EMFAC), which is used in California. The structures of both models are the same. Activity-specific emission rates estimated by the models are multiplied by vehicle activities to provide emission outputs by pollutant (that is, grams per vehicle-mile for MOBILE and grams per vehicle-hour and per vehicle trip for EMFAC) (Guensler 1993). Baseline emission rates are derived from a laboratory test procedure known as the federal test procedure (FTP). The FTP driving cycle consists of a sequence of accelerations, decelerations, cruise speeds and idling based on actual home-to-work commuter trips in the 1960s on Los Angeles freeways and surface arterials (EPA 1993).
C. Previous studies in Bangkok
Emissions from on-road vehicles can be determined from vehicle mileage travel (VMT) and the emission factors of pollutants. Hanson and Lopez (1992) estimated the emission factors of CO. Later, Boontherawara (1994) developed the emission factors of NOx, which depend on temperature, vapour pressure, speed, operating mode, altitude, age of vehicle, and so on. However, the most important determining factor of the emission rate is vehicle speed (EPA 1996). Chulalongkorn University conducted a study to develop an emission database as an input to the “Airviro” computer program. The database of Airviro can be updated and used to estimate the emission load and its dispersion. The road network and traffic data needed for the program include hourly volume, traffic composition, speed, and average daily traffic (ADT). The emission load is finally estimated by the program from data on fuel consumption, traffic characteristics and VKT (Pollution Control Department 1994).
Tanadtang (1999) conducted a study on the effects of traffic on air quality through driving cycle tests by measuring and evaluating the exhaust emissions of petrol vehicles on congested and uncongested roads, suburban roads and expressways in Bangkok. Muttamara and Leong (2000) measured exhaust emissions from petrol vehicles in Bangkok by chassis dynamometer. A fleet of 10 vehicles of different models, years and manufacturers was selected for the purpose of measuring air pollutants in exhaust fumes. They found that average CO and HC emissions from 1990-1992 cars were 32.3-64.2 and 1.82-2.98 gm per km respectively and decreased to 17.8-40.71 and 0.75-1.88 gm per km respectively for the newer 1994-1995 cars. The results also indicated that air pollutant emissions significantly increase with increases in mileage and the age of the car. The study
44
also confirmed that there is a correlation between average air pollutant concentration and traffic speed.
III. FREIGHT TRANSPORTATION PLANS AND POLICIES IN BANGKOK
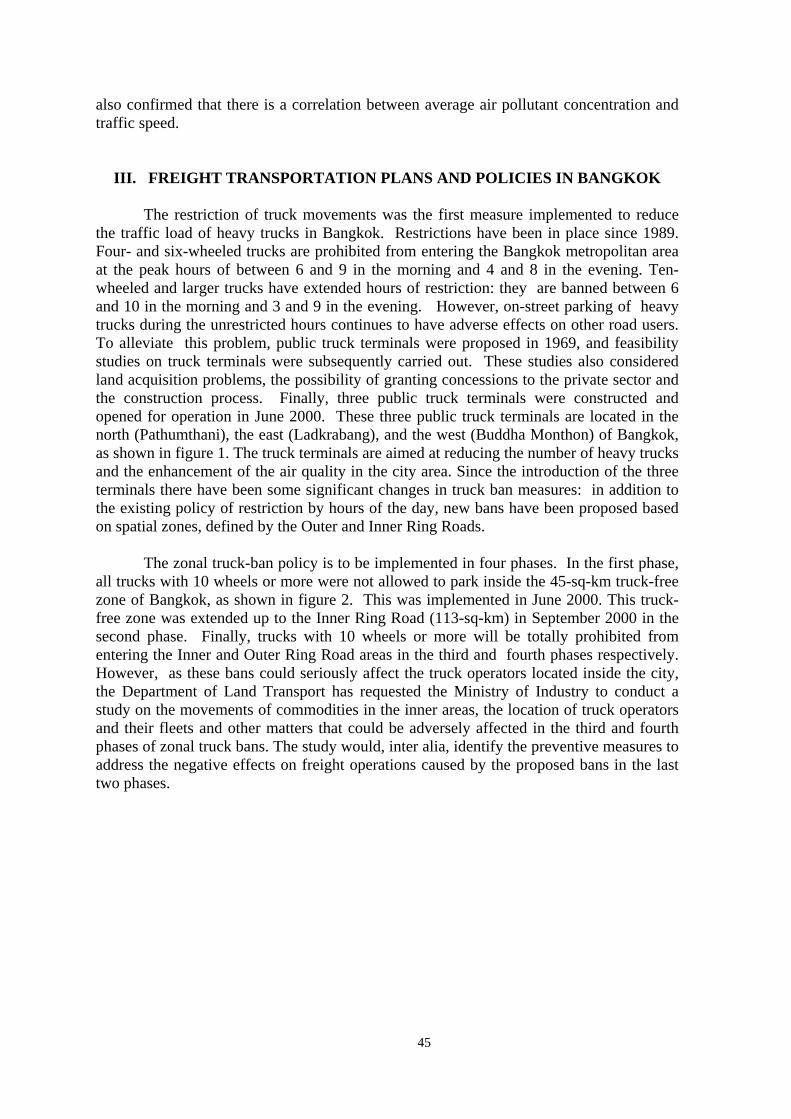
The restriction of truck movements was the first measure implemented to reduce the traffic load of heavy trucks in Bangkok. Restrictions have been in place since 1989. Four- and six-wheeled trucks are prohibited from entering the Bangkok metropolitan area at the peak hours of between 6 and 9 in the morning and 4 and 8 in the evening. Ten-wheeled and larger trucks have extended hours of restriction: they are banned between 6 and 10 in the morning and 3 and 9 in the evening. However, on-street parking of heavy trucks during the unrestricted hours continues to have adverse effects on other road users. To alleviate this problem, public truck terminals were proposed in 1969, and feasibility studies on truck terminals were subsequently carried out. These studies also considered land acquisition problems, the possibility of granting concessions to the private sector and the construction process. Finally, three public truck terminals were constructed and opened for operation in June 2000. These three public truck terminals are located in the north (Pathumthani), the east (Ladkrabang), and the west (Buddha Monthon) of Bangkok, as shown in figure 1. The truck terminals are aimed at reducing the number of heavy trucks and the enhancement of the air quality in the city area. Since the introduction of the three terminals there have been some significant changes in truck ban measures: in addition to the existing policy of restriction by hours of the day, new bans have been proposed based on spatial zones, defined by the Outer and Inner Ring Roads.
The zonal truck-ban policy is to be implemented in four phases. In the first phase, all trucks with 10 wheels or more were not allowed to park inside the 45-sq-km truck-free zone of Bangkok, as shown in figure 2. This was implemented in June 2000. This truck-free zone was extended up to the Inner Ring Road (113-sq-km) in September 2000 in the second phase. Finally, trucks with 10 wheels or more will be totally prohibited from entering the Inner and Outer Ring Road areas in the third and fourth phases respectively. However, as these bans could seriously affect the truck operators located inside the city, the Department of Land Transport has requested the Ministry of Industry to conduct a study on the movements of commodities in the inner areas, the location of truck operators and their fleets and other matters that could be adversely affected in the third and fourth phases of zonal truck bans. The study would, inter alia, identify the preventive measures to address the negative effects on freight operations caused by the proposed bans in the last two phases.
45

Khlong Luang Northern Truck
Terminal
Inland Container Depot (ICD)
Rom Klao Eastern Truck Terminal
Bu Buddha Monthon Western Truck
Terminal
Figure 1. Inner and Outer Ring Roads, ports and freight terminals in Bangkok
Bangkok International Airport
Eastern Outer RingRoad (37)
(In Service)Western Outer
Ring Road (37)(In Service)
Southern Outer Ring Road (37) (Under Construction)
Inner Ring Road Core
Second Bangkok International Airport
Port Motorway (36)
46

Samsen Rd. – Phra Sumen Rd. -Maharad Rd.
Truck Truck-free zone
Figure 2. Truck-free zone implemen
Besides zonal restrictions, some truck routes haaccess to ports and freight terminals located within the the Outer Ring Road and all links between ports and exof Land Transport 1999a).
IV. ESTIMATION OF EMISSION LOADS FROTRANSPORTATION IN BA
A. Data collectio In order to estimate emission loads from truck-bwas carried out, including all 50 administrative districto simplify the origin-destination (O-D) study. Twelvtruck terminals were selected as survey locations formovement and other related information through a qsurvey locations was based on size, location and type of
After defining the survey locations, a quesquestions and those on freight transportation data and frincorporated. The general questions related to the tyfactory, farm and garden, freight forwarder, or other); clothes and leather, fresh food, fruits, processed foods,and flour, manufactured products, or other); and the typwheeled truck, or van). Freight transportation data inclper week, origin and destination, number of trips per daweek, refuelling, load factor, loading and unloading tim
47
Chao Khun Thahan Rd.-Pradipat Rd.-Sutthisan Winitchai Rd.
Charoen Krung Rd.– Rama IV Rd.
Ratchadaphisek Rd.– Asok Rd.
ted in June 2000
ve been designated to enable truck restricted area. Such routes include pressway access roads (Department
M TRUCK-BASED FREIGHT NGKOK
n
ased freight transportation, a study ts of Bangkok. They were encoded e major markets and two private the collection of data on freight uestionnaire. The selection of the market, as shown in table 1.
tionnaire was designed. General eight transportation problems were pe of business (retail, wholesale,
the type of commodity (vegetables, meat and fish, flowers, rice, sugar e of vehicle (pick-up, 4-, 6- or 10-
uded distance travelled per day and y, age of vehicle, trip frequency per e, and travel time.

Table 1. Emission load survey locations by type of market
Location * Size of market No
Outer Ring Road Core
Inner Ring Road Core
Large (over 20,000 sq. m)
Medium (5,001 – 20,000 sq. m)
Small (less than 5,000 sq. m)
1 Inside Inside - 4 ( 3 wholesale, 1 weekend )
2
( 1wholesale, 1 private truck terminal )
2 Inside On - 1 (wholesale) -
3 Inside Outside 1 (wholesale ) - 3
( weekend )
4 On Outside - 1 ( retail market ) -
5 Outside Outside - - 2
( 1 weekend market, 1 private truck terminal )
Total 14 Notes: * See locations of Outer and Inner Ring Road in figure 1.
One thousand two hundred (1200) questionnaires were distributed and collected from truck users at 14 survey locations in November and December 1999. After screening, 910 valid questionnaires were accepted for analysis.
Data collected from secondary sources included truck registration numbers from
1981 to 1999, emission factors of LDDTs and HDDVs, and the estimated number of trucks using the public truck terminals. These data were obtained from the Department of Land Transport (1999b), the Pollution Control Department (1994), and the Japan International Cooperation Agency (1992) respectively. Geographic information on Bangkok from SmartMapTM ( a GIS-based program) was applied to estimate VKT. There are two methods to estimate VKT: the average daily traffic (ADT) method and the method based on a distance-travelled analysis. The second was selected for this study because of the lack of the necessary traffic data for the first method. For travel time, the interview technique was applied. The whole process of data analysis is shown in figure 3.
B. Some general characteristics of freight traffic
It was found that the small pick-up truck was the major type of vehicle used in freight transportation (93.8 per cent), followed by 6-wheeled trucks (4.2 per cent). Other types formed the rest. Most of the trucks carried goods from factories, wholesalers, and warehouses and truck terminals to vendors, fresh markets and retail or grocery shops. The load factor of trucks carrying manufactured products was highest (88.3 per cent), followed by fruits (85.9 per cent), and clothes and leather (82.8 per cent). In terms of origin, trucks from factories had the highest load factor (88.4 per cent), followed by trucks from warehouses or truck terminals (88.1 per cent) and wholesalers (86.8 per cent).
The peak hours for truck movements to and from fresh markets were between 5 and 8 in the morning. For processed food and clothes markets as well as private truck terminals, the peak hours were between 10 and 12 in the morning.
48

49
Dat
a C
olle
ctio
n
Que
stio
nnai
re
OD
Sur
vey,
Num
ber
ofSt
ops
per
Day
Gen
eral
Info
rmat
ion
Dis
tanc
eTr
avel
ed
Expe
cted
Val
uefr
om S
elec
ted
Dis
trib
utio
n Cu
rve
Aver
age
of M
inim
umD
ista
nce
Trav
eled
GIS
Calib
rate
d Av
erag
e D
ista
nce
Trav
eled
per
Day
Age
ofVe
hicl
e
Coho
rt S
urvi
val
Anal
ysis
Coho
rt S
urvi
val
Ratio
Num
ber
of T
ruck
Regi
stra
tion
from
DLT
Num
ber
of T
ruck
s Run
ning
in t
he H
oriz
on Y
ear
Freq
uenc
y of
Trip
s pe
r W
eek
Prob
abili
ty o
fTr
ip M
akin
g
Vehi
cle
Kilo
met
ers
Trav
eled
(VK
T)pe
r D
ay
Trav
elTi
me
Aver
age
Trav
el S
peed
Path
Leng
th
Emis
sion
Fac
tor
from
PCD
Reg
ress
ion
Anal
ysis
Regr
essi
veFu
nctio
ns o
fEm
issi
on F
acto
rs
Rel
evan
t Em
issi
on F
acto
rs a
t th
eAv
erag
e Tr
avel
Spe
ed
Emis
sion
Loa
ds
Aver
age
of M
inim
umD
ista
nce T
rave
lled
Dis
tanc
eTr
avel
led
Cal
ibra
ted
Aver
age
Dis
tanc
eTr
avel
led
per D
ay
Vehi
cle
Kilo
met
res
Trav
elle
d (V
KT)
per d
ay
Figu
re 3
. T
he p
roce
ss o
f dat
a an
alys
is in
em
issi
on lo
ad s
urve
y
Not
e:
DLT
: Dep
artm
ent o
f Lan
d Tr
ansp
ort;
GIS
: geo
grap
hic i
nfor
mat
ion
syst
em: O
D: o
rigin
-des
tinat
ion;
PC
D: P
ollu
tion
Con
trol
Dep
artm
ent

C. Estimation of vehicle kilometer travel
VKT and travel speed are the two important parameters for the estimation of emission loads. In this study, data on distance travelled per day was validated by Chi-square (χ2) goodness-of-fit test. A logarithmic normal distribution model best fitted the collected data. Reference is made to Sirikijpanichkul (2000) for details on the model. The average value was 74.761 kilometres at 0.05 significance level. It was verified later by using GIS. A distance matrix of Bangkok was established using SmartMap. This matrix was developed to provide distances between each pair of the 50 administrative areas in Bangkok based on their assumed central reference positions. An O-D table developed from the survey was then overlapped on the matrix. Consequently, the average shortest distance per trip was obtained. The average shortest distance travelled per day was calculated from the average number of trips per day multiplied by the average shortest distance per trip. The analysis shows that the average shortest distance of travel per day is 33.504 kilometres. When disaggregated by type of vehicle, the modelled average travel distances of LDDTs and HDDVs were found to be 53.700 and 63.119 kilometres respectively.
The age of vehicle and trip frequency per week were used as inputs for estimating the number of trucks running in the base year (1999). A survival rate matrix for different age groups of trucks was developed by using the cohort survival technique (Ortúzar and Willumsen 1996). The matrix of truck population by age and for each category was developed from the vehicle registration data. To get the estimated number of trucks by category in the base year, the survival rate matrix was multiplied by the truck population matrix. Summation of the numbers of truck in both the categories gave the estimated total number of trucks running in 1999.
The data on trip frequency per week were used for the calculation of probability of trip-making by a truck. Finally, VKT per day for HDDVs and LDDTs were calculated by multiplying the modelled average distance travelled per day for each category by the corresponding number of trucks running in the base year and their probability of trip- making as shown in table 3.
50

Table 2. Number of truck registrations from 1983 to 1999
Year Number of truck registrations
Number of heavy-duty diesel vehicles
Number of light-duty diesel trucks
Increase in number of heavy-duty diesel
vehicles
Increase in number of light-duty diesel
trucks 1999 788,493 118,656 669,837 14,112 75,220
1998 699,161 104,544 594,617 -5,910 41,782
1997 663,289 110,454 552,835 3,657 98,595
1996 561,037 106,797 454,240 15,370 51,560
1995 494,107 91,427 402,680 8,177 78,778
1994 407,152 83,250 323,902 -7,099 51,712
1993 362,539 90,349 272,190 5,401 80,282
1992 276,856 84,948 191,908 2,938 41,977
1991 231,941 82,010 149,931 -26,096 63,725
1990 194,312 108,106 86,206 22,716 8,807
1989 162,789 85,390 77,399 5,544 20,866
1988 136,379 79,846 56,533 11,835 10,290
1987 114,254 68,011 46,243 2,433 16,103
1986 95,718 65,578 30,140 1,663 13,865
1985 80,190 63,915 16,275 9,721 3,289
1984 67,180 54,194 12,986 2,354 8,545
1983 56,281 51,840 4,441 - -
Source: Department of Land Transport (1999).
Table 3. Calculation of vehicle kilometres travelled per day by the estimated number of trucks running in 1999
Vehicle type
Number of trucks running in 1999
(1)
Probability of trip-making
(2)
Average distance travelled per day
(kilometres per day) (3)
Vehicle kilometres travel per day
(vehicle–kilometres per day) (4) = (1) x (2) x (3)
LDDT 342,194 0.7761 53.700 14,261,472
HDDV 40,755 0.7594 63.119 1,953,492
51

D. Estimation of emission loads
The emission factor (in grams per kilometre) of each pollutant depends on the type
of vehicle and the travel speed. Sources of emission were broadly categorized into LDDT (pick-up truck and van) and HDDV (6- and 10-wheeled trucks). In this study, travel speed was calculated from distance travelled and travel time. Distance travelled was obtained by tracing the route of O-D survey data on a GIS database. Data on travel time was collected from the questionnaire. A logarithmic normal distribution model was fitted to the estimated travel speed. The model was validated by Chi-square (χ2) goodness-of-fit test. The average value was 36.22 kilometres per hour at 0.05 significance level. The average travel speeds of LDDTs and HDDVs were 36.07 and 39.37 kilometres per hour respectively. The average speed of HDDVs was higher than that of LDDTs owing to the fact that HDDVs could enter the city only during off-peak hours.
The emission factor of each pollutant was obtained from emission factor charts developed by the Pollution Control Department (1994) as shown in figure 4. It was assumed that emission factors would be similar to those based on the driving conditions as used in the above mentioned study by the Pollution Control Department. The emission loads were finally calculated by multiplying VKT per day by the corresponding emission factors at the average travel speed. The results of emission load estimation are shown in table 4.
As shown in table 4, NOx is the major emission load generated by HDDVs,
followed by CO, HC and SPM, in that order. On the other hand, LDDTs emit CO at the highest level, followed by NOx, HC and SPM.
HDDVs generate very high levels of NOx. It is noteworthy that the total NOx generated by HDDVs is approximately double that of LDDTs, despite the fact that the mileage of LDDTs is 7.3 times higher than HDDVs. Total SPM from HDDVs is also much higher than that from LDDTs.
52

0.26 0.26 0.26 0.26 0.26 0.26 0.26
2.552.25
2.001.81
1.541.31
1.901.62
1.401.21
0.940.75 0.62
5.14
4.02
3.19
2.58
1.78
1.05
1.381.32
0
1
2
3
4
5
6
0 10 20 30 40 50 60
SPM
NOx
HC
CO
2.71 2.71 2.71 2.71 2.71 2.71
39.27
34.53
30.78
27.82
23.6821.29
20.22
10.438.90
7.676.66
5.15
29.69
23.19
18.43
14.91
10.29
7.616.05
2.71
4.12 3.41
0
5
10
15
20
25
30
35
40
45
0 10 20 30 40 50 60
SPMNOx
HCCO
❹
❷
❸
❶
❹
❸
❶
❷
Legend
❶ SPM: Suspended Particulate Matter ❷ NOx : Oxides of nitrogen ❸ HC : Hydrocarbon ❹ CO : Carbon monoxide
Emis
sion
Fac
tor (
gm/k
mEm
issi
on F
acto
r (gm
/km
)
Speed (km/hr)Speed (kph)
HDDVHeavy-duty diesel vehicles
Legend
❶ SPM: Suspended Particulate Matter ❷ NOx : Oxides of nitrogen ❸ HC : Hydrocarbon ❹ CO : Carbon monoxide
Emis
sion
Fac
tor (
gm/k
mEm
issi
on F
acto
r (gm
/km
)
Speed (kph)Speed (kph)
LDDTLight-duty diesel trucks
Source: Pollution Control Department, Thailand (1994).
Figure 4. Emission factors of light-duty diesel trucks and heavy-duty diesel vehicles
53

Table 4. Emission load generated by trucks running in the Bangkok Metropolitan Area
Vehicle class VKT per day
Average travel speed (kph)
Emission factor (grams per vehicle
kilometre)
Emission load (kilograms per day)
CO 1.5481 22,078 NOx 1.4416 20,559 HC 0.7583 10,814
Light-duty diesel trucks (pick-up truck and van) 14,261,472 36.07
SPM 0.2600 3,708 NOx 21.0747 41,169 CO 8.0073 15,642 HC 4.0497 7,911
Heavy-duty diesel vehicle (6- and 10-wheeled trucks) 1,953,492 39.37
SPM 2.7100 5,294
V. THE POTENTIAL EFFECTS OF PUBLIC TRUCK TERMINALS ON EMISSION LOADS
The estimated number of truck trips from the three public truck terminals in the
year 2000 was used for the calculation of emission loads. The Japan International Cooperation Agency (1992) simulated five scenarios based on the proposed truck ban measures after the opening of the truck terminals. The scenarios were as follows: Case 1: existing condition with 2.8 per cent use ratio. Case 2a: 24-hour heavy truck restriction in the inner area with 100 per cent use
ratio. Case 2b: 24-hour heavy truck restriction in the inner area with 2.8 per cent use
ratio. Case 3a: 24-hour heavy truck restriction in the outer area with 100 per cent use
ratio. Case 3b: 24-hour heavy truck restriction in the outer area with 2.8 per cent use
ratio.
The predicted number of truck trips using each public truck terminal in the year 2000 is shown in table 5 (JICA 1992). Four commodity types were considered in the study: processed food, clothes and leather, manufacturing products and miscellaneous goods. After the opening of the truck terminals, the number of heavy trucks running inside Bangkok would reduce. However, the number of delivery trucks (LDDTs) transporting goods from truck terminals to destinations inside Bangkok would increase. In addition, the distance travelled by LDDTs would also increase, owing to the longer average distances between the truck terminals and destinations inside the metropolitan area than before.
The three public truck terminals are located in the Don Muang, Thavee Watthana and Ladkrabang areas respectively. From the distance matrix, distance ratios were calculated by dividing the average distance between Don Muang, Thavee Watthana and Ladkrabang and the other administrative areas by the average distance between all administrative areas. For example, the ratio of distance for the northern public truck
54

terminal North is .3399.1234.16
752.21= The average distance travelled per day for 1.6 ton
delivery trucks and the distance ratio at each terminal are shown in table 5.
Table 5. Distance travelled per day of delivery trucks using three public truck terminals
Scenario
(1)
Truck
terminal
(2)
Number of 1.6
ton delivery trucks
(vehicle trips per day)
(3)
Percentage of
1.6 ton delivery trucks
using each terminal
(4)
Distance
ratio
(5)
Existing distance travelled per day
(km/day)
(6)
Adjusted distance travelled per day
(km/day)
(7) = (5) x (6)
North 1,454 40.45 1.3399 77.432
West 1,054 29.32 1.4004 80.928
East 1,087 30.23 1.6399
57.789
94.766 Case 1
Total 3,596 100.00 Average 83.697
North 7,181 37.08 1.3399 77.432
West 4,828 24.93 1.4004 80.928
East 7,357 37.99 1.6399
57.789
94.766 Case 2a
Total 19,367 100.00 Average 84.886
North 5,956 36.74 1.3399 77.432
West 4,073 25.13 1.4004 80.928
East 6,182 38.13 1.6399
57.789
94.766 Case 2b
Total 16,211 100.00 Average 84.920
North 14,049 42.35 1.3399 77.432
West 9,336 28.14 1.4004 80.928
East 9,791 29.51 1.6399
57.789
94.766 Case 3a
Total 33,176 100.00 Average 83.532
North 11,529 42.30 1.3399 77.432
West 7,679 28.17 1.4004 80.928
East 8,049 29.53 1.6399
57.789
94.766 Case 3b
Total 27,258 100.00 Average 83.536
Source: Japan International Cooperation Agency 1992.
55

The possible effects of truck terminals on vehicle mileage and emission loads are presented in tables 6 and 7. It is observed that after the implementation of public truck terminals, the mileage of HDDVs would slightly decrease, while the mileage of LDDTs would greatly increase. The results also show that the truck terminals could reduce emission loads of NOx and SPM in Bangkok owing to the lower mileage of HDDVs. However, emission loads of CO and HC would significantly increase, owing to the increased mileage of smaller delivery trucks.
The results also indicate that a 24-hour truck restriction on the Outer Ring Road core would be more effective in reducing NOx and SPM emissions than a restriction on the Inner Ring Road. The percentage of emission reduction, however, depends on truck terminal usage. The higher the usage of the truck terminal, the larger is the potential emission reduction.
Table 6. Estimation of increased vehicle-kilometres travelled per day of delivery trucks and heavy trucks for each truck ban scenario
Vehicle type/ scenario Estimated number of
truck trips using public truck terminals
Average distance travelled per day
(kilometres per day)
Increased vehicle kilometres per day
Delivery Truck (1.6 Tons per vehicle)
Case 1 3,596 83.697 300,942
Case 2a 19,367 84.886 1,643,971
Case 2b 16,211 84.920 1,376,666
Case 3a 33,176 83.532 2,771,265
Case 3b 27,258 83.536 2,276,978
Heavy Truck (10.5 tons per vehicle)
Case 1 548 63.119 -34,583
Case 2a 2,951 63.119 -186,273
Case 2b 2,470 63.119 -155,922
Case 3a 5,055 63.119 -319,094
Case 3b 4,154 63.119 -262,166
Source: Japan International Cooperation Agency 1992.
56
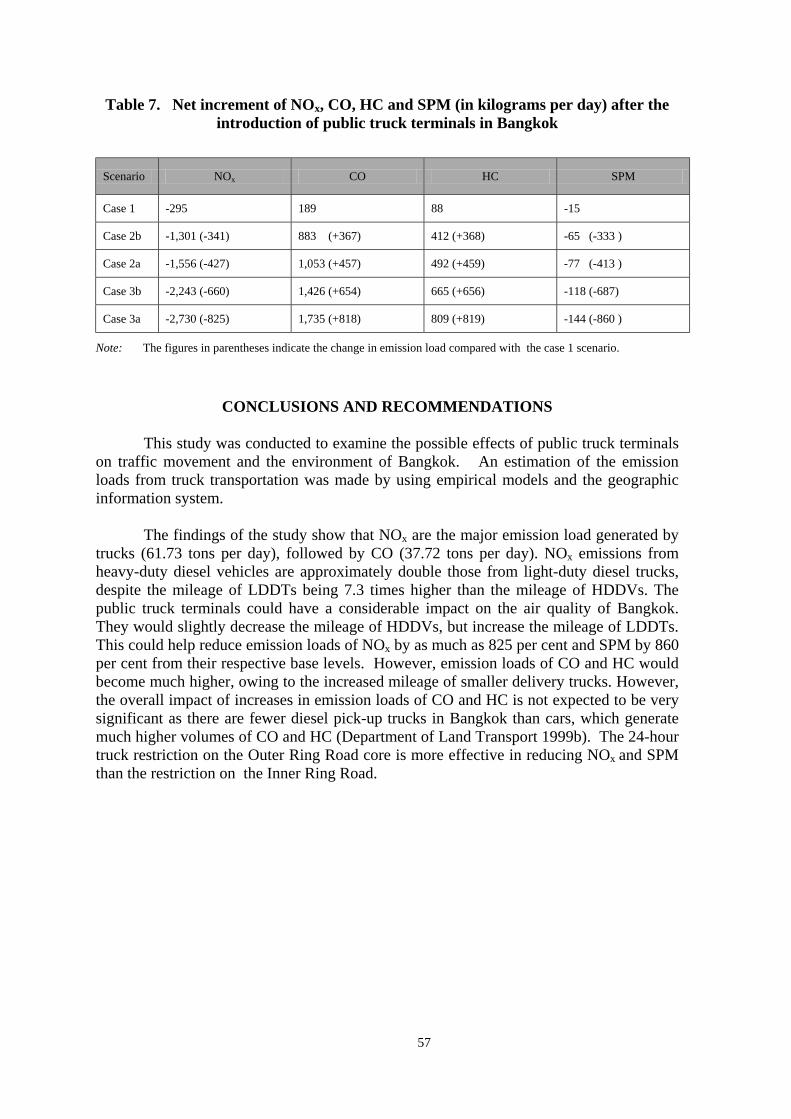
Table 7. Net increment of NOx, CO, HC and SPM (in kilograms per day) after the introduction of public truck terminals in Bangkok
Scenario NOx CO HC SPM
Case 1 -295 189 88 -15
Case 2b -1,301 (-341) 883 (+367) 412 (+368) -65 (-333 )
Case 2a -1,556 (-427) 1,053 (+457) 492 (+459) -77 (-413 )
Case 3b -2,243 (-660) 1,426 (+654) 665 (+656) -118 (-687)
Case 3a -2,730 (-825) 1,735 (+818) 809 (+819) -144 (-860 )
Note: The figures in parentheses indicate the change in emission load compared with the case 1 scenario.
CONCLUSIONS AND RECOMMENDATIONS
This study was conducted to examine the possible effects of public truck terminals on traffic movement and the environment of Bangkok. An estimation of the emission loads from truck transportation was made by using empirical models and the geographic information system.
The findings of the study show that NOx are the major emission load generated by trucks (61.73 tons per day), followed by CO (37.72 tons per day). NOx emissions from heavy-duty diesel vehicles are approximately double those from light-duty diesel trucks, despite the mileage of LDDTs being 7.3 times higher than the mileage of HDDVs. The public truck terminals could have a considerable impact on the air quality of Bangkok. They would slightly decrease the mileage of HDDVs, but increase the mileage of LDDTs. This could help reduce emission loads of NOx by as much as 825 per cent and SPM by 860 per cent from their respective base levels. However, emission loads of CO and HC would become much higher, owing to the increased mileage of smaller delivery trucks. However, the overall impact of increases in emission loads of CO and HC is not expected to be very significant as there are fewer diesel pick-up trucks in Bangkok than cars, which generate much higher volumes of CO and HC (Department of Land Transport 1999b). The 24-hour truck restriction on the Outer Ring Road core is more effective in reducing NOx and SPM than the restriction on the Inner Ring Road.
57

1.98 2.03
1.68
1.97
1.49
2.05
2.64
0.00
0.50
1.00
1.50
2.00
2.50
3.00
Rat
io o
f del
iver
y tr
ucks
to
hea
vy t
ruck
s
6647
5793 60056427
6813
8839
11253
33602856
35833256
45874310 4266
0
2000
4000
6000
8000
10000
12000N
umbe
r of T
ruck
s
Pick-up and Van
Heavy Truck
Num
ber
of t
ruck
s
Ratio
of
deliv
ery
truc
ks t
o he
avy
truc
ks
Aug 2000 Sep 2000 Oct 2000 Nov 2000 Dec 2000 Jan 2001 Feb 2001
Month
Aug 2000 Sept 2000 Oct 2000 Nov 20000 Dec 2000 Jan 2001 Feb 2001
Month
Source: Department of Land Transport, Thailand (2001).
Figure 5. Number of delivery trucks and heavy trucks using the western public truck
terminal from August 2000 to February 2001
Aug 2000 Sep 2000 Oct 2000 Nov 2000 Dec 2000 Jan 2001 Feb 2001
Month
Aug 2000 Sept 2000 Oct 2000 Nov 20000 Dec 2000 Jan 2001 Feb 2001
Month
Source: Department of Land Transport, Thailand (2001)
Figure 6. Ratio of delivery trucks to heavy trucks using the western public truck terminal from August 2000 to February 2001
58

In addition, the higher the usage of the truck terminal, the greater is the reduction in NOx and SPM.
The study reveals some promising positive effects of the truck terminals. However, some problems are challenging the success of this policy. Terminal usage is not as high as was originally predicted. The most serious problem faced by the truck operators is the increase in operating costs. They claim that additional costs include terminal rental cost, parking fees, the purchasing of new delivery trucks, and so forth. The number of delivery trucks using the western public truck terminal in December 2000 was 220 vehicles per day, which was only 5.4 per cent of the predicted volume for Case 2b of table 6. Nevertheless, the number of delivery trucks using the terminals increased sharply in the following months. It is observed that the ratio of delivery trucks to heavy trucks using the truck terminals also rose, as shown in figure 6. This trend indicates the consolidation of cargo handling. Since greater usage of the truck terminals could contribute to significant improvements in air quality in Bangkok, actions need to be considered to promote their usage. To enhance the usage of public truck terminals further, some measures may be considered as follows: (a) The Government could encourage factories in inner areas to move out to industrial zones established near the public truck terminals. If needed, new zones could be established by the Government to ensure a reasonable land price and the availability of all the necessary physical infrastructure;
(b) Logistics facilities for chilled and frozen goods could be developed in public truck terminals;
(c) The road network and other infrastructure facilities linking the truck terminals and industrial zones could be improved to provide greater accessibility, wider coverage and faster movement.
The lessons learned should be useful for the proposed regional truck terminals in
different parts of the country, which include truck terminals in the north at Chiang Mai, in central Thailand at Nakhon Sawan, in the north-east at Khon Kaen and Nakhon Ratchasima, and in the south at Had Yai and Songkhla.
ACKNOWLEDGEMENTS
The authors would like to express their appreciation to the officials of the Department of Land Transport, the Pollution Control Department, and the executive managers of all related private companies for their kindness in offering useful data for and cooperating with the survey.
59

REFERENCES
Boerkamps, J. and Binsbergen, A.V., 1999. Goodtrip – A New Approach for Modeling and Evaluating Urban Goods Distribution. Proceedings of the First International Conference on City Logistics: City Logistics I: 175-186. Cairns, Australia: Institute of Systems Science Research. Boontherawara, N., 1994. Traffic Crisis and Air Pollution in Bangkok. TEI Quarterly Environment Journal, 2, 3: PP. 4-37. Conte, F. 1990. Trucking in the ‘90s: Emissions. Owner Operator, September: pp. 58-65. Department of Land Transport (DLT), 1999a. The Greater Bangkok Truck Terminal, Bangkok: Department of Land Transport (In Thai). Department of Land Transport (DTL), 1999b. Road Transport Statistics, Bangkok: Department of Land Transport, Technical and Planning Division, Transport Statistics Sub-division (In Thai). Environmental Protection Agency (EPA), 1993. Federal Test Procedure Review Project: Preliminary Technical Report. Office of Mobile Sources. Environmental Protection Agency (EPA), 1996. National Air Pollutant Emission Trends. Procedures Document for 1990-1996: pp. 4-244. Friesz, T.L., Tobin, R. and Harker, P., 1983. Predictive Intercity Freight Network Models: The State of the Art. Transportation Research, 17A, 6: pp. 409-17. Guensler, R., 1993. Transportation Data Needs for Evolving Emission Inventory Models. Institute of Transportation Studies, University of California, Davis. Hanson, M.E. and Lopez, R.W., 1992. Methodology for Evaluating Urban Transportation Energy-Environment Strategies: Case Study for Bangkok, Transportation Research Record 1372: pp. 53-61. Harker, P.T., 1985. The State of the Art in the Predictive Analysis of Freight Transport Systems. Transport Reviews, 5,2: pp. 143-64. Japan International Cooperation Agency, 1992. The Study on Greater Bangkok Truck Terminal in the Kingdom of Thailand: Final Report, Vol. 2. Bangkok: Department of Land Transport. Jara Diaz, S.R., 1982. The Estimation of Transport Cost Functions: A Methodological Review. Transport Reviews 2: pp. 257-278. Kim, T.J. and Hinkle, J., 1982. Model for Statewide Freight Transportation Planning. Transportation Research Record 889: pp. 15-19. Leonard, D. R. and Gower, P., 1982. User Guide to CONTRAM Version 4. TRRL Suupplementary Report 735, Transport and Road Research Laboratory. Crowthorne.
60

Lieberman, E., 1981. Enhanced NETSIM Program. Transporation Research Board Special Report 194, 32-5. Memmott, F.W., 1983. Application of Statewide Freight Demand Forecasting Techniques. National Cooperative Highway Research Program Report 260: pp. 9-43. Muttamara, S. and Leong, S.T., 2000. Monitoring and Assessment of Exhaust Emission in Bangkok Street Air. Environmental Monitoring and Assessment 60: pp. 163-180. Ortúzar, J. de D. and Willumsen, L. G., 1996. Modeling Transport, 2nd Edition. (Chichester: John Wiley & Sons). Pollution Control Department (PCD), 1994. Air Emission Database of Vehicles and Industry in Bangkok Metropolitan Region 1992: Final Report. Bangkok: Pollution Control Department, Ministry of Science, Technology and Environment, September. Sirikijpanichkul, A., 2000. Estimation of Emission Loads from Truck-based Freight Transportation in Bangkok Metropolitan Area. AIT Thesis, GE99-19. Bangkok: Asian Institute of Technology. Tanadtang, P., 1999. The Effect of Traffic on Vehicle Emissions in Bangkok. AIT RSPR, TE99-2. Bangkok: Asian Institute of Technology. Van Es, J.V., 1982. Freight Transport, an Evaluation. ECMT Round Table 58, European Conference of Ministers of Transport, Paris. Weaver, C.S., and Klausmeier, R.F., 1988. Heavy-Duty Diesel Vehicle Inspection and Maintenance Study. Final Report: Quantifying the Problem II. Sacramento, California: Radian Corporation.
61