the effects of reduce and eliminate appeals on individual meat consumption
TRANSCRIPT
The effects of “reduce” and “eliminate” appeals onindividual meat consumption
October 2016
Bobbie NJ Macdonald∗Animal Welfare Action Lab†
Stanford [email protected]
Krystal D CaldwellAnimal Welfare Action [email protected]
Gregory D BoeseSimon Fraser [email protected]
1. INTRODUCTIONMeat consumption poses a major societal prob-
lem in the eyes of many environmentalists andhealth practitioners, alongside animal welfare ad-vocates who have long drawn attention to the eth-ical problems of intensive livestock production.However, in contrast to the large bodies of exper-imental research that have been devoted to otherhealth-related and environmental behaviors (e.g.smoking, physical exercise, electricity usage, re-cycling),1 there is strikingly little research that ex-amines the effectiveness of different interventionsand messaging appeals aimed at encouraging indi-viduals to reduce their meat consumption.
To address this problem, we conducted a three-wave survey experiment examining the effects oftwo diet change appeals on self-reported meat con-sumption and attitudes: a reduce appeal that en-courages individuals to reduce their meat con-sumption but not necessarily eliminate it entirely,and an eliminate appeal that encourages individ-uals to completely give up eating meat. We findthat both the reduce and eliminate appeals led tosignificant reductions in self-reported meat con-sumption five weeks after treatment exposure, onthe order of 7.1% and 5.8%, respectively. In addi-tion, both appeals led to shifts in attitudes towardsfactory farming and perceptions of social normsabout meat-eating in the US. However, we find noevidence that a reduce is any more or less effectivethan an eliminate appeal.
∗ Corresponding author. Media inquiries may be di-rected to Brian Kateman at [email protected] study was pre-registered at osf.io/44z7j. Fundingfor this study was generously provided by the ReducetarianFoundation. We thank Brian Kateman, Peter Hurford, andKieran Greig for their helpful comments on survey design.
† http://www.awalab.org/1See, for instance, Goode et al. (2012); Price (2014);
Thomas and Sharp (2013); Cialdini (2003)
These findings have important practical impli-cations for health practitioners, environmentalists,and animal advocates, offering strong evidencethat a short news article containing a simple ap-peal can influence individual diets and attitudesfive weeks later. These are the first experimentalresults to our knowledge that demonstrate persis-tent effects of a simple anti-meat appeal over anextended period of time.
2. RELATED WORKVegetarianism, as a phenomenon of individual
choice, has been the subject of a growing liter-ature examining individual motivations for (andbarriers to) going vegetarian, the general factorsthat predict the adoption of a vegetarian diet, rea-sons for vegetarian recidivism, attitudes towardsmeat, and the ways in which vegetarians and meat-eaters view one another (see Ruby, 2012; Lough-nan et al., 2014). For instance, Piazza et al. (2015)demonstrate that individual justifications for eat-ing meat fall into one of four main categories (the“4Ns”): it is normal, it is natural, it is nice, and itis necessary. In another study, Minson and Monin(2011) show that meat-eaters evaluate vegetariansmore negatively when perceiving vegetarians asholding a “holier-than-thou” mentality.
However, the vast majority of the literature onthe causes of vegetarianism is observational, fail-ing to experimentally examine the effectiveness ofinterventions for influencing individual meat con-sumption. This is an important oversight, sinceenvironmentalists, health practitioners, and animalwelfare advocates use a wide range of message ap-peals and other interventions for encouraging indi-viduals to eat less meat, yet these advocates lackrigorous evidence on what works.
The effectiveness of messaging appeals has

been examined extensively in nutrition and healtheducation, where common goals are to encourageweight loss, exercise, and healthy eating habits.For instance, Gallagher and Updegraff (2012)summarize the results of 94 peer-reviewed studiesin a meta-analysis of the effects of gain/loss mes-sage framings on prevention behaviors (e.g. smok-ing cessation, physical activity), showing thatgain-framed messages – such as “Eating healthywill help you lose weight” – rather than loss-framed messages – such as “Not eating healthywill make you gain weight” – were more effec-tive at promoting illness prevention behaviors (e.g.smoking cessation, skin cancer prevention, physi-cal activity). Similarly, Goode et al. (2012) con-duct a systematic review of telephone-deliveredinterventions for encouraging physical activity,while Noar et al. (2007) review the effects of tai-lored print health interventions on health behaviorchanges – finding that health information whichhas been tailored to individuals is more effec-tive than un-tailored messages at changing health-related behaviors.
In animal advocacy, a small but growing num-ber of studies have examined the effectivenessof persuasive messages. Most closely relatedto our study, Humane League Labs (2015b) ex-amined whether a reduce or eliminate appeal ismore effective at reducing individual meat con-sumption by comparing three pro-vegetarian flyersagainst one another (animal cruelty appeal versusabolitionist appeal versus environmental appeal),finding that a cruelty message is more effectivethan abolitionist and environmental messages atprompting intentions to change diet. However, thisstudy suffers from several shortcomings. First, nocontrol group was used. Second, the flyer text andimages differed in many ways from one another,making it difficult to determine what aspect of theflyers were responsible for observed differences inoutcomes. Third, this study measured intentions toreduce meat consumption immediately after treat-ment exposure, rather than measuring actual orself-reported dietary intake several weeks follow-ing exposure to the treatment. Similarly, in a studyof public attitudes towards gestation stalls, Ryanet al. (2015) find that survey participants were lesslikely to support the use of gestation stalls for sowsimmediately after being exposed to informationabout the stalls, yet these authors only examineimmediate effects and do not examine impacts on
self-reported diets.A second study by Humane League Labs
(2015a) compared four pro-vegetarian messagesdistributed via leaflets on college campuses. Theleaflets either asked participants to eat vegan, eatvegetarian, eat less meat, or cut out/cut backon meat and animal products (the “combination”message). A control group that received no book-let. Oddly, the authors show that participants inthe control group reduced their meat consumptionmore than any other group. In addition, this studywas hindered by the fact that the control group(n=57) had half as many participants as the treat-ment groups, and nearly half of the participantsin the control group contained missing data (n=25with missing data). The study also suffered froma low response response rate in the endline survey(37%), which raises the possibility that mean dif-ferences in self-reported diets reflects differencesin group composition (due to self-selection) ratherthan messaging effects.
3. METHODS3.1. Research Questions
In this study we address two main questions.First, does reading an article about factory farminginspire people to reduce their consumption of an-imal products? Second, is it more effective to askreaders to stop eating meat entirely, or to ask themto reduce their meat consumption without neces-sarily eliminating it from their diet altogether?
3.2. ParticipantsA total of 3,076 participants were recruited
from Amazon Mechanical Turk (MTurk) in June2016 to participate in a three-wave survey spreadout over eight weeks.2 The study was advertised asa “lifestyle and dietary choices” survey. 2,685 par-ticipants completed the second/treatment survey(87.29% response rate, one week after baseline)and 2,237 completed the endline survey (72.40%response rate, five weeks after baseline).
3.3. Data collectionData was collected in three survey waves:
1. Baseline survey: Participants were askedabout demographics, current levels of meat
2MTurk recruitment was restricted to respondents resid-ing in the US with approval rates above 95%. Participantswere paid $0.50 for completing the baseline survey, $0.50 forcompleting the treatment survey, and $1.00 for completingthe endline survey.

consumption, attitudes towards farmed an-imals and eating meat, and other potentialmoderators.
2. Treatment survey: One week after the base-line survey began, the same participants werecontacted via MTurk and asked to completea second survey. Participants were randomlyassigned to one of three experimental arms:(1) control message; (2) reduce appeal; or(3) eliminate appeal. Participants in each armwere given a news article to read, followed bya short survey about their attitudes towardsfactory farming and whether they plannedto change their meat consumption. Blockrandomization – based on self-reported meatconsumption and other variables measured atbaseline – was used to assign participants toexperimental arms in order to minimize sam-pling noise.
3. Endline survey: Five weeks after the treat-ment was deployed, the same participantswere again contacted via MTurk and asked tocomplete an endline survey on their currentlevels of meat consumption, attitudes towardsfarmed animals, and other outcome measures(see Section 3.4).
3.4. Experimental conditionsParticipants were randomly assigned to one of
three conditions:
• In the reduce condition, participants wereshown a news article about factory farmingthat described a growing number of peoplewho are reducing - but not entirely eliminat-ing - their meat consumption and encouragedreaders to do the same.
• In the eliminate condition, participants wereshown a news article about factory farmingthat described a growing number of peoplewho are eliminating meat from their diet andencouraged readers to do the same.
• In the control condition, participants wereshown a news article outlining the benefits ofwalking as a form of exercise. It did not dis-cuss diet or encourage readers to change theirdiet.
The full text of all experimental conditions isprovided in the supplementary materials.
3.5. Outcome measuresAll variables described in this section were
measured in both the baseline and endline surveys,except for the following: ratings of animal intelli-gence, number of discussions held about the neg-ative aspects of meat consumption, and number ofmedia items viewed about the negative aspects ofmeat consumption. Full details on all questionsare provided in the supplementary materials.
Self-reported meat consumption. Participantswere asked to complete a food frequency ques-tionnaire (FFQ) for their diet over the past 30days. Food items included dairy, eggs, meat (e.g.,chicken, turkey, fish, pork, beef), fruits, vegeta-bles, nuts, grains, beans, and vegetarian meats.Participants were also asked two single item ques-tions, “How often do you eat meat?” (1-6 scalefrom never to every day) and “Do you intend toreduce your meat consumption over the next 30days?” (1=greatly decrease, 7=greatly increase).
The main outcome measure used in the analysesbelow is “Total meat servings (FFQ)”, which sumsall servings of meat across chicken, turkey, fish,pork, beef, and “other meats”. This variable doesnot include dairy or egg consumption.
Attitudes towards factory farming. We col-lected four attitudinal measures on meat consump-tion and factory farming using a 1-7 scale rang-ing from strongly disagree to strongly agree. Par-ticipants were asked to rate whether purchasinganimal products contributes to animal suffering,whether most animals have a good standard of liv-ing, whether raising animals for food contributesto environmental degradation, and whether mostpeople would be healthier if they ate less meat.Participants were also asked to select the two mostimportant things they take into consideration whendeciding what animal products to purchase, suchthe price, nutritional content, welfare standards,and taste.
Perceptions of social norms. On a seven pointscale, participants were asked whether they agreedor disagreed with the statement that more andmore people in the US are reducing their meat con-sumption (1=strongly disagree, 7=strongly agree).
Perceptions of vegetarians. Participants wereasked to locate their feelings towards vegetarianson a feeling thermometer, where a rating of 0meant that they felt cold and negative towards veg-etarians and 10 meant they felt warm and positive.
Perceptions of animal intelligence. Partici-

pants were asked to rate seven types of animalson a 1-7 scale in terms of perceived intelligence(1=very unintelligent, 7=very intelligent).
Information exposure and discussions. Par-ticipants were asked how many pieces of mediathey had read or watched and how many personaldiscussions they had in the past 30 days that re-lated to the negative implications of meat con-sumption or the treatment of animals raised forfood. These two measures range from 0 to “10or more”.
Difficulty of reducing meat consumption. Ona seven point scale ranging from very difficult (1)to very easy (7), participants were asked to ratehow difficult it would be to completely eliminatemeat from their diet over the next year and howdifficult it would be to reduce their meat consump-tion 25% over the next year.
3.6. SpecificationsTo estimate the average treatment effects (ATE)
of the reduce and eliminate appeals relative to thecontrol group, we examine differences in groupmeans by regressing each of the outcome mea-sures (described in Section 3.4) on binary indi-cators for each appeal and a vector of binary in-dicators representing the 955 randomized blockgroups. For all outcomes that were measured inbaseline and endline, we report treatment effectsfor both the change between baseline and endline,as well as treatment effects on the endline mea-sure alone. To reduce the influence of outliers, allanalyses below are reported after removing the top2.5% and bottom 2.5% of responses. All figuresbelow show estimated ATEs surrounded by 95%confidence intervals.
To address concerns about multiple hypothesistesting, we restrict the false discovery rate (FDR)using the weighted FDR control method proposedin Benjamini and Hochberg (1997).3 Tables 1 and2 in the Supplementary materials illustrate whichhypothesis tests we still reject at the 95% levelof significance after applying these corrections.These multiple hypothesis testing corrections donot alter the main findings described below.
3The weighted Benjamini and Hochberg (1997) methodallows researchers to place greater weight on hypotheses thatare more important. Since self-reported meat consumption isthe primary outcome of interest in this study, we place 50%of all weight on the “Total meat servings (FFQ) (change)”and “Total meat servings (FFQ) (endline)” measures. Theremaining 50% weight is evenly distributed across all otherhypothesis tests.
4. RESULTS4.1. Effects on meat consumption
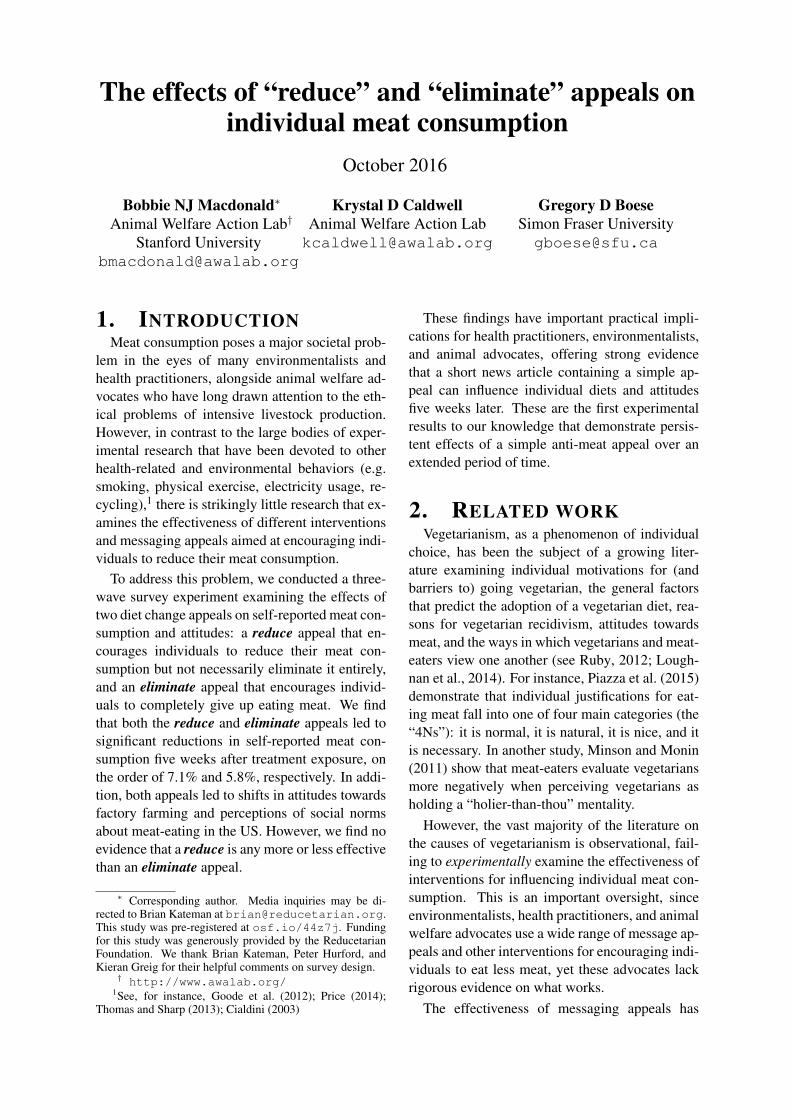
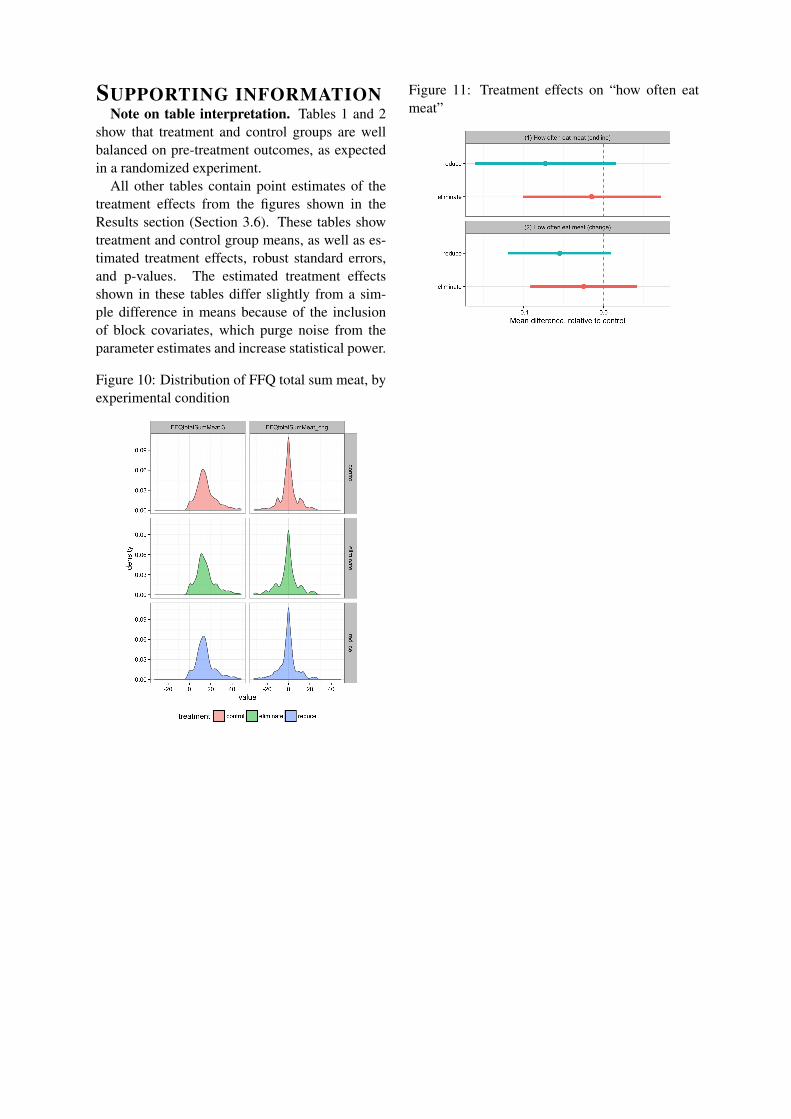
Figure 1 illustrates the main results, showingmean differences for each treatment appeal rela-tive to the control group in terms of total meatservings (FFQ). Specifically, the top panel of Fig-ure 1 illustrates mean differences in total meatconsumption measured at endline only, while thebottom panel of Figure 1 shows treatment effectson the change in total meat consumption betweenbaseline and endline. Together, these figures showthat the reduce and eliminate messages decreasedself-reported meat consumption over the preced-ing 30 days, on the order of 1.1 servings of meatfor the reduce appeal (p = 0.028) and 0.90 serv-ings of meat for the eliminate appeal (p = 0.002).As shown in Figure 11 in the supplementary mate-rials, these effects are similar when using a single-item measure of meat consumption (“how often doyou eat meat?”). With an average of 15.39 serv-ings of meat over the past 30 days in the controlgroup, these effects equate to a 7.1% and 5.8% re-duction in meat consumption, respectively.
These effects do not significantly differ whendisaggregating by gender or age, suggesting thatthese reductions in meat consumption are notbeing overwhelmingly driven by one gender orby individuals from a particular age group. Fi-nally, while both appeals led to decreases in self-reported meat consumption relative to the controlgroup, the difference in treatment effects betweenthe reduce and eliminate conditions are not statis-tically significant. These similarities in the effec-tiveness of the two appeals are reflected across allanalyses presented below.
4.2. What types of animal products wereaffected?
Figure 2 disaggregates the previous results,showing the effects of the two treatment appealson eight categories of animal product consumptionmeasured in the FFQ, as well as consumption ofvegetarian meats. All categories of animal prod-ucts shown in Figure 2 were included in the mea-surement of total meat consumption shown in Fig-ure 1, with the exception of dairy (Panel 1), eggs(Panel 8), and vegetarian meats (Panel 9).
These results show that the effects on aggregateservings of meat consumed cannot be explainedby individual shifts in a single category of animalproducts. Instead, the aggregate effects on meat
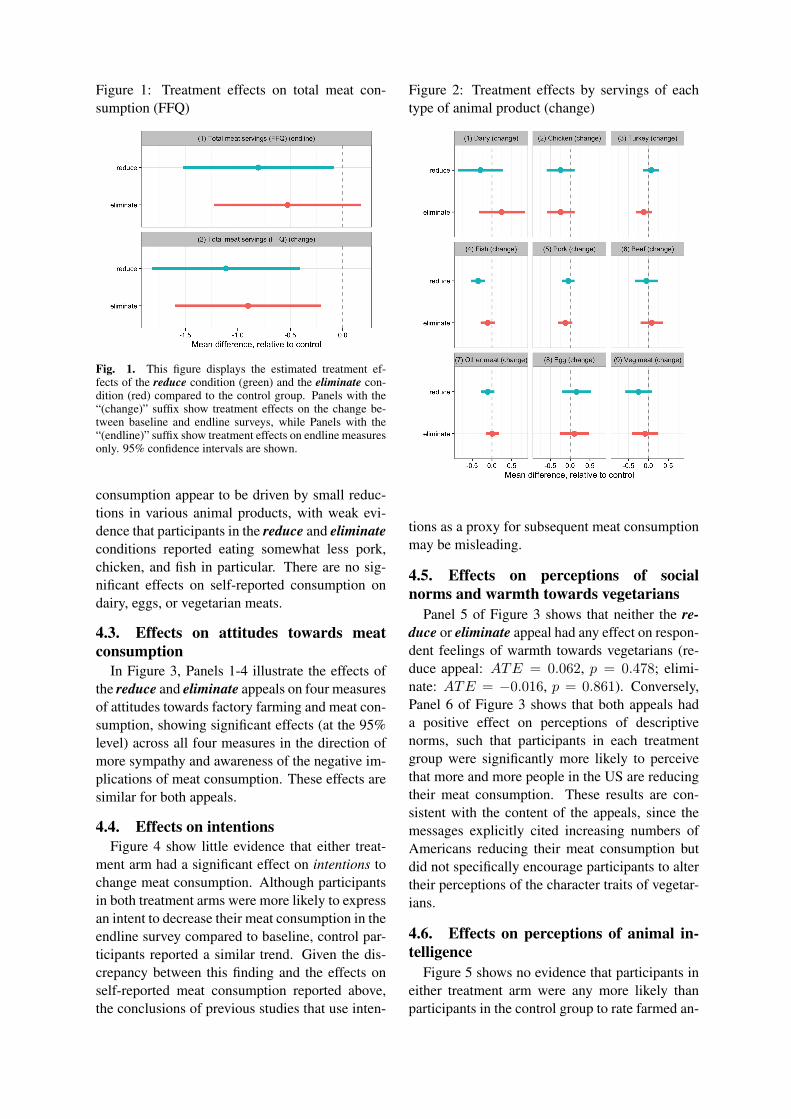
Figure 1: Treatment effects on total meat con-sumption (FFQ)
Fig. 1. This figure displays the estimated treatment ef-fects of the reduce condition (green) and the eliminate con-dition (red) compared to the control group. Panels with the“(change)” suffix show treatment effects on the change be-tween baseline and endline surveys, while Panels with the“(endline)” suffix show treatment effects on endline measuresonly. 95% confidence intervals are shown.
consumption appear to be driven by small reduc-tions in various animal products, with weak evi-dence that participants in the reduce and eliminateconditions reported eating somewhat less pork,chicken, and fish in particular. There are no sig-nificant effects on self-reported consumption ondairy, eggs, or vegetarian meats.
4.3. Effects on attitudes towards meatconsumption
In Figure 3, Panels 1-4 illustrate the effects ofthe reduce and eliminate appeals on four measuresof attitudes towards factory farming and meat con-sumption, showing significant effects (at the 95%level) across all four measures in the direction ofmore sympathy and awareness of the negative im-plications of meat consumption. These effects aresimilar for both appeals.
4.4. Effects on intentionsFigure 4 show little evidence that either treat-
ment arm had a significant effect on intentions tochange meat consumption. Although participantsin both treatment arms were more likely to expressan intent to decrease their meat consumption in theendline survey compared to baseline, control par-ticipants reported a similar trend. Given the dis-crepancy between this finding and the effects onself-reported meat consumption reported above,the conclusions of previous studies that use inten-
Figure 2: Treatment effects by servings of eachtype of animal product (change)
tions as a proxy for subsequent meat consumptionmay be misleading.
4.5. Effects on perceptions of socialnorms and warmth towards vegetarians
Panel 5 of Figure 3 shows that neither the re-duce or eliminate appeal had any effect on respon-dent feelings of warmth towards vegetarians (re-duce appeal: ATE = 0.062, p = 0.478; elimi-nate: ATE = −0.016, p = 0.861). Conversely,Panel 6 of Figure 3 shows that both appeals hada positive effect on perceptions of descriptivenorms, such that participants in each treatmentgroup were significantly more likely to perceivethat more and more people in the US are reducingtheir meat consumption. These results are con-sistent with the content of the appeals, since themessages explicitly cited increasing numbers ofAmericans reducing their meat consumption butdid not specifically encourage participants to altertheir perceptions of the character traits of vegetar-ians.
4.6. Effects on perceptions of animal in-telligence
Figure 5 shows no evidence that participants ineither treatment arm were any more likely thanparticipants in the control group to rate farmed an-

Figure 3: Treatment effects on attitudes (change)
Figure 4: Treatment effects on intent to changemeat consumption (change)
imals (cows, pigs, chicken, fish) as more intelli-gent. These results are consistent with the contentof the appeals, since neither appeal made explicitreferences to the intelligence of farmed animals.
Figure 5: Treatment effects on perceptions of ani-mal intelligence (endline)
4.7. Effects on information sharing andexposure
Figure 6 examines information sharing and ex-posure via media and personal discussions aboutthe negative implications of meat consumption.
Both appeals led to an increase in the number ofdiscussions that participants had over the past 30days about the negative implications of meat con-sumption. Compared to an average of 0.85 dis-cussions in the control group, participants in thereduce arm reported an additional 0.125 discus-sions on average (p = 0.023), while participantsin the eliminate arm reported an additional 0.155discussions on average (p = 0.004). Effects onthe number of pieces of media that participants re-ported viewing were in the similar direction, butnot significant at the 95% level.
Figure 6: Treatment effects on information expo-sure (endline)
4.8. Effects on perceived difficulty of re-ducing meat consumption
Finally, we examine participant perceptions ofhow difficult it would be to (a) entirely eliminatemeat from their diet and (b) reduce meat consump-tion by 25%. Figure 7 shows that, over the courseof the study, participants in both treatment armsdid not update their perceptions of how difficult itwould be to either eliminate meat from their dietentirely (Panel 1) or reduce their meat consump-tion by 25% (Panel 2).
4.9. LimitationsThree potential limitations of this study are
worth noting.Social desirability. First, social desirability
among respondents could explain a significantportion of the observed treatment effects. Specif-ically, respondents in the reduce and eliminateconditions could have reported less meat con-sumption in the endline survey not because theyactually ate less meat, but because they inferredthat the study authors wanted them to reducetheir meat consumption, leading participants tointentionally or unintentionally deflate their self-

Figure 7: Treatment effects on perceived difficultyof reducing meat consumption (change)
reports. Although we cannot directly test for theconfounding effects of social desirability, we be-lieve this concern is minimal for three reasons.First, respondents completed the endline surveyfive weeks after being exposed to treatment, allow-ing for a long period of memory decay. In particu-lar, since our participant pool consisted of M-Turkworkers, many of whom complete a large numberof surveys every day, it is unlikely that many ofour participants made the conscious link betweenthe treatment and endline survey five weeks later.
Second, if social desirability were a major con-cern, we would expect to observe large positivetreatment effects on intentions to reduce meat con-sumption and perceptions of animal intelligence.However, as described above, neither appeal hadsignificant effects on intentions to change meatconsumption or perceived animal intelligence (de-spite reductions in self-reported meat consump-tion).
Third, if social desirability was driving the mainresults, we might expect to observe significanttreatment effects on self-reported consumption offruits and vegetables, since the entire study wasframed as a “diet and lifestyle study” and the treat-ment appeals focused explicitly on diet choices(while the control discussed the benefits of walk-ing). However, Figures 8 and 9 show that neithertreatment appeal had significant effects on self-reported non-meat FFQ categories or on intentionsto eat more fruit/vegetables. As a result, the maineffects of the appeals on self-reported meat con-sumption and attitudes towards meat consumptionare unlikely to be an artifact of the data or a result
of social desirability.
Figure 8: Effects on non-meat FFQ categories
Figure 9: Effects on intentions to change fruit/vegconsumption
Lack of behavioral measures. Second, al-though we improve on the existing literature bymeasuring self-reported meat consumption along-side a battery of attitudinal and intention mea-sures, we have no way of verifying the self-reported consumption measures against actualmeat consumption.
Long-term effects. Third, although we foundno significant differences in effects between thereduce and eliminate treatments five weeks afterexposure to the appeals, we do not know whetherthe treatment effects are likely to persist longerfor one appeal over the other. Given the well-documented high rates of recidivism among veg-etarians (Faunalytics, 2014), it is possible that re-spondents who were shown the eliminate appeal(and thus would have been more likely to adoptan “all-or-nothing” mindset) would be more likelyto fail to retain their reductions in meat consump-tion than respondents who were shown the reduceappeal.
5. CONCLUDING REMARKSIn this study, we have shown that simple reduce
and eliminate appeals in the form of news arti-cles can lead to significant reductions in individ-ual meat consumption five weeks later. These ap-
peals also influenced the attitudes of participantstowards meat consumption and intensive livestockproduction, in addition to increasing the numberof discussions participants had about these topicsover the past 30 days. Overall, these effects areremarkably consistent across the reduce and elim-inate appeals, with few differences in effective-ness between the two appeals. As a result, bothmessaging strategies appear to be effective toolsfor changing individual meat consumption and at-titudes. However, the persistence of these effectsfor periods longer than five weeks remains to beexamined.
This study raises several avenues for further re-search. First, as the number of messaging experi-ments in animal advocacy continues to grow, thereis a need to directly test large numbers of mes-saging appeals against one another. Second, fur-ther work should examine the persistence of theseeffects for several months or more. Third, addi-tional research should collect behavioral measuresand examine the external validity of these resultsin real-world settings through the use of field ex-periments.
REFERENCESBenjamini, Y. and Y. Hochberg (1997). Multiple
Hypotheses Testing with Weights. Scandina-vian Journal of Statistics 24(3), 407–418.
Cialdini, R. B. (2003, aug). Crafting norma-tive messages to protect the environment. Cur-rent Directions in Psychological Science 12(4),105–109.
Faunalytics (2014). Study of Current and FormerVegetarians and Vegans. Report.
Gallagher, K. M. and J. A. Updegraff (2012).Health Message Framing Effects on Attitudes,Intentions, and Behavior: A Meta-analytic Re-view. Annals of Behavioral Medicine 43(1),101–116.
Goode, A. D., M. M. Reeves, and E. G.Eakin (2012). Telephone-Delivered Interven-tions for Physical Activity and Dietary Behav-ior Change. American Journal of PreventiveMedicine 42(1), 81–88.
Humane League Labs (2015a). Report: Does En-couraging The Public To Eat Vegan, Eat Vege-tarian, Eat Less Meat, or Cut Out Or Cut BackOn Meat And Other Animal Products Lead ToThe Most Diet Change? (August).
Humane League Labs (2015b). Report: Is AnimalCruelty, Environmental or Purity (Abolitionist)Messaging More Effective At Inspiring PeopleTo Change Their Diet?
Loughnan, S., B. Bastian, and N. Haslam (2014).The Psychology of Eating Animals. Current Di-rections in Psychological Science.
Minson, J. a. and B. Monin (2011, jul). Do-Gooder Derogation: Disparaging Morally Mo-tivated Minorities to Defuse Anticipated Re-proach. Social Psychological and PersonalityScience 3(2), 200–207.
Noar, S. M., C. N. Benac, and M. S. Harris (2007).Does tailoring matter? Meta-analytic review oftailored print health behavior change interven-tions. Psychological bulletin 133(4), 673–693.
Piazza, J., M. B. Ruby, S. Loughnan, M. Luong,J. Kulik, H. M. Watkins, and M. Seigerman(2015). Rationalizing meat consumption. The4Ns. Appetite 91, 114–128.
Price, M. K. (2014). Using field experiments to ad-dress environmental externalities and resourcescarcity: major lessons learned and new direc-tions for future research. Oxford Review of Eco-nomic Policy 30(4), 621–638.
Ruby, M. B. (2012, feb). Vegetarianism. A blos-soming field of study. Appetite 58(1), 141–50.
Ryan, E. B., D. Fraser, and D. M. Weary (2015).Public Attitudes to Housing Systems for Preg-nant Pigs. Plos One 10(11), e0141878.
Thomas, C. and V. Sharp (2013, oct). Understand-ing the normalisation of recycling behaviourand its implications for other pro-environmentalbehaviours: A review of social norms and re-cycling. Resources, Conservation and Recy-cling 79, 11–20.
SUPPORTING INFORMATIONNote on table interpretation. Tables 1 and 2
show that treatment and control groups are wellbalanced on pre-treatment outcomes, as expectedin a randomized experiment.
All other tables contain point estimates of thetreatment effects from the figures shown in theResults section (Section 3.6). These tables showtreatment and control group means, as well as es-timated treatment effects, robust standard errors,and p-values. The estimated treatment effectsshown in these tables differ slightly from a sim-ple difference in means because of the inclusionof block covariates, which purge noise from theparameter estimates and increase statistical power.
Figure 10: Distribution of FFQ total sum meat, byexperimental condition
Figure 11: Treatment effects on “how often eatmeat”
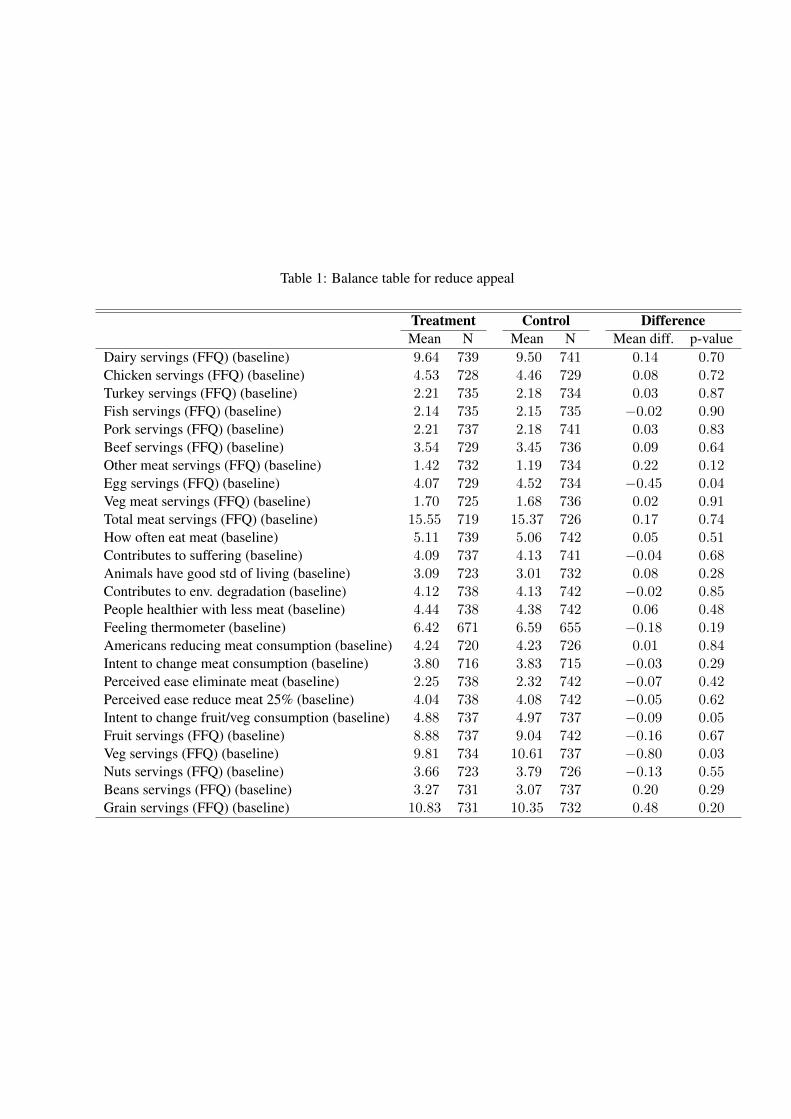
Table 1: Balance table for reduce appeal
Treatment Control DifferenceMean N Mean N Mean diff. p-value
Dairy servings (FFQ) (baseline) 9.64 739 9.50 741 0.14 0.70Chicken servings (FFQ) (baseline) 4.53 728 4.46 729 0.08 0.72Turkey servings (FFQ) (baseline) 2.21 735 2.18 734 0.03 0.87Fish servings (FFQ) (baseline) 2.14 735 2.15 735 −0.02 0.90Pork servings (FFQ) (baseline) 2.21 737 2.18 741 0.03 0.83Beef servings (FFQ) (baseline) 3.54 729 3.45 736 0.09 0.64Other meat servings (FFQ) (baseline) 1.42 732 1.19 734 0.22 0.12Egg servings (FFQ) (baseline) 4.07 729 4.52 734 −0.45 0.04Veg meat servings (FFQ) (baseline) 1.70 725 1.68 736 0.02 0.91Total meat servings (FFQ) (baseline) 15.55 719 15.37 726 0.17 0.74How often eat meat (baseline) 5.11 739 5.06 742 0.05 0.51Contributes to suffering (baseline) 4.09 737 4.13 741 −0.04 0.68Animals have good std of living (baseline) 3.09 723 3.01 732 0.08 0.28Contributes to env. degradation (baseline) 4.12 738 4.13 742 −0.02 0.85People healthier with less meat (baseline) 4.44 738 4.38 742 0.06 0.48Feeling thermometer (baseline) 6.42 671 6.59 655 −0.18 0.19Americans reducing meat consumption (baseline) 4.24 720 4.23 726 0.01 0.84Intent to change meat consumption (baseline) 3.80 716 3.83 715 −0.03 0.29Perceived ease eliminate meat (baseline) 2.25 738 2.32 742 −0.07 0.42Perceived ease reduce meat 25% (baseline) 4.04 738 4.08 742 −0.05 0.62Intent to change fruit/veg consumption (baseline) 4.88 737 4.97 737 −0.09 0.05Fruit servings (FFQ) (baseline) 8.88 737 9.04 742 −0.16 0.67Veg servings (FFQ) (baseline) 9.81 734 10.61 737 −0.80 0.03Nuts servings (FFQ) (baseline) 3.66 723 3.79 726 −0.13 0.55Beans servings (FFQ) (baseline) 3.27 731 3.07 737 0.20 0.29Grain servings (FFQ) (baseline) 10.83 731 10.35 732 0.48 0.20
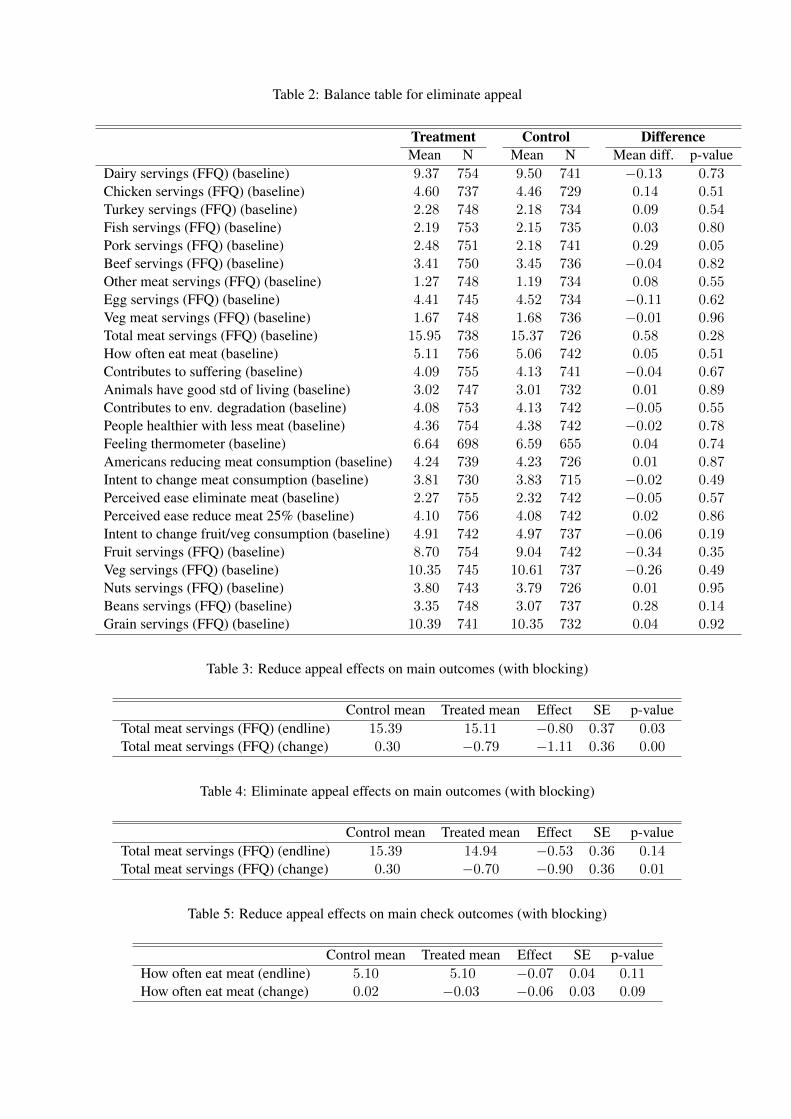
Table 2: Balance table for eliminate appeal
Treatment Control DifferenceMean N Mean N Mean diff. p-value
Dairy servings (FFQ) (baseline) 9.37 754 9.50 741 −0.13 0.73Chicken servings (FFQ) (baseline) 4.60 737 4.46 729 0.14 0.51Turkey servings (FFQ) (baseline) 2.28 748 2.18 734 0.09 0.54Fish servings (FFQ) (baseline) 2.19 753 2.15 735 0.03 0.80Pork servings (FFQ) (baseline) 2.48 751 2.18 741 0.29 0.05Beef servings (FFQ) (baseline) 3.41 750 3.45 736 −0.04 0.82Other meat servings (FFQ) (baseline) 1.27 748 1.19 734 0.08 0.55Egg servings (FFQ) (baseline) 4.41 745 4.52 734 −0.11 0.62Veg meat servings (FFQ) (baseline) 1.67 748 1.68 736 −0.01 0.96Total meat servings (FFQ) (baseline) 15.95 738 15.37 726 0.58 0.28How often eat meat (baseline) 5.11 756 5.06 742 0.05 0.51Contributes to suffering (baseline) 4.09 755 4.13 741 −0.04 0.67Animals have good std of living (baseline) 3.02 747 3.01 732 0.01 0.89Contributes to env. degradation (baseline) 4.08 753 4.13 742 −0.05 0.55People healthier with less meat (baseline) 4.36 754 4.38 742 −0.02 0.78Feeling thermometer (baseline) 6.64 698 6.59 655 0.04 0.74Americans reducing meat consumption (baseline) 4.24 739 4.23 726 0.01 0.87Intent to change meat consumption (baseline) 3.81 730 3.83 715 −0.02 0.49Perceived ease eliminate meat (baseline) 2.27 755 2.32 742 −0.05 0.57Perceived ease reduce meat 25% (baseline) 4.10 756 4.08 742 0.02 0.86Intent to change fruit/veg consumption (baseline) 4.91 742 4.97 737 −0.06 0.19Fruit servings (FFQ) (baseline) 8.70 754 9.04 742 −0.34 0.35Veg servings (FFQ) (baseline) 10.35 745 10.61 737 −0.26 0.49Nuts servings (FFQ) (baseline) 3.80 743 3.79 726 0.01 0.95Beans servings (FFQ) (baseline) 3.35 748 3.07 737 0.28 0.14Grain servings (FFQ) (baseline) 10.39 741 10.35 732 0.04 0.92
Table 3: Reduce appeal effects on main outcomes (with blocking)
Control mean Treated mean Effect SE p-valueTotal meat servings (FFQ) (endline) 15.39 15.11 −0.80 0.37 0.03Total meat servings (FFQ) (change) 0.30 −0.79 −1.11 0.36 0.00
Table 4: Eliminate appeal effects on main outcomes (with blocking)
Control mean Treated mean Effect SE p-valueTotal meat servings (FFQ) (endline) 15.39 14.94 −0.53 0.36 0.14Total meat servings (FFQ) (change) 0.30 −0.70 −0.90 0.36 0.01
Table 5: Reduce appeal effects on main check outcomes (with blocking)
Control mean Treated mean Effect SE p-valueHow often eat meat (endline) 5.10 5.10 −0.07 0.04 0.11How often eat meat (change) 0.02 −0.03 −0.06 0.03 0.09

Table 6: Eliminate appeal effects on main check outcomes (with blocking)
Control mean Treated mean Effect SE p-valueHow often eat meat (endline) 5.10 5.03 −0.02 0.04 0.74How often eat meat (change) 0.02 −0.07 −0.02 0.03 0.46
Table 7: Reduce appeal effects on meat breakdown outcomes (with blocking)
Control mean Treated mean Effect SE p-valueDairy (endline) 9.45 9.36 −0.26 0.31 0.39Chicken (endline) 4.58 4.52 −0.22 0.17 0.18Turkey (endline) 2.26 2.15 −0.30 0.12 0.01Fish (endline) 2.38 2.32 −0.25 0.12 0.04Pork (endline) 2.28 2.19 −0.24 0.10 0.02Beef (endline) 3.35 3.38 −0.14 0.14 0.31Other meat (endline) 1.09 1.30 0.01 0.11 0.91Egg (endline) 4.29 4.18 −0.35 0.18 0.06Veg meat (endline) 1.66 1.70 −0.15 0.15 0.33Dairy (change) −0.05 0.01 −0.29 0.29 0.31Chicken (change) 0.20 −0.23 −0.24 0.18 0.18Turkey (change) −0.03 −0.18 0.07 0.10 0.50Fish (change) 0.37 0.25 −0.35 0.09 0.00Pork (change) −0.21 −0.40 −0.05 0.08 0.53Beef (change) −0.04 0.03 −0.06 0.15 0.70Other meat (change) −0.09 −0.05 −0.11 0.09 0.21Egg (change) −0.27 −0.13 0.16 0.19 0.40Veg meat (change) −0.36 −0.35 −0.25 0.17 0.14
Table 8: Eliminate appeal effects on meat breakdown outcomes (with blocking)
Control mean Treated mean Effect SE p-valueDairy (endline) 9.45 9.56 −0.13 0.31 0.66Chicken (endline) 4.58 4.34 −0.08 0.17 0.66Turkey (endline) 2.26 2.07 −0.15 0.12 0.22Fish (endline) 2.38 2.12 −0.04 0.12 0.72Pork (endline) 2.28 2.00 −0.10 0.11 0.36Beef (endline) 3.35 3.34 −0.07 0.14 0.63Other meat (endline) 1.09 1.23 0.14 0.11 0.21Egg (endline) 4.29 3.93 −0.08 0.18 0.67Veg meat (endline) 1.66 1.56 0.12 0.15 0.43Dairy (change) −0.05 −0.19 0.25 0.30 0.41Chicken (change) 0.20 −0.18 −0.24 0.18 0.18Turkey (change) −0.03 −0.02 −0.12 0.10 0.26Fish (change) 0.37 0.04 −0.10 0.09 0.26Pork (change) −0.21 −0.28 −0.12 0.09 0.18Beef (change) −0.04 −0.12 0.09 0.15 0.56Other meat (change) −0.09 −0.16 0.01 0.08 0.91Egg (change) −0.27 −0.08 0.11 0.19 0.57Veg meat (change) −0.36 −0.48 −0.08 0.17 0.63

Table 9: Reduce appeal effects on attitude outcomes (with blocking)
Control mean Treated mean Effect SE p-valueContributes to suffering (endline) 4.20 4.49 0.20 0.06 0.00Animals have good std of living (endline) 3.06 2.95 −0.08 0.05 0.12Contributes to env. degradation (endline) 4.23 4.53 0.31 0.06 0.00People healthier with less meat (endline) 4.45 4.63 0.30 0.06 0.00Feeling thermometer (endline) 6.75 6.76 −0.07 0.10 0.48Americans reducing meat consumption (endline) 4.46 4.65 0.22 0.05 0.00Contributes to suffering (change) 0.10 0.35 0.22 0.05 0.00Animals have good std of living (change) 0.01 −0.09 −0.11 0.04 0.01Contributes to env. degradation (change) 0.16 0.44 0.26 0.05 0.00People healthier with less meat (change) 0.10 0.29 0.24 0.05 0.00Feeling thermometer (change) 0.25 0.22 0.06 0.09 0.48Americans reducing meat consumption (change) 0.02 0.26 0.28 0.05 0.00
Table 10: Eliminate appeal effects on attitude outcomes (with blocking)
Control mean Treated mean Effect SE p-valueContributes to suffering (endline) 4.20 4.36 0.29 0.06 0.00Animals have good std of living (endline) 3.06 2.98 −0.07 0.05 0.18Contributes to env. degradation (endline) 4.23 4.52 0.31 0.06 0.00People healthier with less meat (endline) 4.45 4.69 0.26 0.06 0.00Feeling thermometer (endline) 6.75 6.65 −0.05 0.10 0.64Americans reducing meat consumption (endline) 4.46 4.61 0.22 0.05 0.00Contributes to suffering (change) 0.10 0.33 0.26 0.05 0.00Animals have good std of living (change) 0.01 −0.14 −0.08 0.05 0.07Contributes to env. degradation (change) 0.16 0.42 0.32 0.05 0.00People healthier with less meat (change) 0.10 0.29 0.24 0.05 0.00Feeling thermometer (change) 0.25 0.33 −0.02 0.09 0.86Americans reducing meat consumption (change) 0.02 0.24 0.28 0.05 0.00
Table 11: Reduce appeal effects on intent outcomes (with blocking)
Control mean Treated mean Effect SE p-valueIntent to change meat consumption (endline) 3.75 3.72 −0.07 0.03 0.01Intent to change meat consumption (change) −0.09 −0.08 0.01 0.03 0.72
Table 12: Eliminate appeal effects on intent outcomes (with blocking)
Control mean Treated mean Effect SE p-valueIntent to change meat consumption (endline) 3.75 3.70 −0.03 0.03 0.32Intent to change meat consumption (change) −0.09 −0.09 0.02 0.03 0.54
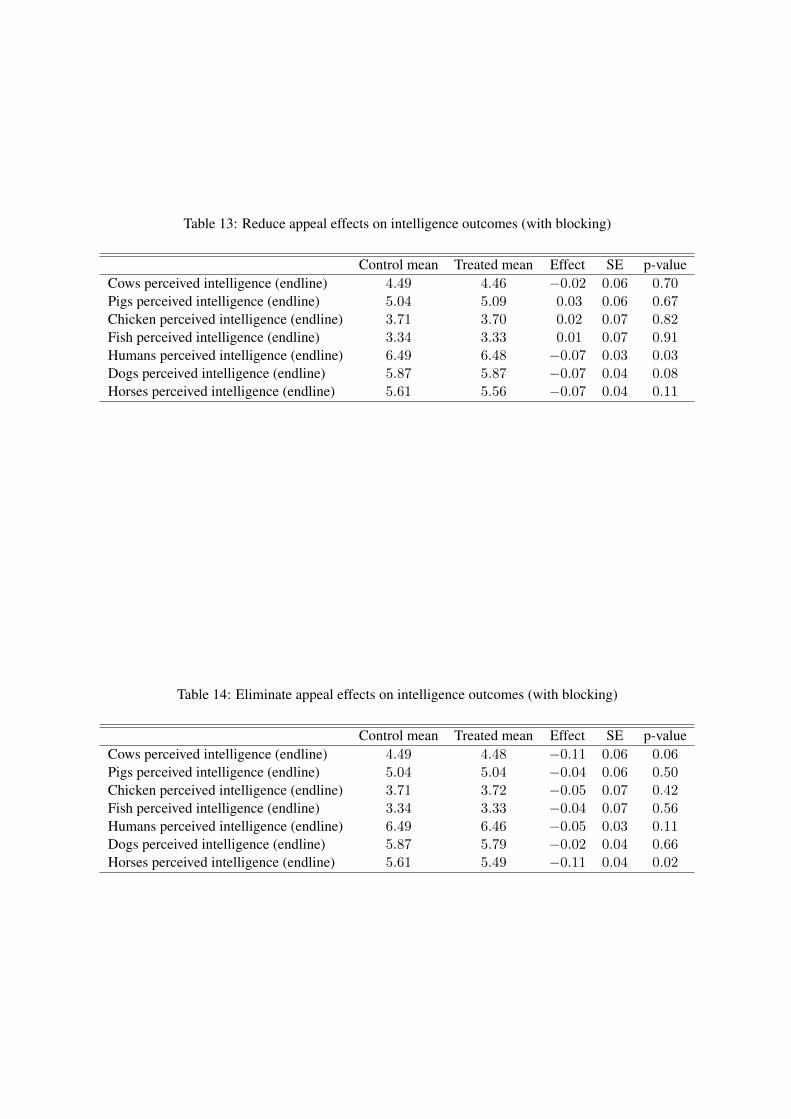
Table 13: Reduce appeal effects on intelligence outcomes (with blocking)
Control mean Treated mean Effect SE p-valueCows perceived intelligence (endline) 4.49 4.46 −0.02 0.06 0.70Pigs perceived intelligence (endline) 5.04 5.09 0.03 0.06 0.67Chicken perceived intelligence (endline) 3.71 3.70 0.02 0.07 0.82Fish perceived intelligence (endline) 3.34 3.33 0.01 0.07 0.91Humans perceived intelligence (endline) 6.49 6.48 −0.07 0.03 0.03Dogs perceived intelligence (endline) 5.87 5.87 −0.07 0.04 0.08Horses perceived intelligence (endline) 5.61 5.56 −0.07 0.04 0.11
Table 14: Eliminate appeal effects on intelligence outcomes (with blocking)
Control mean Treated mean Effect SE p-valueCows perceived intelligence (endline) 4.49 4.48 −0.11 0.06 0.06Pigs perceived intelligence (endline) 5.04 5.04 −0.04 0.06 0.50Chicken perceived intelligence (endline) 3.71 3.72 −0.05 0.07 0.42Fish perceived intelligence (endline) 3.34 3.33 −0.04 0.07 0.56Humans perceived intelligence (endline) 6.49 6.46 −0.05 0.03 0.11Dogs perceived intelligence (endline) 5.87 5.79 −0.02 0.04 0.66Horses perceived intelligence (endline) 5.61 5.49 −0.11 0.04 0.02
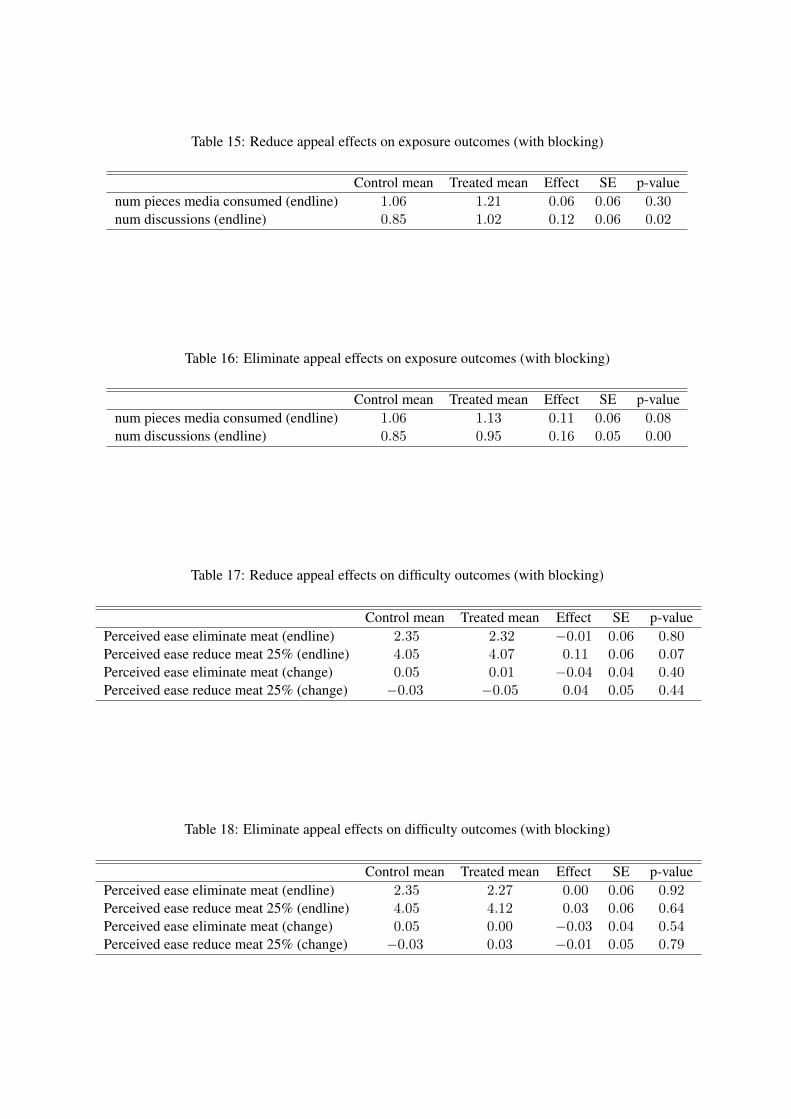
Table 15: Reduce appeal effects on exposure outcomes (with blocking)
Control mean Treated mean Effect SE p-valuenum pieces media consumed (endline) 1.06 1.21 0.06 0.06 0.30num discussions (endline) 0.85 1.02 0.12 0.06 0.02
Table 16: Eliminate appeal effects on exposure outcomes (with blocking)
Control mean Treated mean Effect SE p-valuenum pieces media consumed (endline) 1.06 1.13 0.11 0.06 0.08num discussions (endline) 0.85 0.95 0.16 0.05 0.00
Table 17: Reduce appeal effects on difficulty outcomes (with blocking)
Control mean Treated mean Effect SE p-valuePerceived ease eliminate meat (endline) 2.35 2.32 −0.01 0.06 0.80Perceived ease reduce meat 25% (endline) 4.05 4.07 0.11 0.06 0.07Perceived ease eliminate meat (change) 0.05 0.01 −0.04 0.04 0.40Perceived ease reduce meat 25% (change) −0.03 −0.05 0.04 0.05 0.44
Table 18: Eliminate appeal effects on difficulty outcomes (with blocking)
Control mean Treated mean Effect SE p-valuePerceived ease eliminate meat (endline) 2.35 2.27 0.00 0.06 0.92Perceived ease reduce meat 25% (endline) 4.05 4.12 0.03 0.06 0.64Perceived ease eliminate meat (change) 0.05 0.00 −0.03 0.04 0.54Perceived ease reduce meat 25% (change) −0.03 0.03 −0.01 0.05 0.79

Table 19: Results of multiple hypothesis testing corrections using weighted FDR
pvalue rejectedContributes to suffering (endline) 0.000 YesContributes to env. degradation (endline) 0.000 YesPeople healthier with less meat (endline) 0.000 YesAmericans reducing meat consumption (endline) 0.000 YesContributes to suffering (change) 0.000 YesContributes to env. degradation (change) 0.000 YesPeople healthier with less meat (change) 0.000 YesAmericans reducing meat consumption (change) 0.000 Yesnum discussions (endline) 0.004 YesTotal meat servings (FFQ) (change) 0.011 YesHorses perceived intelligence (endline) 0.015 YesCows perceived intelligence (endline) 0.062 NoAnimals have good std of living (change) 0.068 Nonum pieces media consumed (endline) 0.075 NoBeans servings (FFQ) (change) 0.083 NoHumans perceived intelligence (endline) 0.110 NoTotal meat servings (FFQ) (endline) 0.141 NoFruit servings (FFQ) (change) 0.172 NoPork servings (FFQ) (change) 0.176 NoChicken servings (FFQ) (change) 0.179 NoAnimals have good std of living (endline) 0.181 NoOther meat servings (FFQ) (endline) 0.207 NoTurkey servings (FFQ) (endline) 0.221 NoIntent to change fruit/veg consumption (endline) 0.254 NoTurkey servings (FFQ) (change) 0.260 NoFish servings (FFQ) (change) 0.260 NoIntent to change meat consumption (endline) 0.324 NoPork servings (FFQ) (endline) 0.364 NoVeg servings (FFQ) (endline) 0.367 NoNuts servings (FFQ) (endline) 0.370 No

Table 20: Results of multiple hypothesis testing corrections using weighted FDR
pvalue rejectedFish servings (FFQ) (change) 0.000 YesContributes to suffering (endline) 0.000 YesContributes to env. degradation (endline) 0.000 YesPeople healthier with less meat (endline) 0.000 YesAmericans reducing meat consumption (endline) 0.000 YesContributes to suffering (change) 0.000 YesContributes to env. degradation (change) 0.000 YesPeople healthier with less meat (change) 0.000 YesAmericans reducing meat consumption (change) 0.000 YesTotal meat servings (FFQ) (change) 0.002 YesIntent to change meat consumption (endline) 0.012 YesTurkey servings (FFQ) (endline) 0.012 YesAnimals have good std of living (change) 0.014 YesPork servings (FFQ) (endline) 0.018 Yesnum discussions (endline) 0.023 YesTotal meat servings (FFQ) (endline) 0.028 YesHumans perceived intelligence (endline) 0.030 YesFish servings (FFQ) (endline) 0.039 NoEgg servings (FFQ) (endline) 0.056 NoPerceived ease reduce meat 25% (endline) 0.072 NoDogs perceived intelligence (endline) 0.079 NoIntent to change fruit/veg consumption (change) 0.088 NoHow often eat meat (change) 0.094 NoHow often eat meat (endline) 0.108 NoHorses perceived intelligence (endline) 0.112 NoAnimals have good std of living (endline) 0.120 NoVeg meat servings (FFQ) (change) 0.137 NoBeans servings (FFQ) (change) 0.155 NoChicken servings (FFQ) (endline) 0.178 NoChicken servings (FFQ) (change) 0.179 No

Rise of people pledging to become “reducetarian” PUBLISHED: 18 June 2016
Latest campaign encourages people to go “reducetarian” with respect to their own diets
You can't help feeling that eating less meat is becoming unavoidably mainstream, with more and more people choosing to become “reducetarians” by reducing their consumption of red meat, poultry, and seafood without cutting these products out of their diets entirely. Recent research from data analysts at Mintel has shown that one in eight adults in the US are eating less meat, including up to one in five young adults. In the US, over six million people have reduced their meat intake, and that number is rising.
To learn more, I reached out to Jack Thompson, host of a Future of Food talk entitled "Why I’m a Reducetarian" and the founder of a new campaign to encourage Americans to reduce their meat intake. A 25-year-old New Yorker who grew up eating a standard American diet, Thompson shared his thoughts with me on why he’s urging people to join the movement and pledge to become reducetarian.
“Some people feel that eating meat is an ‘all-or-nothing’ choice: you either stop eating meat entirely or continue eating it as usual,” said Thompson. “Our campaign encourages people to take the middle road and go ‘reducetarian’ by reducing their meat consumption without entirely cutting it out of their diets.”
So take the pledge to live a reducetarian lifestyle and make yourself, your cardiologist, and a whole lot of farm animals very happy,” Thompson added. “Some people think that changing their diet is difficult, but the truth is that there are so many alternatives to meat available today that it’s never been easier to eat less of it.”
According to Thompson, the unsustainability of today’s animal agriculture system is what inspired him to create the reducetarianism campaign. “For one thing, our passion for meat has an enormous negative impact on the environment. Of the 40% of the earth’s surface used for agriculture, a whopping third is used just to grow animal (not people) food. In the United States, studies show, raising livestock accounts for 55 percent of land erosion, 37 percent of pesticide use, and 50 percent of antibiotic consumption. Globally, livestock are responsible for about 18 percent of greenhouse gas emissions—farting cows are doing the atmosphere no good—and food animals, collectively, slurp up about a third of the world’s fresh water,” he said in his Future of Food Talk.
“On a purely personal level, there’s also the issue of our own health and well-being. A wealth of medical evidence shows that people whose diets are low in saturated fats—as found in meat and high-fat dairy products—and high in fruits and vegetables tend to lead healthier, longer lives,” he added.
Finally, since many of the animals we eat are raised in wretched conditions on factory farms, eating meat forces us to contend with the moral issue of animal cruelty. Because of over-crowded and poor sanitary conditions, infections run rampant and the animals cannot engage in many of their natural social behaviors. Hens, for example, typically live out their entire lives in crowded cages, while female pigs are forced into crates which are so restrictive that they cannot even turn around. Every year, over 60 billion animals are killed in factory farms where they are subject to severe abuse and suffering for most of their short lives.
The good news, according to Thompson, is that people are beginning to do something about it. Thanks to a growing number of undercover investigations that expose the suffering of these animals, more and more consumers are thinking about reducing their meat consumption. “Increasingly, Americans now consider ‘factory farming’ to be a dirty word and are taking action by becoming a reducetarian,” said Thompson.
“Since we’ve started this campaign, we have only received positive feedback from people who have taken the pledge to become a reducetarian,” said Thompson. “They feel better physically, and feel great about the choices they’re making to help the environment and animals.”
Rise of people pledging to become vegetarian PUBLISHED: 18 June 2016
Latest campaign encourages people to go vegetarian with respect to their own diets
You can't help feeling that eliminating meat is becoming unavoidably mainstream, with more and more people choosing to become vegetarians by cutting out red meat, poultry, and seafood from their diets. Recent research from data analysts at Mintel has shown that one in eight adults in the US have stopped eating meat, including up to one in five young adults. In the US, over six million people have eliminated meat from their diets, and that number is rising.
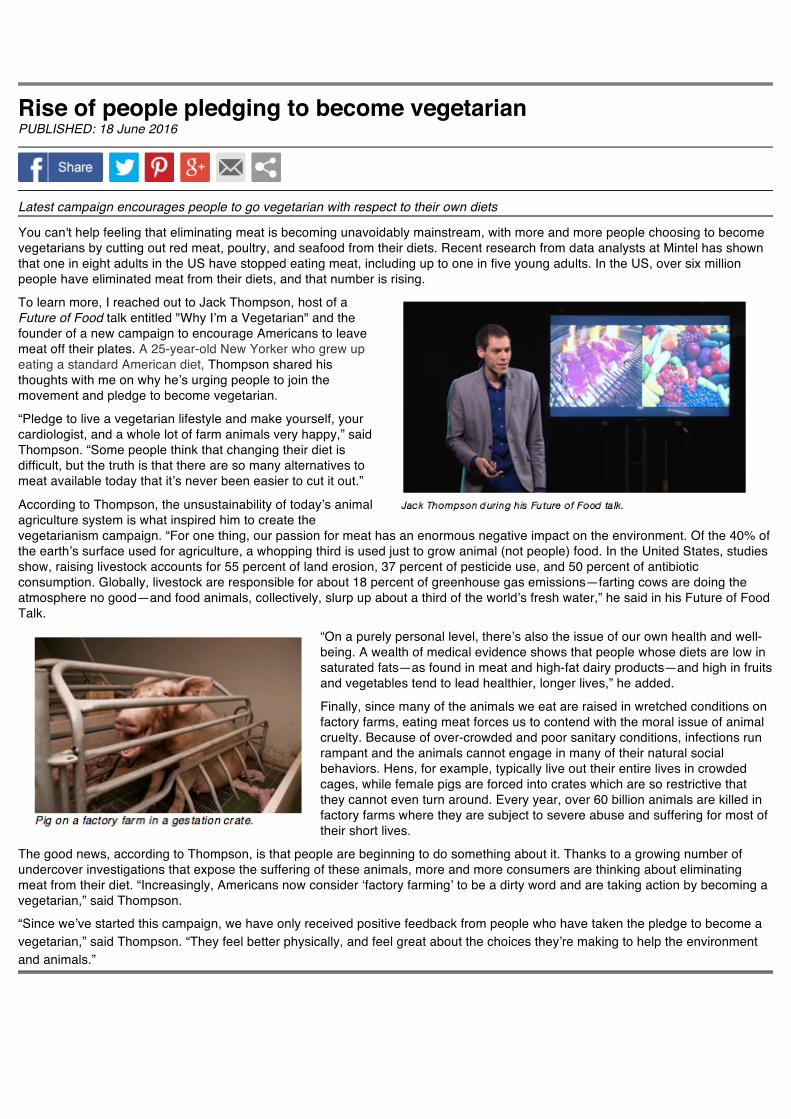
To learn more, I reached out to Jack Thompson, host of a Future of Food talk entitled "Why I’m a Vegetarian" and the founder of a new campaign to encourage Americans to leave meat off their plates. A 25-year-old New Yorker who grew up eating a standard American diet, Thompson shared his thoughts with me on why he’s urging people to join the movement and pledge to become vegetarian.
“Pledge to live a vegetarian lifestyle and make yourself, your cardiologist, and a whole lot of farm animals very happy,” said Thompson. “Some people think that changing their diet is difficult, but the truth is that there are so many alternatives to meat available today that it’s never been easier to cut it out.”
According to Thompson, the unsustainability of today’s animal agriculture system is what inspired him to create the vegetarianism campaign. “For one thing, our passion for meat has an enormous negative impact on the environment. Of the 40% of the earth’s surface used for agriculture, a whopping third is used just to grow animal (not people) food. In the United States, studies show, raising livestock accounts for 55 percent of land erosion, 37 percent of pesticide use, and 50 percent of antibiotic consumption. Globally, livestock are responsible for about 18 percent of greenhouse gas emissions—farting cows are doing the atmosphere no good—and food animals, collectively, slurp up about a third of the world’s fresh water,” he said in his Future of Food Talk.
“On a purely personal level, there’s also the issue of our own health and well-being. A wealth of medical evidence shows that people whose diets are low in saturated fats—as found in meat and high-fat dairy products—and high in fruits and vegetables tend to lead healthier, longer lives,” he added.
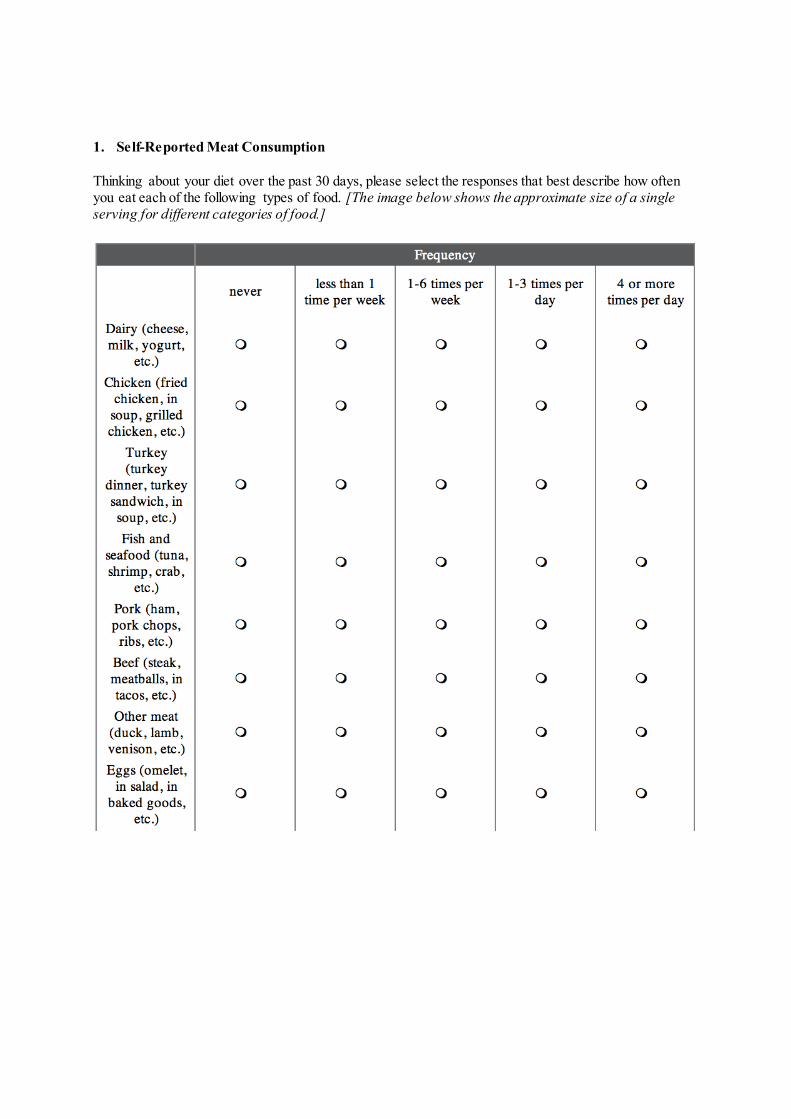
Finally, since many of the animals we eat are raised in wretched conditions on factory farms, eating meat forces us to contend with the moral issue of animal cruelty. Because of over-crowded and poor sanitary conditions, infections run rampant and the animals cannot engage in many of their natural social behaviors. Hens, for example, typically live out their entire lives in crowded cages, while female pigs are forced into crates which are so restrictive that they cannot even turn around. Every year, over 60 billion animals are killed in factory farms where they are subject to severe abuse and suffering for most of their short lives.
The good news, according to Thompson, is that people are beginning to do something about it. Thanks to a growing number of undercover investigations that expose the suffering of these animals, more and more consumers are thinking about eliminating meat from their diet. “Increasingly, Americans now consider ‘factory farming’ to be a dirty word and are taking action by becoming a vegetarian,” said Thompson.
“Since we’ve started this campaign, we have only received positive feedback from people who have taken the pledge to become a vegetarian,” said Thompson. “They feel better physically, and feel great about the choices they’re making to help the environment and animals.”

The Simple Yet Potent Exercise That Benefits Everyone PUBLISHED: 18 June 2016
Walking. We all know it’s good for us. But why? Not only is walking great for our health, but it has a profound socioeconomic impact on our communities. Due to its widespread benefits, the Surgeon General has declared a call to action to promote walking and increase walkability in our communities. But, what really makes walking so great? Regular physical activity is essential for good health. It reduces the risk of chronic diseases (like heart disease, stroke, certain cancers and type 2 diabetes), promotes healthy weight, reduces the risk for depression, lowers blood pressure and decreases stress. All it takes is 30 minutes a day. Moderate walking is a terrific form of exercise, as it doesn’t over-stress that body like some more intense activities can. Walking is good for your body, plain and simple — but you already knew that…
What you may not have considered is the socioeconomic effect walking can have on communities. The 2nd National Walking Summit, held this past fall in Washington D.C., focused on the sometimes shocking correlations between zip code and overall health. Individuals from communities with less walkability were significantly more likely to be obese or suffer from chronic disease than those from very walkable, well-designed communities. If a community isn’t designed with walking in mind, its citizens are less likely to do it due to the inconvenience and inherent danger. This encourages a more sedentary, unhealthy lifestyle.
Walkable communities are associated with healthy citizens. If kids are able to walk or bike to school safely, they are already accomplishing most of their required minimum of physical activity by simply getting to and from school. Safe modes of pedestrian transportation are essential in the battle against childhood obesity, and are beneficial for adults as well.
Communities with sidewalks, lighting, access to water, greenery, parks and playgrounds generally fare better, with healthier, happier and more economically successful citizens. And keeping permanent affordable housing options can reduce widespread gentrification, allowing the low-income to stay rooted in the community as real estate prices may rise due to revitalization of the neighborhood. To walk in safety should be a basic human right in every community, no matter what age, race, religion or wealth pervades there.
The promotion of walking is perhaps the intersection of improved health, social justice, land conservation and neighborhood revitalization. It’s important that no American is denied access to safe walking. With more and more Americans starting to get moving and walking each year, it’s important for our communities to keep up.
Join the Call to Action. Start walking more and promote daily walking in your community. Work to make small changes in your community so that we can ensure health and basic rights for all.
1. Self-Reported Meat Consumption
Thinking about your diet over the past 30 days, please select the responses that best describe how often you eat each of the following types of food. [The image below shows the approximate size of a single serving for different categories of food.]
How often do you eat meat? By "meat", we are referring to red meat (e.g. beef, pork), white and other meat (e.g. eggs, chicken, turkey, duck), and fish and seafood (e.g. tuna, shrimp, crab). Every day
Every other day
2-3 Times a Week
Once a Week
Less than once a week
Never
Do you intend to change your meat consumption over the next month (30 days)? Meat includes chicken, turkey, beef, pork, duck, fish, seafood, etc. "I intend to ______ my meat consumption over the next month." Greatly decrease
Decrease
Somewhat Decrease
Maintain current levels
Somewhat increase
Increase
Greatly increase
2. Attitudes Towards Factory Farming
Please indicate the extent to which you agree or disagree with the following statements.
Strongly disagree
Disagree Somewhat disagree
Neither agree nor disagree
Somewhat agree
Agree Strongly agree
Purchasing animal
products (like meat, eggs,
dairy) contributes to the suffering of animals
Most animals that are raised for food have
a good standard of
living
Raising animals for
food contributes to environmental degradation
Most people would be
healthier if they ate less
meat
What are the TWO most important things that you take into consideration when deciding what meat, eggs, and dairy to purchase at the grocery store? This includes chicken breasts, ground beef, pork chops, eggs, fish fillets, shrimp, etc.You may select up to TWO of the criteria below. Price of the product
Nutritional content of the product
Whether the product is antibiotic and/or hormone free
Whether the animals had a good standard of living
How the product tastes
The environmental impacts of the product
Other (please specify): ____________________
3. Perceptions of Social Norms
Please indicate the extent to which you agree or disagree with the following statements.
Strongly disagree
Disagree Somewhat disagree
Neither agree nor disagree
Somewhat agree
Agree Strongly agree
More and more people in the US are reducing their
meat consumption
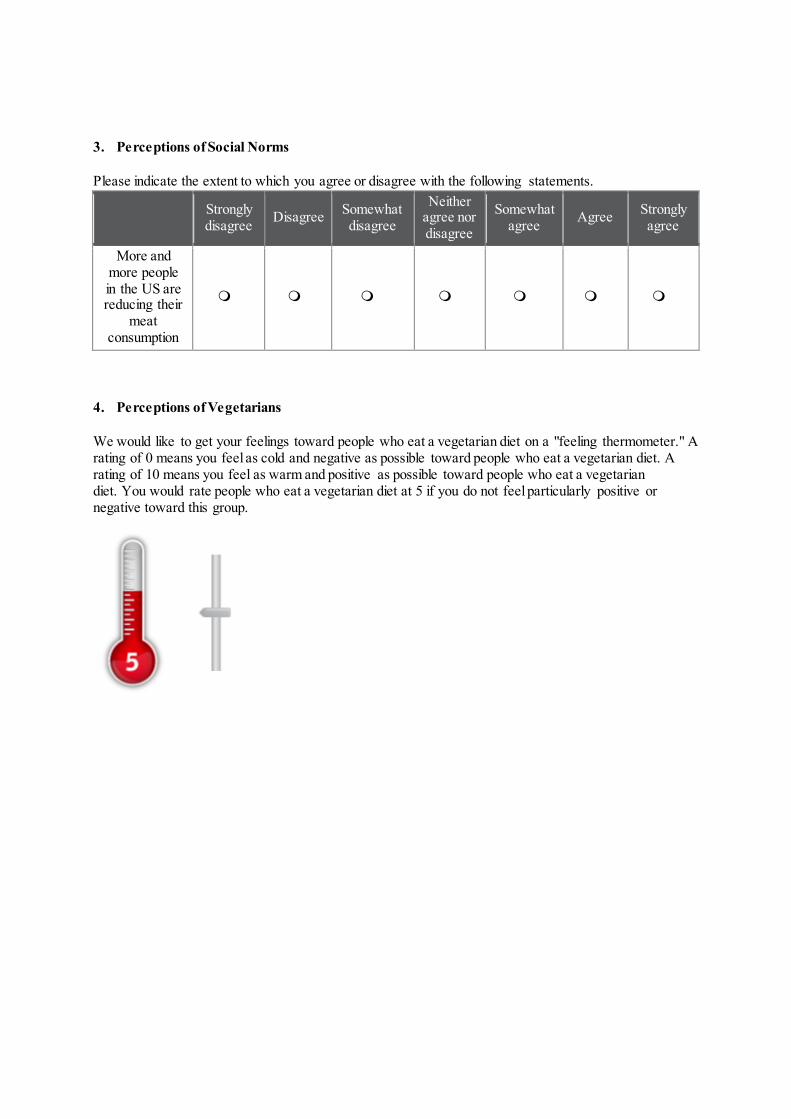
4. Perceptions of Vegetarians
We would like to get your feelings toward people who eat a vegetarian diet on a "feeling thermometer." A rating of 0 means you feel as cold and negative as possible toward people who eat a vegetarian diet. A rating of 10 means you feel as warm and positive as possible toward people who eat a vegetarian diet. You would rate people who eat a vegetarian diet at 5 if you do not feel particularly positive or negative toward this group.

5. Perceptions of Animal Intelligence and Suffering
Please rate each of the following according to the extent that you think they are intelligent or unintelligent:
Very
unintelligent
Unintelligent
Somewhat unintellige
nt
Neither intelligent
nor unintellige
nt
Somewhat
intelligent
Intelligent
Very intelligen
t
Cows
Pigs
Chicken
Fish
Humans
Dogs
Horses
Please rate each of the following according to the extent that you think they are capable of experiencing pain/suffering:
Not capable of
experiencing pain/suffering
at all
(2) (3) (4) (5) (6)
Highly capable of
experiencing pain/suffering
Cows
Pigs
Chicken
Fish
Humans
Dogs
Horses
6. Information Exposure and Discussions
In the past 30 days, how many separate pieces of media (e.g. news stories, blogs, documentaries, books, ...) have you read/watched that discuss the negative implications of meat consumption or the treatment of animals raised for food? 0 pieces of media
1 piece of media
2 pieces of media
3 pieces of media
4 pieces of media
5 pieces of media
6 pieces of media
7 pieces of media
8 pieces of media
9 pieces of media
10 or more pieces of media
In the past 30 days, with how many people have you discussed meat consumption or the treatment of animals raised for food? This could include friends, family, co-workers, acquaintances, strangers, etc. 0 people
1 person
2 people
3 people
4 people
5 people
6 people
7 people
8 people
9 people
10 or more people
7. Difficulty of Reducing Meat Consumption
Imagine you decided to become vegetarian, and thus quit eating meat entirely. How do you think your friends and family would respond?
Definitely not Probably not Maybe Probably yes Definitely yes
My friends and family would be
supportive if I decided to quit eating meat.
My friends and family
would think or say negative things about
me behind my back if I
decided to quit eating meat.
Please rate the following according to how difficult you think each goal would be for you. Think about how much effort it would take, whether you feel like it is something you could possibly do, and whether it is something you could stick with over time.
Very
Difficult Difficult
Somewhat Difficult
Neutral Somewhat
Easy Easy
Very Easy
Completely eliminating meat from
your diet for the next year
Reducing your meat
consumption by 25% for
the next year