the effects of selenium on stz-induced · pdf filethe effects of selenium on stz-induced...
TRANSCRIPT

i
THE EFFECTS OF SELENIUM ON STZ-INDUCED DIABETIC
RAT KIDNEY PLASMA MEMBRANE
A THESIS SUBMITTED TO THE
GRADUATE SCHOOL OF NATURAL AND APPLIED SCIENCES
OF
MIDDLE EAST TECHNICAL UNIVERSITY
BY
RAFIG GURBANOV
IN PARTIAL FULFILLMENT OF THE REQUIREMENTS
FOR
THE DEGREE OF MASTER OF SCIENCE
IN
BIOCHEMISTRY
JANUARY 2010

ii
Approval of the thesis:
THE EFFECTS OF SELENIUM ON STZ-INDUCED DIABETIC
KIDNEY PLASMA MEMBRANE
submitted by RAFIG GURBANOV in partial fulfillment of the requirements
for the degree of Master of Science in Biochemistry Department, Middle East
Technical University by,
Prof. Dr. Canan Özgen _______
Dean, Graduate School of Natural and Applied Sciences
Prof. Dr. Mesude Işcan _______
Head of Department, Biochemistry
Prof. Dr. Feride Severcan _______
Supervisor, Biology Dept., METU
Assoc.Prof. Dr. Sreeparna Banerjee _______
Co-Supervisor, Biology Dept., METU
Examining Committee Members
Prof. Dr. Faruk Bozoğlu _____________
Food Engineering Dept., METU
Prof. Dr. Feride Severcan _____________
Biology Dept., METU
Prof. Dr. Orhan Adalı _____________
Biology Dept., METU
Assoc. Prof. Dr. Nursen Çoruh _____________
Chemistry Dept., METU
Dr. Sevgi Türker _____________
Biology Dept., Kocaeli University
Date: 14.01.2010

iii
I hereby declare that all information in this document has been obtained and
presented in accordance with academic rules and ethical conduct. I also declare
that, as required by these rules and conduct, I have fully cited and referenced
all material and results that are not original to this work.
Name, Last name: Rafig Gurbanov
Signature:

iv
ABSTRACT
THE EFFECTS OF SELENIUM ON STZ-INDUCED DIABETIC
RAT KIDNEY PLASMA MEMBRANE
Gurbanov, Rafig
M.Sc., Department of Biochemistry
Supervisor: Prof. Dr. Feride Severcan
Co Supervisor: Assoc. Prof. Dr. Sreeparna Banerjee
January 2010, 129 Pages
The kidney is one of the most affected organs of body from diabetes. Diabetic kidney
disease is a complication of diabetes seen in 30-40% of diabetic person.
The aim of this work is to contribute the useful information in the therapy of
diabetes. It is very important to know the role of antioxidants at the molecular level
during diabetes. The protecting role of antioxidants against lipid peroxidation, the
effect of cellular antioxidant enzyme systems, understanding the changes of
membrane fluidity, lipid order and protein structure which are resulted from
antioxidant treatment, determining the effective therapeutic dose with the help of
biochemical methods are very important in order to understand the effect of
antioxidants at molecular level.
In this thesis work, the Attenuated Total Reflectance Fourier Transform Infrared
Spectroscopy (ATR-FTIR) was used in order to study the diabetic kidney disease at
v
the molecular level, which is encountered as a complication of diabetes.
Furthermore, the protecting and possible therapeutic role of selenium in the course of
diabetic kidney disease was investigated.
To conclude, the kidney plasma membranes were severely deteriorated due to
diabetes with respect to its lipid, protein and carbohydrate structure and content,
which were corrected after selenium treatment. The diabetes causes diminishment of
whole membrane fluidity, which was normalized with the selenium administration.
This is the first study demonstrating the effect of diabetes on kidney plasma
membrane and the effect of selenium on stz-induced diabetic kidney plasma
membranes using spectroscopic tools. The study revealed serious therapeutic and
preventing capacities of selenium on diabetic kidney plasma membranes which needs
confirmation of future researches. Furthermore, the dosage of selenium given to
diabetics should be investigated in detail and proved with biochemical and clinical
data.
Key Words: Diabetic Nephropathy, Selenium, ATR-FTIR Spectroscopy, Plasma
membranes

vi
ÖZ
SELENYUMUN STREPTOZOTOSİN İLE DIYABET OLUŞTURULAN
SIÇAN BÖBREK HÜCRE ZARI ÜZERINDEKİ ETKİLERİNİN
İNCELENMESİ
Gurbanov, Rafig
Yüksek Lisans, Biyokimya Bölümü
Tez Yöneticisi: Prof. Dr. Feride Severcan
Ortak Tez Yöneticisi: Yrd. Doç. Dr. Sreeparna Banerjee
Ocak 2010, 129 sayfa
Vücutta diyabet hastalığından etkilenen dokular arasında böbrek dokusu da
bulunmaktadır. Diyabetik böbrek hastalığı 30-40% diyabet hastalarında görülen bir
diyabet komplikasyonudur.
Bu çalışmanın amacı diyabetin komplikasyonlarından biri olarak tanımlanan
diyabetik böbrek hastalığının moleküler düzeyde araştırılması, antioksidanların
diyabetik böbrek hastalığında tedavi edici rolünü saptamak, özellikle böbrek hücre
zarlarındakı yapısal değişikleri moleküler düzeyde incelemek ve sıçanlara selenyum
vererek selenyumun diyabetik böbrek dokularındakı iyileştirici rolünü
araştırmaktadır.
Bu tez çalışmasında ATR-FTIR specktoskopisi kullanarak, diyabetin böbrek
üzerindeki etkileri ortaya çıkarılmaya çalışılmışdır. Ayrıca, selenyumun diyabetin
tedavisinde koruyucu ve tedaviedici rolu incelenmiştir.

vii
Sonuc olarak, diyabetin böbrek hücre zarlarında üzerinde önemli degişimlere neden
olduğu gözlemlenmiştir. Diyabet, hücre membranın lipit, protein ve karbonhidratının
yapı ve miktarlarında değişimlerlere yol açmıştır. Selenyum tedavisi sonucunda bu
değişimlerin giderildigi gözlemlenmiştir. Diyabet sonucunda azalmış membrane
akışkanlığını selenium uygulanması sonucunda giderilmiştir. Bu ilkin çalışma,
diyabetin böbrek hücre zari üzerindeki ve selenyumun diyabetik böbrek hücre zari
üzerindeki etkilerini, spektroskopik araçlar kullanılarak ortaya çıkarmıştır. Ayrıca, bu
çalışma sonucunda selenyumun diyabetik böbrek hücre zarı üzerinde tedavi edici ve
koruyucu özellikleri saptanmıştır. Bu çalışmanı kanıtlamak için gelecek araştırmalara
gerek duyulmaktadır. Ayrıca selenyumun diyabetik hastalara uygulana bilecek
dozları detaylı şekilde araştırılmalı ve klinik, biyokimyasal verilerle
desteklenmelidir.
Anahtar kelimeler: Diyabetik nefropati, Selenyum ATR-FTIR spektroskopisi, Hücre
zarı

viii
To My Father,

ix
ACKNOWLEDGEMENTS
I would like to thank to my supervisor Prof. Dr. Feride SEVERCAN and co-
supervisor Assoc. Prof. Dr. Sreeparna BANERJEE for their guidance, patience,
encouragement and supervision throughout this thesis study.
I also compassionately express my special thanks to Sevgi Turker, Nihal Ozek and
Ozlem Bozkurt owing to their precious help and lovely attitude in the course of
experimental period and writing this thesis.
I would like to send my ultimate appreciation to my parents for their endless
patience, encouragement, support and love.
This study was supported by the METU, DAP project. Grant No: BAP -
07.02.2009.03

x
TABLE OF CONTENTS
ABSTRACT...........................................................................................iv
ÖZ...........................................................................................................vi
ACKNOWLEDGEMENTS ..................................................................ix
TABLE OF CONTENTS........................................................................x
LIST OF FIGURES ............................................................................xiii
LIST OF TABLES..............................................................................xvii
CHAPTER
1. INTRODUCTION.........................................................................1
1.1 Kidneys………………………………………………............1
1.1.1 External Anatomy of the kidneys …………………...1
1.1.2 Internal Anatomy of the kidneys …………………....2
1.1.3 Blood supply of kidney...……………………............ 3
1.1.4 Nephrons …….…………………………..……..…....5
1.2 The Plasma Membranes ……………………………..............9
1.2.1 The Plasma Membranes of Kidney …………….......10
1.2.2 The Brush-Border Plasma Membrane .…………......11
1.3 Diabetes Mellitus …………………………………………...11
1.3.1 Type 1 Diabetes Mellitus (IDDM) ...........................12
1.3.2 Type 2 Diabetes Mellitus (NIDDM) ……………….13
1.3.3 Complications of Diabetes Mellitus………….. …...15
1.3.4 Oxidative Stress and Diabetes ……………….........19
1.3.5 Experimental Models of Diabetes Mellitus ….........20
1.3.5.1 Streptozotocin Induced Diabetes ……….….......21
1.3.6 Diabetic Kidney disease………………………........22

xi
1.4 Selenium…………………………………………………….....25
1.4.1 Selenium Deficiency and Toxicity ………………...….26
1.4.2 Selenoproteins…………………………………............28
1.4.3 The effect of Selenium on Glucose metabolism and
Diabetes………………………………….………..…. 29
1.5 Fundamentals of Spectroscopy …..…..…………….…...….....32
1.5.1 Infrared Spectroscopy .…………………………..........35
1.5.2 The Advantages of Infrared Spectroscopy ……...........37
1.5.3 Fourier Transform Infrared Spectrometers
1.5.4 (FT-IR) ………………………………………....….....37
1.5.5 Attenuated Total Reflectance Spectroscopy
1.5.6 (ATR) …………………………………….…..............39
1.6 Aim of the Study ………………………………………….....41
2.MATERIAL AND METHODS
2.1 Reagents ..............................................................................43
2.2 Animals and Feedings ………………………………….....43
2.2.1 Formation of Control group …………………….............43
2.2.2 Formation of Diabetic group ……………………............44
2.2.3 Formation of Selenium treated Diabetic groups………...44
2.3. Isolation of Rat Kidney Brush Border Plasma
Membrane vesicles using Calcium precipitation method
…………………………………………………..…….............44
2.4 ATR-FTIR study ………………………………………....46
2.5 Cluster Analysis ………………………………….…….....47
2.6 Structural Analysis of Main Protein
(Amide I) Band ………………………………..……….......48
2.7 Statistical Analysis ...…………………………..................48
3. RESULTS
3.1 General ATR-FTIR Spectrum and Band Assignment
of Rat Kidney Plasma Membranes ..........................................49
3.2 Effect of Diabetes on Rat Kidney Plasma Membranes
xii
…………………………………………………………..............60
3.2.1 Effect of Diabetes on Rat Kidney Plasma Membranes
In the C-H Region (3020-2800 cm-1) ………………………....60
3.2.2 Effect of Diabetes on Rat Kidney Plasma Membranes
In the Finger-Print Region (1750-950 cm-1
) ………………….68
3.3 Effect of Selenium on Diabetic Rat Kidney
Plasma Membranes ………………………………………….…71
3.3.1 The Effect of Selenium on Diabetic Rat Kidney
Plasma membranes in the C-H region…………………………..71
3.3.2. The Effect of Selenium on Diabetic Rat Kidney
Plasma membranes in the Finger-Print region ……….………...81
3.4 The Second Derivative Secondary Structure Analysis
Of Main Protein Band (Amide I band)………………………....88
4. DISCUSSION …………………………………………………..........92
5. CONCLUSION...................................................................................103
REFERENCES........................................................................................105
xiii
LIST OF FIGURES
FIGURES
Figure 1. Internal and External Anatomy of Kidneys. ................................................3
Figure 2. Blood supply of Whole kidney....................................................................4
Figure 3. Structure of nephron.....................................................................................6
Figure 4. Renal glomerulus..........................................................................................8
Figure 5.The Schematic view of Plasma Membrane...................................................9
Figure 6. Abnormalities in type 2 diabetes that contribute to hyperglycemia...........14
Figure 7. Illustration of the pathways leading to diabetic complications..................18
Figure 8. From hyperglycemia to diabetic nephropathy...........................................25
Figure 9. An electromagnetic wave..........................................................................32
Figure 10. Typical energy-level diagrams showing the ground state
and the first excited state..........................................................................................33
Figure 11. The Electromagnetic spectrum………………………............................34
Figure 12. The schematic representation of some molecular vibrations in linear
triatomic molecules: (A) and non-linear triatomic molecules (B). + ; -
Symbols represent atomic displacement out of page plane …………………..…..36
Figure 13. Types of bending vibrations ..................................................................36
Figure 14. Schematic of Michelson interferometer.................................................38
Figure 15. Typical attenuated total reflectance cell………………………….........40
Figure 16. The reference spectrum of air.................................................................47
Figure 17. The representative ATR-FTIR spectra of rat kidney brush-border
Plasma membranes before and after water subtraction in the region
Between 3020 –950 cm1…………………………………………………….........51
Figure 18. The representative spectra of control rat kidney brush-border plasma
membrane in the 3017-957 cm-1
region...................................................................52

xiv
Figure 19. Hierarchical clustering of all groups of kidney cell membrane using
Second derivative spectra.........................................................................................59
Figure 20 . The representative infrared spectra of control and diabetic kidney
Brush-border plasma membranes in the 3030-2800 cm-1
region ………..…..….....60
Figure 21.The comparison of Olefinic band area (3011 cm-1
) between
the control and diabetic groups………………………………………….................62
Figure 22. The comparison of CH2 asymmetric band area (2923 cm-1
)
Between the control and diabetic groups………………………………………..…62
Figure 23.The comparison of bandwidth values of the CH2 asymmetric
and CH3 symmetric bands between control and diabetic groups……….................63
Figure 24. Hierarchial clustering of control and diabetic groups of kidney
cell membrane using second derivative spectra (spectral range: 3020-950
cm-1
).........................................................................................................................64
Figure 25 .Comparison of band area ratios of the CH2 asymmetric band
to the CH3 symmetric band among the control and diabetic groups.......................65
Figure 26 .Comparison of band area ratios of the CH2 asymmetric band
to the CH3 symmetric band among the control, diabetic and selenium
treated groups .........................................................................................................66
Figure 27. Comparison of band area ratios of the sum of the CH2
asymmetric and the CH2 symmetric bands to the CH3 symmetric band
among the control and diabetic groups...................................................................66
Figure 28. Comparison of band area ratios of the sum of the CH2
asymmetric and the CH2 symmetric bands to the CH3 symmetric band
among the control, diabetic and selenium treatedgroups........................................67
Figure 29. Comparison of band area ratios of the sum of the CH2
asymmetric and the CH2 symmetric bands to the amide I band among
the control and diabetic groups..............................................................................67
Figure 30. Comparison of band area ratios of the sum of the CH2
asymmetric and the CH2 symmetric bands to the amide I band among
all groups ................................................................................................................68
Figure 31. The representative infrared spectra of the control and

xv
diabetic kidney brush-border plasma membranes in the 1750-950 cm-1
region ...............................................................................................................69
Figure 32. The representative comparison of the Control, Diabetic and
Selenium treated diabetic groups of rat kidney plasma membrane
at the C-H region ..............................................................................................73
Figure 33. The comparison of Olefinic band area (3011 cm-1
)
Between the control, diabetic and selenium treated groups..............................74
Figure 34. The comparison of CH2 asymmetric stretching band area
(2923 cm-1
) between the control, diabetic and selenium treated
groups...............................................................................................................74
Figure 35. The comparison of the CH2 symmetric stretching band
frequency between all groups..........................................................................75
Figure 36. The comparison of the CH2 symmetric stretching band
area values between all groups.......................................................................76
Figure 37.The comparison of bandwidth values of the CH2
asymmetric and CH3 symmetric bands among the control diabetic
and selenium treated groups…........................................................................76
Figure 38. Hierarchial clustering of all groups of kidney cell
membrane using second derivative spectra (spectral range:
3020-2800 cm-1
).............................................................................................80
Figure 39. The representative comparison of the infrared spectra
of the Control, Diabetic Selenium treated diabetic groups of rat
kidney plasma membrane at Finger-Print region (1740-940
cm-1
)...............................................................................................................83
Figure 40.The representative comparison of the infrared spectra
of amide I band between all groups................................................................84
Figure 41.The comparison of amide I band area between the,
diabetic andselenium treated groups...............................................................82
Figure 42.The comparison of band area values of amide II
Band among groups………………………………………….. …................85
Figure 43. Hierarchial clustering of all groups of kidney cell

xvi
membrane using second derivative spectra (spectral range:
1750-950 cm-1
)..............................................................................................87
Figure 44. The representative second derivative infrared spectrum
of amide I band of control brush-border plasma membrane at
1700-600 cm-1
region....................................................................................89
Figure 45. The comparison of second derivative of the amide I
band in the average infrared spectra of the control and diabetic
group at 1700-1
600 cm-1
region....................................................................90

xvii
LIST OF TABLES
TABLES
Table 1. FT-IR spectral band assignments of rat kidney brush-border plasma
membrane in the region of 3030-950 cm -1
...........................................................53
Table 2. Numerical summary of the detailed differences in the band frequencies
of the control, diabetic and treated groups.. ...............................................................54
Table 3. Numerical summary of the detailed differences in the band areas of
the control, diabetic and treated groups……………………………………….….... 55
Table 4. Numerical summary of the detailed differences in the bandwidth
values of control and selenium treated groups
....................................................................................................................................56
Table 5. The summary of the differences in lipid-to-protein ratios of
control, diabetic and treated groups for kidney brush-border plasma
membranes.................................................................................................................57
Table 6. The summary of the differences oin lipid-to-protein ratios of
Control, diabetic and treated groups for kidney brush-border plasma
membranes.................................................................................................................58
Table 7. Intensity changes of the main protein secondary structures between
the control,diabetic and treated groups for kidney brush-border plasma
membranes.................................................................................................................91

1
CHAPTER 1
INTRODUCTION
In this study the renal brush-border plasma membranes, the effect of streptozotocin
induced diabetes on kidney plasma membranes and possible healing effect of trace
element selenium ( antioxidant ) on diabetic kidney plasma membranes were
reported via ATR-FTIR spectroscopic techniques. In this chapter a preliminary
detailed survey including structure and function of kidneys, diabetes mellitus, the
plasma membranes, structural and functional properties of selenium in health and
disease and basis of infrared spectroscopy have been conducted.
1.1 Kidneys
1.1.1 External Anatomy of the kidneys
Anatomically kidney is a bean-shaped, reddish organ, 10-12 cm long, 5-7 cm wide, 3
cm thick and have a mass of 135-150 gr. Kidneys are located between the posterior
wall of the abdomen and the peritoneum. They are called retroperitoneal organs
because they are positioned posterior to the peritoneum of the abdominal cavity
(retro means behind). Kidneys proximal and distal sides are commonly at the levels
of the 12-th thoracic and 3-rd lumbar vertebrae, respectively. The right kidney is
typically located 1-2 cm lower than the left kidney. By the help of the surrounding
renal fascia (connective tissue) and renal fat, kidneys are held in position. The lateral
side of kidney is convex; however its media surface is concave in shape. The
resulting medial depression forms a chamber which is called the renal sinus. The
hilum is an entrance of renal sinus. Through the hilum, blood vessels, lymphatic
vessels and nerves enter and exit. The ureter also leaves the kidney through the
hilum. Kidneys are surrounded by three layers of tissue. The renal capsule is a

2
deepest layer. It constitutes, smooth, transparent sheet of dense irregular connective
tissue. The function of the renal capsule is to protect the kidney against injury and to
maintain the shape of organ. The fat tissue surrounding the renal capsule is a middle
layer, called adipose capsule. It serves to hold the kidney tightly in place within the
cavity of abdomen. The thin outer layer is composed of dense, irregular connective
tissue. This layer is called the renal fascia (Jenkins et al., 2007; Hole et al., 1993).
1.1.2 Internal Anatomy of the kidneys
There are two different regions of the kidneys. The red superficial region is called the
renal cortex and a deep, reddish-brown region is called the renal medulla. The renal
medulla is composed of conical masses of tissue called renal pyramids. The wider
end of pyramid faces the renal cortex, the narrow end (apex) points toward the renal
hilum. The tissue of the renal cortex dips into the medulla between adjacent renal
pyramids, forming renal columns. The renal pyramid, its superficial reg, one of renal
cortex and one-half of each adjacent renal column forms renal lobe. Nephrons are the
microscopic structures, located inside the renal pyramids and the renal cortex. They
are called functional units of kidney and their number is about 1 million. Urine is
formed by the nephrons and drains into large papillary ducts. These ducts drain into
cuplike units called minor and major calyces (calyx means cup). Each kidney has 8
to18 minor calyces and 2 to 3 major calyces. Urine drains from minor calyces into
major calyces and from the major calyces drains into a large cavity called the renal
pelvis. From the renal pelvis it infiltrate through the ureter to the urinary bladder.
The renal sinus is a cavity, into which the hilum expands. The renal sinus contains
the calyces, the branches of the renal bold vessels and nerves and part of the renal
pelvis. The positions of these structures are stabilized by the adipose tissue (Jenkins
et al., 2007; Hole et al., 1993).

3
Figure 1. Internal and External Anatomy of Kidneys (Hole et al., 1993).
1.1.3 Blood supply of kidney
The renal artery divides into several segmental arteries within the kidney. Branches
of these segmental arteries pass through the renal columns as the interlobar arteries.
At the bases of renal pyramids these interlobar arteries give off branches. These
branches are called arcuate arteries. Interlobar arteries also enter the renal cortex and
divides into branches called afferent arterioles. Nephrons supplied by these afferent
arterioles. Within the nephron these arteriole subdivides into a ball-shaped capillary
network called the glomerulus (little ball). These capillaries are then combining to
form an efferent arteriole that carries out the glomerular blood. The division of the
efferent arterioles forms the peritubular capillaries. In the cortex these capillaries
surround tubular part of the nephron. Capillaries extending from efferent arterioles

4
are called vasa recta. In the medulla, vasa recta supplies tubular part of the nephron.
Peritubular capillaries open to the interlobar veins, and then the blood drains from
the arcuate veins to the interlobar veins. Through the kidney vein, the venous blood
leaves the kidney, draining into the interior vena cava (Jenkins et al., 2007; Hole et
al., 1993).
Figure 2. Blood supply of Whole kidney (Hole et. al, 1993).

5
1.1.4 Nephrons
Nephrons consist of a renal corpuscle and a renal tubule. Blood plasma is filtered in
the renal corpuscle, then filtered fluid pass into the renal tubule. The renal corpuscle
has two units: glomerulus and glomerular Bowman‘s capsule. Bowman‘s capsule is
composed of the tissue surrounding the glomerular capillaries. The renal tubule has
three parts. The filtered plasma passes through these parts. They are proximal
convoluted tubule, distal convoluted tubule and loop of Henle. Convoluted means the
tubule is firmly coiled. The convoluted tubules and renal corpuscle located within the
cortex; however Henle loop located within the medulla. Proximal and Distal
convoluted tubules are connected through the Henle loop.
The first part of the Henle loop starts from the cortex and continues downward to the
medulla. In the medulla it is called the descending limb of the Henle loop. Then it
turns and returns to the cortex. This part is called ascending limb of the Henle loop.
Approximately, 80-85 % of the nephrons are located in the cortex. Remaining 15-20
% are located near the medulla and called juxtamedullary nephrons (juxta means
near). Distal convoluted tubules merge into the cortex forming a collecting duct.
These ducts then combine to form papillary ducts in the medulla. These papillary
ducts open to the minor calyx (Jenkins et al., 2007; Hole et al., 1993).
A thin layer of epithelial cells forms the wall of the glomerular capsule, renal tubule
and ducts. Nevertheless, each part has their own histological features. There are two
layers of glomerular capsule. The visceral layer composed of podocytes. Projections
of these cells form inner wall of Bowman‘s capsule. The parietal layer composed of
simple squamaous epithelium and forms an outer wall of the glomerular capsule.
Filtered plasma enters the space between these layers. Simple cuboid epithelial cells
with microvillus serve to increase surface area for reabsorption. Ascending limb of
Henle loop composed of columnar epithelium. The final part of this ascending limb
of Henle loop is rich of the columnar cells. These cells are called macula densa.
Alongside of macula densa the wall of the efferent arteriole contains modified
smooth muscle fiber called juxtaglomerular cells. Together with macula densa they

6
form the juxtamedullary apparatus. Juxtamedullary apparatus regulates the blood
pressure within the kidney. There are two different types of cells that form distal
convoluted tubules. Most of them are principal cells, which have receptors for
antidiuretic hormone and aldesterone. Small number of intercalated cells regulates
the blood homeostasis.
Figure 3. Structure of nephron (Hole et al., 1993)
Nephrons serve to regulate water and electrolyte balance of body and to remove
waste products from the organism. Urine is an end product of nephrons work,
contains excess electrolytes, water and wastes. In order to produce urine nephrons
and collecting ducts perform the following three basic steps. In the first step, fluid
moves across the capillaries of glomerulus into the glomerular capsule and then into
the renal tubule. This process is called glomerular filtration. As the fluid moves

7
through the renal tubule and collecting duct, 99% is reabsorbed by the tubule and
duct cells. Through the vasa recta and peritubular capillaries the water and solutes
return to the blood stream, in order to recycle the useful substances. This process is
called tubular reabsorption. As the fluid cross the renal tubule and the collecting duct
waste material such as drugs, excess ions are secreted into the fluid, in order to be
removed from the body. Solutes in the fluid drain into the renal pelvis and remain in
the urine until excretion (Jenkins et al., 2007; Hole et al., 1993).
Endothelial cells of glomerular capillaries and the podocytes surrounding the
capillaries form a leaky filter. This filter is called glomerular filtration membrane.
The function of filtration membrane is to catch blood cells and plasma proteins. The
size of these proteins and cells do not permit them to cross the membrane so they
remain in the blood. Furthermore, filtration membrane allows removal of water and
small solutes from the blood into the capsular space (Jenkins et al., 2007; Hole et al.,
1993).

8
Figure 4. Renal glomerulus ( Hole et al. , 1993)
9
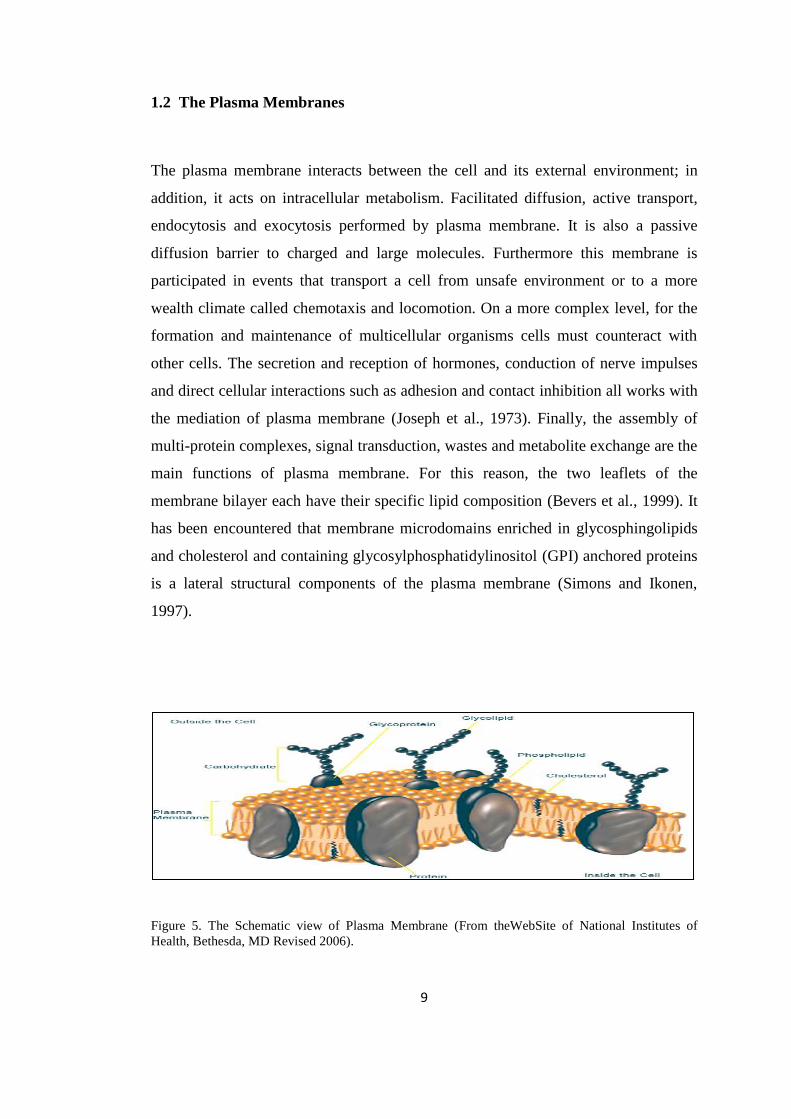
1.2 The Plasma Membranes
The plasma membrane interacts between the cell and its external environment; in
addition, it acts on intracellular metabolism. Facilitated diffusion, active transport,
endocytosis and exocytosis performed by plasma membrane. It is also a passive
diffusion barrier to charged and large molecules. Furthermore this membrane is
participated in events that transport a cell from unsafe environment or to a more
wealth climate called chemotaxis and locomotion. On a more complex level, for the
formation and maintenance of multicellular organisms cells must counteract with
other cells. The secretion and reception of hormones, conduction of nerve impulses
and direct cellular interactions such as adhesion and contact inhibition all works with
the mediation of plasma membrane (Joseph et al., 1973). Finally, the assembly of
multi-protein complexes, signal transduction, wastes and metabolite exchange are the
main functions of plasma membrane. For this reason, the two leaflets of the
membrane bilayer each have their specific lipid composition (Bevers et al., 1999). It
has been encountered that membrane microdomains enriched in glycosphingolipids
and cholesterol and containing glycosylphosphatidylinositol (GPI) anchored proteins
is a lateral structural components of the plasma membrane (Simons and Ikonen,
1997).
Figure 5. The Schematic view of Plasma Membrane (From theWebSite of National Institutes of
Health, Bethesda, MD Revised 2006).

10
1.2.1 The Plasma Membranes of Kidney
Proximal tubule cells, a specialized and relatively homogeneous type of renal
epithelial cell found in the first part of the nephron in the kidney. It is the most
abundant cell type existed in the renal cortex and reabsorbs the small molecules
filtered at the glomerulus. Transcellular transport in renal tubules involves the
movements of solutes between three compartments: luminal, intracellular and
peritubular. They are separated by two barriers: the apical (luminal, brush border)
and the basolateral (contra luminal, per tubular, serosal) plasma membranes (Murer
et al., 1986). Like all epithelial cells, proximal cells are polarized, such that their
apical (brush-bordered) and basolateral membranes are separated by tight junctions
and have different structures and corresponding transport functions (Martin et al.,
2000).
The functional polarity of the cell is required for vectorial transport of solutes so the
transport properties of the apical and the basolateral membrane must be different.
Morphology, enzyme content, protein, lipid, and carbohydrate composition hormone
receptors and transport properties of these two membranes are distinct in almost
every respect and these distinctions are used in the procedures for membrane
separation.
Differences in enzyme activities provide the criteria for identification of the
separated membranes. In addition, differences in lipid to protein ratios and
carbohydrate contents result in distinct physical properties of the two membranes.
The physical properties such as density and surface charge, license for their
separation by density gradient centrifugation, phase partitioning, differential
precipitation and electrophoresis (Heine Murer and Piotr Gmaj, 1986; Aronson,
1981; Kinne et al., 1980).

11
1.2.2 The Brush-Border Plasma Membrane
The Brush-Border Plasma Membrane means the part of plasma membrane that close
to lumen of the kidneys. So this part of plasma membrane plays an important role in
the filtering and reabsorption processes in the kidney. The apical membrane has a
brush border, which increases the surface area available for reabsorption of the
glomerular filtrate. Channel and transport proteins located at the apical membrane
(brush border membrane, BBM), performs reabsorbtion of solutes present in this
filtrate (tubular fluid). Many of these transport proteins are coupled indirectly to the
gradient for Na+ due to the low intracellular Na+ concentration maintained by the
‗sodium pump‘(Na+, K+ -ATPase) located in basolateral membrane (BLM). The
other transport proteins are also expressed at the BLM that transfer solutes from
inside the cell to the interstitial space and peritubular capillary blood (Martin et al.,
2000).
1.3 Diabetes Mellitus
Diabetes Mellitus is a disease of metabolism affecting the great amount of world‘s
population, accompanied with long-term hyperglycemic condition, in which fat,
protein and carbohydrate metabolism is severely affected by deficient insulin
secretion or function. General signs of diabetes are loss of weight, frequent thirst,
polyuria, polyphagia and impairment of eyes. Ketoasetosis also may develop as a
result of accummulation of ketone bodies in severe forms of disease leading to
glycemic come and even to death. Chronic diabetes open way to the complications of
illness by damaging perivascular and cardiovascular system. These include,
retinopathy, nephropathy, neuropathy and cardivascular disorders (Albert and
Zimmet, 1998).

12
There are two general forms of Diabetes. First one, is insulin dependent diabetes
mellitus (IDDM) called Type I, results from autoimmune degradation of ß cells of
pancrease producing insulin. Second one, is non-insulin dependent DM (NIDDM)
called Type II. In this form insulin concentration in blood almost cannot be detected
or detected in very low amounts. In Type 2 insulin secretion or function is affected
by loss of cell responces to insulin secretion ( Stapleton et al. , 2000 ).
1.3.1 Type 1 Diabetes Mellitus (IDDM)
In Type I DM immune system cells attack to the pancreatic ß cells producing insulin,
because the body recognizes islet cells as antigens (Bardsley et al. , 2004). CD+4,
CD+8 T cells, B cells, macrophages and cytokines accumulate in the area of lesion
but they are not destructive ( Pietropaolo et al. , 2007; Lee et al., 1988; Kawasaki et
al., 1999; Pearl-Yafe et al., 2007). The processes how autoantibodies are synthesized
against islet cells are well studied but the onset of trigger is still unknown. About 90
% of islet cells should be destroyed in order to see clinical picture of the diabetes
(Kawasaki et al., 1999). During the pathogenesis of Type I diabetes many
autoimmune processes involved. Concentration of autoantigens and autoantibodies
increases as a disease progresses. Insulin, islet-cell antigen-2 and glutamic acid
decarboxylase (GAD) are well investigated autoantigens triggering immune response
(Atkinson et al., 2001). Studies showed that insulin is a first autoantigen found in the
early diabetes, later as a disease progresses other antigens also exist in the laceration
area (Hutton et al., 2007).
Only two chromosomal regions are found to be related to autoimmune diabetes. They
are human leukocyte antigen (HLA) region on chromosome 6p21 and the insulin
gene region on chromosome 11p15 (Nepom et al., 1995). Genetic factors seem to be
more important to cause islet autoimmunity than environmental factors (Redondo et
al., 2004). Environmental factors also play a role as a possible trigger of autoimmune
diabetes (Akerblom et al., 1998). Viruses are the most potent environmental triggers
for Type I diabetes, because of their capability to produce severe immune response
when entered to the body.
13
Potential viral triggers are adenoviruses, coxsachkie B virus, enteroviruses,
retroviruses, cytomegaloviruses and etc (Yoon et al. , 1991 ; Varela-Calvino et al. ,
2003; Green et al. , 2004 ; Barbu et al. , 2005 ; Chen et al. , 2005; Jun et al. , 2002 ).
Viruses can change host cell environment in such a way that, immune cells recognize
them as a potent antigens and destruct them. Furthermore, viruses produce proteins
similar to host proteins. Consequently, the host cell proteins can be encountered as
viral proteins by antibodies (Akerbhlom et al., 1998; Jun et al., 2002).
1.3.2 Type 2 Diabetes Mellitus (NIDDM)
Most common form of diabetes mellitus is Type II. It is a multifactorial metabolic
illness characterized by the elevation of blood glucose concentrations. There is an
interaction between defects of insulin secretion and peripheral insulin resistance. Due
to this interaction insulin deficiency and impairment of glucose tolerance occurs.
Typically type II diabetes patients have high insulin levels which do not completely
compensate for insulin resistance. Later, gradually developing ß cell dysfunction
causes disruption of this compensation that leads to deficiency of insulin secretion
(Stern et al., 2000). Underlying causes of ß cell dysfunction and insulin resistance
can be genetic predisposition, obesity, chemical exposure, physical inactivity and etc.

14
Fig 6. Abnormalities in type 2 diabetes that contribute to hyperglycemia (Lancet et al., 2005)
When insulin cannot bind to its receptors located on liver and muscle tissues insulin
resistance may develop. Furthermore, impairments of post receptor coupling pathway
can lead to IR, respectively. As a result, glucose is overproduced by the cells at the
same time; inhibition of glucose clearance occurs (Kelley et al., 1996; Cline et al.,
1999).
Impairments of insulin receptor signaling pathway can cause IR. Normally,
phosphorylation of insulin receptor substrate proteins is activated by insulin receptor.
These proteins interact with phosphatidylinasitol kinase which causes activation of
Akt-2/ PKBb pathway. Akt-2/ PKBb plays a crucial role in the insulin initiated
transportation of the glucose transporter 4 (GLUT 4) through cell membrane in order
to eliminate high levels of glucose from blood (Younger et al., 2007). Impairment of
any step of insulin signal transduction leads to IR (Surampudi et al., 2009). Among
the causes inducing IR, inflammation is an important one. TNF-α is a main cytokine
secreted during inflammatory processes. Adipocyte lipolysis is intensified by TNF-α,
which causes increase of the concentration of nonesterified FFAs. These FFAs can
cause IR by exerting negative effects on insulin signaling pathway (Schulman et al.,

15
1999; Bergman et al., 2000). In skeletal muscle, elevated levels of free fatty acids
can affect insulin signaling pathway which leads to IR (Guillermo et al., 2008).
When blood glucose concentration increases GLUT 2 transporters enter the ß cells of
pancreas and elevate the ATP/ ADP ratio. Increase of ATP/ ADP ratio causes
depolarization of cell membrane, Ca ion influx increases and insulin secretes from
insulin granules. In Type II DM the secretion of insulin is disrupted as a result of ß
cell dysfunction. ß cell mass can be reduced (20% - 50%) in long-term type II DM.
This reduction is caused by apoptosis of ß cells (Porte et. al, 2001). The loss of ß
cells can be hereditary either acquired. High amounts of FFAs and glucose badly
affects ß cell function through various pathways such as, defects of metabolic
mechanisms, generation of reactive oxygen species (ROS), elevation of intracellular
Ca levels and interaction with membrane potassium channels ( Surampudi et al. ,
2009 ) .
1.3.3 Complications of Diabetes Mellitus
Chronic diabetes often damages the renal glomerulus, the retina and peripheral
nerves. All these microvascular diseases are associated with chronic hyperglycemic
state. Atherosclerosis also may develop as s consequence of diabetes, which leads to
microvascular heart problems (Lancet et al., 1998). Similar pathological mechanisms
are observed in all diabetic complications. In the early diabetes, vascular
permeability and increased blood flow are observed, caused by hyperglycemia.
Increased amount of extracellular matrix components result irreversible increased
vascular permeability. Over time, microvascular cell loss and capillary occlusion
occurs.
These abnormalities cause ischemia, edema and hypoxia induced neurovasculization
in the retina. Glomerulosclerosis, proteinuria and meshangial matrix expansion in the

16
kidney and multiple degenerative lesions in axonal peripheral nerves happen
(Brownlee M., 2001).
There are four main mechanisms explaining the molecular pathogenesis of diabetic
complications. These mechanisms are increased polyol pathway flux, increased
hexosamine pathway, increased formation of advanced glycation end products
(AGEs) and activation of protein kinase C (PKC) pathway. Particularly, increased
ROS production as a consequence of diabetes alters the enzymes and molecules of
above mentioned pathways opening way to new diseases besides diabetes. These
disorders are called diabetic complications.
The main enzyme of the polyol pathway is an aldose reductase which inactivates
alcohols by decreasing the amount of toxic aldehydes. Aldose reductase reduces
glucose to sorbitol during hyperglycemic state. Sorbitol oxidized to fructose by using
cofactor NADPH. NADPH is an essential cofactor regenerating reduced glutathione.
Glutathione is an essential intracellular antioxidant. The polyol pathway rise
susceptibility to intracellular oxidative damage by decreasing the concentration of
reduced glutathione (Lee et al., 1999; Brownlee M., 2005).
Hexosamine pathway also induces diabetic complications. During normal conditions
glucose is converted into glucose-6 phosphate and later to fructose-6 phosphate.
When hyperglycemia develops, enzyme glutamine fructose-6-phosphate
amidotransferase metabolizes F6P into glucosamine-6 phosphate and later to uridine
diphosphate N-acetyl glucosamine (Brownlee M., 2005). Serine and threonine
residues of transcription factors interact with N-acetyl glucosamine and this reaction
leads to pathological disturbances in expression of genes (Wells L. et al., 2003).
Increased gene expression include, increase of plasminogen activator inhibitor-1
and
transforming growth factor-β1 (Du et al., 2000).
Diacylglycerol is an important cofactor activating PKC-α, PKC-β and PKC-δ.
During hyperglycemia elevation of diacylglycerol occurs (Facchini et. al, 2000;
Mueller CF et al., 2005). In diabetes induced microvascular diseases, such as

17
ischemia and neovascularization, PKC-β isoform is especially activated (Idris et al.,
2006).
Activation of PKC causes changes in gene expression such as inhibition of
antiatheroschlerotic factors (eNOS inhibition) and activation of proatherogenic
factors (endothelin-1
, TGF-β) (Idris et al., 2006; Wagner et al., 2007). In addition
PKC activates NF-kβ in endothelial cells (Pieper et al., 1997).
The enzymatic interaction of glucose with extracellular proteins causes the formation
of advanced glycation end products (AGEs). When hyperglycemia occurs, the rate of
AGEs formation also increases (Degenhardt et al., 1998). During diabetic
complications AGEs damage the cells by three mechanisms. First, AGEs cause
conformational changes in extracellular protein structure thus altering their
functional capabilities. Second, modified plasma proteins react with AGE receptors
on endothelial cells and macrophages and as a result, reactive oxygen species (ROS)
are generated. AGE receptor binding also activates NF-kβ transforming factor which
leads to altered gene expression. Third, extracellular matrix proteins modified by
AGEs abnormally binds to receptors of matrix components (integrins) on cells and to
matrix components themselves (Brownlee M., 2001).

18
Figure 7.Illustration of the pathways leading to diabetic complications. (Brownlee M., 2001).

19
1.3.4 Oxidative Stress and Diabetes
Accumulation of oxidants (ROS) causes oxidative stress in many diseases,
particularly in diabetes. Disturbances of cellular homeostasis and alterations of
vascular function are the resulted damages of ROS. Oxygenated free radicals block
the synthesis and action of nitric oxide and activate the NF-kβ. Furthermore the
strong interaction takes place between AGEs and ROS, since AGEs are involved in
complications of diabetes and also they can produce free radicals by themselves. In
the pathogenesis of diabetic nephropathy ROS and AGEs are especially involved
(Bonne font et al., 2000).
The elevation and accumulation of ROS leads to the activation of NF-kβ and PARP.
NF-kβ is a transforming factor that activates proinflammatory and proadhesive
pathways. Activation of this factor causes synthesis of substances such as cytokines,
prothrombotic and vasoconstrictive gene products, AGE and their receptors (RAGE)
(Barnes et al., 1997; Li et al., 1997). Furthermore, apoptotic genes such as Bcl-2and
BCL-XL also activated through NF-kβ synthesis (Li et al., 1997). In addition, ROS
damages the cell by activating polyadenyl ribose polymerase. PARP accelerates
breakdown of reduced NADH and ATP depletion. In general, inhibition of glycolysis
occurs through activation of PARP. As a result C3 and C6 intermediates of glucose
metabolism accumulate causing diacylglycerol formation and subsequently PKC
pathway is activated (Soriano et al., 2001). Finally, C6 intermediates promote polyol
and hexosamine pathways which lead to diabetic complications (Wells et al., 2003;
Du et al., 2000). To conclude, the ROS accumulation activates the complex
interaction of molecular pathways involved in diabetes and its complications.

20
1.3.5 Experimental Models of Diabetes Mellitus
Investigation of pathogenetic mechanisms, diagnosis and treatment strategies of
various diseases require experimental animal models. There are some advantages of
using experimental models:
a) Researcher can control experimental alterations in model study more easily,
b) Researcher can produce designed number of animal models to obtain significant
statistical results,
c) Other undesired factors that may affect the result of a study can be removed out in
experimental models in order to see the results of specific factor.
In order to investigate molecular basis of diabetes experimental models are widely
used. The experimental models also allow studying effect of environmental factors
on diabetes. These factors include drugs, toxins, viruses, physical activity, diet and
etc. Nowadays there are so many experimental models of diabetes, however none of
them completely correspondence to human diabetes (Irer and Alper G., 2003).
The experimental models of diabetes include chemical diabetes (streptozotocin and
alloxan), surgical diabetes, diet (high fatty and high carbohydrate diet), hormones
and etc.
Surgical diabetes.Removal of 90% of pancreatic tissue is needed to see stable
increase of glycemia. This process is called pancreaectomy. Technically, very
difficult and is rarely used in our days (Pickup et al., 2002). When exposed to
electrical shock in the ventromedial and paraventricular regions of the hypothalamus,
lesions are formed. These lesions cause hyperphagia, hyperinsulinemia and obesity
in animal models (Pickup et al., 2002).
Viral diabetes.The most investigated diabetes related virus is M variant of
encephalomyocarditis virus which belongs to picarnoviruses family. Its injection to
rats causes insulinitis, hyperglycemia, glucose intolerance, ketoacidosis and death.
Another most studied virus is Kilham rat virus (KRV). It causes autoimmune

21
diabetes in rats. Other diabetes related viruses are rubella, reovirus, coxsachie B,
cytomegalovirus (CMV) and Venezuelan guinea encephalitis viruses (Pickup et al.,
2002; Jun et al., 2001).
Chemical diabetes.Chemically induced diabetic models include streptozotocin and
alloxan induced experimental diabetes. Alloxan is an antienoplastic agent and
metabolite of uric acid. Alloxan inhibits the glucose induced insulin secretion and at
high doses, induces necrosis of β cells. Another mechanism of action of alloxan is
inhibition of mitochondrial transport chain system which leads to elevation of
intracellular pH levels and cell death (Bell et al., 1983). Pathological changes in
chemically induced diabetic nephropathy are very similar to pathological changes of
human diabetic kidney disease (Brown DM., 1982).
1.3.5.1 Streptozotocin Induced Diabetes
Streptozotocin is a chemical with diabetogenic, carcinogenic and antibiotoical
properties. It is a large-spectrum antibiotic which is the metabolite of streptomyces
griseus. STZ is very toxic to β cells of pancreas. The mechanism of action is through
the binding to glucoreceptors of cell membrane. While it has glucose molecule in its
structure, the glucose receptors on cell membrane accept STZ as glucose molecule
and finally blocking of insulin secretion occurs. Furthermore, it affects the nuclear
DNA. Inside the cell STZ decomposes and reactive carbonium ions forms causing
alkylation of DNA bases. In addition, STZ has oxidant properties. It decreases
superoxide dismutase levels in red blood cells and glutathione concentrations in β
cells (Bell et al., 1983; Szkudelski et al., 2001; Crouch et al., 1978; Irer SV and
Alper G, 2004).
STZ has negative effect not only to pancreas but also to liver and kidneys. In order to
produce diabetes STZ should be injected IV or IP in 50-1
00 mg / kg single dose or
during 5-6 days with small doses (5 mg / kg). Blood clearance is about 15 minute
(Schein et al., 1973; Rossini et al., 1976; Irer and Alper G, 2004).

22
The effect of STZ on diabetes is dose-dependent. In mild diabetes 35 mg / kg dose
leads to acute ketoacidosis, while 100 mg /kg dose leads to death in 2-3 days.
Moderate doses (55-65 mg /kg) causes elevation of blood glucose levels 3-4 fold and
weight losses (Tomlinson et al., 1992).
1.3.6 Diabetic Kidney disease
Kidneys are damaged extensively due to hyperglycemic state. The disease of a
kidney caused by diabetes is called diabetic nephropathy. In diabetic nephropathy, a
structural alteration in kidney tissue is observed. These alterations are commonly
podocyte loss, thickening of glomerular basement membrane, dysfunction of a
glomerular endothelium and deposition of extracellular matrix components in the
mesangial area (Wolf et al., 2005). In the development of diabetic nephropathy
genetic and environmental factors play an important role. Factors such as
hyperlipidemia, proteinuria and hyperglycemia can cause renal damage during
diabetes. In addition, this condition is supported by genetic predispositions to
diabetes, as the diabetic nephropathy frequently seen in some ethnicities and siblings
(DCCT group, 1995).
Epidemiological studies showed that control of a metabolism of diabetes and diabetic
nephropathy does not differ, predicting involvement of a genetic susceptibility to
diabetes (Klein et. al, 1984). The results of familial cluster studies revealed that there
is a four times more risk of developing diabetic nephropathy in relatives of diabetic
and diabetic nephropathy patients (Seaquist et al., 1989). As several races are more
susceptible to diabetic nephropathy than others, one can propose an importance of
ethnic background of diabetic nephropathy. Studies revealed that the rate of
progression of end-stage renal disease in siblings of type II black diabetic patients is
5 times more than white ones (Freidman et al., 1993). In Pime Indians, high
prevalence of diabetic nephropathy in type II diabetic families is observed. The

23
variations between races may be provoked by clustering of different loci of genes,
leading to genetic predisposition to the diabetic nephropathy (Schena et al., 2005).
Pathogenesis.During the early stage of diabetes (1-2 years), extracellular matrix
protein synthesis and damage of protein degradation develops. It results in increase
of collagen IV leading to glomerular basement membrane thickening (Wolf et al.,
2007). Elevation of Collagen IV level causes pores in the structure of GBM that
permits protein loss from this barrier (Isogai et al., 1999). In the late period of
diabetic nephropathy decrease of negatively charged proteoglycans within the GBM
occurs, leading to protein leakage (Adler et al., 1994). Proteoglycans are synthesized
in all glomerular cells but major fractions are produced in podocytes (Wolf et al.,
2005).
The major proteoglycans within the GBM are agrin and perlecan. When
hyperglycemia develops agrin production is modified. In addition, angiotensin II also
has contributions to modification of agrin synthesis (Yard et al., 2001; Brinkkoetter
et al., 2004).
The hallmark of diabetic kidney disease is a proteinuria caused by density decrease
of podocytes (Pagtalunan et al., 1997). In normal conditions, podocytes are attached
firmly to the GBM by the foot processes and the gap between these feet processes are
occupied by a porous membrane. This membrane filters is permeable to water and
small solutes but highly impermeable to proteins (Tsilibary et al., 2003; Kreitzer et
al., 2002). Transmembrane protein nephrin is a major component of porous
membrane. It is bounded to filaments of podocytes. Decrease in number of nephrins
cause damage to glomerulus. Furthermore, nephrin plays a role in podocyte
integrity, so nephrin reduction causes podocytopenia (Saleem et al., 2002; Doublier
et al., 2003; Patari et al., 2003).
Glomeruloschlerosis may develop as a result of apoptosis of podocytes by formation
of synechiae (attachment of tissues to each other) among the erosed GBM and
Bowman‘s capsule (Pavenstadf et al., 2003). Podocyte loss is probably caused by
Ang II, the effect of which is mediated by TGF-β (Ding et al., 2002). Elevation of

24
ROS levels, increase the angiotensinogen suppression and subsequently podocyte
apoptosis happens (Kojima et al., 2000). Some growth factors and cytokines also
play a crucial role in the development of diabetic kidney disease. Vascular
endothelial growth factor (VEGF) stimulates NOS and increased GBM permeability
to proteins develops (Schrijvers et al., 2004). Especially during diabetes VEGF
originates from podocytes (Cooper et al., 1999; Wendt et al., 2003). In addition,
VEGF synthesis is upregulated by AGEs. TGF-β and VEGF increase is observed
during excessive expression of AGE receptors (RAGE) in podocytes (Wendt et al.,
2003). Also during diabetes, increased production of α3 chains of collagen IV is
observed due to VEGF stimulation of podocytes. Stimulation of podocytes by VEGF
causes GBM thickening (Chen et al., 2004).
Cytokine that is expressed excessively in kidneys during diabetes is TGF-β1. It
causes mesangial expansion, fibrosis, proteinuria and renal insufficiency during
diabetic nephropathy (Kern et al., 1996). In the formation of new blood vessels
angiopoetins are participated. Ang-I promotes the formation of non-leaky vessels
(Suri et al., 1996). It is antagonized by Ang-II and Ang-II together with VEGF
stimulates angiogenesis. Upregulation of Ang-II in diabetic nephropathy may cause
increase of angiogenesis, formation of immature vessels and increase of protein
leakage (Hammes et al., 2004; Ichinose et al., 2007).

25
Figure 8. From hyperglycemia to diabetic nephropathy (Kanwar et al., 2005)
1.4 Selenium
Selenium is an essential metalloid trace element for mammalians because it is a
component of two main body enzymes, glutathione peroxides and iodothyroine 5 ‘-
de-iodinase (Arthur et. al., 1993). Selenium positioned among sulphur and tellurium

26
in group VI A and between arsenic and bromine in period IV of the periodic table.
Atomic weight is 79 (Tinggi, 2003). Atomic weight, bond energies and electron
energy changes are very similar to sulphur, however selenium happens as reduced
quadrivalent form. Selenium may exist in different oxidative shapes which allow it
to exist in several organic selenium compounds and in amino acids content (Tinggi,
2002). Selenium is a component of enzyme, glutathione peroxides, characterized as
a tetramer protein with 4 atoms of selenium per molecule (Rotruck et al., 1973).
Glutathione peroxides provide intracellular defense mechanisms against oxidative
stress (Ursini and Bindoli, 1987). In addition, Se is a component of enzyme
iodothyronine deiodonase which protects from abnormal hormone metabolism
(Foster and Sumar, 1997; Arthur et al., 1993). In fishes, high selenium levels
provides against Hg toxicity (Curvinaralar and Furness, 1991).
1.4.1 Selenium Deficiency and Toxicity
Experimentally, selenium deficiency are developed in group of people receiving
parenteral nutrition without selenium for long period ( Brown et al., 1986 ; Kien et
al., 1983 ; Lockitch et al., 1990 ; Van Rij et al., 1979) . Recommended selenium
supplementation doses for adults are 20-60 microgram per day (Levander et al.,
2003). Excretion path is through the kidneys, therefore low doses should be given if
person have already developed renal disorders (Greene et al., 1988).
Keshan disease was developed in the mountain regions of the China. In these
regions, cultivated soya was lacking proper amounts of selenium leading to selenium
deficiency related Keshan disease. Keshan disease is characterized as cardiovascular
myopathy (Yang et al., 1987). In addition, coxsackieviruses play an important role as
a potential cofactor in the etiology of the selenium responsive cardiomyopathy
(Beck. et al., 1994).
It is possible that, avirulent coxsakievirus B3 viral genome acquires virulence during
selenium deficiency (Beck et al., 1995). In the regions where soil selenium

27
concentrations are low (Allander et al., 1994) Keshan-Beck disease development was
reported. Signs of this disease include, joint swelling, short stature, pain, general
malaise and arthritis (WHO, 1990). Hyperthyroidism and selenium deficiency have
associated with the acuteness of myxoedemetous cretinism in the iodine-deficient
region of central Africa. Selenium deficiency appears to protect against iodine
deficiency (Vanderpas et al., 1990; Contempre et al., 1991). In the second generation
of selenium deficient diet rats, the development of growth retardation was reported
(Hurt et al., 1971; Ewan et al., 1976; Thompson et al., 1995).
The most widespread Selenium toxicity was occurred in between 1961 and 1964 in
China. In this country, corn and vegetables grown in soil that contained high amounts
of selenium was eaten by people and developed classical symptoms of Se toxicity
such as, red, blistered skin, discolored nail and hair, hairiness and dysfunction of
nervous system (Yang et al., 1983). Severe intoxication of Selenium affects mainly
the nervous system causing peripheral anesthesia, paralysis, convulsions, ataxia and
depression. Other signs of Selenium intoxication are anorexia, diarrhea, fatigue,
pulmonary edema, liver and kidney necrosis, blindness and respiratory distress (Fan
AM. et al., 1990; Helzlsouer et al., 1985).
Recently, the effect of dietary selenium on the biochemical properties of rat bone
was reported using FTIR and X-ray diffraction analysis. Biomechanical data was
supported the results of above mentioned techniques. Selenium and vitamin E
deficient and excess selenium and vitamin E diet lead to decreased crystalline and
mineral content diminish in the tibiae and femora of the rats. The authors suggest that
the bones affected seriously from intoxication and deficiency syndromes. The
underlying mechanism of action has not been clarified (B. Turan et al., 2000).
Despite the fact that human environmental poisoning with Selenium is rare there are
a numerous accidents in which acute and sub acute Selenium intoxication happened.
Until now, molecular mechanism of Se toxicity is not completely studied. However,
interaction of glutathione with Selenium forms selenotrisulphides.

28
The selenotrisulphides produces toxic super oxides and hydrogen peroxide that may
lead to Selenium poisoning (Spallahlz, 1994). Usage of Selenium as dietary
supplement should be approached carefully because no complete knowledge exists
about its exact effect. Furthermore, there are other factors influencing Selenium
toxicity such as age, physiological state, mutation, route of administration and etc.
1.4.2 Selenoproteins
Proteins containing selecysteine in their structure are called selenoproteins. Until
now 11 total selenoproteins are identified (Stadtman, 1996; Takahashi et al., 1987).
Glutathione peroxides. There are four distinct types of glutathione peroxides,
catalyzing the reduction of peroxides which damage the cells. Selenium as a
component of this enzyme is considered as antioxidant. Selenium prevents ROS
formation that leads to severe diseases, by damaging DNA, proteins, lipids and
carbohydrates (Holben et al., 1999).
Cellular glutathione peroxides found in all cells and reduces hydrogen peroxide and
free organic hydro peroxides to water and alcohol (Hoekstra WG, 1975). This
enzyme is depository for selenium and activity is decreased with Se deficiency (Rea
HM et al., 1978).
Plasma glutathione peroxides found in human milk and plasma produces in the
proximal tubule cells of the kidney (Bhattachorya et al., 1988; Avissar et al., 1994).
Phospholipids hydro peroxide glutathione peroxides reduces esterified fatty acid
hydro peroxides (Ursini et al., 1985). In membranes and in low density lipoproteins
(LDL) it reduces cholesterol hydro peroxides and cholesterol esters. It functions to
prevent the organism against lipid peroxidation (Thomas et al., 1990; Ursine et al.,
1987; Ursini and Bindoli, 1987). Prevention of LDL oxidation is important because
oxidized LDL can be taken by macrophages and endothelial cells in the arterial walls
initiating atherosclerosis (Holovet and Collen, 1994). Gastrointestinal glutathione

29
peroxides plays an important role in preventing organism from toxicity of ingested
lipid hydro peroxides.
Selenoprotein P. Hypothetically it has role in transport and oxidant protection but
the exact function in body are not studied yet. Glutathione peroxides and
selenoprotein P are the only known plasma selenoproteins (Burk and Hill, 1994;
Burk and Hill, 1991). Studies demonstrated that liver necrosis and lipid per
oxidation were inhibited with increase of selenoprotein P levels in Se-deficient rats
that were administered Se (Burk and Hilli, 1991; Burk et al., 1995). In addition,
delivery of Selenium to the testes in Se-deficient rats with the help of selenoprotein P
was observed (Wilson and Tappel, 1993).
Thyroid hormone deiodinases function in the formation and regulation of active
thyroid hormone triiodothyronine (T3). It catalyses the deiodination of thyroxin(T4)
to T3. Types 1, 2 and 3 of this enzyme contain selenium. Consequently, selenium is
found to be participated in growth and metabolism. It was reported that during Se
deficiency 15-20% decrease in T3 and T4 levels happens (Larsen and Berry, 1995;
Arthur et al., 1993).
Selenoprotein W associated with white muscle disease which is a metabolic disorder
characterized by calcified skeletal muscle tissue. Selenium supplementation
alleviates the disease state (Vendeland et al., 1993; Schubert et al., 1961).
1.4.3 The effect of Selenium on Glucose metabolism and Diabetes
Several chronic diseases are related to diminished selenium levels in body. These
diseases include cancer, cirrhosis, heart diseases, renal diseases and diabetes.
Changes of homeostasis of Selenium have been associated to diabetes and its
complications (Simonoff, 1991). The serum and red blood cell concentrations of
selenium as well as enzyme activities are decreased during diabetes. These enzymes
include, superoxide dismutase‘s (SOD) and glutathione peroxides. Controversies

30
exist in literature about plasma selenium concentrations of diabetic patients. Some
studies revealed Selenium decreases in diabetic patients while others observed no
change in Se levels versus controls ( Simonoff, 1991 ; Schlienger et al. , 1988 ;
Tawardowska-Saucha et al. ,1994 ; Navarro-Alarcon et al. , 1999 ; Klapec et al.
,1998 ; Wang et al. , 1995 ; Armstrong et al. , 1996 ) . Some researchers even found
significant increases in serum selenium levels in diabetic persons (Gebre-Medhin et
al., 1984; Cser et al., 1993).
Studies revealed that selenate stimulates glucose transport activity in a dose-
dependent manner in isolated rat adiposities. Increased glucose transport activity was
due to translocation of glucose transporters (GLUT1 and GLUT2) to the membrane
surface (Ezaki et al., 1990). Furthermore selenite acts as insulin-mimetic in whole
animal diabetic models. Insulin-mimetic effect of Selenium causes decrease of blood
glucose level. In addition, Se stimulates glycolysis, fatty acid synthesis and glucagon
production. The increase of ability of these pathways blocks the glucose increase via
the increased expression of key enzymes of these pathways. These enzymes are
glycogen syntheses‘, glucokinase, phospho-enolpyrivatecarboxykinase (PEPCK),
fatty acid syntheses‘ (FAS) and glucose-6-phosphate dehydrogenase. In addition,
Selenite activates insulin signaling pathway which controls important key enzymes
metabolism and expression (Stapleton, 2000).
The effect of Selenium on diabetic complications was observed through many
studies. Selenate administration to diabetic rats normalized heart functions compared
to control group (Bartell et al., 1998). Selenium diminishes the diabetic platelet
hyperactivity involved in thrombosis. Thrombosis is one of the most important
factors leading to diabetic cardiovascular disorders (Douillet et al., 1996).
In the diabetic rats the modified antioxidant enzymes activities were recovered as a
result of sodium selenite administration. Contraction-relaxation functions of thoracic
aorta were altered by an oxidant shift of cellular thiolic reserves. The study suggests
that, selenium restores the modified contraction-relaxation activities of thoracic aorta
through acting on glutathione redox cycle during diabetic state. So, selenium

31
administration diminishes the oxidative stress in diabetes. As a conclusion, they
propose that the small doses of selenium may be useful as an adjunctive therapy in
the treatment of human diabetes (Turan et al., 2007).
Selenium or Selenomethionine supplementations increased Se concentrations in
plasma and in kidneys further improving glycemic state, increased arachidonic acid
levels in diabetic kidneys, normalized renal hyper filtration and diabetic renal
lesions. The beneficial effect of selenium on renal lesions could be explained as
insulin-like effect of selenium. The authors of study suggest that selenium
supplementation should be used as additive therapy to delay diabetic nephropathy
(Douillet et al., 1999; Stachouse et al., 1990).
Recently it was demonstrated that Selenium deficiency induces albuminuria,
glomerular sclerosis and hyperglycemia in normal and diabetic rats. Furthermore, the
lumen size of interlobular artery was decreased as a result of Se-deficient diet.
Researchers suggest that selenium deficient diet may induce renal oxidative stress
and damage via the action of TGF-β1 in normal and diabetic rats (Reddi et al., 2001).
In addition, it was reported that selenium deficient diet induces proteinuria and
glucosuria with renal calcifications of kidney in rats. The mechanism by which
selenium deficient diet causes renal calcifications is not known, however, the
calcification may be induced by lipid peroxidation damaging proximal tubular cells.
These findings suggest that proximal tubule cells are most vulnerable targets of
oxidative stress or selenium deficiency may influence other factors, such as renal
hemodynamic. Study also revealed that selenium deficiency is the primary factor
affecting glutathione peroxides activity since glutathione peroxides activity markedly
decreased during 2 weeks of selenium deficient diet (Mikija Fujieda et al., 2006).
Selenium also improves lipid levels in rats. It was reported that, liver lipid levels
especially triglycerides was decreased in diabetic rats without supplements compared
to controls. However selenium supplements normalized liver triglyceride levels. In
situ selenium supplements modulated fatty acid composition in kidney, heart and
aorta maintaining normal tissue functions (Douillet et al., 1998).

32
Recently the alterations of the rat heart tissues caused by selenium treatment were
reported. The study revealed that selenium caused increase of both saturated and
unsaturated lipid content in rat heart tissues. In addition the protein profile was
changed with decreased α-helix and increased ß-sheet structure in the rat heart and
vein tissues using FTIR micro spectroscopy. The authors suggest that the dose of
selenium used in this study (5 μmol / kg) might be slight subtoxic for healthy rat
heart, which has known as non-toxic dose (N. Toyran et al., 2007). Another study of
same authors demonstrated that the lipid, glycogen and glycolipid contents were
increased during early diabetes in rats. Also an altered protein profile with a decrease
in α-helix and an increase in β-sheet structure in all the diabetic groups was
demonstrated ( N. Toyran et al. , 2006 ) .
1.5 Fundamentals of Spectroscopy
According to Maxwell‘s theory, radiation is considered as two perpendicular electric
and magnetic fields oscillating in single planes at right angles to each other. The
magnitudes of the electric and magnetic vectors are represented by E and B
respectively as shown in figure 8 (Stuart, 2004).
Figure 9. An electromagnetic wave

33
When a wave encounters a molecule it can be scattered (direction of propagation
changes) or absorbed (its energy is transferred to the molecule). When
electromagnetic energy of the light is absorbed the molecule is said to be excited.
An excited molecule can possess any one of a set of discrete amounts of energy.
These amounts are called the energy levels of the molecule. The major energy levels
are determined by the possible spatial distributions of the electrons and are called
electronic energy levels. Usually, electronic energy levels are shown by an energy-
level diagram in figure 9. The lowest energy level is called the ground state and all
others are excited states.
Figure 10.Typical energy-level diagrams showing the ground state and the first excited state.
Vibration levels are shown as thin horizontal lines. A possible electronic transition
between the ground state and the fourth vibration level of the first excited state is
indicated by the long arrow. A vibration transition within the ground state is
indicated by the short arrow (Freifelder, 1982).

34
The absorption of energy is most probable, only if the amount absorbed corresponds
to the difference between energy levels. This can be expressed by stating that light of
wavelength λ can be absorbed only if λ =𝐻𝐶
𝐸2−𝐸1 . In which, E is the energy level
of the molecule before absorption and E2 is an energy level reached by absorption. A
change between energy levels is called a transition (Freifelder, 1982). It is
convenient to treat a molecule as if it possesses several distinct reservoirs of energy.
Total energy is described by equation: Total = Transition +Rotation+ Vibration+ Electronic+
Electron spin orientation +
Nuclear spin orientation (Campbell and Dwerk et al., 1984).
Spectroscopy is the study of the interaction of radiation with matter. Radiation is
characterized by its energy E which is linked to the frequency ν or wavelength λ of
the radiation by him Planck relationship: 𝐸 = ℎν = ℎ𝑐/λ
To investigate biological systems spectroscopy is a powerful technique, providing a
convenient opportunity for analysis of proteins, nucleic acids and metabolites.
Furthermore, the detailed structural information about molecule and action
mechanism can be obtained (Hammes, 2005). Figure 11 represents many of the
important regions of the electromagnetic spectrum.
Figure 11.The Electromagnetic spectrum

35
1.5.1 Infrared Spectroscopy
Transitions between vibration levels of the ground state of a molecule result from the
absorption of light in the infrared region. Infrared spectra are generated by the
characteristic motions of various functional groups. The modes of vibration of each
group are very sensitive to changes in chemical structure, conformation and
environment making infrared spectra valuable for analysis (Freifelder, 1982).
The term ―infrared‖ covers the range of the electromagnetic spectrum between 0.78
and 1000 μm. In the context of infrared spy, wavelength is measured in ―wave
number‖. Infrared (IR) region is divided into three sub regions (Smith, 1999):
Region Wave number range (cm-1
)
Near 14000-4000
Middle 4000-400
Far 400-4
Infrared spectroscopy is based on the transitions between vibration energy levels of
the atoms of a molecule. Spectrum is obtained by passing radiation through a sample
and determining what fraction of the incident radiation is absorbed at a particular
energy. The energy at which any peak in an absorption spectrum corresponds to the
frequency of a vibration of a part of a sample molecule (Stuart, 1996). The atoms in
molecules can move relative to one other, that is, bond lengths can vary or one atom
can move out of its present plane. This is a description of stretching and bending
movements that are collectively referred to as vibrations (Stuart, 2004). Figure 12
schematically shows main types of vibrations.

36
Figure 12.The schematic representation of some molecular vibrations in linear triatomic molecules
(A) and non-linear triatomic molecules (B). +; - symbols represent atomic displacement out of page
plane (Arrondo et. al., 1993).
For a molecule to demonstrate infrared absorptions it must possess an electric dipole
moment that changes during the vibrations. Vibrations can involve either a change in
bond length (stretching) or bond angle (bending). Some bonds can stretch in-phase
(symmetrical stretching) of out-phase (asymmetrical stretching). Bending vibrations
also contribute to infrared spectra and these are summarized in Figure 13. The types
of bending vibrations are deformation, rocking, wagging and twisting motions.
Figure 13. Types of bending vibrations
Symmetrical molecules will have fewer ‘‘ infrared-active ‘‘ vibrations than
asymmetric molecules. To conclude, asymmetric vibrations will be stronger than
symmetric ones, since the symmetric vibrations will not lead to a change in dipole

37
moment. There are also skeletal vibrations associated with whole skeleton of the
molecule rather than a specific group within the molecule (Stuart, 2004).
1.5.2 The Advantages of Infrared Spectroscopy
It is a universal technique. Solid, liquids, gases, semi-solids, powders and
polymers are all can be analyzed.
Infrared spectra are very informative. The peak positions, intensities, widths
and shapes in a spectrum all gives useful information.
An infrared spectrum is a relatively fast and easy technique. The majority of
samples can be prepared, scanned and the results plotted in less than five
minutes.
It is sensitive method. By interfacing an infrared spectrometer to a gas
chromatograph, the infrared spectrum of as little as 5 nanograms of material
can be obtained. Micrograms of material can be detected routinely.
Infrared instruments are relatively inexpensive laboratory equipments.
The different functional groups belonging to the macromolecules in the
biological system can be monitored simultaneously from the same spectrum.
1.5.3 Fourier- Transform Infrared Spectrometers (FT-IR)
The basic principle of FTIR spectroscopy is the interference of radiation among two
beams yielding an interferogram. Interferogram is a signal generated as a function of
the change of path length among the two beams. The Figure 14 schematically
represents an FTIR spectrometer.

38
Figure 14. Schematic of Michelson interferometer.
The emerged radiation from the source is passed through an interferometer to the
sample before reaching a detector. The high-frequency contributions have been
removed by the filter when signal is amplified. Then by the help of analog-to-digital
converter, the data are transformed to digital form and passed on to the computer for
Fourier-transformation.
Michelson interferometer is the most used interferometer, consists of two
perpendicular plane mirrors. One mirror can move in direction perpendicular to the
plane. The beam splitter intersects the planes of two mirrors. The transmitted beam
emerges from interferometer at 90∘ to the input beam. In FTIR spectrometry this
beam is detected.
In order to investigate mid-infrared region of FTIR spectrometer, Globar or Nernst
source is used. High-pressure mercury lamps are used for far-infrared region and
tungsten-halogen lamps used for near-infrared region as sources.
There are two type of detectors used for mid-infrared region. The normal pyrolectric
device (deuterium tryglycine sulfate (DTGS)) routinely used in a temperature-
39
resistant alkali halide window. The mercury cadmium telluride (MCT) detectors used
for sensitive studies. MCT requires to be cooled to liquid nitrogen temperatures
(Stuart, 2004).
The Advantages of FT-IR Spectrometers
Fellgett advantage is due to an improvement in the SNR per unit time, proportional
to the square root of the number of resolution elements being monitored. This results
from the large number of resolution elements being monitored simultaneously.
Jacquinot’s advantage is due to the substantial gain in energy at the detector hence
translating to higher signals and improved SNRs. Because FTIR spectrometry does
not require the use of a slit or other restricting device, the total source output can be
passed through the sample continuously.
Speed advantage. The mirror has the ability to move short distances quite rapidly and
this, together with the SNR improvements make it possible to obtain spectra on a
millisecond timescale (Stuart, 1997).
1.5.4 Attenuated Total Reflectance Spectroscopy (ATR)
ATR spectroscopy uses the total internal reflection phenomena. A radiation beam
penetrating into the crystal undergoes total internal reflection when the angle of
incidence at the interface among the crystal and sample is greater than the critical
angle. The critical angle is the function of the refractive indices of the two surfaces.
The beam enters a fraction of a wavelength beyond the reflecting surface. When a
material that selectively absorbs radiation is in close contact with the reflecting
surface, the beam loses energy at the wavelength where the material absorbs.
The resultant attenuated radiation is detected and plotted as a function of wavelength
by the spectrometer and gives rise to the absorption spectral characteristics of the
sample.

40
Figure 15.Typical attenuated total reflectance cell.
The crystals used in ATR cells are made from materials that are low soluble in water
and are have very high refractive index. The commonly used materials are zinc-
selenide (ZnSe), thallium-iodide (KRS-5) and germanium (Ge). Both solid and liquid
samples can be analyzed in ATR cells. Furthermore, it is possible to set up a flow of
sample through ATR cell which allows monitoring of spectral changes with time
(Stuart, 2004).
The advantages of ATR-FTIR spectroscopy are the following:
1. The samples can be directly investigated without extensive drying
2. The results are not affected from the width of the samples. As a result more
reliable results can be obtained for quantitative measurements.

41
1.6 Aim of the Study
Diabetes Mellitus is a disease of metabolism affecting the great amount of world‘s
population. Protein, fat and carbohydrate metabolism are severely affected during
diabetes. Complications of diabetes affect mostly retina, nerves and kidneys. The
kidney is one of the most damaged organs in diabetes. Diabetes-induced kidney
disease is the complications of diabetes mellitus affecting 30-40 % of diabetic
patients. Diabetic kidney disease is characterized by micro and macroangiopathy in
kidney cortex leading to glomerulosclerosis, proteinuria and meshangial matrix
expansion. If untreated, these pathologies cause renal insufficiency and even death.
Hyperglycemia is a main factor causing diabetes and diabetic kidney disease. As
kidneys have serious functions such as regulation of water and electrolyte balance in
the body, it is very important to diagnose and apply proper treatment during diabetic
kidney disease.
In this study we made an attempt to explain the structural and functional alterations
involved in diabetic kidney disease via infrared spectroscopic techniques, using rat
animal model. We have used three different dose of selenium as low, medium and
high, to discover the optimal curing dose of selenium for the diabetes-induced
disorders.
Oxidative stress may cause diabetes and diabetic complications through various
pathways. To sum up, in the pathogenesis of diabetic nephropathy ROS production
can extensively damage the kidneys. Nowadays, the usage of antioxidants in the
treatment of diabetes is also a promising strategy for diabetic complications (Guvenc
Gorgulu, 2004). Selenium is a metal cofactor of antioxidant enzyme glutathione
peroxides which is an important enzyme removing free radicals from the body.
Furthermore, Selenium exerts antioxidant effects and also demonstrates insulin-like
properties in animal studies. However, the exact mechanism of action of selenium is
not known, yet.

42
The literature survey reveals the interesting results about the effect of selenium on
diabetes and diabetic complications. Most studies show that selenium exerts healing
effect on diabetes and diabetic complications ( Ezaki et al. , 1990 ; Gebre-Medhin et
al. , 1984 ; Cser et al. , 1993 ; Stapleton, 2000 ; Turan et al. , 2007 ). We conducted
this study in order to investigate biological action of selenium in diabetic kidney
disease via ATR-FTIR spectroscopy in rat animal model.
To conclude, the aim of this study is to investigate the diabetes-induced structural
and functional changes of rat kidney tissue, especially alterations of kidney brush-
border plasma membrane using ATR-FTIR spectroscopy. Furthermore, the best of
our knowledge it is the first study investigating the structural properties of the
macromolecules of kidney plasma membrane. In addition, the structural alterations
of kidney brush-border plasma membrane caused by selenium supplementation on
diabetes induced damages were studied, for the first time. Finally, the possible
recovery effect of selenium as an antioxidant on diabetic kidney disease state was
investigated via ATR-FTIR spectroscopy.

43
CHAPTER 2
MATERIALS AND METHODS
2.1 Reagents
Mannitol, Trisma Base, HEPES, Calcium Chloride, Stretozotocin (STZ) and Sodium
Selenite used in this study were obtained from Sigma at the high grade of purity.
2.2 Animals and Feedings
Male adult Wistar rats (250-300 gr) 12-14 weeks old were obtained from
Experimental Center of Adnan Menderes University. Animals were fed with standard
diet with water and libitum. All experimental procedures were approved by the ethics
committee of Adnan Menderes University.
The animals were divided randomly, into 5 groups as control (n=10), diabetic (n=8),
low dose selenium treated diabetic (n=8), medium dose selenium treated diabetic
(n=8) and high dose selenium treated diabetic group (n=5).
2.2.1 Formation of Control group
Animals were injected 0.05 M Citrate buffer (PH-4.5) intraperitonally as a single
dose. Also physiological saline solution was injected daily for 5 weeks. All the
44
animals were fed without any restriction for 5 weeks. At the end of 5 the week they
were decapitated, kidneys were removed and stored at -80 C until use.
2.2.2 Formation of Diabetic group
Diabetes was induced with intraperitonal injection of streptozotocin (50 mg/ kg)
dissolved in 0.05 M Citrate buffer. Animals received 5 % dextrose solution in order
to prevent death due to hyperglycemic shock. After 4 days of STZ injection blood
glucose levels were measured using a glucometer (One Touch Horizon Blood
Glucose Monitoring System/ Glucometer, USA). Blood glucose levels higher than
250 mg/ dl were encountered as diabetic. During 5 weeks the animals were fed with
standard diet without any restriction and at the end of 5 th week they were
decapitated, kidneys were removed and stored at -80 °C for experimental purposes.
2.2.3 Formation of Selenium treated Diabetic groups
Diabetes was induced with intraperitonal injection of streptozotocin (50 mg/ kg)
dissolved in 0.05 M Citrate buffer as described previously. Diabetic rats were
divided into three groups. Low dose (1μmol/ kg), medium dose (5μmol/ kg) and high
dose (25 μmol/ kg) sodium selenite were injected daily for 5 weeks into rat‘s
intraperitonally. At the end of 5 th week they were decapitated, kidneys were
removed and stored at -80 °C till usage.
2.3 Isolation of Rat Kidney Brush Border Plasma membrane vesicles using
Calcium precipitation method.
The renal brush-border plasma membranes were isolated using Calcium precipitation
method with some modifications (Evers et al., 1978). The fatty tissue surrounding
kidneys was removed and kidneys were dissected and the cortex part was obtained.
Tissue was weighted and homogenized as 10% w/ w suspension with mannitol buffer

45
(10 mM Mannitol, 2mM Tris-Hcl) for 2 min. The tissue was homogenized using
Potter-Elvehjem glass homogenizer packed in crush ice, coupled motor – driven (
Black & Decker, V850, multispeed drill ) Teflon at 2400 rpm for 3 X 20 sec. 10 mM
CaCl2 was added to final concentration. All procedures was carried out at 0- 4 oC.
After 15 min the homogenate was diluted 1:1 with a buffer containing10 mM
Mannitol, 2mM Tris-Hcl and 10 mM CaCl2. The homogenate was centrifuged at 500
g for 12 min and pellet was discarded. The supernatant was centrifuged at 15. 000 g
for 12 min. The resulting supernatant was discarded and pellet was resuspended with
4 ml Mannitol buffer (10 mM Mannitol, 2mM Tris-Hcl). 10 mM CaCl2 was added to
final concentration. After 15 minute the homogenate was diluted 1:1 with a buffer
containing10 mM Mannitol, 2mM Tris-Hcl and 10 mM CaCl2. The homogenate was
centrifuged at 750 g for 12 min and pellet was discarded. The supernatant was
centrifuged at 15.000 g for 12 min and resulting supernatant was discarded. The
pellet was resuspended in 15 ml of buffer containing 10 mM Mannitol, 20mM Tris-
Hcl and 20 mM HEPES and centrifuged at 48. 000 g for 20 min. The supernatant
was discarded and the pellet was homogenized with 1.5 ml of buffer containing 10
mM Mannitol, 20mM Tris-Hcl and 20 mM HEPES by sucking the suspension 10
times through a steel needle into a plastic syringe. The homogenate was centrifuged
at 2000 g for 5 min and the pellet was discarded. The supernatant was centrifuged at
48.000 g for 20 min. The resulting pellet was final brush-bordered plasma membrane
vesicles. The pellet was resuspended with 0.25 ml of final supernatant in order to
transfer to eppendorf tubes and centrifuged at 14.000 rpm for 10 minute. The
supernatant was discarded and pellet was used for ATR-FTIR experiments.

46
2.4 ATR-FTIR study
The infrared spectra of kidney brush border plasma membrane samples were
collected in the one-bounce ATR mode in a Spectrum 100 FTIR spectrometer
(Perkin- Elmer Inc., Norwalk, CT, USA) equipped with a Universal ATR accessory.
The air was scanned and spectrum was used as a reference. The samples (10 µl) were
placed on a Diamond/ ZnSe crystal plate (PerkinElmer) with a micropipette. The
samples were scanned from 4000 to 650 cm−1
for 200 scans with a resolution of 4
cm−1
at room temperature. Since the membrane contains water, the last buffer used
during membrane isolation was scanned and subtracted manually from the samples
using Spectrum 100 software. Collections of spectra and data manipulations were
carried out using Spectrum 100 software (Perkin-Elmer). The band positions were
measured using the frequency corresponding to the center of weight. Using the same
software, the spectra were first smoothed with thirteen-point Savitsky-Golay smooth
function to remove the noise. Then the spectra were baseline corrected. The spectra
were normalized with respect to specific bands for visual demonstration. The
purpose of the normalization is to remove differences in peak heights between the
spectra acquired under different conditions. It allows a point-to-point comparison to
be made (Smith, 1999). The ratios of the intensities and shifting of the frequencies
were examined before the normalization process. Band areas were calculated from
smoothed and baseline corrected spectra using Spectrum 100 software. The
bandwidth values of specific bands were calculated as the width at 0.75 x height of
the signal in terms of cm-1
.

47
air spectrum
1000200030004000Wavenumber (cm-1)
AB
SO
RB
AN
CE
Figure 16. The reference spectrum of air
2.5 Cluster Analysis
For the observation of the spectral differentiation among experimental groups, cluster
analysis was applied by using OPUS 5.5 software (Bruker Optics, GmbH). For
cluster analysis, first derivative of each sample was taken in 3020-950 cm -1
region
and subsequently vector normalization was applied over the investigated frequency
range. As input data for this analysis, spectral distances were calculated between
pairs of spectra as Pearson‘s correlation coefficients. Cluster analysis for the
separation of control versus other groups was based on the Euclidean distances.
Ward‘s algorithm was used to construct dendrograms.

48
2.6 Structural Analysis of Main Protein (Amide I) Band
OPUS 5. 5 software (Bruker Optics, GmbH) was used in order to analyze main
protein band. Vector normalized second derivatives was used to determine the
spectral differences of Amide I band (1700-1600 cm-1
) among all groups.
Minimum positions were used for the comparisons in the second derivative spectra
because absorption maxima displayed as minima in the second derivatives (Ozek et
al., 2009).
Concentration sensitive alterations in the constituents of amide I band were
observed by using these spectra because peak height is very sensitive to alterations
of FWHH (full width at half height) of the FTIR bands in the second derivative
spectra. Finally, the qualitative and quantitative evaluation of protein secondary
structure components was acquired, detailly in addition to the determination of
band frequencies.
2.7 Statistical Analysis
The results were expressed as ± standard error of mean (SEM) . Control vs diabetic
group, diabetic versus selenium treated groups (low dose, medium dose and high
dose group) data were analyzed statistically using non-parametric Mann–Whitney U
test. A ‗p‘ value less than or equal to 0.05 was considered as statistically significant.
The degree of significance was denoted as less than or equal to p < 0.05 *, ‡ , p <
0.01 **, ‡‡ p < 0.001 ***, ‡‡‡ .

49
CHAPTER 3
RESULTS
3.1 General ATR-FTIR Spectrum and Band Assignment of Rat Kidney Plasma
Membranes
Current research was conducted using 5 (five) groups of wistar rat, namely control
(n=10) , diabetic (n=8), treated groups at high selenium dose (n=5), medium dose
(n=8) and low dose (n=8) to reveal the effect of diabetes on kidney brush-border cell
membranes and ffurthermore, the role of of selenium as an antioxidant on the
diabetes-induced damages. In this study, ATR-FTIR spectroscopy was used as a
basic informative method. Through the use of this spectroscopic method the
structural and compositional alterations such as protein and lipid concentration, lipid
/ protein ratio, lipid peroxidation, acyl chain flexibility and membrane dynamics
were compared among healthy (control group), diabetic and selenium treated diabetic
animals. In addition, the secondary structural changes of membrane proteins were
also revealed.
In order to investigate the aqueous system in FTIR spectroscopy, water must be
subtracted from the system, because water is a strong infrared absorber (Mantsch,
1984). In infrared spectroscopy, water gives strong bands around 3409 cm-1
and
1645 cm-1
regions that overlap the C-H stretching modes of lipids in the 3000-2800
cm-1 region and the C=O stretching‘s belonging to tryglycerides, cholesterol esters
and protein ( amide I ) bands located around 1730 cm-1
and 1650 cm-1
( amide II )
respectively.

50
In this work, the spectrum of buffer used in last step of membrane isolation was
subtracted from the system using appropriate software. The experimental conditions
such as amount of sample scan number and temperature of buffer (water) was exactly
same for all samples. Mainly two regions of the spectra were analyzed in details
because there are too many bands belonging to different functional groups of
proteins, lipids and polysaccharides. These regions namely are the C-H stretching
region (3030 cm-1
- 2800 cm-1
) and the finger-print region (1800 cm-1
– 950 cm-1
).
Figure 17 shows representative overall spectra of kidney brush-border cell membrane
in 3030-950 cm-1
region. The bands were assigned on the basis of this work together
with citations of other studies from literature ( Rigas et al. , 1990 ; Wong et al. , 1991
; Takahashi et al. , 1991 ; Wang et al. , 1997 ; Jamin et al. , 1998 ; Melin et al. , 2000
; Jackson et al. , 1998 ; Lyman et al. , 1999 ; Chiriboga et al. , 2000 ; Cakmak et.al ,
2003 ; Banyay et al. , 2003 ; Toyran et al. , 2006 ; Cakmak et al. , 2006 ) . The
assigned bands were summarized in Table 1.
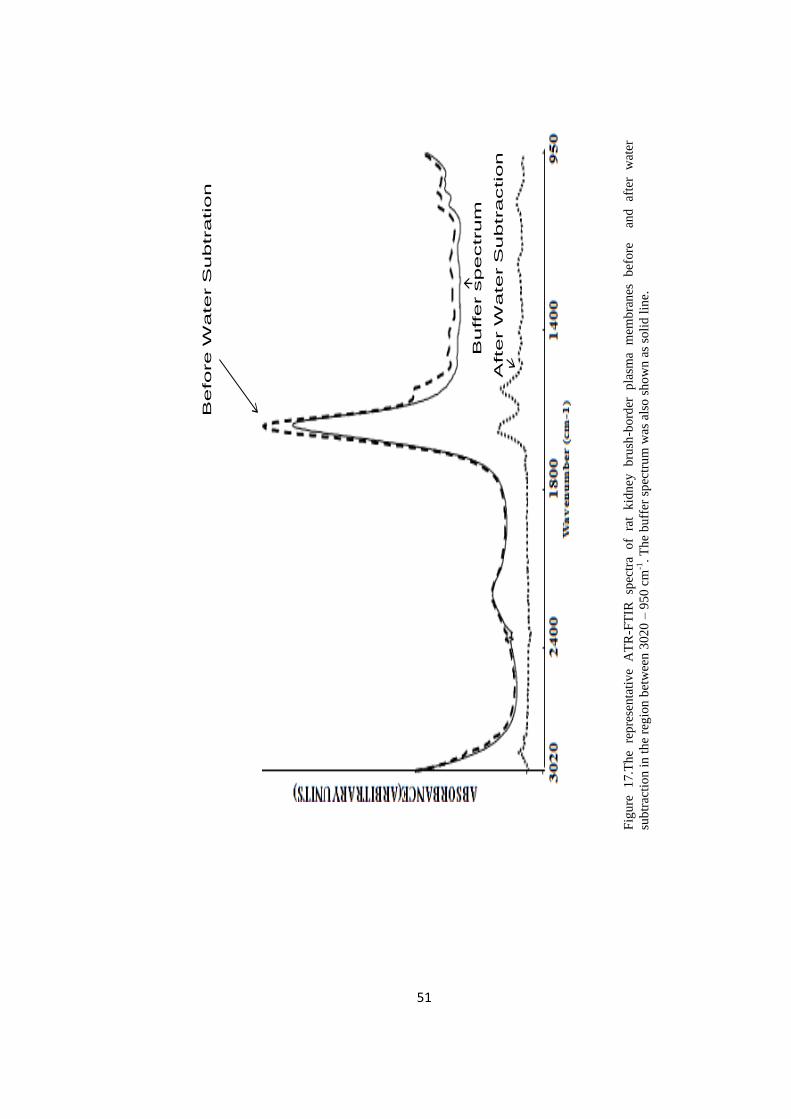
51
Before W
ater S
ubtratio
n
Bu
ffer s
pectrum
After W
ater S
ubtractio
n
Fig
ure
1
7.T
he
rep
rese
nta
tiv
e A
TR
-FT
IR
spec
tra
of
rat
kid
ney
b
rush
-bo
rder
p
lasm
a m
emb
ran
es
bef
ore
and
af
ter
wat
er
sub
trac
tio
n i
n t
he
reg
ion
bet
wee
n 3
02
0 –
95
0 c
m-1
. T
he
buff
er s
pec
tru
m w
as a
lso
sh
ow
n a
s so
lid
lin
e.

52
Fig
ure
18.T
he
rep
rese
nta
tiv
e sp
ectr
a o
f co
ntr
ol
rat
kid
ney
bru
sh-b
ord
er p
lasm
a m
emb
ran
e in
th
e 3
02
0-
957
cm
-1 r
egio
n.
Th
e em
erg
ing
ban
ds
are
nu
mer
ized
res
pec
tiv
ely
.Th
e d
efin
itio
n o
f n
um
eriz
ed b
and
s ar
e il
lust
rate
d i
n T
able
1.
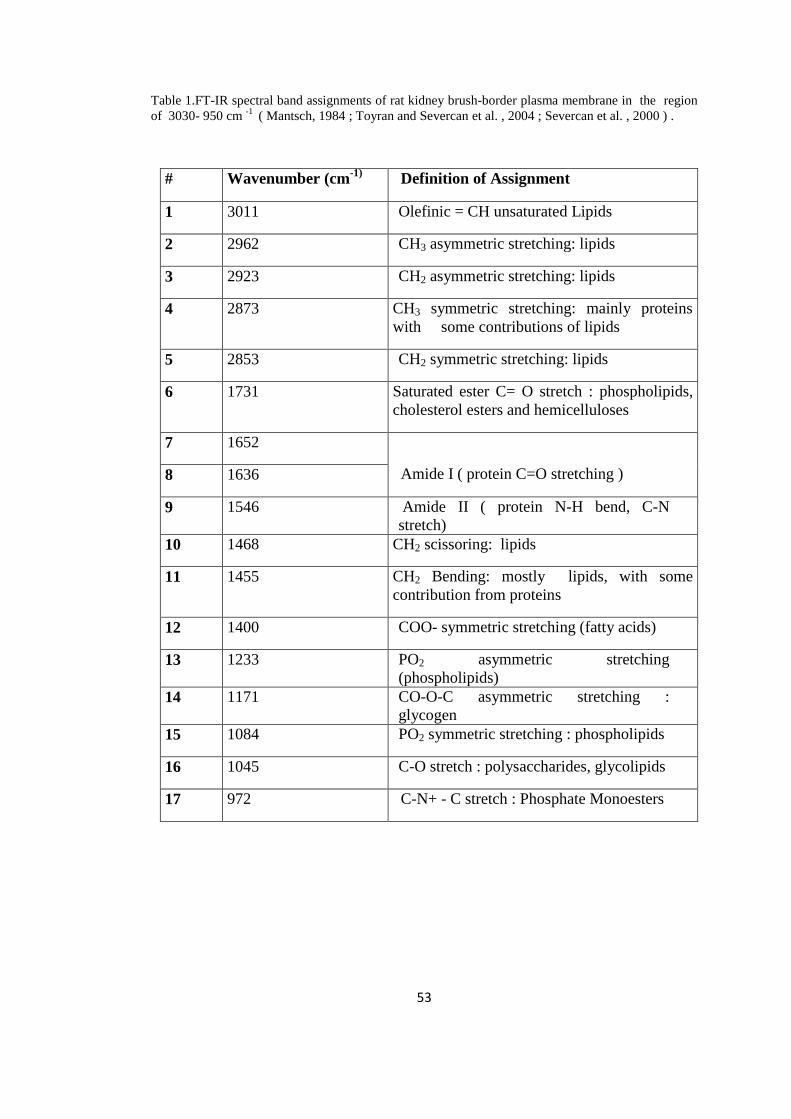
53
Table 1.FT-IR spectral band assignments of rat kidney brush-border plasma membrane in the region
of 3030- 950 cm -1
( Mantsch, 1984 ; Toyran and Severcan et al. , 2004 ; Severcan et al. , 2000 ) .
# Wavenumber (cm-1)
Definition of Assignment
1 3011 Olefinic = CH unsaturated Lipids
2 2962 CH3 asymmetric stretching: lipids
3 2923 CH2 asymmetric stretching: lipids
4 2873 CH3 symmetric stretching: mainly proteins
with some contributions of lipids
5 2853 CH2 symmetric stretching: lipids
6 1731 Saturated ester C= O stretch : phospholipids,
cholesterol esters and hemicelluloses
7 1652
Amide I ( protein C=O stretching ) 8 1636
9 1546 Amide II ( protein N-H bend, C-N
stretch)
10 1468 CH2 scissoring: lipids
11 1455 CH2 Bending: mostly lipids, with some
contribution from proteins
12 1400 COO- symmetric stretching (fatty acids)
13 1233 PO2 asymmetric stretching
(phospholipids)
14 1171 CO-O-C asymmetric stretching :
glycogen
15 1084 PO2 symmetric stretching : phospholipids
16 1045 C-O stretch : polysaccharides, glycolipids
17 972 C-N+ - C stretch : Phosphate Monoesters

54
Table 2.Numerical summary of the detailed differences in the band frequencies of the control, diabetic
and treated groups. The values are the means ± SEM for each group. Man-Whitney U-test was used to
compare the groups. The degree of significance was donated as *, ‡ P < 0.05; **, ‡‡ P < 0. 01 and
***, ‡‡‡ P < 0.001. The upward arrow indicates an increase and the downward arrow indicates a
decrease. The ddiabetic group was compared with respect to the control group. The Selenium treated
groups were compared with respect to the diabetic group.
# Control (n=10) Diabetic (n=8) HDSe(n=5) MDSe (n=8) LDSe (n=8)
1. 3011.66 ± 1.5 3013.25 ± 2.32 ↑ 3012.62 ± 2.19 ↓ 3017 ± 0.07 ‡ ↑ 3011.81 ± 0.9 ↓
2. 2962.6 ± 1.95 2959.84 ± 2.46 ↓ 2960.78 ± 2.1 ↑ 2958.6 ± 0.12 ↓ 2960.3 ± 2.87 ↑
3. 2923.74 ± 1.15 2923.49 ± 0.91 ↓ 2924.15 ± 0.93 ↑ 2924.08 ± 0.24 ↑ 2924.39 ± 0.4 ‡ ↑
4. 2873.072± 0.37 2873.23 ± 1.76 ↑ 2872.28 ± 0.11 ↓ 2872.84 ± 0.42↓ 2872.7 ± 0.43 ↓
5. 2853.05 ± 0.37 2852.2 ± 0.5 ** ↓ 2853.4 ± 0.4 ‡ ↑ 2853.36± 0.24 ‡ ↑ 2853.66 ± 0.3 ‡ ↑
6. 1731.86 ± 0.31 1732.25 ± 0.4 ↑ 1730.34±0.8 ‡↓ 1730.84 ± 2.4 ↑ 1731.24 ± 2.01 ↓
7. 1652.29 ± 0.73 1651.59 ± 0.4 ↓ 1651.67 ± 0.5 ↑ 1652.97 ± 0.08 ‡ ↑ 1651.95 ± 0.84 ↑
8. 1636.05 ± 0.7 1635.34 ± 0.92↓ 1637.68 ± 0.7 ‡ ↑ 1636.13 ± 0.51‡ ↑ 1636.48 ± 1.08 ↑
9. 1546.37 ± 0.3 1546.03 ± 0.2 * ↓ 1542.6 ± 0.67 ‡ ↓ 1546.4 ± 0.47 ‡ ↑ 1546.68 ± 0.5 ‡ ↑
10. 1468.88 ± 0.78 1469.47 ± 0.19 ↑ 1468.28 ± 0.1 ‡ ↓ 1468.13 ± 0.11 ‡ ↓ 1469.16 ± 0.5 ↓
11. 1455.38 ± 2.07 1455.06 ± 0.31 ↓ 1453.87 ± 0.9 ‡ ↓ 1458.1 ± 0.4 ‡ ↑ 1454.97 ± 0.76 ↓
12. 1400.061± 2.15 1398.92 ± 1.86 ↓ 1399.4 ± 1.99 ↑ 1400.34 ±1.93 ‡ ↑ 1401.74 ±1.37 ‡ ↑
13. 1233.3 ± 2.09 1233.59 ± 1.17 ↑ 1226.7 ± 2.77 ‡↓ 1231.87 ±0.82 ‡ ↓ 1233.13 ± 1.09 ↓
14. 1171.55 ± 0.69 1172.34 ± 0.43 ↑ 1172.23 ± 0.37 ↓ 1172.95 ±0.64 ‡ ↑ 1171.67 ±0.29 ‡ ↓
15. 1084.95 ± 0.75 1085.82 ± 0.96 * ↑ 1082.15 ± 0.14 ‡↓ 1085.79 ± 0.6 ↓ 1085.47 ± 2.09 ↓
16. 1045.83 ± 0.21 1045.78 ± 0.18 ↓ 1040.68 ± 1.1 ‡ ↓ 1045.39 ±0.26 ‡ ↓ 1045.63 ± 0.2 ↓
17. 972.255 ± 0.568 972.45 ± 1.13 ↑ 972.91 ± 0.9 ↑ 972.74 ± 0.4 ↓ 971.88 ± 0.48 ↓

55
Table 3.Numerical summary of the detailed differences in the band areas of the control, diabetic and
treated groups. The values are the means ± SEM for each group. Man-Whitney U-test was used to
compare the groups. The degree of significance was donated as *, ‡ P < 0.05; ** , ‡‡ P < 0.01 and
***, ‡‡‡ P < 0.001. The upward arrow indicates an increase and the downward arrow indicates a
decrease. The diabetic group was compared with respect to the control group. The Selenium treated
groups were compared with respect to the diabetic group.
# Control (n=10) Diabetic (n=8) HDSE (n=5) MDSE (n=8) LDSE (n=8)
1. 0.0034 ± 0.002 0.007 ± 0.01 ↑ *** 0.009 ± 0.004 ‡‡ ↑ 0.012 ± 0.003 ‡ ↑ 0.0067 ± 0.001 ‡ ↓
2. 0.0282 ± 0.009 0.022 ± 0.006 ↓ 0.16 ± 0.1 ↑ 0.06 ± 0.01 ‡↑ 0.035±0.01 ‡↑
3. 0.215 ± 0.006 0.06 ±0.03 *** ↓ 0.88 ± 0.45 ‡ ↑ 0.16 ± 0.04 ‡↑ 0.16 ± 0.04 ‡ ↑
4. 0.0029 ± 0.009 0.02±0.017 *** ↑ 0.29 ± 0.15 ‡ ↑ 0.063 ± 0.012 ‡ ↑ 0.03 ± 0.007 ‡ ↑
5. 0.039 ± 0.01 0.02 ± 0.007 *** ↓ 0.37 ± 0.19 ‡ ↑ 0.074 ± 0.02 ‡ ↑ 0.04 ± 0.01 ‡ ↑
6. 0.006 ± 0.001 0.006 ± 0.001 0,03 ± 0,008 ‡ ↑ 0.007 ± 0.002 ‡↑ 0.01 ± 0.002 ‡ ↑
7. 0,71 ± 0,34 0.88 ± 0.1 ↑ 6.7 ± 3,29 ‡‡‡ ↑ 0,83 ± 0,22 ↓ 0,95 ± 0,23 ↑
8. 0.21 ± 0.05 0.21 ± 0.03 1.23 ± 0.6 ‡ ↑ 0.19 ± 0.05 ↓ 0.028 ± 0.07 ‡ ↓
9. 0.82 ± 0.19 0.06 ± 0.01 *** ↓ 1.44 ± 0.66 ‡ ↑ 0.15 ± 0.03 ‡ ↑ 0.86 ± 0.23 ‡ ↑
10. 0.025 ± 0.006 0.02 ± 0.004 ↓ 0.21 ± 0.09 ‡ ↑ 0.04 ± 0.009 ‡↑ 0.04 ± 0.01 ‡ ↑
11. 0.027 ± 0.022 0.02 ± 0.003 ↓ 0.21 ± 0.1 ‡ ↑ 0.03 ± 0.007 ‡ ↑ 0.03 ± 0.01 ‡ ↑
12. 0.02 ± 0.006 0.02 ± 0.003 0.29 ± 0.12 ‡ ↑ 0.03 ± 0.008 ‡ ↑ 0.026 ± 0.008 ↑
13. 0.12 ± 0.04 0.15 ± 0.016 ↑ 0.28 ± 0.17 ‡ ↑ 0.04 ± 0.01 ‡ ↓ 0.18 ± 0.04 ‡ ↑
14. 0.006 ± 0.001 0.006 ± 0.001 0.17 ± 0.088 ↑ 0.005 ± 0.004 ↓ 0.005 ± 0.001 ↓
15. 0.08 ± 0.03 0.068 ± 0.01↓ 1.46 ± 0.66 ‡ ↑ 0.11 ± 0.04 ‡ ↑ 0.07 ± 0.02 ↑
16. 0.032 ± 0.008 0.06 ± 0.017 ** ↑ 1.3 ± 0.6 ‡ ↑ 0.06 ± 0.02 ↑ 0.09 ± 0.13 ↑
17. 0.02 ± 0.02 0.01 ± 0.002 ↓ 0.086 ± 0.05 ‡ ↑ 0.02 ± 0.003 ‡↑ 0.011 ± 0.001 ↑
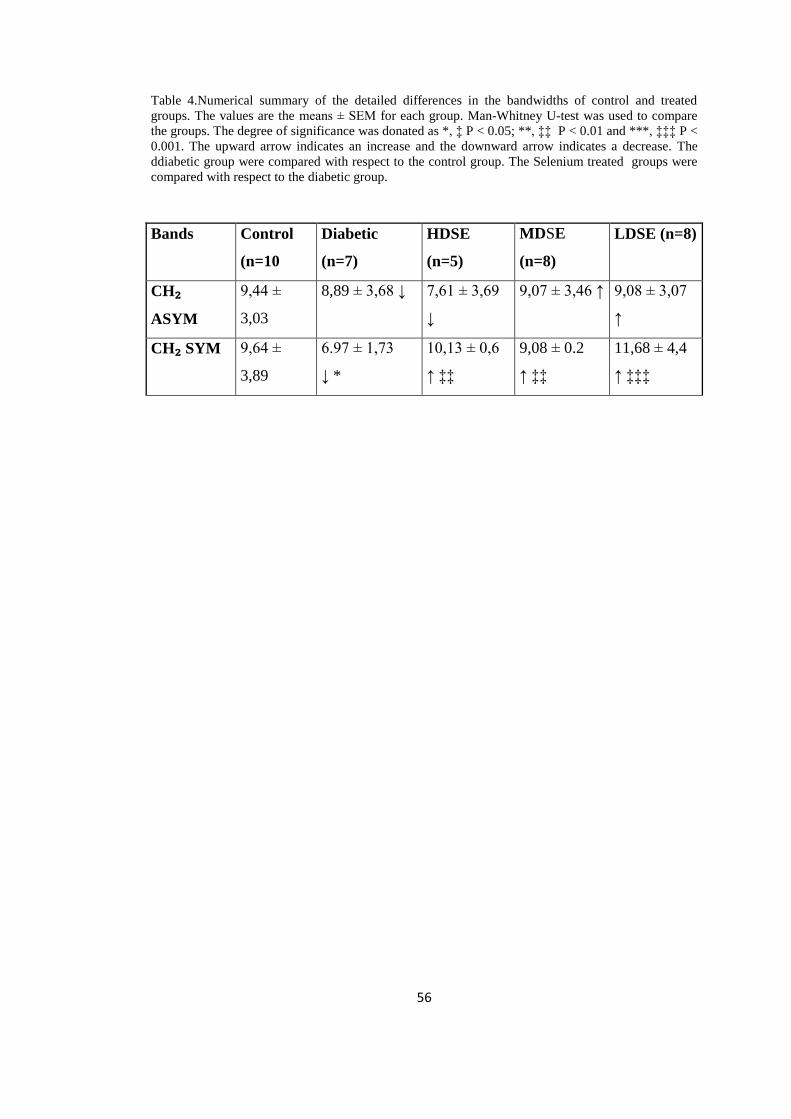
56
Table 4.Numerical summary of the detailed differences in the bandwidths of control and treated
groups. The values are the means ± SEM for each group. Man-Whitney U-test was used to compare
the groups. The degree of significance was donated as *, ‡ P < 0.05; **, ‡‡ P < 0.01 and ***, ‡‡‡ P <
0.001. The upward arrow indicates an increase and the downward arrow indicates a decrease. The
ddiabetic group were compared with respect to the control group. The Selenium treated groups were
compared with respect to the diabetic group.
Bands Control
(n=10
Diabetic
(n=7)
HDSE
(n=5)
MDSE
(n=8)
LDSE (n=8)
CH₂
ASYM
9,44 ±
3,03
8,89 ± 3,68 ↓ 7,61 ± 3,69
↓
9,07 ± 3,46 ↑ 9,08 ± 3,07
↑
CH₂ SYM 9,64 ±
3,89
6.97 ± 1,73
↓ *
10,13 ± 0,6
↑ ‡‡
9,08 ± 0.2
↑ ‡‡
11,68 ± 4,4
↑ ‡‡‡

57
Table 5.The summary of the differences in lipid to protein ratios between the control, diabetic and
treated groups for kidney brush-border plasma membranes. The values are the means ± SEM for each
group. Man-Whitney U-test was used to compare the groups. The degree of significance was donated
as *, ‡ P < 0.05; **, ‡‡ P < 0.01 and ***, ‡‡‡ P < 0.001. The upward arrow indicates an increase and
the downward arrow indicates a decrease. The ddiabetic group was compared with respect to the
control group. Selenium treated groups were compared with respect to the diabetic group.
Ratio of Peak
Areas
Control Diabetic HDSe MDSE LDSe
(Lipid to
Protein)
(n=10) (n=8) (n=5) (n=8) (n=8)
CH2SYM /
CH3SYM
1,35 ±
0,12
1,26 ± 0,45 ↓ 1,25 ± 0,03 ↓ 1,18 ± 0,15 ↓ 1,73 ± 0,1 ↑
‡‡‡
CH2 ASYM /
CH3 SYM
7,52 ± 0,5 4,46 ± 0,5 ↓
***
2,94 ± 0,1 ↓
‡‡
2,62 ± 0,22 ↓
‡‡‡
6,19 ± 0,23 ↑
‡‡‡
CH2ASYM +
CH2SYM /
CH3SYM
8,67 ±
0,82
5,85 ± 0,72 ↓
***
4,19 ± 0,13 ↓
‡‡
3,8 ± 0,3 ↓ ‡‡‡ 7,92 ± 0,32 ↑
‡‡‡

58
Table 6.The summary of the differences in lipid to protein ratios between the control, diabetic and
treated groups for kidney brush-border plasma membranes. The values are the means ± SEM for each
group. Man-Whitney U-test was used to compare the groups. The degree of significance was donated
as *, ‡ P < 0.05; **, ‡‡ P < 0.01 and ***, ‡‡‡ P < 0.001. The upward arrow indicates an increase and
the downward arrow indicates a decrease. The ddiabetic group was compared with respect to the
control group. The Selenium treated groups were compared with respect to the diabetic group.
Ratio of Peak Areas Control Diabetic HDSe MDSE LDSe
(Lipid to Protein) (n= 8) (n=8) (n=5) (n=8) (n=8)
CH2 ASYM + CH2 SYM
/ AMIDE I
1,65 ± 0,37 0,08 ± 0,03 0,74 ± 0,13 1,39 ± 0,12 0,9 ± 0,16
↓ *** ↑ ‡‡ ↑ ‡‡‡ ↑ ‡‡‡
Furthermore, cluster analysis was presented to observe the differences among all
groups. The results are given in figure 19.
Finally, the second derivative structural analysis of main protein band was presented
in order to show structural modifications of diabetic and selenium treated groups.

59
Figure 19.Hierarchical clustering of all groups of kidney cell membrane using second derivative
spectra (spectral range: 3020- 950 cm-1
).

60
3.2 Effect of Diabetes on Rat Kidney Plasma Membranes
In order to see the effect of diabetes on kidney cell membranes, the band frequency,
band area and bandwidth value changes of normal and diabetic samples will be
discussed in detail in this part of research. Table 2, 3 and 4 summarized all obtained
data.
3.2.1 Effect of Diabetes on Rat Kidney Plasma Membranes in the C-H Region
(3020-2800 cm-1
)
As can be seen from the Figure 20 the diabetes induced several alterations in the
spectral bands in the 3020 cm-1
- 2800 cm-1
region. These regions represent mainly
lipids of cell membrane, more precisely, the C-H stretching vibrational modes of
fatty acyl chains of lipids. The spectra were normalized with respect to the CH2
asymmetric stretching band.
Figure 20.The representative infrared spectra of control and diabetic kidney brush-border plasma
membranes in the 3030-2800 cm-1
region (The spectra were normalized with respect to the olefinic =
CH band at 3011 cm-1
).

61
The band positioned at 3011 cm-1
represents H-C=C-H vibrational stretching‘s of
lipid molecules. The bands centered at 2962 cm-1
, 2923 cm-1
, 2873 cm-1
and 2853
cm-1
monitor CH3 asymmetric, CH2 asymmetric, CH3 symmetric and CH2
symmetric stretching vibrations, respectively ( Melin et al. , 2000 ; Chang and
Tavaka, 2002 ; Cakmak et al. , 2003 ; Severcan et al. , 2003 ; Cakmak et al. , 2006 ).
Phospholipids acyl chain unsaturation can be monitored by evaluation of the
intensity value of 3011 cm-1
band. No significant variations wea observed in the
frequency of this band due to diabetes. The area of olefinic band was increased
significantly in diabetic group ( P < 0.001 ) ( see the figure 21 ).
The degree of conformational modifications is closely related to the frequency shifts
of the CH2 stretching vibrational modes. For this purpose, the CH2 stretching
vibrations in the system can assist to obtain trans/gauche isomerization in the lipid
acyl chain. (Mantsch et al., 1984; Severcan, 1997; Bizeau et al., 2000). An increase
in the frequency of the CH2 stretching band implies an increase in the number of
gauche conformers in the fatty acyl chains ( Severcan 1997 ; Rana et al. , 1990 ;
Schultz et al. , 1991 ; Melin et al. , 2000 ; Cakmak et al. , 2003 ; Cakmak et al. , 2006
).
The CH3 asymmetric, CH2 asymmetric, CH2 symmetric stretching bands arise from
the vibration of the related functional groups in lipid molecules. However, CH3
symmetric stretching band monitors proteins ( Mantsch, 1984 ; Severcan et al. , 1997
; Severcan et al. , 2000 ; Severcan et al. , 2003 , Cakmak et al. , 2006 ) .
The area under the CH3 asymmetric band decreased insignificantly, but the CH2
asymmetric band area decreased significantly (p < 0.001 ***) (see the Figure 22).
The peak area of thee CH3 symmetric stretching band increased significantly (p <
0.001 ***). The CH2 symmetric band frequency and band area were both decreased
significantly in diabetic group (p < 0.001 ***).

62
Figure 21.The comparison of Olefinic band area (3011 cm-1
) between the control and diabetic groups.
* show significances p < 0. 05, *** show significance p < 0.001.
Figure 22.The comparison of CH2 asymmetric band area (2923 cm-1
) between the control and diabetic
groups. * show significances p< 0.05 *** show significance p<0.001.
The bandwidth values give information about membrane dynamics. The bandwidth
value of the CH2 asymmetric band diminished insignificantly during diabetes.
However, the bandwidth value of the CH2 symmetric band decreased significantly
during diabetes as represented in figure 23 and Table 4.
0
0,002
0,004
0,006
0,008
Control Diabetic
Inte
grat
ed B
and
AR
ea
The Area of Olefinic Band
***
0
0,1
0,2
0,3
Control Diabetic
Inte
grat
ed
B
and
ae
ea
CH 2 ASYM
***

63
Figure 23.The comparison of bandwidth value of the CH2 symmetric band between control and
diabetic groups. The values are the means ± SEM for each group. Man-Whitney U-test was used to
compare the groups. The degree of significance was donated as * P < 0.05. The ddiabetic group was
compared with respect to control group.
In order to see accurately spectral differences between the control and diabetic group
the results of cluster analysis was demonstrated in Figure 24.
0
2
4
6
8
10
12
control diabetic
BA
ND
WID
TH C
M-1
CH2 SYM
*

64
Figure 24.Hierarchical clustering of control and diabetic groups of kidney
Cell membrane using second derivative spectra (spectral range: 3020-950 cm-1
).

65
As seen from the figure diabetic group was succesfully differentiated from the
control group with high success ( 8 / 8 for diabetic, 10 / 10 for control ) .
One of the important factor that alters the membrane structure and dynamics is the
concentration of proteins and lipids of the membranes ( Szalontai et al. , 2000 ) . A
lipid to protein ratios can be calculated precisely by measuring the ratio of the band
areas emerging from proteins and lipids. From the Figure 25, 26, 27 and 28 one can
see that the band area of the CH2 asymmetric (lipids) band to CH3 symmetric
(proteins) band and the sum of the areas of these bands to the area of CH3 symmetric
band were calculated. Furthermore, the ratio of the area of the CH2 symmetric
stretchings to the CH3 symmetric stretchings was calculated. Finally the sum of the
areas of the CH2 asymmetric and symmetric bands to the area of amide I band was
calculated ( Figure 29, 30 and Table 6 ) . The results show significant decrease in the
lipid to protein ratios, for diabetic state ( p < 0.001 *** ) .
Figure 25.Comparison of band area ratios of the CH2 asymmetric band to the CH3 symmetric band
among the control and diabetic groups. * show significances p < 0.001.
02468
10
Control DiabeticRA
TIO
OF
BA
ND
A
REA
S
CH2 ASYM / CH3 SYM
***

66
Figure 26.Comparison of band area ratios of the CH2 asymmetric band to the CH3 symmetric band
among the control, diabetic and selenium treated groups. *, ‡ show significances p < 0.001.
Figure 27.Comparison of band area ratios of the sum of the CH2 asymmetric and the CH2 symmetric
bands to the CH3 symmetric band among the control and diabetic groups. (* show significances of p <
0.001)
0
1
2
3
4
5
6
7
8
Control Diabetic HDSe MDSE LDSe
RA
TIO
OF
BA
ND
AR
EAS
CH2 ASYM / CH2 SYM
‡‡‡
‡‡‡‡‡***
0
2
4
6
8
10
Control Diabetic
RA
TIO
OF
BA
ND
A
REA
S
CH2 ASYM+CH2 SYM / CH3 SYM
***

67
Figure 28. Comparison of band area ratios of the sum of the CH2 asymmetric and the CH2 symmetric
bands to the CH3 symmetric band among the control, diabetic and selenium treated groups. The
degree of significance was donated as **, ‡‡ P < 0.01 and ***, ‡‡‡ P < 0.001.
Figure 29.Comparison of band area ratios of the sum of the CH2 asymmetric and the CH2 symmetric
bands to the amide I band among the control and diabetic groups. The degree of significance was
donated as *** P < 0.001.
0
2
4
6
8
10
Control Diabetic HDSe MDSE LDSe
Rat
io o
f B
and
are
as
CH2 ASYM+CH2 SYM / CH3 SYM
***‡‡ ‡‡‡
‡‡‡
0
0,5
1
1,5
2
control diabetic
RA
TIO
OF
BA
ND
A
REA
S
CH2 SYM+CH2 ASYM / AMIDE I
***

68
Figure 30.Comparison of band area ratios of the sum of the CH2 asymmetric and the CH2 symmetric
bands to the amide I band among all groups. The degree of significance was donated **, ‡‡P < 0.01
and ***, ‡‡‡ P < 0.001.
3.2.2 Effect of Diabetes on Rat Kidney Plasma Membranes in the Finger-Print
Region (1750-950 cm-1
).
The each fingerprint region of spectra was normalized according to amade I band.
The results are compared statistically using Mann-Whitney U test. As shown in the
Figure 31, there are several peaks arising from different macromolecules in this
region. The bands giving important information will be discussed in this part of the
research.
0
0,2
0,4
0,6
0,8
1
1,2
1,4
1,6
1,8
control diabetic HDSe MDSe LDSe
RA
TIO
OF
BA
ND
AR
EAS
CH2 SYM+CH2 ASYM / AMIDE I
***
‡ ‡
‡ ‡ ‡ ‡ ‡ ‡

69
Fig
ure
31
.Th
e re
pre
sen
tati
ve
infr
ared
sp
ectr
a of
the
con
trol
and
dia
bet
ic k
idn
ey b
rush
-bo
rder
pla
sma
mem
bra
nes
in
th
e 1
750
-950
cm
-1
reg
ion
(T
he
spec
tra
wer
e n
orm
aliz
ed w
ith
res
pec
t to
th
e am
ade
I b
and
at
16
52 c
m-1
).
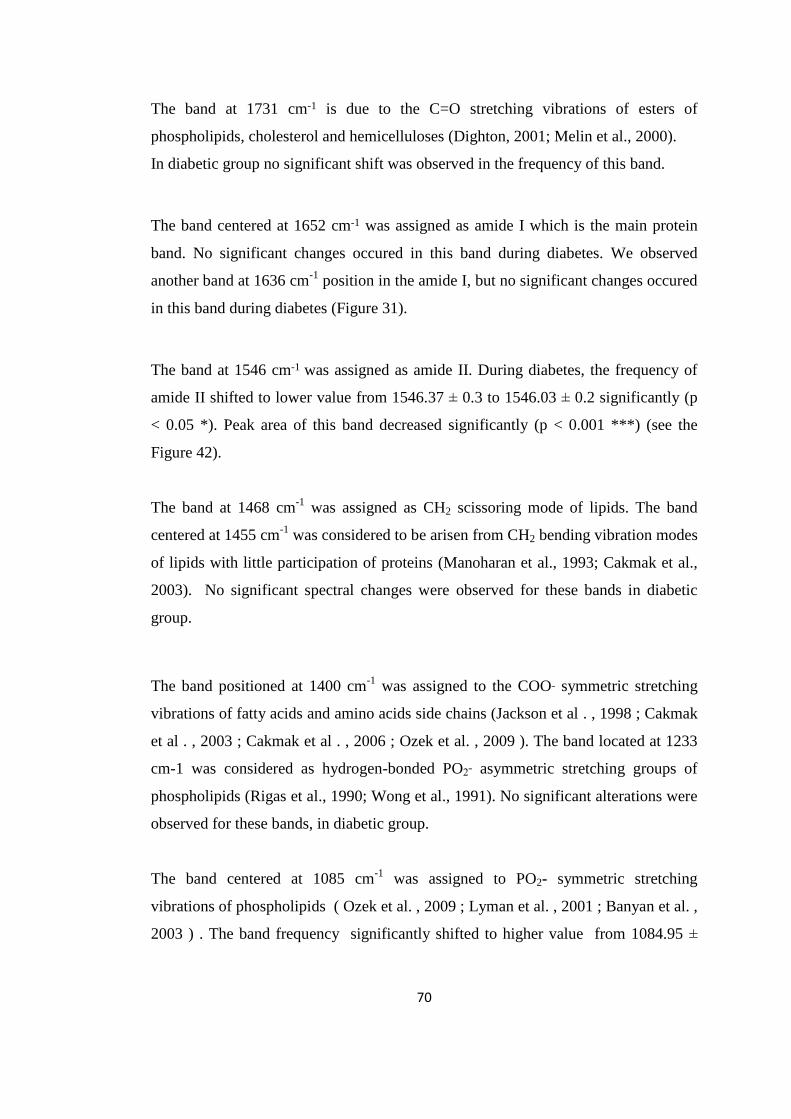
70
The band at 1731 cm-1 is due to the C=O stretching vibrations of esters of
phospholipids, cholesterol and hemicelluloses (Dighton, 2001; Melin et al., 2000).
In diabetic group no significant shift was observed in the frequency of this band.
The band centered at 1652 cm-1 was assigned as amide I which is the main protein
band. No significant changes occured in this band during diabetes. We observed
another band at 1636 cm-1
position in the amide I, but no significant changes occured
in this band during diabetes (Figure 31).
The band at 1546 cm-1 was assigned as amide II. During diabetes, the frequency of
amide II shifted to lower value from 1546.37 ± 0.3 to 1546.03 ± 0.2 significantly (p
< 0.05 *). Peak area of this band decreased significantly (p < 0.001 ***) (see the
Figure 42).
The band at 1468 cm-1
was assigned as CH2 scissoring mode of lipids. The band
centered at 1455 cm-1
was considered to be arisen from CH2 bending vibration modes
of lipids with little participation of proteins (Manoharan et al., 1993; Cakmak et al.,
2003). No significant spectral changes were observed for these bands in diabetic
group.
The band positioned at 1400 cm-1
was assigned to the COOˉ symmetric stretching
vibrations of fatty acids and amino acids side chains (Jackson et al . , 1998 ; Cakmak
et al . , 2003 ; Cakmak et al . , 2006 ; Ozek et al. , 2009 ). The band located at 1233
cm-1 was considered as hydrogen-bonded PO2ˉ asymmetric stretching groups of
phospholipids (Rigas et al., 1990; Wong et al., 1991). No significant alterations were
observed for these bands, in diabetic group.
The band centered at 1085 cm-1
was assigned to PO2- symmetric stretching
vibrations of phospholipids ( Ozek et al. , 2009 ; Lyman et al. , 2001 ; Banyan et al. ,
2003 ) . The band frequency significantly shifted to higher value from 1084.95 ±

71
0,75 cm-1
to 1085.82 ± 0.96 cm-1
(p < 0.05*). The band area decreased
insignificantly.
The band at 1045 cm-1 was considered as C-O stretching vibration modes of
polysaccharides (Melin et al., 2000; Toyran et al., 2006; Cakmak et al., 2006). The
frequency of this band shifted to a lower value insignificantly. However, the area
under this band increased significantly ( p < 0.001 *** ).
The band located at 972 cm-1 was assigned to symmetric stretching‘s of dianionic
phosphate monoesters (Ci et al ,1999 ; Chiriboga et al. , 2000 ; Cakmak et al. , 2003)
and ribose-phosphate main chain vibrations of the RNA backbone ( Banyay et al. ,
2003, Tsuboi et al. ,1969 ). No significant variations were observed for this band in
diabetic group.
3.3 Effect of Selenium on Diabetic Rat Kidney Plasma Membranes
We have discussed the effect of diabetes on healthy kidney plasma membranes in
previous parts of the study. The alterations of the diabetic kidney cell membranes
caused by Selenium will be summarized in this part. The changes in the band
frequency, band area and bandwidth values of selenium treated diabetic groups
against diabetic group will be discussed in detail. Table 2, 3 and 4 include all data.
3.3.1 The Effect of Selenium on Diabetic Rat Kidney Plasma membranes in the
C-H region
The figure 32 represents comparison of spectra among all groups in the C-H
strecthing region. The frequency of olefin band slightly shifted to lower value in both
high selenium treated and low selenium treated diabetic groups with respect to
diabetic group. However, the frequency of selenium treated group at medium dose
shifted significantly to high value from 3013.25 ± 2.32 cm-1
to 3017 ± 0, 007 cm-1
(p
<0.05 ‡). The band area of this band increased significantly in high and medium dose
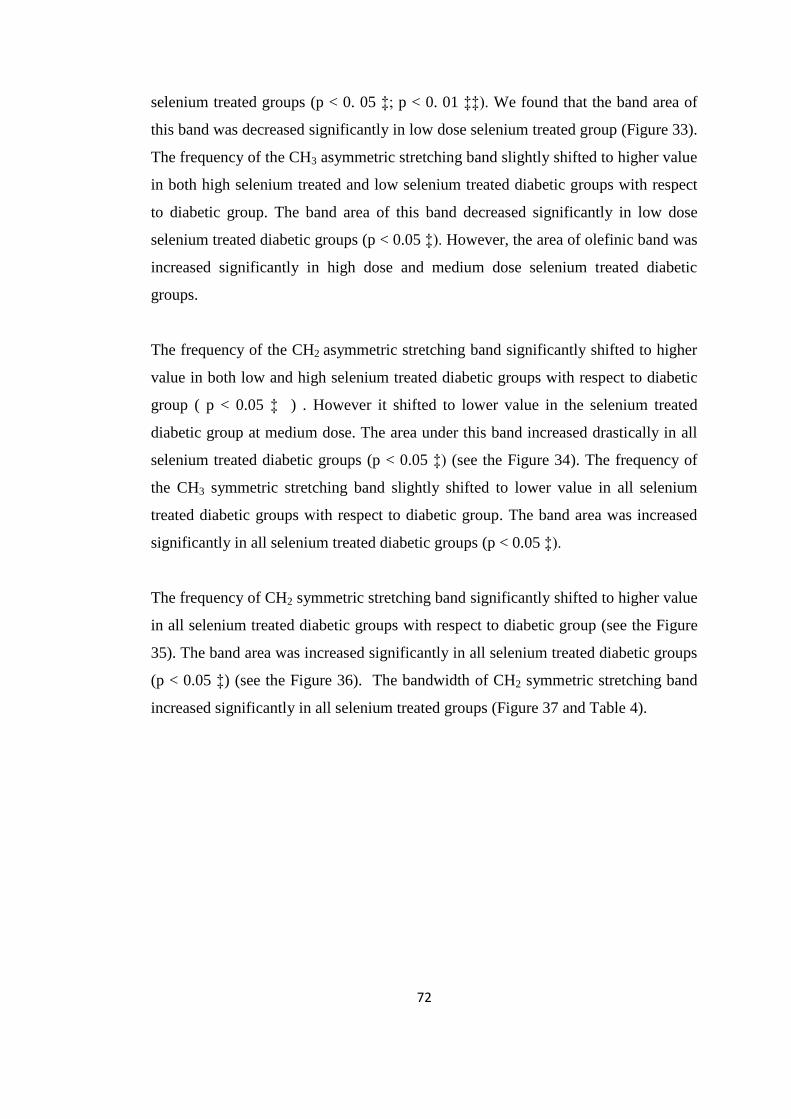
72
selenium treated groups (p < 0. 05 ‡; p < 0. 01 ‡‡). We found that the band area of
this band was decreased significantly in low dose selenium treated group (Figure 33).
The frequency of the CH3 asymmetric stretching band slightly shifted to higher value
in both high selenium treated and low selenium treated diabetic groups with respect
to diabetic group. The band area of this band decreased significantly in low dose
selenium treated diabetic groups (p < 0.05 ‡). However, the area of olefinic band was
increased significantly in high dose and medium dose selenium treated diabetic
groups.
The frequency of the CH2 asymmetric stretching band significantly shifted to higher
value in both low and high selenium treated diabetic groups with respect to diabetic
group ( p < 0.05 ‡ ) . However it shifted to lower value in the selenium treated
diabetic group at medium dose. The area under this band increased drastically in all
selenium treated diabetic groups (p < 0.05 ‡) (see the Figure 34). The frequency of
the CH3 symmetric stretching band slightly shifted to lower value in all selenium
treated diabetic groups with respect to diabetic group. The band area was increased
significantly in all selenium treated diabetic groups (p < 0.05 ‡).
The frequency of CH2 symmetric stretching band significantly shifted to higher value
in all selenium treated diabetic groups with respect to diabetic group (see the Figure
35). The band area was increased significantly in all selenium treated diabetic groups
(p < 0.05 ‡) (see the Figure 36). The bandwidth of CH2 symmetric stretching band
increased significantly in all selenium treated groups (Figure 37 and Table 4).

73
Figure 32.The representative comparison of the Control, Diabetic and Selenium treated diabetic
groups of rat kidney plasma membrane at the C-H region ( 3020-2800 cm -1
) .

74
Figure 33.The comparison of Olefinic band area (3011 cm-1)
between the control, diabetic and
selenium treated groups. *, ‡ show significances of p < 0.05, ***, ‡‡‡ show significance of p <
0.001.
Figure 34.The comparison of CH2 asymmetric stretching band area (2923 cm-1)
between the control,
diabetic and selenium treated groups. The degree of significance was donated as *, ‡ P < 0, 05. The
Selenium treated groups were compared with respect to diabetic group.
0
0,002
0,004
0,006
0,008
0,01
0,012
0,014
Control Diabetic HDSe MDSe LDSe
Inte
grat
ed
Ban
d A
rea
Area of Olefinic Band
‡‡‡
‡
0
0,2
0,4
0,6
0,8
1
Control Diabetic HDSe MDSE LDSe
Inte
grat
ed
Ban
d A
rea
CH 2 asym
***
‡
‡ ‡
***

75
Table 4.Numerical summary of the detailed differences in the bandwidths of the control and treated
groups. The values are the means ± SEM for each group. Man-Whitney U-test was used to compare
the groups. The degree of significance was donated as *, ‡ P < 0.05; **, ‡‡ P < 0.01 and ***, ‡‡‡ P <
0.001. The upward arrow indicates an increase and the downward arrow indicates a decrease. Diabetic
group was compared with respect to the control group. Selenium treated groups were compared with
respect to the diabetic group.
Bands
Control
(n=10)
Diabetic
(n=7)
HDSE
(n=5)
MDSE
(n=8)
LDSE
(n=8)
CH₂
ASYM 9,44 ± 3,03 8,89 ± 3,68 ↓ 7,61 ± 3,69 ↓ 9,07 ± 3,46 ↑ 9,08 ± 3,07 ↑
CH₂
SYM 9,64 ± 3,89
6.97 ± 1,73 ↓
*
10,13 ± 0,6 ↑
‡‡
9,08±0.2 ↑
‡‡
11,68 ± 4,4 ↑
‡‡‡
Figure 35.The comparison of the CH2 symmetric stretching band frequency between all groups. The
degree of significance was donated as *, ‡ P < 0.05. The Selenium treated groups were compared
with respect to diabetic group.
2851
2851,5
2852
2852,5
2853
2853,5
2854
Control Diabetic HDSe MDSe LDSe
WA
VEN
UM
BER
(cm
-1)
CH2 SYM BAND FREQUENCY
**
‡ ‡‡

76
Figure 36. The comparison of the CH2 symmetric stretching band area between all groups. The degree
of significance was donated as *, ‡ P < 0.05; **, ‡‡ P < 0.01 and ***, ‡‡‡ P < 0.001. The Selenium
treated groups were compared with respect to diabetic group.
Figure 37.The comparison of bandwidth values of the CH2 symmetric bands among the control
diabetic and selenium treated groups. Man-Whitney U-test was used to compare the groups. The
degree of significance was donated as *, ‡ P < 0.05; **, ‡‡ P < 0.01 and ***, ‡‡‡ P < 0.001. The
Selenium treated groups were compared with respect to the diabetic group.
The ratio of the CH2 symmetric band area to the CH3 symmetric band area was
decreased in high and mmedium dose groups. Whilst, it increased significantly in the
low dose group ( p < 0.001 ‡‡‡ ). The ratio of the CH2 asymmetric band area to the
CH3 symmetric band area significantly decreased in high and medium dose groups (p
0
0,1
0,2
0,3
0,4
Control Diabetic HDSe MDSe LDSe
Inte
grat
ed B
and
Are
a
CH 2 SYM‡
‡‡
***
0
2
4
6
8
10
12
14
Control Diabetic HDSe MDSe LDSe
Ban
dw
idth
cm
-1
CH 2 SYM
*‡ ‡ ‡ ‡
‡ ‡ ‡

77
< 0.001 ‡‡‡). However, it increased significantly in low dose group (p < 0.001 ‡‡‡)
(Figure 26).
The ratio of the areas of the CH2 asymmetric and symmetric bands to the area of the
CH3 symmetric band decreased significantly in high and mmedium dose groups (p <
0.001 ) .We observed a significant increase in this ratio in low dose group (p < 0.001
‡‡‡) when compared to the diabetic group (Figure 28).
From the Figure 30 and Table 6 we can see that the lipid to protein ratios
significantly increased in all selenium treated groups (P < 0.01 and P < 0.001 ) .

78
Table 5.The summary of the differences of lipid-to-protein ratios between the control, diabetic and
treated groups for kidney brush-border plasma membranes. The values are the means ± SEM for each
group. Man-Whitney U-test was used to compare the groups. The degree of significance was donated
as *, ‡ P < 0.05; **, ‡‡ P < 0.01 and ***, ‡‡‡ P < 0.001. The upward arrow indicates an increase and
the downward arrow indicates a decrease. The diabetic group was compared with respect to the
control group. The Selenium treated groups were compared with respect to the diabetic group
Ratio of Peak
Areas
Control Diabetic HDSe MDSE LDSe
(Lipid to
Protein)
(n=10) (n=8) (n=5) (n=8) (n=8)
CH2SYM /
CH3SYM
1,35 ±
0,12
1,26 ± 0,45 ↓ 1,25 ± 0,03 ↓ 1,18 ± 0,15 ↓ 1,73 ± 0,1 ↑
‡‡‡
CH2 ASYM /
CH3 SYM
7,52 ± 0,5 4,46 ± 0,5 ↓
***
2,94 ± 0,1 ↓
‡‡
2,62 ± 0,22 ↓
‡‡‡
6,19 ± 0,23 ↑
‡‡‡
CH2ASYM +
CH2SYM /
CH3SYM
8,67 ±
0,82
5,85 ± 0,72 ↓
***
4,19 ± 0,13 ↓
‡‡
3,8 ± 0,3 ↓ ‡‡‡ 7,92 ± 0,32 ↑
‡‡‡

79
Table 6.The summary of the differences of lipid-to-protein ratios between the control, diabetic and
treated groups for kidney brush-border plasma membranes. The values are the means ± SEM for each
group. Man-Whitney U-test was used to compare the groups. The degree of significance was donated
as *, ‡ P < 0.05; **, ‡‡ P < 0.01 and ***, ‡‡‡ P < 0.001. The upward arrow indicates an increase and
the downward arrow indicates a decrease. Diabetic group was compared with respect to control group.
The Selenium treated groups were compared with respect to the diabetic group.
Ratio of
Peak Areas
Control Diabetic HDSe MDSE LDSe
(Lipid to
Protein)
(n= 8) (n=8) (n=5) (n=8) (n=8)
CH2 ASYM +
CH2SYM /AMIDE I
1,65 ± 0,37 0,08 ± 0,03 0,74 ± 0,13 1,39 ± 0,12 0,9 ± 0,16
↓ *** ↑ ‡‡ ↑ ‡‡‡ ↑ ‡‡‡
Based on these spectral differences cluster analysis was performed to see spectral
differences of the C-H region of all groups as displayed in figure 38.

80
Figure 38.Hierarchical clustering of all groups of kidney cell membrane using second derivative
spectra (spectral range: 3020- 2800 cm-1
).

81
As seen from this figure succesful separation of all groups was obtained.
3.3.2. The Effect of Selenium on Diabetic Rat Kidney Plasma membranes in the
Finger-Print region
The figure 39 represents comparison of spectra among all groups. The band at 1731
cm -1
significantly shifted to lower value from 1732.25 ± 0.4 cm-1
to 1730.34 ± 0.8
cm-1
in selenium treated diabetic group at high dose (p < 0.05). The area under this
band significantly increased in all selenium treated groups (p < 0.05).
The bands located between 1700- 1600 cm-1
correspond to amide I band. Under this
band, two peaks located at 1652 cm-1
and 1636 cm-1
were observed (Figure 40).
The frequency of amide I band significantly shifted to higher wavenumber values
from 1651.59 ± 0.4 cm-1
to 1652.97 ± 0.008 cm-1
in the medium dose selenium
group. The band area increased dramatically in high dose selenium group (p < 0.
005) however, the insignificant changes were observed in both the medium and low
dose selenium groups (figure 41).
The frequency of the band at 1636 cm-1
increased significantly in all selenium treated
groups (p < 0.05 *) (Table 2 and 3). The area under this band diminished in both
medium and low dose selenium groups (p < 0.05), however it increased in the
selenium group at high dose (p < 0.05) (see the Figure 40).
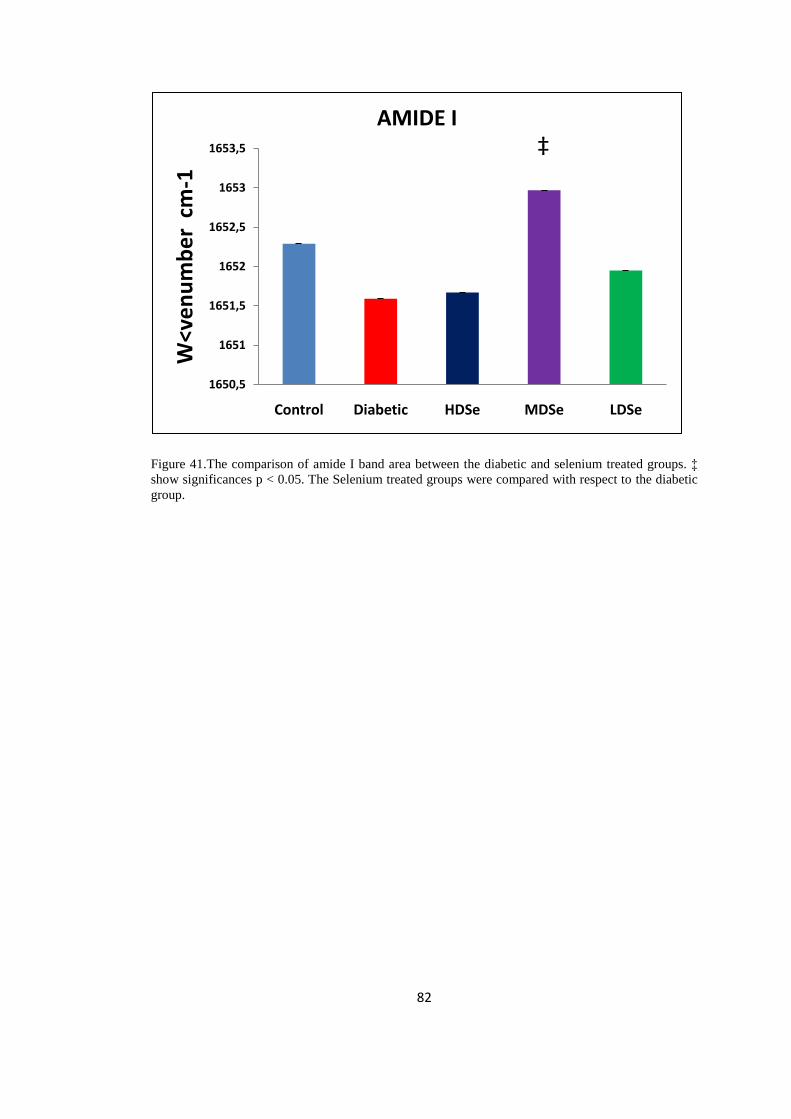
82
Figure 41.The comparison of amide I band area between the diabetic and selenium treated groups. ‡
show significances p < 0.05. The Selenium treated groups were compared with respect to the diabetic
group.
1650,5
1651
1651,5
1652
1652,5
1653
1653,5
Control Diabetic HDSe MDSe LDSe
W<v
en
um
be
r c
m-1
AMIDE I‡

83
Fig
ure
39
.Th
e re
pre
sen
tati
ve
com
par
iso
n o
f th
e in
frar
ed s
epct
ra o
f C
on
tro
l, D
iab
etic
an
d S
elen
ium
tre
ated
dia
bet
ic g
rou
ps
of
rat
kid
ney
pla
sma
mem
bra
ne
at F
ing
er-P
rin
t re
gio
n.

84
Fig
ure
40
.Th
e r
epre
sen
tati
ve
com
par
iso
n o
f th
e in
frar
ed s
pec
tra
of
amid
e I
ban
d b
etw
een a
ll g
roup
s.

85
Figure 42.The comparison of band area values of amide II band among groups. The degree of
significance were donated as *, ‡ P < 0.05 and ***, ‡‡‡ p < 0.001. The Selenium treated groups were
compared with respect to the diabetic group.
As can be seen from the table 2, 3 and 4, the frequency of amide II band dramatically
shifted to high values in both medium and low dose selenium-treated diabetic groups
(p < 0.05 ‡ ). The area under amide II band significantly increased in all the selenium
treated groups (p < 0.05 ‡) (see the Figure 42).
The band positioned at 1469. 47 ± 0.19 cm-1
in diabetic group significantly shifted to
lower value in the high and medium dose selenium-treated diabetic groups ( p < 0.05
‡ ) . The area under this band significantly increased in all selenium treated groups (p
< 0.05 ‡) (Table 2 and 3).
The band at 1455.06 ± 0.31 cm -1
significantly shifted to lower value for high dose
selenium group, however, significantly shifted to higher value in medium dose
selenium group ( p < 0.05 ‡ ). The band area broadened significantly in all selenium
treated groups (p < 0.05 ‡) (Table 2 and 3).
0
0,2
0,4
0,6
0,8
1
1,2
1,4
1,6
1,8
2
Control Diabetic HDSe MDSe LDSe
Inte
grat
ed
Ban
d A
rea
AMIDE II BAND AREA
‡
‡***
‡

86
The band centered at 1398.92 ± 1.86 cm -1
in diabetic group insignificantly shifted to
higher value in high dose selenium treated group and also shifted to higher value
significantly for medium and low doses of selenium ( p < 0.05 ‡ ) . The peak area
significantly elevated in all selenium treated groups (p < 0.05 ‡) (Table 2 and 3).
The band at 1233.59 ± 1.17 cm-1
in diabetic group significantly shifted to lower
value in selenium treated group at medium dose ( p < 0.05 ‡ ) . The area under this
band increased significantly for high and low doses of selenium, however we
monitored significant decrease in medium dose group ( p < 0.05 ‡ ) .
As seen from the table 2 and 3, the band at 1172. 34 ± 0.43 cm-1
did not vary
significantly, but this band shifted to higher value in medium dose selenium treated
group, significantly ( p < 0.05 ‡) . In addition we found that the frequency of this
band significantly shifted to lower value in low dose selenium treated group, ( p < 0.
05 ‡ ) . We observed insignificant variations in the band area for all groups.
The band located at 1085.82 ± 0.96 cm-1
significantly shifted to lower value in high
dose selenium group ( p < 0.05 ‡ ). The area of this band increased dramatically in
high and medium dose selenium treated groups (p < 0.05 ‡).
The band centered at 1045.78 ± 0,18 cm-1 was significantly shifted to lower value in
high dose and medium dose selenium groups ( p < 0.05 ‡ ) . In low dose group this
observation was insignificant. The peak area of this band increased in high dose
selenium group (p < 0.05 ‡). We found insignificant increase in other selenium
treated groups (Table 2 and 3).
The band located at 972. 45 ± 1.13 cm -1 did not change significantly in all groups.
However, the area of this band significantly increased in high and medium dose
selenium group ( p < 0.05 ‡ ).
Based on these spectral differences cluster analysis was performed to see spectral
differences of finger-print region of all groups as displayed in figure 43.
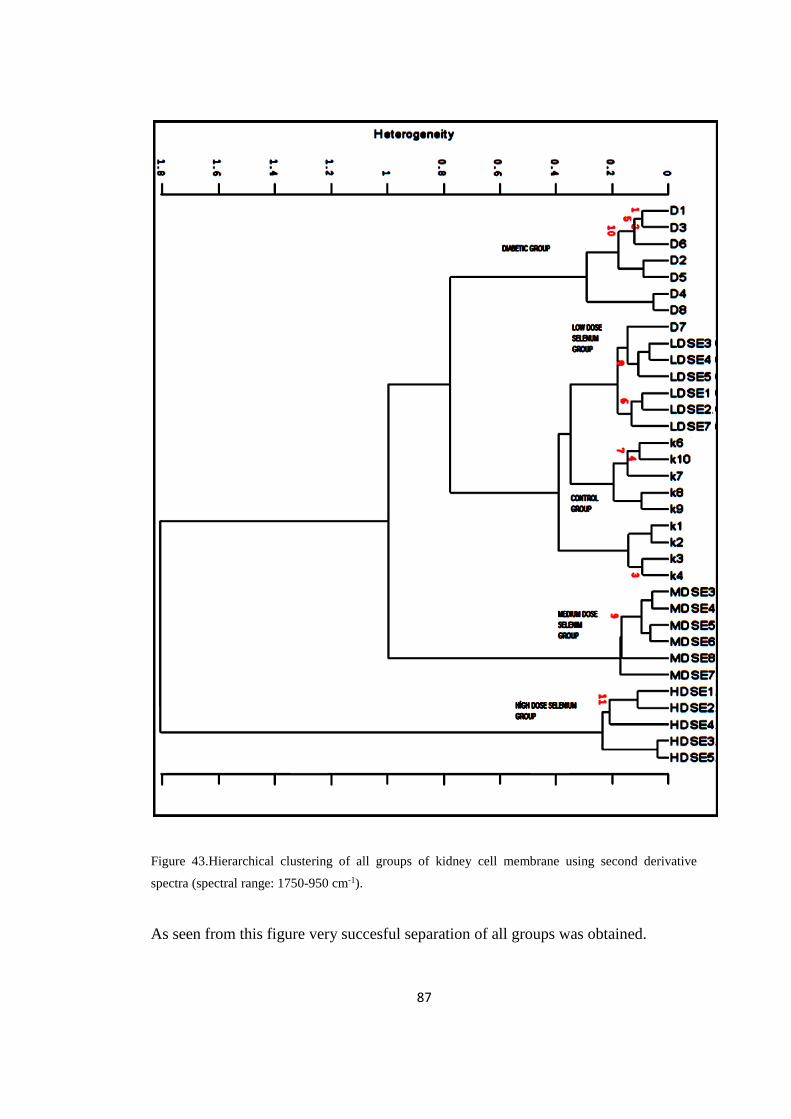
87
Figure 43.Hierarchical clustering of all groups of kidney cell membrane using second derivative
spectra (spectral range: 1750-950 cm-1).
As seen from this figure very succesful separation of all groups was obtained.

88
3.4 The Second Derivative Secondary Structure Analysis of Main Protein Band
(Amide I band).
In order to identify the secondary structural changes of the rat brush-border kidney
plasma membrane protein content, amide I was analyzed in detail in this part of the
study. Table 7 summarizes the all data of related to the amide I band which includes
assignment of the sub-bands and their intensityy values. As can be seen from Figure
44 also, the seven different types of secondary structures are identified.

89
Figure 44.The representative second derivative infrared spectrum of amide I band of control brush-
border plasma membrane at 1700-1
600 cm -1
region.
A
B
AMIDE I

90
Figure 45.The comparison of second derivative of the amide I band in the average infrared spectraa of
the control and diabetic group at 1700-1600 cm -1
region.
As seen from the Table 7, the antiparallel ß sheet content of the diabetic samples
drastically increased (p < 0.01 ) . In contrast, all selenium treated diabetic groups
show dramatic decrease in this value toward the control group (p < 0.001). The area
under the band of turns also increased significantly in diabetic group ( p < 0.001 )
and decreased drastically in all selenium treated diabetic groups (p < 0.01 ) ( Figure
45 and Table 7 ).
Futhermore, the α helix content significantly increased in diabetic group ( p < 0.001 )
and decreased significantly in the other groups ( p < 0.01 ). As shown in Figure 45

91
the random coil band was identified only in diabetic group at 1642 cm-1
. No
significant variations were observed for all the other bands.
Table 7.Intensity changes of the main protein secondary structures between the control, diabetic and
treated groups for kidney brush-border plasma membranes. The values are the means ± SEM for each
group. Man-Whitney U-test was used to compare the groups. The degree of significance was donated
as *, ‡ P < 0.05; **, ‡‡ P < 0.01 and ***, ‡‡‡ P < 0.001. The upward arrow indicates an increase and
the downward arrow indicates a decrease. Diabetic group was compared with respect to the control
group. The Selenium treated groups were compared with respect to the diabetic group.
92
CHAPTER 4
DISCUSSION
Diabetes Mellitus is a metabolic disturbance affecting entire body, because of
developed insulin resistance or autoimmune loss of insulin producing ß cells.
Complications of this disease possess more harm than diabetes itself. These
complications may damage eyes, nerves, heart, testes and kidneys. The dysfunction
of above mentioned vital organs may lead to disability in diabetic patients or even to
death. Among these organs the kidneys seriously harmed from diabetes. In developed
countries the diabetic kidney disease is the major cause of renal insufficiency and
leads to high financial cost. Up to now, very few studies were performed to
investigate the diabetic nephropathy. Until recently, it was proposed there are several
pathogenetic mechanisms related to diabetic complications. Unfortunately the exact
molecular mechanisms explaining underlying causes of diabetic complications are
still unknown.
The proposed mechanisms associated directly to diabetic complications include
increased polyol pathway flux, increased hexosamine pathway, increased formation
of advanced glycation end products (AGEs) and activation of protein kinase C (PKC
) pathway. All these pathways are related to oxidative stress directly or indirectly.
Oxidative stress is an important feature of diabetic complications. Free radicals can
mediate the addition and subtraction of DNA nucleotide bases leading to DNA
mutations. Consequently DNA cannot direct protein and fatty acid synthesis. In
addition, increased ROS production as a consequence of diabetes oxidizes and
inactivates enzymes and molecules of above mentioned pathways opening way to
new diseases besides diabetes. These disorders are called diabetic complications.
Many strategies have been used to target the disturbance in oxidative balance of the

93
body to treat diabetes and diabetic complications. The most common researches are
focused on antioxidants and its components. The great majority of these studies
reported that, selenium administration improved the antioxidant levels and protects
the body from diabetes ( Stachouse et al. , 1990; Douillet et al. ,1996 ; Stapleton ,
2000 ; Turan et al. , 2007 ).
In our study FTIR spectroscopy was used to determine the structural and functional
alterations of kidney plasma membrane resulted from diabetes mellitus and to
monitor effect of selenium as an antioxidant on diabetes disease state. More precisely
the changes caused by diabetes on kidney plasma membrane apical side (brush-
border membrane) resulted from diabetes was monitored, in detail. The study can be
divided into two parts. In the first part, we investigated the macromolecular
alterations in the diabetic kidney plasma membrane. Alterations in membrane
protein, lipid and carbohydrate content were monitored in this part. In the second part
we studied the proposed therapeutic effects of selenium. Different doses of selenium
were used to reveal the effects of selenium on stz-induced diabetic kidney disease
using ATR- FTIR spectroscopy.
In infrared spectroscopic analysis, the intensity or band area of the bands in
absorption spectra give information about the concentration of related functional
groups (Freifelder, 1982; Toyran and Severcan, 2003; Toyran et al., 2004).
The C-H region at spectra ( 3050-2800 cm-1
) is composed of olefinic = CH, - CH2
and CH3 groups of C-H stretching vibrations which, originates from lipid molecules (
Severcan et al., 2000; Severcan et al., 2003; Cakmak et al., 2006 ) . The C-H
stretching vibrational modes of HC - CH groups give absorption at 3011cm-1
position
and called olefinic band. The band area of olefinic band gives information about the
unsaturation state of acyl chains (Takahashi et al., 1991; Liu et al., 2002; Severcan et
al., 2005). Increased lipid peroxidation may be caused by loss of unsaturation (Sills
et al., 1994; Kinder et al., 1997). The area of olefinic band increased significantly in
diabetic group showing that lipid peroxidation end products occurred during diabetes
(Severcan et al., 2005). Our results also revealed that low dose selenium treatment

94
restored lipid peroxidation in diabetes. In contrary, high dose and medium dose
selenium administration increased lipid peroxidation in diabetes. Our experiments
with low dose selenium treatment confirmed the previous studies reporting that
selenite administration considerably lowered the extent of lipid peroxidation
(Mukherjee et al., 1998). Lipid order parameter can be determined by the monitoring
of frequency changes of CH2 stretching vibrations (Liu et al., 2002; Mantsch, 1984;
Severcan et al., 1997). In our study, CH2 stretching band frequency shifted to lower
value indicating that the system became more ordered during diabetes. The ordered
membrane lipids mean that there are increased dose of trans / gauche conformers that
may cause more rigid membrane structure.
Free radicals may be responsible for membrane rigidity. In contrary, we monitored
shifting of the CH2 stretching band frequencies to higher values in all Selenium
treated diabetic groups. This observation can be interpreted as decrease of order state
and membrane rigidity during selenium treatment of diabetes.
The areas of CH3 asymmetric (2962 cm-1
), CH2 asymmetric (2923 cm-1
) and CH2
symmetric (2853 cm -1
) bands can give information about membrane lipid content.
In diabetic state the areas of these bands decreased significantly, suggesting that the
lipid concentration decreased during diabetes. However, we found significant
increase in band areas for selenium treated diabetic groups, which implies that the
selenium has recovery effect on lipid content of diabetic kidney plasma membrane
by approaching it to the control values. Supporting this, in addition, we revealed a
decrease in the band areas of other bands related to lipids namely CH2 scissoring
band (1468 cm-1
) and CH2 bending band (1455 cm-1
) in the diabetic group. However,
in Selenium treated diabetic groups, the areas of these bands increased significantly
towards the control values. It was previously reported that, treatment of diabetic
animals or rat hepatocytes in culture with selenate restored the expression of FAS
and G & PDH indicating that selenate is capable of stimulating lipogenesis in the
liver (Ghosh et al., 1994; Shepherd et al., 1995). Our findings confirmed the referred
studies because we also found that the selenium treatment stimulates lipogenesis.

95
The ratio of the areas of the CH2 symmetric and asymmetric stretching bands and the
sum of the areas of these bands to the area of the CH3 symmetric stretching band
lowered in diabetic group, indicating that the lipid concentration decreased more
profoundly than protein content in diabetic condition. However, we observed
dramatic increase of these ratios in low dose selenium treated diabetic group. In low
dose selenium treated diabetic group the values were similar with the control values.
These findings suggest that, in diabetic state, in order to restore lipid concentrations,
the low doses of selenium can be used. In addition, the sum of the areas of CH2
symmetric and asymmetric stretching bands to the area of the Amide I band lowered
in diabetic group, however this value increased in all selenium treated groups. This
indicates that, selenium treatment restored the lipid content in diabetic kidney brush-
border plasma membrane. To sum up it can said that the low dose selenium treatment
improved the lipid profile of renal brush-border plasma membrane.
Membrane dynamics can be determined by monitoring the bandwidths of CH2
stretching bands ( Mantsch, 1984 ; Lopez-Garcia et al. ,1993 ; Severcan et al. , 2003 ;
Severcan et al. , 2005 ) . The increase in the bandwidths of these bands implies an
increase in membrane dynamics (Levin et al., 1990; Severcan et al., 1999; Severcan
et al., 2005; Korkmaz and Severcan, 2005). We have observed a decrease in the
bandwidth of CH2 symmetric band in diabetic group suggesting that membrane
dynamics decreased in diabetic groups. In all selenium treated diabetic groups we
found an increase in the CH2 symmetric bandwidth values indicating that selenium
restored diabetes-induced variations in membrane dynamics of diabetic kidney
brush-border plasma membranes toward the normal values (see the Figure 37).
The band located at 1731 cm-1
belongs to carbonyl stretching vibrational modes of
lipids. This band emerges from ester groups of phospholipids and cholesterol esters
(Jackson, 1998; Dighton, 2001). According to our results the band frequency in
diabetic group slightly shifted to higher values, indicating a decrease in the strength
of hydrogen bonding (dehydration). We found significant shifting of this band
frequency to the lower value in high dose selenium treated group, so we suggest that
selenium administration in diabetes removes the excess amounts of hydrogen bonds

96
from the system. Band area of the C=O ester band increased dramatically in all
selenium treated diabetic groups indicating that, the membrane phospholipids content
elevated as a result of selenium treatment. The area of this band did not change
during diabetes.
To support our results, the studies reported that, selenate treatment improved the
plasma lipid levels, the cholesterol, triglycerides and free fatty acids of diabetic
animals (Battell et al., 1998). Also selenium and selenium + L-arginine combination
showed significant increase in plasma HDL-cholesterol level in diabetic rats (Nader
et al., 2007).
Amide I and Amide II bands are very informative for monitoring proteins secondary
structures (Haris and Severcan, 1999; Jackson and Smith, 1999; Lyman et al., 1999).
The band located at 1652 cm-1
belongs to amide I band of proteins. In addition the
band at 1546 cm-1
assigned to amide II protein band. Amide I band is mainly due to
C=O stretching (%80) and C-N stretching. Amide II arises from N-H bending ( %60
) and C-N stretching ( %40 ) of proteins ( Haris and Severcan, 1999 ; Melin et al.,
2000 ; Takahashi et al., 1991 ; Wong et al., 1991 ; Cakmak et al., 2006 ) . The band
frequencies of Amide I and Amide II shifted to lower value in diabetic group
indicating that the changes in protein conformation occurred during diabetes.
Amide II band assigned to α-helix structures of proteins and shifting to lower
frequency value can be interpreted as elevated amounts of random coil structures (
Melin et al. , 2000 ; Spassov et al. , 2006 ; Dousseau and Pezolet ,1990 ) . According
to our findings, in diabetic state, the proteins native conformational structure changed
with the increased formation of random coil. This indicates protein denaturation.
Interestingly, we observed shifting to higher values of amide II band frequency in all
selenium treated diabetic groups, demonstrating that, the process of denaturation in
diabetic kidney plasma membrane proteins recovered with the selenium
administration. In case of high dose selenium treated diabetic group we monitored
significant increase of amide I band area, demonstrating that the protein content was
normalized with the administration of selenium.

97
Amide II band area decreased in diabetic group. This result draw such a conclusion
that, the protein degradation occurred in kidney plasma membranes during diabetes.
However, selenium treatment as displayed with increased band areas improved the
situation.
The bands at 1468 cm-1
and 1455 cm-1
originates from CH2 scissoring and CH2
bending vibrational modes of lipids respectively ( Severcan et al, 2000 ; Severcan et
al. , 2003 ; Cakmak et al. , 2006 ) . The frequency of CH2 bending band shifted to
lower value in all selenium treated diabetic groups. We observed that, the order
parameter of these lipids decreased as a result of selenium treatment. The area of
these bands increased which means the increased lipid content as a result of selenium
treatment. Studies have shown that the tissue lipids, peroxides and fatty acids are
normalized to in diabetic animals with the administration of selenium (Douillet et al.,
1998).
The band positioned at 1400 cm-1
originates from the COO- symmetric stretching
vibrations of amino acids side chains and fatty acids (Jackson et al., 1998; Cakmak et
al., 2003). The band area decreased in diabetic group indicating the decreased
amounts of amino acids and fatty acids on the diabetic kidney plasma membrane. In
contrary, the area of this band was increased in all selenium treated diabetic groups.
We suggest that the content of amino acids and fatty acids on the diabetic kidney
plasma membrane increased with the administration of selenium.
It was demonstrated that selenate can act as a potent insulin-like agent (Ezaki et al.,
1990). The healing effect of insulin on diabetes is well-known. Selenium and
Vanadate mimics the insulin in regard to glycolysis, gluconeogenesis, fatty acid
synthesis and pentose–phosphate pathway (Bosch et al, 1990; Miralpeix et al., 1991;
Johnson et al., 1990).
Insulin plays a role in the facilitating the entry of amino acids into cells for protein
synthesis, increases nucleic acid synthesis, stimulates Na+ /K+ ATPase, controls the
expression of large number of genes and upregulates the glucose uptake via glucose
98
transporters. Selenium as an insulin mimetic translocates the glucose transporters
(GLUT1 and GLUT2) to the membrane surface. At the same time, facilitation of
aerobic and anaerobic glycolysis was observed (Furnsinn et al., 1996). As a result,
an excess amount of glucose is taken away from the plasma into the cells. Insulin
also regulates the transcription of genes for several key enzymes related to
carbohydrate and fatty acid metabolism (O‘Brien et al., 1996).
The PO2- asymmetric and symmetric stretching bands positioned at 1233 cm
-1 and
1084 cm-1
respectively emerges from the phosphate stretching‘s of phospholipids
head groups ( Lyman et al. , 2001 ; Banyay et al. , 2003 ) . The phosphate
stretching‘s deliver the information about the phospholipids head groups located on
the non-polar interface of membrane (Mendelsohn and Mantsch, 1986). The
frequency of the PO2- symmetric stretching‘s shifted to high value in diabetic group.
This indicates that during the diabetes the PO2 groups of phospholipids are
dehydrated compared to healthy membranes. In contrary, we monitored that the PO2
asymmetric and symmetric band frequencies in all selenium treated diabetic groups
shifted to lower values. These results demonstrate that the selenium restored the
situation by hydrating the system.
The area of PO2 asymmetric stretching band increased in all selenium treated
animals, indicating the elevation of the phospholipids content. We suppose that, as
selenium treatment in diabetes can elevate the phospholipids concentrations so
selenium positively affects the phospholipids content of diabetic kidney plasma
membranes.
The bands located at 1171 cm-1
and 1045 cm-1
are emerged from glycogen,
glycolipids and polysaccharides ( Lyman et al. ,1999 ; Rigas et al. ,1990 ; Cakmak et
al. , 2003 ; Cakmak et al., 2006 ). The band at 1171 cm -1
was assigned to C-O-O-C
asymmetric stretching‘s of glycogen. The band at 1045 cm-1
was assigned to CO-
stretching‘s of glycolipids and polysaccharides. The frequency of 1171 cm-1
band
shifted to higher value significantly in medium dose selenium treated group
indicating that the hydrogen bonds of glycogen are increased in plasma membranes

99
due to medium doses of selenium. So the medium doses of selenium negatively
affected the glycogen levels in plasma membrane. However, the frequency of this
band shifted to lower value significantly in low dose selenium treated group,
indicating that the low doses of selenium restores the variation in the hydrogen bonds
of glycogen in plasma membrane.
The increased area of 1045 cm-1
band in all selenium treated diabetic groups
indicates increased amounts of glycolipids and polysaccharides in the system.
However in diabetic group increased amounts of glycolipids and polysaccharides
were also monitored. The frequency of this band shifted to lower values in selenium
treated groups exhibiting that, the hydrogen bonds decreased in glycolipids and
polysaccharides. Several studied demonstrated that, oral administration of selenite to
diabetic animals partly reversed abnormal liver expression of glycogenic and
glyconeogenic enzymes (Becker et al., 1996). Our findings are in agreement to some
extent with previous studies.
The band at 972 cm-1
was considered to be arisen from the symmetric stretching
modes of dianionic phosphate monoesters (Ci et al. , 1999 ; Chiriboga et al. , 2000 ;
Cakmak et al. , 2003 ) and ribose-phosphate main chain vibrations of the RNA
backbone ( Banyay et al. , 2003 ; Tsuboi et al. , 1969 ) . The frequency of this band
shifted to higher value in diabetic animals exhibiting conformational changes in these
molecules. It was revealed that, in selenium treated groups the frequency shifted to
lower values. We observed that structural variations in the phosphate monoesters and
ribose-phosphates were restored with selenium treatment.
Area of this band was decreased in diabetic group demonstrating that the content of
the phosphate monoesters and ribose-phosphate main chains decreased during
diabetes. On the contrary, the area of this band increased in all selenium treated
diabetic groups. We monitored that, selenium treatment elevated the concentration of
phosphate monoesters and ribose-phosphate main chains.

100
In order to disclose the effect of diabetes and selenium on kidney plasma
membranes, the Amide I main protein band was examined, in detail. We conducted
the secondary structure analysis of amide I band for clarifying the structural
conformational alterations of kidney plasma membrane proteins using FTIR
spectroscopy. Antiparallel ß-sheet structure can be identified by the presence of
band near 1670–1695 cm -1
. This component is normally weak and its precise
assignment is often made difficult by the overlap of absorption from ß-turn and
unordered structures ( Hares et al. , 1999 ) .
Antiparallel ß sheet and α-helix content dramatically elevated in diabetic kidney
plasma membranes. In addition, amide I band area located at 1652 cm-1
increased
slightly confirming the elevation of contents of antiparallel ß sheet and α-helix.
These results show that the proteins of diabetic kidney brush-border plasma
membrane are predominantly α-helix.
We suggest that, the diabetes caused enormous increase in membrane proteins
synthesis and folding properties. On the contrary, in all selenium treated diabetic
plasma membranes we monitored drastically decrease of intensities of antiparallel ß
sheet and α-helix. According to our results it is obvious that, selenium administration
in diabetes has reversed enormous increased protein synthesis and folding toward the
normal levels. The intensities of turns in diabetic group increased significantly
supporting above mentioned abnormal increase in antiparallel ß sheet and α-helix
secondary structures. In selenium treated diabetic plasma membranes the intensities
of turns decreased significantly, proving that selenium restored the proteins
secondary structures of diabetic membranes. We found that only in diabetic group
the random coil band was apparent. However in control and in selenium treated
groups this band was not observed. The manifestation of random coil band indicates
the denaturation of membrane proteins. We observed that, the selenium treatment has
completely reversed the denaturation process toward control values.

101
The ß sheet content was decreased slightly in diabetes; however, the intensities of
these bands were increased in all selenium treated groups. This observation makes a
sense that during diabetes the aggregated ß sheet and ß sheet was conversed to
random coil structure, so we monitored decreased amounts of aggregated ß sheet and
ß sheet. In addition, selenium treatment increased the aggregated ß sheet and ß sheet
content indicating that the random coil structure has conversed to aggregated ß sheet
and ß sheet.
Insulin has an important action on cell signaling pathway (Kahn et al., 1993). Also
selenite as similar to insulin have been shown to activate the MAP kinase signaling
pathway ( Stapleton et al. , 1997 ; Stapleton et al. , 1998 ; Hei et al. , 1998 ) . To sum
up, the altered protein synthesis and folding due to diabetes can be reversed as a
result of antioxidant and insulin-like properties of selenium.
As our results supports the majority of previously reported studies, we can conclude
that, during diabetes the protein content of membranes was enormously increased
and proteins are severely denatured. However selenium administration in diabetes
restored the protein content. It is obvious that the process of denaturation
considerable reversed towards the control value as a result of selenium treatment.
Despite the fact that the selenium compounds can be used as antidiabetic agent in
therapy, the administered dose should be handled carefully. In this study, we could
not differentiate between three doses of selenium given to diabetic rats. Future
investigations are necessary for selection of optimal doses of this trace element
before it can safely be used in therapy for diabetes and diabetic nephropathy. In
addition the detailed structural alterations caused by diabetes and selenium effect on
diabetic structural alterations in the kidneys should be studied.

102
To sum up, the early alterations in the kidneys due to diabetes could be diagnosed
with the help of spectroscopic techniques, which is difficult to determine with the
usage of nowadays clinical data. Spectral changes such as lipid to protein ratio,
protein secondary structure and lipid content can be used in this manner. In future,
we hope, it will be possible to put a diagnosis of the early diabetes in the kidneys via
the FTIR spectroscopy.

103
CHAPTER 5
CONCLUSION
The current study firstly demonstrated the significant changes happened in kidney
brush-border plasma membranes due to STZ-induced type I Diabetes via ATR-FTIR
spectroscopy. Equally, some protective and curable role of selenium in Diabetes was
uncovered.
The detailed spectral analysis of ATR-FTIR spectroscopy was revealed the following
remarks:
The protein and lipid content of diabetic kidney plasma membrane was prominently
diminished. This shows that the lypolysis and lipid peroxidation occurred during
diabetes. Nevertheless, the administration of selenium improved the condition by
changing the lipid and protein content to normal values.
The lipids of diabetic plasma membrane were in more ordered structure than the
lipids of healthy plasma membranes, whereas selenium treatment reversed this
condition towards the normal structure.
The diabetes caused the decrease of membrane dynamics however; selenium
treatment increased the dynamics of membrane.
The content of fatty acids and amino acids decreased in diabetic plasma membranes
whereas with the selenium administration this content was elevated.
The glycogen, glycolipids and polysaccharides on the membrane displayed
contradictory results. The hydrogen bonds of glycogen increased as a result of

104
medium doses of selenium, but decreased as a result of low doses of selenium. The
glycolipids and polysaccharides content increased in selenium treated diabetic
animals nevertheless, this content was increased in diabetic group also. In addition
the hydrogen bonds of the glycolipids and polysaccharides in selenium treated
diabetic plasma membranes decreased.
The diabetes caused critical secondary structural changes in plasma membranes.
During the detailed analysis of proteins secondary structures, the aggregation and
denaturation of proteins were observed, suggesting that, diabetes caused abnormal
synthesis and folding of proteins. In contrary, the administration of selenium
removed the denaturation and as a result, normal secondary structure of proteins was
established.
The membrane phospholipids of diabetic kidney plasma membrane were found to be
more ordered than normal ones. Nonetheless, the selenium therapy restored the
ordered structural alterations. Also, membrane phospholipids content elevated as a
result of selenium treatment.
To conclude, the kidney plasma membranes were severely deteriorated due to
diabetes with respect to its lipid, protein and carbohydrate structure and content,
which were restored after selenium treatment. The diabetes caused the diminishing of
whole membrane fluidity, which was restored with the selenium administration. This
the first study demonstrating the effect of stz-induced diabetes on kidney plasma
membrane and the effect of selenium on stz-induced diabetic kidney plasma
membranes using spectroscopic tools. The study revealed serious therapeutic
capacities of selenium on diabetic kidney plasma membranes which needs
confirmation of future researches. In future, the selenium treated control kidney
brush-border plasma membrane samples will also be studied detailly, in order to see
the effect of selenium on healthy kidney tissues.

105
REFERENCES
Atkinson MA, Eisenbarth GS. Type I diabetes: new perspectives on disease
pathogenesis and treatment. Lancet 2001; 358: 221–229.
Akerblom HK, Knip M. Putative environmental factors in type 1 diabetes. Diabetes
Metab Rev 1998; 14: 31–67.
Adler S. Structure-function relationships associated with extracellular matrix
alterations in diabetic glomerulopathy. J Am Soc Nephrol 1994; 5: 1165–1172
Alberti K. G. M. M, P. Z. Zimmet. Definition, Diagnosis and Classification of
Diabetes Mellitus and its Complications Part 1: Diagnosis and Classification of
Diabetes Mellitus Provisional Report of a WHO Consultation. K. G. Diabet. Med.
15: 539–553 (1998)
Arthur RJ, Nicol F, Beckett GJ. Selenium deficiency, thyroid hormone metabolism
and thyroid hormone deiodinases. Am J Clin Nutr. 1993; 57: 236S-239S
Arthur J.R., Nicol R., Beckett, G.J., 1993. Selenium deficiency, thyroid hormone
metabolism, and thyroid hormone deiodinases. Am. J. Clin. Nutr. 57, 236S - 239S.
Ujang Tinggi. Essentiality and toxicity of selenium and its status in Australia: a
review Toxicology Letters 137 (2003) 103-/110
Aronson PS. Kinetic properties of the plasma membrane Na / H exchanger. Ann Rev
Physio4l7: 545—560, 1985

106
Aronson PS. identifying secondary active solute transport in epithelia. Am J Pliysiol
240: Fl—F11, 1981
Arrondo J.R., Muga, A., Castresa, J., and Goni, R. M., (1993). ―Quantative Studies
of the Structure of Proteins in Solution by Fourier Transform Infrared Spectroscopy‖,
Progress. Biophys. Acta. 468:63-72.
Armstrong AM, Chestnutt JE, Gormley MJ, Young IS. Theeffect of dietary treatment
on lipid peroxidation and antioxidantstatus in new diagnosed non-insulin dependent
diabetes. Free Radical Biol Med 1996; 21:719]726
Allander E.Kashin-Beck disease.An analysis of research and public health activities
based on a bibliography 1849-1
992. Scand J Rheumatol.1994;23
AM van Rij, CD Thomson, JM McKenzie, and MF Robinson.. Selenium deficiency
in total parenteral nutrition . J. Am. J. C/in. Nuir. 32 : 2076-2085, 1979.
3,
Avissar N, Ornt DB, Yagil Y, Horowitz S, Watkins RH, KerlEA, Takahashi K,
Palmer IS, Cohen HJ. Human Kidney Proximal Tubules Are the Main Source of
Plasma Glutathione Peroxidase. Am. J. Physiol. 1994; 266: C367-75.
Barbu AR, Akusjarvi G, Welsh N. Adenoviral-mediated transduction of human
pancreatic islets: importance of adenoviral genome for cell viability and association
with a deficient antiviral response. Endocrinology 2005; 146: 2406–2414.
Bergman R. Non-esterified fatty acids and the liver: why is insulin secreted into the
portal vein? Diabetologia 2000; 43: 946–952.
Brownlee M. Biochemistry and molecular cell biology of diabetic complications.
Nature 2001; 414:813–820
Brownlee M. The pathobiology of diabetic complications: a unifying mechanism.
Diabetes 2005; 54: 1615–1625

107
Brown DM, Andres GA, Hostetter TH, Mauer SM, Price R, Venkatachalam MA.
Kidney Complications Diabetes 1982; Vol 31, Suppl 1.
Bell RH, Hye RJ. Animal Models of Diabetes Mellitus:Physiology and Pathology.
Journal of surgical Research 1983; 35: 433-460
Belma Turan, Sevgi Bayari, Cenk Balcik, Feride Severcan, Nuri Akkas (2000).‘‘A
biomechanical and spectroscopic study of bone from rats with selenium deficiency
and toxicity‘‘. BioMetals 13: 113–121, 2000
Belma Turan, Esma Zeydanli, Evrim Tanriverdi, Aytac Seymen, Erkan Tuncay,
Hakan Gurdal, Aslihan Koksoy. ‘‘Beneficial effect of sodium selenate on vascular
dysfunction in diabetic rats‘‘. Journal of Molecular and Cellular Cardiology 42
(2007) S219–S233
Beck MA, Kolbeck PC, Rohr LH, Morris VC & Levander OA (1994a). Benign
human enterovirus becomes virulent in selenium-deficient mice. Journal of Medical
Virology 43, 166 -1
70.
Beck MA, Kolbeck PC, Shi Q, Rohr LH, Morris VC & Levander OA (1994b)
Increased virulence of a human enterovirus (Coxsackievirus B3) in selenium-
deficient mice. Journal of Infectious Diseases 170, 351 - 357.
Beck MA, Shi Q, Morris VC & Levander OA (1995). Rapid genomic evolution of a
non-virulent Coxsackievirus B3 in selenium-deficient mice results in selection of
identical virulent isolates. Nature Medicine 1, 433-436
Battell ML, Delgatty HL, McNeill JH. Sodium selenate corrects glucose tolerance
and heart function in STZ diabetic rats. Mol Cell Biochem 1998; 179: 27–34.

108
Bevers E.M., P. Comfurius, J.L.M.L. van Rijn, H.C. Hemker, R.F.A. Zwaal.
Generation of platelet prothrombin converting activity and the exposure of
phosphatidylserine at the platelet outer surface. Eur. J. Biochem. 122 (1982) 429-
436.
Bevers Edouard M. , Paul Comfurius, David W.C. Dekkers, Robert F.A. Zwaal.
Lipid translocation across the plasma membrane of mammalian cells. Biochimica et
Biophysica Acta 1439 (1999) 317-330
Bevers E.M., P. Comfurius, R.F.A. Zwaal. Changes in membrane phospholipid
distribution during platelet activation. Biochim. Biophys. Acta 736 (1983) 57-66.
Matlin, K., Caplan, M., in: Seldin, D., Giebisch, G. (Eds.). The Kidney: Physiology
and Pathophysiology, Lippincott Williams and Wilkins, Philadelphia, PA 2000
Bosch R., Hatzoglou M., Park E. A. and Hanson R. W. (1990). Vanadate inhibits
expression of the gene for phosphoenolpyruvate carboxykinase (GTP) in rat
hepatome cells. J. Biol. Chem. 265: 13677–13682
Banyay, M., Sarkar, M., Graslund, A., (2003). ―A library of IR bands of nucleic
acids in solution‖. Biophysical Chemistry, 104: 477–488.
Bizeau, M.E., Salano, J.M., and Jeffrey, R., (2000). ―Menhaden oil feeding increases
lypolysis without changing plasma membrane order in isolated rat adipocytes‖.
Nutrition Research, 20(11): 1633-1
644.
Burk RF: Molecular biology of selenium with implications for its metabolism.
FASEB J 5: 2274–2279, 1991
Burk RF, Hill KE. Regulation of Selenoproteins. Annual Review of Nutrition 1993;
13: 65-81.

109
Burk RF, Hill KE. Selenoprotein P: A selenium rich extra cellular glycoprotein. J.
Nutr. 1994; 124(10): 1891-7.
Becker D. J., Reul B., Ozcelikay A. T., Buchet J. P., Henquin J. C. and Brichard S.
M. (1996). Oral selenate improves glucose homeostasis and partly reverses
abnormal expression of liver glycogenic and gluconeogenic enzymes in diabetic rats.
Diabetologia 39: 3–11
Brinkkoetter PT, Holtgrefe S, van der Woude FJ, Yard BA. Angiotensin II type 1-
receptor mediated changes in heparin sulfate proteoglycans in human SV40
transformed podocytes. J Am Soc Nephrol 2004; 15: 33–40.
Crouch R, Kimsey G, Priest DG, Sarda A, Buse MG. Effect of streptozotocin on
erythrocyte and retinal superoxide dismutase. Diabetologia 1978; 15: 53
Cline G, Petersen K, Kreskas M, et al. Impaired glucose transport as a cause of
decreased insulin-stimulated muscle glycogen synthesis in T2DM. The New England
Journal of Medicine 1999; 341: 240–246.
Christelle Douillet, Alain Tabib, Muriel Bost, Michele Accominotti, Francoise
Borson-Chazot, and Maryvonne Ciavatti1. Selenium in Diabetes: Effects of
Selenium on Nephropathy in Type I Streptozotocin-induced Diabetic Rats the
Journal of Trace Elements in Experimental Medicine 12:379–392 (1999)
Chen LK, Chou YC, Tsai ST, et al. Hepatitis C virus infection-related type 1 diabetes
mellitus. Diabet Med 2005; 22: 340–343
Chen S, Kasama Y, Lee JS, et al. Podocytederivedvascular endothelial growth factor
mediates the stimulation of alpha3 (IV) collagen production by transforming growth
factor beta1in mouse podocytes. Diabetes 2004; 53:2939–2949.
110
Cooper ME, Vranes D, Youssef S, et al. Increased renal expression of vascular
endothelial growth factor (VEGF) and its receptor VEGFR-2 in experimental
diabetes. Diabetes 1999; 48: 2229–2239.
Chang, M.C., Tanaka, J., (2002). ―FT-IR study for hydroxyapatite / collagen
nanocomposite cross-linked by glutaraldehyde‖. Biomaterials, 23: 4811–4818.
Chiriboga, L., Yee, H., Diem, M., (2000). ―Infrared spectroscopy of human cells and
tissues. Part VI: A comparative study of histopathology and infrared micro
spectroscopy of normal, cirrhotic, and cancerous liver tissue‖. Appl.Spectrosc. 54: 1-
8.
Cakmak, G., Togan, I., Uguz, C., Severcan, F., (2003). ―FT-IR spectroscopic
analysis of rainbow trout liver exposed to nonylphenol‖. Appl. Spec. 57:835–841.
Cakmak, G., Togan, I., Severcan, F., (2006). ―17-Estradiol induced compositional,
structural and functional changes in rainbow trout liver. Aquatic Toxicology, 77: 53–
63
Cakmak, G., Togan, I., Severcan, F., (2006). ―17-Estradiol induced compositional,
structural and functional changes in rainbow trout liver, revealed by FT-IR
spectroscopy: A comparative study with nonylphenol‖, Aquatic Toxicology, 77: 53
Celik S., Yilmaz O, T. Asan, M. Naziroglu , M. Cay and M. Aksakal.‘‘ Infuence of
Dietary Selenium and Vitamin E on the Levels of Fatty Acids in Brain and Liver
Tissues of Lambs‘‘. Cell Biochem. Funct. 17, 115-1
21 (1999)
Cser A, Sziklai-Laszlo I, Menzel H, Lombeck I. Selenium status and lipoproteins in
healthy and diabetic children. J Trace Elem Electrolytes Heath Dis 1993; 7:205]210.
Contempre B,Dumont JE,Bebe N,Thilly CH,Diplock AT,Vanderpas J. Effect of
selenium supplementation in hypothyroid subjects of an iodine and selenium
deficient area. J Clin Endocrinol Metab.1991;73;213-215

111
Campbell, I. D. and Dwek, R. A. (1984). Biological spectroscopy, Benjamin /
Cummings Publishing Company, USA, 1-60.
Ci, X. Y., Gao, T. Y., Feng, J. and Guo, Z. Q., (1999). ―Fourier transforms infrared
characterization of human breast tissue: Implications for breast cancer diagnosis‖,
Applied Spectroscopy, 53:312-315.
Cuvin-Aralar ML, Furness RW. Mercury and selenium interaction: a review.
Ecotoxicol Environ Health 1991; 21:348]364.
Dighton, J., Mascarenhas, M., and Arbuckle-Keil, G. (2001), ―Changing Resources:
Assessment of Leaf Litter Carbohydrate Resource Change at A Microbial Scale of
Resolution‖, Soil Biology and Biochemistry. 33: 1429-1
432.
David Holben,Anne M.Smith. The diverse role of selenium within selenoproteins:a
review.J Am Dietetic Assoc.1999;99-7
Ding G, Reddy K, Kapasi AA, et al. Angiotensin II induces apoptosis in rat
glomerular epithelial cells. Am J Physiol Renal Physiol 2002; 283:F173–F180
Du XL, Edelstein D, Rossetti L, et al. Hyperglycemia-induced mitochondrial
superoxide overproduction activates the hexosamine pathway and induces
plasminogen activator inhibitor-1
expression by increasing Sp1 glycosylation. Proc
Nat Acad Sci U S a 2000; 97: 12222–12226
Douillet C, Tabib A, Bost M, Accominotti M, Borson-Chazot F, Ciavatti M. A
selenium supplement associated or not with vitamin E delays early renal lesions in
experimental diabetes in rats. Proc Soc Exp Biol Med 1996; 211:323]331.
Douillet C, Bost M, Accominotti M, Borson-Chazot F, Ciavatti M. Effect of
selenium and vitamin E supplements on tissue lipids, peroxides, and fatty acid
distribution in experimental diabetes. Lipids 1998; 33:393–399

112
Douillet C, Bost M, Accominotti M, Borson-Chazot F, Ciavatti M. In vitro and in
vivo effects of selenium and selenium with vitamin E on platelet functions in diabetic
rats. Relationship to platelet sorbitol and fatty acid distribution. Biol Trace Elem Res
1996; 55:263–277.
Doublier S, Salvidio G, Lupia E, et al. Nephrin expression is reduced in human
diabetic nephropathy: evidence for a distinct role for glycatedalbumin and
angiotensin II. Diabetes 2003; 52:1023–1030.
Dousseau, F, and Pezolet, M., (1990). ―Determination of the secondary structure
content of proteins in aqueous solutions from their amide I and amide II infrared
bands. Comparison between classical and partial least-squares methods?‖
Biochemistry, 29: 8771-8779.
The Diabetes Control and Complications (DCCT) Research group: Effect of
intensive therapy on the development and progression of diabetic nephropathy in the
Diabetes Control and Complications Trial. Kidney Int 47:1703-1
720, 1995
Ezaki, O., 1990. The insulin like effects of selenate in rat adipocytes. J. Biol. Chem.
265, 1124–1130
Evers, C., Haase, W., Murer, H. and Kinne, R. (1978). Properties of Brush Border
Vesicles Isolated from Rat Kidney Cortex by Calcium Precipitation. Molecular
Membrane Biology, 1:3,203 — 219
Fan AM,Kizer KW. Selenium-nutritional,toxicological and clinical aspects. West J
Med.1990;153;160-1
67
Facchini FS, Humphreys MH, DoNascimento CA, et al. Relation between insulin
resistance and plasma doses of lipid hydro peroxides, carotenoids, and tocopherols.
Am J Clin Nutr 2000; 72:776–779?

113
Foster, L. H. and Sumar, S. (1997) Selenium in health and disease: a review. Crit
Rev Food Sci Nutr 37:211-228.
Freifelder, D., (1982). Physical Chemistry. Applications to biochemistry and
molecular biology, Freeman, W. H. (Ed), New York.
Friedman BI, Spray BJ, Tuttle AB, Buckalew VM Jr. The familial risk of end-stage
renal disease in African Americans. Am J Kidney Dis 21: 387-393, 1993?
Francesco Piscean and Loreto Gesualdo. Pathogenetic Mechanisms of Diabetic
Nephropathy. J Am Soc Nephrol 16:S30-S33, 2005
Furnsinn C., English R., Ebner K., Nowotny P., Vogle C. and Waldhausl W. (1996)
Insulin-like vs. non-insulin stimulation of glucose metabolism by vanadium, tungsten
and selenium compounds in rat muscle. Life Sci. 59: 1989–2000
Green J, Casabonne D, Newton R. Coxsackie B virus serology and type I diabetes
mellitus: a systemic review of published case-control studies. Diabet Med 2004; 21:
507–514.
Guilherme A, Virbasius JV, Puri V, Czech MP. Adipocyte dysfunctions linking
obesity to insulin resistance and T2DM. Nat Rev Mol Cell Biol 2008; 9 (5): 367–77.
Güvenc Görgülü,‘‘The Effects of Antioxidants on Diabetic Rat Livet Microsomal
Membranes and Antioxidant Enzyme Activities ‗‘. PHD Thesis,2004.
Gordon G.Hammes. (2005) Spectroscopy of biological sciences, John Wiley & Sons,
Inc
Gebre-Medhin M, Ewald U, Plantin LO, Tuvemo T. Elevated serum selenium in
diabetic children. Acta Pediatr Scand 1984; 73:109]114

114
Greene HL, Hambridge KM, Schanler R, Tsang RC. Guidlines for the use of
vitamins,trace elements ,calcium and phosphorus in infants and children receiving
total parenteral nutrition. Am.J.Clin Nutr. 1988;48:1324-1
342
Ghosh R, Mukherjee B, Chatterjee M. A novel effect of selenium on streptozotocin-
induced diabetic mice. Diabetes Res 1994; 25:165–171.
Hutton JC, Wenzlau JM, Juhl K, et al. The cation efflux transporter ZnT8 (Slc30A8)
is a major autoantigen in human type 1 diabetes. PNAS 2007; 104: 17 040–17 045
Helzlsouer K, Jacobs R, Morris S. Acute selenium intoxication in the United States
(abstract). Fed.Proc.1985; 44:1670
Hoekstra, W. G. 1975. Biochemical functions of selenium and its relation to vitamin
E. Fed. Proc. 34:2083-89
Hafeman, D. G., Sunde, R. A., Hoekstra, W. G. 1974. Effect of dietary selenium on
erythrocyte and liver glutathione peroxides in the rat. J. Nutr. 104: 580-87
Holovet P, Collen D. Oxidized lipoproteins in athereosclerosis and thrombosis.
FASEB J.1994;8:1279-1
284
Hill KE, Lloyd RS, Yang JG, Read R & Burk RF (1991). The cDNA for rat
selenoprotein P contains 10 TGA codons in the open reading frame. Journal
Of Biological Chemistry 266, 10050±10053.
Hei Y., J., Farahbakhshian S., Chen X., Battell M. L. And McNeill J. H. (1998)
Stimulation of MAP kinase and S6 kinase by vanadium and selenium in rat
adipocytes. Mol. Cell. Biochem. 178: 367–375
Heini Murer and Piotr Gmaj. Transport studies in plasma membrane vesicles isolated
from renal cortex. Kidney international, Vol. 30 (1986), pp. I/I—ISO

115
Hammes HP, Du X, Edelstein D, et al. Benfotiamine blocks three major pathways of
Hyperglycemic damage and prevents experimental diabetic retinopathy. Nat Med
2003; 9:294–299
Ichinose K, Kawasaki E, Eguchi K. Recent advancement of understanding
pathogenesis of type 1 diabetes and potential relevance to diabetic nephropathy. Am
J Nephrol 2007; 27:554–564?
Idris I, Donnelly R. Protein kinase C beta inhibition: a novel therapeutic strategy for
diabetic microangiopathy. Diab Vasc Dis Res 2006; 3: 172–178
Isogai S, Mogami K, Shiina N, Yoshino G. Initial ultra structural changes in pore
size and anionic sites of the glomerular basement membrane in streptozotocin-
induced diabetic rats and their prevention by insulin treatment. Nephron 1999;
83:53–58.
Jamin, N., Dumas, P., Moncuit, J., Friedman, W., Teillaud, J., Carr, L. G., and
Williams, G. P., (1998). ―Highly resolved chemical imaging of living cells by using
synchrotron infrared micro spectroscopy‖, Applied Biological Sciences, 95(9): 4837-
4840
Jackson, M., Ramjiawan, B., Hawk, M., and Mantsch, H. H., (1998). ―Infrared
microscopic functional group mapping and spectral clustering analysis of
hypercholosterolomic rabbit liver‖, Cell. Mol. Biol., 44(1): 89-98.
Jenkins, Kemnitz, Tortora. (2007). Anatomy and Physiology, Wiley Inc.Textbook
John W. Hole (1993) Human anatomy and physiology, 6th edition.Wm.C.Brown
Publishers, Dubuque. Textbook

116
Joseph W. DePierre and Manfred L. Karnovsky. Plasma Membranes of Mammalian
Cells: A Review of Methods for Their Characterization and Isolation. The Journal of
Cell Biology • Volume 56, 1973 • pages 275-303
Jun HS, Yoon JW. A new look at viruses in type 1 diabetes. Diabetes Metab Res Rev
2002; 19: 8–31.
Jackson, M., Ramjiawan, B., Hawk, M., and Mantsch, H. H., (1998). ―Infrared
microscopic functional group mapping and spectral clustering analysis of
hypercholosterolomic rabbit liver‖, Cell. Mol. Biol., 44(1): 89-98.
Johnson T. M., Meisler M. H., Bennett M. I. and Willsky G. R. (1990) Vanadate
induction of pancreatic amylase mRNA in diabetic rats. Diabetes 39: 757–762
Jun HS, Yoon JW. The role of viruses in type I diabetes: two distinct cellular and
molecular pathogenic mechanisms of virus induced diabetes in animals. Diabetologia
2001; 44(3): 271-85.
Kahn C. R., White M. F., Shelson S. E., Backer J. M., Araki E., Cheatham B. et al.
(1993). The insulin receptor and its substrate: molecular determinants of early events
in insulin action. Recent Progress in Hormone Research 48: 291–360
Kawasaki E, Gill RG, Eisenbarth GS. Type 1 Diabetes Mellitus. Austin, TX: Landes
Bioscience; 1999
Kelley D, Mintun M, Watkins S, et al. The effect of non-Insulin dependent diabetes
mellitus and obesity on glucose transport and phosphorylation in skeletal muscle. J
Clin Invest 1996; 97: 2705–2713.
Korkmaz, F., and Severcan, F., (2005). ―Effect of progesterone on DPPC membrane:
Evidence for lateral phase separation and inverse action in lipid dynamics‖, Arch.
Biochem. Biophys. 440: 141–147.

117
Kanwar M, Chan PS, Kern TS, Kowluru RA. Oxidative damage in the retinal
mitochondria ofdiabetic mice: possible protection by superoxide dismutase. Invest
Ophthalmol Vis Sci 2007; 48:3805–3811
Kien CL and HE Ganther. Manifestations of chronic selenium deficiency in a child
receiving total parenteral nutrition. .American Journal of Clinical Nutrition, Vol 37,
319-328,1983 T
Klein R, Klein BE, Moss SE, Davis MD, DeMets DL. The Wisconsin Epidemiologic
Study of Diabetic Retinopathy.IV.Diabetic macular edema. Ophthalmology 91:1464-
1474, 1984
Klapec T, Mandic ML, Grid J et al. Daily dietary intake of selenium in eastern
Croatia. Sci Total Environ 1998; 217:127]136
Kinne Saffron E, Kinne R. The separation of apical from basal—lateral plasma
membranes of epithelial cells: A tool to identify transport systems. Ann NYAcad SD
341:48—56, 1980
Kretzler M. Regulation of adhesive interaction between podocytes and glomerular
basement membrane. Microsc Res Tech 2002; 57:247–25
Kinder, R., Ziegler, C., Wessels, J.M., (1997). ―Irradiation and UV-C light induced
Lipid peroxidation: A Fourier transform-infrared absorption spectroscopic study‖,
Int. J. Radiat. Biol., 71(5): 561-571
Larsen PR, Berry MJ. Nutritional and hormonal regulation of thyroid hormone
deiodinases. Annu Rev Nutr.1995; 15:323-352
Lockitch, G: Jacobson, B: Quigley, G: Dison, P: Pen dray, M. .Selenium deficiency
in low birth weight neonates: an unrecognized problem. J-Pediatr. 1989 May;
114(5): 865-70 urinal

118
Lee KU, Amano K, Yoon JW. Evidence for initial involvement of macrophages in
development of insulitis in NOD mice. Diabetes 1988; 37: 989–991
Lee AY, Chung SS. Contributions of polyol pathway to oxidative stress in diabetic
cataract. FASEB J 1999; 13: 23–30
Like AA, Rossini AA. Streptozotocin-induced pancreaticinitis: A new model of
diabetes mellitus. Science 1976; 193: 415-1
7.
Lopez-Garcia, F., Villain, J., and Gomez-Fernandez, J.C., (1993). ―Infrared
spectroscopic studies of the interaction of diacylglycerols with phosphatidylcerol,
phosphatidylserin in the presence of calcium‖. Biochim Biophys Acta, 1169: 264-
272.
Lyman, D.J., and Murray-Wijelath, J., (1999). ―Vacular graft healing: I.FTIR
analysis of an implant model for studying the healing of a vascular graft‖. J.Biomed.
Mater. Res. (Appl. Biomater.), 48; 172-1
86.
Liu, K.Z., Bose, R., Mantsch, H.H., (2002). ―Infrared spectroscopic study of diabetic
platelets‖, Vibrational Spectroscopy, 28: 131–136.
Mantsch, H.H., (1984). ―Biological application of Fourier Transform Infrared
Spectroscopy: A study of phase transitions in biomembranes‖. J. Mol.Strucutre, 113:
201-212
Mueller CF, Widder JD, McNally JS, et al. The role of the multidrug resistance
protein-1
in modulation of endothelial cell oxidative stress. Circ Res 2005; 97: 637–
644.
Melinda A. Beck, Orville A. Levander
and Jean Handy. Selenium Deficiency and
Viral Infection J. Nutr. 133: 1463S–1467S, 2003

119
Manoharan, R., Baraga, J.J., Rava, R.P., Dasari, R.R., Fitzmaurice, M. And Feld,
M.S., (1993). ―Biochemical analysis and mapping of atherosclerotic human artery
using FTIR microspectroscopy‖. Atherosclerosis, 103:181-1
93.
Melin, A., Perromat, A., and Deleris, G., (2000). ―Pharmacologic Application of
Fourier Transform IR Spectroscopy: In vivo Toxicity of Carbon tetrachloride on rat
liver‖, Biopolymers (Biospectroscopy), 57:160-1
68.
Mukherjee B, S Anbazhagan, a Roy, R Ghosh, M Chatterjee. Novel implications of
the potential role of selenium on antioxidant status in streptozotocin-induced diabetic
mice. Biomed & Pharmucothrr 1998; 52: 89-95
Mizutani M, Kern TS, Lorenzi M. Accelerated death of retinal micro vascular cells
in human and experimental diabetic retinopathy. J Clin Invest 1996; 97:2883–2890
Miralpeix M., Decaux J.-F., Kahn A. and Bartrons R. (1991) Vanadate induction of
L type pyrivate kinase mRNA in adult rat hepatocytes in primary culture. Diabetes
40: 462–467
Mikiya Fujieda & Keishi Naruse & Tadashi Hamauzu & Eriko Miyazaki &
Yoshihiro Hayashi & Riyo Enomoto & Eibai Lee & Kazuhide Ohta & Yutaka
Yamaguchi &Hiroshi Wakiguchi & Hideaki Enza. Effect of selenium-deficient diet
on tubular epithelium in normal rats. Pediatr Nephrol (2007) 22:192–201
Mendelsohn, R. and Mantsch, H. H., (1986). Fourier transform infrared studies
of lipid-protein interaction, Progress in Protein-Lipid Interactions, Volume 2,
Elsevier Science Publishers, Netherlands, 103-1
47.
Navarro-Alarcon M, Lopez-Ga de la Serrano H, Perez-Valero, Lopez-Martinez MC.
Serum and urine selenium doses as indicators of body status in patients with diabetes
mellitus. Sci Total Environ 1999b; 228:79]85

120
Navarro-Alarcon M, Lopez-Ga de la Serrano H, Perez-Valero, Lopez-Martinez MC.
Serum selenium levels as indicators of body status in cancer patients and their
relationship with other nutritional and biochemical markers. Sci Total Environ 1998;
212:195]202.
Navarro-Alarcon M, Lopez-Ga de la Serrano H, Perez-Valero, Lopez-Martinez MC.
Serum and urine selenium doses in patients with cardiovascular diseases and
relationship with other nutritional indexes. Ann Nutr Metab1999a; 43:30]36.
Nader Manar M., Laila A. Eissa, Nariman M. Gamil and El-Sayed M. Ammar. Effect
of Nitric Oxide, Vitamin E and Selenium on streptozotocin induced Diabetic Rats.
Saudi Pharmaceutical Journal, Vol. 15, No. 1, January 2007
Nepom, GT. Class II antigens and disease susceptibility. Annu Rev Med 1995; 46:
17–25.
Nihal Simsek Ozek, Yildirim Sara, Rustu Onur and Feride Severcan. Low dose
simvastatin induces compositional, structural and dynamical changes in rat skeletal
extensor digitorum longus muscle tissue. Biosci. Rep. (2009) Volume 29
O‘Brien R. M. and Granner D. K. (1996). Regulation of gene expression by insulin.
Physiol. Rev. 76: 1109–1161
Parvez I. Haris and Feride Severcan. FTIR spectroscopic characterization of protein
structure in aqueous and non-aqueous media. Journal of Molecular Catalysis B:
Enzymatic 7.1999. 207–221
Pagtalunan ME, Miller PL, Jumping-Eagle S, et al. Podocyte loss and progressive
glomerular injury in type II diabetes. J Clin Invest 1997; 99: 342–348.
Patari A, Forsblom C, Havana M, et al. Nephrinuriain diabetic nephropathy of type 1
diabetes. Diabetes2003; 52: 2969–2974
121
Pavenstadt H, Kriz W, Kretzler M. Cell biology of the glomerular podocyte. Physiol
Rev 2003; 83:253–307
Pietropaolo M, Barinas-Mitchell E, Kuller LH. Perspectives in diabetes
heterogeneity of diabetes mellitus. Unraveling a dispute: is systemic inflammation
related to islet autoimmunity? Diabetes 2007; 56: 1189–1197.
Pickup JC, Williams G. Textbook of Diabetes 2nded. Volume 1. Blackwell Science,
Inc; 2002.
Pearl-Yafe M, Kaminitz A, Yolcu ES, et al. Pancreatic islets under attack: cellular
and molecular effectors. Curr Pharm Des 2007; 13: 749–760.
Prasanth N. Surampudi, MD, Jennifer John-Kalarickal, MD, and Vivian A. Fonseca.
Emerging Concepts in the Pathophysiology of Type 2 Diabetes Mellitus. MOUNT
SINAI JOURNAL OF MEDICINE 76: 216–226, 2009
Rotruck, J.T., Pope, A.L., Ganther, H.E., Swanson, A.B., Hafeman, D.G., Hoekstra,
W.G., 1973. Selenium: biochemical role as a component of glutathione peroxides.
Science 179, 588-/590
Reddi, A. S. and Bollineni, J. S. Selenium deficient diet induces renal oxidative
stress and injury via TGF- beta-1
in normal and diabetic rat‘s kidney. Kidney Int.,
2001 59: 1342-1
353 Saudi Pharmaceutical
Rana, F.R., Sultany, C.M. and Blazyk, J., (1990). ―Interactions between Salmonella
typhimurium lipopolysaccharide and the antimicrobial peptide, magainin 2 amide‖,
FEBS Letters, 261, 2, 464-467.

122
Rigas, B., Morgellot, S., Goldman, I.S., Wong, P.T.T., (1990). ―Human colorectal
cancers display abnormal Fourier-transform infrared spectra‖, Proc. Nati. Acad. Sci.,
87: 8140-8144
Redondo MJ, Fain PR, Krischer P, et al. Expression of beta-cell autoimmunity does
not differ between potential dizygotic twins of siblings of patients with type 1
diabetes. J Autoimmun 2004; 23: 275–279.
Seda V. Urer G.linnaz Alper. Experimental Models of Diabetes Mellitus Turk Klinik
Biyokimya Derg 2004; 2(3): 127-1
36
Stern M. Strategies and prospects for finding insulin resistance genes. J Clin Invest
2000; 323–327
Shulman G. Cellular mechanisms of insulin resistance in humans. Am J Cardiol
1999; 83: 3J–10J
Seaquist ER, Goetz C, Rich S, Barbosa J: Familial clustering of diabetic
nephropathy. N Eng J Med 320:1161-1
165, 1989
S. R. Stapleton Selenium: an insulin-mimetic CMLS, Cell. Mol. Life Sci. 57 (2000)
1874–1879.Bardsley JK, Want LL. Overview of diabetes. Crit Care Nurse Q 2004;
27: 106–112
Szkudelski T. The mechanism of alloxan and streptozotocin action in B cells of the
rat pancreas. Physiol Res 2001; 50: 536-546.
Suri C, Jones PF, Patan S, et al. Requisite role of angiopoietin-1
, a ligand for the TIE2
receptor, during embryonic angiogenesis. Cell 1996; 87:1171–1180.
Spallohlz,J.E.,1994. On the nature of selenium toxicity and carcinostatic activity.
Free Radic.Biol.Med.17,45-64

123
Stadtman TC. Selenocysteine.Annu Rev Biochem.1996;65:83-1
00
Saleem MA, Ni L, Witherden I, et al. Colocalizationof nephrin, podocin, and the
actin cytoskeleton: evidence for a role in podocyte foot process formation. Am J
Pathol 2002; 161: 1459–1466?
Schrijvers BF, Flyvbjerg A, de Vriese AS. The role of vascular endothelial growth
factor (VEGF) in renal pathophysiology. Kidney Int 2004; 65:2003–2017.
Severcan, F., Kaptan, N., Turan, B., (2003). ―Fourier transform infrared
spectroscopic studies of diabetic rat heart crude membranes‖, Spectroscopy, 17: 569–
577 569.
Severcan, F., (1997). ―Vitamin E decreases the order of the phospholipid model
membranes in the gel phase: An FTIR study‖. Bioscience Reports, 17: 231-235.
Severcan, F., Kaptan, N., Turan, B., (2003). ―Fourier transform infrared
spectroscopic studies of diabetic rat heart crude membranes‖, Spectroscopy, 17: 569–
577 569.
Severcan, F., Toyran, N., Kaptan, N. and Turan, B., (2000). ―Fourier transform
infrared study of diabetes on rat liver and heart tissues in the C-H region‖, Talanta,
53, 55-59.
Severcan, F., Yazıcı, Z., Guray, T., (1999). ―Interaction of vitamin E-acetate
with human erythrocyte membranes‖, Chem. Phys. Lipids 101:176-1
77.
Shepherd P. R., Nave´ B. T. and Siddle K. (1995). Insulin stimulation of glycogen
synthesis and glycogen synthase activity is blocked by wortmannin and rapamycin in
3T3-L1 adipocytes: evidence for the involvement of phosphoinositide-3 kinase and
p70 ribosomal protein-S6 kinase. Biochem. J.305: 25–28

124
Stapleton S. R., Garlock G., Foellmi-Adams L., Kletzien R. F. (1997). Selenium:
potent stimulator of tyrosyl phosphorylation and activator of MAP kinase. Biochem.
Biophys. Acta 1355: 259–269
Stapleton S. R., Jivraj S. and Wagle A. (1998). Insulin and the insulin-mimetic
selenium mediate the regulation of glucose-6- phosphate dehydrogenase gene
expression via different signal proteins. FASEB J. 12: 1404
Spassov, S., Beekes M., Naumann, D., (2006). ―Structural differences between TSEs
strains investigated by FT-IR spectroscopy‖. Biochimica ET Biophysica Acta, 1760:
1138–1149.
Sills, R.H., Moore, D.J. and Mendelsohn, R., (1994). ―Erythrocyte peroxidation:
quantitation by Fourier transforms infrared spectroscopy‖. Analytical Biochemistry
218: 118-1
Stapleton S.R. Selenium; An insulin-mimetic. CMLS, Cell .Mol. Life. Sci. 57 (2000)
1874-1
879
Stuart, B., (1997). Biological Applications of Infrared Spectroscopy. John Wiley and
Sons, Ltd., England.
Stuart, B., (2004). Infrared Spectroscopy: Fundamentals and Applications. John
Wiley and Sons, Ltd., England.
Schultz, C. and Naumann, D., (1991). ―In vivo study of the state of order of the
membranes of Gram-negative bacteria by Fourier-transform infrared spectroscopy
(FT-IR)‖. FEBS Letters, 294, 43-46.
Stachouse S, Miller PL, Park SK, Meyer TW. Reversal glomerular hyperfiltration
and renal hypertrophy by blood glucose normalization in diabetic rats. Diabetes
1990; 39:989–995
Schubert JR, Muth OH, Oldfield JE, Remmert LF. Experimental results with
selenium in white muscle disease of abms and calves. Fed Proc 1961; 20: 689-692

125
Simonoff M, Simonoff G, editors. Le selenium ET la vie. Paris: Masson, 199128.
Simonoff M, Sergeant C, Garnier N et al. Antioxidant status of selenium, vitamins A
and E. and aging. In: Emerit I, Chance B, editors. Free radicals and aging. Basel:
Birkhauser, 1992:3 68 - 396.
Schlienger JL, Grunenberger F, Maier EA, Simon C, Chabier G, Leroy MJF.
Perturbation des oligoelements plasmatiques dans la diabetes. Relation avec
lequilibre glycemique. Presse Med 1988; 17:1076]1079.
Smith, G.C.M., and Jackson, S.P., (1999). ―The DNA dependant protein kinase‖,
Genes Dev. 13, 916-934.
Szalontai, B., Nishiyama, Y., Gombos, Z., and Murata, N., (2000). ―Membrane
dynamics as seen by Fourier Transform Infrared Spectroscopy in a cyan bacterium,
synechocystis PCC 6803. The effects of lipid unsaturation and the protein-to-lipid
ratio‖, Biochim. Biophys. Acta, 1509; 409-419.
Simons, K., and E. Ikonen. 1997. Functional rafts in cell membranes. Nature.
387:569–572efense
Smith, G.C.M., and Jackson, S.P., (1999). ―The DNA dependant protein kinase‖,
Genes Dev. 13, 916
Tawardowska-Saucha K, Grzeszczak W, Lacka B, Froehlich J, Krywult D. Lipid
peroxidation, antioxidant enzyme activity and trace element dose in II and III
trimester of pregnancy in pregnant women with diabetes. Pol Arch MedWomen
1994; 92:313]321.
Takahashi K, Avissar JW, Cohen H. Purification and characterization of humna
plasma glutathione peroxidase:a selenoglycoprotein distinct from the known cellular
enzyme. Arch Biochem Biophys.1987; 256: 677-686

126
Takahashi, H., French, S. M., and Wong, P. T. T., (1991). ―Alterations in hepatic
lipids and proteins by chronic ethanol Intake: A highpressure Fourier transform
Infrared spectroscopic study on alcoholic liver disease in the rat alcohol‖. Clin. Exp.
Res., 15(2): 219-223.
Thomson, C.D., Robinson, M.F., 1996. The changing selenium status of New
Zealand residents. Evr.J.Clin.Nutr.50, 107
Tsilibary EC. Microvascular basement membranes in diabetes mellitus. J Pathol
2003; 200:537–546.
Thomas JP, Maiorino M, Ursuni F, Girotti Aw. A protective action of phospholipids
hydropexide glutathione peroxides against membrane-damaging lipid peroxidation:
in situ reduction of phospholipids and cholesterol hydro peroxides. J Biol
Chem.1990; 265:454-461
Thomas JP, Geiger PG, Maiorino M, Ursuni F, Girotti Aw. Enzymatic reduction of
phospholipid and cholesterol hydro peroxides inartificial bilayers and lipoproteins.
Biochim. Biophys Acta 1990: 1045: 252-276
Toyran, N., Lasch, P., Naumann, D., Turan, B., Severcan, F., (2006). ―Early
alterations in myocardia and vessels of the diabetic rat heart: an FTIR micro
spectroscopic study‖, Biochem J., 397(3):427-36.
Toyran, N., and Severcan, F., (2003). ―Competitive effect of vitamin D2 and Ca2+
on phospholipids model membranes: an FTIR study‖, Chem. Phys.Lipids, 123:165-
176.
Toyran, N., Zorlu, F., Donmez, G., Oge, K., Severcan, F., (2004). ―Chronic
hypoperfusion alters the content and structure of proteins and lipids of rat brain
homogenates: A Fourier transform infrared spectroscopy study‖, Eur. Biophys.
J., 33: 549–554.

127
Toyran,N.,Turan,B.,Severcan,F.,.‘‘Selenium alters the lipid content and protein
profile of rat heart:An FTIR microspectroscopic study‘‘.Archives of Biochemistry
and Biophysics 458(2007) 184-1
93.
Tomlinson, K. C., Gardiner, S. M., Hebden, R. A. and Bennett, T., (1992).
―Functional consequences of streptozotocin-induced diabetes mellitus, with
particular reference to the cardiovascular system‖. Pharmacol Rev., 44:103-1
50.
Tsuboi, M., (1969). Application of infrared spectroscopy to structure studies of
nucleic acids, Applied Spectroscopy Reviews, Dekker, New York, pp. 45–90
Ursini, F., Bindoli, A., 1987. The role of selenium peroxidasesin the protection
against oxidative damage of membranes. Chem. Phys. Lipids 44, 255_/276.
Ursuni F, Pelosi G, Tomassi G, Benassi A, Di elice M,Barsacchi R. Effect of dietary
ats on hydro peroxide-induced chemiluni emission and eicosanoids release in the rat
heart. Biochim Biophys Acta. 1987; 919:93-96
Ursini, F., Bindoli, A., 1987. The role of selenium peroxides in the protection against
oxidative damage of membranes. Chem. Phys. Lipids 44, 255_/276.
Varela-Calvino R, Peakman M. Enteroviruses and type 1 diabetes. Diabetes Metab
Res Rev 2003; 19: 431–441
Vanderpas JB, Contempre B, Duale NL, Goossens W, Bebe N, horpe R ,Ntambue K,
Dumont J, Thilly CH, Diplock AT. Iodine and selenium deficiency associated with
cretinism in nortern Zaire. Am J Clin Nutr. 1990; 52: 1087 - 1093
Vendeland SC, Beilstein MA, Chen CL, kensen ON, Barofsky E, Whanger PD.
Purification and properties of selenoprotein W rom rat muscle. J Biol Chem. 1993;
268: 17103-1
7107

128
Wagner L, Laczy B, Tamasko M. et al. Cigarette smoke-induced alterations in
endothelial nitric oxide synthase phosphorylation: role of protein kinase C.
Endothelium 2007; 14:245–255
Wells L, Hart GW. O-GlcNAc turns twenty: functional implications for post-
translational modification of nuclear and cytosolic proteins with a sugar. FEBS Lett
2003; 546: 154–158
Wong, P.T.T., Wong, R.K., Caputo, T.A., Godwin, T.A., Rigas, B., (1991). ―Infrared
spectroscopy of exfoliated human cervical cells: Evidence of extensive structural
changes during carcinogenesis‖, Proc. Nati. Acad. Sci., 88: 10988-1
0992.
and information storage and
Wang WC, Makela AL, Nanto V, Makela P. Serum selenium levels in diabetic
children. A follow-up study during selenium-enriched agricultural fertilization in
Finland. Biol Trace Elem Res 1995; 47:335-364.
Wang, J., Chi, C., Lin, S., and Chern, Y., (1997). ―Conformational changes in gastric
carcinoma cell membrane protein correlated to cell viability after treatment with
adamantyl maleimide‖, Anticancer Research, 17: 3473-3478.
Wendt TM, Tanji N, Guo J. et al. RAGE drives the development of
glomerulosclerosis and implicates podocyte activation in the pathogenesis of diabetic
nephropathy. Am J Pathol 2003; 162: 1123–1137?
Wolf G, Ziyadeh FN. Cellular and molecular mechanisms of proteinuria in diabetic
nephropathy. Nephron Physiol 2007; 106:26–31.
Wolf G, Chen S, Ziyadeh FN. From the periphery of the glomerular capillary wall
toward the center of disease: podocyte injury comes of age in diabetic nephropathy.
Diabetes 2005; 54: 1626–1634

129
Wilson DS, Tappel AL .Subcellular fate of selenium from 75 S- labeled plasma
selenoprotein P in selenium deficient dier. J Nutr Biochem.1993: 4:208-211
Yard BA, Kahlert S, Engelleiter R. et al. Decreased glomerular expression of agrin in
diabetic nephropathy and podocytes, cultured in high glucose medium. Exp Nephrol
2001; 9:214–222
Yang, I.-G., Morrison-Plummer, J., Burk, R. F. 1987. l. Biol. Chern. 262: 13372-75
Yang,G.,Wang,S.,Zhou,R.,Sun,S.,1983. Endemic selenium intoxication of humans in
China. Am.J.Clin.Nutr.37,872-881
Yilmaz O., Celik S., Cay M. and Naziroglu lu, M. (1997). Protective role of
intraperitoneally administered vitamin E and selenium on the level of total lipid, total
cholesterol and fatty acid composition of muscle and liver tissues in rats. J.Cell
Biochem., 64, 233-241.
Yoon JW, Jun HS. Cellular and molecular pathogenic mechanisms of insulin-
dependent diabetes mellitus. Ann N Y Acad Sci 2001; 928: 200–211
Zwaal R.F.A., A.J. Schroit, Pathophysiologic implications of membrane
phospholipids asymmetry in blood cells, Blood 89 (1997) 1121-132