the effects of solar farms on local biodiversity · i the effects of solar farms on local...
TRANSCRIPT

THE EFFECTS OF SOLAR FARMS ON LOCAL
BIODIVERSITY: A COMPARATIVE STUDY
BY
HANNAH MONTAG, DR GUY PARKER & TOM CLARKSON
Joint Funded By:
APRIL 2016

THE EFFECTS OF SOLAR FARMS ON LOCAL
BIODIVERSITY: A COMPARATIVE STUDY
AUTHORS:
HANNAH MONTAG1, DR GUY PARKER2 & TOM CLARKSON1
1 Clarkson & Woods
2 Wychwood Biodiversity
This document should be referenced as: H. Montag, G Parker & T. Clarkson. 2016. The Effects of Solar
Farms on Local Biodiversity; A Comparative Study. Clarkson and Woods and Wychwood Biodiversity.
The information, data and advice which has been prepared and provided is true, and has been prepared and provided in accordance with the Chartered Institute of Ecology and Environmental Management’s (CIEEM) Code of
Professional Conduct. We confirm that the opinions expressed are our true and professional bona fide opinions.
Acknowledgements
This research follows on from a preliminary study conducted by Guy Parker and Charlie McQueen in
2013. The same methodologies have been utilised for this project, with some expansion to include
further taxa.
This project was initiated by Kate Covill of Orta Solar, who also sourced the funding for the work. Kate
was instrumental in setting up the project and it would not have been possible without her enthusiasm
and perseverance.
We would like to thank those solar organisations who allowed us access to their sites, as well as the
site managers who met us on site (often early in the morning) and helped with setting up the
equipment. Thank you also to the landowners who provided us with an adjacent control plot.
The fieldwork was undertaken by Hannah Montag, Harry Fox, Jo Donnelly and Mark Baker of Clarkson
& Woods and by Charlie McQueen, Florence Parker-Jurd and Clare Halliday of Wychwood Biodiversity.
We would also like to thank Belinda Howell and Phil Bowater from Clarkson & Woods and Florence
Parker-Jurd of Wychwood Biodiversity who helped with analysis and number crunching.
Thank you to Dr. Jonathan Scurlock of the National Farmers’ Union and Dr John Feltwell for providing
comments on the draft report.
Several photographs used within this report should be credited as G Parker Westmill 2013. Please
contact the authors for further details if required.
Published by Clarkson & Woods and Wychwood Biodiversity
Copyright © Clarkson & Woods and Wychwood Biodiversity ISBN: 978-1-5262-0223-9

i
THE EFFECTS OF SOLAR FARMS ON LOCAL BIODIVERSITY: A COMPARATIVE STUDY
CONTENTS
NON-TECHNICAL SUMMARY ........................................................................................................................................ II
1 INTRODUCTION ................................................................................................................................................... 1
2 OBJECTIVE AND AIMS ......................................................................................................................................... 2
3 APPROACH ........................................................................................................................................................... 3
3.1 SITE SELECTION AND SURVEY DESIGN ................................................................................................................... 3 3.2 SITE MANAGEMENT .............................................................................................................................................. 4 3.3 DATA COLLECTION ............................................................................................................................................... 7
3.4 STATISTICAL ANALYSIS ......................................................................................................................................... 7
4 LIMITATIONS ........................................................................................................................................................ 9
4.1 SITE SELECTION................................................................................................................................................... 9 4.2 BOTANY ............................................................................................................................................................... 9 4.3 BIRDS .................................................................................................................................................................. 9 4.4 INVERTEBRATES ................................................................................................................................................... 9
4.5 BATS ................................................................................................................................................................... 9 4.6 GENERAL ........................................................................................................................................................... 10
5 RESULTS ............................................................................................................................................................ 11
5.1 INTRODUCTION ................................................................................................................................................... 11 5.2 BOTANY ............................................................................................................................................................. 11 5.3 INVERTEBRATES ................................................................................................................................................. 15 5.4 BIRDS ................................................................................................................................................................ 19 5.5 BATS ................................................................................................................................................................. 24 5.6 OBSERVATIONS OF OTHER SPECIES.................................................................................................................... 26
6 RANKING OF SOLAR SITES .............................................................................................................................. 27
7 DISCUSSION....................................................................................................................................................... 30
DOES ACTIVE MANAGEMENT OF SOLAR FARMS LEAD TO GREATER BOTANICAL DIVERSITY? ............................................... 30 DO THE PHYSICAL STRUCTURES OF SOLAR FARMS ENCOURAGE A GREATER BOTANICAL DIVERSITY WHEN COMPARED WITH
EQUIVALENT UNDEVELOPED AGRICULTURAL LAND? ........................................................................................................ 32 CAN SOLAR FARMS ENCOURAGE GREATER INVERTEBRATE DIVERSITY? ........................................................................... 33 CAN SOLAR FARMS ENCOURAGE A GREATER DIVERSITY OF BIRDS? ................................................................................. 34 CAN SOLAR FARMS ENCOURAGE A GREATER DIVERSITY OF BATS? .................................................................................. 36 OTHER OBSERVATIONS ................................................................................................................................................ 38
8 CONCLUSIONS................................................................................................................................................... 39
AREAS OF POTENTIAL FUTURE RESEARCH ............................................................................................................ 40
9 MANAGEMENT RECOMMENDATIONS ............................................................................................................. 41
10 REFERENCES .................................................................................................................................................... 42
APPENDIX A: SURVEY METHODOLOGIES ................................................................................................................ 43
APPENDIX B: STATISTICAL ANALYSIS....................................................................................................................... 45
APPENDIX C: GROUND NESTING BIRD TERRITORY MAPS ..................................................................................... 46

ii
NON-TECHNICAL SUMMARY
Very little research has been carried out on the impacts of solar farms on biodiversity, despite the
proliferation of this industry within the UK.
This study investigates whether solar farms can lead to greater ecological diversity when compared with
equivalent undeveloped sites. The research focussed on four key indicators; botany (both grasses and
broadleaved plants), invertebrates (specifically butterflies and bumblebees), birds (including notable
species and ground nesting birds) and bats, assessing both species diversity and abundance in each
case.
A total of 11 solar farms were identified across the southern UK for inclusion in this study. All sites had
been completed for at least one growing season. Approaches to land management varied from primarily
livestock grazing through to primarily wildlife-focused management. At each site the level of management
for wildlife was assessed as low, medium or high based upon activities such as re-seeding, grazing or
mowing regimes, use of herbicides and management of hedgerows and field margins.
To assess changes in biodiversity relating to the solar farm, we compared wildlife in the solar farm to
wildlife at a “control” plot nearby. The control plot was outside the solar array, but within the same farm.
Most importantly, the control plot was under the same management as the solar farm was prior to its
construction. The purpose of the control plot was to give an indication of wildlife levels before the solar
farm was constructed.
Botanical, invertebrate, bird and bat surveys were then carried out during 2015 on both the solar plot and
the adjacent matched control plot. The results of these surveys were compared statistically to identify any
changes in biodiversity the solar farm, and its land management, had brought about.
The results of the botanical surveys revealed that over all, solar farms had greater diversity than control
plots, and this was especially the case for broadleaved plants. This greater diversity was partly the result
of re-seeding of solar farms: where species-rich wild flower mixes had been sown this diversity was
greater, but even where agricultural grass mixes had been used diversity was greater as compared to the
largely arable control plots.
Management of grassland also influenced botanical diversity. At sites with conservation grazing (winter
and spring sheep grazing with a pause through the summer for wild flowers to flower and set seed), plant
diversity had increased through natural processes as compared to the original seed mix.
The invertebrate surveys revealed that butterflies and bumblebees were in greater abundance on solar
farms than on control plots, and the greatest numbers occurred where botanical diversity was also high.
The number of species did not differ significantly between most solar farms and control plots. However,
at several sites with higher botanical diversity, and where management for wildlife was considered to be
‘high’, a greater diversity of bumblebee and butterfly species was observed.
The bird surveys revealed that over all, a greater diversity of birds was found within solar plots when
compared with control plots. On two of the sites, a greater abundance of birds was observed on the solar
farms when compared with control plots. The greater abundance and species of birds on these sites
suggests foraging opportunities within the solar farms are greater than on the adjacent undeveloped sites.

iii
This is likely to reflect the change from a homogenous arable environment to a diverse grassland habitat
that also contains structures for cover or perching.
When weighting bird species according to their conservation status, solar farms scored significantly higher
in terms of bird diversity and abundance, indicating their importance for declining bird species. The decline
of many of these species has been attributed to intensification of agricultural practices. Solar farms with
a focus on wildlife management tend towards limited use of pesticides, lower livestock stocking densities
and the re-establishment of field margins, which would benefit many of these bird species.
There was no overall difference in the numbers of skylark territories when comparing solar plots to control
plots, although one site showed a significantly higher number within the control plot. Nesting skylarks were
confirmed within several of the control plots but at only one solar plot. The nest within the solar plot was
located within the security fencing surrounding the array, but outside of the actual footprint of the array.
The study shows that although skylarks may not nest beneath solar arrays, they do nest within solar farms
and they do incorporate solar farms into their territorial boundaries for foraging.
The results of the bat surveys revealed that there were significantly higher levels of bat activity at the
control plots when compared with the solar plots at three of the sites but no difference in bat diversity. The
lower levels of bat activity within the solar plots may reflect the problems bats have discerning artificially
smooth surfaces such as solar panels. The results of the survey are, however, inconclusive due to
potential issues with the survey methodology and warrant further research into this area.
Observations of other species during the surveys included the presence of owl pellets on the solar panels,
indicating that owls were utilising them for perching. Large numbers of brown hare were also noted within
the solar farms at several of the sites.
When sites were ranked for overall biodiversity value, it was revealed that the three sites with the greatest
management focus towards wildlife ranked highest for biodiversity overall.
In conclusion, the study revealed that solar farms can lead to an increase in the diversity and abundance
of broad leaved plants, grasses, butterflies, bumblebees and birds. The level of benefit to biodiversity is
highly dependent on the management of the site, with greater focus on wildlife management leading to
greater biodiversity benefit. The sites with the highest wildlife value were seeded with a diverse seed mix
upon completion of construction, limited the use of herbicides, provided good marginal habitat for wildlife
and employed a conservation grazing or mowing regime.

1
1 INTRODUCTION
Background to the Project
1.1.1 Solar Photovoltaic (PV) technology is a relatively new industry within the UK, which has expanded greatly
over the last five years from a total capacity of around 32MW in 2010 to over 8GW in 20151.
1.1.2 PV technology can be utilised in many ways, however, the main area of growth has been large-scale solar
farms which are often constructed on agricultural land or brownfield sites. These can range in size from
1ha to 90ha and have varied greatly in terms of the management of the site post-construction, with some
being managed specifically for wildlife and others continuing to be agriculturally worked, predominately
through sheep grazing.
1.1.3 During the planning process, a greater emphasis has been placed on seeking ecological enhancements
over the last few years as wildlife benefits are perceived to balance any negative effects relating to visual
impact as well as contributing to national and local conservation targets. Several guidance documents
have been produced to guide developers and local authorities, including Natural England’s “TIN 101: Solar
Parks: Maximising Environmental Benefits”2 and BRE / National Solar Centre’s “Biodiversity Guidance for
Solar Developers”3, which was produced with input from a number of solar development companies and
environmental organisations.
1.1.4 Despite the growing emphasis on ecological enhancements within solar farms, very little research has
been undertaken on the effects of solar farms on wildlife in the UK and the effectiveness of these
enhancements. A literature review carried out by BSG in 20144 highlighted the limited availability of
research in this area and the difficulty in drawing conclusions on the potential impacts of solar farms on
wildlife. Much of the research has been carried out within other European countries, where solar farms
are often constructed within very different habitats, or in the United States, where concentrated solar
power technologyi is utilised in addition to PV.
1.1.5 A preliminary study was conducted in the UK in 2013 which measured biodiversity within four solar farms,
each with neighbouring control plots. The study focussed on grassland herbaceous plants, butterflies and
bumblebees and concluded that under suitable management, solar farms can deliver measurable benefits
to biodiversity5. The study has been used as a basis for further research, as outlined within this report,
with a widened scope to look at a larger number of sites and wider indicator taxa. A similar study carried
out in 2013 recorded greater biodiversity on a solar farm in West Sussex as compared to an adjoining
arable field6.
iThis system uses mirrors or lenses to focus sunlight onto a small fixed point where heat energy can be utilised and impacts on
wildlife are very different when compared with PV technology.

2
2 OBJECTIVE AND AIMS
2.1.1 The purpose of this study is to investigate whether solar farms are able to increase the ecological value
of the land they occupy. The over-arching objective, posed as a question, is: ‘Can solar farms and their
associated management lead to a greater ecological diversity as compared to equivalent undeveloped
land?’ This objective can be broken down to the following questions:
2.1.2 Can solar farms create conditions for greater botanical diversity? There are likely to be changes in
botany resulting from the change of land management within the solar farm. The reduction in the intensity
of agricultural activities including the application of herbicides and fertilizers may result in a greater floristic
diversity. Less intensive grazing may also encourage the establishment of broadleaved plants. Solar farms
may have management in place designed specifically to encourage wildlife, for example, diverse native
seed mixes established and with no grazing or cutting through the flowering season. The study explored
the difference in plant diversity between a solar farm and control plot (land which is under the same
management as the solar farm was previously) in order to determine any changes in botany relating to
land management. In addition to management, the solar farm structure may provide a variety of
microclimates with shaded and unshaded areas or wetter and drier environments resulting from the
physical effects of installing solar panels within the field. This study investigated whether there was a
difference between the assemblage of plants directly beneath the solar panels with that between the rows,
where more sunlight and rainfall would be expected to reach.
2.1.3 Can solar farms encourage greater invertebrate diversity? The reduction in intensive agricultural
management and potential increase in botanical diversity would be likely to affect other taxonomic groups,
such as invertebrates, which rely on plants for food and shelter. This study investigated whether a greater
diversity and abundance of invertebrates was encountered within solar farms when compared to an
adjacent control plot.
2.1.4 Can solar farms encourage a greater diversity of birds? The increase in plant diversity and reduction
in agricultural pressure may provide suitable conditions for farmland birds, with a corresponding increase
in bird diversity. This study investigated both number of species and their abundance, but also the
conservation significance of the birds recorded. Bird diversity was compared between solar farm and
control plot. In addition, the pattern of use within the solar farm (within the array, site margins) was
investigated. There is a general consensus that ground-nesting birds which require unbroken sightlines,
such as skylarks Alauda arvensis, will be discouraged from nesting within solar farms due to the cluttered
environment, however, no studies have been conducted to examine this theory. The study examined the
presence of ground nesting birds and how they utilise solar farms, including feeding and nesting sites, if
present.
2.1.5 Can solar farms encourage a greater diversity of bats? The study also investigates the usage of solar
farms by bats. Should solar farms offer a greater invertebrate abundance and diversity, this may result in
a valuable foraging resource for bats and it has been theorised that the solar panels may even act as
navigational features for bats in the same way that linear habitats such as hedgerows and watercourses
do. Bat diversity was measured and compared between solar farms and their control plots.
3
3 APPROACH
3.1 Site Selection and survey design
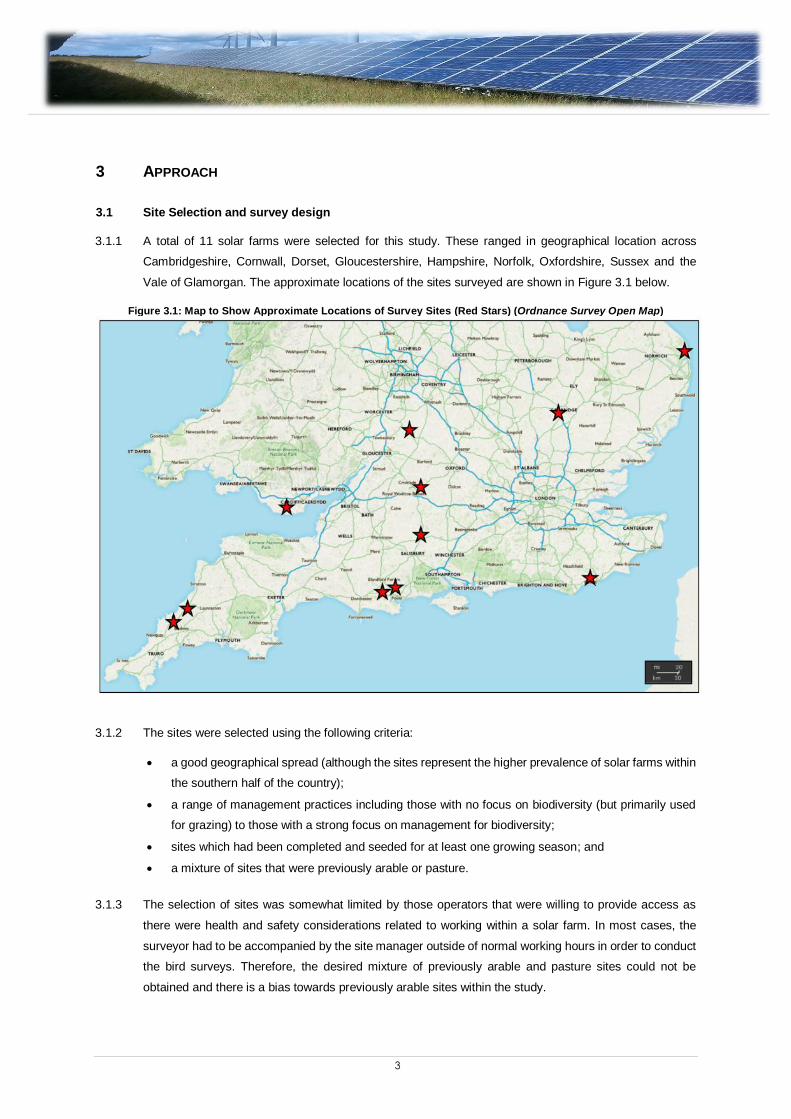
3.1.1 A total of 11 solar farms were selected for this study. These ranged in geographical location across
Cambridgeshire, Cornwall, Dorset, Gloucestershire, Hampshire, Norfolk, Oxfordshire, Sussex and the
Vale of Glamorgan. The approximate locations of the sites surveyed are shown in Figure 3.1 below.
Figure 3.1: Map to Show Approximate Locations of Survey Sites (Red Stars) (Ordnance Survey Open Map)
3.1.2 The sites were selected using the following criteria:
a good geographical spread (although the sites represent the higher prevalence of solar farms within
the southern half of the country);
a range of management practices including those with no focus on biodiversity (but primarily used
for grazing) to those with a strong focus on management for biodiversity;
sites which had been completed and seeded for at least one growing season; and
a mixture of sites that were previously arable or pasture.
3.1.3 The selection of sites was somewhat limited by those operators that were willing to provide access as
there were health and safety considerations related to working within a solar farm. In most cases, the
surveyor had to be accompanied by the site manager outside of normal working hours in order to conduct
the bird surveys. Therefore, the desired mixture of previously arable and pasture sites could not be
obtained and there is a bias towards previously arable sites within the study.

4
3.1.4 A field within the solar farm was identified for survey. For some sites, this comprised the entire array and
with others it was one field within a larger solar farm. The surveyed field within the array (hereafter referred
to the ‘solar plot’) was then matched with a field within the same land ownership, but outside the solar
farm (the ‘control plot’). Considerations when choosing the control plot included size, shape, similarity in
adjacent vegetation, and distance from roads. The control plots were under the same management regime
(i.e. arable crop production or intensive pasture) as the solar plot was prior to the construction of the array.
3.1.5 The purpose of the control plot was to provide an indication of the level of biodiversity occurring if the solar
farm had not been developed. Survey results from the solar plot and control plot were compared
statistically to investigate any difference, so providing an indication of any biodiversity changes occurring
as a result of the solar development, and specifically, the land management associated with the solar
farm.
3.2 Site Management
3.2.1 The management of the solar and control plots at the time of the survey are outlined in Table 3.1, including
any seeding, grazing or mowing, use of herbicides and a description of boundary features such as
hedgerows and field margins.
3.2.2 The final column of the table below shows a qualitative evaluation of the approach that the solar site
adopts with respect to wildlife. This has been calculated based upon a consideration of the approach
adopted by the manager of the array to a range of issues:
whether the site was seeded with a diverse seed mix;
if and how herbicides were used;
whether the site was subject to grazing or mowing and how this was managed; and
whether the field margins were managed in an ecologically sensitive manner.
3.2.3 Each site was scored according to the approach under each of these categories with an overall ranking
of ‘high’, ‘medium’ or ‘low’ awarded to each site based upon the scores within the various categories. This
methodology and the outcomes are therefore subjective. The outcomes were however cross-checked
with the professional opinion of the field surveyors regarding the approach to habitat management within
the solar array and the outcomes were found to be similar and as such, this qualitative approach to
assessment is considered to be robust.

5
Table 3.1: Description of the Management of the Solar and Control Plots
Site No.
Surveyed Areas (ha) Location Context Date Solar
Farm Connected
Details of Solar Farm
Seeding
Grazing/ Mowing Regime on Solar
Plot
Use of Herbicide on Solar
Site
Description of Field Boundaries on Solar Site
Description of Field Boundaries on Control
Site
Mgmt of Control
Plot
Mgmt Plan Adhered to?
Mgmt focus towards wildlife
Site
1
Surveyed solar plot: 9.69ha Entire solar site: 17.17ha Size of control plot: 11.3ha Distance between solar and control plots: 280m
In a predominantly arable setting, with occasional woodland coppices, and adjacent a reservoir to the east.
February 2013 Seeded with a rye-grass grazing mix
Cutting and removal of arisings x 3 per year.
Spraying beneath panels to control vegetation.
Hedgerow on all edges with newly planted infill (approx. 6 years ago). Diverse with good structure. Trees planted along N boundary.
East side, 30m wide band of tree/shrub planting. Northern boundary is a private railway line. South and west are hedgerows.
Rape-seed crop (non-organically farmed)
N/A. No management plan
Medium
Site
2
Surveyed solar plot: 11.68ha Entire solar site: 16ha Size of control plot 11.71ha Distance between solar and control plots: 17m
Surrounded by a mix of agricultural land, disused quarries, and plantation and broadleaved woodlands.
March 2014 Seeded with a rye-grass grazing mix
Sheep in a permanent rotation – approximately 100 sheep.
Limited – spot treatment.
Mix of mature and newly planted hedgerows with generous grass strip (at least 3m) between hedge and security fence of solar farm. This grass strip was managed by a mechanical cut in late summer.
Mature hedgerows with some large standards. Field seeded tight to the hedgerow.
Silage (non-organically farmed)
Biodiversity Management Plan – not fully adhered to: specified 3 different seed mixes such as EM5, EM10 and retained arable herbs which were not planted.
Low
Site
3
Surveyed solar plot: 5ha Entire solar site: 30ha Size of control plot: 3.5ha Distance between solar and control plots: 27m
Mixed landscape with pasture, coastal grazing, rivers, lowland fens and a range of broadleaved woodlands. Either side of an A-road and north of a river.
March 2014 Seeded with a rye-grass grazing mix
Conservation grazing from 2015, with sheep taken off during summer and a mechanical cut in summer 2015.
No Mix of mature and newly planted hedgerows with generous grass strip (2-4m) between hedge and security fence of solar farm. This grass strip was managed by a mechanical cut in late summer. The hedge of the southern boundary of the solar farm runs alongside a ditch.
Mature hedgerows and woodland at boundary. Field planted tight to the boundary with less than a 1m margin between crops and the field boundary.
Barley (non-organically farmed)
Biodiversity Management Plan – not fully adhered to: specified planting species rich acid grassland in 10 areas beneath the arrays, these were not planted. Some bird boxes installed and new hedgerows planted.
Low
Site
4
Surveyed solar plot: 13.6ha Entire solar site: 29ha Size of control plot: 11.8ha Distance between solar and control plots: 10m
Surrounded by largely arable farmland, a mix of broadleaved woodlands and coastal grazing. 1.6km from the coast.
March 2014 Seeded with a rye-grass grazing mix
Sheep in a permanent rotation – approximately 100 sheep.
Spot spraying of thistle & docks. Blanket spraying of fence line areas and inverter areas.
Hedges of varying age: some mature with standards, some newly planted. On one boundary between the hedge and the security fence there is a grass margin of approx. 4m, which is managed with twice yearly cuts.
Hedges of varying age: some mature with standards, some newly planted. The control site was planted with crop tight to the hedgerow.
Barley (non-organically farmed)
Biodiversity Management Plan – not fully adhered to: specified sowing of areas with a meadow seed mix, which was not done.
Med
Site
5
Surveyed solar plot: 18ha (the entire solar site was surveyed) Size of control plot: 11.3ha Distance between solar and control plots: 20m
Mixed farmland with areas of ancient broadleaved woodlands and lowland fens.
February 2015 Seeded with King’s Species Rich Grass Mix (contains 7 species of native grasses) as well as 13 species of native wildflower
Conservation grazing, with sheep taken off during summer for a flowering break.
Some mowing to control weeds.
Wide field margins in places (over 30m) managed for wildlife. Mature hedgerows with some tree planting. Small woodland copses present at boundaries.
Narrow field margins. Mature hedgerows with areas of woodland present.
Broad bean crop (non-organically farmed)
Site Environmental Management Plan fully adhered to.
High
Site
6
Surveyed solar plot: 14ha (the entire solar site was surveyed) Size of control plot: 13.4ha Distance between solar and control plots: 6m
A mix of ancient woodland and conifer plantation woodland. Less than 2km from the coast.
March 2014 Seeded with a rye-grass grazing mix
Conservation grazing from 2015, with sheep taken off during summer and a mechanical cut in summer 2015.
No Mature hedgerows with large standards and woodland. Generous grass strip (at least 3m) between hedge and security fence of solar farm. This grass strip was managed by a mechanical cut in late summer.
Mature hedgerows with large standards and woodland. Field seeded tight to the hedgerow.
White clover ley (non-organically farmed)
Biodiversity Management Plan – not fully adhered to: specified planting species rich acid grassland in 10 areas beneath the arrays and tussocky grassland strips, these were not planted.
Med

6
Site No.
Surveyed Areas (ha) Location Context Date Solar
Farm Connected
Details of Solar Farm
Seeding
Grazing/ Mowing Regime on Solar
Plot
Use of Herbicide on Solar
Site
Description of Field Boundaries on Solar Site
Description of Field Boundaries on Control
Site
Mgmt of Control
Plot
Mgmt Plan Adhered to?
Mgmt focus towards wildlife
Site
7
Surveyed solar plot: 13.33ha (the entire solar site was surveyed) Size of control plot: 20.4ha Distance between solar and control plots: 10m
Predominantly mixed agricultural landscape with mature hedgerows and small patches of woodland, A-roads run near the south and east bounds of the site.
March 2013 Originally seeded with Emorsgate EM2 or EM6 but seed did not establish. Will be reseeded April/May 2016.
Mowed Spot spraying of weeds
40-50m wildflower meadow buffer present along south and southwest bounds comprising fine grasses, red campion, daisies, no dense thatch formed yet. Control and solar site share a woodland belt along the western boundaries. The remainder of the hedges had been in-fill planted and had varied structures.
Western boundary is a woodland belt, the northern Is a mature hedgerow, the southern boundary is a gappy but developing hedgerow and the eastern a line of scrub.
Arable crop (non-organically farmed)
Biodiversity Management Plan produced – not fully adhered to: bat and bird boxes have not been installed, and conifer trees were planted along the hedgerows instead of he recommended native trees.
Med
Site
8
Surveyed solar plot: 5.12ha Entire solar site: 16.1ha Size of control plot: 5.72ha Distance between solar and control plots: 10m
Agricultural landscape dominated by improved grassland with occasional small pockets of woodland.
March 2014 Not seeded by solar operator, but likely to have been seeded with rye-grass grazing mix by farmer
Sheep grazed N/A - No weed control has yet taken place.
Diverse field margins planted with clover mix, although not forming tussocky structure as yet. Hedgerows mature with standard trees with some evidence of poaching by sheep.
Hedgerow around entire field. Mature, with standard trees.
Maize crop (spring sown) (non-organically farmed)
N/A - No management plan produced.
Med
Site
9
Surveyed solar plot: 4ha Entire solar site: 14.19ha Size of control plot: 3.9ha Distance between solar and control plots: 130m
Predominantly arable landscape with patches of broadleaved and some ancient woodland, and a river running 350m east of the site.
March 2013 Seeded yearly with rye-grass grazing mix
Hay cut and sheep grazed at time of survey
Spot spraying of weeds
A max of 15m between the site security fence and the hedge which runs around ¾ of the site, kept mown by the farmer. The hedge to the west of the site had failed to establish. Shares a hedge with the control site.
Earth bund covered by wildflowers along lane to the south. Hedgerow along lane to the east. Hedgerows along west and northern sides.
Barley crop (non-organically farmed)
No management plan though the Planting Plan was not adhered to. The native hedgerow along the west of the site had failed to establish and EM1 seed mix was not used.
Low
Site
10
Surveyed solar plot: 12.14ha (the entire solar site was surveyed) Size of control plot: 16.18ha Distance between solar and control plots: 190m
Row of wind turbines along the northern boundary. A-road to south. Mixed agricultural landscape with patches of woodland.
July 2011 Diverse wildflower mix (8 species of broadleaved plant)
Annual cut with sheep grazing through the winter and spring (conservation grazing)
Selective spot spraying of problem sp. (thistle, dock, nettle)
Large grassland buffer around site. Extensive open areas within fenced area. Good connectivity between seeded grassland in array with other corridors of seeded grassland along tracks and beneath turbines. A hedgerow to the south and east but no other boundaries. Wind turbines to the north with grassy field margin.
South-west boundary has a course grassland/scrub strip with a large number of poppies. Scrub/field margin along lane to the west. Wind turbines to the north, below which is seeded with wildflower mix. No boundary to the east.
Barley (non-organically farmed)
N/A - No management plan was produced.
High
Site
11
Surveyed solar plot: 9.3ha (the entire solar site was surveyed) Size of control plot: 10.8ha Distance between solar and control plots: 22m
In a predominantly agricultural (mixed arable and pasture) landscape with small patches of woodland and some mature hedgerows.
March 2014 Seeded with a mixture of native and non-native pollinator attracting plants. Not seeded directly beneath panels.
Wildlife-sensitive mowing regime employed (2 to 3 cuts per year).
N/A - no weed control beyond mowing.
Site bounded by mixed hedgerows.
Long grass left on part of the site (possibly for skylarks). Hedgerows present on three sides of boundary (E, N and W). Grassland and scrub developing to the SW.
Newly planted grass crop cut for silage (non-organically farmed)
Habitat Management Portfolio - bird boxes have been installed, as well as reptile hibernacula and small pond.
High

7
3.3 Data Collection
3.3.1 Four biodiversity indicators were selected: botany, birds, invertebrates (bumblebees and butterflies) and
bats. The survey protocol for each discipline is provided within Appendix A. A brief description of the
approach to data collection is outlined below.
3.3.2 These indicators were selected for a variety of reasons including: the role and importance of the receptor
within an ecological community; whether the species group is used as a typical indicator of biodiversity
and ecosystem health7; the ease and practicality of collecting information within the available survey
period and budget; species groups for which questions remain regarding the impact of solar arrays; and
species groups which are thought to be adversely affected by solar arrays.
Botany
3.3.3 Quadrat surveys were used to compare the botany present within the solar array and the control plot. Ten
quadrats were surveyed within the solar plot (from between the panel rows) and 10 quadrats from the
control plot for this purpose. Within the solar plot, a further 10 quadrats were collected directly beneath
the solar panel rows. These quadrats were compared to those collected between the rows to assess the
effects of shading and water stress on plant communities. The locations of the quadrats were randomly
picked prior to visiting site in order to avoid surveyor bias.
Invertebrates
3.3.4 Invertebrate surveys focussed on bumblebees and butterflies within both the solar plot and control plot.
A total of ten, 100m transects were walked within the solar plot and within the control plot; these transects
were spaced evenly through the site. The species and number of individuals were recorded on each
transect.
Birds
3.3.5 Three bird surveys were conducted both within the solar plot and within the control plot. Surveyors walked
a pre-defined transect route recording the species and abundance of all birds seen or heard. Additionally,
the behaviour of each bird was categorised into calling/singing, foraging or flying over site and the location
of the bird was marked as either within the field or the field boundary. This method is an adapted form of
the Breeding Bird Survey (BBS) method developed by the RSPB, BTO and JNCC8.
3.3.6 Ground nesting birds were mapped and behaviours recorded in order to assess the numbers of territories
and presence of active nests.
Bats
3.3.7 Static bat detectors were installed within both the solar plot and the control plot. Microphones were set
approximately 50m from the nearest field boundary at a height of approximately 3m. These were left
recording for around 10 nights and the data subsequently analysed using Kaleidoscope Pro software. This
methodology allowed an assessment of the number of bat species using each site and the number of
passes per night, giving an indication of activity levels.
3.4 Statistical Analysis
3.4.1 The data was subject to various statistical analyses in order to demonstrate whether any of the
relationships and patterns observed were statistically significant. Chi-Squared Test was used to consider

8
differences between the findings within the solar plot and the control plot and Mann Witney-U Test was
used to assess the significance of overall differences between the control and solar plots in the aggregated
findings for all sites. Further details of the statistical analyses used are presented in Appendix B.

9
4 LIMITATIONS
4.1 Site Selection
4.1.1 Where possible, the control plot was selected to reflect the management of the solar plot immediately prior
to the construction of the array. However, one of the solar farms (Site 2) was constructed on land used
previously for arable crop production but was within a farm where arable and pasture rotation was
undertaken. At the time of survey it was only possible to select a control plot under intensive pasture
management. Given the regular rotation of this land between pasture and arable, this was not seen as a
major limitation.
4.1.2 It was not possible to obtain a good mixture of sites which were previously arable and pasture, due to
difficulties in gaining access to sites. Therefore, the study shows a bias towards previously arable plots,
with only two (Sites 6 and 11) on previously pasture land.
4.2 Botany
4.2.1 Several of the sites had recently been cut or were grazed to a very short sward by sheep. It most cases,
plants could be identified to species level; however, it is possible that some species may have been missed
due to not being apparent during the survey.
4.3 Birds
4.3.1 Surveys were conducted between April and July; bird surveys become less effective later in the season
as males stop singing and defending territories when they are feeding young, therefore, surveys
conducted in June and July may have under-recorded singing birds. However, this bias will have been
equally introduced to all sites.
4.3.2 Ground nesting bird territory mapping was not carried out at one of the sites due to an error in the recording
methodology.
4.4 Invertebrates
4.4.1 Due to generally poor weather conditions during 2015, several bird and invertebrate surveys were
undertaken under suboptimal conditions. Although rain was avoided, several surveys were undertaken on
cloudy days with a light wind, which is suboptimal for butterfly and bumblebee surveys. Where possible,
survey dates were changed, however, in some cases this was not possible due to the long bouts of
suboptimal weather in June/July 2015. As the surveys on the control and solar plots were conducted on
the same morning, this limitation would not affect the comparative analysis, but may have resulted in lower
numbers than expected for both solar and control plots.
4.5 Bats
4.5.1 Due to malfunctions in the recording equipment, only 8 of the 11 sites were successfully surveyed for bats.
The technical difficulties included static detectors failing to record, or on one of the sites the detector within
the solar plot recorded continuous noise, which appeared to have cancelled out any bat activity. It was
not clear whether this noise was emitted from electrical equipment associated with the array or if it was a
malfunction within the bat detector. This resulted in the bat data being excluded from the ranking of overall
biodiversity value for each site.
10
4.6 General
4.6.1 Later in the season, it became difficult to navigate through the control sites which were planted with
rapeseed due to the density and height of the crop. Therefore, the transects and quadrats had to be
modified to follow existing tramlines. However, due to the monoculture nature of the crop it is not thought
that this would affect the results of the survey.
11
5 RESULTS
5.1 Introduction
5.1.1 The results of the surveys are set out within this section with statistical information shown in table form.
All highly significant differences (where the probability that the results show a non-random difference is
more than 99%, or P=<0.01) are shown as “HSD” and highlighted in dark green. All significant differences
(where the probability that the results show a non-random difference is more than 95%, or P=<0.05) are
shown as “SD” and highlighted in light green. Where an inverse relationship is found (i.e. where the results
show significantly higher numbers on the control plot when compared with the solar plot), significant results
are highlighted in orange.
5.1.2 The term “Diversity” has been used to express species richness, i.e. the number of different species
present within a sample. The term “Abundance” has been used to express the number of individuals
present within a sample (of all species).
5.2 Botany
5.2.1 The botanical data was analysed to compare the diversity between control/solar plots and between sites.
The diversity within solar plots was also explored to investigate whether there was a difference in the
sward directly beneath the panels compared with
between the rows of panels. The results are
summarised below.
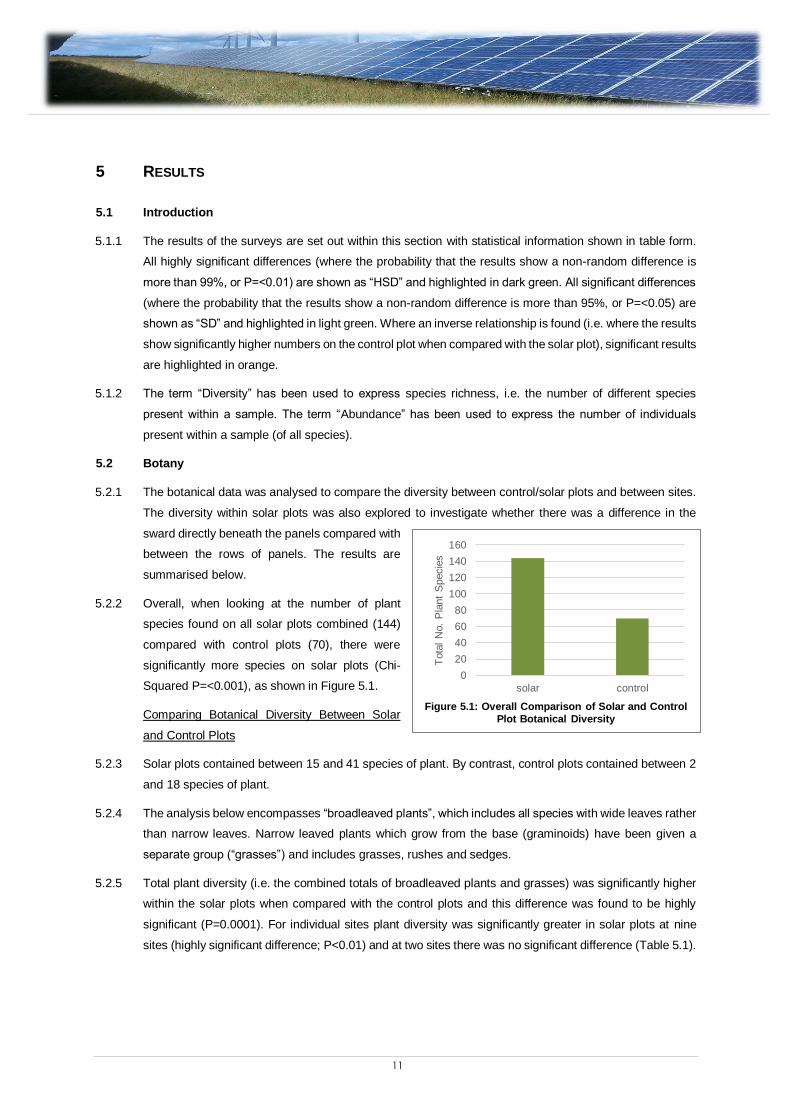
5.2.2 Overall, when looking at the number of plant
species found on all solar plots combined (144)
compared with control plots (70), there were
significantly more species on solar plots (Chi-
Squared P=<0.001), as shown in Figure 5.1.
Comparing Botanical Diversity Between Solar
and Control Plots
5.2.3 Solar plots contained between 15 and 41 species of plant. By contrast, control plots contained between 2
and 18 species of plant.
5.2.4 The analysis below encompasses “broadleaved plants”, which includes all species with wide leaves rather
than narrow leaves. Narrow leaved plants which grow from the base (graminoids) have been given a
separate group (“grasses”) and includes grasses, rushes and sedges.
5.2.5 Total plant diversity (i.e. the combined totals of broadleaved plants and grasses) was significantly higher
within the solar plots when compared with the control plots and this difference was found to be highly
significant (P=0.0001). For individual sites plant diversity was significantly greater in solar plots at nine
sites (highly significant difference; P<0.01) and at two sites there was no significant difference (Table 5.1).
0
20
40
60
80
100
120
140
160
solar control
Tota
l N
o.
Pla
nt
Specie
s
Figure 5.1: Overall Comparison of Solar and Control
Plot Botanical Diversity

12
Table 5.1: Diversity of Plants Compared between Solar Plots (S) and Control Plots (C) for Each Site using Chi-Square Test. An Overall Comparison between Solar and Control using Mann-Whitney U Test is Shown in the Bottom Row
Site Total Species
Significance S C
Site 1 25 2 HSD (P=0.000)
Site 2 23 7 HSD (P=0.003)
Site 3 28 5 HSD (P=0.000)
Site 4 15 7 NS (P=0.08)
Site 5 22 8 HSD (P=<0.01)
Site 6 22 18 NS (P=0.52)
Site 7 31 6 HSD (P=0.000)
Site 8 21 6 HSD (P=0.003)
Site 9 25 4 HSD (P=0.000)
Site 10 24 9 HSD (P=0.009)
Site 11 41 18 HSD (P=0.002)
Overall comparison of solar plots and control plots HSD (P=0.0001)
5.2.6 When comparing grass diversity between solar plot and control plot for all sites, grass species diversity
was greater in solar plots and this difference was highly significant (P=0.0005). When comparing individual
sites, in two sites the solar plot displayed greater diversity which was highly significant (P<0.01), and in
two plots which was significant (P<0.05). In seven plots, there was no significant difference in the diversity
of grasses between solar plot and control plot. The statistical results are shown in Table 5.2.
Table 5.2: Grass Species Diversity Compared Between Solar Plots (S) and Control Plots (C) for Each Site using Chi-Square Test. An Overall Comparison between Solar and Control using Mann-Whitney U Test is Shown in the Bottom
Row
Site Total species
Significance S C
Site 1 11 1 HSD (P=<0.004)
Site 2 5 3 NS (P=0.48)
Site 3 7 1 SD (P=<0.03)
Site 4 4 3 NS (P=0.71)
Site 5 8 0 HSD (P=0.005)
Site 6 7 7 NS (P=1.0)
Site 7 7 1 SD (P=0.03)
Site 8 6 1 NS (P=0.06)
Site 9 7 3 NS (P=0.21)
Site 10 10 5 NS (P=0.19)
Site 11 10 4 NS (P=0.11)
Overall comparison of solar plots and control plots HSD (P=0.0005)

13
5.2.7 For broadleaved plants, diversity was greatest in solar plots as compared to control plots and this
difference was highly significant (P=0.0002). For individual sites, the diversity was greater in eight solar
plots as compared to their control plots. This difference was highly significant (P<0.01) in five sites, and
significant (P<0.05) in three sites. In three sites, there was no difference in broadleaved plant diversity
between the solar plot and control plot (Table 5.3).
Table 5.3: Diversity of Broadleaved Plants Compared between Solar Plots (S) and Control Plots (C) for Each Site using Chi-Square Test. An Overall Comparison between Solar and Control using Mann-Whitney U Test is Shown in the
Bottom Row
Site Total species
Significance S C
Site 1 14 1 HSD (P=0.001)
Site 2 18 4 HSD (P=0.002)
Site 3 21 4 HSD (P=0.001)
Site 4 11 4 NS (P=0.07)
Site 5 14 8 NS (P=0.2)
Site 6 15 11 NS (P=0.43)
Site 7 24 5 HSD (P=<0.001)
Site 8 15 5 SD (P=0.03)
Site 9 18 1 HSD (P=<0.001)
Site 10 14 4 SD (P=0.018)
Site 11 31 14 SD (P=0.011)
Overall comparison of solar plots and control plots HSD (P=0.0002)
Comparing Botanical Diversity Within Solar Farms
5.2.8 An analysis of the data collected from within the solar plots was conducted, looking at those samples
collected in the middle of the rows (i.e. in the open) and those collected from beneath the panels (i.e.
shaded). There was no significant difference in plant diversity beneath the panels as compared to between
the rows when comparing all plots together (P=0.08; Table 5.4)
5.2.9 Comparing plant diversity in the middle and under the rows, at nine solar plots there was no significant
difference, at one plot there was significantly higher diversity in the middle of the rows and in another plot
there was significantly higher diversity of plants beneath the panels (Table 5.4).

14
Table 5.4: Diversity of Plants in Solar Farms Compared Between Panel Rows (M) and Beneath Panels (U) for Each Site using Chi-Square Test. An Overall Comparison between the Two Locations using Mann-Whitney U Test is Shown in
the Bottom Row
Site Total species
Significance M U
Site 1 22 11 NS (P=0.055)
Site 2 18 17 NS (P=0.87)
Site 3 24 17 NS (P=0.27)
Site 4 12 13 NS (P=0.87)
Site 5 20 17 NS (P=0.62)
Site 6 22 16 NS (P=0.33)
Site 7 22 17 NS (P=0.42)
Site 8 18 7 SD (P=<0.02)
Site 9 9 20 SD (P=0.04)
Site 10 19 24 NS (P=0.44)
Site 11 28 20 NS (P=0.25)
Overall comparison of between panel rows and beneath panels NS P=0.08
5.2.10 Comparing the diversity of grasses within solar plots, no significant difference was found beneath the
panels as compared to between the rows in all eleven plots (P=0.07) and there was no significant
difference found at the site level (Table 5.5).
Table 5.5: Diversity of Grasses in Solar Farms Compared Between Panel Rows (M) and Beneath Panels (U) for Each Plot using Chi-Square Test. An Overall Comparison between the Two Locations using Mann-Whitney U Test is Shown
in the Bottom Row
Site Total species
Significance M U
Site 1 10 5 NS (P=0.19)
Site 2 5 3 NS (P=0.48)
Site 3 7 5 NS (P=0.53)
Site 4 2 4 NS (P=0.41)
Site 5 8 6 NS (P=0.59)
Site 6 7 6 NS (P=0.78)
Site 7 5 2 SD (P=0.25)
Site 8 6 3 NS (P=<0.32)
Site 9 5 5 NS (P=1.00)
Site 10 9 10 NS (P=0.81)
Site 11 7 5 NS (P=0.56)
Overall comparison of between panel rows and beneath panels NS (P=0.07)

15
5.2.11 Comparing the diversity of broad-leaved plants between the rows vs underneath the panels, there was no
significant difference for all sites together (P=0.44). Looking at individual sites, two sites displayed greater
botanical diversity between the rows than under the panels, with the difference being highly significant
(P=0.01) in one site and significant (P=0.045) at the other. At one further site, broadleaved plant diversity
was greater beneath the panels than between the rows, this difference being significant (P=0.018). At the
remaining eight sites there was no significant difference in diversity between rows and beneath (Table
5.6).
Table 5.6: Diversity of Broadleaved Plants in Solar Farms Compared Between Panel Rows (M) and Beneath Panels (U) for each site using Chi-Square Test. An Overall Comparison between the Two Locations using Mann-Whitney U Test is
Shown in the Bottom Row
Site Total species
Significance M U
Site 1 12 6 NS (P=0.16)
Site 2 13 14 NS (P=0.84)
Site 3 17 12 HSD (P<0.01)
Site 4 10 9 NS (P=0.81)
Site 5 12 11 NS (P=0.83)
Site 6 15 10 NS (P=0.32)
Site 7 17 15 NS (P=0.72)
Site 8 12 4 SD (P=0.045)
Site 9 4 15 SD (P=0.018)
Site 10 10 14 NS (P=0.41)
Site 11 21 15 NS (P=0.32)
Overall comparison of between panel rows and beneath panels NS (P=0.44)
5.3 Invertebrates
5.3.1 The invertebrate transect data was analysed to compare species diversity and abundance between solar
and control plots for each site and as an
overall measure. This section has been split
into an analysis of butterflies and bumblebees.
5.3.2 Overall, when looking at the number of both
butterfly and bumblebee species found on all
solar plots combined (29) compared with
control plots (21), there was no significant
difference (Chi-Squared P=0.26). There was,
however, a significantly higher abundance of
invertebrates on solar plots (Chi-Squared
P=<0.001), as shown in Figure 5.2.
Butterflies
5.3.3 The number of species of butterfly observed in solar plots ranged from 2 to 5, with a mean of 3.4. For
control plots, the range was 0 to 3 with a mean value of 1.8. There was a highly significant difference
0
10
20
30
40
50
60
70
80
90
100
solar control
Abundance
Diversity
Figure 5.2: Overall Comparison of Solar and Control Plot Invertebrate Diversity and Abundance

16
between the numbers of butterfly species recorded within solar plot and control plot when all sites were
considered together (P=0.008).
5.3.4 In terms of individual sites, the number of butterfly species observed was significantly higher in the solar
plot than the control plot at a single site (P=0.045), as shown in Table 5.7.
Table 5.7: Diversity of Butterflies Compared between Solar Plot (S) and Control Plots (C) for Each Site using Chi-
Square Test. An Overall Comparison between Solar and Control using Mann-Whitney U Test is Shown in the Bottom Row
Site Total Species
Significance S C
Site 1 3 2 NS (P=0.65)
Site 2 2 0 NS (P=>0.05)
Site 3 4 2 NS (P=0.41)
Site 4 2 2 NS (P=1.00)
Site 5 4 3 NS (P=0.70)
Site 6 2 3 NS (P=0.65)
Site 7 4 2 NS (P=0.41)
Site 8 3 3 NS (P=1.00)
Site 9 4 2 NS (P=0.41)
Site 10 4 0 SD (P=0.045)
Site 11 5 1 NS (P=0.10)
Overall comparison of solar plots and control plots HSD (P=0.008)
5.3.5 In terms of numbers of individual butterflies observed, for solar plots the number ranged from 3 to 99 with
a mean of 19.9, and for control plots, 0 to 68 with a mean of 8.3. The number of butterflies observed per
survey in all solar plots was statistically higher than in all control plots (P=0.005), with the difference being
highly significant (Table 5.8).
5.3.6 Looking at individual site surveys, the number of butterflies observed was greater in the solar plot than
the control plot for surveys at six sites. This difference was statistically highly significant at four sites, and
significant at a further two sites. However, in one site the reverse was true, with significantly greater
numbers of butterflies being observed in the control plot, which was highly significantly different
(P=<0.001), as shown in Table 5.8.

17
Table 5.8: Butterfly Abundance Compared between Solar Plot (S) and Control Plots (C) for Each Site using Chi-Square Test. An Overall Comparison between Solar and Control using Mann-Whitney U Test is Shown in the Bottom Row
Site Mean Abundance Across All Surveys
Significance S C
Site 1 11 3 SD (P= 0.03)
Site 2 3 0 NS (P=>0.05)
Site 3 15 3 HSD (P=0.004)
Site 4 4 2 NS (P= 0.41)
Site 5 99 7 HSD (P=<0.001)
Site 6 13 68 HSD (P=<0.001)
Site 7 10 2 SD (P=0.02)
Site 8 3 3 NS (P= 1.00)
Site 9 6 2 NS (P=0.15)
Site 10 16 0 HSD (P=<0.001)
Site 11 39 1 HSD (P=<0.01)
Overall comparison of solar plots and control plots HSD (P=0.005)
Bumblebees
5.3.7 The number of species of bumblebee per survey observed in solar plots ranged from 0 to 10, with a mean
per survey of 3.6. For control plots, the range was 0 to 5 with a mean value per survey of 1.7. However,
overall, the number of bumblebee species observed per survey in solar plots was not statistically different
from control plots (P=0.06).
5.3.8 Comparing bumblebees at individual sites, the number of species observed was significantly higher in the
solar plot than the control plot at one site (P=0.01), as shown in Table 5.9.
18
Table 5.9: Diversity of Bumblebees Compared between Solar Plot (S) and Control Plots (C) for Each Site using Chi-Square Test. An Overall Comparison between Solar and Control using Mann-Whitney U Test is Shown in the Bottom
Row
Site Total Species
Significance S C
Site 1 3 0 NS (P=0.08)
Site 2 2 2 NS (P=>0.05)
Site 3 4 2 NS (P=0.41)
Site 4 2 2 NS (P=1.00)
Site 5 6 0 SD (P=0.01)
Site 6 3 3 NS (P=0.65)
Site 7 10 5 NS (P=0.19)
Site 8 1 1 NS (P=1.00)
Site 9 1 1 NS (P=1.00)
Site 10 2 2 NS (P=1.00)
Site 11 5 1 NS (P=0.10)
Overall comparison of solar plots and control plots NS (P=0.06)
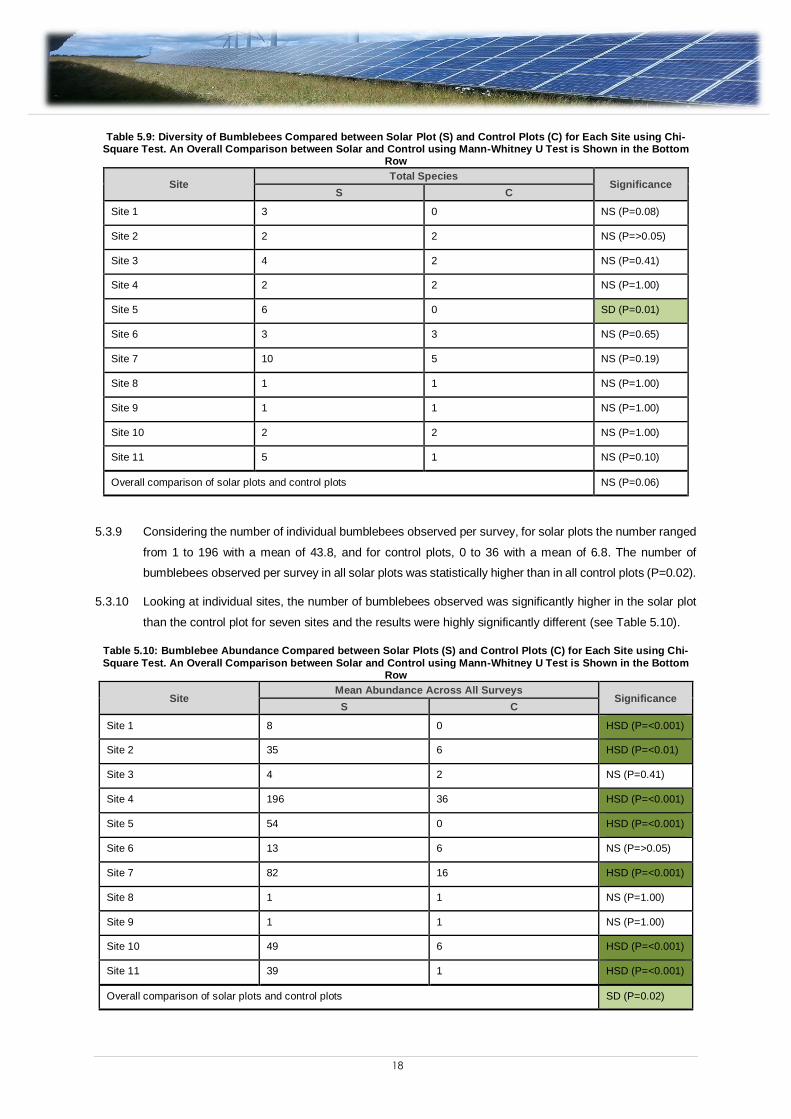
5.3.9 Considering the number of individual bumblebees observed per survey, for solar plots the number ranged
from 1 to 196 with a mean of 43.8, and for control plots, 0 to 36 with a mean of 6.8. The number of
bumblebees observed per survey in all solar plots was statistically higher than in all control plots (P=0.02).
5.3.10 Looking at individual sites, the number of bumblebees observed was significantly higher in the solar plot
than the control plot for seven sites and the results were highly significantly different (see Table 5.10).
Table 5.10: Bumblebee Abundance Compared between Solar Plots (S) and Control Plots (C) for Each Site using Chi-
Square Test. An Overall Comparison between Solar and Control using Mann-Whitney U Test is Shown in the Bottom Row
Site Mean Abundance Across All Surveys
Significance S C
Site 1 8 0 HSD (P=<0.001)
Site 2 35 6 HSD (P=<0.01)
Site 3 4 2 NS (P=0.41)
Site 4 196 36 HSD (P=<0.001)
Site 5 54 0 HSD (P=<0.001)
Site 6 13 6 NS (P=>0.05)
Site 7 82 16 HSD (P=<0.001)
Site 8 1 1 NS (P=1.00)
Site 9 1 1 NS (P=1.00)
Site 10 49 6 HSD (P=<0.001)
Site 11 39 1 HSD (P=<0.001)
Overall comparison of solar plots and control plots SD (P=0.02)

19
5.4 Birds
5.4.1 The data collected from the bird surveys was analysed in various ways in order to investigate differences
between the solar and control plots and
between sites. This included looking at
diversity and abundance as well as behaviour,
conservation status and territory mapping for
any ground nesting birds recorded. The
results of the analysis are outlined below.
5.4.2 Overall, when comparing the number of bird
species found on all solar plots combined (60)
compared with control plots (51), there was no
significant difference (Chi-Squared P=0.39).
There was, however, a significantly higher
abundance of birds on solar plots (Chi-
Squared P=0.02), as shown in Figure 5.3.
Comparing Species Diversity Between Solar and Control Plots
5.4.3 The number of species of birds observed per survey within the solar plots ranged from 6 to 23 with a mean
of 15.2. The number of species within the control plots ranged from 4 to 21 with a mean of 12.8.
5.4.4 When all surveys carried out on solar plots were compared with control plots, there was a significantly
higher diversity of birds found within the solar plots (P=0.04).
5.4.5 When looking at the total number of bird species recorded over all three surveys for each site, there was
no significant difference between solar plots and control plots, as can be seen within Table 5.11. However,
in 10 of the 11 sites the species diversity was higher on the solar plot although this was not statistically
significant.
Table 5.11: Diversity of Birds Compared between Solar Plots (S) and Control Plots (C) for Each Site using Chi-Square Test. An Overall Comparison between Solar and Control using Mann-Whitney U Test is Shown in the Bottom Row
Site Total Species
Significance S C
Site 1 30 23 NS (P=0.34)
Site 2 29 21 NS (P=0.26)
Site 3 20 21 NS (P=0.88)
Site 4 28 20 NS (P=0.25)
Site 5 24 20 NS (P=0.55)
Site 6 28 27 NS (P=0.89)
Site 7 18 18 NS (P=1.00)
Site 8 19 18 NS (P=0.87)
Site 9 21 18 NS (P=0.63)
Site 10 24 15 NS (P=0.15)
Site 11 23 22 NS (P=0.88)
Overall comparison of solar plots and control plots SD (P=0.04)
0
20
40
60
80
100
120
140
160
solar control
Abundance
Diversity
Figure 5.3: Overall Comparison of Solar and Control
Plot Bird Diversity and Abundance

20
Comparing Bird Abundance Between Solar and Control Plots
5.4.6 The total numbers of birds observed during each survey was examined. The abundance on solar plots
ranged from 13 to 135 individual birds observed during a single survey, with a mean of 47.8 individuals.
The number of birds observed on the control plots ranged from 12 to 77 with a mean of 38.8 individuals.
5.4.7 When looking at the difference between bird abundance on all solar plots compared with all control plots,
there was no statistically significant difference (P=0.06).However, it is worth noting that bird abundance
was higher on the solar plot at 8 of the 11 sites, indicating a trend, albeit not statistically significant.
5.4.8 When comparing bird abundance between solar plots and control plots for individual sites, in two sites
there were significant higher numbers of birds recorded within the solar plot when compared with the
control plot (this was statistically highly significantly different). In the remaining nine sites, no significant
difference was found, as shown in Table 5.12.
Table 5.12: Bird Abundance Compared between Solar Plots (S) and Control Plots (C) for Each Site using Chi-Square Test. An Overall Comparison between Solar and Control using Mann-Whitney U Test is Shown in the Bottom Row
Site Mean
Significance S C
Site 1 50 34 NS (P=0.09)
Site 2 66 50 NS (P=0.15)
Site 3 26 26 NS (P=0.96)
Site 4 110 67 HSD (P=0.0013)
Site 5 46 30 NS (P=0.07)
Site 6 66 57 NS (P=0.42)
Site 7 29 29 NS (P=0.93)
Site 8 21 19 NS (P=0.75)
Site 9 20 20 NS (P=0.92)
Site 10 50 24 HSD (P=0.002)
Site 11 41 38 NS (P=0.71)
Overall comparison of solar plots and control plots NS (P=0.06)
Bird Behaviour
5.4.9 Information on bird behaviour was collected during the surveys. An analysis has been carried out on this
data, however, very few significant differences were observed when comparing behaviour at solar and
control plots.
5.4.10 At Site 2, a significantly lower diversity of birds was observed foraging within the field boundaries on the
solar plot when compared with the control (Chi-squared test P=0.02), however, a significantly higher
abundance of birds was recorded foraging within the field on the solar plot when compared with the control.
5.4.11 At Site 4, a significantly higher diversity and abundance of birds was observed foraging within the field at
the solar plots when compared with the control plots (Chi-squared test P=0.02 and P=0.0001 respectively).

21
Similarly, at Site 10 a significantly higher diversity and abundance of birds was observed foraging within
the field at the solar plot (Chi-squared test P=0.01 and P=0.00004 respectively).
5.4.12 At Site 5, a significantly higher diversity of birds was observed singing within the field at the solar plot
when compared with the control plot (Chi-squared test P=0.03).
5.4.13 Overall, when comparing bird behaviours between all solar and control plots, no statistically significant
difference was observed.
Comparing Notable Bird Species Between Solar and Control Plots
5.4.14 The bird species recorded within each site was weighted depending on its conservation status (Red or
Amber listed Bird of Conservation Concern). When comparing solar and control plots overall, the solar
plots scored significantly higher than control plots (P=0.04) indicating that they are more important for
birds of conservation concern.
5.4.15 When looking at the results on a site by site basis, the results show no statistical difference between solar
and control plots when looking at bird diversity, as shown in Table 5.13.
Table 5.13: Weighted Scoring of Bird Species Compared Between Solar Plots (S) and Control Plots (C) for Each Site using Chi-Square Test (Scoring: Red Listed=3; Amber Listed=2; Non-Notable=1). An Overall Comparison between
Solar and Control using Mann-Whitney U Test is Shown in the Bottom Row
Site Total Score Across All Surveys
Significance S C
Site 1 44 34 NS (P=0.26)
Site 2 45 30 NS (P=0.08)
Site 3 31 30 NS (P=0.90)
Site 4 41 30 NS (P=0.19)
Site 5 33 30 NS (P=0.71)
Site 6 41 41 NS (P=1.00)
Site 7 28 24 NS (P=0.58)
Site 8 30 28 NS (P=0.79)
Site 9 30 23 NS (P=0.34)
Site 10 38 23 NS (P=0.055)
Site 11 33 34 NS (P=0.90)
Overall comparison of solar plots and control plots SD (P=0.04)
5.4.16 When looking at abundance of birds of conservation concern, with species recorded weighted depending
on their conservation interest, overall, solar plots scored significantly higher when compared with control
plots (P=0.04).
5.4.17 When looking at the results on a site-by-site basis, a statistically highly significant difference can be seen
within four sites, where the score for the solar plot was significantly greater than that for the control plot,
as shown in Table 5.14.

22
Table 5.14: Weighted Scoring of Abundance of Birds Compared Between Solar Plots (S) and Control Plots (C) for Each Site using Chi-Square Test (Scoring: Red Listed=3; Amber Listed=2; Non-Notable=1). An Overall Comparison between
Solar and Control using Mann-Whitney U Test is Shown in the Bottom Row
Site Mean Score Across All Surveys
Significance S C
Site 1 64 48 NS (P=0.12)
Site 2 115 69 HSD (P=<0.001)
Site 3 37 35 NS (P=0.84)
Site 4 140 97 HSD (P=0.005)
Site 5 61 35 HSD (P=0.006)
Site 6 92 79 NS (P=0.31)
Site 7 47 44 NS (P=0.78)
Site 8 37 35 NS (P=0.78)
Site 9 27 26 NS (P=0.86)
Site 10 88 51 HSD (P=0.0014)
Site 11 55 64 NS (P=0.39)
Overall comparison of solar plots and control plots SD (P=0.04)
Ground Nesting Birds
5.4.18 Where ground nesting birds were identified, behaviour and movements were mapped in order to ascertain
the likely number of territories and active nests within each plot.
5.4.19 The only species of ground-nesting bird consistently recorded across all but one site was skylark. The
only other ground-nesting bird species recorded was one juvenile meadow pipit Anthus pratensis; calling
within the boundary of the control plot at Site 9.
Skylark Territories
5.4.20 The results of the territory mapping are shown in Appendix C. Mapping of ground nesting birds was not
carried out at Site 5.
5.4.21 The total number of territories recorded for control and solar plots were 29 and 26 respectively. Table 5.15
below provides the number of territories recorded for each site in solar and control plots; with the results
of a Chi-Square test on this data also being presented. The sites varied greatly, with several solar plots
accommodating more territories and some control sites accommodating more territories, however, only
Site 11 had significantly more skylark territories on the control plot when compared with the solar plot
(P=0.014). The overall comparison of solar and control plots was also not significant.

23
Table 5.15: Number of Ground Nesting Bird Territories Compared between Solar Plots (S) and Control Plots (C) for Each Site using Chi-Square Test. An Overall Comparison between Solar and Control using Mann-Whitney U Test is
Shown in the Bottom Row
Site No. Territories
Significance S C
Site 1 4 7 NS (P=0.37)
Site 2 3 2 NS (P=0.65)
Site 3 2 0 NS (P=0.16)
Site 4 3 3 NS (P=1.00)
Site 5 (no data)
Site 6 2 0 NS (P=0.16)
Site 7 1 1 NS (P=1.00)
Site 8 2 4 NS (P=0.41)
Site 9 2 1 NS (P=0.56)
Site 10 7 5 NS (P=0.56)
Site 11 0 6 SD (P=0.014)
Overall comparison of solar plots and control plots NS (P=0.97)
Skylark Nesting
Skylark nesting was confirmed through observing adults carrying food to a site repeatedly. The actual
nests were not searched for in order to avoid disturbance and prevent accidental damage to the nest
through trampling.
5.4.22 Skylark nesting was confirmed by surveyors at Site 10 within the solar plot, but outside of the footprint of
the array itself (Appendix C refers). This was the only instance of a confirmed nest within any of the solar
plots surveyed.
5.4.23 Skylark nesting behaviour was recorded within several of the control plots. Surveyors noted that possible
nesting within tramlines of the control plot at Site 10 was occurring, but could not be confirmed due to the
dense arable crop. Site 11 had an unconfirmed skylark nest recorded adjacent the western boundary of
(but outside of) the control plot. Unconfirmed numbers of skylark nesting were recorded at Site 7, with
skylark noted as nesting within the centre of the control plot.
Skylark Foraging
5.4.24 Skylark foraging was observed across all but two of the sites included in the study. Table 5.16 below
details the numbers of skylark recorded foraging across solar and control plots.
5.4.25 There were significantly more skylarks recorded foraging within the solar plots when compared with the
control plots at two of the sites, however, the overall comparison between solar and control was not
significant.

24
Table 5.16: Number of Instances of Skylark Foraging Compared between Solar Plots (S) and Control Plots (C) for Each Site using Chi-Square Test. An Overall Comparison between Solar and Control using Mann-Whitney U Test is Shown
in the Bottom Row
Site No. Foraging Instances
Significance S C
Site 1 0 1 NS (P=0.32)
Site 2 11 1 HSD (P=<0.01)
Site 3 2 2 NS (P=1.00)
Site 4 8 0 HSD (P=<0.01)
Site 5 0 0 N/A
Site 6 1 1 NS (P=1.00)
Site 7 0 1 NS (P=0.32)
Site 8 3 0 NS (P=0.08)
Site 9 0 0 N/A
Site 10 3 9 NS (P=0.08)
Site 11 0 3 NS (P=0.08)
Overall comparison of solar plots and control plots NS (P=0.81)
5.5 Bats
5.5.1 Both the numbers of bats recorded and the species diversity were examined for solar plots and control
plots. Due to equipment failure, only
eight of the eleven sites were
surveyed.
5.5.2 Overall, when looking at the number
of bat species found on all solar plots
combined (8) compared with control
plots (8), there was no difference.
There was, however, a significantly
higher total number of bat passes on
the control plots when compared with
solar (Chi-Squared P=<0.001), as
shown in Figure 5.4.
Comparing Bat Activity Between Solar and Control Plots
5.5.3 The number of bat passes per night ranged from 1.78 to 24.44 on solar plots and 7.22 to 71.5 on control
plots. When considering all sites combined, there was no significant difference between the numbers of
bat passes between solar and control plots (P=0.08), as shown in Table 5.17.
5.5.4 When comparing the number of bat passes per night between solar plots and control plots, three of the
sites showed significantly higher numbers of bat passes within the control plots when compared with the
solar plots (and this was a highly significant difference). The five remaining sites showed no significant
0
20
40
60
80
100
120
140
160
180
solar control
Abundance
Diversity
Figure 5.4: Overall Comparison of Solar and Control Plot Bat Diversity and Activity

25
difference when comparing solar to control plots, although it should be noted bat activity was higher in
control than solar plots in four out of the five sites.
Table 5.17: Bat Activity Compared between Solar Plots (S) and Control Plots (C) for Each Site using Chi-Square Test.
An Overall Comparison between Solar and Control using Mann-Whitney U Test is Shown in the Bottom Row
Site Mean Passes per Night
Significance S C
Site 1 10 9 NS (P=0.81)
Site 3 2 14 HSD (P=0.003)
Site 4 7 13 NS (P=0.20)
Site 5 3 9 NS (P=0.053)
Site 6 6 11 NS (P=0.23)
Site 9 24 50 HSD (P=0.003)
Site 10 2 7 NS (P=0.07)
Site 11 27 72 HSD (P=<0.001)
Overall comparison of solar plots and control plots NS (P=0.09)
Comparing Bat Diversity Between Solar and Control Plots
5.5.5 The number of species recorded by the static detectors on the solar plots ranged from 4 to 7, while on the
control plots the number of species ranged from 3 to 8. When assessing all of the survey sites combined,
there was no statistically significant difference between the number of species recorded within the solar
plots when compared with the control plots (P=0.55).
5.5.6 When comparing the species diversity of bats recorded within the solar and control plots on a site-by-site
basis, it can be seen that no statistically significant difference was found when comparing solar to control
plots across any sites, as shown in Table 5.18.
Table 5.18: Bat Diversity Compared between Solar Plots (S) and Control Plots (C) for Each Site using Chi-Square Test. An Overall Comparison between Solar and Control using Mann-Whitney U Test is Shown in the Bottom Row
Site No. Species Recorded
Significance S C
Site 1 7 5 NS (P=0.56)
Site 3 5 8 NS (P=0.41)
Site 4 8 7 NS (P=0.80)
Site 5 5 7 NS (P=0.56)
Site 6 7 8 NS (P=0.80)
Site 9 5 6 NS (P=0.76)
Site 10 4 5 NS (P=0.74)
Site 11 5 3 NS (P=0.48)
Overall comparison of solar plots and control plots NS (P=0.55)

26
5.6 Observations of Other Species
5.6.1 Beehives were present within the solar plot on Site 11 and large numbers of honeybees Apis mellifera
were noted during the invertebrate surveys. This site is being managed for pollinating invertebrates with
a specific seed mix being sown to benefit these species.
5.6.2 Owl pellets were observed on the solar panels at Site 8 on the southern row (although they could not be
reached in order to identify to species), which was adjacent to a field margin comprising rough grassland.
Anecdotal evidence of owls using the solar array was also obtained from the site manager at Site 9. A
tawny owl Strix alucowas was observed during one of the bird surveys on Site 4. It is likely that the
presence of a more diverse habitat along with rough grassland within field boundaries provides good
habitat for small mammals, which owls prey on. The panels are also likely to provide suitable perching
opportunities for hunting. Similarly, large numbers of raptors were observed within solar plots, particularly
on Site 10 where kestrels Falco tinnunculus and a red kite Milvus milvus were observed hunting within the
array.
5.6.3 Brown hare Lepus europaeus was found to be particularly abundant within solar plots, with counts ranging
from 3 to 12 on a single survey. Hares were less abundant on control plots, with counts ranging from 1 to
3 on a single survey. The hares were seen to form scrapes beneath the panels and appeared to be utilising
them for shelter. Natural gaps beneath the security fencing and gates were used to access the site. The
highest number of hares were observed within Site 1.
5.6.4 Fox Vulpes vulpes scat was observed within the solar plot on Site 1. No evidence of badgers Meles meles
was observed within the solar plots, although a sett was found within the control plot on Site 7 and badger
latrines within the control plot on Site 9.

27
6 RANKING OF SOLAR SITES
6.1.1 An overall score has been calculated for each site reflecting its rank for each biodiversity indicator.
6.1.2 The rank has been calculated by comparing the difference in the score of the solar plot to its corresponding
control plot. This way any variation in diversity and abundance of species which might be explained by
the geographic location of the site or its surrounding landscape can be largely eliminated. The rank
therefore illustrates how successful or otherwise the solar plot has been at creating a positive change in
diversity when compared with the adjacent control plot.
6.1.3 Bats have not been included within the ranking as unfortunately, an incomplete data set was held for this
group and as such, it was not possible to ascribe a ranking to a number of the sites. It should be noted
that a general trend observed within the bat data was for an inverse relationship between the abundance
of bats in the solar plots when compared to the control plots. As such it may have been difficult to score
bats in the same manner as other sites have been scored. This is not to say that the findings with respect
of bats are not considered important; however, there may be explanations behind the findings of the bat
monitoring. This is discussed further in Chapter 7.
6.1.4 It is acknowledged that, as both abundance and diversity have been included for invertebrates and birds,
there is some degree of bias. However, the final scoring combines both of these measures and so can be
seen as a reflection of biological diversity (a combination of species diversity and abundance).

28
Table 6.1: Sites Ranked According to Overall Biodiversity Value (based on each indicator), with Higher Ranking Sites Coloured Darker Green and Lower Ranking Sites Coloured Lighter Green. The Final Column Shows the Grade of each Site in Terms of its Management Focus Towards Wildlife.
Site
Gra
ss
Div
ers
ity
Ran
k
Bro
ad
-Leaved
Pla
nt D
ivers
ity
Ran
k
Bu
tterfly
Div
ers
ity
Ran
k
Bu
tterfly
A
bu
nd
an
ce R
an
k
Bu
mb
leb
ee
Div
ers
ity R
an
k
Bu
mb
leb
ee
Ab
un
dan
ce R
an
k
Bird
Ab
un
dan
ce
Ran
k
Bird
Div
ers
ity
Ran
k
Su
m o
f Ran
ks
FIN
AL
RA
NK
Man
ag
em
en
t F
ocu
s T
ow
ard
s
Wild
life
Site 10 6 7 1 3 6 4 2 1 30 1 High
Site 11 3 2 1 2 3 5 7 7 30 1 High
Site 5 2 10 7 1 1 3 3 5 32 3 High
Site 7 3 1 3 5 2 2 9 10 35 4 Med
Site 1 1 6 7 5 4 7 3 4 37 5 Med
Site 2 9 5 3 8 6 6 3 2 42 6 Low
Site 3 3 2 3 4 5 9 9 11 46 7 Low
Site 4 10 9 9 9 6 1 1 2 47 8 Med
Site 9 8 2 3 7 6 10 9 6 51 9 Low
Site 8 6 7 9 10 6 10 8 7 63 10 Med
Site 6 11 11 11 11 6 8 6 7 71 11 Med

29
6.1.6 The three highest ranking sites were Sites 10 and 11 (joint first) and 5 (second), which were also graded as
having a ‘high’ management focus towards wildlife. All three of these sites were seeded with a diverse mix,
although, interestingly, Site 5 scored lowly in terms of broadleaved plant diversity, but highly for grasses, and
Site 10 displayed moderate plant diversity.
6.1.7 Site 11 was previously grassland and the control plot comprised a grassland field, although the solar farm had
been reseeded post construction, therefore, the higher plant diversity is not surprising.
6.1.8 The three top sites all have relatively high butterfly and bumblebee rankings as well as birds for sites 10 and 5.
6.1.9 Site 7 is ranked fourth overall due to high broadleaved species diversity and a high diversity of invertebrates,
particularly bumblebees. This is possibly due to the failure of the sown seed mix to establish, which has resulted
in an abundance of early colonising plants such as arable weeds. The marginal habitat (a wide wildflower
meadow buffer) may also attract invertebrate species.
6.1.10 Sites 1 and 2 are ranked fifth and sixth overall due to strong bird assemblages and high grass diversity at Site
1. Site 2 was previously arable, however, was compared with a grassland control plot due to the current rotation
of the farm at the time. Although this site was low ranking in terms of grass diversity, it had a moderate
broadleaved plant rank.
6.1.11 Site 3, which ranked seventh overall, had relatively high botanical diversity but moderate invertebrate scoring
and poor bird diversity. Site 4 is ranked eighth overall, which exhibits some of the lowest botanical diversity, but
scores highly in terms of bird diversity and bumblebee abundance. Site 9 ranked ninth, but had a high diversity
of broadleaved plants and butterflies.
6.1.12 The lowest ranking sites were Site 8 and 6 which generally had low scores for all indicators, but were classed
as having a ‘medium’ management focus towards wildlife due to diverse field margins at site 8 and a
conservation grazing regime at Site 6 (although this was initiated in the same year that the survey was conducted
so the full effects may not yet be realised). The control plot at Site 6 had also been managed as a ley and so
exhibited a high plant diversity compared with a grazed pasture site. Site 6 was one of the two sites that were
previously grassland.
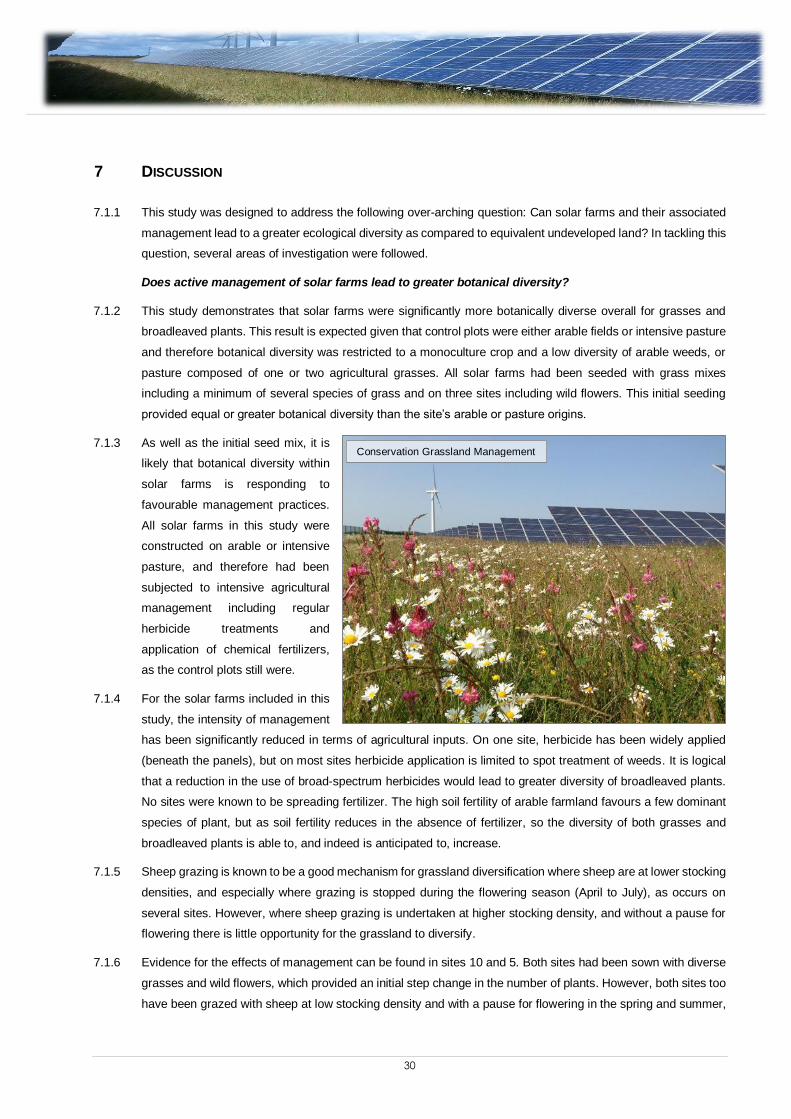
30
7 DISCUSSION
7.1.1 This study was designed to address the following over-arching question: Can solar farms and their associated
management lead to a greater ecological diversity as compared to equivalent undeveloped land? In tackling this
question, several areas of investigation were followed.
Does active management of solar farms lead to greater botanical diversity?
7.1.2 This study demonstrates that solar farms were significantly more botanically diverse overall for grasses and
broadleaved plants. This result is expected given that control plots were either arable fields or intensive pasture
and therefore botanical diversity was restricted to a monoculture crop and a low diversity of arable weeds, or
pasture composed of one or two agricultural grasses. All solar farms had been seeded with grass mixes
including a minimum of several species of grass and on three sites including wild flowers. This initial seeding
provided equal or greater botanical diversity than the site’s arable or pasture origins.
7.1.3 As well as the initial seed mix, it is
likely that botanical diversity within
solar farms is responding to
favourable management practices.
All solar farms in this study were
constructed on arable or intensive
pasture, and therefore had been
subjected to intensive agricultural
management including regular
herbicide treatments and
application of chemical fertilizers,
as the control plots still were.
7.1.4 For the solar farms included in this
study, the intensity of management
has been significantly reduced in terms of agricultural inputs. On one site, herbicide has been widely applied
(beneath the panels), but on most sites herbicide application is limited to spot treatment of weeds. It is logical
that a reduction in the use of broad-spectrum herbicides would lead to greater diversity of broadleaved plants.
No sites were known to be spreading fertilizer. The high soil fertility of arable farmland favours a few dominant
species of plant, but as soil fertility reduces in the absence of fertilizer, so the diversity of both grasses and
broadleaved plants is able to, and indeed is anticipated to, increase.
7.1.5 Sheep grazing is known to be a good mechanism for grassland diversification where sheep are at lower stocking
densities, and especially where grazing is stopped during the flowering season (April to July), as occurs on
several sites. However, where sheep grazing is undertaken at higher stocking density, and without a pause for
flowering there is little opportunity for the grassland to diversify.
7.1.6 Evidence for the effects of management can be found in sites 10 and 5. Both sites had been sown with diverse
grasses and wild flowers, which provided an initial step change in the number of plants. However, both sites too
have been grazed with sheep at low stocking density and with a pause for flowering in the spring and summer,
Conservation Grassland Management
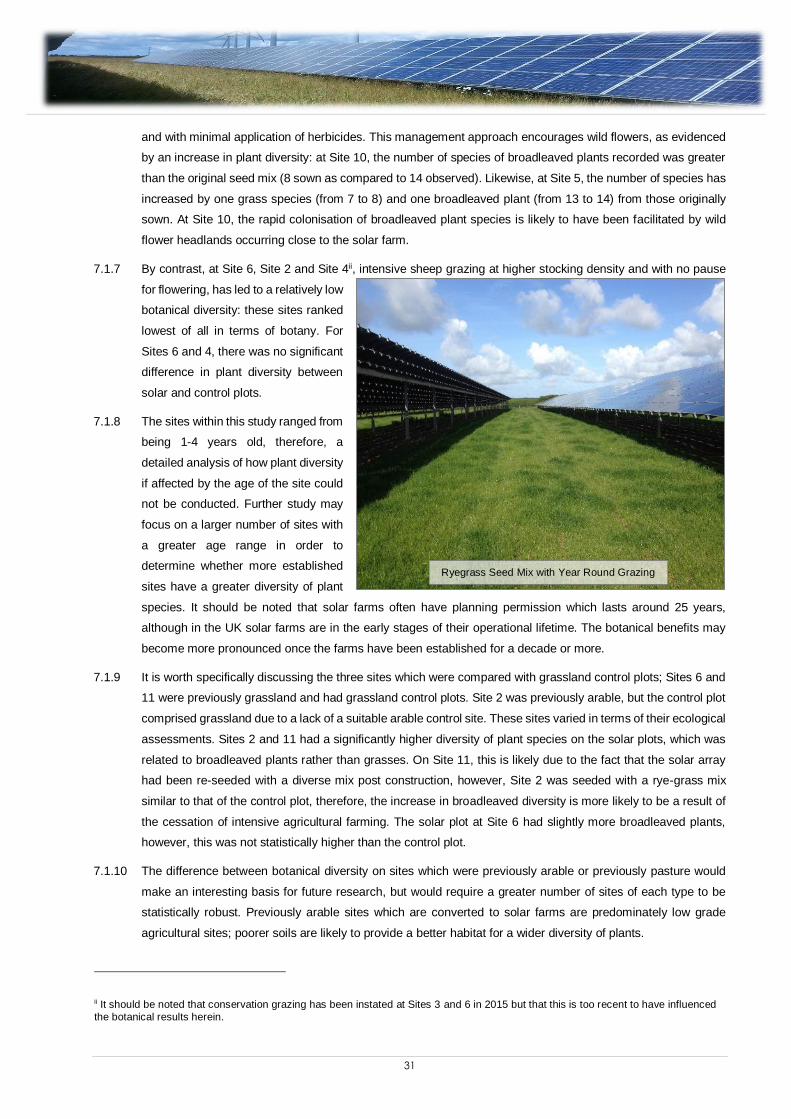
31
and with minimal application of herbicides. This management approach encourages wild flowers, as evidenced
by an increase in plant diversity: at Site 10, the number of species of broadleaved plants recorded was greater
than the original seed mix (8 sown as compared to 14 observed). Likewise, at Site 5, the number of species has
increased by one grass species (from 7 to 8) and one broadleaved plant (from 13 to 14) from those originally
sown. At Site 10, the rapid colonisation of broadleaved plant species is likely to have been facilitated by wild
flower headlands occurring close to the solar farm.
7.1.7 By contrast, at Site 6, Site 2 and Site 4ii, intensive sheep grazing at higher stocking density and with no pause
for flowering, has led to a relatively low
botanical diversity: these sites ranked
lowest of all in terms of botany. For
Sites 6 and 4, there was no significant
difference in plant diversity between
solar and control plots.
7.1.8 The sites within this study ranged from
being 1-4 years old, therefore, a
detailed analysis of how plant diversity
if affected by the age of the site could
not be conducted. Further study may
focus on a larger number of sites with
a greater age range in order to
determine whether more established
sites have a greater diversity of plant
species. It should be noted that solar farms often have planning permission which lasts around 25 years,
although in the UK solar farms are in the early stages of their operational lifetime. The botanical benefits may
become more pronounced once the farms have been established for a decade or more.
7.1.9 It is worth specifically discussing the three sites which were compared with grassland control plots; Sites 6 and
11 were previously grassland and had grassland control plots. Site 2 was previously arable, but the control plot
comprised grassland due to a lack of a suitable arable control site. These sites varied in terms of their ecological
assessments. Sites 2 and 11 had a significantly higher diversity of plant species on the solar plots, which was
related to broadleaved plants rather than grasses. On Site 11, this is likely due to the fact that the solar array
had been re-seeded with a diverse mix post construction, however, Site 2 was seeded with a rye-grass mix
similar to that of the control plot, therefore, the increase in broadleaved diversity is more likely to be a result of
the cessation of intensive agricultural farming. The solar plot at Site 6 had slightly more broadleaved plants,
however, this was not statistically higher than the control plot.
7.1.10 The difference between botanical diversity on sites which were previously arable or previously pasture would
make an interesting basis for future research, but would require a greater number of sites of each type to be
statistically robust. Previously arable sites which are converted to solar farms are predominately low grade
agricultural sites; poorer soils are likely to provide a better habitat for a wider diversity of plants.
ii It should be noted that conservation grazing has been instated at Sites 3 and 6 in 2015 but that this is too recent to have influenced
the botanical results herein.
Ryegrass Seed Mix with Year Round Grazing

32
7.1.11 Therefore, where suitable management
exists, botanical diversity is expected to
increase over time, with some plants
emerging from the seed bank in response
to favourable conditions, and others
colonising from airborne or animal-carried
seed.
Do the physical structures of solar
farms encourage a greater botanical
diversity when compared with
equivalent undeveloped agricultural
land?
7.1.12 Botanical diversity on solar farms may be
influenced by the diversity of ecological
conditions provided by the solar panels
themselves. In several sites, greater
broadleaved plant diversity was observed
between the rows as compared to beneath
the panels. This difference is likely to be
due to the effects of shading and drying
beneath the panels, where more extreme
ecological conditions are likely to occur. It
is likely that more ‘natural’ field conditions
exist between rows, where shading is less
and rainfall is not impeded by the panels.
Therefore, in the more extreme conditions
beneath the panels, one might expect only
more specialist plants tolerant to these
conditions to grow. This may be a focus of
further analysis work of the current data,
however, it was not under the remit of this
study.
7.1.13 However, the reverse was also found at
one site, where diversity of broadleaved
plants was greater beneath the panels
than between the rows. On this site (Site
9), the effects of regular cutting may have
reduced the botanical diversity of the area
between the rows (the area beneath the
Management of pernicious weeds
The Weeds Act 1959 specifies five injurious weeds: Common
Ragwort, Spear Thistle, Creeping or Field Thistle, Broad Leaved
Dock and Curled Dock. Under this Act the Secretary of State may
serve an enforcement notice on the occupier of land on which
injurious weeds are growing, requiring the occupier to take action
to prevent their spread.
Recognising that certain pernicious weeds must be controlled by
law, and tall weeds also present a risk of over-shadowing solar
panels, some form of weed management is usually required on
solar farms. From observations during this survey, and indeed,
from wider survey work on solar farms, it has been noted that
pernicious weeds tend to proliferate beneath solar panels.
In one site weeds were being controlled by regular spraying of
broad-spectrum herbicide which kills off the majority of grasses
and broadleaved plants. In the authors’ experience this strategy
may be effective in the short term, but also invites repeat
problems with pernicious weeds. Spraying creates bare ground
which is ideal for weeds to colonise. Weeds such as ragwort and
thistle produce large quantities of wind-borne seed designed for
colonising bare ground.
To reduce the risk of weed colonisation, it is recommended all
bare areas be sown with a seed mix of some description to cover
the ground in vegetation. Before re-sowing it is recommended that
all existing weeds are spot treated. A wild flower and fine grass
mix is recommended as it a) provides a stable mat of vegetation
which once established will outcompete weed species, and b)
provides forage and habitat for wildlife. A suitable mix of shade
tolerant and low growing species can be selected for beneath the
solar panels.
In recognition of the need for some weed control spot treatment
with a non-residual translocated herbicide is considered the most
ecologically sensitive option. As the grassland becomes
established beneath the panels the requirements for regular
treatment should decline, as weeds tend to be early colonisers.
Re-sowing bare areas beneath the panels rather than spraying
should provide a long-term solution to the weed problem. This
approach is expected to substantially decrease management
costs over the life of the solar farm by minimising spraying of
herbicide, which also has benefits for biodiversity.

33
panels is not usually accessible to mechanical mowers).iiiThis management approach may have led to greater
plant diversity beneath the panels.
7.1.14 It is worth noting that in some instances the vegetation directly under the panels was more vigorous in growth
than between the panels and it may be that there is an effect, often observed in shaded habitats such as
woodland, where shade can lead to increased humidity and reduced drying out of soils, particularly when the
site is relatively wet to begin with. Over time, it may be that shade tolerant species such as woodland specialist
plants, may colonise the areas beneath the panels, as has been seen in sites outside of this study (Hannah
Montag pers. obs. of ferns growing under panels).
7.1.15 It was noted that at Site 1 spraying of herbicide on vegetation beneath the panels was likely to rapidly reduce
the diversity of broadleaved plants. At this site the diversity of both grasses and broadleaved plants was lower
beneath the panels than between the rows, but this difference was on the cusp of being significant (P=0.055).
It is anticipated that in time, such a management approach will lead to a marked reduction in botanical diversity.
7.1.16 It should be noted that a number of indirect effects of the presence of solar panels might influence botany under
and between the panel rows. Where sheep graze sites, their grazing and resting patterns will vary across the
site, with the area beneath panels being used for shelter during adverse weather. Where sites are mowed, the
area beneath the panels cannot be accessed by tractor-towed mowers and so a different method (usually hand
held strimmers) is used. These variations in management convey differing selective pressures upon the
grassland sward and may lead to differences in plant assemblages.
Can solar farms encourage greater invertebrate diversity?
7.1.17 Over all, the abundance of butterflies and bumblebees was greater on solar plots than at control plots. The sites
which had the highest butterfly abundance were those that had management in place considered to be ‘high’ in
terms of its focus upon wildlife (Sites 5, 10 and 11). Those with the highest bumblebee abundance (Sites 4, 5
and 7) had ‘medium’ to ‘high’ management focus on wildlife. Sites 5, 10 and 11 were sown with a species-rich
seed mix including wild flowers which are likely to include suitable foraging plants for both butterflies and
bumblebees (although they appear to be benefitting butterflies more significantly). This high botanical diversity
is likely the principal reason for the greater abundance of invertebrates on these sites.
7.1.18 The exception to the above was Site 4, where botanical diversity was low. Here, a bloom of white clover occurred
during the survey period which attracted a large abundance of bumblebees (196), but of just 2 common species.
7.1.19 Invertebrate species diversity at solar farms, as in the wider environment, will be heavily influenced by botanical
diversity, as plants provide essential forage, habitat and structure for nesting and egg laying. The suitability of
a plant as a food source depends upon its floral structure, with bees and butterflies being adapted for different
structures. In addition, several butterflies rely on a single or very few plant species for laying eggs and larval
stages and can only breed on a site if this species is present. Therefore, to attract a wide range of bumblebees
and butterflies, it is necessary to have a high diversity of plants.
7.1.20 At two sites invertebrate species richness was significantly greater within the solar plots as compared to the
control plots. At Site 10, significantly higher numbers of butterfly species were observed, and at Site 5
iiiThe Weeds Act 1959 specifies five injurious weeds: Common Ragwort, Spear Thistle, Creeping or Field Thistle, Broad Leaved Dock and
Curled Dock. Under this Act the Secretary of State may serve an enforcement notice on the occupier of land on which injurious weeds are
growing, requiring the occupier to take action to prevent their spread.

34
significantly higher bumblebee species were observed within the solar plots. This result reflects the sowing of
these solar plots with wild flower mixes providing suitable forage for a wide range of invertebrates. Further, at
Site 10, the relative longevity of the site (4 years) is likely to influence this result. At Site 7, the highest bumblebee
diversity of all solar plots was observed (10 species), even though this was not significantly higher than its
control plot. For this site, too, botanical diversity is the reason for high invertebrate diversity: Site 7 displays the
second highest plant diversity of all the solar plots.
7.1.21 On the majority of solar farms
included in this survey, invertebrate
species richness was generally not
significantly different between solar
plot and control plot on a site-by-site
basis (although overall, butterfly
diversity was higher on solar plots).
This is because the botanical
diversity on many of the solar plots
is still quite low and based upon an
agricultural seed mix. However, as
botany improves over time in
response to favourable
management, so invertebrate
diversity would be expected to
improve. In addition, the solar farms
are relatively new features of the landscape, and so even where there is higher botanical diversity it will take
some time for species to discover and utilise the sites.
7.1.22 Agricultural flowers such as white clover or crops such as oil seed rape may attract an abundance of bees, but
this is likely to be short lived (3-4 weeks of the year) and benefit only a few species. To benefit a high diversity
of invertebrate species in larger numbers, it is necessary to sow a meadow with a range of grass and wild flower
species. Higher plant diversity will have the added benefit of providing early and late season flowering which in
turn will provide nectar sources at times of year when food sources for bumblebees are in short supply.
7.1.23 The results of the surveys indicate that solar farms can have a part to play in ecosystem services, through
increasing the abundance and diversity of pollinator species. They may act as an important reservoir of
pollinating invertebrates, particularly within intensively farmed landscapes where other suitable habitats are
scarce. The fact that generally solar farms are constructed on land of poor agricultural value may mean that the
economic benefits of providing a pollinating invertebrate resource (and thus benefitting adjacent agricultural
land) may outweigh that of planting crops within the site. Additional indirect ecosystem services may be through
the reduction in agricultural inputs leading to cleaner groundwater or adjacent waterbodies. Further study may
look at calculating the economic value of solar farms in terms of their ecosystem services.
Can solar farms encourage a greater diversity of birds?
7.1.24 The conclusions reached so far indicate that solar farms can support a greater diversity of plants as well as
greater numbers of butterflies and bumblebees, particularly under management which focuses on optimising
Small Copper Butterfly on Thistle
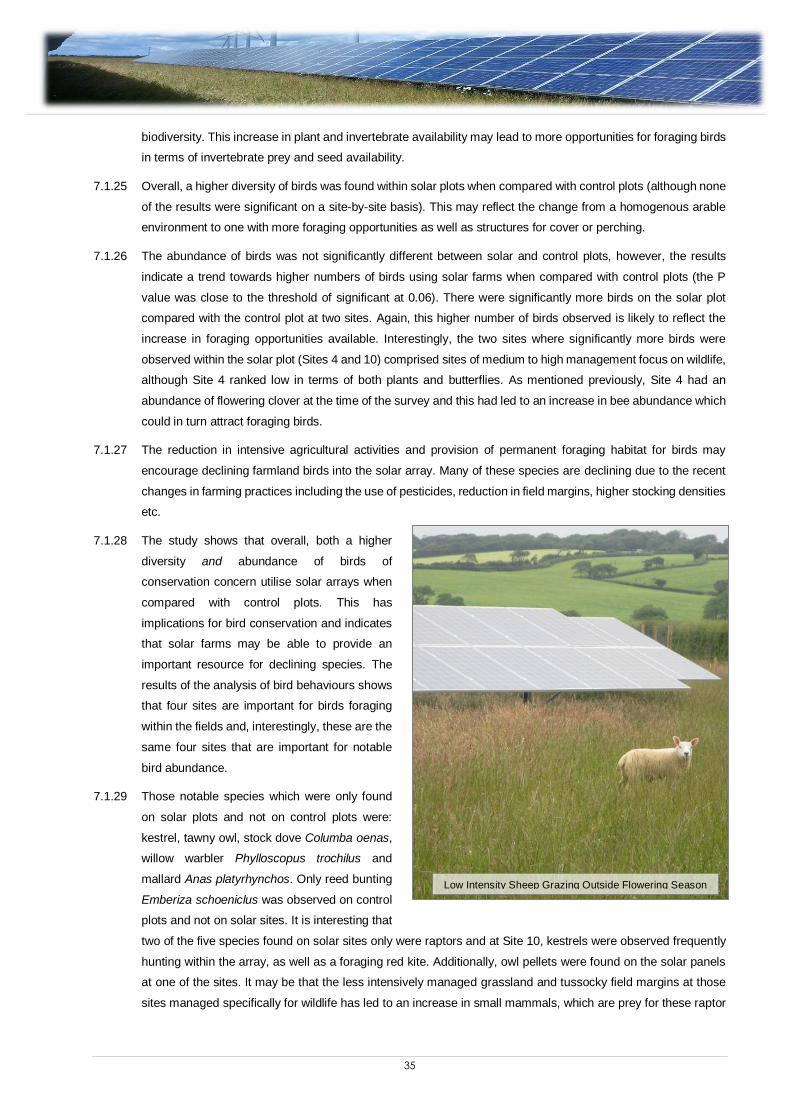
35
biodiversity. This increase in plant and invertebrate availability may lead to more opportunities for foraging birds
in terms of invertebrate prey and seed availability.
7.1.25 Overall, a higher diversity of birds was found within solar plots when compared with control plots (although none
of the results were significant on a site-by-site basis). This may reflect the change from a homogenous arable
environment to one with more foraging opportunities as well as structures for cover or perching.
7.1.26 The abundance of birds was not significantly different between solar and control plots, however, the results
indicate a trend towards higher numbers of birds using solar farms when compared with control plots (the P
value was close to the threshold of significant at 0.06). There were significantly more birds on the solar plot
compared with the control plot at two sites. Again, this higher number of birds observed is likely to reflect the
increase in foraging opportunities available. Interestingly, the two sites where significantly more birds were
observed within the solar plot (Sites 4 and 10) comprised sites of medium to high management focus on wildlife,
although Site 4 ranked low in terms of both plants and butterflies. As mentioned previously, Site 4 had an
abundance of flowering clover at the time of the survey and this had led to an increase in bee abundance which
could in turn attract foraging birds.
7.1.27 The reduction in intensive agricultural activities and provision of permanent foraging habitat for birds may
encourage declining farmland birds into the solar array. Many of these species are declining due to the recent
changes in farming practices including the use of pesticides, reduction in field margins, higher stocking densities
etc.
7.1.28 The study shows that overall, both a higher
diversity and abundance of birds of
conservation concern utilise solar arrays when
compared with control plots. This has
implications for bird conservation and indicates
that solar farms may be able to provide an
important resource for declining species. The
results of the analysis of bird behaviours shows
that four sites are important for birds foraging
within the fields and, interestingly, these are the
same four sites that are important for notable
bird abundance.
7.1.29 Those notable species which were only found
on solar plots and not on control plots were:
kestrel, tawny owl, stock dove Columba oenas,
willow warbler Phylloscopus trochilus and
mallard Anas platyrhynchos. Only reed bunting
Emberiza schoeniclus was observed on control
plots and not on solar sites. It is interesting that
two of the five species found on solar sites only were raptors and at Site 10, kestrels were observed frequently
hunting within the array, as well as a foraging red kite. Additionally, owl pellets were found on the solar panels
at one of the sites. It may be that the less intensively managed grassland and tussocky field margins at those
sites managed specifically for wildlife has led to an increase in small mammals, which are prey for these raptor
Low Intensity Sheep Grazing Outside Flowering Season
36
species. Future research may focus on the use of solar sites by raptors (which would also include nocturnal
surveys) or an investigation into the abundance and diversity of small mammals through Longworth trapping
and footprint tunnel surveys.
7.1.30 Another aim of the study was to investigate the usage of solar sites by ground nesting birds, as it is generally
assumed that these species will be dissuaded from utilising these sites due to the cluttered nature of the
environment. Skylark was the only ground nesting bird which was regularly recorded and the analysis shows
that at only one site was the number of skylark territories within the control plot significantly higher than at the
solar plot. Overall, there was no significant difference between solar and control plots. This shows that skylarks
are utilising solar farms within their territorial boundaries. However, only one confirmed nest was identified within
a solar plot (at Site 10, the highest overall ranking site when looking at all indicators). The nest was situated
outside of the footprint of the array but within the security fencing surrounding the site in an area of grassland
measuring approximately 40x90m. This has implications for assessing impacts on skylarks and mitigation for
this species within other solar farm sites, as quite often within the layout of solar farms large areas remain
outside of the footprint of the array due to various factors (underground services, public rights of way, visual
impacts etc.). If these areas can be managed specifically for ground nesting birds, they may contribute towards
mitigation for these species. It should be noted, however, that Site 10 was situated in an area with very few
hedgerows and trees and so where these features are present, a larger open area may be required to encourage
ground nesting.
7.1.31 Although the study shows that skylarks do not nest within the footprint of the array, it does show that this species
will forage within solar farms. Indeed, within two of the Sites (2 and 4), significantly higher numbers of foraging
skylarks were observed within the solar plots when compared to the control plots.
7.1.32 In conclusion, although skylarks were not found to utilise solar sites for nesting, they do incorporate them into
their territorial boundaries and some of the sites may represent a valuable foraging resource for this species.
An interesting focus for future research would be to assess the productivity of skylarks utilising solar and control
plots. A proposed hypothesis may be that skylarks nesting adjacent to solar farms would be more productive
than those on control plots due to the increase in foraging resources.
Can solar farms encourage a greater diversity of bats?
7.1.33 The findings of the study generally suggest that fewer bats are recorded within the solar array than within the
control plot, although the differences in abundance of bats was only significant on a small number of sites and
the overall comparison of solar and control plots was not significantly different. It also appears clear that bats
do not entirely avoid solar arrays with regular activity by bats recorded at all sites.
7.1.34 The bat activity at both solar and control plots was generally very low when compared with other static surveys
of this type, although this is likely to reflect the placement of the microphones in the middle of the fields, as most
species of bat utilise hedgerow habitats or other linear features for navigation.
7.1.35 Interestingly, although the bat activity was low, the number of species was relatively high, although there was
no significant difference between solar and control plots. A peak number of eight species were recorded at
several sites and this includes the pooling of the Myotis genus, which cannot be separated to species by call
alone. It should be noted, however, that the distribution of bat species is limited within the UK and several of the
sites were located in areas where more species of bats are present, therefore, a direct comparison between
sites cannot be made.

37
7.1.36 It is unclear if the general reduced levels of activity recorded within the solar plots when compared with the
control plots is a real relationship or whether this is an artefact of the survey methodology.
7.1.37 The detectors employed during the surveys were fitted with high-gain microphones which are able to pick up
calls, in particular loud calls, at substantial distance. Microphones were therefore placed at least 50m from field
boundaries, where possible.
7.1.38 As such, whilst the microphones were placed at
least 50m from the field boundaries within both the
arrays and the control plots it is unclear if the bats
recorded by the detectors were recorded within the
fields or at the field boundaries. Furthermore, due
to the presence of the solar panels within the array
it is likely that calls would attenuate more quickly
within this cluttered environment than within the
control sites which had a more uniform and low-
lying structure. Vegetation heights were on every
control site lower than the height of the panels.
7.1.39 In retrospect, therefore, the methodology
employed to assess the diversity and abundance
of bats foraging within the array and control sites
had certain limitations.
7.1.40 Nevertheless, it remains possible that there is a
reduced level of bat activity within solar array sites.
This may be explained by the interaction of the
bats with the solar panels. Research suggests bats may be confused by artificially smooth surfaces. Bats have
been observed trying to drink from flat panels within laboratory settings9 and it has been suggested that they
may have difficulty in perceiving glassy surfaces as they do not reflect the echolocation calls in the same way
as a natural (and rough) surface. Instead, bats perceive smooth surfaces as holes and may even collide with
these surfaces (pers. com. Stefan Greif). Whilst it seems likely in a natural setting confusion would not be a
significant risk, as bats will learn to navigate these objects, the presence of smooth surfaces may be
disconcerting to bats who consequently avoid these areas in favour of typical natural environments which they
are familiar with.
7.1.41 It should also be noted that if the evidence of the invertebrate studies translates through to night-time
invertebrates (midges, moths etc.) it would suggest that the solar arrays will provide a better foraging resource
for bats than the control areas. As such the solar arrays and panels whilst having disadvantages and
representing unfamiliar, difficult to perceive structures, may ultimately become adopted by bats as they provide
excellent foraging opportunities. As bats are particularly long-lived animals it may be several years before the
effects of habituation become apparent. It may be that providing wide, diversely seeded field margins would
benefit bat species more than enhancing the grassland within the array itself.
7.1.42 The findings of the study suggest that a variety of species of bats do use solar arrays but possibly at a lower
level than within the control plots. If this pattern is true then the proliferation of solar arrays across the UK could
be having a small but nevertheless, adverse effect upon foraging and commuting bats. Clearly further study of
Placement of Static Bat Detector and Microphone

38
the relationship between bats and solar arrays are required. We would recommend that such further surveys
include the use of both manned and static detectors and that a survey methodology is devised which avoids the
possibility of high gain microphones recording bats at some distance from the location of the microphone.
Infrared cameras may be employed in order to investigate the behaviour of bats around the solar panels.
Other Observations
7.1.43 Whilst conducting the surveys for the selected biological indicators, anecdotal observations on other species
observed were also recorded.
7.1.44 One notable observation was that large numbers of brown hare were recorded within the solar farms compared
with surrounding land. This is a species of conservation concern due to declines in numbers in many parts of
the country. During the surveys, these animals were often flushed from beneath the strings of panels where
they had formed scrapes. It appears that solar arrays provide preferential habitat for hares, which would usually
form scrapes in the middle of large arable fields or long grassland during the summer months. It may be that
the panels offer shelter from sun/rain as well as protection from aerial predators. The animals are also likely to
have a good horizontal field of view under the panels to be able to detect ground predators. Therefore, this
artificial habitat may lead to increased hare survival or productivity, although further research would be required
in order to investigate this further.

39
8 CONCLUSIONS
8.1 Summary of Conclusions
The over-arching finding of this study is that where solar farms implement management that is focused upon
wildlife, an increase in biodiversity can be detected across a number of different species groups.
In this study, wildlife focused management included the seeding of a site with a diverse seed mix, limited use of
herbicides, conservation grazing or mowing and management of marginal habitats for wildlife. In sites where
these elements were implemented, greater increases in biodiversity were recorded.
Botanical diversity was found to be greater in solar farms than equivalent agricultural land. This partly reflects
sowing of new grassland, including species-rich meadow mixes, but also reflects less intensive management
typical of a solar farm.
Where botanical diversity is greater, this leads to a greater abundance of butterflies and bumblebees, and in
several cases, an increase in species diversity too.
The increase in botanical diversity and consequently the availability of invertebrates also results in a higher
diversity of bird species and in some cases, abundance. The study revealed that solar sites are particularly
important for birds of conservation concern.
While greater botanical diversity is somewhat expected, especially where diverse seed mixes have been sown,
the importance of this finding should not be under-estimated. Botanical diversity provides the basic building
blocks from which greater biological diversity can be achieved (as demonstrated by the increases recorded for
other species groups).
Wild flower meadows have declined by 97% in the UK since the 1950’s. The establishment of wildflower
meadows within the UK’s intensively farmed landscape would significantly contribute to the UKs biodiversity
targets. This study shows that a diverse meadow also has a knock-on positive effect on wider species, including
birds of conservation concern.
Furthermore, by providing diverse meadow habitat, solar farms will contribute a mosaic of habitat types which
is important foraging habitat for a wide range of species, especially in a farmed landscape. This is likely to
benefit species which occur in a wide range of habitats such as bumblebees as well as species requiring diverse
landscapes such as hares. A mosaic habitat will also benefit specific bird species, with a low sward height
benefitting some species and a longer sward benefitting others.
By encouraging high abundances of bees and butterflies, solar farms can become net producers of pollinating
insects. These insects perform a vital task of pollinating crops (including cereal crops, vegetables, soft fruits and
orchard fruits) and are in decline across the UK. Solar farms are likely to benefit surrounding farmland by
increasing the local abundance of pollinators.
Solar farms are likely to provide further benefits to humanity (such benefits are termed ecosystem services)
including carbon storage, water cycling, erosion control and provision of pest controlling species such as solitary
wasps and farmland birds. The provision of ecosystem services by solar farms should be the subject of future
research.
Solar farms are unique in the farmed landscape in that they provide a high value crop (solar power) while leaving
the majority of the land area free for wildlife management. There are very few other ways that farmers can earn
a sustainable amount of money by creating large areas of conservation habitat.

40
AREAS OF POTENTIAL FUTURE RESEARCH
Further study including sites of a greater range of ages in order to examine how the age of a solar farm
affects plant diversity.
Comparison of solar sites that were previously pasture compared with those which were previously arable
to examine plant diversity.
Analysis of species found beneath solar panels and whether there is a bias towards more specialist,
shade tolerant plants.
Economic analysis of solar farms and their contribution to ecosystem services.
Examination of the use of solar farms by raptor species (including nocturnal surveys for owls).
Study of the diversity/abundance of small mammals within solar farms (as linked to the presence of raptor
species) which may include Longworth trapping (potentially with mark and recapture) and footprint tunnel
surveys.
Investigation into the productivity of skylarks in the local landscape of a solar farm in order to investigate
the hypothesis that skylark productivity is higher adjacent to solar farms due to the increase in foraging
opportunities.
Further research into the impacts of solar arrays on bats. This should include manned surveys as well as
further static surveys potentially utilising a different methodology (such as reducing microphone gain).
Infrared cameras may also be utilised to investigate bat behaviour around solar panels.
Investigation into the usage of solar farms by brown hare.
Further research into other taxa including amphibians and reptiles as well as other invertebrate species.

41
9 MANAGEMENT RECOMMENDATIONS
9.1.1 Given the results of the surveys, the following management practices would be recommended in order to
optimise the benefits of a solar farm for biodiversity:
To enhance biodiversity, it is recommended that all or part of a solar farm is re-sown with a diverse wild flower
and fine grass mix.
The best approach would be to re-seed most or all of the site, and to incorporate as many native species of
grass and wild flower as possible. However, it should be noted that even including a few species of grass and
herb should have positive benefits.
An experienced ecologist should advise on the seed mix to ensure it includes suitable forage plants for both
butterflies and bumblebees, and to avoid tall species which may overshadow the panels.
Fine grasses should be used in place of typical agricultural grasses, e.g. rye-grass, which is aggressive and
does not encourage diversity.
In all sites where re-seeding has been done it is recommended that monitoring is undertaken to ensure the
vegetation develops as planned.
All plantings (seed mixes and woody plants) must be native species and should be of local provenance.
Solar farms should be managed through conservation grazing, with sheep grazing from September – March
and a pause from April – August to allow wild flowers to flower and set seed. If mowing is the management
option, then a similar approach should be adopted, with a pause in cutting from April – September.
Where solar sites comprise multiple fields, implementing different management regimes would benefit a wider
range of species. For example, one field may be grazed year-round in order to encourage species that require
a short sward height, while the main site area should be managed as above. If mowing is the management
option, the date of cutting may be varied across the site or between years in order to encourage plant species
that may flower and seed at different times.
All bare areas of a solar farm should be re-seeded as soon as possible with an appropriate meadow mix to a)
cover bare ground and reduce the risk of weeds, and b) increase the botanical diversity of the site.
Use of herbicide should be restricted to spot treating of pernicious weeds (docks, thistles and ragwort) wherever
possible. Herbicides reduce wild flower diversity and create conditions suitable for weeds.
Open areas within the solar farm (wayleaves or voids) should be managed specifically for ground nesting birds
by grazing at low stocking density through the winter and allowing the grasses to grow up through the bird
breeding season (March – July inclusive).

42
10 REFERENCES
1 Solar Photovoltaic Deployment in the UK. September 2015. Department of Energy and Climate Change
2 Solar Parks: Maximising Environmental Benefits. TIN101. September 2011. Natural England
3 BRE (2014) Biodiversity Guidance for Solar Developers. Eds G E Parker and L Greene
4 Taylor R (2014) Potential Ecological Impacts of Ground-Mounted Photovoltaic Solar Panels in the UK. An
Introduction and Literature Review. BSG Ecology
5 Parker G and McQueen C (2013) Can Solar Farms Deliver Measurable Benefits for Biodiversity? Wychwood
Biodiversity and Rowsell & McQueen
6 Feltwell, J. (2013) A Comparative Biodiversity Study of a Working Solar Farm and a Wheat Field in West
Sussex, July- November 2013. (Unpublished Report, dated 7 December 2013)
7JNCC (2013) UK Biodiversity Indicators in your Pocket
8 Gilbert et al. (1998) Bird Monitoring Methods – A Manual of Techniques for Key UK Species. RSPB,
Bedfordshire
9 Greif, S & B. M. Siemers (2010) Innate Recognition of Water Bodies in Echolocating Bats. Nature
Communications 1. Article 107

43
APPENDIX A: SURVEY METHODOLOGIES
Botany
All botanical visits were conducted from mid-June to late July (16/06/15 to 21/07/15) in order to standardise
surveys.
The surveys comprised the assessment of the grassland sward utilising 50cm² quadrats. Percentage cover of
each plant species within the quadrat was recorded using the Domin Scale:
% Cover Domin Score
91–100% 10
76–90% 9
51–75% 8
34–50% 7
26–33% 6
11–25% 5
4–10% 4
<4% (>10 individual plants) 3
<4% (5-10 individual plants) 2
<4% (<5 individual plants) 1
A total of 30 quadrats were recorded at each site, comprising:
10 quadrats within the treatment plot - unshaded, between strings of panels
10 quadrats within the treatment plot – directly beneath panels, adjacent to the above
10 quadrats within control plot
The quadrat locations were selected using random points generated within qGISiv mapping software and were
located on the ground using a GPS device.
Birds
A total of three bird surveys were conducted at each site during late April to early July. The treatment and
control plot surveys were carried out on the same day between 06:00am and 10:00am.
The bird surveys followed a fixed transect designed in a ‘zig zag’ pattern, with the transect being started on
the northern field boundary, then crossing the plot every 100m until the southern field boundary is reached.
The length of the transect therefore varied from site to site, but was roughly the same distance between the
paired treatment and control plots.
iv Quantum GIS Development Team (2014). Quantum GIS Geographic Information System. Open Source Geospatial Foundation
Project.http://qgis.osgeo.org

44
All bird species within 50m of the transect route were recorded, including the behaviour (calling/singing,
foraging, flying over site) and location (within field or within field boundary). As far as possible, birds were not
double-counted, however, this methodology allows for some double counting.
Where ground nesting birds were observed, the location and behaviour was mapped on a separate survey
sheet using the BTO common bird census territory mapping methodologyv. These were then utilised to assess
the numbers of ground nesting bird territories and potential location of nests.
Invertebrates
Invertebrate surveys concentrated on two taxa; bumblebees and butterflies. A total of ten 100m transects
were carried out within the treatment plot and ten within the control plot.
Invertebrate surveys were conducted during June, with five sites being revisited for a second survey in mid-
June to early July.
Transects were spaced evenly throughout the field, positioned in an east/west arrangement, with one transect
at the northern field boundary and one at the southern.
The transects were were walked at a slow pace, with all bumblebee and butterfly species within 2.5m of each
side of the transect line recorded. The ground ahead was also scanned, with binoculars used where required.
Bats
Automated bat surveys were conducted at both the treatment and control plot using Song Meter 2 Acoustic
Monitoring systems. The detectors were placed in the centre of the fields, at a height determined by the size
of the solar panels within the treatment plot; both microphones were positioned 150mm above the height of
the solar panels. Detectors were deployed from early June to early July and collected two weeks later.
Microphones were attached to extendable poles within the control plots or batons attached to the solar panel
frames and left to record for a period of at least 10 days. The batteries lasted for varying amounts of time on
each site, depending on the amount of bat passes or noise recorded.
Upon collection, the data was subsequently analysed using Kaleidoscope software. This computer program
automatically analyses bat calls using a stored library of comparison calls. Any less widespread bats which
were automatically identified by the software were also manually checked to verify the species recorded.
vMarchant, J.H. 1983. Common Birds Census instructions. BTO, Tring. 12pp

45
APPENDIX B: STATISTICAL ANALYSIS
The majority of data collected on site consisted of frequencies, that is the number of species or individuals
observed. In most cases the comparison of solar plot and control plot surveys involved comparing the number
of species found in each, e.g. 7 species of butterfly observed in the solar plot vs. 3 observed in the control
plot. In such cases, the Chi Square statistical testvi was used to determine if the difference between the solar
plot and control plot was significant. It is possible to directly compare these results because the same survey
methods and effort were used in the solar plot and control plot.
While Chi Square works for individual sites, it was necessary to compare all butterfly survey results on solar
plots with control plots. In these cases, the 17 surveysvii for solar plots were compared with the 17 for control
plots using the Mann Whitney U testviii.
To explore botanical diversity, the results of individual quadrats within the solar plot were compared to those
within the control plot, so 10 solar quadrats were compared to 10 control quadrats (only the ‘between panels’
quadrats were used in this analysis) for each site. The Mann-Whitney U test was used to compare botanical
results.
Within the solar plot, we investigated whether there was any difference in botany between the panels vs.
beneath the panels. As above, the Mann-Whitney U test was used to compare the results.
Where notable birds were identified during bird surveys, this was explored further. Birds were categorised
depending on their conservation status, based on those listed within the British Trust for Ornithology Birds of
Conservation Concernix. This list contains red and amber designated birds which are showing declines in
population and so are of particular conservation concern. A weighted scoring system was utilised within the
analysis of the data where non-notable birds (those not on the Birds of Conservation Concern list) were given
a score of 1, amber listed birds were given a score of 2 and red listed a score of 3. An overall score could then
be obtained in order to carry out the statistical analysis.
An over-arching analysis of all 11 solar plots was conducted where the results for all solar plots were pooled
and compared to the 11 control plots. This approach was designed to investigate what patterns existed overall
between solar and control plots. It was possible to pool data for all sites because the same survey methods
and effort had been applied at each site.
vi This non-parametric statistical test is designed to compare individual numbers and is able to deal with count data. vii There were 17 invertebrate surveys in total spread across 11 solar farms. On 6 solar farms 2 surveys were conducted while on 5 solar farms a single survey was conducted. viii The Mann-Whitney U test is a non-parametric statistical test that compares two data sets and is able to deal with count data. ixEaton MA, Aebischer NJ, Brown AF, Hearn RD, Lock L, Musgrove AJ, Noble DG, Stroud DA and Gregory RD (2015) Birds of Conservation Concern 4: the population status of birds in the United Kingdom, Channel Islands and Isle of Man. British Birds 108,
708–746.

APPENDIX C: GROUND NESTING BIRD TERRITORY MAPS


1 Solar Photovoltaic Deployment in the UK. September 2015. Department of Energy and Climate Change 2 Solar Parks: Maximising Environmental Benefits. TIN101. September 2011. Natural England 3 BRE (2014) Biodiversity Guidance for Solar Developers. Eds G E Parker and L Greene 4 Taylor R (2014) Potential Ecological Impacts of Ground-Mounted Photovoltaic Solar Panels in the UK. An Introduction and
Literature Review. BSG Ecology 5 Parker G and McQueen C (2013) Can solar farms deliver measurable benefits for biodiversity? Wychwood Biodiversity and Rowsell & McQueen.
7JNCC (2013) UK Biodiversity Indicators in your Pocket. 8 Gilbert et al. (1998) Bird Monitoring Methods – a manual of techniques for key UK specie
s. RSPB, Bedfordshire. 9 Greif, S & B. M. Siemers. 2010. Innate Recognition of Wa
ter Bodies in Echolocating
Bats. Nature Communications 1. Art
icle 107
.