the effects of stress and placebo alcohol on cognitive ... · the effects of stress and placebo...
TRANSCRIPT
The Effects of Stress and Placebo Alcohol on Cognitive Activation and Inhibitory Control in Male Problem Drinkers
and Healthy Controls
by
Anne-Marie Tremblay
A thesis submitted in conformity with the requirements for the degree of Master of Science
Department of Pharmacology and Toxicology University of Toronto
© Copyright by Anne-Marie Tremblay 2009

ii
The Effects of Stress and Placebo Alcohol on Cognitive Activation
and Inhibitory Control in Male Problem Drinkers and Healthy
Controls
Anne-Marie Tremblay
Master of Science
Department of Pharmacology and Toxicology University of Toronto
2009
Abstract
This study assessed the separate and combined effects of two important instigators of relapse,
alcohol cues and stress, on the salience of alcohol target stimuli and inhibitory control, in 12
male problem drinkers and 16 male controls. Subjects underwent two test sessions where they
received alcohol cues (non-alcoholic beer) and/or stress (uncontrollable noise) in a
counterbalanced manner. Testing was carried out through validated, computer-based tasks:
modified Stroop, gambling-word Shift task; and conventional and modified (Alcohol word)
Stop-Signal tasks. Inhibitory control was preferentially impaired to Alcohol stimuli in both
groups. Beer and stress in combination increased incentive salience of Alcohol stimuli and
moderated self-reported desire for alcohol in problem drinkers but not controls. Results suggest
that alcohol cues and stress have interactive effects on subjective motivation, and disinhibit
behaviour due to distraction in problem drinkers. Findings from this paradigm may improve
understanding and facilitate treatment for relapse prevention in problem drinkers.
iii
Acknowledgments
I would like to thank Dr. Martin Zack, Dr. Usoa Busto and Dr. Laurie Zawertailo for their
guidance and support. I would also like to thank my family for their continued encouragement
throughout this project.

iv
Table of Contents Abstract ..................................................................................................................................... ii
Acknowledgements.................................................................................................................. iii
Table of Contents..................................................................................................................... iv
List of Tables ........................................................................................................................... vi
List of Figures ......................................................................................................................... vii
1 Introduction........................................................................................................................... 1
1.1 Behavioural Systems of Relapse.............................................................................. 2
1.2 Neurochemical Processes......................................................................................... 3
1.2.1 Dopamine.................................................................................................... 3
1.2.2 Serotonin ..................................................................................................... 4
1.2.3 Opioids........................................................................................................ 5
1.3 Cognitive Processes ................................................................................................. 6
1.3.1 Attentional Bias .......................................................................................... 6
1.3.2 Inhibitory Control ....................................................................................... 8
1.4 Operationalizing Relapse – The Model ................................................................. 10
1.4.1 Independent Variables .............................................................................. 10
1.4.1.1 Stress .......................................................................................... 10
1.4.1.2 Alcohol Cues .............................................................................. 11
1.4.2 Dependent Variables................................................................................. 12
1.4.2.1 Salience – Stroop Task............................................................... 12
1.4.2.2 Disinhibition – Stop Signal Task ............................................... 13
1.4.2.3 Novel Indices.............................................................................. 14
1.5 Experimental Questions ......................................................................................... 16
1.6 Hypotheses............................................................................................................. 16

v
2 Methods............................................................................................................................... 18
2.1 Study Design.......................................................................................................... 18
2.2 Subjects .................................................................................................................. 29
2.3 Materials ................................................................................................................ 21
2.3.1 Apparatus .................................................................................................. 21
2.3.2 Questionnaires........................................................................................... 23
2.3.3 Experimental Tasks................................................................................... 26
2.4 Procedure ............................................................................................................... 33
2.5 Data Analysis ......................................................................................................... 35
3 Results................................................................................................................................. 37
3.1 Background Characteristics ................................................................................... 37
3.2 Experimental Effects.............................................................................................. 40
3.2.1 Self-Report ................................................................................................ 41
3.2.2 Cognitive Tasks ........................................................................................ 45
3.2.3 Physiological Measures ............................................................................ 57
4 Discussion ........................................................................................................................... 61
4.1 Self-Report ............................................................................................................. 61
4.2 Cognitive Tasks ..................................................................................................... 65
4.3 Physiological Measures ......................................................................................... 68
4.4 General Discussion ................................................................................................ 69
4.5 Conclusion ............................................................................................................. 71
4.6 Limitation............................................................................................................... 72
4.7 Future Directions ................................................................................................... 72
References............................................................................................................................... 74
Appendix A............................................................................................................................. 80
Study Advertisement from February 2008 to May 2008 .............................................. 80
vi
Study Advertisement from June 2008 to December 2008 ............................................ 81
Appendix B ............................................................................................................................. 82
Consent Form................................................................................................................ 82
Appendix C ............................................................................................................................. 87
Table I. ANOVA of colour-naming reaction times on the modified Stroop task ....... 87
Table II. ANOVA of commission errors on the Shift task ......................................... 88
Table III. ANOVA of reaction time scores on the Lexical Stop Signal task .............. 90
Table IV. ANOVA of go reaction time (go_rt) and stop signal reaction time (ssrt) scores on the Stop Signal task...................................................................................... 92

vii
List of Tables Table 1. Stress-Drink sequences for problem drinkers and controls across test sessions...... 18
Table 2. Test session timeline................................................................................................ 36
Table 3. Mean (SD) background characteristics in problem drinkers (n = 12) and controls (n = 16).................................................................................................................................... 37
Table 4. Mean (SD) trait characteristics in problem drinkers (n = 12) and controls (n = 16).................................................................................................................................... 39
Table 5. Mean (SD) scores for problem drinkers (n = 12) and controls (n = 16) on the Digit Span task........................................................................................................................ 39
Table 6. Mean (SD) Drink Strength ratings of placebo beer drinks for problem drinkers (n = 12) and controls (n = 16) ................................................................................................. 40
Table 7. Mean (SD) Desire to Gamble scores for problem drinkers (n = 12) and controls (n = 16).................................................................................................................................... 44
Table 8. Mean (SD) State Anger scores for problem drinkers (n = 12) and controls (n = 16).................................................................................................................................... 46
Table 9. Mean (SD) colour-naming reaction time to gambling and neutral words on the modified Stroop task in problem drinkers (n = 12) and controls (n = 16) .............................. 48
Table 10. Mean (SD) number of commission errors for neutral and gambling words, on shift and non-shift trials, during the Shift task in problem drinkers (n = 12) and controls (n = 16).................................................................................................................................... 51
Table 11. Mean (SD) diastolic blood pressure in problem drinkers (n = 12) and controls (n = 16), separated by test session and condition.................................................................... 59
Table 12. Mean (SD) heart rate in problem drinkers (n = 12) and controls (n = 12), separated by test session and condition .................................................................................. 60

viii
List of Figures Figure 1. Flowchart of the study recruitment of problem drinker and control subjects (between the period of February to December 2008) ............................................................. 20
Figure 2. Mean (SEM) visual analog scale ratings of Desire for Alcohol (0-100; Not at all – Extreme) after the Noise task and after drink administration across conditions ............ 43
Figure 3. Mean (SEM) colour-naming response time to Alcohol vs. Neutral words on a modified Stroop task across conditions .................................................................................. 49
Figure 4. Mean (SEM) stop signal reaction time for Alcohol and Neutral words across sessions on the Lexical Stop Signal task................................................................................. 53
Figure 5. Mean (SEM) stop signal reaction time to Neutral and Alcohol words on the Lexical Decision task across conditions ................................................................................. 54
Figure 6. Mean (SEM) stop signal reaction time across sessions on the Conventional Stop Signal task....................................................................................................................... 56
Figure 7. Mean systolic blood pressure across test sessions.................................................. 58

1
1 Introduction Relapse is a major challenge in the treatment of alcohol use disorders (McKay, Franklin et al.
2006). While achieving detoxification and early abstinence can be readily accomplished,
maintaining abstinence over prolonged periods of time remains a common problem (McKay,
Franklin et al. 2006). Two of the most reliable instigators of relapse are stress and exposure to
cues for the addictive substance. The progressive loss of inhibitory control towards drug use
combined with increased incentive salience of addictive stimuli are two critical processes
believed to mediate the effects of these relapse instigators (Volkow, Fowler et al. 2004). While
these processes may involve neuroadaptations that occur in pharmacologically distinct pathways,
they likely converge on a common mesocorticolimbic dopamine system (Shaham, Shalev et al.
2003; Volkow, Fowler et al. 2004).
Highly reliable and valid models of stress- and cue-induced reinstatement of alcohol seeking
have been developed in animals (Stewart 2003). In humans, a number of studies have sought to
evaluate the effects of these variables independently. However, their combined and possible
interactive effects have not been extensively investigated in problem drinkers. In addition, there
is a need to operationalize the effects of stress and cues in a manner that captures the cognitive
processes (i.e. increased salience and loss of inhibitory control) that are presumed to result in
relapse. The overall goals of this thesis are to [A] assess the interactive effects of stress and
alcohol cues on well validated indices; [B] to validate novel indices of response to these
variables to further characterize the cognitive processes involved; and [C] to compare the pattern
of responses in problem drinkers and healthy control subjects, who should have different
susceptibilities to stress and alcohol cues. The ultimate objective is to facilitate pre-clinical
development of medications to deter relapse in problem drinkers.

2
1.1 Behavioural Systems of Relapse Vulnerability to relapse is hypothesized to result from impaired response inhibition combined
with excessive salience attribution to drug-related cues (Goldstein and Volkow 2002). These
cognitive processes are believed to be mediated by two distinct neurochemical systems: the
behavioural approach system (BAS) and the behavioural inhibition system (BIS) (Gray 1991).
The BAS is activated by appetitive stimuli, such as those related to reward, while the BIS is
activated by conditioned stimuli associated with punishment or termination of reward (Franken,
Muris et al. 2006). In healthy individuals, a balance exists between the approach and inhibition
systems. However, individuals susceptible to addiction and relapse are believed to have an
excessive BAS and deficient BIS (Goldstein and Volkow 2002). As a result, relapse triggers,
such as drug cues and stress, can reinstate drug seeking despite the negative consequences of
doing so.
The ability of stress and alcohol cue exposure to instigate relapse has been extensively studied in
animals using reinstatement models of alcohol seeking. For example, an intermittent foot-shock
stressor reliably reinstates alcohol seeking in rats following extinction (Le, Quan et al. 1998).
Similarly, auditory cues predictive of alcohol availability were found to reinstate alcohol seeking
in rats following a period of extinction (Katner, Magalong et al. 1999).
In humans, drug-related cues and episodes of stress have consistently been reported as factors
precipitating relapse in drug dependent populations (McKay, Franklin et al. 2006). As
individuals engage in repeated drug use, associated stimuli become increasingly salient and drug
taking behaviour becomes progressively more difficult to control (Goldstein and Volkow 2002).
These processes are likely mediated within the prefrontal, orbitofrontal and anterior cingulate
3
cortices and converge on the mesocorticolimbic dopamine system obligatory for the
reinstatement of drug seeking (Kalivas and Volkow 2005).
1.2 Neurochemical Processes The actions of alcohol are mediated through multiple neurotransmitters (Kiefer and Mann 2005).
Of key importance in the study of relapse are the opioid, serotonin and dopamine systems.
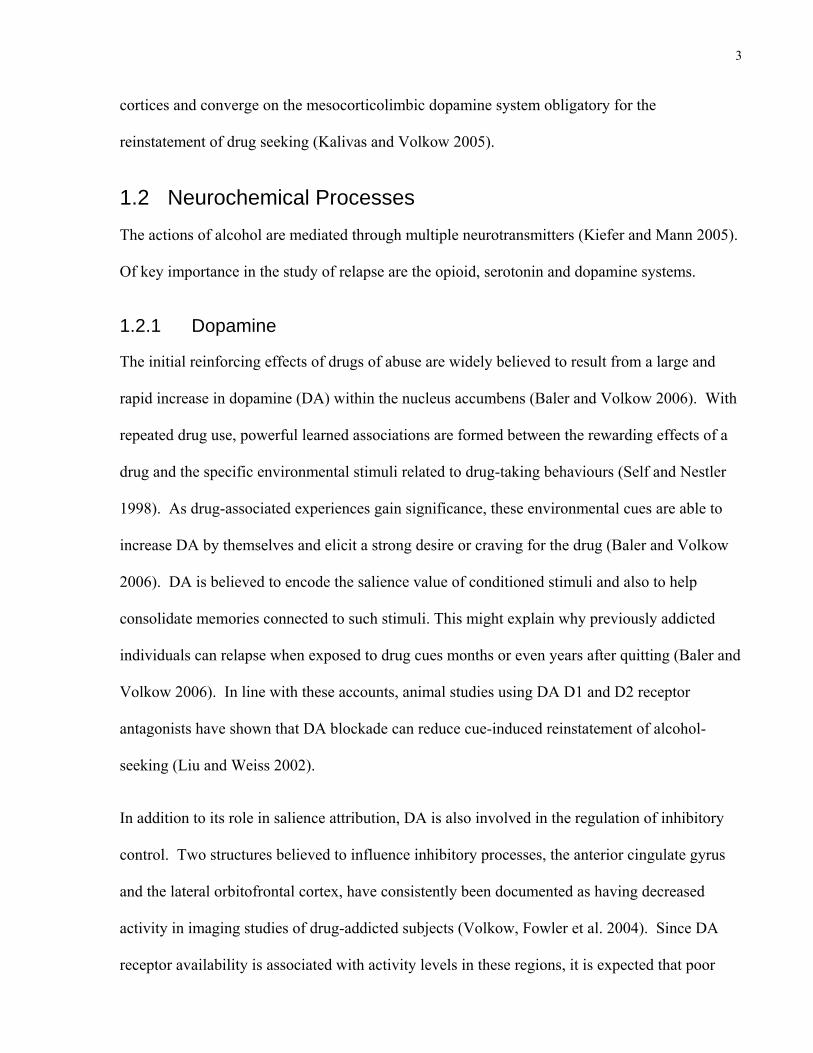
1.2.1 Dopamine
The initial reinforcing effects of drugs of abuse are widely believed to result from a large and
rapid increase in dopamine (DA) within the nucleus accumbens (Baler and Volkow 2006). With
repeated drug use, powerful learned associations are formed between the rewarding effects of a
drug and the specific environmental stimuli related to drug-taking behaviours (Self and Nestler
1998). As drug-associated experiences gain significance, these environmental cues are able to
increase DA by themselves and elicit a strong desire or craving for the drug (Baler and Volkow
2006). DA is believed to encode the salience value of conditioned stimuli and also to help
consolidate memories connected to such stimuli. This might explain why previously addicted
individuals can relapse when exposed to drug cues months or even years after quitting (Baler and
Volkow 2006). In line with these accounts, animal studies using DA D1 and D2 receptor
antagonists have shown that DA blockade can reduce cue-induced reinstatement of alcohol-
seeking (Liu and Weiss 2002).
In addition to its role in salience attribution, DA is also involved in the regulation of inhibitory
control. Two structures believed to influence inhibitory processes, the anterior cingulate gyrus
and the lateral orbitofrontal cortex, have consistently been documented as having decreased
activity in imaging studies of drug-addicted subjects (Volkow, Fowler et al. 2004). Since DA
receptor availability is associated with activity levels in these regions, it is expected that poor
4
inhibitory control is mediated in part by disturbances in DA transmission (Volkow, Fowler et al.
2004).
1.2.2 Serotonin
Considerable evidence from animal studies suggests that serotonin (5-HT) plays an important
role in relapse. Models of reinstatement to alcohol seeking have shown that local infusions of 5-
HT1A agonist 8-OH-DPAT into the median raphe nucleus (MRN), a major site of cell bodies for
the 5-HT neuronal system, can induce alcohol reinstatement in rats (Le, Funk et al. 2008).
The ability of 5-HT agents to modulate relapse may derive in part from this neurotransmitter’s
influence on impulsivity. Dexfenfluramine, a 5-HT releaser, previously shown to dose-
dependently reduce alcohol consumption, can also reduce impulsivity scores in a delay of reward
paradigm (Poulos, Parker et al. 1996). Furthermore, intra-MRN infusions of 8-OH-DPAT,
capable of reinstating alcohol seeking, are associated with enhanced responding (i.e., inhibitory
failure) in tasks measuring response inhibition, an indirect measure of impulsivity (Le, Harding
et al. 2002).
Lastly, the pathway by which stress can trigger relapse appears to be influenced by 5-HT. Using
footshock as a stressor, injections of 5-HT reuptake blocker fluoxetine were able to block
reinstatement to alcohol seeking. This effect was also reproduced using dexfenfluramine and 5-
HT3 receptor antagonists ondansetron and tropisetron (Le, Funk et al. 2006).
Together, these results suggest that impaired functioning of the 5-HT system, associated with
inhibitory control deficits such as excessive impulsivity, contribute to relapse vulnerability.
Additionally, the role of 5-HT may be especially pronounced in stress-induced relapse.

5
1.2.3 Opioids
Endogenous opioids are crucial neurotransmitters involved in the initiation, maintenance and
reinstatement phases of drug consumption. A key role of the opioid system is to mediate reward
processes by modulating associated dopamine pathways (Herz 1997). Specifically, opioids
appear to play an important role in alcohol craving. For example, a correlation between opioid
receptor availability and alcohol craving in detoxified alcoholic patients was found in a positron
emission tomography study, using the selective μ opioid receptor ligand carfentanil (Heinz,
Reimold et al. 2005).
The use of the nonselective opioid receptor antagonist naltrexone for relapse prevention in
problem drinkers offers further support for the importance of the endogenous opioid system
(Kiefer and Mann 2005). Because of the opioid system’s role in mediating craving, naltrexone
has been hypothesized to be most effective in patients who suffer from intense desires to drink
alcohol (Kiefer and Mann 2005). In line with this finding, naltrexone has been shown to
efficiently reduce cue-induced responding to alcohol seeking in animal studies (Katner,
Magalong et al. 1999). Selective antagonists of μ or δ opioid receptors have also been shown to
inhibit alcohol-seeking behaviour to drug-related environmental stimuli (Ciccocioppo, Martin-
Fardon et al. 2002). On the other hand, opioid antagonism does not block reinstatement to
alcohol seeking following exposure to stress (Le, Poulos et al. 1999).
This research suggests that, while the opioid system does not appear to play a role in stress-
induced relapse, its effect on craving and the dopaminergic reward system likely influences
susceptibility to cue-induced relapse.

6
1.3 Cognitive Processes Repeated drug use is associated with numerous cognitive changes which can influence individual
vulnerability to relapse. Increased attentional bias to drug-associated cues and loss of control
over drug-taking behaviour are two critical processes believed to contribute to stress and cue-
induced relapse.
1.3.1 Attentional Bias
Through a classical conditioning system, drug-related cues are paired with the effects of the
abused drug (Field 2006). As a consequence, these cues come to predict the unconditioned
stimuli (i.e. the drug itself) and acquire salience, defined as the ability to capture an individual’s
attention (Field 2006). With repeated use, drugs can “hijack” the reward pathways and increase
the salience of drug-associated cues at the expense of natural reward cues (Kalivas and Volkow
2005). For example, problem drinkers may tend to ignore conventional rewards and give
processing priority to alcohol cues (Cox, Klinger et al. 2006). As a result, they would be more
likely to notice, encode, and think about alcohol cues than non drinkers (Cox, Klinger et al.
2006).
Involuntary attention to these drug-related stimuli can be interpreted by both the positive and
negative reinforcement models of addiction. Theorists who support the positive reinforcement
model argue that drug-related cues become associated with the positive reinforcing properties of
drugs. It is the incentive properties of these cues, which motivate further drug seeking (Field
2006). According to the negative reinforcement model, drug-related cues are associated with the
negative affect present during drug withdrawal. In this case, exposure to drug-associated cues
leads to renewed drug taking as a means to avoid a withdrawal state (Field 2006). Regardless of
whether the conditioned drug-related stimuli trigger euphoria or dysphoria, addicted individuals

7
report an intense desire to self-administer the drug of choice following cue exposure (Self and
Nestler 1998).
Numerous studies have shown evidence for attentional bias in addicted populations, including
problem drinkers. For example, in an fMRI study conducted in humans using a monetary delay
task (Wrase, Schlagenhauf et al. 2007), detoxified alcohol dependent subjects showed reduced
activation of the ventral striatum during anticipation of monetary gains and increased activation
in response to alcohol cues, relative to healthy controls. Activation of the ventral striatum was
also correlated with alcohol craving. These results suggest that problem drinkers are biased
towards the processing of alcohol cues, which might explain why they have difficulty focusing
on conventional reward cues and engaging in alternative rewarding activities (Wrase,
Schlagenhauf et al. 2007). Furthermore, on a modified Stroop task assessing attentional bias to
alcohol-related words versus neutral words, relapsing alcohol abusers showed an increase in
attentional bias towards alcohol stimuli at follow-up compared to the first assessment (Cox,
Hogan et al. 2002). In contrast, non-relapsing alcohol dependent subjects who successfully
completed the treatment program showed a reduction in attentional bias (Cox, Hogan et al.
2002).
This research illustrates that involuntary attention to drug-related stimuli is a detrimental
cognitive consequence of prolonged drug use. In addition, the neuronal changes associated with
drug exposure can be long lasting and play an important role in an addicted individual’s ability to
maintain abstinence.

8
1.3.2 Inhibitory Control
Despite intentions to quit, many drug users experience repeated periods of relapse. This apparent
loss of control is a hallmark of addictive behaviours and may occur outside conscious awareness
(McCusker 2006).
Initially, drug taking is believed to be mediated by conscious and intentional cognitive processes
(McCusker 2006). However, with repeated use, drug consumption becomes a well-learned
behaviour, which eventually becomes habitual (Robbins and Everitt 2002). As a result,
attentional bias towards drug-related cues is increasingly mediated by fast, effortless automatic
processes that involve little conscious effort and are difficult to control (McCusker 2006).
In addition to addiction becoming habit-based, it is associated with prefrontal cortex deficits, a
key brain region mediating impulse control (Bechara, Noel et al. 2006). Ordinarily, executive
inhibitory functions mediated by the prefrontal cortex act to transiently suppress conditioned
responses, a type of pre-potent responding, allowing slower intentional cognitive mechanisms to
guide behaviour (Jentsch and Taylor 1999). With prefrontal cortex dysfunction, behaviour is
dominated by pre-potent tendencies and individuals preferentially respond to immediate small
rewards over delayed larger ones (i.e., they have difficulty delaying gratification, even though it
would be adaptive) (Jentsch and Taylor 1999).
Changes in pre-potent responding within addicted populations have been well documented. For
example, on the Iowa Gambling Task, where subjects are asked to make decisions between
various monetary rewards, substance abusers, but not controls, failed to trigger anticipatory skin
conductance responses when pondering choices associated with high immediate gains but more
severe delayed losses (Bechara and Damasio 2002; Bechara, Dolan et al. 2002). These findings
suggest that drug users have a deficient executive functioning system that favors pre-potent

9
reward responses at the expense of long-term more beneficial outcomes. Similar results were
found in patients (without addiction) suffering a ventromedial prefrontal cortex lesion, which
supports the role of this neural substrate in regulating inhibitory control (Bechara and Damasio
2002; Bechara, Dolan et al. 2002).
A Stroop study, assessing inhibition of a pre-potent response (reading a word) and its association
with glucose metabolism in drug users, offers additional support for the role of the prefrontal
circuit in response inhibition (Goldstein, Volkow et al. 2001). For cocaine and alcohol
dependent subjects, higher metabolism within the orbitofrontal gyrus, a part of the prefrontal
cortex, was associated with greater inhibition. Conversely, higher metabolism within the same
region in controls was associated with poorer performance. These findings suggest a change in
the function of the orbitofrontal cortex with substance addiction (Goldstein, Volkow et al. 2001).
Such disturbances within the prefrontal circuits may help to explain drug users’ vulnerability to
stress-induced relapse. High levels of stress have been suggested to further impair the
functioning of the prefrontal cortex, and, consequently, inhibitory control (Li and Sinha 2008).
This notion is supported by a study conducted in monkeys, which showed that an uncontrollable
noise stress impaired prefrontal cognitive function (Arnsten and Goldman-Rakic 1998).
Together, these results suggest that drug dependent individuals suffer from inhibitory control
deficits, likely mediated by prefrontal circuits. Thus, excessive attentional bias towards
motivationally relevant stimuli combined with the poor inhibition mechanisms found in
dependent drug users can results in a dangerous susceptibility towards relapse.

10
1.4 Operationalizing Relapse – The Model Given the detrimental consequences of relapse, a better understanding of the cognitive pathways
and factors involved is vital to the development of more effective treatment strategies for its
prevention. Studies investigating the influence of different relapse triggers on cognitive
processes have usually examined the effects of such triggers independently. However, in the
natural environment, individuals are likely to be exposed to relapse instigators concurrently. For
example, even if stress is the principal trigger, the individual will necessarily encounter cues for
the drug prior to actual drug administration. A model capable of operationalizing both the
independent and combined effects of these instigating factors while assessing their influence on
cognitive processes that mediate relapse would have enhanced external validity, which should
help to identify treatments more likely to be effective outside the laboratory.
Building on initial evidence, the present study investigated the independent and combined effects
of stress and alcohol cues on cognitive activation and inhibitory control in male problem
drinkers, with moderate to heavy alcohol dependence, and healthy controls.
1.4.1 Independent Variables
1.4.1.1 Stress
Stress has been operationalized in numerous ways. In this model, stress will be induced by a
controllable/uncontrollable (C/UC) noise task (Richell and Anderson 2004). In this task,
subjects can extinguish an aversive noise (110 dB binaural white noise) on one occasion (test
session) but not on the other. This paradigm aims to generate feelings of lack of control that can
precipitate negative mood states (e.g., anger, frustration, hopelessness) (Richell and Anderson
2004).
11
Animal studies have shown that the specific neurochemical and neuroendocrine consequences of
uncontrollable stress are not observed following exposure to identical amounts of controllable
stress (Breier, Albus et al. 1987). In humans, healthy volunteers who have undergone the C/UC
paradigm have reported higher self-ratings of stress, helplessness, lack of control, tensions and
anxiety following exposure to uncontrollable noise versus controllable noise (Breier, Albus et al.
1987). These same subjects also had greater hypothalamic-pituitary-adrenal axis function after
the stress condition (Breier, Albus et al. 1987). As a result, lack of control over a mild aversive
stimulus can produce a negative mood state as well as autonomic nervous system changes in
healthy subjects (Breier, Albus et al. 1987). It is hypothesized that an analogous noise stressor
will precipitate negative affect when administered to both problem drinkers and healthy controls.
If problem drinking involves vulnerability to stress (Koob and Le Moal 1997), problem drinkers
should display greater reactivity to UC noise than controls.
1.4.1.2 Alcohol cues
In this model, exposure to alcohol cues will be achieved by consumption of nonalcoholic beer,
which subjects are led to believe is actual alcohol. The use of nonalcoholic beverages has been
used extensively in research to induce the expectation of having received alcohol (Martin and
Sayette 1993). Findings suggest that placebo beer is a highly credible placebo (Martin,
Earleywine et al. 1990). The effects of anticipating alcohol will also be examined by advising
subjects, upon arrival, that they will receive beer (test condition) or that they will receive a soft
drink (control condition).
Nonalcoholic beer may provide a superior placebo since it allows sensory cues (i.e., conditioned
alcohol stimuli) to be present throughout beverage consumption (Martin, Earleywine et al. 1990).

12
In contrast, alcohol rubbed on rims of beverages to imitate alcoholic drinks other than beer has
been shown to dissipate more quickly (Martin, Earleywine et al. 1990).
In addition to having similar sensory stimuli to alcohol itself, nonalcoholic beverages have been
found to activate beliefs about alcohol, which can manipulate behaviour (Martin and Sayette
1993). For example, on a stop-signal choice reaction time task, social drinkers who consumed
alcohol or placebo alcohol showed greater disinhibition overall compared to subjects who did not
consume any beverage (Fillmore and Blackburn 2002). Together this research suggests that
nonalcoholic beverages can deliver both alcohol-related cues and influence related cognitive
processes.
1.4.2 Dependent Variables
1.4.2.1 Salience - Stroop Task
An ‘addiction’ Stroop paradigm will be used to operationalize the effects of stress on attentional
bias to motivationally-relevant stimuli. The critical experimental condition in this task is the
reaction time to name the colour of addiction-related words (e.g., whiskey) versus control (e.g.,
window) words (Stetter, Ackermann et al. 1995). An increased latency to colour-name drug cues
compared to neutral is referred to as interference. Addiction-related attentional interference
presumably indicates that subjects are focusing their attention away from the task relevant
dimension of the stimuli (i.e. colour) and towards a dimension that should be ignored (i.e.
addiction-relatedness) (Cox, Klinger et al. 2006). As a result of dwelling on the alcohol-related
concept of a stimulus, the reaction time to colour-name the word is increased. Thus, the
addiction Stroop is an index of the extent to which mechanisms modulating attentional bias are
being activated by such cues (Mogg and Bradley 2002).

13
The degree of Stroop interference to addiction words varies based on trait and state factors. For
example, alcohol dependent subjects exhibit significantly greater interference to alcohol colour
words than do healthy controls (Stetter, Ackermann et al. 1995). In drug dependent subjects,
self-reported craving following cue exposure also correlates positively with the degree of
interference effect to addiction words.
These results suggest that attentional bias towards drug-related stimuli can be experimentally
assessed in drug dependent populations using a modified addiction Stroop. Furthermore, they
suggest that the salience value of addiction-related concepts could provide a sensitive
corroborating index of an individual’s desire to use drugs or alcohol. This is important given
that drug dependent subjects may deny craving due to the influence of social desirability factors,
or may simply lack insight into their current motivational state. Because the Stroop effect is
involuntary, it lacks these problematic features of self-report.
1.4.2.2 Disinhibition - Stop Signal Task
A stop signal task will be used to assess the combined and independent effects of stress and
alcohol cues on inhibitory cognitive processes. Based on race model principles, the ability to
inhibit an action in this paradigm depends on the outcome of competitive activating and
inhibiting processes (Fillmore and Rush 2002). The time it takes to complete each competing
process determines the behavioural outcome (Fillmore and Rush 2002). Thus, only if the
inhibiting processes are completed first will the response be withheld (Fillmore and Rush 2002).
Specifically, the paradigm involves two concurrent tasks. Individuals are required to respond to
a go signal [make a speeded key press decision to neutral visual stimuli: X (press left key) or O
(press right key)]. Occasionally, during the course of their decision trials, subjects need to
inhibit their key press response when an unexpected stop-signal (tone) occurs. The response to

14
the go signal can be interpreted as a pre-potent response and the stop signal can be viewed as a
control signal that makes the pre-potent response inappropriate (Logan, Schachar et al. 1997).
As a result, inhibitory control depends on the latency of response to the go signal (i.e. go reaction
time) and the latency of the stop signal response (i.e. stop signal reaction time) (Logan, Schachar
et al. 1997).
Deficits in inhibitory control in individuals with behavioural or substance use disorders has been
extensively studied using the Stop Signal task. Undergraduate students with high impulsivity
were found to have similar go reaction times on this task as non-impulsive students (Logan,
Schachar et al. 1997). However, stop signal reaction times were significantly longer in the more
impulsive subjects (Logan, Schachar et al. 1997). Similarly, chronic cocaine users displayed a
significantly poorer ability to inhibit responses on stop signal trials and had longer stop signal
reaction times compared to healthy controls (Fillmore and Rush 2002). As with individuals with
high impulsivity, cocaine users did not differ from controls with respect to their go reaction
times.
These findings imply that populations with impulse control disorders, including drug
dependence, have difficulty in inhibiting pre-potent responses due to exceptionally slow
cognitive inhibitory processes. In this study, the disinhibiting effects of stress and exposure to
alcohol cues on overt behaviour will be examined in problem drinkers and healthy controls using
the validated Stop Signal Task (SST).
1.4.2.3 Novel Indices
Two additional novel paradigms will be used to further characterize the effects of stress and
alcohol cues on related cognitive processes. Firstly, the Lexical Stop Signal task (LSST) is a
hybrid task which combines test conditions from both the Stroop and the SST. Rather than
15
neutral stimuli only, as in the conventional SST, the LSST incorporates alcohol-related and
neutral words, as is the case in the Stroop task. However, like the conventional SST, it assesses
go reaction time and stop signal reaction time to both word groups. Subjects see a series of letter
strings presented individually on a computer screen and must decide as quickly and accurately as
possible if the string displayed is a real English (e.g., carrot) word (press right key) or nonsense
(e.g., fibbage) word (press left key). As in the conventional SST, a stop signal occurs on a
random 25% of trials for each type of letter string. With this design, the LSST is able to
independently evaluate attentional bias and inhibitory control to motivationally-relevant stimuli.
The rationale for this procedure stems from the BAS-BIS model of countervailing approach and
avoidance processes, and the idea that these processes may be imbalanced or biased towards
approach in addicted subjects. Preliminary unpublished data on the effects of actual alcohol in
this model have been collected for the LSST. This study will serve to further validate the task.
A second novel paradigm, the Shift task, will serve as a positive control procedure to evaluate
the effects on inhibitory control of addiction word stimuli other than alcohol. This task is a
variant of the go/no-go paradigm requiring a key press response to (Go) targets and no response
to (No-Go) distracters and was previously validated using alcohol stimuli (Noel, Van der Linden
et al. 2007). For this study, alcohol word cues were replaced with gambling word cues (e.g.,
wager).
Together, the battery of tasks will provide a comprehensive assessment of cognitive processes
related to attentional bias and inhibitory control. In addition, further validation of the model will
verify its utility for the study of relapse in humans. Standard self-report scales will also be used
to assess subjects’ desire for alcohol, desire to gamble and state anger level. These scales will
complement the cognitive procedures.

16
1.5 Experimental Questions In order to build on the initial evidence gathered for this model, the present study aims to answer
the following experimental questions:
A. What are the effects of stress exposure on the dependent variables employed in this
model?
B. What are the effects of alcohol cues on the dependent variables employed in this model?
C. Do the effects of stress and alcohol cues interact?
D. How do the effects of stress and alcohol cues manifest themselves in terms of their
influence on attentional bias and inhibitory control?
E. Do the effects of stress and alcohol cues differ based on problem drinker status?
1.6 Hypotheses (1) Both stress and alcohol cues will increase problem drinkers’ motivation for alcohol in this
model.
(2) If stress and alcohol cues interact, their combined effects on problem drinkers’ motivation for
alcohol will be greater than when only one manipulation is applied.
(3) If the influence of stress and alcohol cues differs due to alcohol-related pathology, problem
drinkers will show stronger effects, overall, than controls.
Effects of stress, cues, and drinker status will be examined using a between-within design, where
subjects receive each treatment (stress/cues) either in combination or separately on two separate
test sessions. The effects of stress and alcohol cues on attentional bias will be assessed in terms
of vocal colour-naming reaction times on the Stroop task. Psychomotor go and stop response
times on the conventional SST will assess the effects of the manipulations on inhibitory control.

17
The LSST will evaluate the effects of stress and alcohol cues on attentional bias and
psychomotor inhibitory control concurrently. Lastly, the Shift task will serve as a positive
control to index involuntary attention and disinhibition to non-alcohol related addictive stimuli.

18
2 Methods
2.1 Study Design The study used a single-blind, fully counterbalanced repeated measures design: 2 (Group:
Problem Drinker [PD], Control [C]) x 2 (Stress Sequence: Stress on Day 1, Stress on Day 2) x 2
(Drink Sequence: Beer on Day 1, Beer on Day 2) X 2 (Session). Effects of stress can vary
significantly as a function of the menstrual cycle (Kudielka and Kirschbaum 2005). To expedite
testing in this initial study, testing was restricted to men. Half of the subjects received Beer on
test session 1 and Soft Drink on test session 2 and the other half of the subjects received their
assigned beverage in the reverse order. Similarly, half of the subjects received the active stressor
on test session 1 and the control task on test session 2, while the other half received their stress
treatment in the reverse order. Table 1 outlines the fully crossed stress and drink sequence
design for the two groups. Each subject was randomly assigned to a sequence.*
Table 1 Stress-Drink sequences for problem drinkers and controls across test sessions
Condition Test Session 1 Test Session 2
1 stress + placebo beer no stress + soft drink
2 no stress + placebo beer stress + soft drink
3 stress + soft drink no stress + placebo beer
4 no stress + soft drink stress + placebo beer
* The overall study included an additional two groups (Problem Gamblers and Problem Gambler-Drinkers) that received the same drink and stress treatments as described here. However the results reported in this dissertation pertain to the problem drinker and control groups only.

19
2.2 Subjects Sixteen control subjects and twelve non-treatment seeking problem drinkers subjects were
recruited through advertisements (see Appendix A) in newspapers and ad postings on bulletin
boards within the Centre for Addiction and Mental Health (CAMH). Subjects were screened by
telephone interview to determine their study eligibility. Figure 1 show an overview of
recruitment for the sample. To participate, subjects needed to be male, between the ages of 19
and 65 years of age, have no concurrent physical or mental health illness and be drug and
medication free, with the exception of nicotine. Those who smoked over 20 cigarettes / day were
excluded to minimize the effects of nicotine withdrawal during testing. Since subjects would be
exposed to a stressful situation, as part of the noise task, high systolic blood pressure (over
140mmHg) was an exclusion criterion for this study. Individuals also needed to be fluent in
English and have normal vision, without colour-blindness, to ensure their ability to comprehend
and read stimuli on the experimental tasks. Subjects had to score > 12 on the Alcohol
Dependence Scale (ADS, Skinner and Allen 1982), corresponding to moderate alcohol
dependence, and consume between 20 to 70 alcoholic drinks / week to qualify for the Problem
Drinker group. To meet criteria for the Control group, subjects had to score < 9 on the ADS and
drink < 13 alcoholic drinks/week. To exclude for clinically relevant depression, subjects needed
to score < 11 on the Beck Depression Inventory-short form (BDF-sf, Beck and Beck 1972). In
addition, subjects needed to score < 2 on the South Oaks Gambling Screen (SOGS, Lesieur and
Blume 1987) to exclude for problem gambling. Once eligible, subjects were randomly assigned
to a test condition. Since sixteen controls and twelve problem drinkers completed the study,
each condition was made up of three problem drinkers and four controls. The study was carried
out in accordance with ethical standards of the Helsinki declaration (1975; updated 1989), and
approved by the CAMH Research Ethics Board. Study subjects provided written informed

20
Figure 1 Flowchart of the study recruitment of problem drinker and control subjects (between the period of February to December 2008). PD, problem drinkers; C, controls; SBP, systolic blood pressure; BAC, blood alcohol concentration; ADS, alcohol dependence scale; BDI, Beck depression inventory; SOGS, South Oaks gambling screen; Drinks/week, average standard alcoholic drinks per week.

21
consent at the start of the first test session and received $300 for their participation at the end of
the study.
2.3 Materials
2.3.1 Apparatus
Breathalyzer
A handheld J4X-ALERT (Alcohol Countermeasures Inc., Mississauga, ON, Canada)
breathalyzer measured blood alcohol concentrations (BAC) at the beginning of each test session
to verify alcohol abstinence before the test phase. On test days where subjects received Beer, a
reading was also taken at the end of the session to alert subjects of their complete sobriety at time
of dismissal.
Mock Breathalyzer
A mock breathalyzer, closely resembling the J4X-ALERT, was used to help persuade subjects to
believe they had consumed alcohol on test days where they received placebo beer. This device
was administered once after the second beer drink had been consumed and produced a false
reading of 41mg/dl units, which was clearly visible to the subject. This value has been
previously shown to be the highest credible reading for deceiving subjects with placebo
manipulations of this kind (Martin and Sayette 1993).
Beverages
Placebo Alcohol
In order to expose subjects to alcohol cues during testing, each subject consumed two 355ml
cups of chilled nonalcoholic beer (<0.05% alcohol; Labatt Nordic, Labatt Brewing Co., Toronto,
ON, Canada) on one of their two test sessions. On Beer test days, subjects were also instructed,

22
at the start of the test session, that they would receive the equivalent of 2 bottles of beer to ensure
that the expectation of receiving alcohol was present prior to all experimental tasks.
Soft Drink
On test sessions where subjects did not receive Beer, they were administered two 355ml cups of
chilled diet soft drink (Diet Fresca, Coca-Cola Ltd., Toronto, ON, Canada). This particular
brand was chosen because it is not usually mixed with alcohol and, thus, unlikely to serve as an
alcohol cue.
Blood Pressure Monitor
Blood pressure and heart rate were assessed, in the first half of subjects, using an automated
wrist cuff (HEM-601, Omron Inc., Vernon Hills, IL, USA). Due to technical difficulties with
this apparatus, it was replaced with a new monitor (Dinamap 100 Monitor with DURA-CUF, GE
Healthcare-Clinical Systems, Mississauga, ON, Canada), which was used to obtain
cardiovascular readings in the second half of subjects. Measurements were taken at scheduled
intervals (before and after key tasks) throughout both test sessions.
MicroExperimental Laboratories (MEL) Professional version 2.01 with intergrated microphone
The Stroop task was administered using a computer equipped with MEL software (v. 2.01;
Psychology Software Tools Inc., Pittsburgh, PA, USA) connected to a microphone. This system
was used to record subjects’ latencies in voice responses. A serial response box (Psychology
Software Tools Inc., Pittsburgh, PA, USA) was used to record the accuracy of vocal responses
during this task.

23
2.3.2 Questionnaires
State Questionnaires
All state questionnaires were administered 3 times over the course of each test session: at pre-test
baseline, immediately after the stressor and before drink 1, and after drink 2 and completion of
the Lexical Stop Signal task (see Table 2).
Visual Analog Scale
Modified visual analog scales (VAS, c.f. Annis and Graham 1988) measured subjects’ Desire for
Alcohol and Desire to Gamble. Ratings were scored using a numbered scale ranging from 0 (not
at all) to 100 (extremely), with 5-point gradations.
State Anger Scale
The State Anger Scale (SAS, Spielberger, Jacobs et al. 1983), composed of 15 items, required
subjects to rate the intensity of their anger at that very moment on a 4-point scale ranging from
“Not at all” to “Very much so”. Total scores are calculated by summing up all 15 items and
range between 15 to 60 points. The SAS measured the subjective frustrating effects of the
stressor.
Trait Questionnaires
All subjects completed a series of trait questionnaires to provide background characteristics on
their personality and alcohol or gambling severity. Trait scales were administered at the end of
the second test session to avoid influencing subjects’ moods and thoughts when they were
performing the computer tasks.
Drinking Motives Questionnaire
The Drinking Motives Questionnaire (DMQ, Cooper, Russell et al. 1992) is divided into 3
factors: enhancement, coping and social motives for drinking. This scale was used to measure

24
how often the subjects used alcohol for each of the different motives. It is composed of 15 items
scored on a 4-point Likert-type scale from “Never or almost never” to “Almost always”. The
total value for a subscale can range between 5 to 20 points.
Eysenck Personality Inventory
The Eysenck Personality Inventory (EPI, Eysenck and Eysenck 1963) was used to assess
subjects’ personality. It is composed 57 “yes” or “no” questions about individuals’ usual way of
acting or feeling and is divided into 3 dimensions, for which each is given a total score:
Extraversion (ranges from 0-24), Neuroticism (ranges from 0-24) and Impulsivity (ranges from
0-9). To detect dissimulation, the questionnaire also includes a Lie scale (ranges from 0-9).
Trait Anger Scale
Subjects’ typical anger levels were assessed using the Trait Anger Scale (TAS, Spielberger,
Jacobs et al. 1983). The 15 item questionnaire asks subjects to rate the frequency of certain
anger-related feelings on a 4-point scale ranging from “Almost never” to “Almost always”. It
has two subscales, anger and temperament, which can total between 4 to 16 points. The overall
score on the TAS is reached by summing all scale items together (range 15-60).
State-Trait Anxiety Inventory
The State-Trait Anxiety Inventory (STAI, Spielberger, Gorsuch et al. 1970) measured subjects’
subjective anxiety level. The state and trait portions of the scale ask subjects to rank how much
certain statements people use to describe themselves applies to them at the time, using a 4-point
scale from “not at all” to “very much so”. Each subscales’ total score can range between 20-80
points.

25
Other Questionnaires
Digit Span
A Digit Span task (Wechsler 2001) assessed subjects’ basic cognitive proficiency. The task was
divided into two parts, a digit-forward (short term memory) and a digit-backwards (working
memory) test, administered one after the other. For each test, the digits were given orally at a
rate of one per second by the examiner. In the forward test, subjects were required to repeat the
digits verbatim. In the backwards test, subjects had to repeat the digits in the reverse order to
what they heard. In each version of the task, the number of digits increased by one until the
subject failed to complete 2 trials of the same span length. Subjects scored 1 point for each
series of digits correctly repeated. The maximum score on the digit-forward and digit-backward
tests is 14 points for a total maximum score of 28 points. The Digit Span was administered
before the start of computer tasks on each test day.
Drink-Strength Rating Scale
On test sessions were subjects received Beer, the perceived intoxicating effects of the drinks
consumed were measured using a Drink-Strength Rating Scale (DSRS, Vogel-Sprott 1992). The
strength of the beverages were rated in terms of standard 5% alcoholic bottles of beer on a scale
of 0 to >8.5, with half point intervals. The scale was administered after all computer tasks were
completed. This questionnaire was employed to assess the credibility of the placebo alcohol
manipulation.
Timeline Follow-back
At the end of the second test session, subjects were asked to complete a history of their drinking
behaviour over the last 3 months. The Timeline Follow-Back (TLFB, Sobell and Sobell 1992)
involves recording each day’s total alcohol standard drink consumption, over the past 90 days,

26
using a calendar, beginning with the current day and working backwards. The total amount of
alcoholic drinks / month and drinks / week for each subject was tallied based on these data.
Beck Depression Inventory
The short-form version of the Beck Depression Inventory (BDI, Beck and Beck 1972) assessed
the level of subjects’ depression symptoms at the time of the telephone screening. Individuals
with a total score over 10 were excluded from participating in the study.
Alcohol Dependence Scale
The Alcohol Dependence Scale (ADS, Skinner and Allen 1982) assessed the problem drinking
status of all ad respondents. In order to participate in the study, Problem Drinker subjects had to
obtain a total score of > 12 on the ADS and Control subjects needed to score < 9.
South Oaks Gambling Screen
The South Oaks gambling screen (SOGS, Lesieur and Blume 1987) identified the problem
gambling status of ad respondents. To be eligible for the Problem Drinker and Control groups,
all subjects needed to score < 2 on the SOGS to rule out any gambling pathology.
2.3.3 Experimental (Computer-Based) Tasks
Modified Stroop Task
The modified Stroop task assessed the effects of the stress manipulation on the salience of
Motivationally-related versus Neutral word stimuli. Salience can be operationally defined as the
ability to divert attention and is measured by interference (increased latency to name the colour
of Motivationally-related vs. Neutral stimuli) on the modified Stroop.
The procedure for the task was identical to that of Zack et al. (2007). The task was administered
using MEL within MS-DOS. Subjects sat approximately 60 cm from the computer screen and

27
were instructed to name the colour of each word, rather than read the word itself, as quickly and
accurately as possible. A microphone connected to the computer and positioned approximately 3
cm from the subject’s mouth registered the vocal response time (RT) to each stimulus in
millisecond (ms). Using a serial response box also connected to the computer, the study
experimenter coded response accuracy (correct response, incorrect response or spoiled trial) to
every word trial. Subjects completed a practice version of the task, using only Neutral words, in
order to familiarize them with its requirements before the stress manipulation. The test version
was completed following the Noise task stressor and contained words from both motivationally
relevant and neutral control categories. The 8 word categories for the test version of the task
were: Physical Threat (e.g. paralyzed), Social Threat (e.g. ashamed), Depression (e.g. hopeless),
Positive (e.g. cheerful), Anger (e.g. violence), Alcohol (e.g. vodka), Gambling (e.g. wager), and
Neutral – music instruments (e.g. piano). Positive, Physical Threat and Social Threat items were
taken from Stewart et al. (1998). Anger items were taken from Schubert et al. (2004). Alcohol
and Neutral items were taken from Cox et al. (1999). Gambling items were taken from Zack and
Poulos (2004).
The practice and test version of the modified Stroop task began with 20 warm-up trials made up
of Neutral word stimuli only. The sequence of each trial was identical: the stimulus (1 cm in
height) appeared in 1 of 4 colours (red, yellow, blue or green) in the centre of the screen and
remained visible until a vocal response was made. Following the response, the experimenter
coded its accuracy and the screen remained blank for 1000 ms before another stimulus appeared
in the same location. There were 20 items per category, all distributed randomly over trials. The
duration of the test Stroop task was approximately 10 minutes, including a short rest period half
way through the task.

28
Shift Task
The Shift task was adapted from Noel et al. (2007). The task was run within Microsoft
Windows. It consisted of 10 blocks, including 2 practice blocks at the start of the task. Every
block was made up of words belonging to one of two categories: Gambling-related words (e.g.
jackpot) (G) or Neutral words denoting parts of a building (e.g. ceiling) (N). In each block,
either Neutral words or Gambling words were specified as targets, while the other category was
designated as distracters. There were 8 target words and 10 distracter words for each block.
Subjects were instructed to respond to target words by pressing the “/” key with the right index
finger as quickly as possible and to ignore the distracter words (i.e., make no key press). The
order of targets for the 10 blocks was presented as either NNGGNNGGNN or GGNNGGNNGG.
Individuals with odd subject numbers received the NNGGNNGGNN and GGNNGGNNGG
sequences on test days 1 and 2, respectively. Individuals with even subject numbers received
these two blocking sequences on days 2 and 1, respectively. In this arrangement, 4 test blocks
were non-shift blocks (e.g., NN or GG), where subjects had to continue to respond to stimuli in
the same way. The remaining 4 test blocks were shift blocks (e.g., NG or GN), where subjects
had to start responding to stimuli that had been distracters, and cease responding to stimuli that
had been targets.
The sequence of events for each trial was identical: the stimulus word appeared at the centre of
the screen for 750 ms (during which time the subject had to decide to press or not press the “/”
key) followed by an inter-stimulus interval of 1000 ms during which a fixation point (++++) was
presented in the same location. If a subject pressed the “/” key for a distracter word, a 500 ms /
450 Hertz (Hz) tone was played through the computer’s internal speaker and the screen appeared
blank. The 10 blocks were made up of 30 Gambling and 31 Neutral words. Gambling and
Neutral words were taken from Zack and Poulos (2004). Stimuli from each word category were

29
randomly selected for their designated blocks. The Shift task was administered immediately
after subjects consumed their first drink and lasted approximately 10 minutes.
The Shift task assessed effects of the placebo beer manipulation on response inhibition to
gambling versus neutral stimuli as measured by the number of commission (pressing a key for a
distracter word) errors for each shift and non-shift block.
Lexical Stop-Signal Task
The Lexical Stop-Signal task (LSST) provided an independent measure of salience (through go
reaction times) and disinhibition (through stop signal reaction times) to motivationally relevant
stimuli versus neutral stimuli, following exposure to the placebo beer and stress manipulations.
The task was adapted from Logan et al. (1997). It was run in MEL within MS-DOS. In this
task, subjects performed a series of trials in which they made a choice between pressing either of
two keys depending on the stimulus presented. They were instructed to decide if a stimulus that
appeared on the computer screen was a real English word (e.g. martini) or a nonsense word (e.g.
rablet) by pressing the “z” key for a non-sense letter string and the “/” key for a real English
word as quickly as possible. A random 50% of trials contained words, and the other 50%
contained non-words. Of the word trials, a random 50% were Alcohol-related and the other half
were Neutral. During a random 25% of trials for each of the stimulus categories, a tone (stop
signal) occurred briefly after the onset of the visual stimulus indicating to the subject to withhold
a key press for that trial. Over the course of the trials, the program modified the interval between
the onset of the visual cue and the tone to correspond to 50% successful inhibition. The mean
time required to pre-empt the key press while maintaining 50% successful inhibition denotes the
stop signal reaction time (SSRT).

30
The sequence of events for each trial was as follows: a 500 ms fixation point (++++) presented in
the centre of the screen, followed by a blank screen exposed for 1000 ms preceded the
presentation of the stimulus. Immediately afterwards, the letter string stimulus (go signal) was
presented in the centre of the screen for 1000 ms. The stop signal was a 100 ms / 1000 Hz tone
played through the internal speaker of the computer. The interval between the onset of the go
signal and stop signal (stop signal delay) varied throughout the task. It was initially set at 350
ms and adjusted automatically depending on a subject’s performance. The delay was increased
by 50 ms each time a subject successfully inhibited a key press following a stop signal (making it
more difficult to inhibit a response on the next stop signal trial). The delay was decreased by 50
ms if a subject failed to inhibit his response to a stop signal (making it easier to inhibit a response
on the next stop signal trial). This tracking procedure provides a mean stop signal inhibitory
success rate across trials of 50 %, which is subtracted from the mean go signal RT to yield a
single index of inhibitory control: SSRT. Shorter SSRT scores indicate greater inhibitory
control.
The 120 Alcohol word trials, 120 Neutral word trials and 240 nonsense letter string trials
were drawn from Zack et al. (1999). Items from each category were presented in random order
and divided into 8 test blocks with rest periods in between. Subjects completed 2 practice blocks
before the test trials. The task was administered immediately after subjects consumed their
second drink and lasted approximately 20 minutes.
Conventional Stop Signal Task
The conventional Stop Signal task (SST) procedure was identical to that of Logan et al. (1997).
The task was run in Quick Basic within MS-DOS. Similar to the LSST, subjects were asked to
make a rapid decision by pressing one of two keys depending on the stimulus that appeared on

31
the computer screen. In this case, subjects were instructed to press the “z” key with the left
index finger when the letter X appeared on the screen and “/” key with the right index finger
when the letter O appeared on the screen, as quickly as possible without making any mistakes.
In the SST, the letters X and O acted as the go signal rather than letter strings. Thus, the primary
distinction between the lexical and conventional versions of the SST was that, in the latter
version, all go stimuli were conceptually meaningless and motivationally neutral. Similarly to
the LSST, during a random 25% of trials, a tone (stop signal) occurred briefly after the onset of a
letter stimulus indicating to the subject to withhold making a response for that trial. The stop
signal delay interval was modified over the trials to correspond to 50% successful inhibition in
the exact manner as described for the LSST.
The sequence of events for each trial was identical to the LSST. The only variation was
that the stop signal delay was originally set at 250 ms rather than 350 ms to account for the faster
discrimination of X and O stimuli compared to lexical stimuli. The 256 test trials administered
were split into 3 blocks with 40 second rest periods in between. Subjects completed 2 practice
blocks before the test trials. Stop signal tones were divided evenly between X and O trials. The
task lasted approximately 10 minutes. The XO version of the SST was completed after the
neutral version of the Stroop task and before the stress administration on each test day. The
conventional SST, (with go stimuli A & B on day 1; or C & D on day 2) was also administered a
second time after the LSST to permit a pre-post test of the stress / drink manipulations on each
test day.
Stress Manipulation – Noise Task (Independent variable)
The stressor procedure used in this study conforms to a task previously employed to induce
stress in healthy control subjects by Richell et al. (2004). This task ran in Microsoft Windows on
32
a separate computer from all other computer tasks in an adjacent room. The task consists of
trains of white noise (15-20 kHz / 110dB), administered through headphones, for randomly
determined bursts of 2 to 20 seconds. Uncontrollable white noise at this decibel has previously
been shown to activate the Hypothalamic-Pituatary Axis in healthy volunteers (Breier, Albus et
al. 1987).
Before the task begins, subjects are instructed to find a way to stop a noise generated by the
computer by using the correct sequence and timing of mouse clicks on a circular target in the
centre of the computer screen. The task is separated into 2 noise conditions: controllable and
uncontrollable. In each trial under the controllable condition, the noise coming through the
headphones can be extinguished when subjects respond 4 times in rapid succession on a response
key. If successful in extinguishing the noise, the message “subject out” appeared at the centre of
the screen. In the uncontrollable condition, the noise cannot be extinguished by a subject,
irrespective of responses on the target. However, subjects were not made aware that the task was
insolvable. At the end of the each uncontrollable trial, the message “time out” appeared, which
subjects were informed to mean that they were unable to stop the noise and the computer
automatically timed out. Richell et al. (2004) have shown that it is the inability to control the
noise during the uncontrollable condition that precipitates feelings of stress and negative mood
states.
On the test session without stress exposure, subjects were given 2 blocks of the controllable
condition. Each controllable block was made up of 25 trials for a total duration of approximately
5 minutes. Controllable noise gives the subject a sense of self-efficacy, in that the extinction of
the noise indicates that the subject has successfully determined the response rule. It is this

33
dimension (i.e. controllability) that has proven to be critical in the emergence of stress, rather
than the exposure to the noise per se (Richell and Anderson 2004).
On the test session with stress exposure, subjects completed the first block of trials under the
controllable condition and the second block under the uncontrollable condition. The
uncontrollable block consisted of 15 trials and lasted approximately 10 minutes. The first block
was administered under controllable conditions to show subjects that the noise can be
successfully extinguished. This way, under the uncontrollable condition, the subject expected
that the noise was controllable and attempted to solve for the response strategy required to
extinguish it throughout the second block. The stress manipulation was administered
immediately before the test Stroop computer task.
2.4 Procedure The procedure for each test session was identical and is outlined in Table 2. To strengthen
subjects’ belief that they were going to consume alcohol on one of the two test sessions, subjects
were asked to fast for 2 hours prior to the start of each test session in order to ensure even drink
absorption. Subjects were also required to abstain from drinking any alcoholic beverages for 12
hours prior to start of both test sessions.
Eligible subjects reported to the laboratory at 11 am. After reading and signing the consent form
(see Appendix B), subjects received a baseline breathalyzer assessment to confirm alcohol
abstinence. Blood pressure and heart rate readings were also taken and the first package of state
questionnaires was filled out. After the baseline measures, subjects completed the Digit-Span
task and performed a neutral version of the Stroop task followed by the XO version of the SST.
This initial series of computer-based tasks was aimed towards familiarizing subjects with task
requirements before any manipulations were administered.
34
Immediately afterwards, subjects received their respective stress manipulation (Uncontrollable or
Controllable Noise) before completing the test Stroop task. A second set of blood pressure and
heart rate measures was then taken and the second package of state questionnaires was
completed. Subsequently, subjects received the first of their assigned beverage and were
instructed to consume the drink steadily over the next 5 minutes. After a short rest period and
another set of blood pressure and heart rate measures, subjects were administered the Shift task.
Subjects then consumed their second assigned drink over another 5 minute period. If subjects
had consumed Beer, they received a mock breathalyzer assessment following the forth blood
pressure and heart rate measurement.
Once the drink administration phase was complete, subjects were administered the LSST. After
taking another set of physiological readings, the last package of state questionnaire was
completed. The SST was then administered. If subjects had consumed Beer, they were asked to
fill out the DSRS, following the last computer task. On test session 2, subjects were asked to fill
out a TLFB of their drinking behaviour over the last 3 months. A sixth set of heart rate and
blood pressure measures was also taken.
Following assessment of the main dependent variables, subjects received lunch. During lunch,
on the second test session, subjects completed a set of trait questionnaires. Before departure, a
last set of blood pressure and heart rate measures was taken. On days that subjects received
Beer, a third breathalyzer reading was administered to alert subjects of their sobriety. At the end
of the last test session, subjects were debriefed, paid for their study participation and dismissed.

35
2.5 Data analysis Experimental effects were assessed with 2 Group (PD, C) x 2 Drink Sequence (BSEQ: [Beer
Day 1/Soft Drink Day 2] versus [Soft Drink Day 1/ Beer Day 2]) x 2 Stress Sequence (SSEQ:
[Uncontrollable Noise Day 1/Controllable Noise Day 2] versus [Controllable Day1/
Uncontrollable Noise Day 2]) x 2 (Sessions) repeated measures analyses of variance (ANOVAs).
Where appropriate, within subjects’ variables were included in the ANOVA (e.g. Word Type in
the Stroop task). A multivariate analysis of variance (MANOVA) assessed subject background
and trait characteristics. The Bonferroni procedure controlled for inflation of family-wise alpha
with multiple exploratory comparisons. For variables where baseline scores were available (e.g.
VAS), and groups differed significantly at baseline (e.g., Desire for Alcohol), analyses of
covariance (ANCOVAs) were conducted, using the baseline score as the covariate, to control for
intrinsic variations and isolate treatment effects (Wainer 1991). Simple effects analyses, using
the MS-error term from the corresponding variance analysis, decomposed significant interactions
(Winer 1971).
36
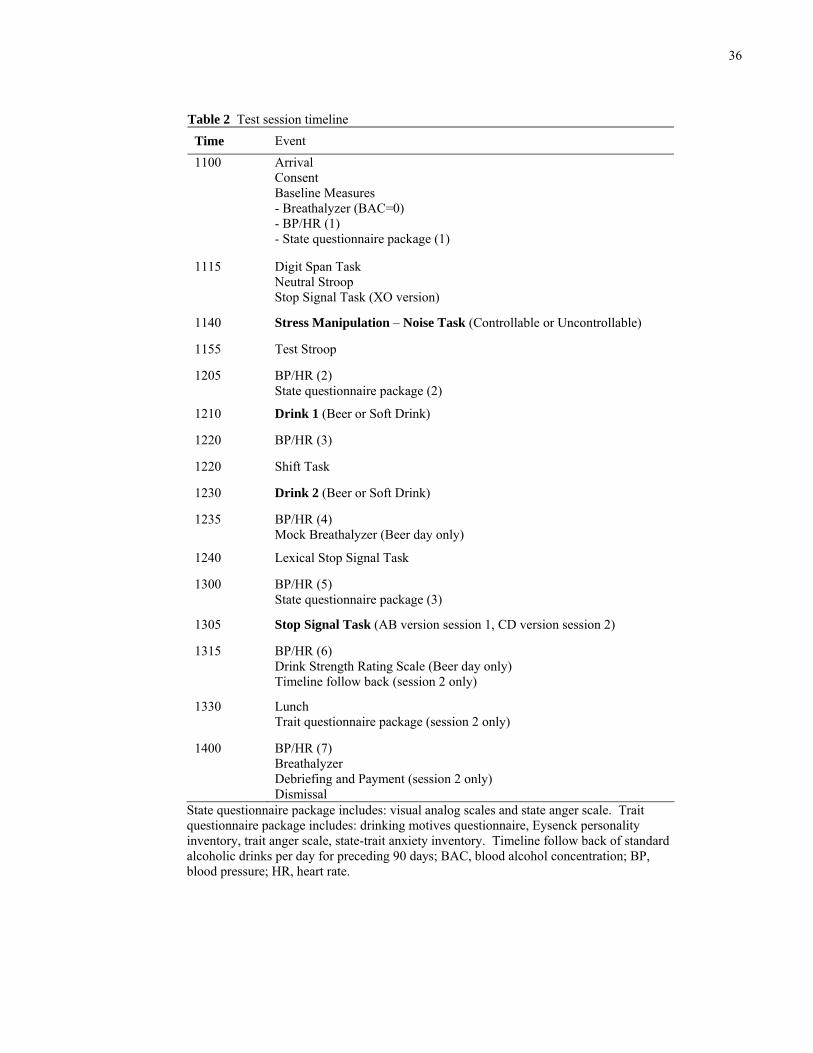
Table 2 Test session timeline Time Event 1100 Arrival
Consent Baseline Measures - Breathalyzer (BAC=0) - BP/HR (1) - State questionnaire package (1)
1115 Digit Span Task Neutral Stroop Stop Signal Task (XO version)
1140 Stress Manipulation – Noise Task (Controllable or Uncontrollable)
1155 Test Stroop
1205 BP/HR (2) State questionnaire package (2)
1210 Drink 1 (Beer or Soft Drink)
1220 BP/HR (3)
1220 Shift Task
1230 Drink 2 (Beer or Soft Drink)
1235 BP/HR (4) Mock Breathalyzer (Beer day only)
1240 Lexical Stop Signal Task
1300 BP/HR (5) State questionnaire package (3)
1305 Stop Signal Task (AB version session 1, CD version session 2)
1315 BP/HR (6) Drink Strength Rating Scale (Beer day only) Timeline follow back (session 2 only)
1330 Lunch Trait questionnaire package (session 2 only)
1400 BP/HR (7) Breathalyzer Debriefing and Payment (session 2 only) Dismissal
State questionnaire package includes: visual analog scales and state anger scale. Trait questionnaire package includes: drinking motives questionnaire, Eysenck personality inventory, trait anger scale, state-trait anxiety inventory. Timeline follow back of standard alcoholic drinks per day for preceding 90 days; BAC, blood alcohol concentration; BP, blood pressure; HR, heart rate.
37
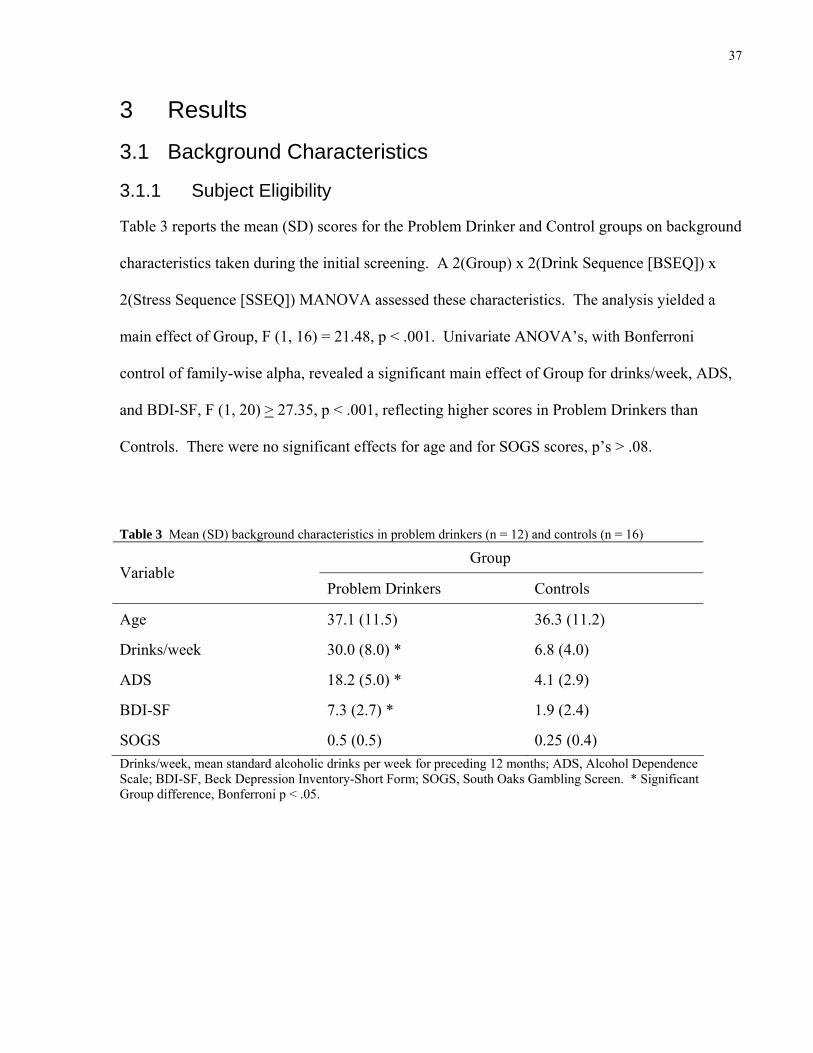
3 Results
3.1 Background Characteristics
3.1.1 Subject Eligibility
Table 3 reports the mean (SD) scores for the Problem Drinker and Control groups on background
characteristics taken during the initial screening. A 2(Group) x 2(Drink Sequence [BSEQ]) x
2(Stress Sequence [SSEQ]) MANOVA assessed these characteristics. The analysis yielded a
main effect of Group, F (1, 16) = 21.48, p < .001. Univariate ANOVA’s, with Bonferroni
control of family-wise alpha, revealed a significant main effect of Group for drinks/week, ADS,
and BDI-SF, F (1, 20) > 27.35, p < .001, reflecting higher scores in Problem Drinkers than
Controls. There were no significant effects for age and for SOGS scores, p’s > .08.
Table 3 Mean (SD) background characteristics in problem drinkers (n = 12) and controls (n = 16)
Group Variable
Problem Drinkers Controls
Age 37.1 (11.5) 36.3 (11.2)
Drinks/week 30.0 (8.0) * 6.8 (4.0)
ADS 18.2 (5.0) * 4.1 (2.9)
BDI-SF 7.3 (2.7) * 1.9 (2.4)
SOGS 0.5 (0.5) 0.25 (0.4) Drinks/week, mean standard alcoholic drinks per week for preceding 12 months; ADS, Alcohol Dependence Scale; BDI-SF, Beck Depression Inventory-Short Form; SOGS, South Oaks Gambling Screen. * Significant Group difference, Bonferroni p < .05.

38
3.1.2 Subject Characteristics and Procedural Checks
Table 4 shows mean (SD) scores for Problem Drinkers and Controls on the trait questionnaires.
A 2 x 2 x 2 MANOVA of these scores (with Bonferroni control), yielded a main effect of SSEQ
on the DMQ-coping subscale, F (1, 20) = 15.37, p = .01, reflecting a higher score in subjects
who received Stress on session 1 versus session 2. Despite random assignment, subjects
(regardless of group) who received stress on day 1 reported a stronger tendency to drink to cope
with negative emotional situations than those who received stress on day 2. Main effects of
Group (Problem Drinkers > Controls) were also found on the EPI-neuroticism scale, the STAI-
state, the STAI-trait, and the TLFB, F (1, 20) > 14.49, p < .01. There were no other significant
effects. Thus, Problem Drinkers reported greater neuroticism, anxiety at test, dispositional
anxiety, and alcohol drinks per week than Controls.
3.1.3 Digit Span Task
Table 5 reports mean (SD) Digit Span scores for the Problem Drinker and Control groups. A 2 x
2 x 2 ANOVA and a 2 x 2 x 2 x 2 (Session) ANOVA assessing total scores on the Digit Span
task revealed no significant effects, p > .07. A 2 x 2 x 2 x 2 x 2 (Subscale: forward recall,
backward recall) ANOVA revealed a main effect of subscale, F (1, 20) = 23.29, p < .001.
Subjects in both groups scored higher on the forward recall than the backward recall. The lack
of effects involving Group, indicates no overall difference in short-term or working memory as a
function of Problem Drinker status, and suggests good general cognitive function in the Problem
Drinker group. This helps to mitigate concerns about the impact of global impairment in the
cognitive tasks.

39
Table 4 Mean (SD) trait characteristics in problem drinkers (n = 12) and controls (n = 16)
Group Variable
Problem Drinkers Controls
DMQ – Enhancement 15.3 (3.2) 12.0 (3.0)
DMQ – Coping 10.9 (3.9) 9.0 (2.0)
DMQ – Social 15.8 (3.0) 13.8 (2.8)
EPI – Extraversion 13.1 (2.5) 12.2 (3.7)
EPI – Neuroticism 15.0 (3.6) * 8.1 (5.6)
EPI – Lie Scale 6.2 (2.4) 4.2 (2.0)
EPI – Impulsivity 3.9 (2.2) 4.0 (2.0)
TAS – Anger Temperament 6.7 (1.9) 5.6 (1.7)
TAS – Anger Reaction 9.7 (3.3) 7.5 (2.5)
TAS – Total 30.1 (8.4) 24.1 (5.4)
STAI – State 37.8 (10.1) * 26.8 (5.8)
STAI – Trait 44.9 (8.8) * 31.6 (7.6)
TLFB – Drinks/month 127.4 (85.6) * 29.4 (19.5) DMQ, Drinking Motives Questionnaire; EPI, Eysenck Personality Inventory; TAS, Trait Anger Scale; STAI, State-Trait Anxiety Inventory; TLFB, Timeline Follow-Back of number of standard alcoholic drinks per month for preceding 90 days. * Significant Group difference, Bonferroni p < .05.
Table 5 Mean (SD) scores for problem drinkers (n = 12) and controls (n = 16) on the Digit Span task Test Session 1 Test Session 2
Group Forward* Recall
Backward Recall Total
Forward* Recall
Backward Recall Total
Problem Drinkers 8.5 (2.0) 7.3 (2.1) 15.8 (3.4) 8.0 (2.0) 7.0 (1.8) 15 (2.9)
Controls 9.1 (1.9) 7.4 (2.2) 16.1 (4.0) 9.8 (1.6) 7.7 (2.1) 17.5 (3.4) * Significant effect of sub-scale (Forward > Backward), p < .05
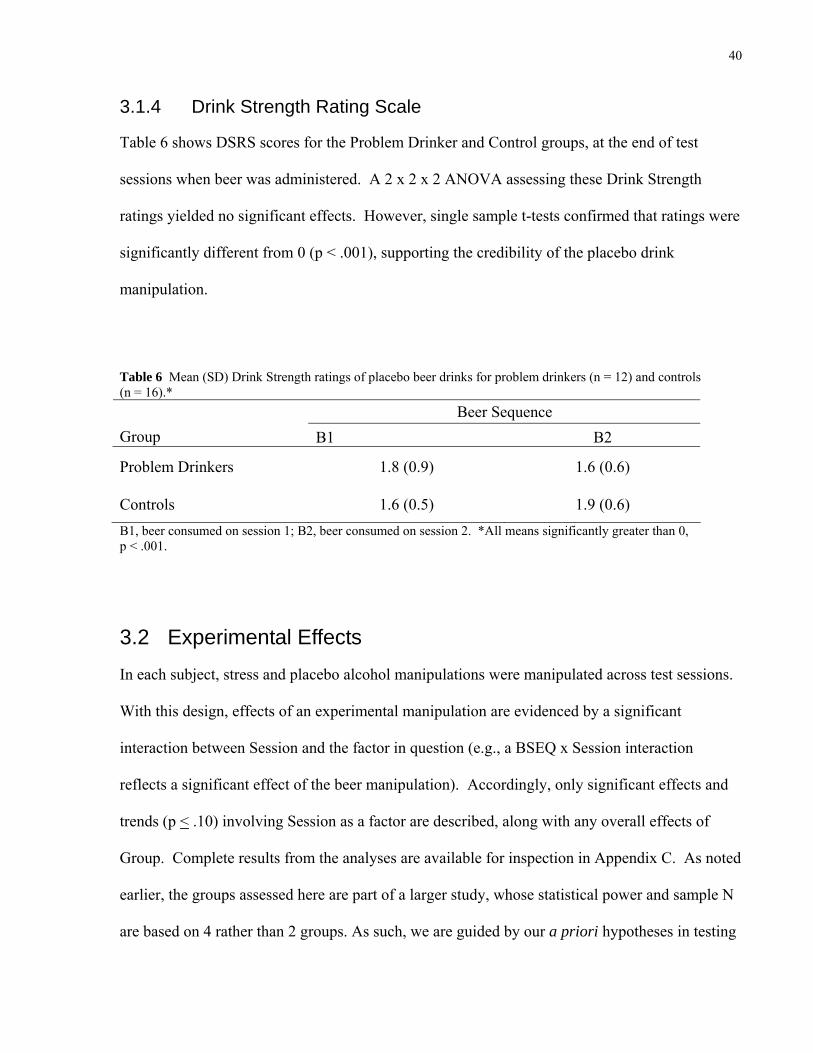
40
3.1.4 Drink Strength Rating Scale
Table 6 shows DSRS scores for the Problem Drinker and Control groups, at the end of test
sessions when beer was administered. A 2 x 2 x 2 ANOVA assessing these Drink Strength
ratings yielded no significant effects. However, single sample t-tests confirmed that ratings were
significantly different from 0 (p < .001), supporting the credibility of the placebo drink
manipulation.
Table 6 Mean (SD) Drink Strength ratings of placebo beer drinks for problem drinkers (n = 12) and controls (n = 16).*
Beer Sequence Group B1 B2
Problem Drinkers 1.8 (0.9) 1.6 (0.6)
Controls 1.6 (0.5) 1.9 (0.6) B1, beer consumed on session 1; B2, beer consumed on session 2. *All means significantly greater than 0, p < .001.
3.2 Experimental Effects In each subject, stress and placebo alcohol manipulations were manipulated across test sessions.
With this design, effects of an experimental manipulation are evidenced by a significant
interaction between Session and the factor in question (e.g., a BSEQ x Session interaction
reflects a significant effect of the beer manipulation). Accordingly, only significant effects and
trends (p < .10) involving Session as a factor are described, along with any overall effects of
Group. Complete results from the analyses are available for inspection in Appendix C. As noted
earlier, the groups assessed here are part of a larger study, whose statistical power and sample N
are based on 4 rather than 2 groups. As such, we are guided by our a priori hypotheses in testing

41
simple effects rather than by overall F statistics. As noted by Howell (1987), “In general, we
seldom look at simple effects unless there is a significant interaction. However, this practice
must be governed by common sense. It is not difficult to imagine data for which an analysis of
simple effects would be warranted even in the face of a non-significant interaction, or to imagine
studies in which the simple effects are the prime reason for conducting the experiment” (p. 376).
3.2.1 Self Report
3.2.1.1 Desire for Alcohol
Across conditions, Problem Drinkers’ mean (SD) pre-treatment baseline Desire for Alcohol, 16.9
(18.1), was higher than that of Controls, 13.6 (22.9). To control for this extra-experimental
variance and isolate the treatment effect, baseline Desire for Alcohol scores were entered as a co-
variate in a 2 x 2 x 2 x 2 (Session) x 2 (Time: post noise task, post drinks) analysis of covariance
(ANCOVA). The analysis yielded a significant Session x Group x BSEQ interaction, F (1, 18) =
5.54, p = .03. Inspection of mean (SD) Desire for Alcohol scores indicated that, in general,
Problem Drinkers had a higher overall Desire for Alcohol across test sessions, 23.32 (21.83),
than Controls, 13.46 (18.28). However, the interaction reflected a higher mean (SD) Desire for
Alcohol score in Controls, 29.40 (32.23) compared to Problem Drinkers, 22.50 (27.53) on
session 1 for subjects who consumed Beer on session 1. Thus, in subjects who received Beer on
the first test session, anticipation and receipt of Beer led to a greater increase in reported Desire
for Alcohol in Controls than Problem Drinkers, when baseline differences in Desire were
controlled by covariance.
Figure 2 (A, B) shows mean (SEM) Desire for Alcohol scores for the Problem Drinker and
Control groups, under the different test conditions. Simple effects analyses comparing post noise
task scores to post drinks scores found that Problem Drinker subjects who received Stress and
42
Beer on the same test session exhibited a significant decrease in Desire for Alcohol from post
Stress to post Beer, t (18) = 9.70, p < .001. In contrast, Problem Drinker subjects who received
Stress and Beer separately showed a significant increase in Desire for Alcohol from after the
noise task to after the drink administration, t (18) = 5.36, p < .001. Problem Drinker subjects
exposed to Stress on session 1 displayed no change in Desire across time points on that test
session, p > .10.
In Controls, subjects who received Stress and Beer together on day 1 had higher Desire for
Alcohol scores immediately after Stress than after the Beer on both test days, t (18) > 4.85, p <
.001. Control subjects who received Stress and Beer together on day 2 reported higher Desire
scores immediately after Stress than after drinking on test day 2 (beer day), t (18) = 2.46, p < .05,
but not day 1 (control soft drink day), p > .10. Control subjects who received Stress and Beer
separately had similar Desire for Alcohol scores across time points on each session, p > .10.
These results indicate that stress and alcohol cues interact differently in Problem Drinker
subjects than Controls. In Problem Drinkers, placebo beer reduced Desire for Alcohol following
stress, but increased Desire for Alcohol in the absence of stress. In contrast, in Controls, placebo
beer reduced Desire for Alcohol or had no effect, regardless of stress.
3.2.1.2 Desire to Gamble
To control for non-specific addictive motivation, M-VAS ratings of Desire to Gamble were taken
throughout the test sessions at the same times as Desire for Alcohol. Table 7 reports these M-
VAS ratings at baseline, post noise task and post drinks time points for the Problem Drinker and
Control groups. Baseline scores for both groups did not differ. Therefore, an ANOVA, rather
than ANCOVA, including 3 levels of time (i.e. baseline, post noise task and post drinks), was

43
Problem Drinkers
0
10
20
30
40
50
60
70
Stress Beer Stress + Beer Control Stress Beer Stress + Beer Control
Condition
Des
ire fo
r Alc
ohol
(0-1
00)
Session 1 Session 2
*
*
*
*
*
A
Controls
0
10
20
30
40
50
60
70
Stress Beer Stress + Beer Control Stress Beer Stress + Beer Control
Condition
Des
ire fo
r Alc
ohol
(0-1
00)
Session 1 Session 2
*
*
*
B
Figure 2 Mean (SEM) visual analog scale ratings of Desire for Alcohol (0-100; Not at all – Extreme) after the Noise task and after the drink administration across conditions. (A) Problem Drinker group (n = 12); (B) Control group (n = 16). ■ Post Noise task score (controllable or uncontrollable); □ Post drink score (placebo beer or soft drink). Horizontal lines indicate pre-stress baseline scores. *P<0.05, two-tailed for simple effect of post noise task vs. post drink for each session and condition.

44
performed. The analysis yielded no significant effects, p > .10. Thus, the effects of stress and
alcohol cues on addictive motivation were selective for alcohol.
Table 7 Mean (SD) Desire to Gamble scores for problem drinkers (PD; n = 12) and controls (C; n = 16) Test Session 1 Test Session 2
Group Condition Baseline Post- Noise
Post- Drinks Baseline
Post-Noise
Post-Drinks
PD B1S1 11.7 (20.2) 18.3 (31.8) 6.7 (11.5) 0 8.3 (14.4) 3.3 (5.8)
B1S2 8.3 (10.4) 5.0 (8.7) 5.0 (8.7) 6.7 (11.5) 5.0 (8.7) 5.0 (12.6)
B2S1 0 0 0 0 0 1.7 (2.9)
B2S2 10.0 (13.2) 11.7 (10.4) 8.3 (7.6) 11.7 (12.6) 16.7 (16.1) 11.7 (12.6) C B1S1 10.0 (12.2) 2.5 (5.0) 7.5 (15.0) 5.0 (10.0) 0 3.8 (7.5)
B1S2 12.5 (25.0) 13.8 (24.3) 16.3 (29.3) 12.5 (25.0) 12.5 (25.0) 12.5 (25.0)
B2S1 0 2.5 (5.0) 0 0 0 0
B2S2 1.3 (2.5) 0 0 2.5 (5.0) 0 0 B1S1, beer on session 1, stress on session 1; B1S2, beer on session 1 and stress on session 2; B2S1, beer on session 2 and stress on session 1; B2S2, beer on session 2 and stress on session 2
3.2.1.3 State Anger Scale
Table 8 reports state anger scores at baseline, post noise task and post drinks for the two groups.
Since both groups had similar scores at baseline, a 2 x 2 x 2 x 2 (Session) x 3 (Time) ANOVA
was performed. The analysis yielded a session x time x BSEQ interaction, F (2, 40) = 5.03, p =
.01. Inspection of table 8 indicates that the interaction reflected higher overall anger scores in
subjects who received beer on session 2 vs. session 1, and that this effect was more pronounced
before vs. after beer consumption.
A marginal session x time x group x SSEQ interaction also emerged, F (2, 40) = 3.07, p = .058.
Simple effects analyses compared baseline to post noise task scores and post noise task to post

45
drinks scores. In Problem Drinkers, anger scores generally increased from baseline to post noise
task in three of four active stress conditions, t (40) > 3 .14, p < .01. Also, in three of four active
stress conditions, anger levels decreased from post noise task to post drink, t (40) > 13.65, p <
.001.
In the active stress conditions, Controls’ anger scores did not increase, p > .10 , and in one case
decreased (soft drink + stress on day 2), t (40) = 2.36, p < .05, significantly from baseline to post
noise task. Similarly, anger scores did not increase, p > .10, and in one case decreased (beer +
stress day 1), t (40) = 5.50, p < .05, significantly from post noise task to post drink on beer days.
The analysis also revealed a trend towards a main effect of group, F (2, 20) = 3.85, p = .06. The
Problem Drinker group tended to have higher overall mean (SD) anger scores, 17.1 (2.8) than the
Control group, 15.8 (1.4).
In sum, stress reliably increased self-reported anger and placebo beer reliably decreased this
effect in Problem Drinkers, whereas Controls exhibited generally stable anger levels regardless
of stress or beer.
3.2.2 Cognitive Tasks
3.2.2.1 Modified Stroop Task
To rule out differences in overall mental fluency between groups on the Stroop task, a
preliminary 2 x 2 x 2 x 2 (Session) ANOVA of reaction times to neutral (Music) words was
conducted. It yielded no significant effects, p > 0.20. In line with standard procedure in reaction
time (RT) tasks (Stanovich and West 1983), individual trial scores of less than 200 ms (too fast
to reflect a decision) or more than 3 SD above the sample mean (too slow - indicating
momentary lapse of attention) were excluded from statistical analyses (5.83% of trials). The

46
Table 8 Mean (SD) State Anger scores for problem drinkers (PD; n = 12) and controls (C; n = 16) Test Session 1 Test Session 2
Group Condition Baseline Post- Noise
Post- Drinks Baseline
Post-Noise
Post-Drinks
PD B1S1 18.3 (5.8) 20.0 (7.8)* 15.0 (0)* 16.0 (1.7) 17.7 (4.6)* 15.0 (0)*
B1S2 15.7 (1.2) 15.7 (1.2) 15.7 (0.6) 15.0 (0) 18.3 (3.1)* 15.0 (0)*
B2S1 19.0 (3.6) 17.3 (1.5)* 16.0 (1.0) 16.3 (1.2) 19.3 (3.2)* 17.7 (2.1)
B2S2 16.3 (1.5) 17.3 (4.0) 17.7 (3.8) 15.7 (0.6) 22.7 (6.0)* 17.0 (2.6)* C B1S1 16.3 (1.9) 17.0 (4.0) 15.3 (0.5)* 15.0 (0) 15.3 (0.5) 15.0 (0)
B1S2 15.5 (1.0) 15.5 (1.0) 15.0 (0) 15.8 (1.5) 15.0 (0) 15.8 (1.5)
B2S1 17.0 (2.4) 16.5 (1.7) 16.5 (1.7) 16.3 (1.9) 15.3 (0.5)* 15.0 (0)
B2S2 16.0 (1.4) 15.8 (1.0) 16.8 (1.7) 15.5 (1.0) 15.3 (0.5) 15.5 (1.0) B1S1, beer on session 1 and stress on session 1; B1S2, beer on session 1 and stress on session 2; B2S1, beer on session 2 and stress on session 1; B2S2, beer on session 2 and stress on session 2. * Significant within-subject change (p < .05) from preceding time point in a given session.
number of excluded trials was modest and did not differ as a function of Group or Condition, p >
0.10. A 2 x 2 x 2 x 2 (Session) x 6 (Word type: Depression, Positive, Anger, Alcohol, Gambling,
Neutral-Music) ANOVA of RT scores yielded no significant effects involving Session, p > 0.10.
Figure 3 (A, B) shows mean (SEM) Stroop colour-naming RT for the critical (Alcohol) condition
compared to the Neutral control condition in Problem Drinkers and Controls. Recall that the
Stroop task occurred immediately after the Noise task and before drink administration. However,
all subjects were advised at the start of each session, whether they would be receiving beer or
soft drink that day. Thus, the beer manipulation in this case, reflected anticipation of receiving
alcohol, rather than effects of drinking a placebo.
Panel A shows that in the Problem Drinker group, anticipation of beer alone was never
associated with significant Stroop interference (Alcohol RT > Neutral RT) p > .10. However,
when subjects had undergone the active stressor, anticipation of beer coincided with significant

47
interference for Alcohol words t (100) > 7.31, p < .001. Moreover, the size of the interference
effect was comparable whether stress and beer were combined on session 1 or session 2, and was
more than twice as large as the interference effect for stress alone or the control treatment.
Figure 3B presents results for the Control group, and shows that Alcohol words led to significant
interference in several cases. However, in contrast to Problem Drinkers, experimental factors
exerted no consistent pattern of effects. Stress combined with beer led to interference on session
2, t (100) = 7.63, p < .001, but not on session 1, p > .50. Stress alone led to interference on
session 1, t (100) = 11.42, p < .001, but led to slower RT to Neutral than Alcohol words (i.e.,
reverse interference) on session 2, t (100) = 8.50, p < .001. Similarly, anticipation of beer alone
led to significant interference on session 1, t (100) = 5.17, p < .001, but significant reverse
interference on session 2, t (100) = 2.18, p < .05. Lastly, comparable interference emerged in the
absence of any active manipulation as in the presence of stress and/or beer, t (100) > 3.46, p <
.001.
Together, these results suggest that exposure to stress in combination with anticipation of alcohol
reliably increases the salience of alcohol stimuli in Problem Drinkers. In contrast, neither stress
nor anticipation of alcohol reliably affects salience of alcohol stimuli in Controls, who instead
appear to attend more to alcohol vs. neutral cues in the absence of any manipulation.
RT scores for the Gambling word (positive control) condition are shown in Table 9. In Problem
Drinkers, Gambling words were associated with slower RT than Neutral words (i.e.,
interference) in subjects who received Beer and Stress on day 2 and subjects who received Stress
on day 1 and Beer on day 2. However, for the remaining Problem Drinker groups, reaction time
for Gambling words were associated with equivalent RT or faster RT than Neutral words

48
(reverse interference). In each condition, the pattern seen on session 1 was also seen on session
2. In Control subjects, Gambling words were not associated with interference in any condition.
Thus, in contrast to Alcohol words whose salience varied as a function of stress and drink
condition in Problem Drinker subjects, the salience of Gambling words appeared to depend on
the particular subjects (a trait factor), rather than on the instigating factors. There was no
evidence of Gambling word salience in Controls.
Table 9 Mean (SD) colour-naming reaction time to Gambling and Neutral words on the modified Stroop task in problem drinkers (PD; n =12) and controls (C; n =16) Test Session 1 Test Session 2
Group Condition Neutral Alcohol
Neutral Alcohol PD B1S1 697.9 (3.0) 702.0 (30.3) 700.0 (14.3) 687.3 (5.6)
B1S2 626.8 (65.3) 622.5 (78.4) 660.5 (118.4) 650.6 (99.0)
B2S1 * 638.2 (37.8) 662.2 (58.2) 653.2 (43.4) 693.8 (59.6)
B2S2 * 738.6 (83.5) 770.9 (43.8) 756.6 (24.0) 776.9 (49.0) C B1S1 719.6 (110.7) 707.7 (113.4) 701.8 (133.8) 701.2 (119.1)
B1S2 683.1 (57.1) 703.4 (104.9) 706.5 (93.9) 649.2 (85.1)
B2S1 714.2 (91.2) 692.9 (91.4) 707.1 (82.6) 695.1 (94.5)
B2S2 717.6 (109.1) 709.6 (136.2) 678.9 (60.8) 687.7 (63.1) B1S1, beer on session 1 and stress on session 1; B1S2, beer on session 1 and stress on session 2; B2S1, beer on session 2 and stress on session 1; B2S2, beer on session 2 and stress on session 2. *P < .05, two-tailed for simple effect of Gambling vs. Neutral word response times on both test sessions.

49
Problem Drinkers
575.0
650.0
725.0
800.0
Stress Beer Stress + Beer Control Stress Beer Stress + Beer Control
Condition
Mea
n C
olou
r-na
min
g R
eact
ion
Tim
e (m
s)Session 1 Session 2
*
*
*
*
A
Controls
575.0
650.0
725.0
800.0
Stress Beer Stress + Beer Control Stress Beer Stress + Beer Control
Condition
Mea
n C
olou
r-na
min
g R
eact
ion
Tim
e (m
s)
Session 1 Session 2
**
*
*
*
*
*
B
Figure 3 Mean (SEM) colour-naming response time to Alcohol vs. Neutral words on a modified Stroop task across conditions. (A) Problem Drinkers (n = 12); (B) Controls (n = 16). ■ Alcohol words; □ Neutral words. *P < .05, two-tailed for simple effect of Alcohol vs. Neutral word response times for each test session in each condition.

50
3.2.2.2 Shift Task
Table 10 reports the number of commission errors for Neutral and Gambling words, on both shift
and non-shift trials, in the Problem Drinker and Control groups. A 2 x 2 x 2 x 2 (Session) x 2
(Trial Type: Non-Shift, Shift) x 2 (Word Type: Gambling, Neutral) ANOVA revealed a main
effect of group, F (1, 20) = 6.48, p = .02. Inspection of table 10 indicates that Problem Drinkers
made more commission errors overall than Controls. The analysis also revealed a Session x
Word Type interaction, F(1, 20) = 10.56, p = .004, reflecting more errors for Gambling words on
session 1 as opposed to Neutral words on session 2. There were no other significant effects. The
lack of effects involving the experimental manipulations suggests that effects of stress and
placebo beer on response to alcohol stimuli in the other tasks are not mediated by an inhibitory
deficit to addictive stimuli that are unrelated to alcohol.
3.2.2.3 Lexical Stop Signal Task
Subjects with SSRT greater than 400 ms (n = 4) were excluded from the statistical analysis.
Such long responses (twice the norm of ~200 ms) indicate that, contrary to instructions, these
individuals were deliberately waiting for the stop signal rather than responding as quickly as
possible to the go stimuli.
A 2 x 2 x 2 x 2 (Session) x 2 (Response Type: go RT, SSRT) x 2 (Word type: Alcohol, Neutral)
ANOVA was performed on RT scores. The analysis revealed a main effect of word type F (1,
16) = 5.31, p < .04. Simple effects analyses revealed that subjects had significantly slower mean
(SD) go RT to Alcohol, 746.20 (201.87), than Neutral words, 729.73 (204.19), across sessions, t
(16) = 7.64, p < .001.
Figure 4 shows scores for the critical variable, SSRT, by word type on both sessions. As was the
case for go RT, subjects had slower SSRT to Alcohol versus Neutral words on session 1, t (16) =

51
Table 10 Mean (SD) number of commission errors for Neutral (NEU) and Gambling (GAM) words, on shift and non-shift trials, during the Shift task in problem drinkers (PD; n = 12) and controls (C; n = 16) Test Session 1 Test Session 2 Non-shift Shift Non-shift Shift
Group Condition NEU GAM NEU GAM NEU GAM NEU GAM
PD * B1S1 1.0 (1.0)
1.7 (2.1)
2.3 (1.5)
4.3 (2.5) 1.3
(1.5) 1.7
(1.5) 2.0
(1.0) 2.3
(1.2)
B1S2 1.0 (1.0)
3.0 (1.7)
0.7 (1.2)
6.3 (3.2) 0.3
(0.6) 0.7
(0.6) 1.3
(0.6) 1.0
(1.0)
B2S1 1.0 (1.0)
1.7 (1.2)
2.0 (1.0)
4.0 (1.0) 1.7
(1.5) 2.0
(2.0) 3.0
(3.0) 1.3
(1.2)
B2S2 2.3 (3.2)
3.7 (4.0)
5.7 (8.1)
5.7 (3.2) 1.7
(2.9) 2.0
(2.6) 4.0
(3.6) 3.0
(1.7)
C B1S1 0.8 (1.0)
0.5 (0.6)
1.0 (2.0)
2.0 (2.2) 1.0
(1.4) 0.3
(0.5) 1.3
(1.0) 0.8
(0.5)
B1S2 1.5 (1.9)
1.3 (1.0)
1.0 (0.8)
2.8 (1.5) 1.0
(1.2) 1.0
(1.2) 1.0
(2.0) 1.3
(1.5)
B2S1 0.5 (1.0)
1.3 (0.5)
2.0 (2.2)
2.5 (3.1) 1.0
(2.0) 0.5
(0.6) 0.8
(1.0) 1.3
(1.0)
B2S2 0.8 (1.0)
1.5 (1.7)
1.5 (1.9)
1.8 (1.3) 0.5
(0.6) 0.5
(0.6) 1.5
(0.6) 1.0
(0.8) B1S1, beer on session 1 and stress on session 1; B1S2, beer on session 1 and stress on session 2; B2S1, beer on session 2 and stress on session 1; B2S2, beer on session 2 and stress on session 2. * Significant main effect of Group (PD > C), p < .05, overall.
5.72, p = .001, and session 2, t (16) = 4.78, p = .001. Together, these results suggest that Word
type has a consistent effect on go RT and SSRT, irrespective of test conditions, and that Alcohol
stimuli particularly impair both these measures.
The highest order hypothesized effect from the analysis (Session x Word Type x Group x SSEQ
x BSEQ interaction) also approached significance, F (1, 6) = 3.04, p = 0.10. Simple effects
analysis compared go RT to Alcohol and Neutral words for both groups under each test
condition. Problem Drinkers exhibited slower mean go RT (SD) to Alcohol words, 716.51
(97.93), vs. Neutral words, 686.75 (126.90), across conditions, t (16) > 2.14, p < .05. Controls
52
had consistently slower mean go RT to Alcohol words, 748.95 (178.90), versus Neutral words,
729.05 (188.25), only on test sessions where they consumed beer, t (16) > 6.58, p < .001. Thus,
Problem Drinkers are slower to make a lexical decision to Alcohol than Neutral words,
regardless of stress or consumption of placebo beer, whereas Controls primarily show this bias
when they have consumed placebo beer.
Figure 5 (A, B) shows SSRT to Alcohol and Neutral words in the two groups across conditions.
In the Problem Drinker Group, neither stress nor beer, alone or combined reliably affected
relative SSRT to Alcohol vs. Neutral words. The Control group displayed consistently longer
SSRT to Alcohol than Neutral words in the absence of either manipulation, t (16)> 16.19, p <
.001. This bias was also evident under stress alone, t (16) > 7.15, p < .001. Under beer alone, the
Control group displayed slower SSRT to Neutral than to Alcohol words, t (16) > 3.47, p < .01.
These findings suggest that, in subjects with no drinking pathology, stress appears to intensify
whereas placebo beer appears to reverse the overt inhibitory deficit to Alcohol stimuli.

53
210
230
250
270
1 2
Session
Mea
n St
op S
igna
l Rea
ctio
n Ti
me
(ms)
**
Figure 4 Mean (SEM) stop signal reaction time for Alcohol and Neutral words across sessions on the Lexical Stop Signal task (n = 28). ■ Alcohol words; □ Neutral words. *P < .001, two-tailed for simple effect of Word Type for each session.

54
Problem Drinkers
170.0
220.0
270.0
320.0
Stress Beer Stress + Beer Control Stress Beer Stress + Beer Control
Condition
Mea
n St
op S
igna
l Rea
ctio
n Ti
me
(ms)
Session 1 Session 2
*
**
*
*
**
A
Controls
170.0
220.0
270.0
320.0
Stress Beer Stress + Beer Control Stress Beer Stress + Beer Control
Condition
Mea
n St
op S
igna
l Rea
ctio
n Ti
me
(ms)
Session 1 Session 2
*
*
*
*
*
#
#
*
B
Figure 5 Mean (SEM) stop signal reaction time to Neutral and Alcohol words on the Lexical Decision task across conditions. (A) Problem Drinker group; (B) Control group. ■ Alcohol words; □ Neutral words. #P<0.01, two-tailed for simple effect of Word Type for each test session under each condition. *P<0.001, two-tailed for simple effect of Word Type for each test session under each condition.

55
3.2.2.4 Conventional Stop Signal Task
As with the LSST, subjects with SSRT greater than 400 ms were excluded from statistical
analysis (n = 3). A 2 x 2 x 2 x 2 (Session) x 2 (Time: pre drinks, post drinks) ANOVA was
performed for both go RT and SSRT scores. A Session x Time x BSEQ interaction approached
significance for go RT, F (1 20) = 3.65, p = .07. Simple effects analyses of go RT indicated that
on sessions where subjects consumed Beer, they had similar scores before and after the drink
administration, t (20) < 1.3, p > .20. Conversely, when subjects received Soft Drink, their go RT
was slower after drink consumption than before, t (20) > 3.0, p < .01. The pattern for go RT
scores implies that responses to the go signal (i.e. activation) slowed down after consuming a
Soft Drink. However, after Beer, this slowing was negated and there was a slight but reliable
enhancement in go RT.
For SSRT scores, a Session x Group x SSEQ interaction approached significance, F (1, 20) =
17.00, p = .07. Figure 6 (A, B) shows SSRT for session 1 and session 2 in both groups. The
Problem Drinker group displayed longer SSRT on days where they received stress, t (20) > 4.79,
p < .001. The Control group showed an improvement in SSRT over test sessions regardless of
the stress manipulation, t(20) > 2.66, p < .05. Inspection of the means confirmed that this was
not due to baseline factors (i.e., higher order interaction with Time p > .18).
Together, these results suggest that exposure to stress impairs general inhibitory control in
Problem Drinkers but not healthy Controls.
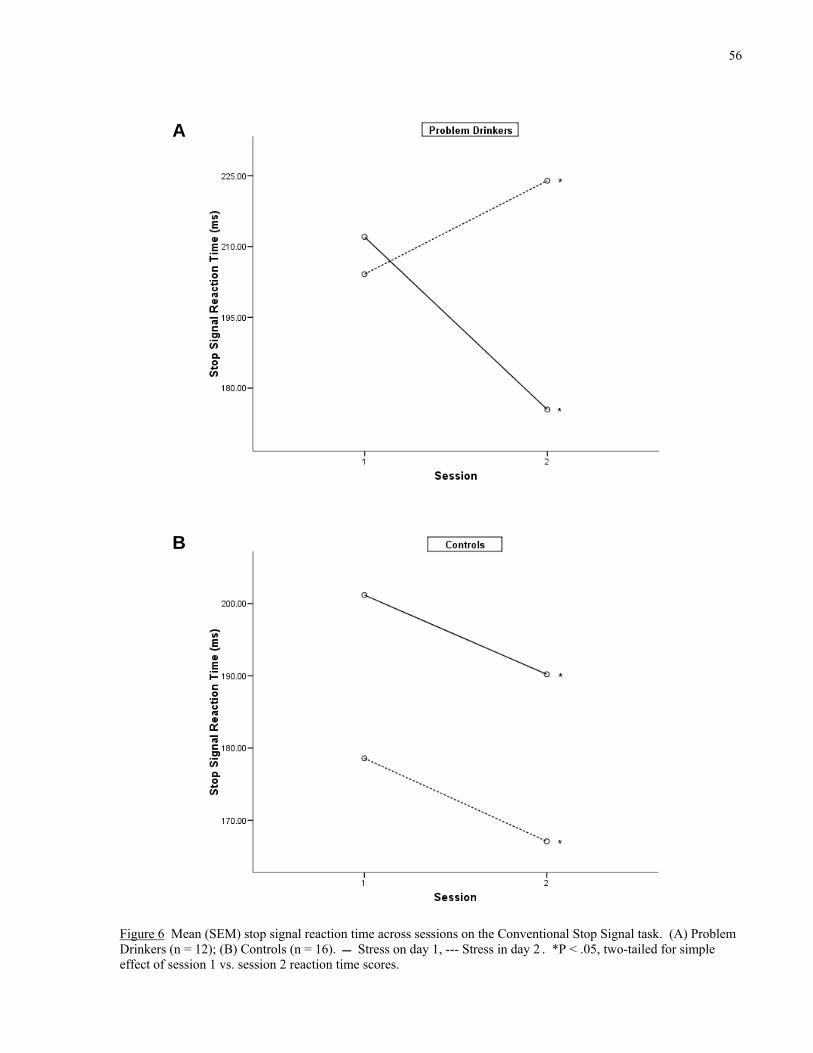
56
Figure 6 Mean (SEM) stop signal reaction time across sessions on the Conventional Stop Signal task. (A) Problem Drinkers (n = 12); (B) Controls (n = 16). Stress on day 1, --- Stress in day 2 . *P < .05, two-tailed for simple effect of session 1 vs. session 2 reaction time scores.
A
B

57
3.2.3 Physiological Measures
3.2.3.1 Systolic Blood Pressure
Overall baseline scores for both groups were similar. A 2 x 2 x 2 x 2 (Session) x 7 (Time:
baseline, post Stroop, post drink 1, post drink 2, post LSST, post SST, dismissal) ANOVA
yielded a significant session x BSEQ interaction, F (6, 120) = 12.09, p = .002, reflecting a higher
mean SBP (SD) on test sessions where subjects received Beer, 117.57 (11.47), versus Soft Drink,
113.45 (12.28).
A session x time x BSEQ interaction also approached significance, F (6, 120) = 1.75, p = .01.
Figure 7 (A, B) shows the mean SBP measurements across the different time points for each beer
sequence. In both graphs, on test days where subjects received Beer, SBP peaked after both
drinks had been consumed. Simple effects analysis revealed that SBP after the second drink
differed significantly from the previous as well as the subsequent SBP readings, t (120) > 3.41, p
< .001. These results suggest that the alcohol cue manipulation acted to temporarily increase
sympatho-adrenal activity in both Problem Drinkers and Controls.
3.2.3.2 Diastolic Blood Pressure
Table 11 reports DBP measures for both groups across test sessions. As with SBP readings, the
two groups shared similar baseline scores. A 2 x 2 x 2 (Session) x 7 (Time) ANOVA yielded no
significant effects related to session, p > .20. These results suggest that the stress and alcohol
cues had no influence on this physiological measure, which, in contrast to SBP, tends to vary
more with trait vs. state factors.

58
Placebo Beer Day 1
100
105
110
115
120
125
Baseline Post Stroop After Drink 1 After Drink 2 Post LSST Post SST Dismissal
Time
Syst
olic
Blo
od P
ress
ure
(mm
Hg)
*
A
Placebo Beer Day 2
105
110
115
120
125
130
Baseline Post Stroop After Drink 1 After Drink 2 Post LSST Post SST Dismissal
Time
Syst
olic
Blo
od P
ress
ure
(mm
Hg)
*
B
Figure 7 Mean systolic blood pressure across test sessions. (A) Subjects who received placebo beer on session 1 (n = 14); (B) Subjects who received placebo beer on session 2 (n = 14). ■ Session 1, ● Session 2. *P < .001, two-tailed for simple effect of systolic blood pressure scores after drink 2 vs. after drink 1 and post LSST. LSST, lexical stop signal task; SST, conventional stop signal task.

59
Table 11 Mean (SD) diastolic blood pressure in problem drinkers (n = 12) and controls (n=16), separated by test session and condition. Problem Drinkers Controls
Session Time B1S1 B1S2 B2S1 B2S2 B1S1 B1S2 B2S1 B2S2
1 Arrival 72.0 (10.6)
68.0 (6.9)
68.7 (8.1)
70.0 (3.6) 71.5
(6.1) 62.0 (7.5)
66.3 (5.3)
72.3 (10.6)
Post Stroop
65.0 (11.5)
65.0 (4.6)
72.0 (15.6)
71.0 (4.4) 65.8
(6.3) 59.5 (5.8)
68.8 (1.9)
72.0 (4.7)
After Drink 1
69.3 (12.1)
70.3 (13.3)
73.7 (14.4)
75.7 (5.7) 72.0
(6.3) 64.5 (9.5)
70.5 (1.7)
74.8 (9.0)
After Drink 2
71.0 (11.5)
75.7 (1.2)
78.3 (9.9)
78.3 (2.5) 70.8
(5.2) 72.3
(10.0) 76.0 (4.1)
76.3 (9.1)
Post LSST 67.0 (13.0)
69.0 (5.0)
73.0 (12.8)
75.7 (6.4) 67.8
(6.2) 67.0 (6.9)
73.0 (6.2)
70.8 (4.7)
Post SST 65.7 (10.2)
71.3 (5.9)
75.0 (13.5)
74.7 (1.5) 67.0
(4.8) 67.5 (7.0)
69.3 (5.1)
74.0 (7.7)
Dismissal 72.3 (9.2)
68.0 (6.6)
76.0 (16.8)
78.0 (6.1) 70.0
(1.6) 68.8 (6.0)
73.8 (5.1)
80.3 (8.3)
2 Arrival 71.3 (6.4)
64.0 (15.1)
74.0 (13.9)
73.0 (1.7) 68.3
(6.1) 63.3 (9.5)
67.8 (2.6)
69.8 (12.2)
Post Stroop
67.0 (7.0)
61.0 (12.0)
76.7 (11.2)
79.3 (7.8) 64.0
(8.0) 61.8 (6.4)
66.5 (1.9)
70.0 (9.3)
After Drink 1
70.3 (13.3)
67.3 (13.1)
74.7 (8.5)
82.0 (10.4) 69.3
(8.9) 67.0 (4.5)
72.0 (3.4)
70.0 (9.2)
After Drink 2
74.0 (8.0)
70.3 (11.1)
77.7 (12.7)
79.0 (7.0) 70.6
(8.5) 74.3
(15.5) 72.0 (1.4)
76.3 (7.5)
Post LSST 70.7
(3.5) 71.0
(11.4) 77.3
(11.7) 74.0 (3.6) 68.3
(9.5) 68.3
(10.7) 71.0 (4.8)
70.0 (8.8)
Post SST 67.3
(5.8) 68.0
(10.1) 76.0
(16.4) 74.3 (6.0) 69.0
(9.2) 68.0 (8.8)
72.8 (6.4)
71.5 (6.7)
Dismissal 68.0
(3.6) 65.0
(18.1) 75.0
(12.8) 71.7 (2.1) 70.0
(3.7) 69.3
(13.5) 76.0 (7.0)
69.3 (9.5)
B1S1, beer on session 1 and stress on session 1; B1S2, beer on session 1 and stress on session 2; B2S1, beer on session 2 and stress on session 1; B2S2, beer on session 2 and stress on session 2. LSST, lexical stop signal task; SST, conventional stop signal task
3.2.3.3 Heart Rate
Table 12 reports the heart rate measures for the Problem Drinker and Control groups across test
sessions. Since baseline scores did not differ, a 2 x 2 x 2 x 2 (Session) x 7 (Time) ANOVA was
conducted. The only significant effect was a session x time x group interaction, F (6, 120) =

60
2.81, p = .01, reflecting higher HR scores in Problem Drinkers than Controls across the test
sessions, except at arrival and after the Stroop task.
Table 12 Mean (SD) heart rate in problem drinkers (n = 12) and controls (n = 16), separated by test session and condition. Problem Drinkers Controls
Session Time B1S1 B1S2 B2S1 B2S2 B1S1 B1S2 B2S1 B2S2
1 Arrival 78.0 (8.0)
67.0 (13.7)
64.7 (4.0)
65.7 (18.2) 73.0
(10.2) 73.5
(16.8) 73.3 (5.0)
67.8 (20.8)
Post Stroop
69.0 (2.0)
63.0 (14.4)
59.7 (7.3)
57.3 (13.6) 63.0
(8.3) 65.8
(15.5) 70.8 (3.2)
62.8 (15.4)
After Drink 1
66.7 (1.2)
62.0 (14.8)
61.0 (5.3)
60.0 (15.9) 61.8
(10.6) 60.0
(13.6) 66.3 (6.6)
60.0 (12.1)
After Drink 2
66.3 (1.2)
61.7 (5.8)
61.3 (7.0)
60.3 (11.2) 58.8
(9.0) 60.0
(13.6) 69.8 (5.6)
52.5 (8.9)
Post LSST 69.0 (5.6)
61.7 (10.0)
65.0 (14.7)
57.0 (6.2) 56.0
(9.6) 60.8
(11.8) 66.3 (4.0)
58.5 (14.9)
Post SST 67.7 (3.8)
63.0 (10.4)
65.3 (15.3)
57.3 (9.3) 58.8
(4.9) 59.5
(12.8) 68.5 (1.7)
56.3 (15.8)
Dismissal 69.7 (5.0)
66.3 (7.2)
62.7 (5.0)
58.7 (6.5) 65.3
(9.0) 63.5
(16.0) 67.3 (7.2)
60.8 (10.5)
2 Arrival 82.3 (6.4)
78.3 (19.7)
80.0 (15.6)
71.3 (23.0) 78.3
(9.9) 84.3 (9.6)
72.8 (9.8)
73.0 (22.2)
Post Stroop
75.0 (5.2)
67.0 (15.4)
73.0 (13.9)
68.3 (12.3) 68.0
(10.4) 70.3 (9.2)
66.8 (8.4)
62.8 (15.0)
After Drink 1
71.0 (1.7)
61.3 (13.2)
70.7 (11.0)
68.7 (15.2) 68.3
(9.0) 66.0
(10.2) 65.5 (6.5)
61.3 (13.0)
After Drink 2
71.0 (2.6)
60.3 (9.0)
68.3 (4.9)
66.7 (18.0) 60.3
(6.9) 65.3
(11.2) 62.3 (9.5)
60.8 (15.4)
Post LSST 67.0
(2.0) 62.0
(13.5) 70.7
(10.4) 61.3
(13.8) 60.3 (3.9)
61.0 (12.6)
63.5 (12.0)
57.3 (14.1)
Post SST 68.0
(4.6) 59.7
(10.7) 66.7 (9.0)
67.7 (14.4) 58.3
(5.9) 62.8
(12.0) 63.5
(10.5) 64.8
(16.0)
Dismissal 74.3 (4.9)
74.3 (23.1)
82.7 (11.7)
78.0 (6.2) 68.0
(9.9) 67.5
(10.7) 67.0
(12.3) 64.3
(18.3) B1S1, beer on session 1 and stress on session 1; B1S2, beer on session 1 and stress on session 2; B2S1, beer on session 2 and stress on session 1; B2S2, beer on session 2 and stress on session 2. LSST, lexical stop signal task; SST, conventional stop signal task

61
4 Discussion The effects of stress and drug-related cues on cognitive processes related to relapse have largely
been studied independently. The potential interactive role of salience and disinhibition in
response to these instigating factors is also essentially unknown. This study aimed to evaluate
the interactive effects of stress and alcohol cues, in problem drinkers and controls, and the
respective roles of salience and disinhibition in mediating these effects.
It was hypothesized that the combined effects of stress and alcohol stimuli would have a greater
impact on motivation for alcohol, than either of these instigating factors alone. Furthermore, the
influence of stress and alcohol cues on cognitive processes assessed by the experimental tasks
would be greater in the problem drinker than control group. The findings provide general
support for these predictions as outlined below.
4.1 Self-Report Self report scales were used to assess the influence of alcohol stimuli and stress on subjective
motivation for alcohol and gambling as well as on state anger levels.
To begin with, placebo beer alone and in combination with stress affected subjects’ Desire for
Alcohol. By itself, the placebo beer manipulation increased motivation for alcohol in the
problem drinker group as hypothesized. In contrast, placebo beer neither increased nor
decreased Desire for Alcohol in a reliable manner in controls. These results are in agreement
with recent studies showing that alcohol cues increase craving in alcohol dependent individuals.
For example, exposure to alcohol cues using a guided imagery paradigm produced significant
increases in alcohol craving in a group of treatment-seeking alcohol dependent subjects (Reid,
Flammino et al. 2006). Similarly, in-treatment alcohol dependent subjects showed an increase in

62
desire to drink and alcohol-like high following an alcohol cue presentation which included
audio-visual (video), tactile, olfactory, and guided imagery components related to alcohol
beverages (Fox, Bergquist et al. 2007).
It is important to consider that the alcohol cue manipulation in this study is divided into two
parts: an anticipatory phase where subjects are told that they will be receiving alcohol during the
test session and a consummatory phase where subjects receive their placebo drinks. It is possible
that these separate elements of the manipulation differed with regards to their influence on
related cognitive processes and in comparison to actual alcohol. While the pre-drink effects
should be the same as with real alcohol, post-drink effects may be drug-like, drug-opposite or
neither of these.
Furthermore, the ability of placebo beer to increase Desire for Alcohol in problem drinker
subjects offers evidence for its efficacy as a manipulation. This is corroborated by drink strength
ratings taken at the end of test sessions where subjects consumed beer, which indicate that both
problem drinker and control groups were successfully deceived as having received actual
alcohol. Although deception was used to enhance the value of the alcohol cue manipulation,
subjects were fully debriefed, immediately following the completion of the test phase, and
informed that the beer drinks consumed were non-alcoholic. In line with previous research using
placebo alcohol, all subjects received a clear explanation of the scientific purpose behind this
deception and were carefully assured that their response to the deception procedure was
completely normal (Rohsenow and Marlatt 1981). Together, these results suggest that placebo
beer beverages are an effective manipulation to deliver alcohol cues in this experimental model
of relapse.

63
Contrary to alcohol stimuli (Beer), stress did not reliably increase Desire for Alcohol in problem
drinkers or controls. This is noteworthy given inconsistent reports of the effect of stress on
craving in the literature. Stress has been found to increase, decrease or have no influence on
alcohol craving and consumption depending on pre-stress alcohol intake levels, timing and type
of stressor (Fox, Bergquist et al. 2007). Thus, it may be that the uncontrollable noise
manipulation in this study may not have been sufficiently stressful or the right type of stress to
produce a change in subjective motivation for alcohol on its own.
However, the placebo beer was capable of reducing Desire for Alcohol following exposure to
stress in the problem drinker group. That is, although stress alone did not alter motivation for
alcohol, in problem drinkers, it interacted with cue exposure to induce a satiation-like effect, in
contrast to alcohol cues alone, which increased appetite for alcohol.
Alcohol dependent individuals have often cited drinking as a means to cope with stress (Li and
Sinha 2008). Furthermore, alcohol consumption has been positively associated with stress level
(Sinha 2001). Thus, it appears from our data that placebo beer, as with actual alcohol, is
sufficient to reduce negative reinforcement (i.e., relief) drinking motivation associated with
stress. This satiation-like effect was restricted to problem drinkers.
It is important to note that the decrease in Desire for Alcohol following exposure to stress and
consumption of placebo beer was greater than the increase in Desire following beer alone. This
finding, along with the directionally opposite effects of beer vs. stress + beer, suggests that
alcohol cues and stress interact and that their combined influence on (negative reinforcement)
motivation for alcohol is greater than their independent effects. Furthermore, since these results
were only present in the problem drinker group, the motivational impact of these relapse triggers
appears to vary as a function of drinking pathology.

64
Changes in state anger extend the findings for Desire for Alcohol. Changes in anger levels as a
function of stress and cue exposure were only evident in the problem drinker group. Alcohol
cues and stress had opposite effects on anger in these subjects. Consumption of placebo beer
decreased anger levels. Since problem drinkers have repeatedly reported drinking as a means to
cope with negative affect, a reduction in anger following placebo beer is in line with previous
findings on the effects of actual alcohol (Li and Sinha 2008). The ability of alcohol cues to
reduce feelings of anger is also in line with its ability to decrease Desire for Alcohol following
stress (as if alcohol were no longer “necessary”). These findings suggest that the belief that one
has consumed alcohol may produce an actual anti-stress effect in problem drinkers. Thus, the
anti-stress effects of drinking (at least after an acute dose) in problem drinker subjects may result
from the attribution of anti-stress properties to alcohol rather than, or in addition to, alcohol’s
pharmacological stress-dampening effects. Further studies will be required to confirm this
finding.
Stress on its own increased levels of anger in the problem drinker group. These results suggest
that the uncontrollable noise paradigm was successful at increasing negative affect in these
subjects. A parallel increase in anger was not seen in the controls. It is unclear whether the type
of stressor, or a group difference in stress sensitivity, account for these effects. Previous studies
using the noise paradigm have found increased hopelessness ratings but not anger in healthy
controls (Richell and Anderson 2004). Therefore, control subjects may require a more potent or
different stress manipulation to experience a subjective change in feelings of anger.
Unlike self-reported Desire for Alcohol and State Anger, stress and alcohol cues did not
influence Desire to Gamble in either group. This was expected given that scores on the South
Oaks Gambling Screen did not differ between the groups and were well below the cut-off for

65
problem gambling. These results support the selectivity of the effects of stress and alcohol cues
on subjective motivation for an individual’s preferred reinforcer, alcohol, rather than a more
general enhancement in motivation for addictive reinforcers.
4.2 Cognitive Tasks Both groups performed similarly on the Digit Span task. These results suggest that the effects of
the manipulations cannot be accounted for by differences in general cognitive function.
The modified Stroop task was the first experimental task administered to subjects during the test
session. It was completed immediately after the stress manipulation and before the placebo drink
administration. This task was used to assess incentive salience to addictive versus neutral stimuli
following exposure to a stressful event.
Attentional bias to alcohol stimuli was seen in both groups, but under different test conditions.
In the problem drinker group, attentional bias to alcohol versus neutral words was present with
exposure to stress in combination with the anticipation of alcohol. This effect was reliable across
sessions and was inconsistent in the control group. These results suggest that incentive salience
towards alcohol stimuli may only be evident when anticipating being able to drink alcohol as a
means to cope with a stressful event. Interestingly, Desire for Alcohol in problem drinkers was
also most impacted when consuming placebo beer following exposure to stress. Thus, the
findings from the Stroop task provide further evidence for an interactive role between alcohol
cues and stress, which appear to influence attention-related processes of relapse in problem
drinkers. Additionally, because effects on the Stroop occur involuntarily, they help to
corroborate the self-report effects, which are more susceptible to experimental demand.

66
The control group also showed attentional bias to alcohol versus neutral cues but only in the
absence of any manipulation. This is consistent with previous studies with social drinkers (Cox,
Klinger et al. 2006). The lack of interference in the presence of stress or anticipation of beer
suggests that relapse triggers are incompatible with or even inhibitory to attention to alcohol
stimuli in non-problem drinkers. Control subjects did show some experience with alcohol
(approximately 1 drink per day) and were aware that the study was related to drinking as they
were screened with respect to their alcohol consumption. These elements may help account for
the salience towards alcohol words on non-stress / non-cue days.
In the case of inhibitory control, exposure to stress, but not alcohol cues, resulted in inhibitory
control deficits on the SST. As hypothesized, these deficits were confined to the problem
drinker group. Deficiencies in inhibitory control have been well documented in problem
drinkers. Alcohol dependent individuals have previously been shown to exhibit poor
performance in a variety of pre-potent response inhibition tasks compared to healthy controls,
including the SST (Goudriaan, Oosterlaan et al. 2006; Noel, Van der Linden et al. 2007).
Interestingly, the inhibitory control deficits were intensified as a result of stress exposure only.
These results suggest that inhibitory cognitive processes in problem drinkers are particularly
vulnerable to the effects of stress and may play an important role in mediating stress-induced
relapse.
A novel experimental task, the LSST, was employed in this study to assess interactions between
incentive salience and inhibitory control to alcohol-related stimuli as measured by overt (rather
than covert) attentional responses. While problem drinkers did not show alcohol-related
inhibitory deficits on the LSST with exposure to the study manipulations, an overall main effect
of word type was observed for all subjects, irrespective of test conditions. This important

67
finding indicates that both inhibitory control (i.e. SSRT) and activation (i.e. go RT) processes
were preferentially impaired by Alcohol words in general. The finding that Go and Stop
responses were affected in the same direction illustrates the inter-relatedness of salience and
inhibitory control and helps to validate this novel experimental task. Furthermore, it argues
against an increased propensity to approach motivationally relevant stimuli (i.e., a biasing
effect). Instead, it suggests that the mental resources needed to activate or inhibit overt
responses were diverted by the salient stimuli.
The assertion that attention mediated the word-type specific deficits in activation and inhibition
on the LSST is consistent with other evidence showing the importance of attention in
withholding responses to a stop signal. For example, the amplitude of P300 waves, an evoked-
response potential, which arises when higher order cognitive processes related to selective
attention are engaged, is enhanced when a response to a stop-signal is successfully versus
unsuccessfully inhibited (Donchin and Coles 1988; De Jong, Coles et al. 1990). The current
results also extend findings from a recent study, which used an Alcohol Shift task (Noel, Van der
Linden et al. 2007). These researchers found that detoxified alcohol dependent subjects,
compared to controls, made significantly more commission errors on a modified Go/No-Go task
when eliciting stimuli were Alcohol-related vs. Neutral words. Increased salience (i.e. go RT)
and disinhibition (i.e. SSRT) to Alcohol words observed on the LSST offers further support for
the influence of alcohol cues on cognitive impulsivity in problem drinkers and social drinkers
alike. Together, the findings suggest that alcohol-drinking practices encompass stimulus-driven
automatic behaviours (Tiffany 1990; Noel, Van der Linden et al. 2007).
The effects of addictive stimuli, other than alcohol, on inhibitory control were assessed using a
Gambling Shift task. As in the Alcohol Shift task (Noel, Van der Linden et al. 2007), the
68
problem drinker group made significantly more commission errors overall compared to the
control group. However, inhibitory control did not vary as a function of gambling or neutral
stimuli. These results suggest that impairments to activation and inhibitory cognitive processes
are selective for personally relevant addictive stimuli rather than addictive stimuli in general.
Additionally, exposure to stress and alcohol cues did not impair performance on the Shift task.
This parallels the null effects of stress or placebo beer on responses to Gambling words in the
Stroop task. In that case, interference to Gambling words emerged in half of the problem drinker
subjects and none of the controls. The problem drinkers who showed Gambling word
interference did so on both test sessions, indicating a trait-like effect rather than a response to the
experimental manipulations. Thus, the effects of relapse triggering events in problem drinkers
appear to be specific to alcohol-related cognitive pathways.
4.3 Physiological Measures Changes in physiological function were only observed following alcohol cue exposure. Placebo
beer led to a temporary but significant increase in systolic blood pressure in both groups.
Conversely, acute alcohol intoxication is usually associated with a reduction in blood pressure
(Vengeliene, Bilbao et al. 2008). While heart rate did not vary in the current study, substantial
research documents increases in both systolic blood pressure and heart rate in the presence of
alcohol related cues in both dependent and non-dependent drinkers (Cox, Yeates et al. 1999;
Reid, Flammino et al. 2006; Fox, Bergquist et al. 2007). Results from this study and others on
alcohol cue exposure suggest that placebo beer may have a drug-opposite effect on physiological
reactivity.
Contrary to some previous studies (Fox, Bergquist et al. 2007), changes in physiological
responses as a function of stress were not observed. Collectively, these results suggest that

69
alcohol cue exposure has a greater impact than uncontrollable noise stress on cardiovascular
indices.
4.4 General Discussion The experimental manipulations in this study had dissociable effects on activation and inhibitory
processes in this model. Exposure to alcohol cues alone increased Desire for Alcohol in problem
drinkers, improved inhibitory control deficits to Alcohol stimuli in Controls, and increased
systolic blood pressure in both groups. Stress increased state anger levels and produced general
disinhibition in problem drinkers and disinhibition to Alcohol-related stimuli in controls.
In addition to their individual effects, stress and alcohol cues interacted to influence subjective
motivation for alcohol and incentive salience to alcohol stimuli in problem drinkers. While
placebo beer alone increased Desire for Alcohol, it decreased Desire following exposure to
stress. The anticipation of alcohol after a stressful experience induced an attentional bias to
Alcohol words on the Stroop task in problem drinkers, highlighting the association between
negative reinforcement (relief/coping) motives and incentive salience of alcohol cues in this
population.
The bi-directional effects of placebo beer in problem drinkers when stress was present versus
absent are potentially important to the understanding of the neurochemical systems involved in
relapse. Animal studies have shown that cue-mediated relapse can be blocked by opioid receptor
antagonists, whereas stress-induced relapse can be blocked by enhancing the serotonin system,
suggesting two distinct neural pathways to relapse (Le, Poulos et al. 1999). The findings from
the current study suggest that these neural systems may interact to reduce or enhance
vulnerability to relapse, depending on the combination of relapse triggers present in the
environment. Considering our data, this suggests that, on its own, placebo beer enhances opioid

70
transmission (increases positive reinforcement motivation), but when combined with stress
enhances serotonin transmission (reduces negative reinforcement motivation). Pre-treatment of
subjects in this paradigm with an opiate antagonist versus a serotonin agonist would enable a test
of these hypotheses.
The interaction observed between alcohol cues and stress is consistent with previous animal and
human studies. Drug seeking induced by drug-related cues following a period of extinction has
been shown to be enhanced by a brief exposure to foot-shock stress in rats (Liu and Weiss 2002).
In humans, several studies have shown that stress or negative affect, prior to or during testing,
can enhance cue-induced alcohol craving (Rubonis, Colby et al. 1994; Stasiewicz, Gulliver et al.
1997; Reid, Flammino et al. 2006). Differences in methodologies may help explain why
exposure to alcohol cues reduced alcohol craving following stress in the current model (i.e.,
consumption of a placebo rather than mere exposure to alcohol cues). Nevertheless, these
studies offer further evidence of the interactive effects between relapse instigators.
In addition to having more pronounced effects on cognitive function collectively, stress and
alcohol cues appear to have a greater overall influence on problem drinkers versus controls.
Repeated drug use is associated with multiple neuroadaptations in pathways that regulate
positive and negative reinforcement aspects (Koob and Le Moal 1997). These changes in brain
reward circuits are believed to result in a greater sensitivity to the reinforcing properties of drugs,
leading to compulsive drug use and increased susceptibility to relapse (Sinha 2001). Alcohol
cues’ strong influence on subjective desire to drink in problem drinkers but not controls could be
the result of similar changes in reward circuitry.
Chronic drug exposure is believed to be associated with increased corticotropin-releasing factor
(CRF) and noradrenergic activation (Stewart 2003). The co-release of CRF and catecholamine

71
in response to stress is known to increase dopaminergic neurotransmission in the mesolimbic
regions, a critical pathway for the reinforcing properties of abusive drugs (Sinha 2001). Thus,
stress may act to “prime” brain reward systems and enhance the reinforcing efficacy of drugs
(Piazza and Le Moal 1998).
In the present study, stress increased anger levels and incentive salience to Alcohol stimuli as
well as impaired general inhibitory control in problem drinker subjects. These findings suggest
that problem drinkers are more vulnerable to stress and that it can act to increase the incentive
value of alcohol in the problem drinker group. Results from the current study agree with Koob
and Le Moal’s proposed model of addiction, which postulates the development of hyper-
sensitivity to stress following chronic exposure to alcohol (Koob and Le Moal 1997).
4.5 Conclusion Overall, the experimental model employed in this study provided valuable insight into the
individual and combined influence of stress and alcohol cues on activation and inhibitory
processes. While stress appears to have a greater influence on inhibitory control and negative
affect, alcohol cues strongly impact subjective motivation for alcohol.
Most importantly, Stroop data illustrated the interactive effects between stress and alcohol cues.
The ability of stress to increase the incentive salience of this drug emphasizes the extent to which
problem drinkers rely on alcohol as a means to cope with negative affect. Additionally, LSST
data underscored the importance of the motivational ‘valence’ of target stimuli in measures of
inhibitory control and suggest a mediating role for attention in this process. Together, these
results suggest that activation and inhibition processes under the influence of alcohol cues and
stress interact in a manner that may predispose problem drinkers to alcohol seeking, particularly
for the purpose of negative reinforcement.

72
These findings have direct implications on the treatment of relapse prevention and imply that the
most successful strategies are likely to target both cognitive pathways. Therapies that can lessen
the incentive value of alcohol stimuli, enhance attentional control and improve inhibitory deficits
could greatly assist problem drinkers in maintaining abstinence.
4.6 Limitations The generalization of study findings is somewhat limited by the number of subjects. Future
studies will need to increase the size and diversity of the sample to include different subgroups of
problem drinkers with varying degree of dependence and to investigate gender differences.
In addition, exposure to stress and alcohol cues in the real world may differ (e.g., in sequence or
chronicity) from the manipulations used in this study. Therefore, their influence on cognitive
processes may be different from those observed in this experimental setting. The effect of other
relapse triggers (i.e. priming dose of actual alcohol, social pressure, etc.) may also produce
different results in this model.
Lastly, it is possible that some subjects’ preferred alcoholic drink was not beer, which may have
impacted the effectiveness of the alcohol cue manipulation. Subsequent studies should consider
using a non-alcoholic version of each subjects’ preferred alcoholic beverage in order to
maximize the influence of alcohol cues on the experimental outcome measures.
4.7 Future Direction Problem drinkers are likely to be exposed to stress, alcohol cues and other relapse instigators
simultaneously. Furthermore, study findings provide initial evidence of their interactive
influence on related cognitive systems. As a result, a model capable of investigating both the

73
independent and interactive effects of relapse triggers could yield valuable information for the
development of more effective therapies against relapse.
As a next step, current study findings need to be reproduced in larger sample sizes and in
different populations of drinkers to fully validate the model. Once validated, the model could be
used as an experimental paradigm to test the effectiveness of medications to deter relapse. Such
research could improve the understanding of the pharmacological action of these drugs and, by
association, the neurotransmitter systems involved in relapse. Ultimately, the experimental
model could be used to study the effects of relapse medications in other addicted and co-morbid
populations.
74
References Annis, H. M. and J. M. Graham (1988). Situational Confidence Questionnaire (SCQ 39),
Addiction Research Foundation: Toronto.
Arnsten, A. F. and P. S. Goldman-Rakic (1998). "Noise stress impairs prefrontal cortical cognitive function in monkeys: evidence for a hyperdopaminergic mechanism." Arch Gen Psychiatry 55(4): 362-8.
Baler, R. D. and N. D. Volkow (2006). "Drug addiction: the neurobiology of disrupted self-control." Trends Mol Med 12(12): 559-66.
Bechara, A. and H. Damasio (2002). "Decision-making and addiction (part I): impaired activation of somatic states in substance dependent individuals when pondering decisions with negative future consequences." Neuropsychologia 40(10): 1675-89.
Bechara, A., S. Dolan, et al. (2002). "Decision-making and addiction (part II): myopia for the future or hypersensitivity to reward?" Neuropsychologia 40(10): 1690-705.
Bechara, A., X. Noel, et al. (2006). Loss of Willpower: Abnormal neural mechanisms of impulse control and decision making in addiction. Handbook of Implicit Cognition and Addiction. R. W. Wiers and A. W. Stacy. Thousand Oaks, Sage: 215-227.
Beck, A. T. and R. W. Beck (1972). "Screening depressed patients in family practice. A rapid technic." Postgrad Med 52(6): 81-5.
Breier, A., M. Albus, et al. (1987). "Controllable and uncontrollable stress in humans: alterations in mood and neuroendocrine and psychophysiological function." Am J Psychiatry 144(11): 1419-25.
Ciccocioppo, R., R. Martin-Fardon, et al. (2002). "Effect of selective blockade of mu(1) or delta opioid receptors on reinstatement of alcohol-seeking behavior by drug-associated stimuli in rats." Neuropsychopharmacology 27(3): 391-9.
Cooper, M. L., M. Russell, et al. (1992). "Development and validation of a three-dimentional measure of drinking motives." Psychol Assess 64: 123-132.
Cox, M., E. Klinger, et al. (2006). Motivational basis of cognition determinants of addiction. Cognition and Addiction. M. Munafo and I. Albery. New York, Oxford Univerisity Press: 108-115.
Cox, W. M., L. M. Hogan, et al. (2002). "Alcohol attentional bias as a predictor of alcohol abusers' treatment outcome." Drug Alcohol Depend 68(3): 237-43.
Cox, W. M., G. N. Yeates, et al. (1999). "Effects of alcohol cues on cognitive processing in heavy and light drinkers." Drug Alcohol Depend 55(1-2): 85-9.

75
De Jong, R., M. G. H. Coles, et al. (1990). "In search of the point of no return: The control of response processes." Journal of Experimental Psychology: Human Perception and Performance 16: 164-182.
Donchin, E. and M. G. H. Coles (1988). "Is the P300 component a manifestation of cognitive updating?" The Behavioural and Brain Sciences 11: 357-427.
Eysenck, H. J. and S. B. G. Eysenck (1963). Eysenck Personality Inventory manual. San Diego, Education and Industrial Test Services.
Field, M. (2006). Attentional biases in drug abuse and addiction: cognition, mechanisms, causes, consequences and implications. Cognition and Addiction. M. Munafo and I. Albery. New York, Oxford University Press: 73-99.
Fillmore, M. T. and J. Blackburn (2002). "Compensating for alcohol-induced impairment: alcohol expectancies and behavioral disinhibition." J Stud Alcohol 63(2): 237-46.
Fillmore, M. T. and C. R. Rush (2002). "Impaired inhibitory control of behavior in chronic cocaine users." Drug Alcohol Depend 66(3): 265-73.
Fox, H. C., K. L. Bergquist, et al. (2007). "Stress-induced and alcohol cue-induced craving in recently abstinent alcohol-dependent individuals." Alcohol Clin Exp Res 31(3): 395-403.
Franken, I. H., P. Muris, et al. (2006). "Gray's model of personality and addiction." Addict Behav 31(3): 399-403.
Goldstein, R. Z. and N. D. Volkow (2002). "Drug addiction and its underlying neurobiological basis: neuroimaging evidence for the involvement of the frontal cortex." Am J Psychiatry 159(10): 1642-52.
Goldstein, R. Z., N. D. Volkow, et al. (2001). "Addiction changes orbitofrontal gyrus function: involvement in response inhibition." Neuroreport 12(11): 2595-9.
Goudriaan, A. E., J. Oosterlaan, et al. (2006). "Neurocognitive functions in pathological gambling: a comparison with alcohol dependence, Tourette syndrome and normal controls." Addiction 101(4): 534-47.
Gray, J. A. (1991). Neural Systems, Emotion and Prsonality Neurobiology of Learning, Emotion and Affect. J. Madden. New York, Raven Press: 281-294.
Heinz, A., M. Reimold, et al. (2005). "Correlation of stable elevations in striatal mu-opioid receptor availability in detoxified alcoholic patients with alcohol craving: a positron emission tomography study using carbon 11-labeled carfentanil." Arch Gen Psychiatry 62(1): 57-64.
Herz, A. (1997). "Endogenous opioid systems and alcohol addiction." Psychopharmacology (Berl) 129(2): 99-111.
Howell, D. C. (1987). Statistical Methods for Psychology (2nd Ed.). Boston, Duxbury.

76
Jentsch, J. D. and J. R. Taylor (1999). "Impulsivity resulting from frontostriatal dysfunction in drug abuse: implications for the control of behavior by reward-related stimuli." Psychopharmacology (Berl) 146(4): 373-90.
Kalivas, P. W. and N. D. Volkow (2005). "The neural basis of addiction: a pathology of motivation and choice." Am J Psychiatry 162(8): 1403-13.
Katner, S. N., J. G. Magalong, et al. (1999). "Reinstatement of alcohol-seeking behavior by drug-associated discriminative stimuli after prolonged extinction in the rat." Neuropsychopharmacology 20(5): 471-9.
Kiefer, F. and K. Mann (2005). "New achievements and pharmacotherapeutic approaches in the treatment of alcohol dependence." Eur J Pharmacol 526(1-3): 163-71.
Koob, G. F. and M. Le Moal (1997). "Drug abuse: hedonic homeostatic dysregulation." Science 278(5335): 52-8.
Kudielka, B. M. and C. Kirschbaum (2005). "Sex differences in HPA axis responses to stress: a review." Biol Psychol 69(1): 113-32.
Le, A. D., D. Funk, et al. (2006). "Effects of dexfenfluramine and 5-HT3 receptor antagonists on stress-induced reinstatement of alcohol seeking in rats." Psychopharmacology (Berl) 186(1): 82-92.
Le, A. D., D. Funk, et al. (2008). "Intra-median raphe nucleus (MRN) infusions of muscimol, a GABA-A receptor agonist, reinstate alcohol seeking in rats: role of impulsivity and reward." Psychopharmacology (Berl) 195(4): 605-15.
Le, A. D., S. Harding, et al. (2002). "The role of corticotropin-releasing factor in the median raphe nucleus in relapse to alcohol." J Neurosci 22(18): 7844-9.
Le, A. D., C. X. Poulos, et al. (1999). "Effects of naltrexone and fluoxetine on alcohol self-administration and reinstatement of alcohol seeking induced by priming injections of alcohol and exposure to stress." Neuropsychopharmacology 21(3): 435-44.
Le, A. D., B. Quan, et al. (1998). "Reinstatement of alcohol-seeking by priming injections of alcohol and exposure to stress in rats." Psychopharmacology (Berl) 135(2): 169-74.
Lesieur, H. R. and S. B. Blume (1987). "The South Oaks Gambling Screen (SOGS): a new instrument for the identification of pathological gamblers." Am J Psychiatry 144(9): 1184-8.
Li, C. S. and R. Sinha (2008). "Inhibitory control and emotional stress regulation: neuroimaging evidence for frontal-limbic dysfunction in psycho-stimulant addiction." Neurosci Biobehav Rev 32(3): 581-97.
Liu, X. and F. Weiss (2002). "Reversal of ethanol-seeking behavior by D1 and D2 antagonists in an animal model of relapse: differences in antagonist potency in previously ethanol-dependent versus nondependent rats." J Pharmacol Exp Ther 300(3): 882-9.

77
Logan, G. D., R. J. Schachar, et al. (1997). "Impulsivity and Inhibitory Control." Psychological Science 8(1): 60-64.
Marczinski, C. A. and M. T. Fillmore (2005). "Compensating for alcohol-induced impairment of control: effects on inhibition and activation of behavior." Psychopharmacology (Berl) 181(2): 337-46.
Martin, C. S., M. Earleywine, et al. (1990). "Some boundary conditions for the effective use of alcohol placebos." Journal of Studies on Alcohol 51(6): 500-505.
Martin, C. S. and M. A. Sayette (1993). "Experimental design in alcohol administration research: limitations and alternatives in the manipulation of dosage-set." J Stud Alcohol 54(6): 750-61.
McCusker, C. (2006). Towards understanding loss of control: an automatic network theory of addictive behaviours. Cognition and Addiction. M. Munafo and I. Albery. New York, Oxford University Press: 117-145.
McKay, J. R., T. R. Franklin, et al. (2006). Conceptual, methodological, and analytical issues in the study of relapse. Clin Psychol Rev. 26: 109-27.
Mogg, K. and B. P. Bradley (2002). "Selective processing of smoking-related cues in smokers: manipulation of deprivation level and comparison of three measures of processing bias." J Psychopharmacol 16(4): 385-92.
Noel, X., M. Van der Linden, et al. (2007). "Alcohol cues increase cognitive impulsivity in individuals with alcoholism." Psychopharmacology (Berl) 192(2): 291-8.
Piazza, P. V. and M. Le Moal (1998). "The role of stress in drug self-administration." Trends Pharmacol Sci 19(2): 67-74.
Posner, M. I. and S. E. Petersen (1990). "The attention system of the human brain." Annu Rev Neurosci 13: 25-42.
Poulos, C. X., J. L. Parker, et al. (1996). "Dexfenfluramine and 8-OH-DPAT modulate impulsivity in a delay-of-reward paradigm: implications for a correspondence with alcohol consumption." Behav Pharmacol 7(4): 395-399.
Reid, M. S., F. Flammino, et al. (2006). "Physiological and subjective responding to alcohol cue exposure in alcoholics and control subjects: evidence for appetitive responding." J Neural Transm 113(10): 1519-35.
Richell, R. A. and M. Anderson (2004). "Reproducibility of negative mood induction: a self-referent plus musical mood induction procedure and a controllable/uncontrollable stress paradigm." J Psychopharmacol 18(1): 94-101.
Robbins, T. W. and B. J. Everitt (2002). "Limbic-striatal memory systems and drug addiction." Neurobiol Learn Mem 78(3): 625-36.

78
Rohsenow, D. J. and G. A. Marlatt (1981). "The balanced placebo design: methodological considerations." Addict Behav 6(2): 107-22.
Rubonis, A. V., S. M. Colby, et al. (1994). "Alcohol cue reactivity and mood induction in male and female alcoholics." J Stud Alcohol 55(4): 487-94.
Schubert, T. W. (2004). "The power in your hand: gender differences in bodly feedback from making a fist." Personality and Social Psychology Bulletin 30: 759-769.
Self, D. W. and E. J. Nestler (1998). "Relapse to drug-seeking: neural and molecular mechanisms." Drug Alcohol Depend 51(1-2): 49-60.
Shaham, Y., U. Shalev, et al. (2003). "The reinstatement model of drug relapse: history, methodology and major findings." Psychopharmacology (Berl) 168(1-2): 3-20.
Sinha, R. (2001). "How does stress increase risk of drug abuse and relapse?" Psychopharmacology (Berl) 158(4): 343-59.
Skinner, H. A. and B. A. Allen (1982). "Alcohol dependence syndrome: measurement and validation." J Abnorm Psychol 91(3): 199-209.
Sobell, L. C. and M. B. Sobell (1992). Timeline Followback: a technique for assessing self-reported alcohol consumption. Measuring Alcohol Consumption, Psychosocial and Biological Methods. R. Z. Litten and J. Allen. Totowa, Humana: 41-72.
Spielberger, C. D., R. L. Gorsuch, et al. (1970). Manual for the State-Trait Anxiety Inventory. Palo Alto, Consulting Psychological Press.
Spielberger, C. D., G. Jacobs, et al. (1983). Assessment of anger: The State-Trait Anger Scale. Advances in personality assessment. J. N. Butcher and C. D. Spielberger. Hillsdale, Erlbaum. 2: 159-187.
Stanovich, K. E. and R. F. West (1983). "On priming by a sentence context." J Exp Psychol Gen 112(1): 1-36.
Stasiewicz, P. R., S. B. Gulliver, et al. (1997). "Exposure to negative emotional cues and alcohol cue reactivity with alcoholics: a preliminary investigation." Behav Res Ther 35(12): 1143-9.
Stetter, F., K. Ackermann, et al. (1995). "Effects of disease-related cues in alcoholic inpatients: results of a controlled "Alcohol Stroop" study." Alcohol Clin Exp Res 19(3): 593-9.
Stetter, F., K. Ackermann, et al. (1995). "Effects of disease-related cues in alcoholic inpatients: results of a controlled "Alcohol Stroop" study." Alcoholism: Clinical and Experimental Research 19(3): 593-599.
Stewart, J. (2003). "Stress and relapse to drug seeking: studies in laboratory animals shed light on mechanisms and sources of long-term vulnerability." Am J Addict 12(1): 1-17.

79
Stewart, S. H., M. J. Conrod, et al. (1998). "Selective processing biases in anxiety-sensitive men and women." Cognition and Emotion 12: 105-134.
Tiffany, S. T. (1990). "A cognitive model of drug urges and drug-use behavior: role of automatic and nonautomatic processes." Psychol Rev 97(2): 147-68.
Vengeliene, V., A. Bilbao, et al. (2008). "Neuropharmacology of alcohol addiction." Br J Pharmacol 154(2): 299-315.
Vogel-Sprott, M. (1992). Alcohol Tolerance and Social Drinking: Learning the Consequences. New York, McGraw-Hill.
Volkow, N. D., J. S. Fowler, et al. (2004). "The addicted human brain viewed in the light of imaging studies: brain circuits and treatment strategies." Neuropharmacology 47 Suppl 1: 3-13.
Wainer, H. (1991). "Adjusting for differential base rates: Lord's paradox again." Psychol Bull 109(1): 147-51.
Wechsler, D. (2001). Wechsler Adult Intelligence Scale, 3rd edition (WAIS-III). Toronto, The Psychological Corporation, Harcout Brace and Company.
Winer, B. J. (1971). Statistical principles in experimental design. New York, McGraw-Hill.
Wrase, J., F. Schlagenhauf, et al. (2007). "Dysfunction of reward processing correlates with alcohol craving in detoxified alcoholics." Neuroimage 35(2): 787-94.
Zack, M. and C. X. Poulos (2004). "Amphetamine primes motivation to gamble and gambling-related semantic networks in problem gamblers." Neuropsychopharmacology 29(1): 195-207.
Zack, M., C. X. Poulos, et al. (2007). "Effects of drink-stress sequence and gender on alcohol stress response dampening in high and low anxiety sensitive drinkers." Alcohol Clin Exp Res 31(3): 411-22.
Zack, M., T. Toneatto, et al. (1999). "Implicit activation of alcohol concepts by negative affective cues distinguishes between problem drinkers with high and low psychiatric distress." J Abnorm Psychol 108(3): 518-31.

80
Appendix A Study Advertisement from February 2008 to May 2008
Do you Drink Alcohol or Gamble?
If so, you may be eligible for a
RESEARCH STUDY
examining processes related to these activities
If you are: MALE
19-65 years of age Drug and Medication Free
Available for Weekday Sessions
Call Lindsay (416) 535-8501, ext. 6146 OR Anne-Marie (416) 535-8501, ext 6743
NOTE: This is NOT a treatment study.
FINANCIAL COMPENSATION IS PROVIDED
All information will remain confidential

81
Study Advertisement from June 2008 to December 2008
HEAVY DRINKERS needed for
RESEARCH STUDY
If you are:
19-65 years of age
Drug- and Medication-Free
Available for Weekday Sessions
Call Anne-Marie: (416) 535-8501, ext. 6743
Or Lindsay: (416) 535-8501, ext. 6146
NOTE: This is not a treatment study.
FINANCIAL COMPENSATION IS PROVIDED
All information remains confidential to the extent allowed by law
For more information about programs and services at CAMH please visit
www.camh.net or call 416-535-8501 (or 1-800-463-6273).

82
Appendix B
CONSENT FORM
Name of Study: Mental and Behavioural Processes in People Who Gamble and/or Drink Alcohol
Principal Investigator: Martin Zack, Ph. D. Phone: (416) 535-8501 ext. 6052
Purpose: The purpose of this study is to collect information about how alcohol affects various behaviours in heavy gamblers and those who drink alcohol. The study is intended for research purposes only. It is not intended to modify your drinking or gambling habits or otherwise influence your activity. However, the information obtained from this study may lead to improved understanding and treatment of problem gambling and/or problem-drinking in the future. Like all ongoing studies at the Center for Addiction and Mental Health (CAMH), this study is subject to monitoring of records and compliance with agreed-upon procedures by the CAMH Research Ethics Board. Neither the principal investigator nor any of the staff working on this project has any conflict of interest, financial or otherwise, that could influence the results. Alcohol is a drug that can alter thoughts, feelings and behaviour. Recently, studies have found that many people who have gambling problems also have problems with alcohol. Therefore, it is important to evaluate and compare people who engage in one activity or both activities to identify common features as well as differences. As one of 80 participants in the study, you will attend two separate sessions. Two identical test sessions (~ 5 hrs each) at CAMH. The test sessions will occur at least 2 days apart. You will receive beer on one of the sessions and a soft drink on the other. Whether you receive beer on the first or second session will be determined randomly. The dose of beer will be equivalent to about 2-3 standard (355 ml) bottles. This dose has been given to people in other studies without adverse effects. During each test session you will be asked to complete several questionnaires and tests, some on computers. At the start of each session and after consuming beer, your blood alcohol level will be monitored periodically by means of breath samples, which you will provide by blowing into a breathalyser for about 5 seconds. As part of continuing review of the research, your study records may be assessed on behalf of the Research Ethics Board and, if applicable, by the Health Canada Therapeutic Products Programme. A person from the research ethics team may contact you (if your contact information is available) to ask you questions about the research study and your consent to participate. The person assessing your file or contacting you must maintain your confidentiality to the extent permitted by law.
Subject’s Initials _______

83
Procedures: The session will begin promptly at 11am. You will be required to abstain from alcohol and all drugs or medication for 12 hours prior to the start of the session. Upon arrival you will provide a breath sample to confirm that there is no alcohol in your bloodstream. The test phase will last approximately 4 hours. Lunch and snacks will be provided for you following the test phase on each session. At the end of the session, you will be given transit fare to return home. As noted above, the Addictions Medicine Clinic has physicians and nurses who can attend to you in the unlikely event of an emergency during the test sessions. These individuals can also be consulted if you feel unwell. A member of the laboratory staff will escort you to the clinic should this circumstance arise. Steps of the Study: 1. The procedure on each of your test days will be identical. You will report to the laboratory at 11 AM.
You must refrain from drinking alcohol or using any drugs or medication for 12 hours prior to the start of your test session. To ensure even absorption of your drinks, you must not eat or drink anything apart from water for 2 hours prior to the start of your test session.
2. To verify alcohol abstinence, you will provide a breath sample at the beginning of the test session. If
you smoke, you will be required not to for about 3 hrs during the test phase. 3. You will complete some paper and pencil questionnaires.
4. You will perform an initial series of computer-based tasks so that you are familiar with them before
you receive alcohol.
5. Some of the tasks you perform on the computer may be highly challenging or stressful to you. This is normal. As long as you stay focused on the task you are performing you will do fine.
6. You will receive your assigned beverage – beer or soft drink, split into 2 equal-sized drinks, at 15-minute intervals. You will be asked to consume each drink steadily over a period of 5 minutes.
7. Measures of breath alcohol and perceived effects of alcohol will be taken periodically throughout the test phase, by blowing into the breathalyzer. Basic measures of physical function (heart rate, blood pressure) will also be taken using a wrist cuff that slips over your hand and exerts very mild pressure on your forearm for about 30 seconds. None of these measures will cause discomfort.
8. You will perform one computer task after your first drink and two computer tasks after your second drink. Some tasks ask you to identify briefly presented words, on the screen, others require you to make a rapid decision by pressing a designated key on the keyboard. Each of the tasks will be explained to you. These tasks are derived from standard experimental procedures widely used in cognitive psychology as well as alcohol and drug research.
Subject’s Initials _______

84
9. You will also be asked to fill out several questionnaires periodically throughout the test session. Some
of these will ask you to rate the effects of the drinks on your mood at the time. Others will ask you about background characteristics (e.g., your patterns of alcohol use, the kinds of activities you do and don’t enjoy).
10. On days that you receive beer, upon completion of the tasks, you will remain at the laboratory until your blood alcohol level has declined to .01%. This is an extremely important requirement of the study to ensure your safety.
11. After the completion of the study, we will explain to you why we do the various parts of it. Eligibility: To participate in this study you must be 19-65 years old, as confirmed by picture identification, and have no physical or mental illness (with the exception of problem drinking, problem gambling or smoking). You may not participate in this study if you are taking any medications that could alter your mental or emotional state. You must not be colour-blind and must have normal vision or vision that is normal when you wear glasses or contact lenses. A trained Research Analyst will carry out the assessment of eligibility. Confidentiality: Your identity will be kept confidential to the full extent provided by law. In addition, neither your name nor any other personal identifier will be used in any reports or publications arising from this study. All information you provide will be stored in locked cabinets or in computer files accessible only by password. The information you provide will be given a subject number, which cannot be traced back to you. Data from paper copies will be transcribed to computer within 3 months of testing, after which the paper copies will be destroyed. Information linking your name with your research data will only be available to study personnel or a representative of the CAMH Research Ethics Board in the event of a review. Compensation: You will receive $300.00 to compensate you for your time plus transit fare for you to get home from the laboratory. You will receive your payment upon completion of the study. If you are forced to drop out of the study before it has completed, you will be paid for the portion you have completed. Payment for Test Session 1: $150. Payment for Session 2: $150. Risks: The dose of beer may cause you to feel confused or queasy. If this happens, the effect will be short lasting, several hours at most. Food and water will be provided for you after the test phase to minimise possible hangover effects. If you feel unwell during the test session and you wish to see a physician, a member of the laboratory staff will escort you to the medical clinic at the Centre for Addiction and Mental Health. It is possible you will experience emotional or psychological changes as a result of the study. As noted previously, some of the tasks may be quite challenging or stressful. We would like you to carry them out to the best of your ability. However, should you feel you cannot continue, you can drop out of the study at any time, and receive payment for the part you have completed. Similarly, you can refuse to answer any question in the questionnaires that you do.
Subject’s Initials _______

85
Benefits: This study has not been planned to influence your use of alcohol or gambling, but it may provide information that will be of interest to you about their effects. It is hoped that the results will be useful for helping others who wish to change their behaviour. Voluntary Participation: Your participation in this study is voluntary. You may choose to withdraw from the study at any time. In addition, the study investigator or staff responsible for this study may end your participation at any time if you do not act in accordance with the study requirements. Your choice to not participate, your choice to withdraw, or your dismissal by us will in no way affect your right to use the services at The Centre for Addiction and Mental Health. Additional Information: If you have questions about the study that are not answered in this Information Sheet, please ask them. In addition, if you have questions in the future you may contact the study investigator at the telephone number given on the first page. You will also receive a signed copy of this form with additional contact numbers for other study-related concerns. (see next page)
Subject’s Initials _______

86
Agreement to Participate I, _________________________, have read the information in this Consent Form, for the study named “Mental and Behavioural Processes in People Who Gamble and/or Drink Alcohol.” I understand that my role in the study is as a research participant, to help the investigators collect information about various processes associated with the use of alcohol. This information may or may not be useful in designing better ways to help people with alcohol problems and/or gambling problems in the future. My questions, if any, have been answered to my satisfaction, so that I now understand the procedures to be followed in the study, the risks to me from my participation, and my right to the confidential treatment of the information that is collected about me. Research Volunteer: Signature: ____________________________________ Date: ____________________________________ Name: ____________________________________ Please Print Experimenter (person who administered consent form): Signature: ____________________________________ Date: ____________________________________ Name: ____________________________________ Please Print Contact in case of ethical concerns about the study: Dr. Padraig Darby, Chair, Research Ethics Board Centre for Addiction and Mental Health Dr Darby may be reached by telephone at (416) 535-8501, ext. 6876 by research subjects to discuss their rights Contact for questions about the procedures used in the study: Dr. Martin Zack Scientist Clinical Neuroscience Section Centre for Addiction and Mental Health Phone: 416-535-8501, ext. 6052 Email: [email protected]
Subject’s Initials _______

87
Appendix C Table I ANOVA of colour-naming reaction times on the modified Stroop task
Within Subject Effects df F Sig. Session 1 .410 .529 Session * Group 1 3.793 .066 Session * SSEQ 1 .004 .949 Session * BSEQ 1 .080 .780 Session * Group * SSEQ 1 .688 .417 Session * Group * BSEQ 1 .010 .919 Session * SSEQ * BSEQ 1 .054 .819 Session * Group * SSEQ * BSEQ 1 1.121 .302 Wordtype 5 2.360 .045 Wordtype * Group 5 2.681 .026 Wordtype * SSEQ 5 .807 .547 Wordtype * BSEQ 5 2.597 .030 Wordtype * Group * SSEQ 5 .195 .964 Wordtype * Group * BSEQ 5 2.111 .070 Wordtype * SSEQ * BSEQ 5 .660 .655 Wordtype * Group * SSEQ * BSEQ 5 .573 .721 Session * Wordtype 5 1.730 .135 Session * Wordtype * Group 5 .200 .962 Session * Wordtype * SSEQ 5 1.078 .377 Session * Wordtype * BSEQ 5 .588 .709 Session * Wordtype * Group * SSEQ 5 .239 .944 Session * Wordtype * Group * BSEQ 5 1.884 .104 Session * Wordtype * SSEQ * BSEQ 5 1.213 .309 Session * Wordtype * Group * SSEQ * BSEQ 5 1.491 .199
Between Subject Effects df F Sig. Group 1 .092 .764 SSEQ 1 .007 .933 BSEQ 1 1.041 .320 Group * SSEQ 1 .238 .631 Group * BSEQ 1 .204 .656 SSEQ * BSEQ 1 2.310 .144 Group * SSEQ * BSEQ 1 1.427 .246 Error 20
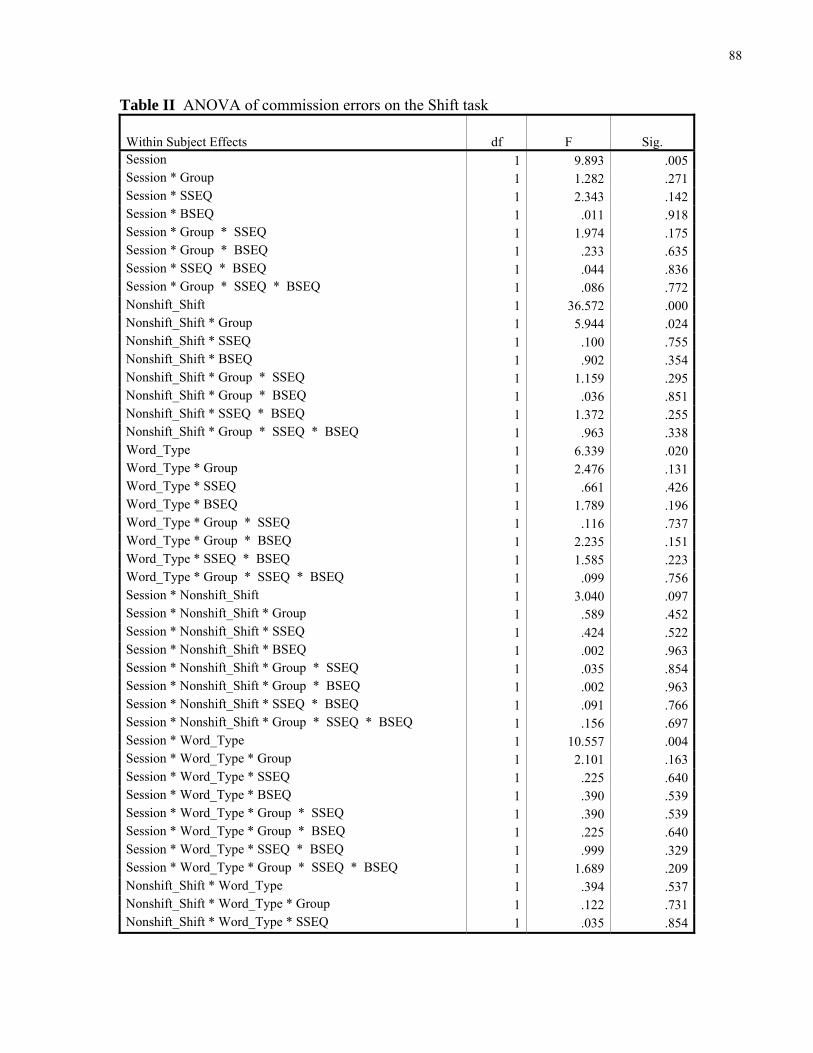
88
Table II ANOVA of commission errors on the Shift task
Within Subject Effects df F Sig. Session 1 9.893 .005Session * Group 1 1.282 .271Session * SSEQ 1 2.343 .142Session * BSEQ 1 .011 .918Session * Group * SSEQ 1 1.974 .175Session * Group * BSEQ 1 .233 .635Session * SSEQ * BSEQ 1 .044 .836Session * Group * SSEQ * BSEQ 1 .086 .772Nonshift_Shift 1 36.572 .000Nonshift_Shift * Group 1 5.944 .024Nonshift_Shift * SSEQ 1 .100 .755Nonshift_Shift * BSEQ 1 .902 .354Nonshift_Shift * Group * SSEQ 1 1.159 .295Nonshift_Shift * Group * BSEQ 1 .036 .851Nonshift_Shift * SSEQ * BSEQ 1 1.372 .255Nonshift_Shift * Group * SSEQ * BSEQ 1 .963 .338Word_Type 1 6.339 .020Word_Type * Group 1 2.476 .131Word_Type * SSEQ 1 .661 .426Word_Type * BSEQ 1 1.789 .196Word_Type * Group * SSEQ 1 .116 .737Word_Type * Group * BSEQ 1 2.235 .151Word_Type * SSEQ * BSEQ 1 1.585 .223Word_Type * Group * SSEQ * BSEQ 1 .099 .756Session * Nonshift_Shift 1 3.040 .097Session * Nonshift_Shift * Group 1 .589 .452Session * Nonshift_Shift * SSEQ 1 .424 .522Session * Nonshift_Shift * BSEQ 1 .002 .963Session * Nonshift_Shift * Group * SSEQ 1 .035 .854Session * Nonshift_Shift * Group * BSEQ 1 .002 .963Session * Nonshift_Shift * SSEQ * BSEQ 1 .091 .766Session * Nonshift_Shift * Group * SSEQ * BSEQ 1 .156 .697Session * Word_Type 1 10.557 .004Session * Word_Type * Group 1 2.101 .163Session * Word_Type * SSEQ 1 .225 .640Session * Word_Type * BSEQ 1 .390 .539Session * Word_Type * Group * SSEQ 1 .390 .539Session * Word_Type * Group * BSEQ 1 .225 .640Session * Word_Type * SSEQ * BSEQ 1 .999 .329Session * Word_Type * Group * SSEQ * BSEQ 1 1.689 .209Nonshift_Shift * Word_Type 1 .394 .537Nonshift_Shift * Word_Type * Group 1 .122 .731Nonshift_Shift * Word_Type * SSEQ 1 .035 .854

89
Table II ANOVA of commission errors on the Shift task (continued)
Within Subject Effects df F Sig. Nonshift_Shift * Word_Type * BSEQ 1 2.649 .119Nonshift_Shift * Word_Type * Group * SSEQ 1 .009 .927Nonshift_Shift * Word_Type * Group * BSEQ 1 .262 .615Nonshift_Shift * Word_Type * SSEQ * BSEQ 1 .740 .400Nonshift_Shift * Word_Type * Group * SSEQ * BSEQ 1 .026 .872Session * Nonshift_Shift * Word_Type 1 4.191 .054Session * Nonshift_Shift * Word_Type * Group 1 2.138 .159Session * Nonshift_Shift * Word_Type * SSEQ 1 .106 .749Session * Nonshift_Shift * Word_Type * BSEQ 1 1.525 .231Session * Nonshift_Shift * Word_Type * Group * SSEQ 1 .207 .654Session * Nonshift_Shift * Word_Type * Group * BSEQ 1 .106 .749Session * Nonshift_Shift * Word_Type * SSEQ * BSEQ 1 1.293 .269Session * Nonshift_Shift * Word_Type * Group * SSEQ * BSEQ 1 1.775 .198
Between Subject Effects df F Sig. Group 1 6.484 .019SSEQ 1 .574 .458BSEQ 1 .870 .362Group * SSEQ 1 .183 .673Group * BSEQ 1 .752 .396SSEQ * BSEQ 1 .405 .532Group * SSEQ * BSEQ 1 1.354 .258Error 20
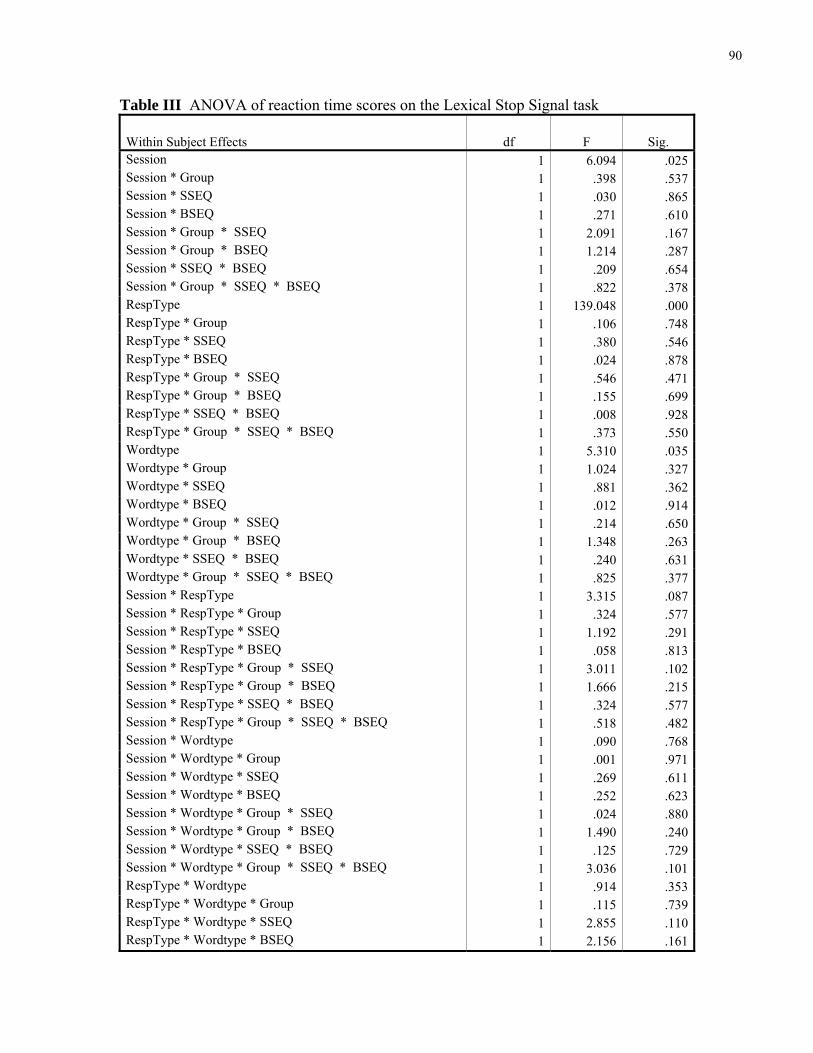
90
Table III ANOVA of reaction time scores on the Lexical Stop Signal task
Within Subject Effects df F Sig. Session 1 6.094 .025Session * Group 1 .398 .537Session * SSEQ 1 .030 .865Session * BSEQ 1 .271 .610Session * Group * SSEQ 1 2.091 .167Session * Group * BSEQ 1 1.214 .287Session * SSEQ * BSEQ 1 .209 .654Session * Group * SSEQ * BSEQ 1 .822 .378RespType 1 139.048 .000RespType * Group 1 .106 .748RespType * SSEQ 1 .380 .546RespType * BSEQ 1 .024 .878RespType * Group * SSEQ 1 .546 .471RespType * Group * BSEQ 1 .155 .699RespType * SSEQ * BSEQ 1 .008 .928RespType * Group * SSEQ * BSEQ 1 .373 .550Wordtype 1 5.310 .035Wordtype * Group 1 1.024 .327Wordtype * SSEQ 1 .881 .362Wordtype * BSEQ 1 .012 .914Wordtype * Group * SSEQ 1 .214 .650Wordtype * Group * BSEQ 1 1.348 .263Wordtype * SSEQ * BSEQ 1 .240 .631Wordtype * Group * SSEQ * BSEQ 1 .825 .377Session * RespType 1 3.315 .087Session * RespType * Group 1 .324 .577Session * RespType * SSEQ 1 1.192 .291Session * RespType * BSEQ 1 .058 .813Session * RespType * Group * SSEQ 1 3.011 .102Session * RespType * Group * BSEQ 1 1.666 .215Session * RespType * SSEQ * BSEQ 1 .324 .577Session * RespType * Group * SSEQ * BSEQ 1 .518 .482Session * Wordtype 1 .090 .768Session * Wordtype * Group 1 .001 .971Session * Wordtype * SSEQ 1 .269 .611Session * Wordtype * BSEQ 1 .252 .623Session * Wordtype * Group * SSEQ 1 .024 .880Session * Wordtype * Group * BSEQ 1 1.490 .240Session * Wordtype * SSEQ * BSEQ 1 .125 .729Session * Wordtype * Group * SSEQ * BSEQ 1 3.036 .101RespType * Wordtype 1 .914 .353RespType * Wordtype * Group 1 .115 .739RespType * Wordtype * SSEQ 1 2.855 .110RespType * Wordtype * BSEQ 1 2.156 .161

91
Table III ANOVA of reaction time scores on the Lexical Stop Signal task (continued)
Within Subject Effects df F Sig. RespType * Wordtype * Group * SSEQ 1 .057 .815RespType * Wordtype * Group * BSEQ 1 .211 .652RespType * Wordtype * SSEQ * BSEQ 1 4.487 .050RespType * Wordtype * Group * SSEQ * BSEQ 1 .487 .495Session * RespType * Wordtype 1 .018 .895Session * RespType * Wordtype * Group 1 .606 .448Session * RespType * Wordtype * SSEQ 1 1.793 .199Session * RespType * Wordtype * BSEQ 1 1.459 .245Session * RespType * Wordtype * Group * SSEQ 1 .021 .887Session * RespType * Wordtype * Group * BSEQ 1 .258 .619Session * RespType * Wordtype * SSEQ * BSEQ 1 .920 .352Session * RespType * Wordtype * Group * SSEQ * BSEQ 1 .143 .710
Between Subject Effects df F Sig. Group 1 .065 .802SSEQ 1 1.114 .307BSEQ 1 .000 .991Group * SSEQ 1 .941 .346Group * BSEQ 1 .056 .815SSEQ * BSEQ 1 .054 .819Group * SSEQ * BSEQ 1 1.068 .317Error 16

92
Table IV ANOVA of go reaction time (go_rt) and stop signal reaction time (ssrt) scores on the Stop Signal task
Within Subject Effects Measure df F Sig. Session go_rt 1 2.748 .116 ssrt 1 1.808 .196Session * Group go_rt 1 .592 .452 ssrt 1 .038 .847Session * SSEQ go_rt 1 .118 .735 ssrt 1 3.661 .073Session * BSEQ go_rt 1 .479 .498 ssrt 1 .285 .600Session * Group * SSEQ go_rt 1 2.153 .161 ssrt 1 3.801 .068Session * Group * BSEQ go_rt 1 .152 .701 ssrt 1 1.210 .287Session * SSEQ * BSEQ go_rt 1 3.755 .069 ssrt 1 .643 .434Session * Group * SSEQ * BSEQ go_rt 1 .836 .373 ssrt 1 .460 .507Pre_post go_rt 1 1.378 .257 ssrt 1 .504 .487Pre_post * Group go_rt 1 2.316 .146 ssrt 1 .022 .885Pre_post * SSEQ go_rt 1 .005 .947 ssrt 1 .920 .351Pre_post * BSEQ go_rt 1 .073 .791 ssrt 1 .002 .969Pre_post * Group * SSEQ go_rt 1 .278 .605 ssrt 1 .962 .341Pre_post * Group * BSEQ go_rt 1 .048 .830 ssrt 1 .204 .657Pre_post * SSEQ * BSEQ go_rt 1 3.819 .067 ssrt 1 .008 .928Pre_post * Group * SSEQ * BSEQ go_rt 1 .276 .606 ssrt 1 .096 .760Session * Pre_post go_rt 1 .305 .588 ssrt 1 .387 .542Session * Pre_post * Group go_rt 1 .260 .616 ssrt 1 .142 .711Session * Pre_post * SSEQ go_rt 1 .000 .990 ssrt 1 .030 .865Session * Pre_post * BSEQ go_rt 1 3.646 .073 ssrt 1 .135 .718Session * Pre_post * Group * SSEQ go_rt 1 .004 .949 ssrt 1 1.871 .189

93
Table IV ANOVA of go reaction time (go_rt) and stop signal reaction time (ssrt) scores on the Stop Signal task (continued) Session * Pre_post * Group * BSEQ go_rt 1 .023 .880 ssrt 1 .214 .650Session * Pre_post * SSEQ * BSEQ go_rt 1 .982 .336 ssrt 1 .534 .475Session * Pre_post * Group * SSEQ * BSEQ go_rt 1 1.596 .223 ssrt 1 .006 .940
Between Group Effects Measure df F Sig. Group go_rt 1 .329 .573 ssrt 1 1.603 .223SSEQ go_rt 1 .022 .885 ssrt 1 .007 .935BSEQ go_rt 1 1.631 .219 ssrt 1 .161 .693Group * SSEQ go_rt 1 .747 .400 ssrt 1 1.937 .182Group * BSEQ go_rt 1 .001 .974 ssrt 1 .008 .930SSEQ * BSEQ go_rt 1 .444 .514 ssrt 1 2.840 .110Group * SSEQ * BSEQ go_rt 1 .027 .872 ssrt 1 .475 .500Error go_rt 17 ssrt 17