the effects of tax planning and earnings quality
TRANSCRIPT

8/7/2019 The Effects of Tax Planning and Earnings Quality
http://slidepdf.com/reader/full/the-effects-of-tax-planning-and-earnings-quality 1/41
Taxable Income as a Performance Measure:
The Effects of Tax Planning and Earnings Quality*
BENJAMIN C. AYERS, The University of Georgia
JOHN (XUEFENG) JIANG, Michigan State University
STACIE K. LAPLANTE, The University of Georg ia
1. Introduction
Hanlon (2005) and Lev and N issim (2004) provide rather compelling evidence that
book-tax differences, on average, are systematically related to earnings growth,
future stock returns, and earnings persistence. Among other implications, these
studies suggest that book-tax differences are useful measures in evaluating firm
performance. Consistent with these studies, Shevlin (2002) and Hanlon. Laplante,
and Shevlin (2005) find that whiie book income explains a firm's annual stock
returns better than estimated taxable income (i.e., calculated using financial statement
disclosures), estimated taxable incom e, on av erage, has incremental explanatory
power for book income (i.e., estimated taxable income summarizes information
reflected in stock returns that is not captured by book income). Beyond these studies,
there is little evidence regarding taxable income as an alternative performance meas-
ure and, in particular, cross-sectional differences in firms that mitigate or enhance
the ability of taxable income to inform investors regarding firm performance.
We look to the recent debates on book-tax conformity and extant literature to
identify two settings (high tax planning and low earnings quality) that may impair
or enhance the information content of taxable income relative to book income.First, recent calls for mandatory book-tax conformity argue that the dual system of
reporting both book and taxable income is "the province of much creative decision-
making" (Desai 2006, 8) that manifests in taxable income that does not reflect the
firm's actual performance.' This argument identifies aggressive tax planning as a
primary source of book-tax differences and suggests that the end result is taxable
income devoid of a firm's economic performance.
* Accepted by Suzan ne Paqu ette. An earlier version of this paper was presented at the 2007 Con-
temporary Accounting Research Conference, generously supported by the Canadian Institute of
Chartered Accountants. Ayers and Laplante gratefully acknowledge the support of the Terry

8/7/2019 The Effects of Tax Planning and Earnings Quality
http://slidepdf.com/reader/full/the-effects-of-tax-planning-and-earnings-quality 2/41
16 Contem porary Accounting Research
Second, financial accounting texts, extant literature, and anecdotal evidencesuggest that taxable income may be especially important in assessing firm perfor-mance for firms with lower earnings quality. Revsine, Co llins, and Johnson (2002 ,
654) state that "an increase in a deferred tax liability might be an indication ofdeteriorating earnings quality". They also state (2002, 630) that "analysts can usetax footnotes to glean information not provided elsewhere in the financial state-ments to better understand a firm's performance and future prospects". Consistentwith this view, Lev and Nissim (2004) and Hanlon (2005) find that large book-taxdifferences, on average, are systematically associated with the quality (persistence,growth) of firm earnings. However, neither study investigates the information con-tent of taxable income for firms with low earnings quality. Thus, as posed in
Seida's 2003 congressional testimony regarding Enron's tax disclosures and rathersizable differences in Enron's book and taxable income, the question remainswhether taxab le income may be a useful alternative measure of income in settings inwhich book income is considered of lower quality.
On the basis of the expectation that tax planning obscures the firm's actualperformance by minimizing the firm's tax liability (e.g., avoiding or deferring tax-able income), we hypothesize that the relative and incremental information contentof taxable income is lower for high tax-planning firms. Likewise, we anticipate that
the relative and incremental information content of taxable income will be higherfor firms with lower-quality earnings. This expectation is based on the assumptionthat the "shocks" to book and taxable income and the managed components ofeach measure are not identical (Lev and Nissim 2004).
Similar to Hanlon et al. 2005, we define infonnation content as the ability ofbook income and estimated taxable income to summarize information that affectsstock returns, and we assess information content using long-window associationtests.2 Specifically, we estimate tbe relative information content of estimated tax-
able income and book income using separate annual regressions of stock returns onfirst differences in estimated taxable income and book income. We estimate world-wide taxable income (federal tax expense plus foreign tax expense divided by tbestatutory tax rate less changes in net operating losses [NOLs]) to ensure that it iscomparable to our measure of pre-tax book income, which is also a worldwidenumber.^ For each analysis, we compare the ratio of the adjusted R^ for the separ-ate tax and book regressions for the comparison group (i.e., high tax planning, lowearnings quality) to the ratio of the adjusted /?2 for these regressions for all otherfirms. We also assess the incremental information content of taxable income by
comparing the difference in adjusted R'h from a regression of returns on both thechange in book and estimated taxable income and a regression of returns on just

8/7/2019 The Effects of Tax Planning and Earnings Quality
http://slidepdf.com/reader/full/the-effects-of-tax-planning-and-earnings-quality 3/41
Taxable Income as a Performance M easure 17
of pre-tax book income over five years). We designate firms ranked in the lowest 20
percent of current effective tax rates for each two-digit Standard Industrial Classifica-
tion (SIC) industry and year as high tax-planning firms. We define low earnings
quality as earnings composed of relatively large "abnormal accruals".'^ We desig-nate firms ranked in the highest 20 percent of modified Jones model abnormal
accruals (absolute value) for each two-digit SIC industry and year as firms with
low earnings quality.
Consistent with expectations, we find that the relative information content of
estimated taxable income for high tax-planning firms is much lower than that
of other firms.5 Specifically, although we find that estimated taxable income for
high tax-planning firms continues to be significantly associated with annual stock
returns, estimated taxable income for these firms explains only 40.3 percent of theannual return variation explained by book income. In contrast, estimated taxable
income for all other sample firms explains 74.2 percent of annual return variation
explained by book income. Additional analyses suggest that the relative information
content of taxable income for high tax-planning firms versus other firms decreased
significantly after 1992, a period commonly perceived to be characterized by high
tax shelter activity (e.g.. Treasury 1999; Government Accountability Office [GAO]
2003). From a tax policy perspective, this evidence suggests that tax planning
results in a taxable income number that does not map well into the market's per-
ception of firm performance, especially during periods of high tax shelter activity.The results from incremental information content tests are also consistent with the
information in taxable income being impaired for high tax-planning firm-years.
However, the incremental information content of taxable Income, on average, is
moderate. Thus, we conclude that from a financial statement analysis perspective,
the incremental information loss to investors from tax planning is quite modest.
Consistent with expectations, we also find that the relative and incremental
information content of estimated taxable income to book income for firms with
large abnormal accruals is significantly larger than that for other firms . For exam ple,for firms with large abnormal accruals, estimated taxable income explains 66.2 per-
cent of the annual return variation explained by book income versus 49 .8 percent for
all other firms. Additional analyses suggest that the relative information content of
taxable income for low earnings-quality firms versus other firms increased signifi-
cantly after 1992, a period marked by increased concerns of opportunistic earnings
managem ent (e.g., Levitt 1998; Katz 2002; B ergstresser and Philippon 2006). Con-
clusions from our incremental information content tests are similar but, again, the
incremental information content of taxable income is quite modest.In sensitivity analyses, we assess the robustness of the study's analyses to

8/7/2019 The Effects of Tax Planning and Earnings Quality
http://slidepdf.com/reader/full/the-effects-of-tax-planning-and-earnings-quality 4/41
18 Contem porary Accou nting Research
for overstating earnings. As expected, we find that the relative and incremental
information content of estimated taxable income is particularly high for these firms
(e.g., estimated taxable income explains 90.1 percent of the annual return variation
explained by book income, and adding the change in estimated taxable income tothe regression of the change in pre-tax income on returns increases the adjusted/?2
by 0.019, a 37.2 percent increase in explanatory power). Among other implica-
tions, these results suggest that the relative explanatory power of taxable income
increases substantially in those settings where managers may have used opportu-
nistic discretion in reporting book income.
This study makes several contributions. First, consistent with speculation in
Desai 2006, results suggest that tax planning obscures the relation between taxable
income and firm performance (as proxied by annual stock returns). Second, thisstudy contributes to the recent literature investigating taxable income as an alterna-
tive performance measure. Consistent with speculation in Seida 2003, results suggest
that taxable income becomes a more useful performance measure in settings where
management may have used discretion in reporting book income. Nonetheless, we
find that book income better explains annual stock retums, on average, for firms
with large abnormal accruals. In sum, our evidence suggests that investors view
taxable income as a supplemental, not a superior, performance measure. Third,
results suggest that tax planning and low earnings quality have contrasting effects
on the information content of taxable income. Given that both tax planning and
events that result in low earnings quality may generate book-tax differences, this
study's findings may be particularly useful for researchers investigating book-tax
differences. In particular, our analyses suggest that existing tax-planning and low
earnings-quality proxies are sufficiently powerful to detect settings where book-tax
differences are more likely attributable to discretion in reporting either book or tax-
able income. Finally, evidence that taxable income becomes less informative for high
tax-planning firms and more informative for low earnings-quality firms suggests
that investors, at least in part, are able to distinguish sources of book-tax differences.In the low earnings-quality setting, tbis evidence is consistent with the market using
taxable income to assess firm performance when earnings may be questionab le.
Our paper proceeds as follows. Section 2 develops hypotheses, while section 3
describes tbe sample data and research m ethods. Section 4 presents results, section 5
presents sensitivity analyses, and section 6 conclude s.I
2. Prior research and hypotheses
Because book and tax reporting serve different purposes and stakeholders, manag-ers have different incentives in calculating both book and taxable income. M anagers

8/7/2019 The Effects of Tax Planning and Earnings Quality
http://slidepdf.com/reader/full/the-effects-of-tax-planning-and-earnings-quality 5/41
Taxable Income as a Performance Measure 19
informative if the "shocks" to taxable income and book income and the managedcomponents of each measure are not identical (Lev and Nissim 2004)7 Anecdotaland empirical evidence confirms this expectation. For example. Internal Revenue
Service (1RS) audit manuals instruct internal revenue agents to reconcile book andtax amounts and question any differences when auditing corporate tax returns.^ Like-wise, Mills (1998) finds that 1RS audit adjustments increase as the book-tax gapwidens (i.e., as book income exceeds taxable income), providing further evidencethat tax authorities view book income as an informative measure of a firm's tax base.
Recent literature also suggests that taxable income is an informative measureof firm performance for financial statement users. Hanlon (2005) and Lev andNissim (2004) find that book-tax differences are systematically related to earningsgrowth, future stock returns, and earnings persistence, suggesting that book-taxdifferences are useful measures in evaluating firm performance. Consistent withthese studies, Shevlin (2002) and Hanlon et al. (2005) find that although bookincome better explains a firm's annual stock returns than taxable income (calculatedusing financial statement disclosures), estimated taxable income has significantincremental explanatory power to book incom e. Beyond these studies, there is littleevidence regarding taxable income as an alternative performance measure. Despitethe paucity of evidence, there is ample speculation regarding taxable income as aperformance measure, especially in settings where the firm engages in tax planning
or has lower earnings quality.
Tax-planning hypothesis development
Concerned by large differences between income reported for financial statementand tax purposes, recent calls for mandatory book-tax conformity argue that thedual system of reporting book and taxable income manifests in taxable income thatdoes not reflect the firm's actual performance. Our analyses speak to this debateby analyzing the information content of estimated taxable income for higb tax-
planning firms. On the basis of the expectation that tax planning obscures thefirm's actual performance by minimizing the firm's tax liability (e.g., by avoidingor deferring taxable income), we hypothesize that, ceteris paribus, the informationcontent of taxable income will be lower for high tax-planning firms.
Despite the rather clear preceding prediction, there is debate whether tax plan-ning enhances or adversely affects the information content of taxable income. Levand Nissim (2004) argue that, under the assumption that firms "smooth" taxableincome to minimize the present value of income taxes, tax planning actually
enhances the ability of taxable income to inform investors regarding future earn-ings growth.^ Specifically, under the assumption that smoothing is the optimal

8/7/2019 The Effects of Tax Planning and Earnings Quality
http://slidepdf.com/reader/full/the-effects-of-tax-planning-and-earnings-quality 6/41
20 Con temporary Accounting Research
H Y P O T H E S I S 1. High tax-planning firms have relatively less informative
taxable income than other firms.
Earnings-quality hypothesis developmentRevsine et al. (2002, 654) state that "an increase in a deferred tax liability might be
an indication of deteriorating earnings quality". They also state (2002, 630) that
"analysts can use tax footnotes to glean information not provided elsewhere in the
financial statements to better understand a firm's performance and future pros-
pects". Likewise, Seida (2003), in his congressional testimony regarding Enron's
tax disclosures and rather sizable differences in Enron's book and taxable incomes,
poses the question whether taxable income may be a useful alternative measure of
income. Consistent with this view. Lev and Nissim (2004) and Hanlon (2005) find
that large book-tax differences are systematically associated with the quality (per-
sistence, growth) of firm earnings. Am ong other im plications, these studies suggest
that taxable income may have enhanced information content as a summary perfor-
mance measure when book income is of lower quality. Nonetheless, this is not a
foregone conclusion (e.g., Joos, Pratt, and Young 2000; Frank, Lyneh, and Rego
2006)."' In.stead. the enhanced information content of taxable income in this set-
ting depends on the source of the lower earnings quality and the extent to which
taxable income is likewise affected. For example, if lower earnings quality results
from opportunistic management discretion (e.g., discretion used to mislead invest-ors), we anticipate that taxable income will have enhanced information content to
the extent that taxable income does not reflect management discretion. Erickson,
Hanlon. and Maydew (2004) show that of 27 firms accused of fraudulently over-
stating book income, 15 firms willingly paid taxes on fraudulent earnings. Their
evidence is consistent with some, but not all, firms trading off higher taxes in
exchange for higher book income. In contrast, if the low earnings quality results
from transitory events (i.e., value-relevant events with low persistence) reflected in
book incom e but not yet in taxable income (the write-down of purchased goodwill,
restructuring charges, mark-to-market adjustments, etc.), then the relative informa-
tion content of taxable income (i.e., the relative ability of current year taxable
income to explain returns) could actually decrease. Thus, it is an empirical ques-
tion whether taxable income has enhanced information content when earnings are
of lower quality. Our second hypothesis stated in alternative form is:
H Y P O T H E S I S 2. Firms with lower earnings quality have relatively more
informative taxable income.

8/7/2019 The Effects of Tax Planning and Earnings Quality
http://slidepdf.com/reader/full/the-effects-of-tax-planning-and-earnings-quality 7/41
Taxable Income as a Performance M easure 21
content if it reflects, or is associated with, information that equity investors find
useful in assessing firm performance. Because we are interested in examining the
ability of taxable or book income to summarize all information that affects returns
and are not concerned with causality, we use long-window association tests.We conduct two association tests to assess tbe information content of esti-
mated taxable income and book income. We use 16-month windows ending
4 months after the fiscal year-end to test for a statistical association between the
two measures of income and security returns to ensure that market participants
have received the annual income numbers. This is especially pertinent to our set-
ting because tax returns are confidential, and we derive an estimate of taxable
income from details in the financial statements. We follow Hanlon et al. 2005 in
calculating taxable and book income. Our primary measure of estimated taxableincome (TI) for firm j at time / is estimated as follows;
+ FOTEj,)/str,] - i^OLj, (1).
where FTE is current federal income tax expense (data 63), FOTE is current for-
eign tax expense (data 64), str, is the top U.S. statutory tax rate for year /, and
^NOL is the change in net operating loss carryforwards (data 52).' • We subtract
ANOL because we require an estimate of the firm's taxable income (or loss) prior to
the effects of any carrybacks or carryforwards. ' -
Plesko (2000, 2006) provides evidence that taxable income calculated from
financial statements is highly and significantly correlated with firms' actual taxable
income, thus providing some assurance that taxable income estimated from financial
statements is a reasonable proxy for a firm's actual taxable income.'-* Nonetheless,
Hanlon (2003) identifies seven major problems in estimating a firm's tax liability
and hence taxable income from financial statement disclosures. Briefly, the issues
include accounting for employee stock options exercises, intraperiod tax allocation,
consolidation, reserves for uncertain tax positions, tax credits, foreign operations,and negative taxable income. Although each of these issues contributes to potential
measurement error in our estimate of taxable incom e, as in Hanlon et al. 2005, the
first three issues should not affect our inferences (see Appendix A of Hanlon et al.
2005 for a detailed discussion related to the current setting), and lack of firm dis-
closure prevents us from evaluating the effects of the tax cushion on our analy-
ses.''* Because we compare the relative information content of estimated taxable
income across groups of firms, measurement error in taxable income resulting
from the last three issues is less of a concern to the extent that the error is not sys-tematically related to how we classify high tax-planning and low earnings-quality

8/7/2019 The Effects of Tax Planning and Earnings Quality
http://slidepdf.com/reader/full/the-effects-of-tax-planning-and-earnings-quality 8/41
22 Contem porary Accoun ting Research
where PTB is pre-tax book income (data 170) and MI is minority interest (data 49 ).
We use a pre-tax measure of book income to be consistent with estimated taxable
incom e, which is a pre-tax m easure.
Test 1: Informaäon content
In our first test, we examine the ratio of the information content of estimated tax-
able income to book income for high tax-planning firms versus all other firms to
test Hy pothesis 1. We conduct a similar test for low earnings-quality firms to test
Hypothesis 2. We measure the information content of estimated taxable income
and book income separately as the adjusted R~ in regressions of security returns on
each measure. To implement this test, we estimate the following two equations
annually for each group of firms (high tax planners versus all others for Hypothesis 1 low earnings-quality firms versus all others for H ypothesis 2):
Sj, (3),
+ Sj, (4),
where R j, is the buy-and-hold market-adjusted return to security y over the 16-
month return window starting at the beginning of fiscal year t and ending 4 months
after the end of fiscal year tJ^ The changes in estimated taxable income and bookincome, A7/y, and APTBlj¡, are equal to the difference in each measure for firm^
from year / - 1 to year / [{TIj, - Tip _ , ) and {PTBIp - PTBIj, _ j )1, each scaled
the market value of equity measured at the start of fiscal year t, respectively. TIj,
and PTBIjt are as previously defined. We use a changes specification (i.e., returns
and changes in estimated taxable income and book income) to mitigate concerns
associated with levels regressions such as correlated omitted variables and heterosce-
dasticity (Kothari200l).
Our test statistic is the average ratio of the adjusted R from (3) to the adjustedR 2 from (4) for each group of firms over our sample period, as follows:
1 l i l t . -
Adjusted R^taxabU i^om./Adjusted /f2¿^^ , .„^^^ ' (5
An advantage of this statistic is that it allows us to compare the information
content of two performance measures (est imated taxable income and book
incom e), holding returns for the firm constant. This m easure does not simply com -
pare the adjusted R ^ of estimated taxable income across samples, which would be
susceptible to a variety of alternative explanations. Instead, this measure comparesthe relative information content of estimated taxable income to book income for

8/7/2019 The Effects of Tax Planning and Earnings Quality
http://slidepdf.com/reader/full/the-effects-of-tax-planning-and-earnings-quality 9/41
Taxable Income as a Performance M easure 23
content of taxable income is reduced for high tax-planning firms. For Hypothesis 2,
we predict that the ratio represented by (5) will be higher for firms with lower earn-
ings quality than for all other firms because the relative information content of tax-
able income is enhanced for the low earnings-quality firms. We test significance
using both M ests and W ilcoxon rank sum tests of the yearly values of (5).
Test 2: Incremental explanatory power of taxable income
In our second test, we assess the additional explanatory power (i.e., the incremental
or unique explanatory power) of including estimated taxable income in a regres-
sion of book income on retums for high tax-planning firms versus all other firms
(Hypothesis 1). We conduct a similar test for low earnings-quality firms versus all
other firms (Hypothesis 2). We measure the additional explanatory power ofestimated taxable income as tbe difference in the adjusted R^ from a regression of
returns on both tbe change in estimated taxable income and book income and
the adjusted R^from (4). To implement tbis test, we estimate (4) and the following
equation annually for each group of firms (high tax planners versus all other
firms to test H ypothesis 1 and low earnings-quality firms versus all other firms to
test H ypothesis 2):^^
Rj, = ßo+ ß]aPTBIj, + ß2aTlj, + sj, (6),
where all of the variables are as previously defined.
Our test statistic for this test is the difference in the adjusted fi^ from (6) and
the adjusted /?2 from (4) for each group of firms over our sample period, as follows;
Adjusted R\f^i - Adjusted R\4^ ^ ., „. . . (7 ).
Our expectation s for these tests are the same as discussed in Hy pothesis 1 and
Hypothesis 2. For Hypothesis 1, the difference represented by (7) will be lower forhigh tax-planning firms than for all other firms if tax planning reduces the informa-
tion content of estimated taxable income. For Hypothesis 2, the difference repre-
sented by (7) will be higher for firms identified as low earnings-quality firms than
for all other firms if the relative information content of estimated taxable income is
enhanced for firms with lower earnings quality.
Identification of high tax-planning firms
Dyreng, H anlon, and M aydew (2008) argue that tax-avoidance firms are those tbat
are able to sustain a low tax rate over multiple years. Following their logic regarding

8/7/2019 The Effects of Tax Planning and Earnings Quality
http://slidepdf.com/reader/full/the-effects-of-tax-planning-and-earnings-quality 10/41
24 Contemporary Accoun ting Research
where CTE is current tax expense equal to total tax expense (data 16) less deferredtax expense (data 50) for firmy over the five-year period from / - 4 through r, andPTB is as previously defined, also accumulated for firm; over the five-year periodfrom Í - 4 through t. We exclude deferred tax expense from ETR because it repre-sents future tax effects from current transactions and not taxes due in the currentperiod (Dyreng et al. 2008). Measuring ETR this way captures both timing andavoidance tax-planning strategies (i.e.. both deferring and permanently avoidingtaxable income result in lower ETRs).'^^
Despite its advantages (e.g., current tax expense is readily available), the tradi-tional measure of ETR has its limitations. First, £77? is an accrual-based measureof tax avoidance and measures the actual taxes paid with error, because the accrued
expense often differs from the actual payment to the government due to challengesby the 1RS or mistakes made in estimating current tax expense (Dyreng et al.2008). If, for example, a firm accrues an expense for an uncertain tax position thatlater is resolved in its favor, the current tax expense overstates the actual liability.Similarly, if the 1RS disallows a questionable position, the current tax expense mayunderstate the actual liability. The second limitation of £77? is that it excludes thebenefit of the deduction for stock options — that is, current tax expense is over-stated for firms with stock option deductions.^' We address these limitations in two
ways. First, we accumulate ETR over a five-year period, which allows for someoffsetting of over- and understatements of tax liability (i.e.. mitigating the first lim-itation). Second, as an alternative measure of tax avoidance, we calculate our accu-mulated ETR using actual cash taxes paid (i.e.. instead of current tax expense),which addresses both Iimitations.22
Identification of tow earnings-quality firms ' ' '
We use abnormal accruals to define earnings quality. Although abnormal accrual
models are subject to criticism in their ability to isolate discretion (McNicholsand Wilson 1988; Dechow, Sloan, and Sweeney 1995; Kasznik 1999; McNichols2000; Dechow, Richardson, and Tuna 2003; Kothari, Leone, and Wasley 2005;Hribar and Nichols 2006; etc.). this study's setting is less susceptible to these criti-cisms because we are interested in the ability of taxable income to inform investorswhere managers use discretion in reporting income and/or where book incomemay be more difficult to interpret (as one may expect when firms have large abnor-mal accruals). We identify firms as low earnings-quality firms by designating firmsranked in the highest 20 percent of absolute abnormal accruals for each year andtwo-digit SIC industry as having low earnings quality.^^

8/7/2019 The Effects of Tax Planning and Earnings Quality
http://slidepdf.com/reader/full/the-effects-of-tax-planning-and-earnings-quality 11/41
Taxable Income as a Performance M easure 25
where TACC is total accruals measured as the change in current assets (data 4),
plus the change in short-term debt (data 34), less the change in current liabilities
(data 5), the change in cash (data 1), and depreciation and amortization expense
(data 14) for firm^ in year t. ¿^Sales is the chan ge in sales (data 12) from year / - 1
to year r, and AREC is the change in accounts receivable (data 2) from year / - I to
year /. PPEj, is firm/s gross property, plant, and equipment (data 7) for year t. We
deflate all variables except the constant term by beginning of the year total assets
for firm 7, TAj, _ ] (data 6). We include an intercept term in (9) because Kothari
et al. (2005, 173) advocate that this term helps alleviate heteroscedasticity. mitigate
concerns regarding an omitted size variable, and generate a more symmetric mea-
sure of abnormal accruals.
4. Results
Sample discussion
Our primary sample consists of firms w ith available data in the intersection of the
2005 COM PUS TA T industrial annual files and the Center for Research in Security
Prices (CR SP) stock return files covering the period from 1983 through 2002. We
exclude financial institutions (SIC codes 6000-6999), utilities (SIC codes 4900-
4999), and firms incorporated outside the United States because they operate in
regulated industries or under different regulations and face a different set of tax
and/or book rules from other firms. We eliminate any firm-year observation in
which the fiscal year-end changes to ensure that observations are comparable
across years. We also exclude any firm-year observations w ith the absolute value of
the change in pre-tax book income or estimated taxable income greater than one to
avoid the influence of extreme values.^'* For the tax-planning analyses, we limit
our sample to firms with positive values for both the numerator (sum of current tax
expense over five years) and the denominator (sum of pre-tax income over five
years) from (8).^^ Finally, firm-year obse rvations must have sufficient data to allowus to estimate taxable income, pre-tax book income, and return variables as discussed
in section 3. These criteria result in a sample of 50,760 firm-years for the tax-
planning analyses using the accrual-based ETR, 24,558 firm-years using the
cash-based ETR, and 74.403 firm-years for the low earnings-quality analyses.26
The sam ples for the tax-planning analyses are smaller due to the calculation of the
tax-planning variable, ETR, described in (8). The sample based on cash-based ETR
is considerab ly smaller because cash taxes paid is available in the statement of cash
flows beginning in 1988.

8/7/2019 The Effects of Tax Planning and Earnings Quality
http://slidepdf.com/reader/full/the-effects-of-tax-planning-and-earnings-quality 12/41
26 Contemporary Accounting Research
pre-tax book income, APTBI. There is no consistent pattern in returns and changesin estimated taxable income, ATI, between high tax planners identified by E77? andall other firms. High tax planners identified by Cash ETR have both higher returnsand higher changes in estimated taxable income than all other firms.
Panel C of Table I provides descriptive statistics for our low earnings-qualitysample. The low earnings-quality sample has higher abnormal accruals (by con-struction) and a significantly lower change in pre-tax book income than all otherfirms. This latter evidence suggests our sample of low earnings-quality finn-yearsis skewed toward firms with negative changes in book income. We find no differ-ence in changes in estimated taxable income for the low earnings-quality firmsrelative to all other firms.^*^
Main results
Tables 2 and 3 present results for Hypothesis 1 with results based on our primarymeasure of tax p lanning, £77?, in Table 2 and our alternative measure. Cash ETR,
in Table 3. Table 4 presents the results for the low earnings-quality analysis. Weidentify significant differences across samples using both /-tests and Wilcoxon ranksum tests, which test whether the average value of adjusted R\axable income /adjuste
^~book income (or adjusted ^ 2 ^ ^ ,„^„,^ + ^^¿,,^ ¿„^^ ^ - adjusted /?2¿^^¿ .^^ ^^ ) fo
TABLE IDescriptive statistics
Pane l A: Sample descriptive statistics and tests for differencesplanning firms (defined using Book ETRs) and all o ther fimis*
Variables
ReturnOverall sampleHigh tax-planning fírmsAU othe r firms
A/To/Overall sampleHigh tax-planning firmsAll other firms
Ä77Overall sample
Significantdifference^
H T P ^ A O
H T P > A O
Mean
0.058
0.054
0.059
0.009
0.0130.008
0.008
s.d.
0.7140.756
0.704
0.1280.1280.128
0.119
in means across high tax-
25%quartile
- 0 . 3 7 2- 0 . 4 1 1
- 0 . 3 6 3
- 0 . 0 3 2- 0 . 0 3 4- 0 . 0 3 2
- 0 . 0 2 9
Median
- 0 . 0 6 6- 0 . 0 9 5- 0 . 0 6
0.0120.0130.012
0.007
75%quartile
0.303
0.3160.3
0.049
0.055
0.047
0.044

8/7/2019 The Effects of Tax Planning and Earnings Quality
http://slidepdf.com/reader/full/the-effects-of-tax-planning-and-earnings-quality 13/41
Taxable Income as a Performance Measure 27
TABLE 1 (Continued)
Panel B: Sample descriptive statistics and tests for differences in means across high
tax-planning firms (defined using Cash ETRs) and all other firms*
Variables
Return
Overall sample
High tax-planning firms
All other firms
APTBI
Overall sample
High tax-planning firms
All other firms
An
Overall sample
High tax-planning firms
All other firms
Cash ETR
Overall sample
High tax-planning firms
All other firms
Significant
difference^
HTP > AO
HTP>AO
HTP > AO
HTP<AO
Mean
0.086
0.144
0.072
0.009
0.022
0.006
0.005
0.015
0.003
0.3680.136
0.422
s.d.
0.752
0.866
0.722
0.125
0.12
0.127
0.11
O.IU
0.109
0.2160.079
0.202
25%
quartile
-0.364
-0.376
-0.361
-0.03
-0.018
-0.033
-0.027
-0.017
-0.031
0.2450.07
0.305
Median
-0.049
-0.03
-0.052
0.012
0.017
0.01
0.006
0.007
0.005
0.340.139
0.369
75%
quartile
0.338
0.408
0.324
0.046
0.056
0.044
0.039
0.042
0.038
0.4260.193
0.456
Panel C: Sample descriptive statistics and tests for differences in means across high
abnormal accruals firms and ail other firms^
Variables
Return
Overall sample
High accrual firms
All otfier firms
àPTBl
Overall sample
High accrual firms
All other firms
AnOverall sample
Significant
difference*
HA-»AO
HA<AO
Mean
-0.014
-0.019
-0.013
0.002
-0.007
0.005
0.004
s.d.
0.819
0.964
0.779
0.184
0.223
0.173
0.157
25%
quartile
-0.507
-0.626
-0.476
-0.053
-0.084
-0.047
-0.034
Median
-0.157
-0.235
-0.142
0.008
0.006
0.008
0
75%
quartile
0.246
0.26
0.243
0.055
0.071
0.052
0.042

8/7/2019 The Effects of Tax Planning and Earnings Quality
http://slidepdf.com/reader/full/the-effects-of-tax-planning-and-earnings-quality 14/41
28 Contem porary Accoun ting Research
TABLE 1 (Continued)
Notes:
Th e overall sample consists of 50,760 fim-years from 1983 to 2002. Th e "high lax-planning firms" subsample consists of the 9,677 firm-years whose Book ETRs
over five years are in the bottom quintile, ranked by two-digit SIC industry and
year. The "all other firms" subsample consists of the remaining 41 ,083 firm-years
whose Book ETRs over five years are in the top four q uintiles, ranked by two-digit
SIC industry and year.
'^ Significant differences between the high-tax planning (H TP) firm-years and all other
(AO) firm-years are based on /-tests of m eans and Wilcoxon rank sum tests of
medians (p value < 0.05).* The overall sample consists of 24.558 firm-years from 1992 to 2002 . The "high tax-
planning firms" subsample consists of the 4,659 firm-years whose Cash ETRs
over five years are in the bottom quintile. ranked by two-digit SIC industry and
year. The "all other firms" subsam ple consists of the remaining 19,899 firm-years
whose Cash ETRs over five years are in the top four quin tiles, ranked by two -digit
SIC industry and year.
5 The overall sample consists of 74,403 firm-years from 1983 to 200 2. The "high
accrual firms" subsam ple consists of the 14,662 firm-ye ars whose absolute valuesof abnormal accruals are in the top quintile, ranked by two-digit S IC industry and
year. The "all other firms" subsample con sists of 59,741 firm-years whose
absolute value of abnormal accruals are not in the top quintile, ranked by two-
digit SIC industry and year.
* Significant differences between the high accrual (HA ) firm-years and all other (AO)
firm-years are based on (-tests of means and Wilcoxon rank sum tests of medians
(/7-vaIue < 0.05).
Return = tbe buy-and-bold market-adjusted retum to firm; overthe 16-month return
window starting at the beginning of fiscal year / and ending 4 mon ths after tbe end
of fiscal year i.
APTBI = the change of pre-tax book income deflated by the market value of equity at the
start of fiscal year / where pre-tax book incom e is (data 170) minus m inority
interest (data 49).
A77 = tbe change in estimated taxab le incom e deflated by tbe market value of equity at the
start of fiscal year /. Taxable income is the sum of federal tax expense (data 63)
and foreign tax expense (data 64) grossed up by the top U .S. statutory tax rate

8/7/2019 The Effects of Tax Planning and Earnings Quality
http://slidepdf.com/reader/full/the-effects-of-tax-planning-and-earnings-quality 15/41
Taxable Income as a Performance M easure 29
TABLE 1 (Continued)
Cash ETR = cash taxes paid (data 317) divided by pre-tax income (data 170) each
summed over five years ftxjm - 4 through t. If data 317 is missing, we assigncash taxes paid the value of current tax expense (data 16 - data 50) as in Dyreng
et al. 2008.
{Abnormal Accruals] = the absolute value of abnormal accraals calculated as the
difference between total accruals and modified Jones model nomial accruals
estimated cross-sectionally annually and by two digit SIC code.
high tax-planning firms or high accrual firms is significantly different from that ofall other firms.28
In panel A of Table 2, we find that the relative information content of estimated
taxable income for high tax-planning firms is much lower (p < O.OOl. o ne-tailed
i-test) compared with all other firms. Specifically, estimated taxable income for
high tax-planning firm-years only explains 40.3 percent of the annual return varia-
tion explained by book income (i.e., the adjusted R'^¡axable intome ^^ î ^^^^ ^\vak
income = 40.3 percent) versus 74.2 percent for all other firms (i.e., the adjusted
R^axabie i«ro^./adjusted R\,^k ,-„,„„, = 74.2 percent). Results for the tax-planning
firm-years identified by Cash ETR in panel A of Table 3 are similar in tbat the high
tax-planning firm-years only explain 40.9 percent of the annual return variation
explained by book income com pared with 80.3 percent for all other firms.
Table 2 reports the average adjusted R'^muo pre-1993 , post-1992, and across
all sample years. U.S. Treasury (1999) and the G overnment Accoun tability Office
(GAO) (2003) suggest that tax shelter activity increased dramatically beginning in
the early 1990s. Consistent with increased aggressive tax planning during this
period, results suggest that the relative information content of estimated taxable
income for high tax-planning finns versus other firms decreased po st-1992. Specif-
ically, the difference in the adjusted R'^ ratio for high tax-planning firms versus all
other firms decreased from -0 .2 4 7 (i.e., 0.402 - 0.649) pre-1993 to -0 .4 3 0 (i.e.,
0.405 - 0.835) post-1992 (p-value = 0.03, one-tailed /-test). We note that the dif-
ference in the adjusted /?2 ratio for high tax-p lann ing firms ve rsus all other firms
pre-1993 to post-1992 is attributable toan increase in the adjustedii^ratio for "all
other firms" post-1992 . This result is consistent with the estimated taxable income
of bigh tax-planning firms becoming relatively less informative post-1992. How-
ever, it is possible that other events explain the larger differences in the relativeinformation content of estimated taxable income post-1992 for high tax-planning

8/7/2019 The Effects of Tax Planning and Earnings Quality
http://slidepdf.com/reader/full/the-effects-of-tax-planning-and-earnings-quality 16/41
30 Contem porary Accoun ting Research
Os m CJ
^ 00 r-;ö ö ö
— r- o— o oo o o
in fN 00
O o o
00 — Os— (N —í
00 VI
p o o^ " * • ^
o d d
r ui y?
P P HO d d
S 00 —in m
m r- m
r* t" /d d d
o r- 00Os (N oOs Tf (S I
§ .-ao
• a
q oÖ ö Ö
OO «o —1
r- rf \D
o o o
O r* ^
Ö -^ d
r-' (N i/~i
d d d
(N Os ofo o r-OO — Os
—' «M' r J
4^ ++ a»
d d d
O o o
00 (N p— (N H
O O O
o r- ocOs <N oos r t (N
•H
I ; '

8/7/2019 The Effects of Tax Planning and Earnings Quality
http://slidepdf.com/reader/full/the-effects-of-tax-planning-and-earnings-quality 17/41
Taxable Income as a Performance M easure 31
TABLE 2 (Continued)
Notes:
* The overall sample consists of 50.760 firm-years from 1983 to 2002 . The "high tax-planning firms" subsample consists of the 9,677 finn-years whose Book ETRs overfive years are in the bottom quin tile, ranked by two-digit SIC industry and year. The"all other firms" subsample consists of the remaining 41,083 firm-years whoseBook ETRs over five years are in the top four quintiles, ranked by two-digit SIC
industry and year.
+ /T-value of < 0.01 (one-tailed Mest) based on the distribution of coefficients across
years (i.e., Fama-McBeth).
Í 0.402 < 0.649. /7-value - 0.001 (/-test), or/7-value = 0.002 (Wilcoxon rank sumtest), one-tailed test computed using the pre-1993 yearly values ofR~j, IR^PJBI forhigh tax-ptanning firms versus all other firms.
§ 0.405 < 0.835, p-value < 0.001 (f-test), or p-value < 0.001 (Wilcoxon rank sumtest), one-tailed test computed using the posI-1992 yearly values of R\¡/R^PTBI
for high tax-planning firms versus all other firms.
* 0.403 < 0.742, /j-value < O.OOI (f-test), orp-va lue < 0.001 (Wilcoxon rank sumtest), one-tailed test computed using the values of R^I/R-PTBI for h'gh tax-planning firms versus all other firms.
'* p-va lue of <0 .0 5 (one-tailed M est) ba.sed on the distribution of coefficients acrossyears (i.e., Fama-McBeth).
t t 0.002 < 0.006. p-valu c ^ 0.038 (i-test), or p-value = 0.013 (Wilcoxon rank sum test),one-tailed test computed using the pre-1993 yearly values of R pjß/ +TI~ ^ P TBIfor high tax-planning firms versus all other firms.
*t 0.006 < 0.015. p-value = 0.006 (/-test), orp -va lue = 0.009 (Wilcoxon rank sum test),one-tailed test computed using the post-1992 yearly values oiR'^pfBi + TI~ ^^PTBI
for high tax-planning firms versus all other firms.
§^ 0.004 < O.OI 1. p-value = 0.003 (i-test), or/j-value = 0.001 (Wilcoxon rank sum test).one-tailed test computed using the yearly values oíR^xBl + TI ~ ^^PTBl ^^^ ^ ' S ^tax-planning firms versus all other firms.
Relative information content = R\¡ IRhTB¡ = ^ ^ ^ ^ °f *^ adjusted Ä^from a regression ofReturn on the change in estimated taxable incom e (AT /) to the adjusted Ä^from aregression of Return on the change in pre-tax book income (ÙiPTBl).
R'^pjgi = adjusted Ä^from a regression of Return on the change in pre-tax book income
(APTBI).
{(2^^ = adjusted/i-from aregression offie/M /Ti on the change in estimated taxableincome (A 7/).

8/7/2019 The Effects of Tax Planning and Earnings Quality
http://slidepdf.com/reader/full/the-effects-of-tax-planning-and-earnings-quality 18/41
32 Contemporary Accounting Research
on
ft;
0 0
d
—d
-• n
O(N
O00d
d
p
B
fo
-a
J
t u
d d
00 00
00 OO
r- 00
o o
• I - - I-
— ^
•o .sa S
I -â' M
O
c2icoso
• a
o
cm
5 ^p pÖ d
o o
s
d d
d d
ON t
o o

8/7/2019 The Effects of Tax Planning and Earnings Quality
http://slidepdf.com/reader/full/the-effects-of-tax-planning-and-earnings-quality 19/41
Taxable Income as a Performance Measure 33
TABLE 3 (Continued)
Notes:
The overall sample consists of 24,558 firm-years from 1992 to 2002. Tbe "high tax-planning firms" subsample consists of the 4,659 firm-years whose Cash ETRs overfive years are in the bottom quintile, ranked by two-digit SIC indusU^ and year. The"all other firms" subsamp le consists of the remaining 19,894 firm-years whoseCash ETRs over five years are in the top four quintiles, ranked by two-digit SICindustry and year.
t /7-value of ^ 0.01 (one-tailed f-test) based on the distribution of coefficients across
years (i.e., Fama-McBeth).
Í 0.393 < a.818./>-vaIue < 0.001 (/-test), orp -va lue < 0.001 (Wilcoxon rank sum test),one-taited test computed using tbe post-1992 yearly values oiR^j¡IR-pjBi for
high tax-planning firms versus all other firms.
§ 0.409 < 0,803. p-value < 0.001 (Mest). or /i value - 0.001 (Wilcoxon rank sum test),one-tailed test computed using the yearly values of R\¡IR-pTB¡ t"r high tax-planning firms versus all other firms.
" 0.005 < 0.016. /ï-value - 0.001 (Mest). orp -va lue = 0.001 (Wilcoxon rank sum test),one-tailed test computed using tbe post-1992 yearly values of Ä ^ r« / + r/ ~ ^^PTltl
for high tax-planning firms versus all other firms.0.005 <0.016.p-va]ue = 0.001 (/-test), or/?-value -0.001 (Wilcoxon rank sum test),
one-tailed test computed using the yearly valuesof/î-prfi/+ n " RyTBi^*^^^^S^
tax-planning firms versus all other firms.
Variables are as defined in Tables I and 2.
favor of finding an increased difference in the relative information content of esti-mated taxable income post-1992. Nonetheless, we cannot eliminate this possibility.
The results from our second association test reported in panel B of Table 2 arealso consistent with the incremental information in estimated taxable income beingimpaired for high tax-planning firm-years. Adding the change in estimated taxableincome to the regression of the change in pre-tax income on retums increases theadjusted R- by 0.004 (a 2.5 percent increase in explanatory power) for high tax-planning firms compared with an Increase in the adjusted R^ by 0.011 (a 7.3 percentincrease in explanatory power) for all other ñrms.29 Results for the tax-planningfirm-years based on Cash ETR in panel B of Table 3 generate the same inference.Adding the change in estimated taxable income to the regression of retums on thechange in book income increases the adjusted R^ by 0.5 percent for high tax-

8/7/2019 The Effects of Tax Planning and Earnings Quality
http://slidepdf.com/reader/full/the-effects-of-tax-planning-and-earnings-quality 20/41
34 Contemporary Accoun ting Research
We draw two conclusions from the analysis of the effects of tax planning on
the information content of est imated taxable income. First , consistent with
Hypothesis 1, we find that relative and incremental information content of taxable
income is impaired for high tax-planning firm-years. From a tax policy perspec-tive, the significant decline in the relative information content of taxable income
(e.g., from 74.2 percent for all other firms to 40.3 percent for high tax-planning
firms) suggests that tax planning results in a taxable income number that does not
map well into the market's perception of firm perfonnance. Second, although we
find a statistically significant decline in the increm ental inform ation conten t for
high tax-planning firms, the incremental information content of estimated taxable
income, on average, is moderate. Thus, the incremental information loss to inves-
tors associated with tax planning is quite modest.
Hypothesis 2 predicts that the relative information content of taxable income
to book income is higher for firm-years with low earnings quality. Results in panel
A of Table 4 confirm this expectation. Specifically, for firm-years with large abnor-
mal accruals, estimated taxable income explains 66.2 percent of the annual return
variation explained by book income (i.e., the adjusted R^t^^^i^ ¿„(.om^/adjusted
^^ook income = 66.2 percent) versus 49.8 percent for all other firms. As well, the
additional explanatory power of adding the change in estimated taxable income to
a regression of returns on a change in pre-tax income is larger for the firm-years
with low earnings quality as reported in panel B of Table 4. As before, the differ-ence in explanatory power is modest (0.009 versus 0.005) but significant in the pre-
dicted direction (p-value = 0.062, one-tailed test). Overall, the results from Table 4
are consistent with Hypothesis 2, which predicts that the information content of tax-
able income relative to book income is higher for firms with low-quality earnings.
The pre-1993 and post-1992 analyses in Table 4 provide an opportunity to
evaluate changes in the information content of estimated taxable income for low
earnings-quali ty f irms over t ime. Bergstresser and Phil ippon (2006) suggest
increased concern of opportunistic earnings management/poor earnings qualityduring the latter period. Consistent with decreased earnings quality during this
period, results suggest that the relative information content of estimated taxable
income for low earnings-quality firms versus other firms increased significantly
post-1992. Specifically, the difference in adjusted /f^ratio for low earnings-quality
firms versus all other firms increased from 0.008 (i.e., 0.536 - 0.528) pre-1993 to
0.319 (i.e.. 0.788 - 0.469) post-1992 (p-value = 0.033, one-tailed /-test).
We note that the explanatory power of pre-tax book income for returns
decreased across all groups from the pre-1993 to post-1992 period (i .e., theadjusted R\o„k income reported in Tables 2 and 4 is lower in the post-1992 period

8/7/2019 The Effects of Tax Planning and Earnings Quality
http://slidepdf.com/reader/full/the-effects-of-tax-planning-and-earnings-quality 21/41
Taxable Income as a Performance Measure 35
sCJ
O
abn
1 /
u
O
c
¿co
ron
J=
00 Os 00
ts -o O«
d d d
vO fS os-H 00 osOs p Os
O ~ d
en '* OOo [ 00_ p p
^.^• HT. *
sO 00 O)r^. 00 >£>
p p ps Ö Ö
— Os mO -o 00
P P
g :: -
+ K
r- O t2 S gC¿ Ö Ö
X) ri v,— Os Orn -^ -^
d d d
— Os pOs 'O mOs p pÖ — —
o r-— q
os in !^r- o- Xs£J n Os
in ^p OO— O
r^ 00 in
d d d
(N so Osin •^ OsOs OO 00

8/7/2019 The Effects of Tax Planning and Earnings Quality
http://slidepdf.com/reader/full/the-effects-of-tax-planning-and-earnings-quality 22/41
36 Contemporary Accounting Research
TABLE 4 (Continued)
Notes:
The overall sample consists of 74,403 firm-years from 1983 to2002. The "highabnormal accrual firms" subsample consists of the 14.662 firm-years whoseabsolute values of abnormal accruals are in the top quintile, ranked by two-digitSIC industry and year. The "all other finns " subsam ple consists of 59,741 firm-years whose absolute value of abnormal accruals are not in the top quintiie.ranked by two-digit SIC industry and year.
+ p-value of s 0.01 (one-tailed /-test) based on the d istribution of coefficients acrossyears (i.e., Fama-M cBeth).
Í 0.536 > 0.528. p-value - 0.460 (/-test), orp-value - 0.396 (Wilcoxon rank sum test),one-tailed test computed using the pre-1993 yearly values of R ~ T ¡ I R ~ P T B I forhighabnormal accruals firms versus all other firms.
§ 0.788 > 0.469. p-value = 0.025 (/-test), or /)-value - 0.013 (Wilcoxon rank sum test),one-tailed test computed using the post-1992 yearly values oíR^j¡ IR\jg¡ for
high abnormal accruals firms versus allother firms.
" 0.662 > 0.498. p-value = 0.034 (/-test), or/j-value - 0.070 (W ilcoxon rank sum test),one-tailed test computed using the yearly values oíR'^¡/R^pj-gj forhigh abnormal
accruals firms versus all other firms.0.004 > 0.004. p-value = 0.427 (Mest), orp-value = 0,081 (Wilcoxon rank sum test).
one-tailed test computed using the pre-1993 yearly values oíR^pj-g¡ + 7/ - R ^ P T B Í
for high abnormal accruals firms vs. all other firms.
t+ 0.015 > 0.007. p-value - 0.025 {Mest). orp -valu e = 0.038 (Wilcoxon rank sum test).one-tailed test computed using the post-1992 yearly values oiR'^pjgj^jf
- R ~ p T B ¡ for high abnormal accruals firms versus all other firms.
** 0.009 > 0.005. p-value - 0.062 (Mest), orp-va lue = 0.328 (Wilcoxon rank sum test),one-tailed test computed using the yearly values oíR^pjg¡ +j¡- R^pjß/ for high
abnormal accruals firms versus allother firms.
Variables are as defined in Tables I and 2.
particular event would systematically bias results in favor of our predictions. We
perform numerous sensitivity tests in the next section to ensure the robustness of
our results.

8/7/2019 The Effects of Tax Planning and Earnings Quality
http://slidepdf.com/reader/full/the-effects-of-tax-planning-and-earnings-quality 23/41
Taxable Income as a Performance M easure 37
income to book income for groups of firms segregated into quintiles using our
measures of tax planning and earnings quality.
Classification of low earnings-quality firms: An analysis of firmssubject to SEC enforcement actions
To further test the relative information content of taxable income when book
income is of lower quality, we collect a sample of firms subject to SEC enforcement
action for allegedly overstating earnings. This sample does not rely on estimated
accruals to identify firms with lower accounting quality and, thus, provides a
strong test of Hypothesis 2. Erickson, Hanlon, and Maydew (2(X)4) find that firms
are willing to pay additional tax for overstated earnings, which suggests that tax-
able income for these firms may also be of lower quality. Thus, it is an empiricalquestion whether taxable income is more informative in this setting.
Following the method in Dechow et al. 1995, 1996, we conducted a keyword
search for "section 13(a)" in the Accounting and Auditing Enforcement Releases
(AAER) Database through Lexis-Nexis. We searched íorAAERs issued between
1994 and 2004 with an identified manipulation between 1989 and 2002. We elimi-
nated releases involving violation of auditing standards, multiple releases involving
the same firms, and firms not having stock returns, pre-tax book income, or taxable
income. The final sample consists of 246 firm-years subject to enforcement actions
by the SEC between 1989 and 2002 for overstating ea rnings. Resu lts presented in
Table 5 show that the sample has an adjusted /f ^ ratio of 0.901 and that adding the
change in estimated taxable income to the regression of returns on the change
in pre-tax income increases the adjusted /?2 by 0.019 (a 37.2 percent increase in
explanatory power) for these firms. By comparison, the adjusted R'^ ratio for "'all
other firms" reported in the last column of panel A of Table 4 is significantly lower
(0.498 < 0.901,/ï-value < 0.001, one-tailed i-test).^« Likewise, the incremental
information content of estimated taxable income for "all other firms" reported in
the last column of panel B of Table 4 is significantly lower (0.005 < 0.019./?-value< 0.001, one-tailed i-test). In sum, results suggest that taxable income has signifi-
cant relative and incremental information content for firms overstating earnings.
Classification of high tax-planning firms
A potential issue with our classification of tax-planning firms is that we may identify
firms that are managing earnings upward instead of tax planning (i.e., managing
taxable income downward). If firms manage earnings upward but do not simul-
taneously increase their current tax expense, then our measure of taxable incomeis low relative to book income, and the resulting book-tax difference results not

8/7/2019 The Effects of Tax Planning and Earnings Quality
http://slidepdf.com/reader/full/the-effects-of-tax-planning-and-earnings-quality 24/41
38 Contemporary Accounting Research
19
I
I
J
O .¡2
5b S
l §
'2 ^00 ,2
O
d
• s
.o
a.. "»NI u
a; c.
fc-s
— c =
« ca g
i*. 3 - -
o
•a
>
B

8/7/2019 The Effects of Tax Planning and Earnings Quality
http://slidepdf.com/reader/full/the-effects-of-tax-planning-and-earnings-quality 25/41
Taxable Income as a Performance M easure 39
mitigate the concern that the tax-planning sample is characterized by firms m anag-
ing earnings, we examine the intersection of the high tax-planning and low earn-
ings-quality samples. We note that only 17 percent of the high tax-planning firms
(i.e., 3.4 percent of the total sample) are classified as low earnings-quality firms.All inferences remain the same after excluding these firms from our analyses.
As an alternative method of identifying high tax-planning firms, we use the
parameter estimates in the "investments in tax planning" m odel in Mills, Erickson,
and Maydew 1998 to classify firms as high tax-planning firms. Using confidential
survey data for a sample of large corporations. Mills et al. (1998) find that tax-
planning costs (i.e., in-house and outsourced tax-related expenditures) decrease
with firm size and increase with foreign operations, capital intensity, and the firm's
number of legal entities. They find positive but not statistically significant associa-tions between tax-related expenditures and firm leverage and inventory. We use the
following parameter estimates from their model to identify high tax-planning
firms:
PLANNING = 0.52 + (-0.09)*5/Z£' + 0.15*EOREIGN + 0.22*LEVERAGE
+ 0.59*CAPITAL + 0.39*INVENTORY + O.Q006*ENTnr
where: ' ' '
PLANNING = the sum of tax department salaries and outside legal, accounting,
and other tax-planning expenditure reported in Mills et al. 1998,
expressed as a percentage of selling, general, and administrative
(SG&A) expenses.
SIZE = the natural log of total sales (data 12) plus 1.
FOREIGN = a dummy variable equal to 1 if [dom estic income (data 272)]/
[domestic income (data 272) + foreign income (data 273)]< 0.5. We note that Mills et al. (1998) define FOREIGN equal to
1 if their sample firm reports foreign assets.
LEVERAGE = long-term debt (data 9) divided by total assets (data 6).
CAPITAL = property, plant, and equipment (data 8) divided by total assets
(data 6).
INVENTORY = inventory (data 3) divided by total assets (data 6).
Because the num ber of subsidiaries, branches, and joint ventures per com pany

8/7/2019 The Effects of Tax Planning and Earnings Quality
http://slidepdf.com/reader/full/the-effects-of-tax-planning-and-earnings-quality 26/41
40 Contemporary Accounting Research
and two-digit SIC industry and classify firms in the top 20 percent of PLANNING
per year and industry as high tax-planning firms.3' W e then reestimate our regres-
sion analyses comparing the information content of estimated taxable income for
high tax-planning firms with all other firms. Inferences based on these analyses are
identical to those reported in the tables (i.e., the relative and incremental informa-
tion content of estimated taxable incom e declines for high tax-planning firms).
Measurement error in taxable income
As discussed in section 3, we calculate taxable income from income statement dis-
closures. We perform several sensitivity tests to assess whether our results are
robust to various sources of measurement error in taxable income. Our first two
tests address the fact that tax expense is reported after tax credits (e.g., investmenttax credit, research and development, and foreign tax credit), which reduces cur-
rent tax expense and understates our measure of taxable income relative to actual
taxable income. In addition, for firms with foreign operations, there is an issue as
to which tax rate is appropriate to use in grossing up tax expense to arrive at tax-
able income. To the extent that tax expense reflects amounts paid to foreign gov-
ernments at different tax rates from those in the United States, our measure of
taxable income contains measurement error. We address these issues by reestimat-
ing our analyses after eliminating multinational firms and firms with high levels ofresearch and development activities.^^ ^f^Q classify firms as multinationals if their
ratio of domestic income (data 272) over domestic plus foreign income (data 273)
is less than or equal to 50 percent. We classify firms as high research and develop-
ment firms if their ratio of research and development expenses (data 46) to sales
(data 12) is in the upper quartile. Inferences remain the same.
We also employ an alternative specification of taxable income (taxable income
without permanent differences) that may be less susceptible to the measurement
error concerns associated with tax credits and foreign taxes. We estimate taxableincome without permanent differences (TIPD) as follows:^^
TIPD j, = iPTB j, - Mlj,) - {DTE j,/str,) (10).
where PTB is pre-tax book income (data 170), MI is minority interest (data 49),
DTE is deferred tax expense (data 50) for firm; at time /, and str is the statutory tax
rate applicable at time i. TIPD represents a measure of taxable income before per-
manent differences. We reestimate our analyses using TIPD from (10) in place of
TI from ( 1 ). Inferences remain the sam e, suggesting that measuremen t error related

8/7/2019 The Effects of Tax Planning and Earnings Quality
http://slidepdf.com/reader/full/the-effects-of-tax-planning-and-earnings-quality 27/41
Taxable Income as a Performance M easure 41
losses to estimate taxable incom e. To mitigate concerns associated with uniformly
using the statutory U.S. tax rate in this calculation, we estimate our analyses
replacing our estimate of taxable income with the three components of the taxable
income calculation: current federal tax expense (FTE), current foreign tax expense(FOTE), and the change in net operating loss (ANOL). Results are also robust
when we reestimate these analyses using cash taxes paid instead of current federal
and foreign tax expense.
Segregation into cashflows and accruals
In our primary analysis, we find that the information content of estimated taxable
income relative to book income is significantly lower for high tax-planning firms
and significantly higher for low earnings-quality firms than for all other firms. Insupplemental analyses, we test whether these relations hold when we separate the
change in book income into the change in book accruals and the change in cash
fiows, and separate the change in estimated taxable income into the change in esti-
mated tax accruals and the change in cash flows. Taxable income is based on
accrual concepts, but some of the rules for revenue recognition and ded uctions are
based on cash flows, such that taxable income is a mixture of accrual and cash now
concepts that vary by transaction. Thu s, there are substantial differences between
taxable income and both cash flows and book income. Hanlon et al. (2005) report
that both book and taxable income exhibit greater relative and incremental infor-mation content than cash flow from operations in their sample. Their findings are
consistent with prior research, which shows that book income is relatively more
informative to investors than cash flows from operations, which suggests that, on
average, accruals are beneficial to investors (Dechow 1994). The evidence in Han-
lon et al. 2005 is also consistent with estimated taxable income being a useful
measure for investors.
We identify cash flows from a firm's cash flow statement (data 308).- '* Results,
in general, are consistent with those reported in the tables. The differences ininformation content of estimated tax accruals and book accruals are statistically
significant for high tax-planning firms relative to all other firms (i.e., tax accruals
are less informative for high tax-planning firms). For the low earnings-quality
firms, we find that, post-1993, the information content of tax accruals relative to
book accruals is significantly higher for low earnings-quality firms than for all other
firms. In sum, results suggest that the relation between cash flows and estimated
taxable income does not unduly influence our primary findings.
Hedge portfolio return tests

8/7/2019 The Effects of Tax Planning and Earnings Quality
http://slidepdf.com/reader/full/the-effects-of-tax-planning-and-earnings-quality 28/41
42 Contemporary Accounting Research '
of earnings within each portfolio" (Ali and Hwang 2(X)0, 13). Because market vol-
atility across time or across samples is less of a concern in our setting, we use test
statistics based on the adjusted R^ (i.e., the adjusted R^ ratio) in our primary tests.
Nevertheless, in sensitivity tests, we employ an approach similar to that employedin prior literature (e.g ., Ali and Hwang 20(X); Alford et al. 1993; Francis and Schip-
per 1999) by calculating the following hedge portfolios:
1. TIHP (taxable-income-based hedge portfolio): For each group (tax planners
versus all other firms for Hypothesis 1, or low earnings-quality firms versus all
other firms for Hypothesis 2), we rank the change in taxable income by year
and two-digit SIC industry and take a long position in firms ranked in the top
30 percent and a short position in firms ranked in the bottom 30 percent.
2. BIHP (book-income-based hedge portfolio): For each group (tax planners ver-
sus all other firms for Hypothesis 1, or low earnings-quality firms versus all
other firms for Hypothesis 2), we rank the change in pre-tax book income by
year and two-digit SIC industry and take a long position in firms ranked in the
top 30 percent and a short position in firms ranked in the bottom 30 percent.
3. RHP (return-based hedge portfolio): For each group (tax planners versus all
other firms for Hypothesis 1, or low earnings-quality firms versus all other
firms for Hypothesis 2), we rank the change in returns by year and two-digit
SIC industry and take a long position in firms ranked in the top 30 percent and
a short position in firms ranked in the bottom 30 percent.
With these variables we calculate the following measures for each group of
firms (tax planners and all others for Hypothesis 1 and low earnings-quality firms
and all others for Hypothesis 2):
B_ret = BIHP/RHP = returns from the book income hedge portfolio divided by
returns from the retum -based hedge portfolio; i
T_ret= TIHP/RHP ~ returns from the taxable income hedge portfolio divided by
returns from the retum -based hedge portfolio;
T/B = TIHP/BIHP = returns from the taxable income hedge portfolio divided by
returns from the book income hedge portfolio.
BIHP {TIHP) represents the total realized returns that could be earned for theyear if book (taxable) income is known in advance (i.e., if one had perfect fore-

8/7/2019 The Effects of Tax Planning and Earnings Quality
http://slidepdf.com/reader/full/the-effects-of-tax-planning-and-earnings-quality 29/41
Taxable Income as a Performance M easure 43
Inferences for Hypothesis 1 and Hypothesis 2 are similar Io those reported ¡n our
primary tests. Specifically, the returns earned from perfect foresight of taxable
income relative to retums earned from perfect foresight of book income decrease
for h igh tax-planning firms and increase for low eamings-quality firms.
The relative information content of estimated taxable income across quintiles
In our main analyses, we designate firms in the bottom (top) quintile of current
effective tax rates (absolute value of abnormal accruals) in each two-digit SIC
industry and year as high tax-planning (low earnings-quality) firms. To evaluate
further the relation between the information content of taxable income and tax
planning and earnings quality, we investigate how the relative information content
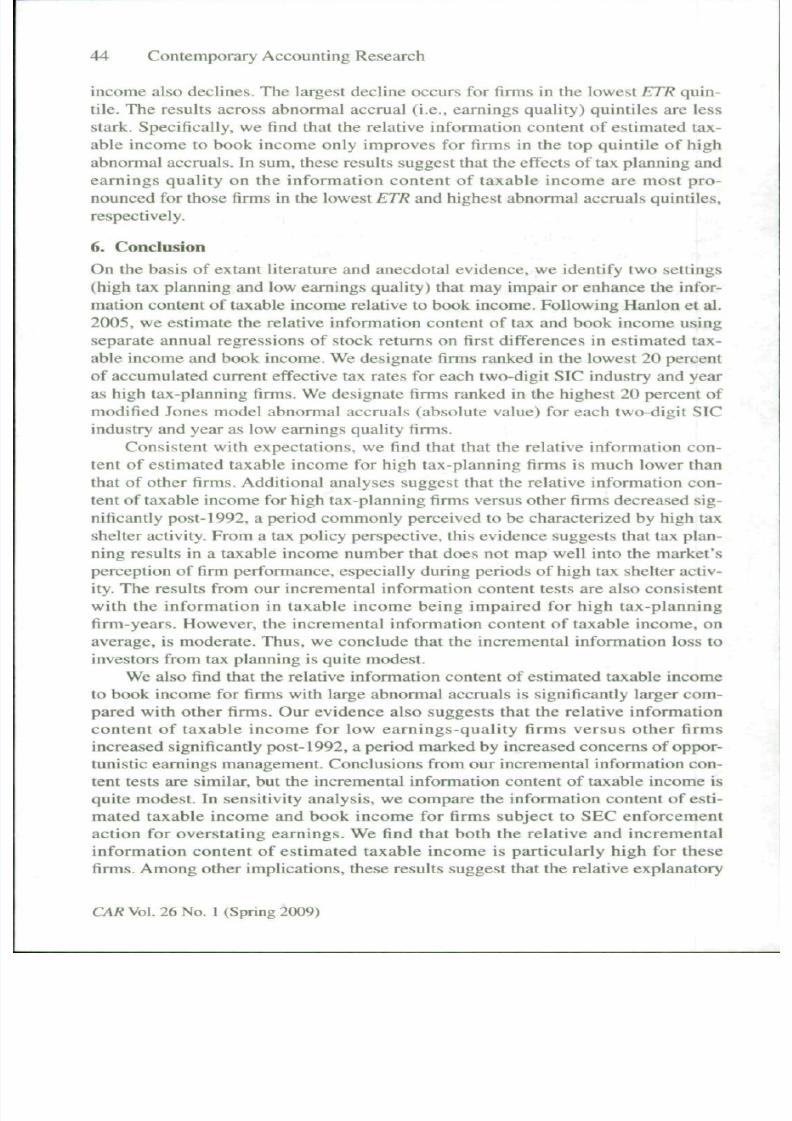
of estimated taxable income to book income changes across ETR and abnormalaccrual quintiles. Figure 1 indicates that, in ge neral, as the current effective tax rate
decreases, the relative information content of estimated taxable income to book
Figure 1 Tbe relative infonnation content of taxable income to book income across ETR
and abnormal accrual quintiles (from the higbest to tbe lowest ETR quintile and
lowest to tbe bigbest abnormal accruals quintile)
90% -
70% -
60% -
50% -
40% -
30 % -
20% -
10% -
0%
Cash ETR
I I I \ \
8/7/2019 The Effects of Tax Planning and Earnings Quality
http://slidepdf.com/reader/full/the-effects-of-tax-planning-and-earnings-quality 30/41
44 Contem porary Accoun ting Research
income also declines. The largest de cline occurs for firms in the lowest ETR quin-
tile. The results across abnormal accrual (i.e., earnings quality) quintiles are less
stark. Specifically, we find that the relative information content of estimated tax-
able income to book income only improves for firms in the top quintile of highabnormal accruals. In sum, these results suggest that the effects of tax planning and
earnings quality on the information content of taxable income are most pro-
nounced for those firms in the lowest ETR and highest abnonnal accruals quintiles,
respectively. . . ;
6. Conclusion . ' I'
On the basis of extant literature and anecdotal evidence, we identify two settings
(high tax planning and low earnings quality) that may impair or enhance the infor-mation content of taxable income relative to book income. Following Hanlon et al.
2005, we estimate the relative information content of tax and book income using
separate annual regressions of stock returns on first differences in estimated tax-
able income and book income. We designate firms ranked in the lowest 20 percent
of accumulated current effective tax rates for each two-digit SIC industry and year
as high tax-planning firms. We designate firms ranked in the highest 20 percent of
modified Jones mode! abnormal accruals (absolute value) for each two-digit SIC
industry and year as low earnings quality firms.
Consistent with expectations, we find that that the relative information con-
tent of estimated taxable income for high tax-planning firms is much lower than
that of other firms. Additional analyses suggest that the relative information con-
tent of taxable income for high tax-planning firms versus other firms decreased sig-
nificantly post-1992, a period commonly perceived to be characterized by high tax
shelter activity. From a tax policy perspective, this evidence suggests that tax plan-
ning results in a taxable income number that does not map well into the market's
perception of firm performance, especially during periods of high tax shelter activ-
ity. The results from our incremental information content tests are also consistentwith the information in taxable income being impaired for high tax-planning
firm-years. However, the incremental information content of taxable income, on
average, is moderate. Thus, we conclude that the incremental information loss to
investors from tax planning is quite modest.
We also find that the relative information content of estimated taxable income
to book income for firms with large abnormal accruals is significantly larger com-
pared with other firms. Our evidence also suggests that the relative information
content of taxable income for low earnings-quality firms versus other firmsincreased significantly post-1992, a period marked by increased concerns of oppor-

8/7/2019 The Effects of Tax Planning and Earnings Quality
http://slidepdf.com/reader/full/the-effects-of-tax-planning-and-earnings-quality 31/41
Taxable Income as a Performance M easure 45
power of taxable income increases substantially in those settings where managers
may have used opportunistic discretion in reporting book income.
This study makes several contributions. Consistent with speculation in Desai
2006, results suggest that tax planning obscures the relation between taxableincome and firm performance (as proxied by annual stock returns). Second, our
analyses contribute to the recent literature investigating taxable income as an alter-
native performance measure. Consistent with speculation in Seida 2003, results
suggest that taxable income becomes a more useful performance measure in set-
tings where management may have used discretion in reporting book income.
Nonetheless, consistent with Hanlon et al. 2005, we find that book income better
explains annual stock returns, on average, for firms with large abnormal accruals.
In sum, our evidence suggests that investors view taxable income as a supplemen-tal, and not superior, performance measure. Third, results suggest that tax planning
and low eaming.s quality have contrasting effects on the information content of tax-
able income. Given that both tax planning and events that result in low earnings
quality can generate book-tax differences, our findings may be particularly useful
for researchers investigating book-tax differences as a measure of discretion or
earnings quality. In particular, our analyses suggest that existing tax-planning and
low earnings-quality proxies are sufficiently powerful to detect settings where
book-tax differences are likely attributable to discretion in reporting book or tax-
able income. Finally, evidence that taxable income becomes less informative forhigh tax-planning firms and more informative for firms with low earnings quality
suggests that investors, at least in part, are able to distinguish sources of book-tax
differences. In the low earnings-quality setting, this evidence is consistent with the
market using taxable income to assess firm performance when earnings may be
questionable.
Our study is subject to certain limitations. As discussed in section 3 ("Research
Methods") and section 5 ("Sensitivity Analyses"), we estimate taxable income
from publicly available financial statements. While this calculation contains meas-urement error, it is the measure that is available to the market, which is pertinent in
our setting. We also identify tax-planning firms using a firm's effective tax rate.
The effective tax rate is problematic because, among other things, it measures
actual taxes paid with error, and it excludes benefits related to employee stock
option deductions. We address these limitations by accum ulating the effective tax
rate over five years and using alternative measures of tax planning, alternative
specifications of taxable incom e, and sensitivity analyses. We group firms accord-
ing to abnormal accruals, which is a somewhat nebulous measure of earningsquality. We use abnormal accruals to define earnings quality because we are inter-

8/7/2019 The Effects of Tax Planning and Earnings Quality
http://slidepdf.com/reader/full/the-effects-of-tax-planning-and-earnings-quality 32/41
46 Contemporary Accounting Research
part, capture low earnings quality. Finally, we find that after 1992 the relative and
incremental information content of estimated taxable income decreased signifi-
cantly for high tax-planning firms and increased significantly for firms with lower
earnings quality. These results are consistent with increased concerns of aggressivetax sheltering and opportunistic earnings management during this period. None-
theless, we are unable to eliminate the possibility that other events influenced the
relative and incremental information content of estimated taxable income for these
firms during this period.
Endnotes
1. Proponents of book-tax conformity argue that com panies should either pay tax on their
financial reporting income (e.g., tax laws and accounting rules should be rewritten to
reduce the differences between the two systems) or. at the minimum, disclose more tax
return information to investors. Given the potential consequences to the capital markets
and the Treasury (M cClelland and M ills 2007), these proposals have sparked considerable
debate by regulators, practitioners, and academics. See Hanlon and Shevlin 2003;
Lenter, Shackelford, and Slemrod 2003; Mills and Plesko 2003; Yin 2001 ; etc.
2. The term "information content" is used by some researchers to examine long-window
associations between earnings and returns (e.g.. Ball and Brown 1968; Alford, Jones,
Leftwich, and Zmijewski 1993) but is used by others to refer to an event study that
examines, for example, whether earnings announcem ents have a stock price effect at
the time of the announcement (for a discussion, see Watts and Zimmerman 1986, 39).
Given the nature ofour tests, we use the same terminology as in Hanlon et ai. 200 5.
3. Because tax return data are not publicly available, we are notable to estimate our
analyses with actual tax return data. However, Plesko (2006) reports that he is unable
to reject the null hyp othesis of no difference between taxable income estimated from
the financial statements (grossing upfederal tax expense, COMP USTA T data 63
[unless otherwise noted, "data" refers to COMPUSTAT data items]) and either taxable
income from Form 1120 (line 28) or taxable income subject to tax from Form 1120(line 28 less special deductions and NOL carryovers) for 37,85 3 firm -years from 1994
to 2001. Thus, our tests should be significantly powerful to detect those settings in
which taxable income is more or less informative as an altem ative performance me tric.
As discussed in detail later in the text, we conduct several sensitivity analyses to
address the measurement error in taxable income,
4. Sloan (1996) defines low-quality earnings as earnings composed primarily of accruals
and finds that accruals are less persistent than cash flows. Subsequent studies (e.g., Xie
2001 ) find that abno rmal accrua ls are less persistent than "no rmal accru als" or cashfiows. We use abnormal ac cruals to define earnings quality beca use w e are interested in

8/7/2019 The Effects of Tax Planning and Earnings Quality
http://slidepdf.com/reader/full/the-effects-of-tax-planning-and-earnings-quality 33/41
Taxable Income as a Performance M easure 47
low earnings quality resulting from earnings management (i.e., firms subject to
Securities Exchange Commission ISEC] enforcement action for overstating eamings).
As expected, we find that the relative and incremen tal information content of taxable
income is enhanced for these firms.5. Results are similar when we use cash effective tax rates (Dyreng , Hanlon, and Maydew
2008) to identify high tax-planning firms.
6. Tliere are situations in which firms prefer repo rting lower incom e because, for
example, of political costs and compensation contracts. See Watts and Zimmerman
1986 for a discussion of the contracting reasons associated w ith political costs and
Healy 1985 for evidence regarding compensation contracts.
7. To the extent that the shocks to taxable income and book income are similar, we do not
anticipate that taxable income will be incrementally informative to book income.8. See audit technique guides for various industries at http://ww w.irs.gov.
9. The incentive to smooth taxable incom e is a function of the convexity of the present
value of income taxes in taxable income that is attributable to (a) a progressive tax rate
schedule, (b) the alternative minim um tax and investment tax credit, and
(c) asymmetric treatment of taxable income and losses. Graham and Smith (1999)
suggest that the asymm etric treatment of taxable income and losses creates most of the
observed convexity of income taxes in taxable income.
10. Joos et al. (2000) exam ine w hether investors shift their reliance from book income totaxable income when firms have large book-tax differences. They find that the
information content of taxable income does not change when book-tax differences are
large. In contrast, we predict and find that two sources of book-tax differences (tax
planning and low eamings quality) have opposite effects on the relative information
content of taxable and book income.
Frank et al. (2006) find that aggressive tax planning accompanies lower eamings
quality. This effect biases against our predicted results in our second hypothesis
because w e expect that aggressive tax p lanning for firms with low eam ings quality w ill
reduce the information content of taxable income.
11. Statutory tax rates (str) equal 46 percent for 1986 and prior tax years. 40 percent for
1987, 34 percent for tax years 1988 through 1992, and 35 percent thereafter.
12. if federal income tax expense is missing from COMPUSTAT, we estimate TI as the
difference between total income tax expense (data 16) and deferred taxes (data 50)
divided by the top statutory tax rate for year t. str,. less the change in NOL
carryforwards, ^OLj¡.
Mills et al. (2003) examine COMPUSTAT's reporting of NOLs in a setting that
focuses on U.S. income. Because we are examining worldwide income, the screensthey suggest that help mitigate problems with COMPUSTAT NOLs are not applicable

8/7/2019 The Effects of Tax Planning and Earnings Quality
http://slidepdf.com/reader/full/the-effects-of-tax-planning-and-earnings-quality 34/41
48 Con temporary Accounting Research
data 63 ) and either taxable income from Form 1120 (line 28) or taxable incom e subjectto tax from Form 1 !20 (line 28 less special deductions and NOL carryovers). Lisowsky(2007) also finds that total tax after credits from the tax retum (Form 1120. line 31) is
highly and significantly correlated with FTE (dala 63) tor 4,011 publicly traded U.S.corporations (excluding foreign-controlled firms) from 2000 to 2004. '
14. To the extent that high tax-planning firms are more likely to record a tax cushion thatnarrows the gap between book income and our estimates of a firm's taxable income,this will bias against finding that the taxable income for h igh tax-planning firms is lessinformative. In sensitivity analysis, we estimate taxable incom e in ( 1 ) using cash taxespaid instead of the sum of current tax expense and current foreign tax expense , whichmitigates the concems of tbe effects of any tax cushion on our analyses. Results are
similar using tbis alternative measure of taxable income.15. From a financial statement analysis perspective, measurement error in taxable income
is less of an issue because we use a measure of taxable incom e available to the market.Specifically, analyzing tbe relative infonnation content of financial statementdisclosures of taxable income may be viewed as interesting and relevant as analyzingthe information content of actual taxable incom e. However, from a tax policyperspective, measurement error in taxable income remains an issue becausepolicymakers are concerned with actual taxable income. Tbus, we need a reasonable
proxy of taxable income to investigate whether tax planning results in a taxable incom enum ber that does not reflect tbe firm's actual performance.
16. We use a 16-month retum window to maintain consistency with Hanlon et al. 2005.Results are robust if we use a 12-month retum window ending 4 montbs after the endof fiscal year /.
17. Since Lev 1989, many studies use the adjusted R^ to a.ssess the value relevance ofaccoun ting information. These studies compare the adjusted /f across time (e.g.Co llins, Maydew, and Weiss 1997 ; Lev and Zarowin 1999; Francis and Schipper 1999)or across coun tries {e.g., Alford et al. 1993; Ali and Hw ang, 2 000). Francis andSchipper (1999), Brown. Lo, and Lys (1999), and Gu (2002) point out, however, tbatthe adjusted /Î 2s from different samples are not d irectly comparable because tbe totalvariance of tbe dependent variable (i.e., stock retums) is not constant across differentsamples causing the explanatory power of the independent variable to suffer Our teststatistics are similar in spirit to one used by Hanlon et al. 2005 (426) and do not sufferfrom problems caused by volatility of the dependent variable because we hold retumsfor tbe firm constant (i.e., we com pare tbe explanatory power of taxable and bookincom es within the same firm). Add itionally, in tests of Hypothesis 1 and Hypothesis 2
between grou ps, retum volatility is less of a concem because we are comparing our teststatistics across two groups of firms incorporated in the same country during the same

8/7/2019 The Effects of Tax Planning and Earnings Quality
http://slidepdf.com/reader/full/the-effects-of-tax-planning-and-earnings-quality 35/41
Taxable Incom e as a Perform ance M easure 49
19. In sensitivity analyses, we identify high tax-planning firms as firms whose annual
E77fs (or, alternatively, annual fr /f s computed using actual cash taxes paid) were in
the lowest quintile (by two-digit SIC industry) in four of the previous tive years.
Results are robust to this alternative specification.Similar to book-tax differences, our "a ccum ulated" measure of £77? may be
inñuenced by managerial discretion used in financial reporting and mechanical
differences between book and taxable income. To the extent that our classification of
high tax-planning firms captures managerial discretion used in financial reporting,
results are biased against expectations (i.e., we expect taxable income to be less
informative for high tax-planning firms, whereas we expect taxable income to be more
informative for low eamings-quality firms). We rank ETR by year and two-digit SIC
industry to identify high tax-planning firms to control for mechanical differences
between book and taxable income that vary by industry. In sensitivity analyses (discussed
later), we identify high tax-planning firms using the Mills, Erickson, and M aydew 1998
model of investments in tax planning. Results are robust to this other specification.
20. As a modification to (8), we subtract special items (data 17) from PTB;,^ in the
denom inator (D yreng et al. 20 08). We also incorporate this change in our cash taxes
paid measure of tax planning discussed below. Results are robust to these alternative
specifications.
21. See Hanlon 2003 for a more complete discussion of this issue.
22. Similar to Dyreng et al. 2008 . we calculate cash effective tax rates as the five-year sum
of cash taxes paid (data 317) divided by the five-year sum of pre-tax book income (data
170). Because the cash flow statement is only available after 1987, our sample for these
tests begins in 1992.
We note that accumulated ETR does not capture "income sm oothing" as a tax-
planning strategy. As suggested in Graham and Sm ith 1999, the majority of firms have
little in the way of tax incentives to smooth income. We leave the investigation of tax-
motivated smoothing to future research.
23. In sensitivity analysis, we compare the relative information content of estimatedtaxable income to book income for firms in the top 20 percent of signed abnorm al
accruals with firms in the middle 60 percent of signed abnormal accruals. We do the
same for firms in the bottom 20 percent of signed abnormal accruals. We find that
the relative information content of estimated taxable income is higher for firms in the
top 20 percent (bottom 20 percent) of signed abnormal accruals than ihat for firms in
the middle 60 percent. In addition, we find no significant difference in the relative
information content of estimated taxable income lo book income for ¡inns in the top
20 percent of signed abnormal accruals compared with firms in the bottom 20 percent.
In sum, our results are robust to using signed abnormal accruals to identity low

8/7/2019 The Effects of Tax Planning and Earnings Quality
http://slidepdf.com/reader/full/the-effects-of-tax-planning-and-earnings-quality 36/41
50 Contem porary Accounting Research
the tax-planning analysis using cash-based ETR to identify high tax-planning nrms,
and by 3,366 observations for the earnings-quality analysis. Including theseobservations does not change our inferences.
25. We do not eliminate firms with accumulative negative pre-tax book incom e from our"earnings-q uality" analyses because this restriction eliminates a disproportionately
large percentage of the low "earnings-qu ality" sample (approximately 48 percent), and
thus raises the concern of "throwing the baby out with the bathwater". C onsistent withthis concem , results for ou r earn Ing-quality analysis a re weaker w hen we eliminate
firms with accumulative negative pre-tax book income, suggesting that alternative
performance metrics (e.g., taxable income) may be particularly important for firmswith more extreme operating performance. In sensitivity analyses, we test whether the
increased relative information content of estimated taxable income for firms with highabnormal accruals is limited to firms with extreme negative or positive operating
performance (e.g., top and bottom 20 percent of return on assets [ROA] by year).
Results are consistent between this group and the group of firms with less extremeoperating performance (e.g., middle 60 percent of ROA by year). In addition, all our
analyses are robust to excluding firms with a loss in the current year.
26. We winsorize (reset) regression variables at the most extreme 1 percent level each yearto mitigate the influence of extreme observations in our regressions.
27. In additional analyses, we compare total assets, market value, earnings per share, growth(measured by the book-to-market ratio), and market risk (measured by beta) for hightax-planning firms and low earnings-quality firm s to other firms. Due to the large samplesize, these measures are generally different between these groups, though the differences
are quite sma ll. We know of no reason why these factors may exp lain the differences inthe information content of estimated taxable income relative to book income. In
sensitivity tests, we reestimate our analyses including the logarithm of total assets, thelogarithm of market value, eam ings per share, the logarithm of the book-to-market ratio,
and beta in our models ( 3, 4, and 6). Results are similar to those presented in the tables.
28. Our sample of high tax-planning firms has less persistent eamin gs than other firms. Forexample, the Spearman correlation between one-year-ahead deflated eamings (book
income scaled by lagged market value of equity) and current-year deflated eamings for
high tax planners is 0.44 compared with 0.50 for all other firms. However, if the tax-planning sam ple simply captures firms with low eamin gs persistence, we wouid expect
this to bias against Hypothesis 1, which predicts a lower adjusted R^ ratio for high tax-
planning firms. Specifically, less persistent book eamings should reduce thedenominator of the adjusted Ä^ratio, making it more difficult to support Hypothesis 1.
In our regression analyses (discussed later), we find that the book income for high tax-planning firms explains a slightly higher but similar proportion of returns than other

8/7/2019 The Effects of Tax Planning and Earnings Quality
http://slidepdf.com/reader/full/the-effects-of-tax-planning-and-earnings-quality 37/41
Taxable Income as a Performance M easure 51
other firms" sam ple in Table 4 (0.045). Com parisons of adjusted R'^s across groups
(i.e., instead of adjusted fi^ ratios across groups) are problematic because they require
much stronger assumptions regarding the distribution of the retums of the comparison
groups.
3 1. Approximately 40 percent of the high tax-planning sample identified using the Mills
et al. 1998 model is also classified as high tax-planning firms in our main analysis —
that is, using ETR. This evidence suggests that although the two methods of identifying
high tax-planning firm s do not create identical sam ples, there is considerable overlap in
the sample, providing some comfort that both measures capture a similar construct.
32. Post-1992 results presented in Tables 2, 3, and 4 suggest that the investment tax credit
(phased out beginning in 1986) does not affect our inferences.
3 3 . This specification mitigates the measurement error concerns associated w ith foreigntaxes on permanen t differences but not temporary differences.
34. The cash flow statement is only available after 1987, so we also identiiy casb fiow s as
the difference between pre-tax income and TACC defined in (9). Inferences are the
same using either definition of cash flows.
References
Alford, A.. J. Jones, R. Leftwich. and M . Zm ijewski. 1993. The relative informativeness of
accounting disclosures in different coun tries. Journal of Accounting Research31 (Supplement): 183-229.
Ali, A., and L . S. Hwang. 2 000 . Country-specific factors related to financial reporting and
the value relevance of accounting data. Journal of Accounting Research 38(1) : 1 -21 .
Ball, R., and P. Brown. 1968. An empirical evaluation of accounting income numbers.
Journal of Accounting Research 6 (2): 15 9-7 8.
Bergstresser, D ., an dT . Philippon. 2006. CEO incentives and earnings management.
Journal of Financial Economics 80 (3): 511 - 2 9 .
Brown, S., K. Lx). an dT . Lys. 1999. Use of/f^ in accoun ting research: Measuring changes in
value relevance over the last four dec ades. Journal of Accounting and Economics
2 8( 2 ): 83 - 115 .
Collins, D., E. M aydew. and I. Weiss. 1997. Changes in the value-relevance of earnings and
book v alues over the past forty years. Journal of Accounting and Econom ics 24 ( I ):
3 9 - 6 7 .
Dechow, P. 1994. Accounting earnings and cash flow s as measures of firm performance: T he
role of accounting accruals. Journal of Accounting and Econom ics 18(1) : 3 -42 .
Dechow, P., S. Richardson, and I. Tuna. 2003. Why are earnings kinky? An examination of
the earnings management explanation. Review of Accounting Studies 8 (2): 3 55 -84 .Dechow, P., R. Sloan, and A. Sweeney. 1995. Detecting earning s m anagem ent. The

8/7/2019 The Effects of Tax Planning and Earnings Quality
http://slidepdf.com/reader/full/the-effects-of-tax-planning-and-earnings-quality 38/41
52 Con temporary Accoun ting Research
Desai, M. 2(X)6. Testimony ofMihir Desai associate professor Harvard University before
¡he Subcom mittee on Select Revenue M easures. Com mittee on Ways and M eans,
House of Representatives, May 9.
Dyreng, S., M. Hanlon, and E. L. Maydew. 2008. Long run corporate tax avoidance. The
Accountini- Review 83 (1): 61 -8 2.
Erickson, M,, M. Hanlon, and E. L. Maydew. 2004. How much will firms pay for eamings
that do not exist? Evidence of taxes paid on allegedly fraudulent earnings. The
Accounting Review 79 (2) : 387 -408 .
Financial Accounting Standards Board (FASB). 1992. Statement ofFimmdai Accounting
Standards No. 109: Accounting for income taxes. Stamford, CT: FASB.
Francis, J., and K. Schipper. 1999. Have financial statements lost their relevance? J o u /n a /o /
Accounting Research 37 (2): 3 1 9 - 5 1 .Frank, M. M., L. J. Lynch, and S. O. Rego. 2006. Does aggressive financial reporting
accompany aggressive tax reporting (and vice versa)? Working paper, University of
Virginia and University of Iowa.
Govemment Accounting Office (GAO). 2003. Internal Revenue Service: Cha llenges remain
in combating abusive tax shelters (GAO'04-\04T). Statement of Michael Brostek,
Director, Tax Issues. O ctober 21. http;//www.gao.gov/cgi-bin/getrpt?GAO-04-104T.
Graham , J. R., and C. Sm ith. 1999. Tax incentives to hedge. The Journal of Finance 54 (6):
2241- 62 .Gu, Z. 2002. Across-sample incomparability of Rh and additional evidence on value
relevance changes over time. Working paper, Camegie Mellon University.
Hanlon, M. 2003. What can we infer about a firm".s axable incom e from its financial
statements? National Tax Journal 56 (4): 831 - 6 3 .
Hanlon, M. 2005. The persistence and pricing of eamings, accruals and cash flows when
firms have large book-tax differences. The Accounting Review 80 (I): 137-66.
Hanlon, M ., S. K. Laplante, and T. Shevlin. 2005 . Evidence for the possible information loss
of conforming book income and taxable income. Journal of Law and Economics
48 (2) : 40 7-4 2.
Hanlon, M ., and T. Shevlin. 2003. Book-tax conformity for corporate income: An
introduction to the issues. NBER working paper no. 11067. Cambridge, MA: National
Bureau for Economic Research.
Healy, P. 1985. The effect ofbonus schemes on accounting decisions./oHrna/o/Accourt/ing
and Economics 1 ( 1 -3 ) : 8 5 - 107.
Hribar, P., and C. N ichols. 2006. The use of unsigned e am ings quality measures in tests of
eaming s m anagement. Working paper, Com ell University.
Joos, P., J. Pratt, and S. D . Young. 2000. Book-tax differences and the pricing of eam ings.
Working pa|Ter. Massachusetts Institute of Technology, Indiana University, and

8/7/2019 The Effects of Tax Planning and Earnings Quality
http://slidepdf.com/reader/full/the-effects-of-tax-planning-and-earnings-quality 39/41
Taxable Income as a Performance M easure 53
Kothari, S. P., A. Leone, and C. W asley. 2005 . Performance matched d iscretionary accrual
measures. Journal of Accounting and Econom ics 39 (1): 16 3-9 7.
Lenter, D., D. Sbackelford. and J. S lemrod. 2003. Public disclosures of corporate tax retum
information: Accounting, economics, and legal perspectives. National Tax Journal
56 (4): 803 -30 .
Lev, B. 1989. On the usefulness of eamings and eamings research: Lessons and directions
from two decades of empirical research. Journal of Accounting Research
11 (Supplement): 153-92.
Lev. B., and D. Nissim. 2004. Taxable income, future eamings and equity values. The
Accounting Review 79 (4): 1039-74.
Lev, B., and P. Zarowin, 1999. The boun daries of financial reporting and how to extend
them. Journal of Accounting Research 37 (2) : 35 3-8 5.
Levitt, A. 1998. Tbe numbers game. Remarks at the NYU Center for Law and Business,
September 28.
Lisowsky, P. 200 7. Inferring U.S . tax liability from financial statement infonn ation.
Working paper, Boston University.
McClelland, J., and L. Mills. 2007. Weighing benefits and risks of taxing book income. Tax
Noie5 115 (7): 77 9- 8 7.
McNicboIs, M. 2000. Research design issues in eamings management studies. Journal of
Accounting and Public Policy 19 (405): 313 -4 5.McNichols, M., and P Wilson. 1988. Evidence of eamings management for the provision
for bad debts. Journal o f Accounting Research 26 (Supplement): I - 3 1 .
M ills, L. 1998. Book-tax differences and intemal revenue service adjustments. Journal of
Accounting Research 36 (2) : 34 3-5 6.
M ills, L., M. Erickson, and E. Maydew. 1998. Investments in tax plann ing. Journal of the
American Tax Association 25 (1): 1 - 2 0 .
M ills, L. R, K. J. Newberry, and G . F. Novack. 2003. How well does Compustat N OL d ata
identify firms w itb U .S. tax rettim loss carryovers? Journal of the American Tax
Association 25 (2): 1 - 1 7 .
M ills, L., and G. Plesko . 2003. Bridging the reporting g ap: A proposal for m ore informative
reconciling of book and tax income. National Tax Journal 56 (4) : 86 5-9 3.
Plesko, G. 2000 . Book-tax differences and the measurement of corporate incom e. NTA
Proceedings ¡999, 17 1- 6. W ashington, DC: National Tax A ssociation.
Plesko, G. 2006. Estimates of the magn itude of financial and tax reporting conflicts.
Working paper. University of Connecticut.
Revsine, L., D. Collins, and B . Johnson. 2002 . Financial reporting and analysis. Upper
Saddle R iver, NJ: Prentice H all.Seida. J. 2003. Enron: Tbe Joint Committee on Taxation's Investigative Report. Testimony

8/7/2019 The Effects of Tax Planning and Earnings Quality
http://slidepdf.com/reader/full/the-effects-of-tax-planning-and-earnings-quality 40/41
54 Contem porary Accoun ting Research
Subram anyam , K. R. 1996 . The pricing of discretionaiy accruals. Journal of Accounting
and Economics 22 (1-3) : 2 4 9 - 8 1 .
U.S. Department of the Treasury. 1999. The problem of corporate tax shellers: Discussion,
analysis and legislative proposals. Washington, D C: U .S. GPO .
W atts, R. L., and J. L. Zimm erman . 1986. Positive accounting the ory. Englewood Cliffs, NJ:
Prentice H all.
Xie, H. 200 1. T he m ispricing of discretionary accruals. The Accounting Review 16 (3):
Yin, G. 20 01 . Getting serious abou t corporate tax shelters: Taking a lesson from history.
SMU Law Review 54 ( I ): 2 0 9 - 3 7 .

8/7/2019 The Effects of Tax Planning and Earnings Quality
http://slidepdf.com/reader/full/the-effects-of-tax-planning-and-earnings-quality 41/41