the effects of temperature on esr spectrum of gamma-irradiated ammonium tartrate
TRANSCRIPT
ARTICLE IN PRESS
Radiation Physics and Chemistry 78 (2009) 966–970
Contents lists available at ScienceDirect
Radiation Physics and Chemistry
0969-80
doi:10.1
� Corr
E-m
journal homepage: www.elsevier.com/locate/radphyschem
The effects of temperature on ESR spectrum of gamma-irradiatedammonium tartrate
Mustafa Polat �, Mustafa Korkmaz
Physics Engineering Department, Hacettepe University, Beytepe, 06800 Ankara, Turkey
a r t i c l e i n f o
Article history:
Received 12 January 2009
Accepted 29 June 2009
Keywords:
Dosimetry
ESR
Temperature
Kinetics
Ammonium tartrate
6X/$ - see front matter & 2009 Elsevier Ltd. A
016/j.radphyschem.2009.06.032
esponding author. Tel.:+90 312 297 72 13; fax
ail address: [email protected] (M. Polat)
a b s t r a c t
Unirradiated ammonium tartrate (AT) samples do not exhibit any ESR signal. However, irradiation
produces an unresolved singlet at g ¼ 2.003470.0006 with two shoulders at g1 ¼ 2.009370.0006 and
g2 ¼ 2.004870.0006. The dose–response curve was found to increase linearly with the applied
radiation doses in the range of 0.1–2.0 kGy and the slope of this curve was increased as the modulation
amplitude increased. The activation energy value Ea ¼ 69.071.2 kJ/mol was calculated from Arrhenius
plot for the radical species responsible from ESR spectrum of irradiated AT.
& 2009 Elsevier Ltd. All rights reserved.
1. Introduction
Dosimetric applications of ESR have been successfully made forintermediate and high dose ranges using alanine as a dosimetricmaterial (Ikeya, 1993; Kojima and Tanaka, 1989; Regulla andDeffner, 1982). Although the performance of alanine dosimetry isbeing improved, the sensitivity of the material is too low for fastand simple dose determinations in the range of 0.2–5.0 Gy, i.e., forapplications in radiation therapy (Hayes et al., 2000). The newmaterial should have a large G-value (stable radical pairs per100 eV of radiation energy), a sharp linewidth and thermalstability at room temperature. Some approaches relevant to thedevelopment of materials for ESR dosimetry have recently beendiscussed. A series of organic materials such as ammoniumtartrate (AT) (Bartolotta et al., 2001; Marrale et al., 2006; Marraleet al., 2009; Brustolon et al., 1999; Lund et al., 2002; Olsson et al.,1999, 2000), ammonium formate (Gustafsson et al., 2004), lithiumformate (Lund et al., 2004, 2005; Vestad et al., 2003, 2004) andinorganic materials such as alkaline earth dithionates (Bogush-evich and Ugolev, 2000) have been discussed and have shown thatthey have great potential of ESR dosimeters for medical radio-theraphy. AT was employed as a dosimeter for high-energy photonand heavy ion irradiation (Olsson et al., 2000). One advantagecompared to alanine was its relatively narrow singlet ESRspectrum resulting in an increased sensitivity by a factor 2.The disadvantage was the effective microwave power saturation,
ll rights reserved.
:+90 312 299 20 37.
.
preventing application of high microwave powers to improvesensitivity.
There are little works on the effects of temperature, in a widerange, on radiation-induced radical in AT and no efforts werespent on simulation calculations to determine spectroscopicparameters of the radical induced in gamma-irradiated AT.The aim of the present work is to investigate the kinetic featureof the radiation-induced radical at room and high annealingtemperatures.
2. Materials and method
AT samples were provided from Aldrich. The samples weretransferred to polycarbonate vials and were kept at roomtemperature in dark before irradiation treatment. All irradiationand ESR experiments were carried out on samples open to air inorder to determine the dosimetric use of AT in food irradiationdetection, radiation accident and radiothrephy. Irradiations wereperformed at room temperature using a 60Co gamma-cell,supplying a dose rate of 1.11270.022 kGy/h as an ionizingradiation source at the Saraykoy Establishment of the TurkishAtomic Energy Agency in Ankara. The dose rate at the sample siteshad been calibrated by Fricke dosimeter (ferrous sulphatedosimeter). AT samples irradiated to doses of 0.1, 0.2, 0.4, 0.7,1.0, 1.5 and 2.0 kGy were employed to construct the dose–r-esponse curves. A long-term radical decay features at roomtemperature was also performed over a time period of 90 daysusing the samples irradiated at a dose of 1.0 kGy. To investigatethe effects of annealing temperatures on decay kinetics of theradiation-induced radical species at high temperatures, annealing

ARTICLE IN PRESS
342
1.0mT
0.7mT
0.4mT
0.2mT
Magnetic Field (mT)
0.1mT
344 346 348 350 352
Fig. 1. Variations of ESR spectra of AT irradiated at a dose of 1.0 kGy with applied modulation amplitudes.
M. Polat, M. Korkmaz / Radiation Physics and Chemistry 78 (2009) 966–970 967
studies were performed by using the samples irradiated at a doseof 1.0 kGy. For this goal, AT samples were transferred afterirradiation process to the predetermined temperatures (300,315, 330, 345 and 360 K) and kept at these temperatures forpredetermined times (2, 4, 6, 10, 20, 40 and 60 min). Their ESRspectra were recorded after cooling them to room temperature.ESR measurements were performed with a delay of 2 h afterstopping irradiation due to the distance between the irradiationplant and ESR spectrometer.
ESR measurements were carried out using the Bruker EMX andVarian E-L 900 X-band ESR spectrometers operating at 9.5 GHzequipped with a high sensitive cylindrical cavity and TE104 doublerectangular cavity, respectively. The spectrometer operationconditions adopted throughout the experiment are: central field:345 mT; scan range: 10 mT; microwave power: 1.0 mW; micro-wave frequency: 9.736 GHz; receiver gain: 2.0�104; modulationfrequency: 100 kHz; modulation amplitude: 0.1 mT; time con-stant: 327.68 ms; sweep time: 83.886 s. Sample temperatureinside the microwave cavity was monitored with a digitaltemperature control unit (Bruker ER 4111-VT). The latter gave usthe opportunity of measuring the temperature with an accuracy of70.5 K at the site of the sample. A crystalline DPPH (1,1-diphenyl-2-picryl-hydrazyl) sample was used as a standard sample. Eachmeasurement corresponds to the average of at least threedifferent samples. The position of the sample in the cavity wasnot changed during the long-term signal intensity decay experi-ment to avoid any error in g-factor and intensity measurementsarising from changes in the cavity-filling factor.
3. Experimental results and discussion
3.1. The effects of modulation amplitudes on dose–response curve
AT samples exhibited no ESR signal before irradiation treat-ment even at high microwave powers and modulation amplitudes.However, irradiated samples exhibited an ESR spectrum consist-ing of an unresolved single resonance line at g ¼ 2.003470.0006having peak-to-peak line width of DHpp ¼ 1.270.1 mT.The schoulders appearing at g1 ¼ 2.009370.0006 andg2 ¼ 2.004870.0006 were also observed in irradiated AT atlow modulation amplitudes. Typical ESR spectrum, recorded
at low microwave power (1 mW) and different modulationamplitudes, of AT irradiated at a dose of 1.0 kGy was given inFig. 1. Similar ESR spectrum for irradiated AT were also observedin other works (Lund et al., 2002; Yordanov and Gancheva, 2004).Previous ENDOR and ESEEM studies (Brustolon et al., 1996) haveshown that mainly the H4NOOC–Cd(OH)–CHOH–COONH4 freeradical species is responsible for the ESR spectrum of AT irradiatedwith gamma and/or X-rays. This stable radical shows an ESRspectrum with a width of �10 G, which is therefore narrower thanthat of many other irradiated organic crystals (Brustolon et al.,1999; Yordanov and Gancheva, 2004). Signal intensity or areaunder the ESR spectrum, calculated by double integration, isrelated directly to the spin concentration in the sample. So,measuring the irradiation doses used in food industry andmedicinal applications depend on the number of spins producedin the sample. One way increasing the ESR signal intensity is toadjust appropriate microwave power and modulation amplitudeof the spectrometer and thus, it can be possible increasing thesensitivity of an ESR/dosimeter. Adjusting microwave power andmodulation amplitude of 3 mW and 1 mT, respectively, was foundto increase the sensitivity when AT is used as an ESR dosimetricmaterial. The details were not given here to save spaces. However,it must be considered that the saturation microwave power valueof any paramagnetic system depends on temperature anddecreases when the temperature decreased. To see the details ofthe variations of schoulders and to avoid from microwavesaturation effects on ESR signal intensity at low temperatures,microwave power and modulation amplitude values of 1 mW and0.1 mT, respectively, were adopted throughout the experiment.
AT samples irradiated to doses of 0.1, 0.2, 0.4, 0.7, 1.0, 1.5 and2.0 kGy were used to construct the dose–response curve. It isimportant to emphasize that in the studied dose range(0.1–2.0 kGy), the g-factors relevant to the schoulders (g1 and g2)and center of the spectrum (g) and peak-to-peak line width of theresonance signal did not change nor did other lines appear. Thedose–response curves were constructed at 1 mW microwavepower but, different modulation amplitudes (Fig. 2). A linearfunction of type Y ¼ a+bD was tried to describe the variation ofpeak-to-peak signal intensity with absorbed radiation dosewithout forcing the function to pass through the origin. In thisfunction, Y and D stand for the peak-to-peak signal intensity andabsorbed radiation dose in kGy, respectively. The parameter
ARTICLE IN PRESS
0.00
300
600
900
1200
1500
1800
2100
ES
R s
igna
l int
ensi
ty (a
.u.)
Dose (kGy)0.4 0.8 1.2 1.6 2.0
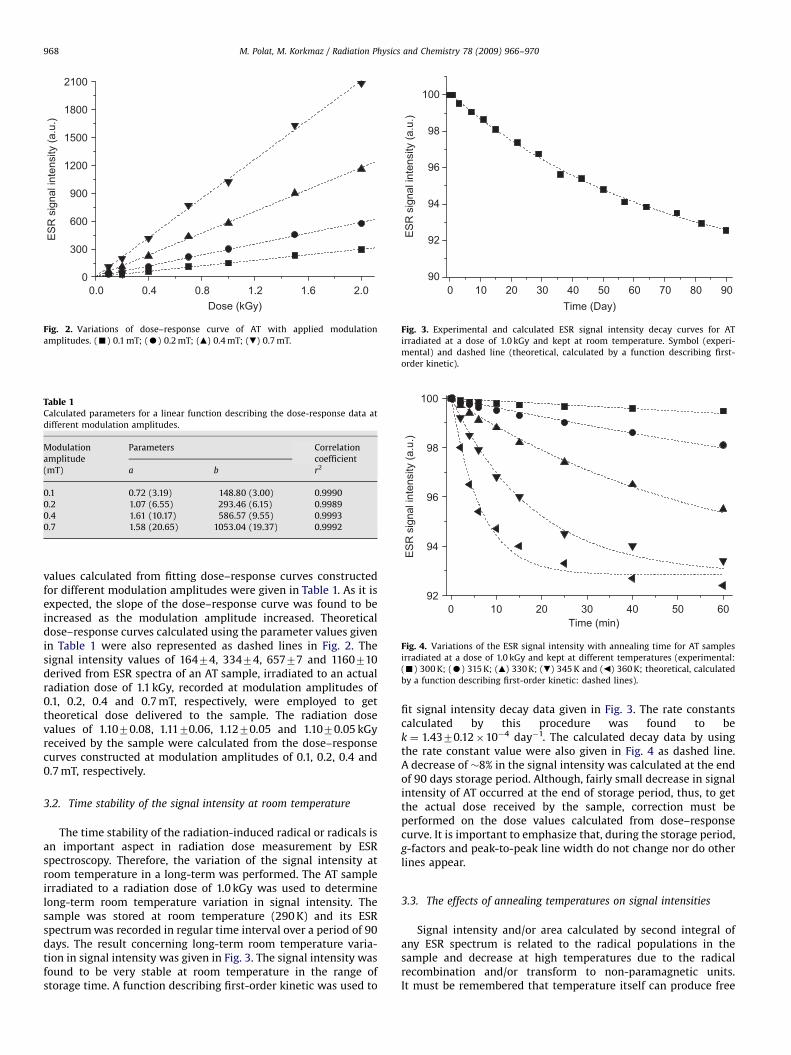
Fig. 2. Variations of dose–response curve of AT with applied modulation
amplitudes. (’) 0.1 mT; (K) 0.2 mT; (m) 0.4 mT; (.) 0.7 mT.
Table 1Calculated parameters for a linear function describing the dose-response data at
different modulation amplitudes.
Modulation
amplitude
(mT)
Parameters Correlation
coefficient
a b r2
0.1 0.72 (3.19) 148.80 (3.00) 0.9990
0.2 1.07 (6.55) 293.46 (6.15) 0.9989
0.4 1.61 (10.17) 586.57 (9.55) 0.9993
0.7 1.58 (20.65) 1053.04 (19.37) 0.9992
090
92
94
96
98
100
ES
R s
igna
l int
ensi
ty (a
.u.)
Time (Day)10 20 30 40 50 60 70 80 90
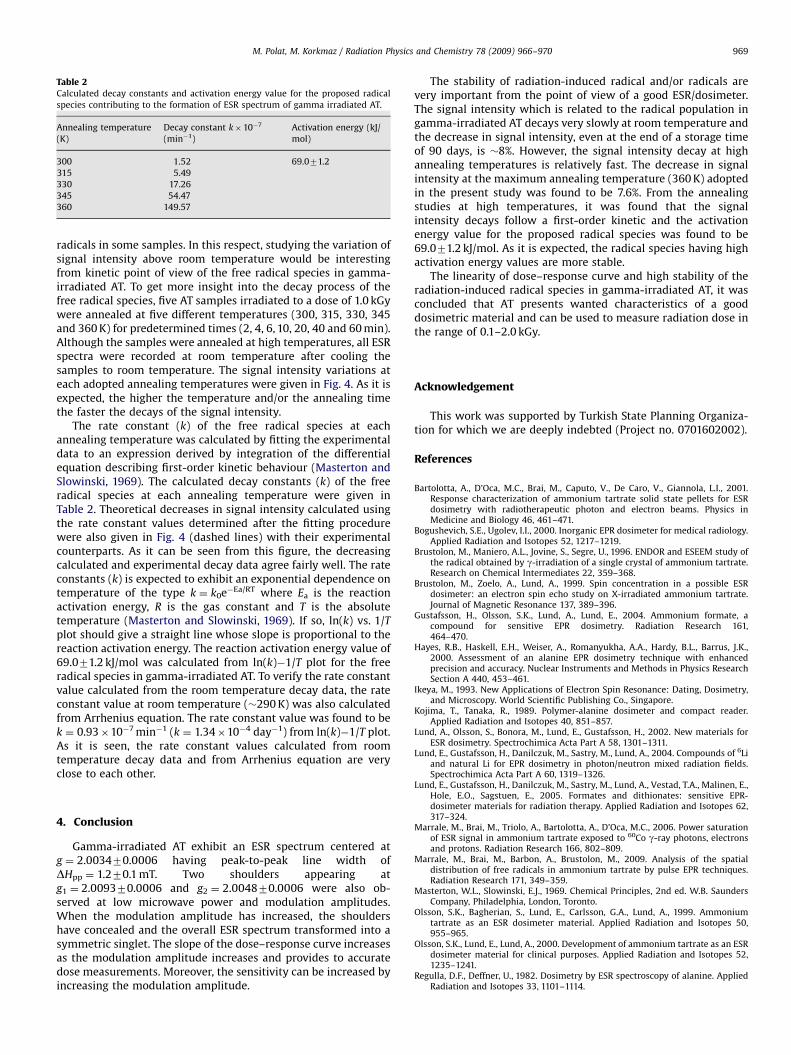
Fig. 3. Experimental and calculated ESR signal intensity decay curves for AT
irradiated at a dose of 1.0 kGy and kept at room temperature. Symbol (experi-
mental) and dashed line (theoretical, calculated by a function describing first-
order kinetic).
092
94
96
98
100E
SR
sig
nal i
nten
sity
(a.u
.)
Time (min)10 20 30 40 50 60
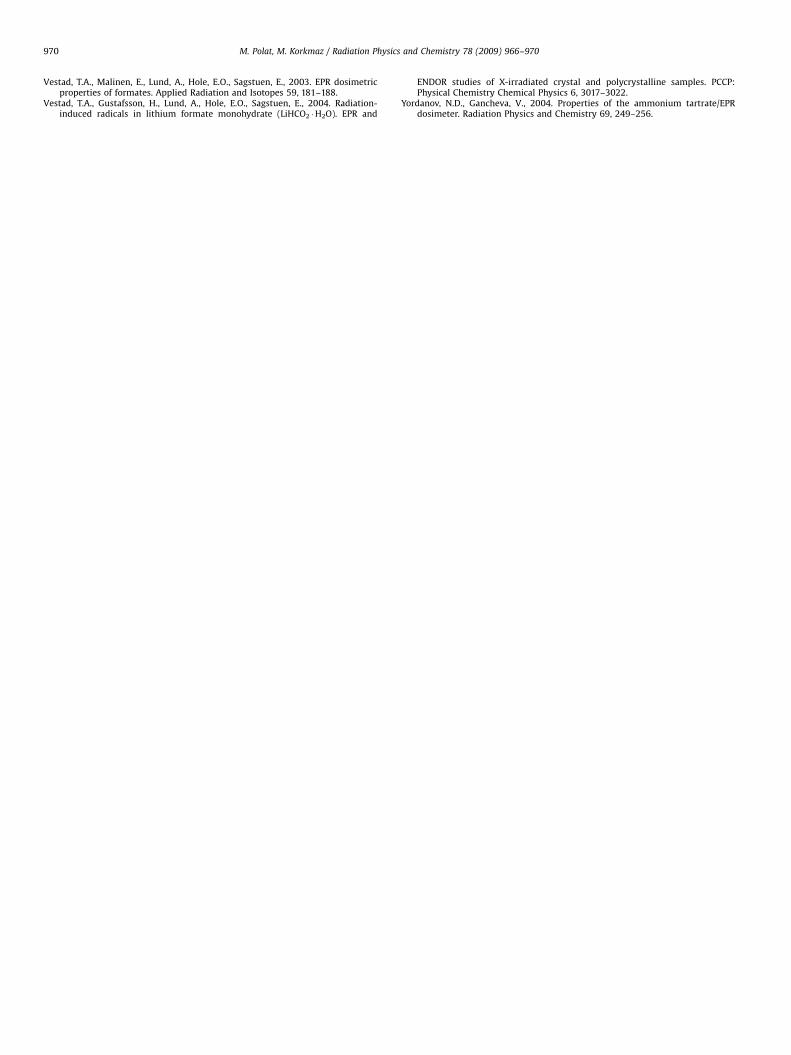
Fig. 4. Variations of the ESR signal intensity with annealing time for AT samples
irradiated at a dose of 1.0 kGy and kept at different temperatures (experimental:
(’) 300 K; (K) 315 K; (m) 330 K; (.) 345 K and (b) 360 K; theoretical, calculated
by a function describing first-order kinetic: dashed lines).
M. Polat, M. Korkmaz / Radiation Physics and Chemistry 78 (2009) 966–970968
values calculated from fitting dose–response curves constructedfor different modulation amplitudes were given in Table 1. As it isexpected, the slope of the dose–response curve was found to beincreased as the modulation amplitude increased. Theoreticaldose–response curves calculated using the parameter values givenin Table 1 were also represented as dashed lines in Fig. 2. Thesignal intensity values of 16474, 33474, 65777 and 1160710derived from ESR spectra of an AT sample, irradiated to an actualradiation dose of 1.1 kGy, recorded at modulation amplitudes of0.1, 0.2, 0.4 and 0.7 mT, respectively, were employed to gettheoretical dose delivered to the sample. The radiation dosevalues of 1.1070.08, 1.1170.06, 1.1270.05 and 1.1070.05 kGyreceived by the sample were calculated from the dose–responsecurves constructed at modulation amplitudes of 0.1, 0.2, 0.4 and0.7 mT, respectively.
3.2. Time stability of the signal intensity at room temperature
The time stability of the radiation-induced radical or radicals isan important aspect in radiation dose measurement by ESRspectroscopy. Therefore, the variation of the signal intensity atroom temperature in a long-term was performed. The AT sampleirradiated to a radiation dose of 1.0 kGy was used to determinelong-term room temperature variation in signal intensity. Thesample was stored at room temperature (290 K) and its ESRspectrum was recorded in regular time interval over a period of 90days. The result concerning long-term room temperature varia-tion in signal intensity was given in Fig. 3. The signal intensity wasfound to be very stable at room temperature in the range ofstorage time. A function describing first-order kinetic was used to
fit signal intensity decay data given in Fig. 3. The rate constantscalculated by this procedure was found to bek ¼ 1.4370.12�10�4 day�1. The calculated decay data by usingthe rate constant value were also given in Fig. 4 as dashed line.A decrease of �8% in the signal intensity was calculated at the endof 90 days storage period. Although, fairly small decrease in signalintensity of AT occurred at the end of storage period, thus, to getthe actual dose received by the sample, correction must beperformed on the dose values calculated from dose–responsecurve. It is important to emphasize that, during the storage period,g-factors and peak-to-peak line width do not change nor do otherlines appear.
3.3. The effects of annealing temperatures on signal intensities
Signal intensity and/or area calculated by second integral ofany ESR spectrum is related to the radical populations in thesample and decrease at high temperatures due to the radicalrecombination and/or transform to non-paramagnetic units.It must be remembered that temperature itself can produce free
ARTICLE IN PRESS
Table 2Calculated decay constants and activation energy value for the proposed radical
species contributing to the formation of ESR spectrum of gamma irradiated AT.
Annealing temperature
(K)
Decay constant k�10�7
(min�1)
Activation energy (kJ/
mol)
300 1.52 69.071.2
315 5.49
330 17.26
345 54.47
360 149.57
M. Polat, M. Korkmaz / Radiation Physics and Chemistry 78 (2009) 966–970 969
radicals in some samples. In this respect, studying the variation ofsignal intensity above room temperature would be interestingfrom kinetic point of view of the free radical species in gamma-irradiated AT. To get more insight into the decay process of thefree radical species, five AT samples irradiated to a dose of 1.0 kGywere annealed at five different temperatures (300, 315, 330, 345and 360 K) for predetermined times (2, 4, 6, 10, 20, 40 and 60 min).Although the samples were annealed at high temperatures, all ESRspectra were recorded at room temperature after cooling thesamples to room temperature. The signal intensity variations ateach adopted annealing temperatures were given in Fig. 4. As it isexpected, the higher the temperature and/or the annealing timethe faster the decays of the signal intensity.
The rate constant (k) of the free radical species at eachannealing temperature was calculated by fitting the experimentaldata to an expression derived by integration of the differentialequation describing first-order kinetic behaviour (Masterton andSlowinski, 1969). The calculated decay constants (k) of the freeradical species at each annealing temperature were given inTable 2. Theoretical decreases in signal intensity calculated usingthe rate constant values determined after the fitting procedurewere also given in Fig. 4 (dashed lines) with their experimentalcounterparts. As it can be seen from this figure, the decreasingcalculated and experimental decay data agree fairly well. The rateconstants (k) is expected to exhibit an exponential dependence ontemperature of the type k ¼ k0e�Ea/RT where Ea is the reactionactivation energy, R is the gas constant and T is the absolutetemperature (Masterton and Slowinski, 1969). If so, ln(k) vs. 1/Tplot should give a straight line whose slope is proportional to thereaction activation energy. The reaction activation energy value of69.071.2 kJ/mol was calculated from ln(k)�1/T plot for the freeradical species in gamma-irradiated AT. To verify the rate constantvalue calculated from the room temperature decay data, the rateconstant value at room temperature (�290 K) was also calculatedfrom Arrhenius equation. The rate constant value was found to bek ¼ 0.93�10�7 min�1 (k ¼ 1.34�10�4 day�1) from ln(k)�1/T plot.As it is seen, the rate constant values calculated from roomtemperature decay data and from Arrhenius equation are veryclose to each other.
4. Conclusion
Gamma-irradiated AT exhibit an ESR spectrum centered atg ¼ 2.003470.0006 having peak-to-peak line width ofDHpp ¼ 1.270.1 mT. Two shoulders appearing atg1 ¼ 2.009370.0006 and g2 ¼ 2.004870.0006 were also ob-served at low microwave power and modulation amplitudes.When the modulation amplitude has increased, the shouldershave concealed and the overall ESR spectrum transformed into asymmetric singlet. The slope of the dose–response curve increasesas the modulation amplitude increases and provides to accuratedose measurements. Moreover, the sensitivity can be increased byincreasing the modulation amplitude.
The stability of radiation-induced radical and/or radicals arevery important from the point of view of a good ESR/dosimeter.The signal intensity which is related to the radical population ingamma-irradiated AT decays very slowly at room temperature andthe decrease in signal intensity, even at the end of a storage timeof 90 days, is �8%. However, the signal intensity decay at highannealing temperatures is relatively fast. The decrease in signalintensity at the maximum annealing temperature (360 K) adoptedin the present study was found to be 7.6%. From the annealingstudies at high temperatures, it was found that the signalintensity decays follow a first-order kinetic and the activationenergy value for the proposed radical species was found to be69.071.2 kJ/mol. As it is expected, the radical species having highactivation energy values are more stable.
The linearity of dose–response curve and high stability of theradiation-induced radical species in gamma-irradiated AT, it wasconcluded that AT presents wanted characteristics of a gooddosimetric material and can be used to measure radiation dose inthe range of 0.1–2.0 kGy.
Acknowledgement
This work was supported by Turkish State Planning Organiza-tion for which we are deeply indebted (Project no. 0701602002).
References
Bartolotta, A., D’Oca, M.C., Brai, M., Caputo, V., De Caro, V., Giannola, L.I., 2001.Response characterization of ammonium tartrate solid state pellets for ESRdosimetry with radiotherapeutic photon and electron beams. Physics inMedicine and Biology 46, 461–471.
Bogushevich, S.E., Ugolev, I.I., 2000. Inorganic EPR dosimeter for medical radiology.Applied Radiation and Isotopes 52, 1217–1219.
Brustolon, M., Maniero, A.L., Jovine, S., Segre, U., 1996. ENDOR and ESEEM study ofthe radical obtained by g-irradiation of a single crystal of ammonium tartrate.Research on Chemical Intermediates 22, 359–368.
Brustolon, M., Zoelo, A., Lund, A., 1999. Spin concentration in a possible ESRdosimeter: an electron spin echo study on X-irradiated ammonium tartrate.Journal of Magnetic Resonance 137, 389–396.
Gustafsson, H., Olsson, S.K., Lund, A., Lund, E., 2004. Ammonium formate, acompound for sensitive EPR dosimetry. Radiation Research 161,464–470.
Hayes, R.B., Haskell, E.H., Weiser, A., Romanyukha, A.A., Hardy, B.L., Barrus, J.K.,2000. Assessment of an alanine EPR dosimetry technique with enhancedprecision and accuracy. Nuclear Instruments and Methods in Physics ResearchSection A 440, 453–461.
Ikeya, M., 1993. New Applications of Electron Spin Resonance: Dating, Dosimetry,and Microscopy. World Scientific Publishing Co., Singapore.
Kojima, T., Tanaka, R., 1989. Polymer-alanine dosimeter and compact reader.Applied Radiation and Isotopes 40, 851–857.
Lund, A., Olsson, S., Bonora, M., Lund, E., Gustafsson, H., 2002. New materials forESR dosimetry. Spectrochimica Acta Part A 58, 1301–1311.
Lund, E., Gustafsson, H., Danilczuk, M., Sastry, M., Lund, A., 2004. Compounds of 6Liand natural Li for EPR dosimetry in photon/neutron mixed radiation fields.Spectrochimica Acta Part A 60, 1319–1326.
Lund, E., Gustafsson, H., Danilczuk, M., Sastry, M., Lund, A., Vestad, T.A., Malinen, E.,Hole, E.O., Sagstuen, E., 2005. Formates and dithionates: sensitive EPR-dosimeter materials for radiation therapy. Applied Radiation and Isotopes 62,317–324.
Marrale, M., Brai, M., Triolo, A., Bartolotta, A., D’Oca, M.C., 2006. Power saturationof ESR signal in ammonium tartrate exposed to 60Co g-ray photons, electronsand protons. Radiation Research 166, 802–809.
Marrale, M., Brai, M., Barbon, A., Brustolon, M., 2009. Analysis of the spatialdistribution of free radicals in ammonium tartrate by pulse EPR techniques.Radiation Research 171, 349–359.
Masterton, W.L., Slowinski, E.J., 1969. Chemical Principles, 2nd ed. W.B. SaundersCompany, Philadelphia, London, Toronto.
Olsson, S.K., Bagherian, S., Lund, E., Carlsson, G.A., Lund, A., 1999. Ammoniumtartrate as an ESR dosimeter material. Applied Radiation and Isotopes 50,955–965.
Olsson, S.K., Lund, E., Lund, A., 2000. Development of ammonium tartrate as an ESRdosimeter material for clinical purposes. Applied Radiation and Isotopes 52,1235–1241.
Regulla, D.F., Deffner, U., 1982. Dosimetry by ESR spectroscopy of alanine. AppliedRadiation and Isotopes 33, 1101–1114.
ARTICLE IN PRESS
M. Polat, M. Korkmaz / Radiation Physics and Chemistry 78 (2009) 966–970970
Vestad, T.A., Malinen, E., Lund, A., Hole, E.O., Sagstuen, E., 2003. EPR dosimetricproperties of formates. Applied Radiation and Isotopes 59, 181–188.
Vestad, T.A., Gustafsson, H., Lund, A., Hole, E.O., Sagstuen, E., 2004. Radiation-induced radicals in lithium formate monohydrate (LiHCO2 �H2O). EPR and
ENDOR studies of X-irradiated crystal and polycrystalline samples. PCCP:Physical Chemistry Chemical Physics 6, 3017–3022.
Yordanov, N.D., Gancheva, V., 2004. Properties of the ammonium tartrate/EPRdosimeter. Radiation Physics and Chemistry 69, 249–256.