the effects of the personal success plan by renzulli … · 2019. 4. 5. · be gifted (dispelling...
TRANSCRIPT

THE EFFECTS OF THE PERSONAL SUCCESS PLAN BY RENZULLI LEARNING ON THE ACHIEVEMENT OF SEVENTH GRADE STUDENTS WITH GIFTEDNESS
A Thesis by
Amy Beigel Miller
Bachelor of Arts, Wichita State University, 2004
Submitted to the Department of Curriculum & Instruction and the faculty of the Graduate School of
Wichita State University in partial fulfillment of
the requirements for the degree of Master of Education
May 2011

ii
© Copyright 2011 by Amy Beigel Miller
All Rights Reserved

iii
THE EFFECTS OF THE PERSONAL SUCCESS PLAN BY RENZULLI LEARNING ON THE ACHIEVEMENT OF SEVENTH GRADE STUDENTS WITH GIFTEDNESS
The following faculty members have examined the final copy of this thesis for form and content, and recommend that it be accepted in partial fulfillment of the requirement for the degree of Master of Education with a major in Special Education. _______________________________________ Kay Gibson, Committee Chair _______________________________________ Linda Mitchell, Committee Member _______________________________________ Kathy Strattman, Committee Member

iv
DEDICATION
To my amazing son Kyle, my supportive family and friends, and my wonderful students

v
ACKNOWLEDGMENTS
I would like to thank my advisor, Kay Gibson, for guiding me through the Master’s
process the past few years. She has provided me with a plethora of guidance and
patience that is irreplaceable. I would also like to extend thanks to my thesis committee,
Linda Mitchell and Kathy Strattman who sacrificed their time and energy to aid me in the
development of my thesis. Lastly, I’d like to thank the Renzulli Learning staff for funding
the use of the intervention for my research.

vi
ABSTRACT
This study tested a method for increasing student achievement in a seventh-
grade gifted classroom. Literature on underachievement supports various methods for
avoiding underachievement, including developing interests, identifying heroes and
utilizing adult helpers, discovering careers, creating academic and personal goals,
naming short-term and long-term plans, and completing student interest projects.
Renzulli Learning created a Personal Success Plan (PSP) with the intention of creating
a tool to increase student achievement of students with giftedness and lower the
underachievement in students. Pretest data was taken on the 23 students before the
intervention of the PSP was begun. Posttest data was then taken after the intervention
was completed according to the timeframe indicated by Renzulli Learning. Through
observation of the data, it is evident that there is a positive correlation with utilizing the
Personal Success Plan intervention 100% of the recommended time and increased
academic achievement. For students who completed the intervention as recommended,
academics did increase.

vii
TABLE OF CONTENTS
Chapter Page
1. INTRODUCTION……………………………………………………………………………..1
2. REVIEW OF THE LITERATURE…………………………………………………………...3
3. METHODOLOGY…………………………………………………………………………...13
4. RESULTS……………………………………………………………………………………23
5. LIMITATIONS……………………………………………………………………………….37
6. DISCUSSION……………………………………………………………………………….39
7. CONCLUSIONS…………………………………………………………………………….45
8. FUTURE RESEARCH……………………………………………………………………...47
REFERENCES………………………………………………………………………………...50
APPENDICES…………………...……………………………………………………………..54
A. Field Notes Spreadsheet……………………………………………………………...55 B. Lesson Plans………………………………………………………………………...…59 C. Teacher-Created Survey……………………………………………………………...61 D. Post Intervention Data Questions……………………………………………………63 E. Pretest and Posttest Student Survey Results………………………………………64 F. Research Proposal with Consent and Assent Forms……………………………...65

viii
LIST OF TABLES
Table Page
1. Student Gender/ Race Comparison of Sample and Building….…………….……16
2. Field Notes Point Explanation………………………………………………………..21
3. Academic Achievement Pre and Posttest Data…………………………….………23
4. Survey Results Pre and Posttest Data……...………………………………………26
5. Survey Results: Pre and Posttest Comparison for Academics…………………...28
6. Observational Time on Tasks Notes Data…………………………………………..30
7. Comparison of Data Averages per Student…………………………………………32
8. Pre and Posttest Academic Achievement Comparison……………………………34

1
CHAPTER 1
INTRODUCTION
Gifted students are commonly believed to be the students who receive straight
“A’s” on every report card, turn in every homework assignment, and answer any and all
questions the teacher asks. Though some students with giftedness do fit this
description, the statement is not necessarily true for all gifted students. Like all students,
students with giftedness have varying degrees of behaviors, including, unfortunately,
not working to their potential. This phenomenon is called, “underachievement”, and
Dowdall and Colangelo (1982) share that it is a discrepancy between potential and
actual performance (Reis & McCoach, 2000).
It is a commonly heard myth that a student receiving poor grades cannot possibly
be gifted (Dispelling myths, serving students, 2008). Whitmore (1986) states, “too often,
for no apparent reason, students who show great academic promise fail to perform at a
level commensurate with their previously documented abilities” (Reis & McCoach,
2000). When students with giftedness begin to underachieve, signs of this can show in
up in academics, or specifically, grades.
There is also a myth that students with giftedness are fine on their own. They
don’t need help (Dispelling myths, serving students, 2008). The National Association for
Gifted Children states, “gifted students need guidance from well-trained teachers who
challenge and support them in order to fully develop their abilities” (Dispelling myths,
2008). Low achievement can come from boredom and frustration when the guidance
and the challenge are not present in the curriculum (Dispelling myths, 2008).

2
Middle school is a time in a student’s schooling when underachievement can
accelerate (Rayneri et al., 2006). Therefore, if a student comes to middle school as an
underachiever, the underachievement can intensify. This can also mean that those
students, who are currently achievers, may begin to underachieve while in middle
school. Although these students have a strong ability to complete the tasks that are
before them, for many reasons, they underachieve. What can motivate these students
to achieve to their potential?

3
CHAPTER 2
REVIEW OF THE LITERATURE
Researchers have sought for years to understand students with giftedness. One
area, which receives more and more attention every year, is the phenomenon of
underachievement. Throughout the years, researchers have attempted to determine
what might be the cause of underachievement. Why do students who have such high
abilities perform at a low level at times? Past and current research attempts to pinpoint
the areas that reverse students from underachievement, and may keep them from
falling into this unfortunate pattern.
In 2009, at the time this research was conducted, other research had not been
published on the effectiveness of the Personal Success Plan (PSP). To gather literature
and data on the effectiveness, the researcher then sought to study research behind the
six main aspects of the PSP. Areas addressed in research include student interests,
their heroes and helpers, careers of interest; goals (academic and personal), plans
(short and long term), and interest projects students may study independently. The
research that was gathered to support the reversal of underachievement included
qualitative and quantitative studies, as this research design was a mixed method of
these two forms of data collection and analysis.
The term "underachiever" is defined by Merriam-Webster's Online Dictionary as
"one that fails to attain a predicted level of achievement or does not do as well as
expected" (2009). In education, this is not as easy to define as it appears in dictionaries.
Reis and McCoach (2000) state that "no universally agreed upon definition of
underachievement currently exists” (p. 152). The two researchers gathered various

4
definitions of underachievement and placed them in one of four categories: definitions
that include a discrepancy between potential and performance, definitions that
emphasize specific IQ or ability test score as a criterion for identification, definitions that
stress predicted achievement versus actual achievement, and definitions that stress
development of potential. In their study, Reis and McCoach concluded that because of
the overabundance of definitions and methods of identifying students with giftedness, a
difficulty in studying the characteristics of gifted existed; indicating that further research
is needed in the area of reversing underachievement to determine why a child
underachieves and what assistance they need to aid them in succeeding. The term
“underachievement” is also interpreted as meaning “poorer than expected performance
(poorer than might have been predicted from intelligence tests)” (Wordwebnet, 1999).
Both Wordwebnet by Princeton University (1999), and the Medical Dictionary (2010) are
in agreement that the intelligence quotient, commonly known as the “IQ”, is “a measure
of a person’s intelligence obtained by dividing the mental age by the chronological age
and multiplying the result by 100”. For the purposes of this paper, the term
“underachievement” is defined as when an individual has previously demonstrated an
ability to perform at a higher level academically than is currently demonstrated.
Characteristics of Students with Giftedness
Students with giftedness are often very different from their non-identified peers in
a number of ways. These students have a strong confidence in the way they believe
others perceive them (Sayler & Brookshire, 1993) and generally, have strong motivation
and task commitment (Davis & Rimm, 2004; Frasier & Passow, 1994; Reis & McCoach,
2002). Socially, they display feelings of acceptance by their peers (Sayler & Brookshire,

5
1993). Other traits of students with giftedness include a high ability to problem solve
(Frasier & Passow, 1994), a well-developed memory (Frasier & Passow, 1994; Reis &
McCoach, 2002), and insight abilities (Frasier & Passow, 1994). Researchers also
agree that students with giftedness have a strong imagination and/or strong abilities to
be creative (Frasier & Passow, 1994; Hebert, 2001; Reis & McCoach, 2002). Students
with giftedness have advanced interests (Davis & Rimm, 2004; Emerick, 1992; Frasier
& Passow, 1994; Hebert & Olenchak, 2000; Peterson, 2006) beyond that of the average
student. Increased abilities and skills to communicate (Frasier & Passow, 1994; Howell
& Heward, 2000; Reis & McCoach, 2002), strengths in inquiry, reasoning, and a sense
of humor are also common traits of giftedness (Frasier & Passow, 1994). However,
students who are classified as gifted can possess traits, which may be considered a
“road block” for these individuals, including perfectionism (Peterson, 2006; Reis &
McCoach, 2002) and a lack of organizational skills (Reis & McCoach, 2002).
Characteristics of Students with Giftedness… who Underachieve
As each individual student with giftedness is unique, underachievers are even
more so unique because of their underachievement phenomenon. Researchers agree
there are different types of gifted underachievers (Frasier & Passow, 1994; Reis &
McCoach, 2000, Reis & McCoach, 2002). The underachiever often lacks motivation,
where the achiever does not (Peterson, 2006). Low self esteem also follows the gifted
underachiever (Peterson, 2006; Rancifer, 1993; Reis & McCoach, 2002), as does a
dependent style of learning (Peterson, 2006). Underachievers often reject work that is
not challenging to the student (Peterson, 2006) and in the classroom, disruptive
behavior can occur when the child has high levels of creativity with low academic

6
success (Baum & Owen, 1988). The underachiever can be found in any financial class,
and does not always come from a poverty or at-risk background. (Colangelo et al.,
1993). The number of underachieving boys is higher than girls in elementary schools,
but as students get into middle school, high school, and even college, there appears to
be more underachieving girls (Davis & Rimm, 2004). Davis and Rimm believe this is
apparently caused by, “peer pressure and different behavior patterns (aggressiveness
versus conformity)” (p. 337, 2004). These behaviors in the classroom leave teachers,
and researchers, wondering what the root of the problem of underachievement is for
students.
Causes of Underachievement
Researchers have found many different causes of the phenomenon of
underachievement in their attempts to pinpoint the reasons students underachieve
(Emerick, 1992; Reis & McCoach, 2002). Academic achievement was a key point in this
research because Renzulli Learning encourages the use of this intervention for just that
purpose. To increase achievement, the setting in which achievement is being measured
can be addressed. Because the researchers were unable to control aspects outside of
the educational setting (for example students’ home environment, sleep, etc…), this in-
school intervention proves the appropriateness of the academic achievement study.
An important factor during the period of underachievement is to provide
appropriately challenging curriculum for the student (Emerick, 1992). At times, services
for students can be inappropriate simply because of poor communication between
regular education and those servicing students with special gifts (Tomlinson, 1995).
Underachievers are experiencing curriculum that is inappropriate for them (Hebert,
7
2001; Rancifer, 1993) and there is a poor match between their strengths and the
classes they are enrolled in (Hebert, 2001; Reis & McCoach, 2002). “There is a need for
schools that value uniqueness and talent in all children and that respect and nurture
giftedness wherever it is found” (Clark, 1997, p. 1). Researchers agree that children’s’
individual gifts must be considered when placing students in curricular classes. At times,
counselors are not made aware of the inappropriate placement of students in classes
until they begin to underachieve (Peterson, 2006). Tomlinson (1995) concluded that
general education teachers and special education teachers commonly disagree, and
that a common ground needs to be found between the two so that services are
appropriate for students. This act of disagreeing is apparent to students and can be part
of what Reis (2002) states is a cause for underachievement.
Researchers have also found causes for underachievement outside the school
setting, such as the family environment (for example, a dysfunctional family) and
parenting styles (David & Rimm, 2004; Peterson, 2006) and inconsistent role models
(Hebert, 2001). In the family, often, the underachieving gifted student is unable to
identify with the parent of the same gender (Davis & Rimm, 2004), which can create a
frustration on both sides in that neither is being understood. This inability to identify is
not present though if the parent is an underachiever like the student, or does not value
achievement (Davis & Rimm, 2004). Students can begin to underachieve when their
special talents or strengths are not nurtured, inside and outside of school.
Another factor can include the student’s own personal characteristics and traits.
Sometimes students underachieve because they have confused or unrealistic
aspirations in life (Hebert, 2001). Underachievement can also result from a personal

8
characteristic, such as low self-motivation, low self-regulation, or low self-efficacy (Reis
& McCoach, 2002, p. 115). Underachievement may be caused by perfectionist
tendencies. Students can procrastinate work and because of this, the workload begins
to get difficult. Students may also display other avoidance behaviors, including fear of
failure (Davis & Rimm, 2004).
At times, students who are gifted can also have disabilities, and often the
characteristics of the disabilities can hamper the giftedness in a student (Reis &
McCoach, 2002), which may then demonstrate the appearance of an underachiever.
Baum and Owen (1988) found that the high ability student had more academic success
than students with high abilities and a disability, which may also appear to be traits of an
underachiever. Often times, if students do not produce their abilities at the rate and level
the educational system asks for, the child may be classified as a student with special
education needs, tutoring needs, and/ or retention. These traditional techniques of
remediation offer, “Little challenges to high-ability students with learning disabilities and
may perpetuate a cycle of underachievement (Howell & Heward, 2000, p. 557). Reis
and McCoach concluded (2002), in their study, that one of the reasons a child has an
apparent underachievement problem is because it masks more serious physical,
cognitive, or emotional issues. Educators need to take a further look into a students’
underachievement before attempting to reverse the situation (Reis & McCoach). As a
final note, Davis and Rimm (2004) state that, “underachievement is a learned behavior
and can be unlearned”. Finding what reverses this for each child is now the question.
The Reversal of Underachievement

9
Research has shown that though there is no clear answer for reversing the
underachievement phenomenon, there are ways that have clearly aided students. As
previously mentioned, often students underachieve because the student’s classroom
instruction and curriculum is not matched appropriately to the student. Research
supports the need for a strong match stating, if a student underachieves; the pattern will
most likely remain unchanged at the secondary level “unless environments and
instruction are compatible with students’ needs” (Rayneri, 2006, p. 116). Educators
should attempt to match the instruction with students’ needs because a child’s “good
years” are created when a teacher “recognizes and provides” for students who are
gifted, and those teachers who don’t accommodate these needs create the students’
“bad years” (Davis & Rimm, 2004). Ensuring that classroom curriculum and instruction
challenges the student can be a key to reversing underachievement for some (Davis &
Rimm, 2004; Emerick, 1992). If gifted students are to make continuous progress and
not begin to underachieve, they will need additional challenges (Clark, 1997).
High expectations from the teacher of the student can also be a key (Davis &
Rimm, 2004; Emerick, 1992; Rancifer, 1993). Rancifer (1993) completed a study, which
concluded that in order to help students set higher goals and increase their learning;
teachers must maintain high expectations for student achievement. To aid in the
reversal of underachievement in the student who is gifted, there needs to be an interest
outside of school, which can be pursued and strengthened (Emerick, 1992; Peterson,
2006).
Having goals associated with academic achievement (Brown, 1999; Emerick,
1992; Rancifer, 1993) can also reverse underachievement. The relationship between

10
effort and goals is a concept that students who underachieve need to understand (Davis
& Rimm, 2004). It is important to have parents help students set these goals (Brown,
1999) and have high expectations of their child (Emerick, 1992).
Providing positive role models and mentors to students can also be beneficial
(Rayneri, 2006). Hebert and Olenchak (2000) made this statement about their study
involving mentors for underachievers,
The open-minded and nonjudgmental characteristics of the mentor were required to sustain an on-going relationship. Secondly, as a natural quality of a caring adult friend, each mentor provided his protégé with consistent and personalized social/ emotional support and advocacy beyond that associated with simple instructor-student relationships. Finally, a plan of strength and interest-based strategies for intervention to reverse patterns of underachievement was implemented successfully in each case. (p. 205) The mentors should be open-minded (Hebert & Olenchak, 2000), non-judgmental
(Emerick, 1992; Hebert & Olenchak, 2000), and positive (Emerick, 1992); so as to
ensure the student feels they have an adult they can confide in and trust to support
them. Hebert and Olenchak (2000) found that the mentor could aid in the creation of a
plan with interest-based strategies to reverse the student’s underachievement. The
mentor can also aid the student in his or her social and emotional difficulties (Peterson,
2006) and personalize social/ emotional support for the underachiever (Hebert &
Olenchak, 2000).
Sometimes, there are no “outside aspects” which reverse the achievement of a
student, only the changes in the student himself that can cause him to reverse and
begin to achieve at a level commensurate with his abilities (Emerick, 1992). In cases
like this, setting career goals can be a tool for reversing underachievement (Brown,
1999). Brown (1999) discussed focusing on life goals, or long term goals students have
11
for themselves, because students who are considered "underachievers" often do not set
educational and career goals that have strong meaning. Brown noted that goals are "an
important source of motivation for students" (p. 278). Due to the demand for education
in today's existing careers, career goals and educational goals should be established at
the same time.
In summary, there are different “types” of underachievers. There are different
ways to reverse underachievement, including enriching interests, having heroes,
helpers and mentors, having a career plan, creating academic and personal goals,
creating short and long term plans, and strengthening students’ interests through
projects.
Purpose of the Study/ The Problem
Underachievement is a common problem amongst students who are gifted and in
the middle level. In the classrooms, many students are underachieving and a need to
reverse this is present. Reis and McCoach (2002) conclude, "Underachievement of
bright students occurs for one of three basic reasons: (a) an apparent
underachievement problem masks more serious physical, cognitive, or emotional
issues, (b) the underachievement is symptomatic of a mismatch between the student
and his or her school environment, and (c) underachievement results from a personal
characteristic such as low self-motivation, low self-regulation, or low self-efficacy”
(p.115). Renzulli Learning created an intervention, The Personal Success Plan, which is
a program to be completed during the school day, to increase student achievement,
regardless of the cause. If completed correctly, the intervention is hypothesized to
decrease student underachievement.

12
The intervention is put into place with the intent that one of the various aspects of
the Renzulli Learning Personal Success Plan (PSP) will impact a student positively so
that he or she is motivated to academically achieve to their potential in their core
education classes.
The question examined in this study was, “If the Renzulli Learning PSP online is
put into place in a Gifted classroom of seventh grade students for 45 minutes a week for
ten weeks, will each child’s academic achievement in English, Mathematics, Social
Studies, and Science increase?”

13
CHAPTER 3
METHODOLOGY
The purpose of this research was to determine the impact of an online
intervention program geared to encourage research-based methods of reversing
underachievement through the analysis of academic achievement scores in English,
Mathematics, Social Studies, and Science. Data was collected on participants’
academic achievement scores, in the form of a percentage, in English, Mathematics,
Social Studies, and Science classes for each student. The participants included in this
research are described below. All were identified as qualifying under the special
education classification of gifted and are provided services according to the school
district’s preset guidelines.
Renzulli Learning created the Personal Success Plan (PSP) with the idea in mind
of increasing academic scores. This research collected data in three different ways that
linked to increases in achievement: academic scores/percentages, exposure time to
intervention, and a student-completed survey. The scores utilized determined if the
students who are underachieving increased their academic scores after the PSP
intervention. It was anticipated that this would provide quantitative data for analysis.
Renzulli Learning also recommends a minimum amount of time in which students
are to be exposed to the intervention. Therefore, data on how much time participants
actually do spend on the intervention was collected through frequency counts and
analyzed as quantitative data.
The third piece of data was quantitative and was the student-completed survey.
Participants were given the opportunity before and after the intervention to reflect on

14
how he or she felt they ranked in each area of the PSP. With these three data sets, the
researcher compared data and identified trends that supported the levels of
effectiveness of the intervention and a constant comparative method was then utilized.
Participants
The School. The classroom in this study was a middle school in a small Midwest
town of 25,000, which is a suburb of the largest urban city in the state. For the 2009-
2010 school year, the school had a population of 947 students. There were 510 males,
53.85% of the population, while 437 females made up 46.14%. Of the school
population, 809, 85.42%, of the students, identified as "White". The Family Educational
Rights and Privacy Act (FERPA) prevents Kansas State Department of Education from
disclosing information that may personally identify a student. Therefore, if there were
less than 10 students in each category, the exact number is not revealed. The number
of students who identified themselves as “Black” falls between 10 and 19,1.05%-2.00%.
Of the students, less than 10 considered themselves “Hispanic”. Of the students who
considered themselves American Indian or Alaska Native, less than 10 seventh grade
females, seventh grade males, eighth grade females, and eighth grade males were
enrolled at the school for each category. There were between 40 and 49 students who
considered themselves “Asian” and between 13 and 40 students who considered
themselves multi-ethnic. For the building, 282 students, 29.78% received free lunch,
and 99 students, 10.45% received reduced-lunch prices for an overall percentage of
40.23% on free or reduced lunch. Of the student body, 102 students were enrolled in
special education, not including gifted education.
The students/participants. In the seventh grade, there were 23 students

15
receiving services for gifted needs. Students were classified for gifted services
according to district guidelines. These students served, as the participants in this study
were in a pull out setting in which only students with giftedness were placed and
hereafter this setting is, called “Research”. From the pretest academic achievement
data, the researcher concluded that of the 23 students in the sample, four students
(student 1, 2, 8, and 20) are scoring less than an 80% in one or more of the four classes
being analyzed. For students to be considered for placement in the gifted program,
students must have high achievement on standardized tests. Therefore, students’
current academic achievement does not parallel abilities they previously demonstrated
upon placement in gifted.
The participants were selected as a sample of convenience. Students are divided
into two separate seventh grade classes, and the genders and races of the two groups,
for the 2010-2011 school year, are outlined in Table 1. Also presented are the building
percentages of gender and race, reflecting the 2009-2010 school due to lack of data at
the time of the study.

16
TABLE 1
STUDENT GENDER/RACE COMPARISON OF PARTICIPANTS AND BUILDING
Of the 23 participants, 11 were boys and 12 were girls. When comparing
the sample to the demographics of the school, it is evident that the number of boys in
the sample is lower than the demographics of the school, while the girls in the sample
are higher than that of the school population.
Only one of these participants is non-white, representing 4.35% of the population.
The Asian population in the sample is parallel with the overall building population, while
the White population is higher than that of the school’s.
The classroom. All participants were enrolled in the “Research” class, which is
the normal placement for seventh grade students with giftedness. Students receive 50
minutes of pull out services (or services apart from their non-identified peers) each day.
For the intervention, participants either worked on individual laptops in the classroom or

17
worked at individual desktops in one of the three available computer labs in the school.
To keep the environment consistent for participants, the laptops in the classroom were
the better option for participants to receive the intervention because it was the same
room and environment as their usual classroom. The location is noted in the field notes
spreadsheet (Appendix A) explained in the “field notes” section.
Procedures
Intervention (Lesson Plans)
In 2009, Renzulli Learning created and published the Personal Success Plan
(PSP). The program is advertised as having the ability to raise achievement and student
performance through student engagement. Due to this, the data collected and analyzed
revolved around student achievement scores in the regular education core curricular
classes (English, Mathematics, Social Studies, and Science). From the PSP program,
the participants received one-on-one support from in-school adults they identified to be
their helpers. Participants studied a project of interest to them and were able to
complete various activities online related to their interest, with the goal of greater
student engagement in their learning and academically achievement that was
commensurate with their potential.
The “plan” comes in two forms, the booklet version and the Internet version. The
first week of the intervention, participants used the Renzulli Learning Personal Success
Plan online. The intervention occurred once a week, for 10 weeks, 45-50 minutes each
session, for a total of between 450 and 500 minutes across the 10 weeks. The
intervention was carried out in the student’s classroom utilizing school laptops when
available. When these were not available, the participants relocated to one of the

18
technology labs to access computers.
The student began the seven-step intervention of the PSP model by logging into
the online program and creating a profile. They then moved to step one, in which
participants were asked questions relative to their area(s) of interest. Step two asked
questions about the child's individual ability. The third step asked participants’
expression style questions (written, oral, hands-on, artistic, etc…) concerning how the
student best expresses him or her. In the fourth step, participants were asked questions
to determine the child's best learning style.
From the analysis of these questions a thorough profile was created and
indicated to the student his or her individual interests, abilities, expression style, and
learning style. Participants were given a chance to express their interests in step six, in
which they were asked open-ended questions about their heroes and activities they
enjoy participating in. Step seven followed with online enrichment activities, which were
tailored, to the student’s profile. Participants chose the form of enrichment activity they
wanted to complete, and then chose an activity from a list of that particular type of
enrichment activities. A profile was created which displayed what each student
completed and which sites they visited. Participants were able to work on his or her
individual suggested enrichment activities or an interest project of their choice (see
Appendix B).
Also, in the PSP, participants were asked thorough questions based on
identification of their heroes and helpers both inside and outside of school. The system
sent an email directly to the teacher or professional in the building that the child
indicated as a helper, so that that person knew they had been identified as a student’s

19
helper. The student identified as many helpers in the school as he or she chose.
Notifying the adult was completed in an attempt to let the individual know that the
student sees them as a helper so that they could continue to positively influence the
child's life and thus, increase the possibility that a mentorship relationship would be
created. The participants were made aware of this before the selection, which may have
influenced who was selected.
Instruments
Pretest Achievement Data. The pretest consisted of each student’s grade
percentiles collected for English, Math, Social Studies and Science at the end of the first
quarter of the participants’ seventh grade year. Student records were utilized to gather
this data.
Pretest Survey Data. For additional data collection, participants took a survey,
prior to beginning the intervention. The teacher-created survey (see Appendix C) asked
questions pertaining to the various sections of the PSP. The purpose of the survey was
to gain student insight on how they feel about each aspect of their lives.
Posttest Achievement Data. After the intervention was utilized for 10 weeks,
the participants' percentages for their classes were gathered for quantitative data
analysis. To gather posttest data each student’s grade percentiles for English, Math,
Social Studies, and Science were obtained again through the school’s online database,
at the end of the second quarter. Each student’s percentiles for these four subject areas
were then compared to the pretest scores to determine differences. Once again student
records were utilized to gather this data.
Posttest Survey Data. Participants were given the survey again after the

20
completion of the intervention. The quantitative data were reviewed and compared with
the pretest qualitative data. This data was analyzed to determine if the participants’
views and beliefs on how they grew in each area of the PSP intervention would be
revealed (see Appendix C).
Note process. The data gathered from the pretest was printed from the school's
database, computed, logged into a spreadsheet, and filed. During the intervention,
participants completed the PSP online, which allowed for constant access to the
participants’ data. When the intervention was completed, grades were printed a second
time and analyzed. The two sets of data (pre and post) were then compared.
To gather qualitative data, the spreadsheets of field notes were utilized each day
to record the participants' comments, reactions, progress and behaviors (see Appendix
A). To ensure confidentiality, numbers referenced participants.
Field Notes. During each PSP intervention lesson, qualitative observational field
notes were taken on each student’s performance (see Appendix A), which was then
converted into quantitative data per amount of time spent working within the research
class. The classes consisted of 12 and 13 participants, and data collection consisted of
observations of all participants at a time during the class period. Comments were made
for each student; for example, “Student worked 35 minutes of the 45” or “Student was
absent today” or “Student was distracted and spent 50% of the time on the intervention.”
The notes were translated into a score. See Table 2 below for further explanation of
how points were determined.

21
TABLE 2
FIELD NOTES POINTS EXPLANATION
Score Explanation of Each Point
0 Student worked 0-24% of the class time on the intervention, or 0-10 minutes.
1 Student worked 25-49% of the class time on the intervention, or 11-21 minutes.
2 Student worked 50-74% of the class time on the intervention, or 22-33 minutes.
3 Student worked 75%-99% of the class time on the intervention, or 34-45 minutes.
4 Student worked 100% of the class time on the intervention, or 45 minutes or more.
Quantitatively, each student received a score for each of the 10 days of the
intervention. The scores were then averaged together to generate one overall score for
the average amount of time participants were exposed to the intervention. Providing
qualitative data, observational field notes were taken also to record personal,
methodological, and theoretical notes. Personal reactions of the observer were logged
in “personal notes”, as well as how the observer felt, any self-reflection the observer
had, or memories or impressions the observer experienced. Personal notes included
brief statements such as “entire class appeared to be focused and on task”. Any type of
description of the method that was used was recorded in “methodology notes”, as well
as a reason for using those methods, and ideas for possible changes. Methodology
notes included only comments similar to “had computers out and turned on for
participants to increase intervention contact time”. Theoretical notes then included any
emergent trends or hypotheses. Field notes were collected in this form to discover any
correlation between the amount of time spent on the intervention, and the amount of

22
academic percentage increase or decrease each child has.
After the academic posttest data was gathered, it was determined that further
data was needed from the participants. In a one-on-one setting, the participants who
decreased academically after the intervention and posttest participated in individual
qualitative/interview discussions with the instructor to determine if the student knew
what kept him/ her from academically achieving. Appendix D displays the questions,
which were asked of the participants individually. Results of these questions were
displayed and discussed in the Results section.
Research Consent/ Assent. To begin research, a proposal (Appendix F) was
submitted to Wichita State University and permission was granted through the approval
of an Institutional Review Form to conduct the research. To receive consent from
parents of student participants, the research was explained to parents verbally on a
parent night at the school. Parents of possible participants were asked at that time to
sign the consent (Appendix F). For those parents whom did not attend the parent night,
email messages were sent home with the consent attached and parents were asked to
print the consent, sign if they agree to allow their child to participate, and send it back to
school. If parents were unable to be reached at that point, a consent form was sent
home with students regarding the research. At the same time parents were asked to
sign the consent forms, students were asked to sign the assent forms (Appendix F). For
those students who did not attend the parent night at the school, assent forms were
provided in class and explained to students verbally. Students were asked to sign the
assent forms if they were willing to participate.

23
CHAPTER 4
RESULTS
The sample of 23 seventh grade participants with giftedness received the PSP
intervention for 10 weeks, one 45 minutes for each week. Three forms of data were
collected including the academic achievement pre and posttest data (quantitative), the
data from the pre and posttest survey (quantitative), and the time on task field notes
(qualitative).
Data from Academic Records. Pre and posttest data as well as survey data
were compared for academic achievement. Table 3 outlines this comparison.
TABLE 3
ACADMIC ACHIEVEMENT PRE AND POSTTEST DATA

24
The table above outlines each student’s pretest and posttest academic scores
expressed as percentages for each core curricular class according to school records,
and then compared the two pieces of data (seen in the chart as “diff” for “difference”).
The four “differences” for each student were then averaged to come up with one
average per student. The data reflects that, on average, academic scores for each
curricular class did decrease, but all decreases were small and not significant.
Language Arts decreased a half of a percentage point, Mathematics decreased eight-
tenths of a point, Science dropped by a little over a single percentage point, and Social
Studies fell a little over half of a percentage point.
Ten participants were able to increase their percentage averages between the
pre and posttest, while 14 participants dropped between the pre and posttest. Seven
are changes that can be considered insignificant because they are an increase or a
decrease of less than 1 percentage point on average.
Data from Student-Completed Survey
The second source of data collected and analyzed was the teacher-created pre
and posttest achievement survey (Appendix C). Participants completed these surveys
prior to the intervention to display how they felt about their progress in each area of the
Personal Success Plan (PSP). The participants were questioned on their ability to know
what they were interested in and how strongly they pursued them. Participants were
also asked about how many people they would consider to be their heroes and how
many they would consider to be people who help them. A third portion of the PSP
included careers, in which participants were questioned on how well they know what

25
they want to be in life and if they know what it takes to get there. They were also asked
if they would do what was necessary to obtain their chosen career, if they have one.
Participants are asked about their academic goals. The questions were not assigned a
numeric value, but an alphabetic grade and therefore were not able to be numerically
compared in Table 4, but were reflected and discussed in Table 5.
The next two questions allowed participants to give a numerical number (as in
the first six questions of the survey) to rate how they feel about their personal goals and
their ability to achieve them. Participants were asked about their short term plans and if
they have plans to work towards achieving them. Long terms plans were then
addressed in the same format as the short term plans. The last section of the survey
asked project-related questions. Participants were asked about their ability to choose a
topic of their interest to study, and if they would have enthusiasm over being able to do
this in school. Table 4 below represents the results of the comparison of the pre and
posttest data. The number reflected is simply the difference between the pretest and
posttest answer provided by each student. The differences are then averaged together
to reflect the student as a whole.

26
TABLE 4
SURVEY RESULTS PRE AND POSTTEST DATA
The data shows that 17 out of 23, 70.8%, of the participants in the sample, had
steady or increased survey scores between the pre and posttest. The remaining 6
participants, 29.2%, had a decrease of 1.00 or less. When viewed by sections, one
question from the heroes and helpers, “ How many people do you consider your
hero(es)” reflects a decrease of -0.57 points when all 23 were averaged together. This
may be due to the fact that after completing the PSP and learning more about their
individual strengths and interests, participants’ interest in others as heroes was able to
be more focused to a few individuals. When averaged with the other heroes and helpers
score, an increase was then demonstrated for that section of .22 points, one-fifth of a
single point.

27
The only other question demonstrating a drop in scores between the pretest and
posttest was the first question on the survey relating to interests. The question asked
how strongly participants feel in their knowledge of his or her individual interests. The
data showed a 0.09-point drop, or a 9% drop of a single point. The remaining 12
questions, 86% of the questions, demonstrate an increase when participants’ responses
were averaged together.
When looking at the sample as a whole, on average each question increased
between the pre and posttest of .57 points, showing an overall increase in participants’
confidence in the 8 areas addressed in the PSP. Thus when averaging the participants’
increases or decreases together as a whole, there was an overall increase in
participants’ confidence in each area of the PSP.
The following table, Table 5, addresses the three academic questions on the
student survey. Participants were not to answer with a number on a scale from one to
ten, but with a letter grade. The pretest survey data and posttest survey data were
compared and the comparison was interpreted. Therefore, the data is shown simply
with a plus sign (+), meaning that a student felt better about their academic
achievement between the pretest and posttest, a minus sign (-) meaning a student felt
their academic skills decreased between the pretest and posttest, or the number zero
(0) meaning there was no change in their responses between the pretest and posttest.
For example, if a student marked on their pretest survey that they were a “B” student,
and then on the posttest survey they marked that they were an “A” student, they were
assigned a plus sign (+) for the analysis of that data.

28
TABLE 5
SURVEY RESULTS: PRE AND POSTTEST COMPARISON FOR ACADEMICS
The first question addresses what grades participants want to make. The data
shows that 6 of the 23, 26%, wanted to make better grades after the intervention than
before and 13 out of the 23, 57%, were consistent in the grades they wanted to achieve.
When referring to the second question which asks about the grades participants actually
make, only 1 student, 4%, felt their grades decreased on average from the end of first
quarter to the end of second quarter, or the duration of the intervention. Eight of the
participants felt their grades increased, and 14 participants felt their grades stayed the
same. When looking at Table 3, it is evident that the student, who felt that he or she

29
made lower grades, did in fact achieve a lower grade than before the intervention, but
looking at the student’s time on task with the intervention may aid in explaining exact
why. The third question addressed is what participants believe is their potential to
achieve. Five participants in the sample, 22% felt they actually have the potential to
make better grades than before the intervention was put into place. The majority of the
participants, 74%, felt the same about their potential as they did during the pretest
survey.
Data from Observation Notes
The third source of data was the observation time on task, or notes. Each time
the participants completed the PSP intervention; notes were taken on each student’s
amount of time spent on the intervention. Participants who spent 100% of the time
provided on the intervention were assigned a “4”. Participants who spent 75-99% (34-45
minutes) of the time were assigned a “3”. Participants were assigned a “2” if they
worked 50-74% (22-33 minutes) of the time given, and participants received a “1” if they
worked 25%-49% (11-21 minutes). Participants then received a “0” if they worked 0-
24% (0-10 minutes) of the time. See table 2 for further explanation of how points were
assigned.

30
TABLE 6
OBSERVATIONAL TIME ON TASK NOTES DATA
The above data displays an overall average score of 3.49 out of 4.0, which is
87% of time provided to the participants was spent on task on average overall. The
chart also displays that three out of the 23 participants received an overall average of a
four out of four, which is 100% on the intervention. One could hypothesize that these
participants’ data more accurately represented the effectiveness of the PSP intervention

31
because these participants had the recommended contact with the intervention
according to Renzulli Learning. Of the sample, 14 participants received an average
score of 3.5 to 3.9, four of 23 participants scored a 3.0 to a 3.4, and two participants
scored less than a 3.0.
The idea behind the collection of three different methods of data was to be able
to determine a positive connection between the increase in participants’ academic
increases and the amount of time spent on the intervention. From there, the survey
results were used as supportive data in determining positive correlations in the data.
The data was then reordered from decreased academic results to increase academic
results, least interventional exposure to greatest interventional exposure, and
decreased to increased pretest to posttest survey results.
Table 7 below reflects the reorganization of the data. Academic averages are
listed by most decreased academic average to greatest increase academic average.
Interventional exposure has also been organized from least amount of time on the
intervention to the most interventional exposure. The last column lists the survey results
that show the greatest decrease to the results that show the most increase.

32
TABLE 7
COMPARISON OF DATA AVERAGES PER STUDENT
The data presented in Table 7 above has specific participants highlighted due to
a large academic average loss or a large academic average gain. Warm colors (red,
orange, yellow) represent a drop in academic achievement while cool colors (greens
and turquoise) represent an increase in academic achievement.
Academic Decreases. Student 20 had the greatest average academic loss
amongst the sample; 10.25 points were dropped on average between the student’s pre
and posttest results. This student only spent 82.5% (3.3 average out of 4) of the time
provided on the intervention. By comparison, 18 out of 23 participants in the sample

33
spent more time on the intervention than this student. The student’s survey results did
show an increase between pre and posttest survey results with an average increase of
.21 points. Given the issue that the student did not spend 100% of the recommended
time on the intervention, it is difficult to conclude on the intervention’s effectiveness with
this student. This student was previously considered to be an underachiever because
he was academically achieving in one or more areas prior to the intervention.
The second largest average academic decrease was by student 9 who dropped
an average of 7 points in academic results. This student only scored an average
intervention score of a 1.7 out of 4, 42.5%, of available time on the intervention. This
student also reflected an average decrease in survey scores of .50. Based on the
student’s responses on the posttest survey, the student reflected that he or she has the
potential to perform at an “A+” level, but performs at a level lower than that (Appendix
E).
Student 17 dropped an academic average of 5.75 points, with 20 participants
academically averaging higher than this student. The participants’ interventional time on
task showed that the student scored an average of a 3.3 out of 4, 82.5%. This student
also demonstrated a decrease in survey results of an average of -0.86 per question.
Another student who had an average academic decrease is student 8, with an
average of one percentage point loss between pretest and posttest scores. This student
spent an average of 1.1 points out of 4, or 27.5% of the provided intervention time on
task. This student’s data is not valid data to consider when determining the effect of the
intervention because of the lack of time actually spent on the intervention. This student

34
was also previously identified as an underachiever based on academic scores below
80% in one or more academic areas.
Due to the low amount of time spent on the intervention, it is difficult to determine
reliability of the effectiveness of the intervention with these participants.
Academic Increases. Of the 23 participants, six students made academic
average gains by one percentage point or higher. Table 8 below provides a visual
comparison of pretest and posttest academic achievement data for the six students
whose scores increased above one percentage on average.
TABLE 8
PRE AND POSTTEST ACADEMIC ACHIEVEMENT COMPARISON
The student with the greatest academic gain is student 1 with an average
increase of 6.75 academic percentage points. This student spent 100% of the allotted

35
time on the intervention as recommended by Renzulli Learning. This student also
demonstrated higher levels of confidence among the areas of the intervention, as
reflected in the 1.07 average points per question on the survey. Data shows that the
student spent 100% of the allotted time on the intervention, increased his or her overall
academic performance, and also had an increase confidence level in the different areas
of the PSP. This student was identified as a possible underachiever based on low
academic achievement prior to the intervention.
Student 2 had the second greatest increase academically with an average
increase of 4.75 percentage points. This student scored a 3.7 out of 4, 92.5% of the
allotted time on the intervention. Similarly, student 7 scored an academic average of
2.75 percentage points and scored a 3.9 out of 4, 97.5%, on the intervention exposure
results. Student 2 was also previously identified as a possible underachiever by the
research. This student was academically achieving at less than an 80% in one or more
academic area.
Receiving an average increase of 1% academically between pretest and posttest
scores, student 21 showed a strong intervention percentage as well. This student
scored a 3.8 out of 4, 95%, for time on task during work on the intervention. This
student also has an average increase of 1.07 points on the survey.
Student 10 had an academic average increase of 1%. This student also spent
100% of the time allotted on the intervention and had the greatest increase in survey
percentage points. Student 10 completed the survey, which demonstrated an average
increase of 3.36 points, the greatest increase of the entire sample.

36
Of the 23 participants in the sample, three participants spent 100% of the
recommended time on the intervention. All three participants demonstrated an average
academic gain and a confidence increase as demonstrated through the survey. This
data supports the claims behind the PSP, which aim to increase student academic
achievement through the use of the intervention.

37
CHAPTER 5
LIMITATIONS
It was recommended by Renzulli Learning, for students to work on the Personal
Success Plan for 45 minutes to one hour each week, for 10 to 12 weeks. For scheduling
purposes, the instructor in this research activity was limited to 10 weeks for 45 minutes
each week. Class periods in which students were enrolled ranged from 52 to 54 minutes
in length.
The Renzulli Personal Success Plan was created based on the Renzulli Learning
Schoolwide Enrichment Model. The idea is that the entire school would adopt the
program; therefore increasing teacher and student buy in. One of the results of the
program being utilized school wide is that all of the teachers and staff in the school
know their students are utilizing the program, and are more apt to support the students
in their venture.
In this study, there was one teacher implementing the intervention and collecting
data. This limited the amount of support and encouragement students received while
participating in the intervention program. Though staff throughout the building were all
made aware, they did not have first hand experience with the program and were less
likely to support these individual students on a one-on-one basis.
The students who participated in this study were students identified as Gifted in
the seventh grade. Therefore, a sample of convenience was utilized, which limits the
ethnicity and socio-economical statuses of the sample to only those already identified
as Gifted at this school building. This, in turn, is limited by the ethnicity of the students

38
enrolled in the school building (Table 1).
Due to the small sample size, both achieving and underachieving students were
utilized for the study. When an achieving student utilizes an intervention meant for
underachievers, it is difficult for an achiever to show growth because he or she is
already academically achieving. If the student drops even one percentage point
academically, it appears in the data as a loss, when really it may be a drop from a 99%
to a 98%, which is not characteristically categorized as “underachievement”. The
student is maintaining a very high percentage, two percentage points away from 100%,
or doing absolutely every assignment the teacher assigns, and answering every single
question correctly on each of those assignments. Additionally, the small sample size
would limit generalization of the results beyond the participants of this study.

39
CHAPTER 6
DISCUSSION
Research was completed to determine the effectiveness of the Renzulli Learning
Personal Success Plan in the seventh grade Gifted classroom, measuring academic
achievement in English, Math, Social Studies, and Science for 23 students for the
recommended time of 45 minutes per week for 10 weeks. Academic percentages for
these four classes were gathered before and after the intervention were put into place.
In addition to academic achievement, data was collected during the intervention on the
time in which participants were exposed to the intervention. Participants also completed
a pretest and posttest survey reflecting questions related to the areas of the PSP.
Student interviews were also conducted for those participants who demonstrated
underachieving characteristics academically.
Many of the participants included in the study were already academic achievers
before the intervention was put into place. The student’s original scores need to be
considered when interpreting the data, considering not all participants were
underachievers. For those participants who were academically achieving before the
intervention, not much academic growth was found, which may appear as if the
intervention was ineffective for the participants, when in fact, the student had no
opportunity to academically grow from the intervention. Even if 100% of the time
provided were spent on the intervention, if the student was a straight “A” student prior to
the intervention and remained a straight “A” student after, academic data would show
that the intervention was not effective on this student when no growth is possible. This

40
appears to be the case for many of the participants. When looked at by subject prior to
the intervention, two participants out of 23 scored less than an 80% in English
(participants 2 and 20), two scored less than 80% in Math (participants 1 and 8), no
participants scored less than an 80% in Science, and no participants scored less than
an 80% in Social Studies. After the intervention, one student scored less than 80% in
English (student 20), one student scored less than 80% in Math (student 8), one student
scored less than 80% in Science (student 20), and one student scored less than 80% in
Social Studies (student 20). Four participants prior to the intervention were scoring
below an 80% in any of the subject areas, and four participants after the intervention
were scoring below an 80% in any of the subject areas.
Academically, seven of the 23 participants, 30%, had an average academic
change (increase or decrease) of less than one percentage point. Six participants, 26%,
had an academic increase at 1% or greater. Seven participants, 30%, had a decrease
between 1% and 4.25%, and three, 13%, had a loss anywhere between 5.75% and
10.25%. The participants with greatest decrease show a positive correlation between
the losses, the intervention exposure time, and often, the survey results in that all
scores went down for most of these participants with more than 5.75% academic
decreases.
Intervention Exposure Discussion. Observationally, 3 of the 23 participants,
13%, spent the recommended time on the intervention. There is a positive difference
between their contact time with the intervention and increased academic scores. Of the
sample, 14 participants, 61% spent somewhere between 87.5% and 97.5% of the
recommended time on the intervention. Of the remaining participants, 4, 17%, spent

41
between 75% and 85% of the recommended time on the intervention, while the
remaining two spent 27.5% and 42.5% of the recommended time on the intervention.
There is a positive difference between decreased academic student achievement and
interventional exposure for these participants.
Survey Discussion. Reflectively, the pretest and posttest student-completed
surveys provide some insight on how participants felt they grew in each area of the
intervention. Participants answered questions and assigned a numerical value as an
answer to each. Two participants showed no average increase or decrease per
question, which is represented to mean those two participants felt the same about
themselves in the areas of the PSP before and after the intervention. Fifteen of the 23
participants, 65%, showed an increase between the pretest and posttest scores. Six of
the participants decreased in scores, but all six were a decrease of one point or less per
question. This decrease shows that they did not feel as strong in each of the areas
addressed on the survey after the intervention as they did prior to the intervention. The
one student with the greatest gain between pretest and posttest scores for the survey,
student 10, spent 100% of the recommended time on the intervention and academically
gained an average of 1% per curricular area.
Interview Discussion. Some of the participants’ academics actually decreased
after the intervention was put into place. Out of the 23 participant sample, five students’
academic achievement average decreased three and a half (3.5) percentage points or
greater. Of these five students, one was previously considered to be an underachiever
and continued to underachieve further after the intervention. The teacher then
conducted one-on-one interviews with these students and reflected on the interviews. A

42
recurring theme became evident which is later discussed. The researcher interviewed
each student utilizing prewritten questions (Appendix D).
Student 20 had the greatest drop in academic achievement, only participated in
the intervention 82.5% of the time (with only four participants receiving less
interventional contact), and made a very slight increase in survey results. Through
questioning this student, the researcher was provided with some qualitative information
as to why this decrease may have occurred. The student reflected that he felt distracted
during second quarter, the time frame in which the intervention was put into place. He
revealed that he was not getting much sleep and was often physically tired. When
asked if his teachers could do anything to help him, he stated that he did not feel he
needed any assistance at this time.
Student 9 had the second greatest drop in academics, with an average decrease
of 7 percentage points. This student also had very little contact with the intervention,
spending only 42.5% of the recommended time on the intervention. This student
dropped, on average, .5 points per question on his survey. Through the interview, this
student revealed that he feels his grades dropped because he was not getting much
sleep. He was less motivated and was absent from school often (six full school days,
and 5 ½ half days). His mother had trouble getting him to school on time.
The third student with an average academic decrease greater than 5 percentage
points is student 17. This student dropped 5.75 percentage points academically, spent
only 80% of the recommended time on the intervention, and, on average, dropped .86
points per question on the survey. This student was unable to clearly define what may

43
have been going on, but did share that he was having social issues at the time and was
definitely distracted from his homework.
The student with the least exposure to the intervention, student 8, spent 27.5% of
the recommended time on the intervention and decreased academically on average 1%
as well. The above four participants (participants 20, 9, 17, and 8) all had an exposure
to the intervention of 82.5% of the time or less. Therefore, considering the participants
did not receive the amount of time on the intervention as recommended by Renzulli
Learning, it is impossible to come to a conclusion that the intervention is ineffective.
Because of the student’s disability (attention deficit hyperactivity disorder) and low drop
in average academic achievement, the researcher did not feel it beneficial to interview
this student.
Student 5 dropped an average of 4.25 percentage points academically and
shared that she did not know what caused her grades to drop during this time frame, but
that she has been working harder to academically achieve since they did fall. Another
student, student 18, mentioned that the reason his academic scores fell (3.5 percentage
point average fall) was because he was not getting enough sleep. He missed two full
days of school during that quarter. He struggled with waking up in the morning and
going to school because he was unable to get much sleep. The student also reflected
that he only really enjoyed two out of his seven classes, one of which is a talent
enrichment class, and the other class is the one in which he received the PSP
intervention.
A commonality amongst the five participants interviewed is that none of the five

44
had the recommended exposure to the intervention. Most students spent 82.5% of the
recommended time on the intervention, while only one student spent 95% of the
recommended time on the intervention.
Of those participants interviewed, a recurring theme appeared as to why
participants began to underachieve. Participants 20, 9, and 18 (60% of the interviewed
sample) all shared that they were not getting much sleep at the time of the intervention
and reflected that their achievement was academically declining because of this. This
topic may be one for future research. Other issues mentioned included social issues or
distractions and poor attendance, both areas not specifically addressed with the
Renzulli Learning Personal Success Plan.
Another recurring theme was that of distraction or social issues. Student 20 and
student 17 stated that he or she was distracted during the time frame of the intervention.
This amounts to 40% of the interviewed sample. Social issues or factors outside of
academics and school are researched previously as a cause for underachievement.
Two different students (students 18 and 9) stated low motivation/ interest was a reason
for their underachievement during the intervention. This too is supported in research as
a cause for underachievement.

45
CHAPTER 7
CONCLUSION
The question asked was, “If the Renzulli Learning PSP online is put into place in
a Gifted classroom of seventh grade participants for 45 minutes a week for 10 weeks,
will each child’s academic achievement in English, Mathematics, Social Studies, and
Science increase?” Through observation of the data, specifically Table 7, there appears
to be a positive difference in percentage points with utilizing the Personal Success Plan
intervention 100% of the recommended time and increased academic achievement.
There was also a positive difference in percentage points between utilizing the Personal
Success Plan intervention 100% of the recommended time and student’s survey results.
Five of the 23 participants increased their academic achievement by an average of 1
percentage point or higher and those five participants spent 92.5% of the recommended
time on the intervention or more. Out of the 23 participants, three participants spent the
entire recommended time on the intervention. All three participants were able to
increase their academic achievement. The third piece of data for these three individuals,
the survey, also shows a positive correlation in that all three participants had increased
survey results between their pretest and posttest.
There also appears to be a positive difference in percentage points between
decreased academic achievement results and little time spent on the intervention. Three
participants’ pretest and posttest scores showed a drop in academic achievement at
5.75% or higher on average. These three participants also spent 82.5% or less of the
recommended time on the intervention. The third piece of data is reflective of this as
well, with one student only showing an increase of one-fifth, .21, of a point average

46
increase in survey results, while the other two participants’ survey results fell, just like
their academic achievement. These participants were addressed in the Discussion
section of the paper in more detail.
The research question was, “If the Renzulli Learning PSP online is put into place
in a Gifted classroom of seventh grade participants for 45 minutes a week for 10 weeks,
will each child’s academic achievement in English, Mathematics, Social Studies, and
Science increase.” It can be answered that in this study, with these participants, for
those students who did participate on the intervention as recommended, academic
achievement did in fact increase in English, Math, Social Studies, and Science.

47
CHAPTER 8
FUTURE RESEARCH
There are many ways to utilize this intervention in the future. It is possible to
narrow down the intervention to only those who are underachieving at the time the
intervention is put into place. This would provide the opportunity to focus in on the
underachievers in the classroom more, instead of having both achievers and
underachievers amongst the sampling population.
Pretest and posttest data was collected for the intervention and compared. In the
future, if possible, having data present to interpret throughout the intervention would be
useful as well. It may provide data showing which point in the intervention process was
the most effective for students.
Renzulli Learning created the Personal Success Plan online, in which students
are able to login and create goals, plans, and identify their heroes and helpers. Students
then have activities with which they can digitally interact to engage their interests.
Lastly, students are able to pick a project of their interest to complete. This online
intervention was put into place and data was analyzed. Renzulli Learning also created a
booklet version of this. Due to the limitations of a booklet, the online enrichment
activities geared towards students’ interests are not possible. Future research may
include utilizing the booklet version and analyzing the data, possibly comparing the
booklet data with the online data.
Renzulli Learning recommends that the PSP be utilized school-wide to best meet
the needs of the students. Therefore, all students would be working on the same

48
program and teachers would be more used to assisting students as students identify
these adults as helpers in their schools. This was unable to be done in this study, but in
the future, utilizing a larger sample and analyzing the data would provide researchers
with more data for analysis.
Another possible form of future research that was previously mentioned is sleep
and student achievement or underachievement. Participants 20, 9, and 18 (60% of the
interviewed sample) all shared that they were not getting much sleep at the time of the
intervention and reflected that their achievement was academically declining because of
this. This topic may be one for future research as it is not addressed in the PSP, but
results from such research may identify other ways in which underachieving students
can be helped.
Utilizing current data, another way to extend the research is through looking
specifically at the classes in which students achieve or underachieve. Researchers
could look at data on an individual level, analyzing trends by class. Questions asked
might include how the academics of students with the intervention compared to the
academics of students without the intervention in English, Mathematics, Social Studies,
and Science classes. Furthermore, the data could be broken down by subject and by
teacher and then compared with peers who were not exposed to the intervention. Did all
of the students with Giftedness who received the intervention in Mrs. Smith’s class have
grades that decreased at the end of second quarter?

49
REFERENCES

50
REFERENCES
Albrecht, E., B.A. (2009). Improving secondary school students’ achievement using intrinsic motivation (Master’s thesis, Saint Xavier University, Chicago, Illinois). Retrieved on 10/25/2009, from http://www.eric.ed.gov/PDFS/ED504829.pdf
Baum, S., & Owen, S. V. (1988). High ability/learning disabled students: How are they
different? Gifted Child Quarterly, 32(3), 321-326. Brown, D. (1999). Helping high-potential underachievers set career and educational
goals using the Internet. In Proven strategies for improving learning & achievement (pp. 273-290). Retrieved on 11/30/2009 from http://www.eric.ed.gov:80/ ERICDocs/data/ericdocs2sql/ content_storage_01/ 0000019b/80/17/8e/98.pdf
Brown, D. (1999). Summing up: Principles and practices. In Proven strategies for
improving learning & achievement (pp. 291-296). Retrieved on 11/30/2009, from http://www.eric.ed.gov:80/ ERICDocs/data/ericdocs2sql/ content_storage_01/ 0000019b/80/17/8e/98.pdf
Clark, B. (1997). Growing up gifted (5th ed.) Columbus, OH: Merrill/ Prentice Hall. Clark, B. (1997). Social ideologies and gifted education in today's schools.
Peabody Journal of Education, 72(3-4), 81-100.
Colangelo, N., Kerr, B., Christensen, P., & Maxey, J. (1993). A comparison of gifted underachievers and gifted high achievers. Gifted Child Quarterly, 37(4), 155-160. Retrieved on 3/17/2010, from http://gcq.sagepub.com/cgi/content/ abstract/37/4/155
Davis, G. A., & Rimm, S. B. (2004). Characteristics of gifted students.
In Education of the gifted and talented (5th ed., pp. 32-53). Boston: Pearson.
Davis, G. A., & Rimm, S. B. (2004). Underachievement: Diagnosis and treatment. In Education of the gifted and talented (5th ed., pp. 305-338). Boston: Pearson.
Dispelling myths, serving students. (2008). Myths about gifted education. Retrieved on August 22, 2010, from http://www.nagc.org/myth_poorgrades.aspx
Emerick, L. J. (1992). Academic underachievement among the gifted: Students’
perceptions of factors that reverse the pattern. Gifted Child Quarterly, 36(140), 140-146.

51
Frasier, M. M., & Passow, A. H. (1994, December). Towards a new paradigm for identifying talent potential (Monograph No. 94112). Retrieved on 11/15/2009, from http://www.eric.ed.gov:80/ ERICDocs/data/ericdocs2sql/ content_storage_01/ 0000019b/80/14/35/a9.pdf
Hebert, T. P. (2001). "If I had a new notebook, I know things would change": Bright
underachieving young men in urban classrooms. Gifted Child Quarterly, 45(3), 174-194.
Hebert, T. P., & Olenchak, F. R. (2000). Mentors for gifted underachieving males:
Developing potential and realizing promise. Gifted Child Quarterly, 44(3), 196-207.
Howell, R. D., & Heward, W. L. (2000). Giftedness and talent development. In W. L.
Hewarde, Exceptional children: An introduction to special education (A. C. Davis, Ed., 6th ed., pp. 532-575). Upper Saddle River, NJ: Prentice-Hall.
Intelligence quotient. (1999). Retrieved on March 31, 2010, from
http://wordnetweb.princeton.edu/perl/ webwn?s=intelligence%20quotient Intelligence quotient. (2010). Retrieved on March 31, 2010, from http://medical-
dictionary.thefreedictionary.com/intelligence+quotient Merriam-Webster, Incorporated (Ed.). (2009). Underachiever. In Merriam-Webster
online. Retrieved on 4/3/2011, from http://www.merriamwebster.com/ dictionary/ underachievement
Peterson, J. S. (2006, October 1). Addressing counseling needs of gifted students The
Free Library. (2006). Retrieved on August 05, 2010, from http://www.thefreelibrary.com/Addressing counseling needs of gifted students-a0153359890
Rancifer, J. L. (1993, November). Correcting impaired student self-concepts: An
instructional leadership strategy for teachers and principals. Retrieved on 11/30/2009, from http://www.eric.ed.gov:80/ ERICDocs/data/ericdocs2sql/ content_storage_01/ 0000019b/80/15/8a/b3.pdf
Rayneri, L. J., Gerber, B. L., & Wiley, L. P. (2006). Relationship between classroom
environment and the learning style preferences of gifted middle school students and the impact on levels of performance. Gifted Child Quarterly, 50(2), 104-118. Retrieved on 2/17/2010, from http://gcq.sagepub.com/cgi/ content/abstract/50/2/104

52
Reis, S. M., & McCoach, D. B. (2000). The underachievement of gifted students: What do we know and where do we go? Gifted Child Quarterly, 44(152), 152-170.
Reis, S. M., & McCoach, D. B. (2002). Underachievement in gifted and talented
students with special needs. Exceptionality, 10(2), 113-125. Sayler, M. F., & Brookshire, W. K. (1993). Social, emotional, and behavioral adjustment
of accelerated students, students in gifted classes, and regular students in eighth grade. Gifted Child Quarterly, 37(4), 150-154.
Sunde Peterson, J., Ph.D. (2006, October). Addressing counseling needs of gifted
students. Professional School Counseling, 10(1), 43-51. Tomlinson, C. A. (1995). Gifted learners and the middle school: Problem or promise?
ERIC EC Digest, E535. Retrieved on 11/30/2009 from http://www.eric.ed.gov/PDFS/ED386832.pdf
Underachievement. (1999). WordNetSearch - 3.0. Retrieved on March 31, 2010, from
http://wordnetweb.princeton.edu/perl/ webwn?s=underachievement

53
APPENDICES

54
APPENDIX A
FIELD NOTES SPREADSHEET: HOUR 1
Date: _____ Day: M T W Th F Time: ______ am/pm Hour: 1 Grade: 7
Student Name Number Notes
1
2
3
4
5
6
7
8

55
Student Name Number Notes
9
10
11
12
13
Personal Notes: Personal reactions, how you feel, self-reflection, memories, and impressions
______________________________________________________________________
______________________________________________________________________
Methodology Notes: Description of methods used, reasons for using those, ideas for possible changes
______________________________________________________________________
______________________________________________________________________
Theoretical Notes: Emergent trends, hypotheses
______________________________________________________________________
______________________________________________________________________

56
APPENDIX A (continued)
FIELD NOTES SPREADSHEET: HOUR 2
Date: ______ Day: M T W Th F Time: ________ am/pm Hour: 2 Grade: 7
Student Name Number Notes
14
15
16
17
18
19
20
21
22
23

57
Personal Notes: Personal reactions, how you feel, self-reflection, memories, and impressions
______________________________________________________________________
______________________________________________________________________
Methodology Notes: Description of methods used, reasons for using those, ideas for possible changes
______________________________________________________________________
______________________________________________________________________
Theoretical Notes: Emergent trends, hypotheses
______________________________________________________________________
______________________________________________________________________

58
APPENDIX B
LESSON PLANS
Lesson one: The student begins by logging into the online program. The students create
a profile in the “Renzulli Profiler” by answering a series of questions in the following
areas:
Step 1: Area of Interest
Step 2: Individual Ability
Step 3: Expression Style
Step 4: Learning Style
Step 5: Profile Creation
Students are given the class period to fill in the questions in the above areas. The
program creates a profile reflective of the student.
Lesson two: The student will log into the program and will complete the profile questions
from previous lesson, if incomplete. They will read their “profile” after it is created
through the use of the questions. Students will begin participating in the “Enrichment
Activities” that the program picks out for them.
Lesson three: The student will work on the “Enrichment Activities” that the program
picks out individually for them.
Lesson four: The student will complete the “Interest” section. Students will login and go
to the green “PSP”: bubble on the program. Students will click on the “interests” tab, and
complete the directions on the screen. If they are able to complete “interests” today,
they move on to “heroes and helpers”.

59
APPENDIX B (continued)
Lesson five: The student works on the green “PSP” bubble by completing an area of
their choice.
Lesson six: The students work on the green “PSP” bubble areas.
Lesson seven through ten: Students work on a project of their choice in the “PSP”
bubble or on their Enrichment Activities. What students complete at this point is self-
driven and self-chosen.

60
APPENDIX C
TEACHER-CREATED SURVEY
Gifted Achievement Survey
Directions: For each question/ statement below, please circle 1 (one). A zero (0) indicates, “This is not like me” or “absolutely no”. A ten (10) indicates, “This is definitely like me” or “yes, very much so”. Interests I know what I am interested in. 0 1 2 3 4 5 6 7 8 9 10 I actively pursue my interests. 0 1 2 3 4 5 6 7 8 9 10 Heroes and Helpers How many people do you consider your hero (es)? 0 1 2 3 4 5 6 7 8 9 10 More than 10 How many people do you have who help you accomplish something? 0 1 2 3 4 5 6 7 8 9 10 More than 10 Careers I know what I want to be in life and I know what it takes to get there. 0 1 2 3 4 5 6 7 8 9 10 I will do what I need to in order to attain the career I have chosen (if you have none chosen, circle “0”). 0 1 2 3 4 5 6 7 8 9 10 Goals – Academic I want to make the following average grade. A+ A A- B+ B B- C+ C C- D+ D D- F I make the following grades on average.

61
APPENDIX C (continued)
A+ A A- B+ B B- C+ C C- D+ D D- F I have the potential to make the following grade on average. A+ A A- B+ B B- C+ C C- D+ D D- F Goals - Personal I have personal goals I would like to achieve. 0 1 2 3 4 5 6 7 8 9 10 I know how to set personal goals. 0 1 2 3 4 5 6 7 8 9 10 Plans – Short Term I have short-term plans. 0 1 2 3 4 5 6 7 8 9 10 I am working to achieve my short-term plans. 0 1 2 3 4 5 6 7 8 9 10 Plans – Long Term I have long-term plans. 0 1 2 3 4 5 6 7 8 9 10 I will meet my long-term plans 0 1 2 3 4 5 6 7 8 9 10 Project If I were able to choose any topic to study in school, I would know exactly what I wanted to study. 0 1 2 3 4 5 6 7 8 9 10 If I was able to choose anything to study, I would be enthusiastic about completing the project. 0 1 2 3 4 5 6 7 8 9 10
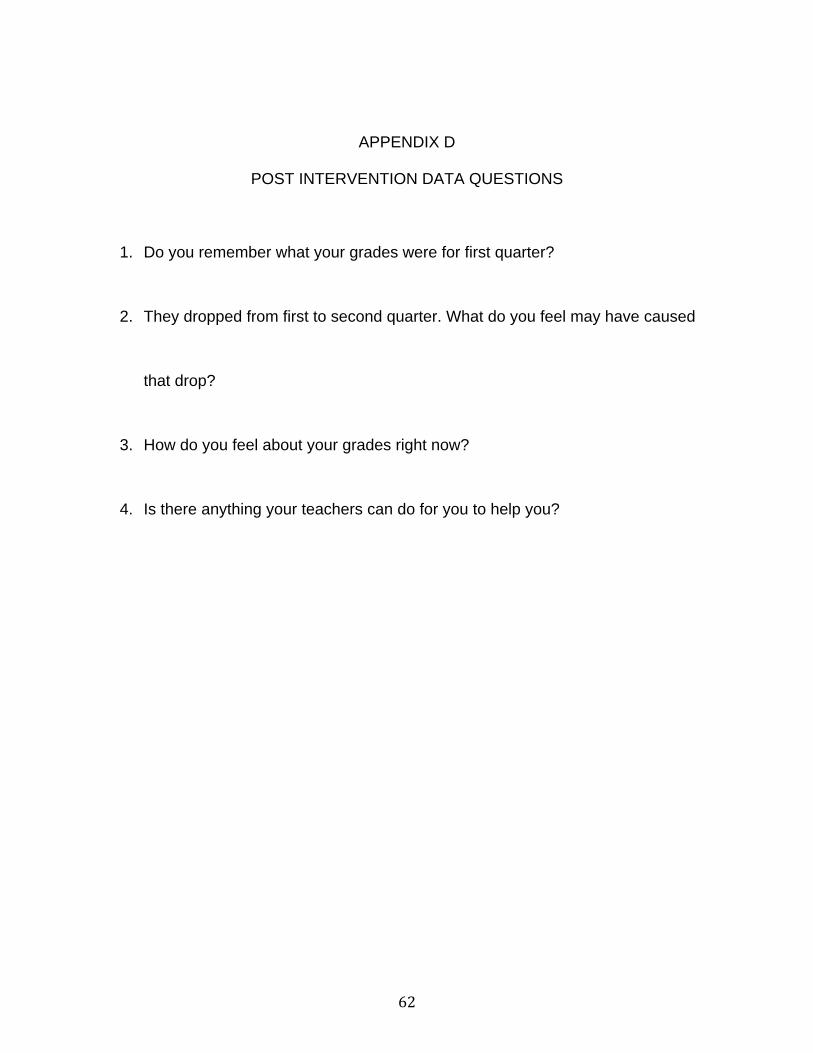
62
APPENDIX D
POST INTERVENTION DATA QUESTIONS
1. Do you remember what your grades were for first quarter?
2. They dropped from first to second quarter. What do you feel may have caused
that drop?
3. How do you feel about your grades right now?
4. Is there anything your teachers can do for you to help you?

63
APPENDIX E
PRETEST AND POSTTEST STUDENT SURVEY RESULTS

64
APPENDIX F
RESEARCH PROPOSAL WITH CONSENT AND ASSENT FORMS
Wichita State University Institutional Review Board for the Protection of Human Subjects (IRB) APPLICATION FOR APPROVAL OF RESEARCH INVOLVING HUMAN SUBJECTS Double click gray boxes to enter information. Name of Principal Investigator(s): Dr. Kay L. Gibson
(For a student project, Principal Investigator must be a WSU faculty member; student is listed as Co-Investigator.)
Departmental/Program Affiliation: C&I Campus Box: 28 Phone X5569 Name(s) of Co- Investigator(s): Amy Miller Co-Investigator(s) is/are: Faculty Member Graduate Student Undergraduate Student Type of Project: Class Project Capstone Project Thesis or Dissertation
Funded Research Unfunded Research If student project, address of student: N/A Title of Project/Proposal: The Effects of the Personal Success Plan by Renzulli Learning on the Achievement of Seventh Grade Students with Giftedness Expected Completion Date: December 2010 Funding Agency (if applicable): N/A Please attach additional sheets, if necessary, with numbers of responses corresponding to those listed below. 1. Describe the research in non-technical language:
The purpose of this project is to determine the effects of the Personal Success Plan (PSP) by Renzulli
Learning on the achievement of seventh grade students with giftedness. The concept is to increase achievement; the strategy to be investigated is utilizing the Renzulli Learning PSP for ten weeks. The Renzulli Learning PSP is defined as an online program for students, created to increase achievement, decreasing underachievement amongst students with giftedness.
2. Describe the benefits of the research to the human subjects, if any, and of the benefits to human
or scientific knowledge:

65
The human subjects will get exposure to a research based intervention. From of the PSP program, the
students will get one-on-one support from in-school adults they identify to be their helpers. Students will get to study a project of interest to them and will be able to complete various activities online related to their interest, all with the goal of getting students engaged in their learning and academically achieving at their potential.

66
3. Describe the subjects, how the subjects are to be selected, how many are to be used, and indicate explicitly whether any are minors (under age 18 per Kansas law) or otherwise members of "vulnerable" populations, including, but not limited to, pregnant women, prisoners, psychiatric patients, etc.
The participants were selected because they are students in my class, 7th grade Research, for students with giftedness. Consent forms will be sent home to all 28 students in the class and those who return the consent form will be included in the research. All participants are minors. 4. Describe each procedure step-by-step, including the frequency, duration, and location of each procedure.
The first week of the intervention, students will begin utilizing the Renzulli Learning Personal Success Plan. The intervention will occur once a week, for ten weeks, 45-50 minutes each time, for a total of between 450 and 500 minutes on the intervention. To complete the intervention, students will be in the classroom utilizing school laptops when available. When these are not available, the students will be located in one of the computer labs. In 2009, Renzulli Learning created and published the PSP. The “plan” comes in two forms, the booklet version and the Internet version with the Internet version being the one that will be utilized in this study. The student will begin the intervention by logging into the online program, and creating a profile. They then will begin "step one", which will ask students questions relative to their area of interest. "Step two" will ask questions about the child's individual ability. The third step will ask students’ expression style questions (written, oral, hands-on, artistic, etc…) asking questions concerning how the student best expresses himself or herself. In the fourth step in the process, students will be asked questions to determine the child's best learning style. From the analysis of these questions will come step five, in which a thorough profile will be created and will indicate to the student his or her individual interests, abilities, expression style, and learning style. Students will be given a chance to express their interests in step six, in which they will be asked open-ended questions. Step seven will follow where students will be given online enrichment activities. Students will be able to choose the form of the enrichment activity they will complete, and will then be able to choose an activity from a list. A profile is created which will demonstrate what each student completes and which sites they have visited. Students will then be able to work on his or her individual suggested enrichment activities or an interest project of their choice. Also, in the Renzulli Learning PSP In the program, students will be asked thorough questions based on their heroes and helpers both inside and outside of school. The system will send an email straight to the teacher or professional in the building that the child indicates as a hero, so that he or she knows they are one of a student’s identified helpers. This will be completed in an attempt to let the individual know that this student sees them as a hero so that they may continue to consciously positively influence the child's life, both inside and outside of school. The students will be made aware of this before the selection, which may influence who they do or do not select. 5. Describe any risks or discomforts (physical, psychological, or social) and how they will be minimized.
All activities are a part of the regular classroom curriculum. There may be some discomfort to the participants when they are asked to disclose their personal interests, learning styles, and heroes. The discomforts are minimized because a survey is used rather than a group discussion where students would be asked to verbalize these personal items. 6. Describe how the subject’s personal privacy is to be protected and confidentiality of information guaranteed (e.g.
disposition of questionnaires, interview notes, recorded audio or videotapes, etc.). Students will each be assigned a number. This number will be used to refer to the students. No data or information
concerning the participants will be present in such a way that the participants will able to be identified. When individual students and their results are discussed, he or she will be referred to with a number. The sole person conducting the research will know which student’s name corresponds to which number. This information will not be provided in the paper itself.
7. Describe the informed consent process and attach a copy of all consent and/or assent documents. These
documents must be retained for three years beyond completion of the study. Any waiver of written informed consent must be justified.
At the beginning of the school year, I will discuss the intervention with parents as they come in to school to meet the teachers before the school year begins. If they have any questions, I will address them at that time. Parents will be given a thorough explanation of the PSP intervention and resources to find more information on the intervention if they wish. At that

67
time, they will be given the chance to sign the consent form, as well as the student being given the opportunity to sign the student assent form. Providing the opportunity to the parents to sign it while the majority of parents are in school will hopefully increase the chances of the form being signed and handed to the teacher, or returned with the child. If parents want to return the form at a later date after completing more research on their part, they will be given the option to do so. After the first week of school, if any forms are not returned, I will notify the parent via email and/or phone that I am still in need of their consent letter if their student is to participate in the study. If any parents notify me that their child is not allowed to participate, I will not follow up with them.
8. Attach all supporting material, including, but not limited to, questionnaire or survey forms and letters of approval
from cooperating institutions. Data will be collected utilizing the following three methods:
1. Academic data on student’s progress in Language Arts, Mathematics, Social Studies and Science. There are no materials for this method.
2. The Renzulli Learning Questionnaire (see attachment) is a teacher created qualitative data collective method. 3. Notes (see attachment) will be taken each time students utilize the PSP intervention. Notes will reflect amount of time
each student spends on the PSP with the idea of utilizing qualitative data to create quantitative data to find a correlation between the amount of time students spend on the intervention and their increase or decrease in scores.
The Principal Investigator agrees to abide by the federal regulations for the protection of human subjects and to retain consent forms for a minimum of three (3) years beyond the completion of the study. If the data collection or testing of subjects is to be performed by student assistants, the Principal Investigator will assume full responsibility for supervising the students to ensure that human subjects are adequately protected.
_______ ___________________ Signature of Principal Investigator Date
________ ___________________ Signature of Co-investigator (for student project) Date

68
CONSENT FORM PURPOSE: Your student is invited to participate in a study of achievement in students with giftedness. I hope to learn if the Renzulli Learning Personal Success Plan (PSP) online will increase student achievement. PARTICIPANT SELECTION: Your student was selected as a possible participant in this study because your student is a seventh grade student at Derby Middle School and attends the Research class. All of the students in seventh grade identified as having giftedness will be asked to participate in this study, approximately 28 students. EXPLANATION OF PROCEDURES: If your student decides to participate, your student will complete the Renzulli Learning PSP online for one class period per week for ten weeks. In this online program, the students will take surveys to determine their interests. Your student will be given activities to complete that match your student’s interests. Your student will also identify his or her heroes and helpers, career interests, goals (academic and personal), plans (short and long term), and will work on a project of interest to your student. DISCOMFORT/RISKS: To complete the PSP, your student will be asked to sit quietly in a comfortable position and work individually at his or her own pace. Your student will be asked to complete an online survey in which he or she will comment on their personal interests, heroes, helpers, and other items mentioned above. To minimize the discomfort he or she may have, your student will not be asked to disclose this information verbally in a large group setting. BENEFITS: From participating in this study, your student will get online assistance in determining his or her heroes, helpers, career interests, and goals and plans. The idea behind this is to assist your child to achieve academically in school, and hopefully have more long-term personal success. This study will assist also in determining the effectiveness of the PSP to gain more research on underachievement. CONFIDENTIALITY: Any information obtained in this study in which your student can be identified will remain confidential and will be disclosed only with your permission. The information and data obtained in this study will be shared with Renzulli Learning for the purpose of providing information as to the effectiveness of the PSP. Names and personal information will not be shared, only the academic data collected, data collected from the student complete survey, and the observational data collected by the researcher relative to the amount of time each student spent on the intervention. REFUSAL/WITHDRAWAL: Participation in this study is entirely voluntary. Your decision whether or not to have your student participate will not affect your future relations with Wichita State University and/or Derby School District USD 260. If you agree to have your student participate in this study, you are free to withdraw your student from the study at any time without penalty. If you choose to not have your student participate, he or she will still participate in the intervention, however, your student’s data will not be used in the study. CONTACT: If you have any questions about this research, you can contact me at: Amy Miller,1845 Fairmount, Wichita, KS 67260-0028; telephone (316) 978-5569. Also you can contact Dr. Kay Gibson, Wichita State University, 1845 Fairmount, Wichita, KS 67260-0028; telephone (316) 978-5569. If you have questions pertaining to your rights as a research subject, you can contact the Office of Research Administration at Wichita State University, Wichita, KS 67260-0007, and telephone (316) 978-3285. Your student is under no obligation to participate in this study. Your signature indicates that you have read the information provided above and have voluntarily decided to allow your student to participate.

69
You will be given a copy of this consent form to keep. ____________________________________________________ _______________________ Signature of Subject Date ____________________________________________________ _______________________ Signature of Parent or Legal Guardian Date ____________________________________________________ _______________________ Witness Signature Date Form A

70
CHILD ASSENT FORM
I have been informed that my parent(s) have given permission for me to participate, if I want to, in a study
concerning achievement in students with giftedness. My participation in this project is voluntary and I
have been told that I may stop my participation in this study at any time. If I choose not to participate, it
will not affect my grade in any way, but I will still be participating in the online program.
___________________________________________ Name Date Form B