the effects of walmart on healthcare and unionization: is
TRANSCRIPT

Syracuse University Syracuse University
SURFACE SURFACE
Syracuse University Honors Program Capstone Projects
Syracuse University Honors Program Capstone Projects
Spring 5-1-2011
The Effects of Walmart on Healthcare and Unionization: Is The Effects of Walmart on Healthcare and Unionization: Is
America Really Saving Money and Living Better? America Really Saving Money and Living Better?
Leyla Ziad
Follow this and additional works at: https://surface.syr.edu/honors_capstone
Part of the Economic History Commons, Economic Theory Commons, Finance Commons, and the
Growth and Development Commons
Recommended Citation Recommended Citation Ziad, Leyla, "The Effects of Walmart on Healthcare and Unionization: Is America Really Saving Money and Living Better?" (2011). Syracuse University Honors Program Capstone Projects. 289. https://surface.syr.edu/honors_capstone/289
This Honors Capstone Project is brought to you for free and open access by the Syracuse University Honors Program Capstone Projects at SURFACE. It has been accepted for inclusion in Syracuse University Honors Program Capstone Projects by an authorized administrator of SURFACE. For more information, please contact [email protected].

The Effects of Walmart on Healthcare and
Unionization: Is America Really Saving Money and Living Better?
A Capstone Project Submitted in Partial Fulfillment of the Requirements of the
Renée Crown University Honors Program at Syracuse University
Leyla Ziad Candidate for B.A. Economics Degree and Renée Crown University Honors
May 2011
Honors Capstone Project in Economics
Capstone Project Advisor: __________________________
(Chris Rohlfs)
Honors Reader: __________________________________ (Jeffrey Weinstein)
Honors Director:__________________________________
(James Spencer, Interim Director)
Date:___________________________________________
ABSTRACT
As the largest private sector employer in the United States, corporate retail
giant Walmart continues to make waves in United States culture and the economy
since launching its first store in 1962. As Walmart seeks to expand, the validity of
its consumer guarantee to “save money, live better” has been increasingly
scrutinized, given Walmart’s use of controversial business practices, most notably
its employee benefit policies and anti-unionization efforts. With over 1.4 million
employees in the United States, there is much talk surrounding the potential costs
of Walmart’s low prices. This study analyzes selected healthcare and unionization
impacts of Walmart in various Metropolitan Statistical Areas across the United States
during the years 1996 - 2004. Using cross-sectional data from the U.S. Census
Bureau’s Current Population Survey, I perform an econometric analysis to evaluate
the effect of the introduction of a Walmart store on Medicaid, Medicare, and private
health insurance coverage as well as union membership and coverage. To address the
endogeneity of Walmart’s decision to enter a particular area, I estimate a fixed effects
model, controlling for year and Metropolitan Statistical Area effects. My results
indicate that the introduction of a Walmart may initially appear beneficial through its
creation of additional jobs and offering of low-priced goods. In addition, findings
show that Walmart increases the probability of Medicaid and private health insurance
coverage and has a negative effect on the probability of being a member of a union.

TABLE OF CONTENTS:
I. Acknowledgements………………………………………..i
II. Advice to Future Honors Students………………………..ii
III. Introduction……………………………………………….1
IV. Literature Review…………………………………………6
V. Data Description…………………………………………..8
VI. Estimation Strategy……………………………………….9
VII. Empirical Results…………………………………………10
VIII. Conclusion………………………………………………..16
IX. Sources Cited and Consulted……………………………..20
X. Appendices
a. Figures……………………………………………22
b. Tables……………………………………………..26
i
I. Acknowledgements
I would like to thank my parents, Mostapha and Elizabeth Ziad, for their
continued motivation, support and encouragement throughout my undergraduate
experience. Additionally, I would like to acknowledge the Undergraduate
Economics Department and Renée Crown University Honors Program at
Syracuse University for making this research possible through their support and
endorsement. I wish to extend my deepest thanks to Professor Jeffrey Weinstein
and to my fellow Economics Program of Distinction students for their support,
advice, and encouragement throughout this researching and writing process.
Lastly and most importantly, this project would not have been possible without
the guidance and assistance provided by Professor Chris Rohlfs, who has been an
invaluable resource, advisor, and role model throughout this process.

ii
II. Advice to Future Honors Students
Having the opportunity write an honors and economics thesis has been a
challenging, but rewarding experience that has enhanced my undergraduate
experience at Syracuse in a profound manner. Being given the opportunity to
interpret data and apply it to an area of interest has given me an insight into the
world of economic research and the ways in which statistics and findings can be
applied towards understanding current events. I would advise future honors
students to follow their passions and complete their capstone in a subject area that
not only interests them, but also inspires them. Substantial time and dedication to
the project is necessary and at times it is daunting; however the reward of
completing a project that is entirely your own is an extremely gratifying feeling
and worth every minute of stress and hard work. Be diligent with your time
management, allot yourself double the time you expect to need as you will always
find yourself wishing for more time, and have fun with it!

1
III. Introduction
Corporate retail giant “Walmart” has continued to make headlines since its
initial store opening in 1962. With an appeal of low, affordable prices on
everyday items, it has constructed a heroic image of itself backed by a motto
promising Americans the opportunity to “save money, live better” (Walmart.com
2011). As shown in figure 1, Walmart has rapidly expanded throughout the
United States in the past twenty years. As a result, this discount mass
merchandising chain has become a staple in American society and a cultural
phenomenon that is spreading across continents. Walmart currently employs more
than 2.1 million associates worldwide, covers 617 square footage of the United
States, and earned $419 billion in fiscal sales for the 2011 year (Walmart 2011).
However, recent concerns have emerged regarding Walmart’s controversial
business practices including its use of government subsidies, predatory pricing,
outsourcing methods, and poor treatment of employees. This has incited much
debate and hesitation in the local communities in which Walmart wishes to enter.
Existing research provides varied findings on Walmart’s socioeconomic impacts
and reflects a further need for analysis, particularly in areas of its employment
practices and the ensuing impacts on labor market characteristics, the utilization
of public assistance, and relevant federal and local fiscal policy.1 This paper seeks
to examine the implications that Walmart’s presence and introduction into a
Metropolitan Statistical Area may have on rates of Medicaid, Medicare, private
1 This need for further scrutiny is most recently echoed in legislation passed by the San Diego Senate requiring new Walmart superstores to prepare economic impact analyses as part of their permit acquisition process (Gardner 2011).

2
health insurance coverage, union membership, union coverage, income, retail
employment, and food stamp receipt.
The wide uncertainty in academic literature surrounding Walmart’s
socioeconomic effects is striking in light of the level of public attention and
controversy surrounding its name. Costs and benefits associated with Walmart are
often exposed to the American public through media headlines, anecdotal
evidence, and Walmart’s own public relation campaigns, but this information is
unlikely to be impartial. The economic literature surrounding Walmart is vast but
altogether quite inconclusive. Many researchers have examined Walmart’s effects
on retail prices, wages, and employment levels. Notable studies include those of
Basker (2005) and Ciccarella, Neumark, and Zhang (2005) who find a reduction
in county-level retail employment and earnings as a result of Walmart. Both use
an instrumental variable approach to correct for the problem of endogeneity in
Walmart’s entry decision. Literature exploring Walmart’s effects on employee
benefits and reliance on anti-poverty programs is much less prevalent. Michael
Hicks (2005) examines Walmart’s impact on Federal and state anti-poverty
expenditures from 1978-2003 and finds that each new Walmart worker is causing
the average state to spend just under $900 per year in Medicaid benefits, which
remains consistent with other studies conducted on Medicaid costs of low wage
workers in the United States. Similarly, Dube, Eidlin, and Lester (2007) perform a
state-level analysis of Walmart stores on healthcare benefits and find a Walmart
store opening decreases employer-sponsored health insurance by 0.1%. Although
these studies veer away from the common employment, price, and wage level

3
analyses, they fail to acknowledge other impacts of Walmart’s employment
practices, notably that of its anti-unionization policy which prohibits employees
from organizing or forming unions and asserts that failure to comply with this
policy can be grounds for termination. The company defends this policy by
explaining that, “At Wal-Mart, we respect the individual rights of our associates
and encourage them to express their ideas, comments and concerns. Because we
believe in maintaining an environment of open communications, we do not
believe there is a need for third-party representation.” (Walmart 2005)
The current study contributes to this literature by expanding the scope of
Walmart’s effects. My research uses a wider range of outcome variables that
address both Walmart’s health care benefits and anti-unionization policy. By
estimating the effects of Walmart on Medicaid, Medicare, private health insurance
coverage, food stamp receipt, union membership and coverage in addition to
income and retail employment, this study dives deeper into the realms of
Walmart’s influence on the American public. While the current literature
frequently examines Walmart’s impacts on rural communities and small towns
(see Stone 1989, 1995, 1997, 2002), this study analyses Metropolitan Statistical
Areas (MSA). 2 A historical look at Walmart shows that, during its rapid
expansion in the 1980s and 90s, a large majority of its new stores were introduced
into metropolitan areas rather than rural areas. Conducting analysis at the MSA-
2 MSA is a geographic entity defined by the U.S. Office of Management and Budget as a vicinity that has at least one urbanized area of 50,000 or more inhabitants. Each MSA consists of one or more counties, including the county containing the core urban area and adjacent counties deemed to have a high degree of social and economic integration in relation to the urban core (U.S. Census Bureau 2011).

4
level provides increased accuracy since metropolitan areas tend to have better-
paying jobs with higher rates of unionization, suggesting a greater sustained
impact in comparison to rural areas. MSA-level analysis also provides research of
greater relevancy to the general public, given the larger resistance towards
Walmart openings in metropolitan areas compared to elsewhere.
Using Walmart store openings compiled by Thomas J. Holmes and cross-
sectional data from the U.S. Census Bureau’s Current Population Survey’s March
Annual Social and Economic Study, econometric analysis is performed on 85
Metropolitan Statistical Areas in which 255 Walmart stores, including
Supercenters, were opened during the years 1996-2004. The estimation strategy
utilized is comprised of two equations which incorporate a vector of controls to
correct for any possible sources of bias, particularly the endogeneity of a Walmart
store opening. This vector varies across specifications and includes controls for
MSA demographics, a linear time trend, and MSA and year fixed effects to
disentangle the effects of Walmart from its entry decision. These controls, along
with evidence presented by Hicks and Wilburn (2001) and Franklin (2001) that
prove that the location and timing of Walmart entries are unaffected by regional
economic conditions and growth, seek to eliminate any potential endogeneity.
An additional feature of this study is the use of sensitivity checks to
examine potential patterns in the effect of Walmart and test the validity of my
estimation strategy. Using lead and lag variables in my regression analysis to look
at outcome variables both before and after a Walmart introduction, I am able to
evaluate the specific time-pattern that I predict will occur in response to a store

5
opening. I hypothesize that this will pattern show no effects five or so years
before a Walmart opening, as the intent to introduce a store is unknown. This will
be followed by slight effects one to two years before the opening, suggesting a
response to store-opening indications such as construction. Further, I expect
Walmart’s effects to be biggest immediately following its opening, with gradually
less effects when the novelty of the new store wears off and the surrounding
community adjusts to its presence. The results of these sensitivity checks can
prove useful in disentangling short-term and long-term patterns, thus allowing a
better understanding of Walmart’s total effect.
Although I achieve mixed results, my initial findings indicate positive
effects on private health insurance and Medicaid coverage as a result of a
Walmart store opening. Union membership appears to decline slightly due to
Walmart while the effects on Medicare coverage remain unclear. Results indicate
varied effects of Walmart on retail employment, union coverage rates, food stamp
recipients, and income levels, but my findings appear to follow the predicted
time-specific pattern previously described, in which short-term effects appear
more pronounced.
The remainder of this paper provides a detailed explanation of my
research and is organized as follows: Section III provides a more in-depth
literature review of case studies relevant to this research. Section IV presents a
description of the data used to complete this study. Section V outlines the
estimation strategy utilized to obtain these results and includes key factors
associated with this method. Section VI provides an in-depth consideration of the

6
empirical results. Section VII ends the paper with a concluding summary and
remarks on potential policy implications.
IV. Literature Review
Research on Walmart’s impact on healthcare and unionization is quite limited in
comparison to the considerable amount of literature on employment and wage
consequences. Often-cited early studies done by Kenneth Stone (1989) suggest
negative impacts of Walmart on rural communities in the United States,
highlighting negative effects sustained to the retail industry and per capita sales in
small-town areas.3 Basker (2005) examines county-level employment and finds
that a net gain in retail sector jobs prior to a Walmart opening is concurrent with a
net loss of jobs in the wholesale sector. Neumark, Zhang and Ciccarella (2007)
also perform a notable study, finding that county level employment and wages of
retail sector workers are adversely affected by the introduction of a Walmart.
Though these case studies provide conclusive findings, they suffer from two
major shortcomings. The first limitation is the narrow scope of these studies, as
they often focus on only one particular state or region. Additionally, they fail to
examine a full picture of employee well-being because their emphasis on
employment rates and wage levels overlooks the potential effects of Walmart’s
employment benefits.
3 See Stone (1989, 1995, 1997, and 2002) for his ongoing literature regarding Walmart’s effect on small-town communities. His overall findings indicate that the introduction of a Walmart substantially hurts towns in Iowa and Mississippi due to local competitors being driven out of business. Stone determines “pull factors” that account for the percentage of the population frequenting Walmart and assesses the consequent changes in sales, relative to non-Walmart areas.

7
The first major study to examine Walmart employee reliance on anti-
poverty programs was conducted by Dube and Jacobs (2004). The authors find
that Walmart’s insufficient wages and lack of benefits cause a reliance of its
Californian workers on public assistance, resulting in significant public costs.
Further findings by Dube, Eidlin, and Lester (2007) project that the introduction
of ten new Walmart stores in a given state will result in a one percentage point
reduction in the retail sector employer-sponsored health insurance rate. Similarly,
studies conducted by Michael Hicks (2005) have examined Walmart’s potential
role in the use of state and Federal anti-poverty programs by its employees.
Hicks’ research shows that Walmart increases Medicaid expenditures but has no
impact on food stamp expenditures in the retail sector and a negative impact on
AFDC/TANF expenditures.4
The main concern in the academic literature remains the question of
whether Walmart’s choice of entrance location and time is endogenous. It is
unclear whether the decision to open a Walmart store is non-random, correlated
with demographic factors, such as age and racial breakdown, as well as levels of
income, employment, and retail competition. The timing of a store opening may
be a calculated decision based on current socioeconomic conditions and future
projections. To address this matter of endogeneity, Neumark et al. (2007) use a
geographic pattern of Walmart store openings over time as an instrumental
variable. Basker (2005) utilizes a similar instrumental variable approach for store
4 Hicks (2005) finds that Walmart increases Medicaid expenditures by roughly $898 per worker per year. Aid to Families of Dependent Children (AFDC) was renamed to Temporary Assistance to Needy Families (TANF) in 1996 and provides support to children in poor, non-working families.

8
openings, correcting for both endogeneity as well as measurement error.
However, research conducted by Hicks and Wilburn (2001), as well as Franklin
(2001), provides evidence that the location and timing of Walmart entries are
unaffected by regional economic conditions and growth.5 This provides me with
enough reassurance that no correction for endogeneity is needed and as a result I
will not be correcting for endogeneity.
V. Data Description
Data on healthcare coverage, employment, income, union coverage, and
other demographic variables such as age, racial, and employment composition,
were taken from the March component of the U.S. Census Bureau’s Current
Population Survey pooled over the years 1996-2004. Walmart store openings data
were obtained from Professor Thomas J. Holmes at the University of Minnesota,
who provides the date and location for the 3,243 Walmart stores opened between
July 1, 1962 and October 26, 2005. The unit of observation in this study is MSA-
year. I concentrate on the data for 85 Metropolitan Statistical Areas (MSAs)
identified in the CPS (see Table 1). This panel of MSAs contains 255 Walmart
stores, including supercenters, opened between the years of 1996 and 2004.
5 Separate tests in each study model the entrance of Walmart stores and Supercenters as a function
of demographic and economic variables.

9
VI. Estimation Strategy
My approach estimates the contemporaneous effect of Walmart on income
and retail employment levels, Medicare, Medicaid, and private health insurance
coverage, food stamp recipients, and union membership and coverage. The
equation is specified for each variable as follows:
(1) Yit = β0 + β1 Walmartsit + βxXit + Uit
where the dependent variable, Yit is for a given MSA i observed at time t. Yit is
assumed to be a linear function of Walmartsit, the number of Walmart stores in
MSA i at time t and Xit is a vector of controls that varies across specifications. Xit
includes MSA characteristics such educational attainment, age, and racial
composition, a linear time trend, and MSA fixed effects models to correct for
spatial autocorrelation. Uit is a mean-zero unobservable within the regression. I
assume that Cov(Walmartsit,Uit)=0, meaning that the number of Walmart stores in
MSA i in year t is uncorrelated with the error term.
Endogeneity in Walmart’s timing of entrance and choice of location is the
foremost concern when employing this estimation strategy. At the individual
level, Walmartsit may be correlated with MSA or year-specific characteristics,
suggesting that Ordinary Least Squares (OLS) estimates of β1 are likely biased.
This paper avoids these biases by including demographic controls in Xit including
educational attainment, age, and racial composition. Furthermore, statistical
models are employed to correct for correlation between the error term and the
explanatory variables in the case that Walmart openings are non-random. An
MSA fixed-effects model allows me to control for various observed and
unobserved tmie-
models with MSA
by allowing a different trend for each MSA while also accounting for influences
on changes in Y
specifications includ
across time and ensure that any outliers or fluctuations are independent from one
time period to the next.
The second estimation strategy utilizes lagged explanatory variables to
measure the effe
following the introduction of a Walmart store. This equation is expressed as:
(2) Yit = δ0 +
where L is the number of lag or lead variables used in the regression. In some
specifications, lead variables are also included for one, two, and three years
preceding the opening of a Walmart store. The various specifications of Equation
(2) include a vector o
VII. Empirical Results
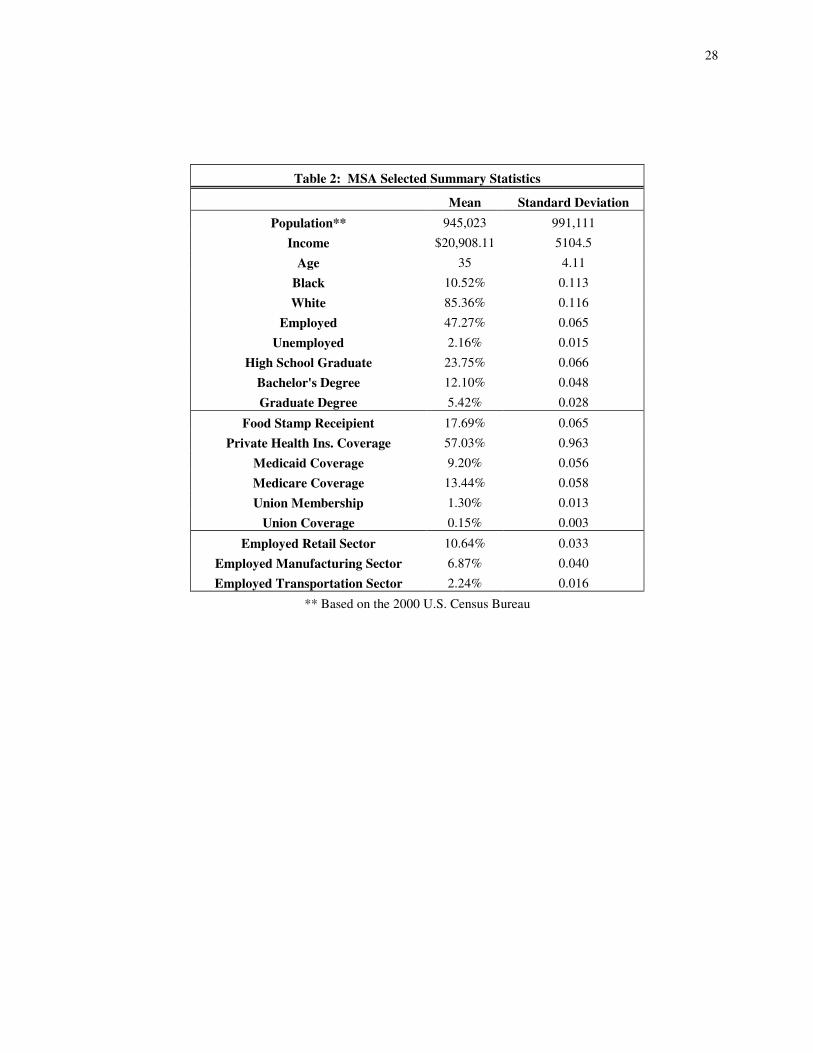
Descriptive statistics for population, income, age and racial composition,
employment, educational attainment levels, and health insurance of the analyzed
MSAs are reported in Table 2. On a
population of approximately 945,023 residents in years 1996
percentage of individuals in the data set covered by private health insurance is
-invariant trends in Yit for each MSA. Similarly, fixed effec
models with MSA-specific time trends account for variation in linear time trends
by allowing a different trend for each MSA while also accounting for influences
on changes in Yit that might be correlated with Walmart openings. Most
specifications include a time trend to test the assumption that Y
across time and ensure that any outliers or fluctuations are independent from one
time period to the next.
The second estimation strategy utilizes lagged explanatory variables to
measure the effect of Walmart on Yit one, two, three, four, and five years
following the introduction of a Walmart store. This equation is expressed as:
+ δj+1 Walmartsit-j + δxXit + Uit
L is the number of lag or lead variables used in the regression. In some
specifications, lead variables are also included for one, two, and three years
preceding the opening of a Walmart store. The various specifications of Equation
(2) include a vector of controls identical to that of Equation (1).
Empirical Results
Descriptive statistics for population, income, age and racial composition,
employment, educational attainment levels, and health insurance of the analyzed
MSAs are reported in Table 2. On average MSAs in this data set have a
population of approximately 945,023 residents in years 1996-2004. The average
percentage of individuals in the data set covered by private health insurance is
10
for each MSA. Similarly, fixed effects
specific time trends account for variation in linear time trends
by allowing a different trend for each MSA while also accounting for influences
that might be correlated with Walmart openings. Most
e a time trend to test the assumption that Yit is constant
across time and ensure that any outliers or fluctuations are independent from one
The second estimation strategy utilizes lagged explanatory variables to
one, two, three, four, and five years
following the introduction of a Walmart store. This equation is expressed as:
L is the number of lag or lead variables used in the regression. In some
specifications, lead variables are also included for one, two, and three years
preceding the opening of a Walmart store. The various specifications of Equation
Descriptive statistics for population, income, age and racial composition,
employment, educational attainment levels, and health insurance of the analyzed
verage MSAs in this data set have a
2004. The average
percentage of individuals in the data set covered by private health insurance is

11
57.03%, while Medicaid coverage averages at 9.2% and Medicare coverage at
13.44%. Union membership among survey participants in the data set remains
very low at 1.30% with union coverage6 even lower at 0.15%7. The average level
of retail employment is 10.64% and average income $20,908.11. I assume
Walmart has the greatest effect on the low-skill, low-wage market. Thus, these
characteristics aid in discerning whether the affected individuals in the data set
generally reflect workers likely to be participating in this labor market.
Figure 2 provides descriptive statistics on Walmart store openings in the analyzed
MSAs during the time period of 1996 to 2004. As indicated on the pie chart, 40%
of the analyzed MSAs experienced the opening of one Walmart store while 21%
experienced two Walmart store openings and 9% experienced 11 openings. The
remaining percentages indicate a range of store openings during this time period,
reaching a high of 17 store openings in the Houston-Sugar Land-Baytown, TX
MSA. Figure 3 provides a comparison of MSA population size to frequency of
store openings, and indicates a positive relationship between population size and
the number of store openings.
To examine the overall effect of Walmart on health care coverage and
unionization, I begin my empirical analysis by using Equation (1) to estimate the
effect of Walmart’s presence (the number of Walmart stores in MSA i at time t)
6 Union coverage rates reflect answers to the CPS survey question reading, “On this job, are you covered by a union or employee association contract?” Union coverage reflects third-party representation which aids in the negotiation of wages, total compensation, benefits, and workplace protections. 7 Comparing unionization rates and unionization coverage in my sample to that of the entire set of
MSAs n the US over the same time period, I find that unionization rates and union coverage are both higher in the entire set of MSAs (13.6% versus 1.3% and 14.9% versus 0.15%). This could be due to Walmart’s decision to enter areas with lower rates of union membership and coverage. It is important to consider these differences when interpreting the empirical results in Section VII.

12
on Medicaid coverage, union membership rates, and private health care coverage.
The Medicaid variable used in these regressions was obtained from the CPS
survey question reading, “At any time in the last year were you/was anyone in this
household covered by Medicaid/(fill state name), the government assistance
program that pays for health care?” Similarly, the private health insurance
variable used was obtained from the CPS survey question reading, “At any time
during the last year, were you/was anyone in this household covered by a plan
that you/they purchased directly, that is, not related to current or past employer?”
The union membership variable examined was obtained from the survey question
asked of all employed participants, “On this job, are you a member of a labor
union or of an employee association similar to a union?” To more easily interpret
the coefficients, all coefficients from the original regression are multiplied by
100. Thus, the coefficients of interest can be read as percentage point changes in
the average rates of coverage. The regression results for seven different
specifications of Equation (1) can be seen in Table 3 of the appendix. Estimates
for Medicaid coverage are represented in Panel A, Union Membership in Panel B,
and Private Health Care coverage in Panel C. Column (1) denotes a basic
Ordinary Least Squares regression with no controls. In columns (2) through (7),
controls are increasingly added to correct for any possible bias and increase the
precision of the coefficient estimates. Column (7) reflects the preferred
specification with a full set of controls that includes demographic controls as well
as MSA and year-fixed effects.

13
In general, the OLS regression results in Table 3 indicate a negative effect
of Walmart presence on Medicaid coverage and union membership and a positive
effect on private healthcare coverage. The coefficients are quite varied between
specifications, with statistical significance at the 5% level only for regression
columns (1), (2), (3), and (6) of Panel A, (1) of Panel B, and (1), (2), (4), and (5)
of Panel C. Although regressions in column (1) exhibit significance across all
three panels, this is likely due to omitted variable bias because there are no
control variables. The coefficients for union membership are quite small and
imprecise, but the results across all specifications exhibit a decreasing probability
of union membership for each additional Walmart, which is to be expected given
Walmart’s anti-unionization policy. Similarly, in each specification I estimate a
positive effect of the number of Walmarts on the likelihood of private healthcare
coverage. Looking at regression (7) of Panel C, the magnitude of this increased
probability can be understood through analysis concluding that the introduction of
100 additional Walmart stores in a given MSA and year lowers the fraction of
people who are covered by private insurance by 0.103, or ten percentage points.
Putting this into a more realistic perspective, the introduction of ten additional
Walmart stores in a given MSA and year would thus decrease the fraction of
people with private health insurance coverage by .01, or one percentage point.
However, this may be indicative of an overall rising trend in private healthcare
rates that is not directly a cause of Walmart’s presence.
As I do not expect the entry of a Walmart store or additional opening of a
Walmart store to have an immediate effect on the outcome variables, (it may take

14
time for a new store to get established), it is interesting to look at the lagged
effects of a Walmart opening and the number of Walmart stores on healthcare and
unionization variables. Table 4 contains regression coefficients from Equation (2),
depicting the lagged effects of Walmart openings on Medicaid coverage, union
membership, and private health care coverage. Columns (1), (4), and (7) indicate
the lagged effects for the initial three years on Medicaid coverage, union
membership, and private health care coverage, respectively, using the preferred
specification of full controls. L1. Walmart Opened represents one year following
the opening of a Walmart store, L2. Walmart Opened represents two years
following the opening of a Walmart store, and L3. Walmart Opened represents
three years following the opening of a Walmart store. Similarly, columns (2), (5),
and (8) indicate lagged effects for four years after a Walmart store opening and
columns (3), (6), and (9) indicate lagged effects for five years after a Walmart
store opening for each outcome variable.
The regression results shown in Table 4 contain varied signs and
magnitudes of the coefficients suggesting mixed results for Walmart’s short-term
effect in the immediate years following its arrival. Medicaid coverage exhibits a
decline in the initial one to two years after store opening subsequently followed
by an increase in years three and four. The lagged effects on union membership
are unclear, showing an ambiguous influence of Walmart that is likely due to the
small percentage of survey participants who answered “yes” to having been a
member of a labor union. Walmart’s short-term effects on private health care

15
coverage also appear uncertain in these regressions due to varied results across
models.
To investigate Walmart’s overall effect on society, Equation (1) with a full
set of controls is used to estimate Walmart’s effect on income levels, Medicare
coverage, union coverage, food stamp recipients, and retail employment levels.
These results are shown in Table 5. Though the coefficients are small and
generally imprecise, they indicate that a Walmart store has an overall negative
effect on income, Medicare, food stamp recipients, and retail employment and no
discernable effect on union coverage. Table 6 displays Equation (2) for these
same outcome variables reflecting the lagged effects of Walmart store openings
for up to five years after store onset. There does not seem to be a conclusive
pattern in the effects of Walmart over time for these outcome variables.
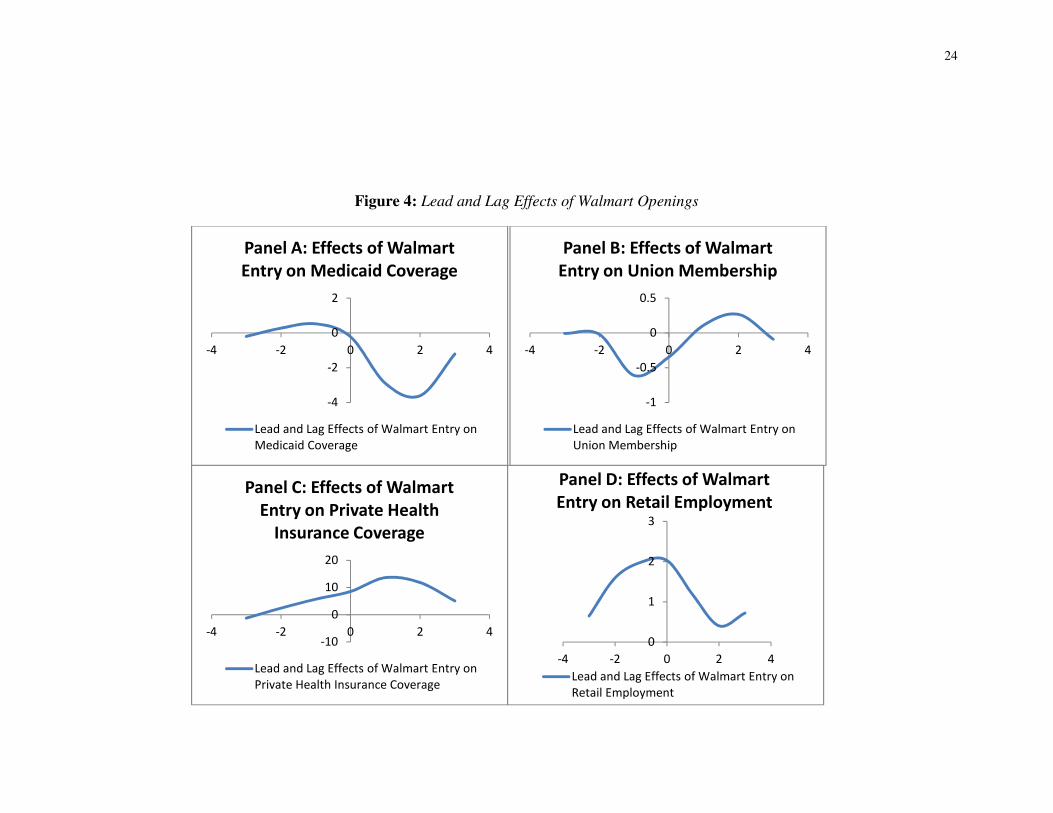
Figure 4 provides sensitivity checks, measuring the precision of my
estimation strategy and assessing a potential time-specific pattern of the effects
surrounding a Walmart store opening. These regressions utilize the same equation
shown in Equation (2) with additional lead explanatory variables included. For
each panel, leads and lags years of three years prior to and three years preceding a
Walmart store opening are plotted on the x-axis and the coefficient estimates are
plotted on the y-axis.
Panels C and H, which measure the effects of private healthcare coverage
and food stamp recipients exhibit increasing trends both before and after Walmart
opening, indicating a general positive trend in the rates of these variables that may
not be related to the opening of a Walmart. However Panel D, which reflects the

16
impact of Walmart entry on retail employment, shows a direct change in retail
employment in the year of store introduction. This is followed by a sign reversal
after two years of store existence, which supports my hypothesized time-specific
pattern of effect. Further, the effect on Medicaid coverage shown in Panel A, the
effect on union membership shown in Panel B, and the effect of Medicare
coverage shown in Panel F all exhibit a trend one year prior to Walmart entry
(decreasing for Medicaid and Medicare and increasing for union membership)
followed by a sign reversal starting to trend the other way after two years of
Walmart’s presence. Lastly, Panels E and F, income and union coverage
respectively, indicate an increasing trend that starts two years preceding the
opening of a Walmart, and in the case of income, is also reversed after two years
of existence.
VIII. Conclusion
The debate surrounding Walmart’s effects on the United States continues
to spark public interest and cause contention throughout academia. While
Walmart argues its presence serves to help America “save money, live better,”
critics point to its use of unfair business practices, which they justify by observing
Walmart’s monopsonistic presence in a low-skill, low-wage labor market. This
study provides empirical consideration of Walmart’s effects on various indicators
of consumer and employee well-being. While my analysis fails to find consistent
effects, given many imprecise and varying results, this study nonetheless provides
interesting findings. Private health insurance and Medicaid coverage appear to
increase as a result of Walmart entrance. Union membership appears to decline
17
slightly, while the effects sustained to Medicare coverage rates remains unclear.
Furthermore, retail employment, union coverage rates, income, and food stamp
recipients appear to follow the hypothesized time-specific pattern in which slight
effects are sustained one to two years prior to store arrival, while the most
pronounced effects occur immediately after store opening and taper off within a
few years.
Given the high turnover rate and quantity of casual workers in the retail
industry, it is difficult to accurately ascertain the effects sustained to retail
workers in the aftermath of a Walmart opening. An increase in Medicaid coverage
rates may be reflective of changes in the labor force due to situations in which
Walmart plays a contributing role. For example, retail workers whose former
employers have been crowded out of the market due to the entry of a Walmart are
faced with unemployment and may be forced to take jobs at Walmart offering
lesser pay and decreased benefits, thus qualifying them for welfare services.8
Counter arguments to this explanation of increased Medicaid coverage rates
suggest that Medicaid eligible workers experience a real income increase by
choosing Medicaid in lieu of employer-based health insurance in which premiums
and co-pays are required (Hicks 2005). The choice of medical coverage is thus a
utility maximizing decision made by the worker and may also explain the
8 The Medicaid program was enacted to provide health care to low-income children, families, and individuals who fit into an eligibility group recognized by federal and state law. Qualification for Medicaid is based on age, income and resources, and whether the individual is pregnant, disabled, blind, and/or aged. It is a state administered program with separately mandated guidelines for eligibility and services (U.S. Department of Health and Human Services - Centers for Medicare and Medicaid Services 2011).

18
increasing rates of private health care coverage found in this study, as employees
find it most beneficial to purchase their own form of coverage.
Others argue that employing large numbers of low-wage workers is a
strategy used by large firms, such as Walmart, that seek to avoid the costs of
providing employer-sponsored health care (see Cutler and Gruber 1996). By
making eligibility for benefits more difficult for workers, many may opt to utilize
alternative forms of coverage. In the case of Walmart, part-time status was
increased in 2002 from those who work 28 hours per week or less to cover those
who work 34 hours per week or less. This may help to explain the rise and
patterns seen in welfare dependence, as workers may have initially received
benefits before more stringent requirements were placed making them ineligible.
In its March 2010 Corporate Fact Sheet, Walmart states, “The majority of
our associates work full-time. Many of our associates are senior citizens who need
supplemental income or students who want work experience.” Given this
assertion, the question that must be asked is whether the provision of employee
benefits is still a major concern. Students are dependents and are therefore
covered by their providers of care or by the state, and any citizen over age 65 is
eligible for Medicare.9 Given these two groups’ guaranteed access to healthcare
coverage, the issue of Walmart’s effect on their healthcare is of lesser concern and
9 The Medicare program was established in 1965 as part of the Social Security Act extending
health insurance coverage to all people aged 65 and older. In 1972, eligibility was further extended to include people under the age of 65 with long-term disabilities and individuals with end-stage renal disease. Thus, the Medicare eligibility requirement does not rely on measures of employment or income, making Walmart’s effect on healthcare inconsequential. (U.S. Department of Health and Human Services - Centers for Medicare and Medicaid Services 2011)

19
helps to explain Walmart’s indiscernible effects on Medicare coverage rates seen
in this study.
While the results of this study do not provide conclusive results as to the
effects of Walmart, they do provide interesting insight into both sides of the
Walmart debate. Looking at preceding and subsequent years of a Walmart
introduction provides interesting patterns, but it also suggests that the placement
of Walmart stores is non-random and thus the problem endogeneity of Walmart’s
entrance decision still remains. Given the opportunity, I would like to pursue
future work on this topic using an instrumental variable approach to better correct
for the problem of endogeneity and to obtain more precise results. While
Walmart’s anti-unionization policy and poor employee treatment remain
troubling, it is clear from the mixed results presented in this case study that
further research is necessary before taking a definitive stance for or against the
presence of Walmart in American society.

20
IX. Sources Cited and Consulted
Basker, Emek. “Job Creation or Destruction? Labor Market Effects of Wal-Mart
Expansion.” Review of Economics and Statistics. 87 (2005): 174-183.
Ciccarella, S., David Neumark, and Junfu Zhang, “The Effects of Wal-Mart on
Local Labor Markets.” National Bureau of Economic Research Working
Paper No 11782 (2005).
Cutler, David M and Jonathan Gruber, “Does Public Insurance Crowd Out Private
Insurance?” The Quarterly Journal of Economics. MIT Press, vol.
111(1996): 391-430.
Dube, Arindrajit, Barry Eidlin, and T. William Lester. “A Downward Push: The
Impact of Wal-Mart Stores on Retail Wages and Benefits.” Research
Brief, UC Berkeley Center for Labor Research and Education. (2007).
Dube, Arindrajit and Ken Jacobs. “Hidden Cost of Wal-Mart Jobs: Use of Safety
Net Programs by Wal-Mart Workers in California.” Research Brief, UC
Berkeley Center for Labor Research and Education. (2004).
Franklin, Andrew W. “The Impact of Wal-Mart Supercenters on Supermarket
Concentration in U.S. Metropolitan Areas.” Agribusiness 17(2001).
Gardner, Michael. “Bill requiring Walmart studies passes committee.” The San
Diego Union-Tribune. April 6, 2011. www.signonsandiego.com
Hicks, Michael J. “Does Wal-Mart Cause an Increase in Medicaid Expenditures?”
Regional Economic Review. (2005).
Hicks, Michael J. and Kristy Wilburn. “The Regional Impact of Wal-Mart
Entrance: A Panel Study of the Retail Trade Sector in West Virginia.”
Review of Regional Studies. 31 (2001): 305-313.
Hirsch, Barry T. David A. Macpherson, "Union Membership and Coverage
Database from the Current Population Survey: Note," Industrial and
Labor Relations Review, 56 (2003): 349-54.
Stone, Kenneth E. “Impact of the Wal-Mart Phenomenon on Rural
Communities.” D.P. Ernestes and D.M. Hicks (eds.), Increasing
Understanding of Public Problems and Policies, Farm Foundation,
Chicago, Illinois. (1997): 189-200.
Stone, Kenneth E. “Impact of Wal-Mart Stores on Iowa Communities: 1983-93.”
Economic Development Review. (1995):60-69.

21
Stone, Kenneth E., Georgeanne Artz, and Albert Myles. “The Economic Impact
of Wal-Mart Supercenters on Existing Businesses in Mississippi.” (2002).
Stone, Kenneth E. “The Impact of Wal-Mart Stores on Retail Trade Areas in
Iowa.” (1989).
U.S. Census Bureau, “Metropolitan and Micropolitan Statistical Areas.” (2011)
http://www.census.gov/population/www/metroareas/metroarea.html
U.S. Department of Health and Human Services, “Centers for Medicare &
Medicaid Services.” (2011) https://www.cms.gov/MedicaidGenInfo/
Walmart, “2011 Annual Report.” (2011)
http://walmartstores.com/sites/annualreport/2011/
Walmart. “Corporate Facts: Walmart by the Numbers” (2010)
http://walmartstores.com/pressroom/factsheets/
Walmart, “Unions (For U.S. Operations Only) January 12, 2005 Press Release.
http://walmartstores.com/pressroom/news/5037.aspx

22
X. Appendices
a. Figures
Figure 1: Location of Walmart Openings, 1970-2001

23
Figure 2: Percentage of Walmart Openings in Analyzed MSAs, 1996-2004
Figure 3: Average Population vs. Number of Store Openings in Analyzed MSAs
40%
21%
6%
9%
8%
3% 5%
1%3%
1%1% 1%
1%
Walmart Openings
in Analyzed MSAs, 1996 - 2004
1 opening
2 openings
3 openings
4 openings
5 openings
6 openings
7 openings
8 openings
10 openings
11 openings
12 openings
14 openings
17 openings
0
500,000
1,000,000
1,500,000
2,000,000
2,500,000
3,000,000
3,500,000
4,000,000
4,500,000
5,000,000
1 2 3 4 5 6 7 8 10 11 12 14 17
Average Population in Analyzed MSAs
Total Number of Walmart Openings, 1996 - 2004
24
Figure 4: Lead and Lag Effects of Walmart Openings
-4
-2
0
2
-4 -2 0 2 4
Panel A: Effects of Walmart
Entry on Medicaid Coverage
Lead and Lag Effects of Walmart Entry on
Medicaid Coverage
-1
-0.5
0
0.5
-4 -2 0 2 4
Panel B: Effects of Walmart
Entry on Union Membership
Lead and Lag Effects of Walmart Entry on
Union Membership
-10
0
10
20
-4 -2 0 2 4
Panel C: Effects of Walmart
Entry on Private Health
Insurance Coverage
Lead and Lag Effects of Walmart Entry on
Private Health Insurance Coverage
0
1
2
3
-4 -2 0 2 4
Panel D: Effects of Walmart
Entry on Retail Employment
Lead and Lag Effects of Walmart Entry on
Retail Employment

25
Figure 4 (continued): Lead and Lag Effects of Walmart Openings
-2000
0
2000
4000
-4 -2 0 2 4
Panel E: Effects of Walmart
Entry on Income
Lead and Lag Effects of Walmart Entry on
Income
-2
-1.5
-1
-0.5
0
-4 -2 0 2 4
Panel F: Effects of Walmart
Entry on Medicare Coverage
Lead and Lag Effects of Walmart Entry on
Medicare Coverage
-0.2
-0.15
-0.1
-0.05
0
0.05
-4 -2 0 2 4
Panel G: Effects of Walmart
Entry on Union Coverage
Lead and Lag Effects of Walmart Entry on
Union Coverage
-2
0
2
4
-4 -2 0 2 4
Panel H: Effects of Walmart
Entry on Food Stamp
Recipients
Lead and Lag Effects of Walmart Entry on
Food Stamp Recipients

26
b. Tables
Table 1: Metropolitan Statistical Areas Analyzed
MSA Area Encompassed
Population*
Number of
Walmarts Opened
1996 - 2004
12060 Atlanta-Sandy Springs-Marietta, GA 4,247,981 10
12580 Baltimore-Towson, MD 2,552,994 12
12940 Baton Rouge, LA 705,973 2
13820 Birmingham-Hoover, AL 1,052,238 5
14600 Bradenton-Sarasota-Venice, FL 589,959 2
15980 Cape Coral-Fort Myers, FL 440,888 1
16300 Cedar Rapids, IA 237,230 1
16740 Charlotte-Gastonia-Concord, NC-SC 1,330,448 2
17140 Cincinnati-Middletown, OH-KY-IN 2,009,632 4
17300 Clarksville, TN-KY 232,000 1
17460 Cleveland-Elyria-Mentor, OH 2,148,143 6
17820 Colorado Springs, CO 537,484 2
19340 Davenport-Moline-Rock Island, IA-IL 376,019 2
19500 Decatur, IL 114,706 1
19740 Denver-Aurora-Broomfield, CO 2,179,240 8
20100 Dover, DE 126,697 1
20260 Duluth, MN-WI 275,486 1
20620 East Liverpool-Salem, OH 112,075 1
21500 Erie, PA 280,843 5
21660 Eugene-Springfield, OR 322,959 4
22180 Fayetteville, NC 336,609 2
22420 Flint, MI 436,141 1
22660 Fort Collins-Loveland, CO 251,494 1
24540 Greeley, CO 180,926 1
24580 Green Bay, WI 282,599 1
26420 Houston-Sugar Land-Baytown, TX 4,715,407 17
26900 Indianapolis-Carmel, IN 1,525,104 4
27100 Jackson, MI 158,422 1
27260 Jacksonville, FL 1,122,750 3
28140 Kansas City, MO-KS 1,836,038 6
28740 Kingston, NY 177,749 1
29460 Lakeland-Winter Haven, FL 483,924 1
29540 Lancaster, PA 470,658 3
29700 Laredo, TX 193,117 1
29740 Las Cruces, NM 174,682 1
29820 Las Vegas-Paradise, NV 1,375,765 7
30700 Lincoln, NE 266,787 1
32580 McAllen-Edinburg-Mission, TX 569,463 1
33460 Minneapolis-St. Paul-Bloomington, MN-WI 2,968,806 7
34820 Myrtle Beach-North Myrtle Beach-Conway, SC 196,629 2
34940 Naples-Marco Island, FL 251,377 1
35380 New Orleans-Metairie-Kenner, LA 1,316,510 4

27
Table 1 continued: Metropolitan Statistical Areas Analyzed
MSA Area Encompassed Population*
Number of
Walmarts Opened
1996 - 2004
36100 Ocala, FL 258,916 2
36500 Olympia, WA 207,355 1
36740 Orlando-Kissimmee, FL 1,644,561 4
37100 Oxnard-Thousand Oaks-Ventura, CA 753,197 1
37340 Palm Bay-Melbourne-Titusville, FL 476,230 1
38060 Phoenix-Mesa-Scottsdale, AZ 3,251,876 14
38300 Pittsburgh, PA 2,431,087 11
38900 Portland-Vancouver-Beaverton, OR-WA 1,927,881 5
39100 Poughkeepsie-Newburgh-Middletown, NY 621,517 1
39340 Provo-Orem, UT 376,774 4
39540 Racine, WI 188,831 2
39580 Raleigh-Cary, NC 797,071 5
39740 Reading, PA 373,638 2
39900 Reno-Sparks, NV 342,885 2
40060 Richmond, VA 1,096,957 5
40380 Rochester, NY 1,037,831 2
40900 Sacramento--Arden-Arcade--Roseville, CA 1,796,857 7
41180 St. Louis, MO-IL 2,698,687 4
41740 San Diego-Carlsbad-San Marcos, CA 2,813,833 10
41940 San Jose-Sunnyvale-Santa Clara, CA 1,735,819 2
42020 San Luis Obispo-Paso Robles, CA 246,681 1
42060 Santa Barbara-Santa Maria-Goleta, CA 399,347 1
42220 Santa Rosa-Petaluma, CA 458,614 1
42580 Seaford, DE 156,638 3
43620 Sioux Falls, SD 187,093 1
43780 South Bend-Mishawaka, IN-MI 316,663 2
44060 Spokane, WA 417,939 3
45060 Syracuse, NY 650,154 3
45300 Tampa-St. Petersburg-Clearwater, FL 2,395,997 7
45940 Trenton-Ewing, NJ 350,761 1
46060 Tucson, AZ 843,746 2
46140 Tulsa, OK 859,532 1
47260 Virginia Beach-Norfolk-Newport News, VA-NC 1,576,370 5
48900 Wilmington, NC 274,532 1
49180 Winston-Salem, NC 421,961 2
49740 Yuma, AZ 160,026 1
*For the year 2000, obtained from the U.S. Census Bureau
28
Table 2: MSA Selected Summary Statistics
Mean Standard Deviation
Population** 945,023 991,111
Income $20,908.11 5104.5
Age 35 4.11
Black 10.52% 0.113
White 85.36% 0.116
Employed 47.27% 0.065
Unemployed 2.16% 0.015
High School Graduate 23.75% 0.066
Bachelor's Degree 12.10% 0.048
Graduate Degree 5.42% 0.028
Food Stamp Receipient 17.69% 0.065
Private Health Ins. Coverage 57.03% 0.963
Medicaid Coverage 9.20% 0.056
Medicare Coverage 13.44% 0.058
Union Membership 1.30% 0.013
Union Coverage 0.15% 0.003
Employed Retail Sector 10.64% 0.033
Employed Manufacturing Sector 6.87% 0.040
Employed Transportation Sector 2.24% 0.016
** Based on the 2000 U.S. Census Bureau

29
Table 3: OLS and Fixed Effects Estimates of Effects of Walmart
(1) (2) (3) (4) (5) (6) (7)
Panel A: Medicaid Coverage
Total Walmarts / 100 -0.108 -0.106 -0.156 -0.105 -0.202 0.055 0.039
(0.018)** (0.018)** (0.095) (0.021)** (0.092)** (0.17) (0.171)
R2 0.025 0.025 0.560 0.244 0.597 0.657 0.675
Panel B: Union Membership
Total Walmarts / 100 -0.009 -0.008 -0.002 0.001 -0.008 -0.027 -0.017
(0.005)** (0.005) (0.025) (0.005) (0.025) (0.051) (0.052)
R2 0.003 0.006 0.590 0.091 0.599 0.676 0.679
Panel C: Private Healthcare Coverage
Total Walmarts /
100 0.081 0.085 0.230 0.014 0.259 0.001 0.103
(0.033)** (0.033)** (0.145) (0.028)** (0.117)** (0.309) (0.305)
R2 0.005 0.006 0.663 0.511 0.774 0.707 0.728
Controls? Yes Yes Yes
Time Trend? Yes Yes
MSA Fixed Effects? Yes Yes Yes Yes
Year Fixed Effects? Yes Yes Yes MSA-Specific
Trends? Yes Yes
Observations 702 702 702 702 702 702 702
**denotes significance at the 5% level

30
Table 4: Lagged Effects of Walmart on Medicaid Coverage, Union Membership, and Private Healthcare
(1) (2) (3) (4) (5) (6) (7) (8) (9)
Medicaid Coverage Union Membership Private Healthcare Coverage
Walmart Opened / 100 -0.126 -0.001 -0.017 -0.084 -0.057 0.834 -0.084 -0.057 0.834
(0.232) (0.251) (0.319) (0.347) (0.487) (1.029) (0.347) (0.487) (1.029)
L1.Walmart Opened / 100 -0.040 -0.024 0.759 0.595 -0.165 1.850 0.595 -0.165 1.850
(0.342) (0.435) (0.56) (0.553) (0.613) (1.449) (0.553) (0.613) (1.449)
L2.Walmart Opened / 100 0.274 0.746 1.305 0.487 -0.498 2.383 0.487 -0.498 2.383
(0.399) (0.568) (0.84) (0.607) (0.959) (2.409) (0.607) (0.959) (2.409)
L3.Walmart Opened / 100 0.518 1.125 1.206 -0.022 -0.921 2.558 -0.022 -0.921 2.558
(0.389) (0.62) (0.983) (0.542) (0.962) (2.656) (0.542) (0.962) (2.656)
L4.Walmart Opened / 100 0.887 0.470
-0.753 2.229
-0.753 2.229
(0.473) (0.904) (0.724) (2.228) (0.724) (2.228)
L5.Walmart Opened / 100 -0.258
1.877
1.877
(0.715)
(1.175)
(1.175)
R2 0.780 0.801 0.872 0.829 0.854 0.870 0.829 0.854 0.870
Controls? Yes Yes Yes Yes Yes Yes Yes Yes Yes
Time Trend?
MSA Fixed Effects? Yes Yes Yes Yes Yes Yes Yes Yes Yes
Year Fixed Effects? Yes Yes Yes Yes Yes Yes Yes Yes Yes
MSA-Specific Trends? Yes Yes Yes Yes Yes Yes Yes Yes Yes
Observations 468 390 312 468 390 312 468 390 312
**denotes significance at the 5% level

31
**denotes significance at the 5% level
Table 5: OLS and Fixed Effects Estimates of Effects of Walmart
Income Medicare
Union
Coverage
Food
Stamp
Recipients
Retail
Employment
Total Walmarts / 100 -229.6 -0.192 0.000 -0.351 -0.394
(167.8) (0.133) (0.018) (0.231) (0.154)**
Controls? Yes Yes Yes Yes Yes
Time Trend?
MSA Fixed Effects? Yes Yes Yes Yes Yes
Year Fixed Effects? Yes Yes Yes Yes Yes
MSA-Specific Trends? Yes Yes Yes Yes Yes
R2 0.855 0.86 0.291 0.698 0.395
Observations 702 702 702 702 702

32
Table 6: Lagged Effects of Walmart Openings
Income Medicare
Union
Coverage
Food
Stamp
Recipients
Retail
Employment
Walmart Opened / 100 124.5 -0.052 0.01 0.181 0.021
(268.1) (0.258) (0.032) (0.758) (0.375)
L1.Walmart Opened / 100 -174.4 0.402 -0.03 -0.498 0.608
(419.2) (0.431) (0.047) (1.01) (0.7)
L2.Walmart Opened / 100 220.6 0.554 -0.02 -0.298 0.914
(699.) (0.617) (0.072) (1.63) (0.957)
L3.Walmart Opened / 100 418.4 0.103 -0.07 -0.442 0.425
(779.5) (0.756) (0.084) (1.886) (1.143)
L4.Walmart Opened / 100 415.1 -0.146 -0.07 -0.436 -0.326
(807.3) (0.819) (0.094) (1.726) (1.148)
L5.Walmart Opened / 100 304.5 -0.677 0.01 0.345 0.263
(527.7) (0.509) (0.064) (1.026) (0.933)
Controls? Yes Yes Yes Yes Yes
Time Trend?
MSA Fixed Effects? Yes Yes Yes Yes Yes
Year Fixed Effects? Yes Yes Yes Yes Yes
MSA-Specific Trends? Yes Yes Yes Yes Yes
R2 0.922 0.916 0.60 0.772 0.723
Observations 312 312 312 312 312