the electrochemistry of mercury at glassy carbon and tungsten electrodes in the aluminum...
TRANSCRIPT

doi: 10.1149/1.22209611993, Volume 140, Issue 5, Pages 1226-1233.J. Electrochem. Soc.
Xiao-Hong Xu and Charles L. Hussey
Ethylimidazolium Chloride Molten Salt−3−Methyl−1−Tungsten Electrodes in the Aluminum Chloride
The Electrochemistry of Mercury at Glassy Carbon and
serviceEmail alerting
click herein the box at the top right corner of the article or Receive free email alerts when new articles cite this article - sign up
http://jes.ecsdl.org/subscriptions go to: Journal of The Electrochemical SocietyTo subscribe to
© 1993 ECS - The Electrochemical Society

The Electrochemistry of Mercury at Glassy Carbon and Tungsten Electrodes in the Aluminum
Chloride-l-Methyl-3-Ethylimidazolium Chloride Molten Salt Xiaa-Hong Xu* and Charles L. Hussey**
Department of Chemistry, University of Mississippi, University, Mississippi 38677
ABSTRACT
The electrochemistry of mercury was studied with voltammetry and chronoamperometry at glassy carbon and poly- crystalline tungsten electrodes in the A1C13-1-methyl-3-ethylimidazolium chloride molten salt. The reduction of Hg ~+ to Hg in the acidic 66.7-33.3 mole percent (m/o) melt involves two steps with the intermediate formation of Hg~ +, whereas the reduction of [HgC12+,] p to Hg in the basic 44.4-55.6 m/o melt proceeds by a single two-electron step. Hg~+ is stable in acidic melt but disproportionates to form [HgC12+p] p- and Hg metal in basic melt. The electrodeposition of Hg metal on glassy carbon from solutions of Hg~ § in acidic melt entails progressive three-dimensional nucleation on a finite number of active sites with diffusion-controlled growth of the nuclei. The electrodeposition of Hg metal from solutions of [HgC12+p] p- in basic melt involves progressive three-dimensional nucleation on a large number of active sites on tungsten and instantaneous three-dimensional nucleation on glassy carbon. The diffusion coefficient and Stokes-Einstein product of Hg~ + in acidic melt are (3.5 _+ 0.5) • 10 -7 cm 2 s -1 and 6.9 • 10 n g cm s -2 K -~, respectively, at 60~ The diffusion coefficient and Stokes-Einstein product of [HgC12j p- in basic melt are (3.0 -+ 0.5) • 10 -7 cm 2 s -1 and 2.0 • 10 ~0 g cm s -2 K -I, respectively, at 40~ The
2+ 2+ 2+ 2+ ~_ ~_ formal potentials o~ the Hg /Hg2, Hg2/Hg, and Hg /Hg redox couples in acidic melt are 1.21 _ 0.01, 1.093 _ 0.002, and ~ - o p 1.15 _ 0.01 V, respectively, vs. AI(III)/A1 in the 66.7-33.3 m/o melt at 40 C. The formal potential of the [HgC12+p] - /Hg couple
in basic melt is -0.370 +_ 0.007 V vs. this same reference electrode. The equilibrium constant for the disproportionation of Hg~ § is ~1.3 • 10 -2 at 40~ in acidic melt. Hg~ + exhibits a single UV-Vis absorption band at 275 nm (e ~ 2.5 • 1041 mol -~
1 2+ o cm- ) in the 66.7-33.3 m/o melt. Hg metal appears to react with Hg2 at 100 C to produce a species with an absorption band at 318 nm. This species is tentatively identified as the Hg~ § cluster.
Room-temperature chloroaluminate melts are obtained when aluminum chloride is combined with certain quater- nary ammonium chloride salts that possess "bulky" or- ganic cations. The most popular examples of this class of molten salts are the mixtures of AIC13 with either 1-(1- butyl)pyridinium chloride (BupyC1) or 1-methyl-3-ethyl- imidazolium chloride (MeEtimC1). 1'2 The composition of these binary melts is typically described in terms of the mole percentage of the two components. Room-tempera- ture chloroaluminates display adjustable Lewis acidity; this acidity can be varied by changing the molar ratio of the two components. Acidic melts (>50 m/o A1C13) contain coor- dinately unsaturated species such as A12CI~ and A13CI~0, which are chloride ion acceptors, whereas basic melts (<50 m/o A1C13) contain chloride ion that is not covalently bound to aluminum. Not surprisingly, the acidity of these melts has a profound effect on the solvation of solutes. Most metal ions dissolve in basic melt to form well-defined an- ionic chloride complexes. 3 Extended x-ray absorption fine structure (EXAFS) studies suggest that metal ions are sol- vated by chloroaluminate ions in acidic melts. 4 However, this solvation must be very weak because it is possible to stabilize homopolyatomic clusters such as Bi~ § in these melts. ~ Such metal clusters are only stable in very acidic solution environments where there is minimal interaction between the solvent and the cluster. ~
In molten alkali metal chlorides and related high temper- ature melts, the stable oxidation states of mercury are confined to mercury(II) and the metal because mercury(I) disproportionates to give the former and either gaseous or liquid metal, depending on the temperature of the melt. 7-~~ However, under the Lewis acidic conditions afforded by the moderate temperature aluminum chloride-rich alkali metal chloroaluminates, it is possible to stabilize mer- cury(I) as the dimeric homopolyatomic cluster Hg~ § and to observe the electrochemical reduction of this species to the metal, n-~3 Detailed investigations of the reduction of mer- cury(II) in acidic A1C13-NaC1 melt by Mamantov and co- workers ~4'1~ revealed that mercury(II) is reduced to the metal in three steps at.a platinum electrode
2Hg 2§ + 2e- Hg~ § [1]
* Electrochemical Society Student Member. ** Electrochemical Society Active Member.
3Hg~ + + 2e 2Hg~ + [2]
Hg~ § + 2e- 3Hg [3]
The trimeric Hg~ + cluster has been isolated from this melt as the [Hg3] [A1C14]2 salt.16 Although mercury solutes have been studied in molten alkali metal chloroaluminates, there is a paucity of information about the chemistry and electro- chemistry of these solutes in the related room temperature organic melts. We report here the electrochemistry of mer- cury(II) and mercury(I) and the electrodeposition of mer- cury on glassy carbon and polycrystalline tungsten elec- trodes in the A1C13-MeEtimC1 melt. These electrodep- osition results are an outgrowth of an ongoing investiga- tion in this laboratory into the deposition of metals from room-temperature chloroaluminate melts.
Experimental Apparatus . - -Al l experiments were conducted in a dry N2
atmosphere in a Kewaunee Scientific Equipment Corp. glove box equipped with a 30 ft3/min inert gas purifier. The quality of the glove-box atmosphere was monitored by ob- serving the lifetime of a 25-W incandescent light bulb with a hole pierced in its glass envelope.17'18 The electrochemical instrumentation, electrode rotator, X-Y-t recorder, electro- chemical cell, and furnace used to heat the cell were identi- cal to those used in previous studies. 1922 A glassy carbon disk rotating electrode (GCRDE) suitable for use at ele- vated temperatures was constructed by sealing a 2.9-mm diam glassy carbon rod (Tokai grade GC-30) in the end of a short length of heavy-wall Pyrex tubing by using the vac- uum procedure described by Phillips et. al. 22 The end of the Pyrex tubing containing the glassy carbon rod was cut off with a glass saw so as to expose the cross section of the rod. The open end of the Pyrex tubing was slipped over a ma- chined stainless steel shaft and attached permanently to the shaft with epoxy glue; contact between the end of the shaft and the glassy carbon was provided by a small spring. The fabrication of a tungsten disk electrode with a Teflon shroud was described previously.2~ The geometrical surface areas of the glassy carbon and tungsten electrodes are 0.066 and 0.071 cm 2, respectively. Before use, each electrode was polished successively with aqueous slurries of 0.1 and 0.05 ~m alumina by using a Buehler Metaserv grinder/pol- isher, rinsed with distilled water, and dried under vacuum
1226 J. Electrochem. Soc., Vol. 140, No. 5, May 1993 �9 The Electrochemical Society, Inc.

J. Electrochem. Soc., Vol. 140, No. 5, May 1993 �9 The Electrochemical Society, Inc. 1227
in the stove box antichamber. All electrode potentials re- ported herein are referenced to the AI(III)/A1 couple in the 66.7-33.3 m/o A1C]3-MeEtimC1 melt.
Chemicals.--The procedures used for the preparation and purification of the MeEtimC1 salt have been described previouslyJ 4 In essence, this procedure involves reacting freshly distilled 1-methylimidazole with excess ethyl chlo- ride in a glass pressure vessel at 60~ for about three days. The resulting MeEtimC1 is purified by precipitation from acetonitrile solutions with ethyl acetate. Usually, three such precipitations are required to obtain a product of ac- ceptable purity. All manipulations of the MeEtimC1 were performed on a Schlenk line using Kontes Airless-Ware. Aluminum(III) chloride, A12C16, (Fluka, >99%) was sub- limed under vacuum a minimum of three times in a heavy- walled reaction flask inside a glove box. The first of these sublimations was carried out from A1C13-NaC1 melt. Pro- ton-containing impurities were removed from the A1C13- MeEtimC1 melt by evacuating the melt to <1 • 10-3 Torr for 72 h. While evacuated, the melt was heated to 60-70~ and stirred vigorously. Ultradry HgC12 (Materials Technology, U.K., 99.9995%), ultradry Hg2C12 (Johnson Matthey, 99.9995%) and mercury metal (Alfa Products, electronic grade) were used as received.
Results and Discussion Reduction of mercury(II) in acidic melt.--Mercury(II)
was introduced into the 66.7-33.3 m/o A1C13-MeEtimC1 melt by dissolving HgC12. The resulting solutions were col- orless and exhibited no significant UV-Vis absorption bands between 900 nm and the UV cutoff of the melt at ca. 250 nm. Stationary electrode cyclic voltammograms recorded at glassy carbon and tungsten electrodes in one of these solutions are shown in Fig. 1. The voltammograms in this figure exhibit two reduction waves of approximately equal magnitude and a single oxidation wave with the sym- metrical shape associated with a reaction involving the stripping of an insoluble deposit from the electrode sur- face. The positions of the two reduction waves are depend- ent upon the electrode material. For example, the peak po- tentials for these two waves are observed at 1.04 and 0.79 V at glassy carbon and at 1.14 and 0.93 V at tungsten. The oxidation wave appearing in each of these voltammograms must be associated with the second reduction wave because this wave is absent if the cathodic scan is reversed before the second reduction wave. The first reduction process may be irreversible because there is no oxidation current associ- ated with this wave prior to the positive limit of the melt. If a small amount of Hg2C12 is added to the HgC12 solution, then the currents for the second reduction wave and the stripping wave increase, but the current for the first reduc- tion wave is unaffected (Fig. lb). Furthermore, if the poten- tial applied to either working electrode is held at ca. 0.4 V for several minutes in a stirred solution containing HgC12, then the electrode becomes coated with an obvious film of mercury metal.
Controlled-potential coulometry experiments were un- dertaken in a cell constructed from a glassy carbon cup with solutions of HgC12 at an applied potential of 1.00 V to determine the number of electrons, n, associated with the first reduction process. The results of two such experiments are shown in Table I. In this table, m~g(i~l is the number of moles of HgC12, Qexp, is the charge passed during the exper- iment, a n d Qtheory is the theoretical charge based on the one-electron reduction of m~gl~) moles of HgC12. A cyclic voltammogram and an absorption spectrum of the elec- trolytica]ly reduced solution were identical to those recorded in solutions known to contain the Hg~ + ion (vide infra). Taken together, the results suggest that the re- duction of Hg 2+ in acidic A1C13-MeEtimC1 involves the fol- lowing sequence of steps
2Hg 2+ + 2e- Hg~ + [4]
Hg~ + + 2e 2Hg [5]
2.0
I 1oo ,uA
I
I 1.6
I I I I I I 1.2 0.8 0.4
I 2oo ,~
1 [
I I I I I I I I I 2,0 1.6 1.2 0,8 0.4 0
E (V) vs At
Fig. 1. Cyclic voltammograms record e~loin a 22.6 mM solution of HgCl2 in the 66 .7 -33 .3 m / o melt at 60 C: (a) glassy.carbo.n, (b) polycrystalline lungsten. The sweep rates were 50 mV s '. The valtammogram represented with a dashed line in (b) was recorded after a small amount of Hg2CI2 was dissolved in the original HgCI2 solution.
with the first reduction step being irreversible at both glassy carbon and tungsten. A white precipitate of what appeared to be Hg2C12 was obtained toward the end of these coulometry experiments if the initial concentration of Hg 2§ in the solution under study was more than twice the solu- bility of Hg2C12. The latter compound is only sparingly sol- uble in these melts; it is necessary to heat the melt to 60~ or more to prepare a solution that is - 4 mM in Hg~ §
Table I. Coulometric results for the reduction of HgCI2.
105mH~gi) = I) Q' r l 66.7-33.3 m/o melt
6.22 6.01 6.05 11.3 10.9 10.1
44.4-55.6 m/o melt 11.9 11.5 22.3 16.2 15.6 31.3
1.01" 0.93 b
Avg: 0.97 -+ 0.04
1.94 ~ 2.01 c
Avg: 1.98 +- 0.04
~E - 1.10 V. b app --
E a p p = 1 . 0 0 V ,
E~pv = -1.20 V.
1228 J. Electrochem. Soc., Vol. 140, No. 5, May 1993 �9 The Electrochemical Society, Inc.
e.. o
,.o
d 1.2
1.0
0.8
0.6
0.4 i
0 . 2
i oJ
, , ~ 250 270 2 0
,,% \
\ \ \ \
350 370 3 0
Wavelength (rim)
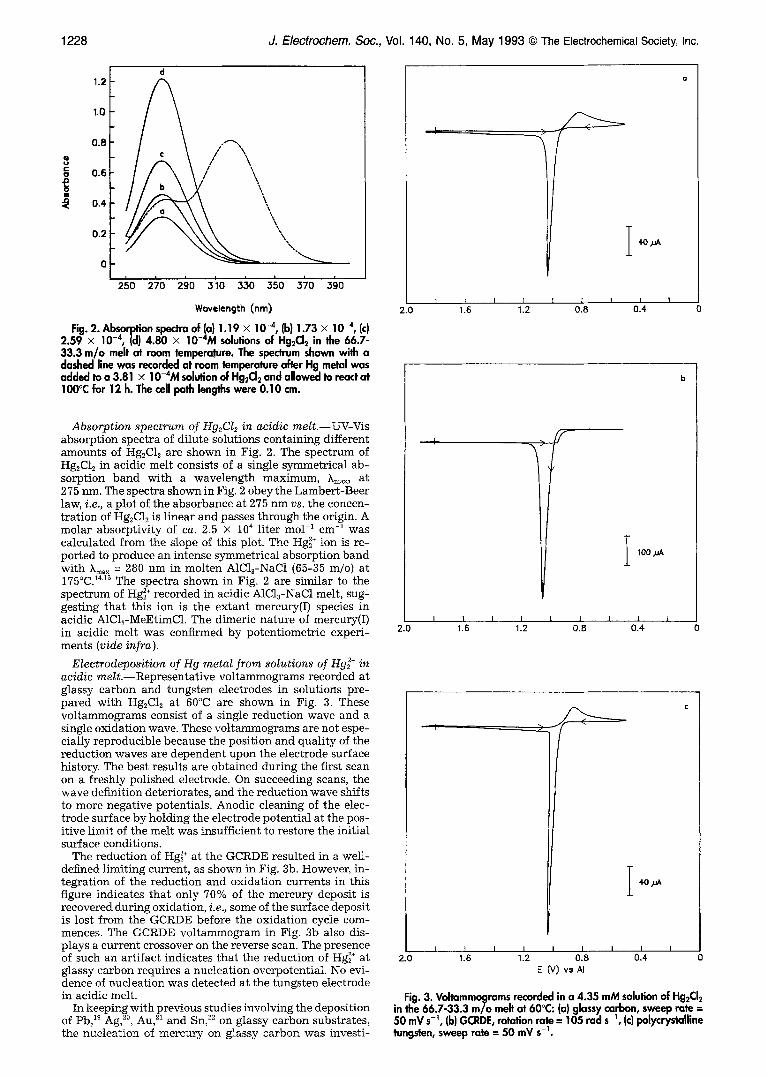
Fig. 2. Absorption spectra of (a) 1.19 • 10 -4, (b) 1.73 • 10 -4, (c) 2.59 • 10 -4, (d) 4.80 • 10-4M solutions of Hg2CI2 in the 66.7- 33.3 m/o melt at room temperature. The spectrum shown with a dashed line was recorded at room temperature after Hg metal was added to a 3.81 • 10-4M solution of Hg2CI2 and allowed to react at I00~ for 12 h. The cell path lengths were 0.10 cm.
Absorption spectrum of Hg2CI2 in acidic melt.--UV-Vis absorption spectra of dilute solutions containing different amounts of I-Ig2Cl~ are shown in Fig. 2. The spectrum of Hg2C12 in acidic melt consists of a single symmetrical ab- sorption band with a wavelength maximum, kin=, at 275 nm. The spectra shown in Fig. 2 obey the Lambert-Beer law, i.e., a plot of the absorbance at 275 nm vs. the concen- tration of Hg2C12 is linear and passes through the origin. A molar absorptivity of ca. 2.5 • 104 liter mol 1 cm-1 was calculated from the slope of this plot. The Hg~ § ion is re- ported to produce an intense symmetrical absorption band with Xm~x = 280 nm in molten A1C13-NaC1 (65-35 m/o) at 175~ 14'1~ The spectra shown in Fig. 2 are similar to the spectrum of Hg~ § recorded in acidic A1C13-NaC1 melt, sug- gesting that this ion is the extant mercury(I) species in acidic A1C13-MeEtimC1. The dimeric nature of mercury(I) in acidic melt was confirmed by potentiometric experi- ments (vide infra ).
Electrodeposition of Hg metal from solutions of Hg~* in acidic melt--Representative voltammograms recorded at glassy carbon and tungsten electrodes in solutions pre- pared with Hg2C12 at 60~ are shown in Fig. 3. These voltammograms consist of a single reduction wave and a single oxidation wave. These voltammograms are not espe- cially reproducible because the position and quality of the reduction waves are dependent upon the electrode surface history. The best results are obtained during the first scan on a freshly polished electrode. On succeeding scans, the wave definition deteriorates, and the reduction wave shifts to more negative potentials. Anodic cleaning of the elec- trode surface by holding the electrode potential at the pos- itive limit of the melt was insufficient to restore the initial surface conditions.
The reduction of Hg~ § at the GCRDE resulted in a well- defined limiting current, as shown in Fig. 3b. However, in- tegration of the reduction and oxidation currents in this figure indicates that only 70% of the mercury deposit is recovered during oxidation, Le., some of the surface deposit is lost from the GCRDE before the oxidation cycle com- mences. The GCRDE voltammogram in Fig. 3b also dis- plays a current crossover on the reverse scan. The presence of such an artifact indicates that the reduction of Hg~ + at glassy carbon requires a nucleation overpotential. No evi- dence of nucleation was detected at the tungsten electrode in acidic melt.
In keeping with previous studies involving the deposition of Pb, 19 Ag, ~~ Au, 21 and Sn, n on glassy carbon substrates, the nucleation of mercury on glassy carbon was investi-
I r
I 2.0 1.6 0
I 1 [ ~ I 1 1.2 0.8 0.4
I ,oo
2.0 0 I
1 . 6 I I i I J i
1.2 0.8 0.4
1,0n
2.0 0 I
1.6 I I I I I I 1.2 0.8 0.4
E (v) vs At
Fig. 3. Voltammograms recorded in a 4.35 mM solution of Hg2CI2 in the 66.7-33.3 m/o melt at 60 C: (a) glassy carbon, sweep rate = 50 mV s -1, (b) GCRDE, rotation rate = 105 rad s -1, (c) polycrystalline tungsten, sweep rate = 50 mV s -~.

J. Electrochem. Soc., Vol. 140, No. 5, May 1993 �9 The Electrochemical Society, Inc. 1229
lO ,uA
I I I I I I I I I I 0 4 8 12 16 20
t (s) Fig. 4. Examples of current-time transients resulting from potential-
step experiments at (a) glassy carbon in a 4.35 mM solution of Hg2CI2 in the 66.7-33.3 m/o melt at 60~ Eopp = 0.870 V; (b) glassy carbon in a 63.1 mM solution of HgCl2 in the 4 4 . 4 - 5 5 . 6 m/o melt at 40~ Eopp. = - 1.57 V; {c) polycrystalline tungsten in the solution described in (b) at 60 C, Eapp = - 0 .570 V.
gated by carrying out potential-step experiments. These experiments were conducted by stepping the potential of the glassy carbon electrode in an unstirred solution con- taining Hg~ § from 1.30 V, where no reduction takes place, to a value sufficiently negative to initiate the nucleation/ growth process after a short time delay. An example of a current-t ime transient resulting from such experiments is shown in Fig. 4a. This transient exhibits a small current spike due to charging of the electrode double layer immedi- ately after the potential step is applied. This current spike is succeeded by an increasing current due to the formation and growth of Hg nuclei. The current increase reaches a maximum, iM, as the diffusion zones of the Hg nuclei begin to overlap. The elapsed time at which the maximum is ob- served, tM, depends on the size of the potential step; tM de- creases as the applied potential is made more negative.
Several different models have been developed to describe the various three-dimensional (3-D) nucleation/growth processes that occur during bulk metal deposition on for- eign substrates; these models have been reviewed. 28 Previ- ous investigations in this laboratory 1~-22 suggested that the nucleation and growth of solid metal deposits on glassy carbon and polycrystalline tungsten in the A1C13- MeEtimC] melt can be explained with models involving 3-D nucleation with hemispherical diffusion-controlled growth of the nuclei. Thus, it was of interest to see if such models also could describe the nucleation of a liquid metal such as mercury on glassy carbon in these melts. There are two limiting cases of the general model for 3-D nucleation with hemispherical diffusion-controlled growth of the nu- clei; these limiting models are based on instantaneous nu- cleation on a fixed number of active sites and progressive nucleation on virtually an infinite number of active sites. 26 With the exception of tin deposition on glassy carbon in acidic A1C13-MeEtimC1 melt, 22 the nucleation of metals on glassy carbon from this melt is consistent with one or the other of these two limiting mechanisms.
There are several procedures for discriminating between instantaneous and progressive 3-D nucleation. The sim- plest method involves graphical analysis of the rising por- tion of the current-time transient before the diffusion zones of the nuclei have begun to overlap; instantaneous nucle- ation is indicated if the current growth is proportional to t ~/2, whereas progressive nucleation is indicated if the cur-
rent growth increases linearly with t 3/2. 27 However, it is more convenient to carry out this analysis by plotting,the normalized current, i/iM, raised to the appropriate power vs. t. Plots of (i/iM) 2 and (i/iM) 2/3 VS. t derived from experi- mental current-time transients similar to the one shown in Fig. 4 are depicted in Fig. 5. Unfortunately, the initial seg- ments of both of the plots in this figure show some degree of linearity, and a clear decision about the applicable nucle- ation mechanism is not forthcoming. Another method for differentiating between the two models is to compare the complete experimental current-time transient to the di- mensionless theoretical transients for each nucleation mechanism. The theoretical transients for instantaneous and progressive 3-D nucleation are represented by Eq. 6 and 7, respectively 27
(i/iM)2 = 1.9542(t/tM)-1{l -- exp [--l.2564(t/tM)]} 2 [6]
(i/iM) 2 = 1.2254(t#M)-1{l -- exp [-- 2.3367(t/tM)2]} 2 [7]
Plots of (i/i~) 2 VS. t/tM calculated from Eq. 6 and 7 are compared to the experimental current-time data in Fig. 6. The data actually fall between the theoretical transients for instantaneous and progressive nucleation. Such behavior is typical of progressive 3-D nucleation on a finite number of active sites. The theoretical transient is represented by Eq. 826,28
(i/iM) 2 = (tM/t){l -- exp [-xt/tM + 5(i - exp (--xt/~tM))]}2/
{1 -- exp [--x + c~ (i -- exp (--x/~))]} 2 [8]
In this expression, e and x are adjustable parameters that contain information about the number density of active sites and the nucleation rate per active site. 26 The former
1.2
1.0
0.8
0 . 6
0 . 4 -
0 . 2 -
o o ;, ; ; 1'o
/ y o iii . . . . . 12 14
1.2
1.0
~ ,~ 0,8
0.6
0.4
0.2
0 , , , , ,
0 10 12 14.
t ( , )
Fig. 5. Plots of (i/iM) 2 and {i/iM) 2/3 vs. t constructed from three current-time transients recorded at glassy carbon in the 66.7- 33.3 m/o melt similar to the one shown in Fig. 4a: (x) 0.870, (<~) 0.880, (r~) 0.890 V.

1230 ,1. Electrochem. Soc., Vol. 140, No. 5, May 1993 �9 The Electrochemical Society, Inc. 101 ntanou 0.8
0.6
~ . . 1.~ . t / t M
Fig. 6. Comparison of the dimensionless experimental current-time transients for the deposition of Hg an glassy carbon from solutions of Hg2CI2 in the 66.7-33.3 m/o melt at 60~ with the theoretical models for 3-D nucleation with diffusion-controlled growth of the nuclei: (• 0.870, (~) 0.880, (D) 0.890. The dashed line was calculated from Eq. 8 with ~ = 0.365 and x = 2.10.
parameter approaches 0 and ~ for the limiting cases of instantaneous and progressive nucleation, respectively. Equation 8 was fit to the data in Fig. 6 by adjusting the values of a and x so as to minimize the variance between the experimental and calculated values of (i/iM) 2. The best fit was obtained for a = 0.365 and x = 2.10. The theoretical line generated with these values is shown in Fig. 6. This general model provides a reasonable representation of the experimental data. These results are similar to those found during the deposition of Sn on glassy carbon in the 66.7- 33.3 m/o melt. 2~
Conventional large potential-step chronoamperometry (CA) and rotating disk electrode voltammetry experiments were conducted at the glassy carbon electrode to obtain an estimate of the diffusion coefficient of Hg~ § D~g(~). In the CA experiments, the electrode potential was stepped from 1.80 to 0.30 V to ensure that the reduction of Hg~ + was a diffu- sion-controlled process unaffected by nucleation kinetics. The resulting current-time transients exhibited Cottrell behavior, i.e., plots of i vs. I/t Iz2 were linear and passed through the origin of the plot. A plot of the GCRDE limit- ing current for the reduction of Hg~ + varied linearly with the square root of the electrode rotation rate. This plot also passed through the origin. The average values of DHg(~I and the calculated Stokes-Einstein product, D~gc~)~/T, where ~l is the absolute viscosity of the melt at T, resulting from these two experiments are (3.5 + 0.5) x i0 =~ cm 2 s i and 6.9 • I0 -ng cm s -2 K -I, respectively, at 60~
Reduction of Hg~ + by Hg metal in acidic m e l t - - T h e elec- trochemical reduction of Hg 2§ in acidic A1C13-NaC1 at 175~ is reported to involve the sequence of steps shown in Eq. 1 to 3 with the intermediate formation of the yellow-colored Hg~ + cluster. However, no evidence was found for the for- mation of this species during the foregoing voltammetric and coulometric experiments. However, if Hg metal was added to a dilute solution of Hg~ + and if this solution was heated to 100~ and stirred vigorously to disperse the liq- uid metal, then the absorption band for Hg~ + decreased and a new intense absorption band arising from another mer- cury species appeared at Xm,~ = 318 nm (Fig. 2). This new band was absent from Hg~ + solutions that were heated to 100~ without Hg metal, from solutions containing only Hg 2§ that were incubated at 100~ and from melt with added Hg metal containing no Hg~ § heated to 100~ The ~max of this absorption band is close to that reported for the Hg~ + ion (325 nm) in acidic A1C13-NaC1 melt. 1~'1~ Thus, the addition of Hg metal to acidic A1C13-MeEtimC1 solutions containing Hg~ + at elevated temperatures results in the fol- lowing reaction
Hg~ § + Hg ~- Hg~ + [9]
The presence of excess Hg metal in the solution is required to stabilize the Hg~ + produced during this reaction. When the Hg metal is separated from the solution by decanting the solution, the absorbance of the Hg~ § band decreases whereas the absorbance of the Hg~ § band increases in ac- cord with the reverse of Eq. 9. However, this decomposition process is very slow. Voltammetric investigations of solu- tions prepared as described above that were carried out at glassy carbon and tungsten electrodes were inconclusive; evidently the Hg~ + ion does not exhibit a well-defined re- duction wave at these electrodes. Additional studies are underway to gain more information about the reaction be- tween Hg and Hg~*, about the kinetics of the Hg~ + decompo- sition process, and about the electrochemistry of Hg~ + at some other electrode materials, e.g., platinum and gold. The results of these investigations are reported separately.
Electrochemical reduction of mercury(II) in basic melt .-- HgC12 dissolves readily in the 44.4-55.6 m/o A1C13- MeEtimC1 melt to produce a colorless solution. Cyclic voltammograms of such a solution are shown in Fig. 7. Un- like the mercury(II) voltammograms recorded in acidic melt, these voltammograms exhibit only a single reduction wave. Furthermore, this wave appears at potentials more than 1.5 V negative of the mercury(II) reduction wave found in acidic melt (Fig. 1). This result is consistent with the increased stabilization of mercury(II) in basic melt rela- tive to acidic melt as a result of the formation of an anionic
I 1oo
I I 1 . 6 0 . 8
I I I l I I I 0 - - 0 . 8 - - 1 . 6 - - 2 . 4
b
tr ~ --
I 1oo ~A
i ] I I I I I I I 0 . 8 0 , 4 0 - 0 . 4 - O . B - 1 . 2
E (V) vs At
Fig.~ Cyclic voltammograms of HgCI2 in the 44.4-55.6 m/o melt at 40 C: (a) glassy carbon, Cxg(ll) = 63.1 mM; (b) polycrystalline tungsten, CHecm = 9.84 mM. The sweep rates were 50 mV s -1.

J. Electrochem. Soc., Vol. 140, No. 5, May 1993 �9 The Electrochemical Society, Inc. 1231
chloride complex of the type [HgClf+p] p . In the case of mer- cury(II), chloride complexes with p = 1 and 2 are known with the latter being the most common. 29
Controlled-potential coulometry experiments were con- ducted at an applied potential of -1.20 V at a plat inum gauze electrode to ensure that mercury(II) does indeed re- sult from the dissolution of HgC12 in basic melt. The results of two such experiments are given in Table I. The voltam- metric and coulometric results indicate that mercury(II) is reduced directly to Hg metal in a single two-electron step in basic melt
[HgC12+pF- + 2e- ~ Hg + (2 + p)C1- [10]
When finely divided, white HgfCI2 powder is placed in contact with basic melt, the powder immediately reacts with the melt and becomes dark gray. As the solution is heated and stirred, the powder disappears leaving behind a small droplet of Hg metal. A cyclic voltammogram of a solution prepared in this way is identical to one recorded in a solution prepared by dissolving HgClf, i.e., no new elec- troactive species are produced. We conclude from these Observations that Hg2CI2 disproportionates rapidly during dissolution in basic melt, according to the following reaction
HgfC12(s) + pC1- r [HgC12~p] p- + Hg [11]
These results parallel those found in the high temperature alkali chloride melts, ~-~~ and they explain the two-electron voltammetric reduction wave observed for [HgCle+~] p in basic AICI~-MeEtimCI.
Both of the voltammograms in Fig. 7 exhibit obvious nu- cleation loops, indicating that the deposition of Hg metal on glassy carbon and tungsten from solutions of [HgCl~+~] '- requires a large nucleation overpotential. Therefore, the nucleation processes occurring on these electrodes were in- vestigated by conducting potential-step experiments simi- lar to those described above for the reduction of Hg~ + in acidic melt. Samples of the current-time transients that resulted from these experiments are shown in Fig. 4b and 4c. The data taken from these and several additional tran- sients were used to construct the plots of (i/i~) 2 and (i/i~) ~/~ vs. t shown in Fig. 8 and 9. These plots suggest that the deposition of Hg on glassy carbon involves instantaneous nucleation, whereas the deposition of Hg on tungsten en- tails progressive nucleation. As a further test for the most appropriate nucleation mechanism, the dimensionless ex- perimental data were compared to the theoretical models represented by Eq. 6 and 7. However, unlike the transients obtained during the electrodeposition of Hg in acidic melt, some of those acquired in basic melt exhibit an observable time delay before the onset of nucleation. To make an effec- tive comparison between the experimental current-time data and the models, a correction must be made for this delay. This delay time, to, can be estimated from the inter- cept of the linear segments of the (i/i~) m and (i/i~) ~ vs. t plots shown in Fig. 8 and 9. ~~ The values of to resulting from this procedure, which were small, are shown in Table II. These to values were used to redefine the time axis as t' = t - to and the position of the current maximum as t~ = tM -- to. The corrected experimental current-time data are com- pared to the dimensionless theoretical models in Fig. i0, and they substantiate the predictions derived from Fig. 8 and 9.
If either of the limiting 3-D nucleation mechanisms in- volving hemispherical diffusion-controlled growth of the nuclei is applicable, then it is possible to obtain informa- tion about the diffusion coefficient of the electroactive spe- cies from the product i~tM. However, the applied potential must be sufficient to reduce the surface concentration of the electroaetive solute to virtually zero. This condition has been achieved when i~t~ is independent of potential. In this case, the [HgCIf+~] ~- diffusion coefficient, DH~{~), is related to i~t~ through the following equations for instantaneous and progressive nucleation, respectively ~v
i~t~ = O.1629(nFA CH~(~))~DH~ [12]
0 .6 -
0 , 4 "
0 .2 -
0 0
I I I I 1 2 3 4
1 . 2 "
1.0-
O.8- N/,.~
1 . 2 "
1.0-
0 .8 -
0 .6 -
0.4.-
0 .2 -
0 0
f I I I I 1 2 3 4
t O Fig. 8. Plots of (i/iM) 2 and ( i / i ~ 2/3 vs. t constructed from three
current-time transients recorded at glassy carbon in the 44.4-55.6 m/o melt similar to the one shown in Fig. 4b: (• -1 .570, (0) - 1.560, (r~) - 1.550 V.
i~t~ = 0.2 5 98(nFA CHg(~))f DHg(~) [13]
In these equations, CHga~) is the concentration of [HgC12§ and all the other symbols have their usual meaning. The experimental values of i~tM shown in Table II do not vary appreciably with the applied potential, signifying that the growth process is diffusion-controlled. The resulting values of DHga~) calculated from Eq. 12 and 13 and i~tM are given in this table also. The average value of DHg(~) is (3.0 +--- 0.5) X 10 -7 cm 2 s -~ at 40~ and this yields a value of 2.0 • 10 ~0 g cm s -2 K -~ for DHg(I~)~]/T. The latter result is consistent with the DH~r measured for anionic chloride complexes with p = 2 in this same molten salt system? ~
Formal potentials of mercury couples.--The formal po- tential of the Hgf+/Hg~ § couple (Eq. 4) was determined in the 66.7-33.3 m/o melt by direct potentiometry. In these experiments the equilibrium potentials, E~q, of solutions with different C~g(~)/CH~(~I) ratios, where CHg(~) is the concen- tration of Hg~ +, were measured at a glassy carbon indicator electrode by using a high input impedance digital volt- meter. These solutions were prepared by combining stock solutions of HgC12 and HgfC12. Plots of E~q vs. log [CHg~o/ CSg(m)] constructed from this potentiometric data were l in- ear and exhibited an average slope of 0.034 __ 0.006 V. This slope is in excellent agreement with the 0.031 V slope ex- pected on the basis of Eq. 4 at 40~ The average intercept of these plots, which corresponds to the formal potential of the Hgf+/Hg~ § couple, E~g(ii)/Hg(~), is given in Table III.
A similar direct potentiometric method was used to ob- o' tain the formal potential of the Hg~§ couple, EHg(~)r~
(Eq. 5). However, in this case the Hg~ § was introduced into the solution by anodizing a mercury pool electrode at E,pp = 1.10 V. The potential-concentration data needed to con-

1232 J. Electrochem. Soc., Vol. 140, No. 5, May 1993 �9 The Electrochemical Society, Inc.
5-" 0 . 6 -
0 , 4 "
0 . 2 -
0 0 1 2 3 4
1.2 b
1.0
~'.,., 0.8 .,,~
0 .6
0 .4
0 .2
0 0
1.2- a
1.0-
0.8- 0 . 8
~ 0 . 6
0 . 4
1.2 o
1.0
0.2 " i
0 ' 0
Instantaneoua
i i I I I 0.5 1.0 1.5 2.0 2.5 3.0
~ B x xB ~ I 1"2 f b
0 .8 Q--
0 . 6
0 . 4
! ! ! 0 . 2 1 2 3
t (el 0 0 0.5 1.0 1.5 2.0 2.5 3.0
Fig. 9. Plots of (i/iM) 2 and ( i / i ~ 213 vs. t constructed from three current-time transients recorded at polycrystalline tungsten in the 44.4-55.6 m/o melt similar to the one shown in Fig. 4c: (D) -0.570, (~) -0.560, (• -0.550 V.
s t r u c t N e r n s t p lo t s were o b t a i n e d b y m e a s u r i n g t he Etq of the m e r c u r y e lec t rode fo l lowing the q u a n t i t a t i v e pas sage of charge. The c o n c e n t r a t i o n of Hg~ +, C~g(~), was ca l cu l a t ed f rom the cha rge passed. P lo t s of E~q vs. log C~g(~) were l i n e a r a n d gave a n ave rage s lope of 0.032 _+ 0.002 V as expec t ed for a t w o - e l e c t r o n couple a t 40~ The i n t e r c e p t of these
o" plots , w h i c h is a n e s t ima te of EH~(~)/H~, is g iven in Table III. The va lue in th i s t ab l e is the ave rage va lue of t h r ee i nde - p e n d e n t expe r imen t s . The t w o - e l e c t r o n s lope obse rved for the p lo t of Er vs. log CHum conf i rms the d imer i c n a t u r e of the mercury( I ) species in ac id ic A1C13-MeEtimC1 melt . If t he mercury(I ) was p r e s e n t in the m e l t as a m o n o m e r i c spe- cies, e.g., Hg +, t h e n t he t heo re t i ca l s lope of th i s p lo t w o u l d be 0.0622 V a t 40~
Table II. Current-time transient data for the reduction of [HgCI2+p] p- at glassy carbon and tungsten in the
44.4-55.6 melt at 40~
E 10 ~ iM tM t 0 108 i~t~ 107 DHg(-) (v) (A) (s) (s) (h 2 s) (cm 2 s i~
Glassy carbon -1.57 8.00 4.00 0.15 -1.56 7.23 4.95 0.14 -1.55 6.65 5.95 0.14
Tungsten -0.570 13.7 3.75 0.00 -0.560 14.4 3.35 0.00 -0.550 12.3 4.50 0.05
2.46 2.34 2.51 2.39 2.57 2.44
Avg: 2.39 -+ 0.03
7.04 3.63 6.95 3.58 6.73 3.47
Avg: 3.56 +_ 0.06
Fig. 10. Comparison of the dimensionless experimental current- time transients for the deposition of Hg in the 44.4-55.6 m/o melt at 40~ with the theorelica/medels for 3-D nucleation with diffusion- controlled growth of the nuclei: (a) glassy carbon, (• - 1.570, (<~) - 1.560, ([::]) - 1.550 V; (b) tungsten, (r~) -0.570, (~) -0.560, (• -0.550 V.
The fo rma l p o t e n t i a l of t he h y p o t h e t i c a l Hg2+/Hg couple, o'
EHg( I I ) /Hg
Hg 2+ + 2e- r Hg [14]
o' was ca l cu la t ed f rom the e x p e r i m e n t a l va lues of EHg(m/H~(~) o' a n d EHg(I)/Hg as was the e q u i l i b r i u m c o n s t a n t for the d i spro-
p o r t i o n a t i o n of Hg~ + in the 66.7-33.3 m/o me l t
Hg~ + ~ Hg 2+ + Hg [15]
The ave rage of va lue of E~g(m/Hg is g iven in Table III, whe rea s the e q u i l i b r i u m c o n s t a n t of the r eac t i on in Eq. 15 was a b o u t 1.3 X 10 2. This e q u i l i b r i u m c o n s t a n t is com- p a r a b l e to t h a t r epo r t ed in aqueous so lu t ion a t 25~ (1.1 x
Table III. Formal potentials of mercury couples in the AICI3-MeEtimCI melt at 40~
Reaction
Melt composition E ~ (m/o A1C13) (V)
2Hg 2+ + 2e- ~- Hg~ + 66.7 Hg~ + + 2e- ~ 2Hg 66.7 Hg 2+ + 2e- ~- Hg 66.7 [HgC12+p] ~- + 2e- ~ Hg + (2 + p)CI- 44.@
1.21 _+ 0.01 1.093 _+ 0.002 1.15 _+ 0.01 ~
-0.370 +_ 0.007
Calculated. b Cc~ = 1.00M.

J. Electrochem. Soc., Vol. 140, No. 5, May 1993 �9 The Electrochemical Society, Inc. 1233
Table IV. Equilibrium potential data for the [HgCl~§ p /Hg couple in the 44.4-55.6 m/o melt at 40~
C~g(:~ E o,
63.1 -0.410 -0.373 9.84 -0.425 -0.363 7.89 -0.440 -0.375
Avg: -0.370 _+ 0.007
10-2), 32 but roughly two orders of magnitude larger than that measured in the 52-48 m/o A1C13-NaC1 melt at 175~ 1~ This result suggests that Hg~ + is actually less stable in acidic A1C13-MeEtimC1 at 40~ than in the acidic A1C13- NaC1 melt at 175~
The formal potential of the [HgC12.v] p /Hg couple (Eq. 10) in the 44.4-55.6 m/o melt, E~gcH),~ was estimated by using a voltammetric technique similar to that employed in previ- ous studies. 2~ In this voltammetric method, the zero cur- rent intercept of the reverse scan of GCRDE voltam- mograms recorded during the stripping of the bulk mercury deposit from the electrode was taken as the equilibrium potent ia l , Eeq , Of the [HgCl~.p]V-/Hg couple. The Eeq values and [HgC12+p] p- concentrations were used to estimate E~g(i~). The data resulting from three experiments are shown in
o' Table IV along with the estimate of EHg(m.
Acknowledgment This research was supported by the National Science
Foundation through Grant No. CHE-9016632.
Manuscript submitted Nov. 5, 1992; revised manuscript received Jan. 19, 1993.
The University of Mississippi assisted in meeting the pub- lication costs of this article.
REFERENCES 1. C. L. Hussey, in Advances in Molten Salt Chemistry,
Vol. 5, G. Mamantov and C. B. Mamantov, Editors, pp. 185-230, Elsevier, Amsterdam (1983).
2. R. A. Osteryoung, in Molten Salt Chemistry: An Intro- duction and Selected Applications, NATO ASI Series C: Mathematical and Physical Sciences, Vol. 202, G. Mamantov and R. Marassi, Editors, p. 329, Reidel, Dordrecht (1987).
3. C. L. Hussey, Pure Appl. Chem., 60, 1763 (1988). 4. A. J. Dent, K. R. Seddon, and T. Welton, J. Chem. Soc.,
Chem. Commun., 315 (1990).
5. L. Heerman and W. D'Olieslager, This Journal, 138, 1372 (1991).
6. J. D. Corbett, Prog. Inorg. Chem., 21, 129 (1976). 7. H. A. Laitinen, C. H. Liu, and W. S. Ferguson, Anal.
Chem., 30, 1266 (1958). 8. G. Delarue, J. Electroanal. Chem. Interracial Elec-
trochem., 1, 285 (1959/1960). 9. K.W. Hanck and M. L. Deanhardt, Anal. Chem., 45, 176
(1973). 10. M. L. Deanhardt and K. W. Hanck, This Journal, 123,
1824 (1976). 11. R. G. Verdieck and L. E Yntema, J. Phys. Chem., 46,344
(1942). 12. R. Martin de Fremont, R. Rosset, and M. Leroy, Bull.
Soc. Chim. Fr., 706 (1964). 13. D. A. Hames and J. A. Plambeck, Can. J. Chem., 46,
1727 (1968). 14. G. Torsi and G. Mamantov, Inorg. Nucl. Chem. Lett., 6,
843 (1970). 15. G. Torsi, K. W. Fung, G. M. Begun, and G. Mamantov,
Inorg. Chem., 10, 2285 (1971). 16. R. D. Ellison, H. A. Levy, and K. W. Fung, ibid., 11, 833
(1972). 17. R. A. Foust, Jr., General Motors Research Laboratories
Bulletin, October 3, 1968. 18. I. D. Eubanks and E J. Abbott, Anal. Chem., 41, 1708
(1969). 19. C. L. Hussey and X. Xu, This Journal, 138, 1886 (1991). 20. X-H. Xu and C. L. Hussey, ibid., 139, 1295 (1992). 21. X-H. Xu and C. L. Hussey, ibid., 139, 3103 (1992). 22. X-H. Xu and C. L. Hussey, ibid., 140, 618 (1993). 23. J. Phillips, R. J. Gale, R. G. Wier, and R. A. Osteryoung,
Anal. Chem., 48, 1266 (1976). 24. J. S. Wilkes, J. A. Levisky, R. A. Wilson, and C. L.
Hussey, Inorg. Chem., 21, 1263 (1982). 25. T. Vargas and R. Varma, in Techniques for Characteri-
zation of Electrodes and Electrochemical Processes, R. Varma and J. R. Selman, Editors, pp. 717-760, Wi- ley-Interscience, New York (1991).
26. B. R. Scharifker and J. Mostany, J. Electroanal. Chem. Interracial Electrochem., 177, 13 (1984).
27. B. Scharifker and G. Hills, Electrochim. Acta, 28, 879 (1983).
28. V. Tsakova and A. Milchev, J. Electroanal. Chem. Inter- facial Electrochem., 235, 237 (1987).
29. E A. Cotton and G. Wilkinson, Advanced Inorganic Chemistry, 5th ed., pp. 612-613, Wiley, New York (1988).
30. E M. Rigano, C. Mayer, and T. Chierchie, J. Electroanal. Chem. Interracial EIectrochem., 248, 219 (1988).
31. C. L. Hussey, I-W. Sun, S. K. D. Strubinger, and P. A. Barnard, This Journal, 137, 2515 (1990).
32. J. Bale in Standard Potentials in Aqueous Solution, A. J. Bard, R. Parsons, and J. Jordan, Editors, p. 281, Dekker, New York (1985).