the elomatic magazine 2 · 2016
TRANSCRIPT

The Elomatic Magazine 2 · 2016
Consulting • Engineering • Design • R & D • Innovation • Technical Solutions
Heidi NiskanenRisky BusinessSimulate accidents – reduce riskspage 4
Teemu Turunen and Jussi JääskeläinenDeveloping business intelligencepage 8
Virgin Island – A vision for Vallisaari in Helsinkipage 16
Modelling can be used to study a myriad of scenarios in process events
and their consequences. – Heidi Niskanen

The Elomatic Magazine · 2 | 3
Since I wrote my first Top Engineer editorial roughly six months ago, some very significant and surprising
global events have taken place. Who among us could have foreseen Brexit, or that Donald Trump would be the next president of the United States? What seemed particularly far-fetched not long ago has become reality.
Our belief in our ability to rationally predict the future has been dented by these events. World markets have been shaken; the Mexican Peso dropped 20% in one day after Donald Trump’s victory. Post-Brexit the British Pound has also declined to levels last seen in 1985. There seems to be a growing trend for the unexpected to happen.
Currency volatility is not good for business, unless you are a forex trader who knows something the rest of us don’t. It adds further uncertainty to the global business environment, which in many respects is still trying to shake off the effects of the global financial crisis.
Fortunately, it is not all gloom and doom. In some key sectors the outlook has, in fact, improved. Several indus-tries are showing increased levels of investment activity. One of Elomatic’s key segments, the Marine Industry, is going through a boom the likes of which most of us have not seen in our lifetimes. We have, for example, signed the largest design contract in our history with MW Werften in Germany for the design of a Global Class mega cruise ship. Our local shipyard in Turku has a full order book that stretches to 2024! It seems absurd that only three years ago some local commentators were talking about the demise of the Marine Industry in Finland.
Change seems to be happening faster than it used to, both in politics and in business. How are we to survive and prosper in this highly volatile and dynamic environment? For starters we need to be agile and adaptive. We also need the ability to evaluate and adjust to risks smartly. Innovation is, and will continue to be, a key driver of suc-cess. Digitalisation offers many possibilities for us to
reinvent our own business models and how we serve our customers, as well as how we make use of data efficiently to optimise their operations.
Several articles in this issue of the Top Engineer touch on these themes. As for politics, that is not our field of expertise.
Change is in the air
Patrik RautaheimoEditor-in-ChiefCEO

Contents
2/2016
Publisher ElomaticItäinen Rantakatu 7220810 Turku, FinlandTel. +358 2 412 [email protected]
Editor-in-ChiefPatrik [email protected]
EditorMartin [email protected]
Art DirectorOlli [email protected]
Teemu Turunen and Jussi Jääskeläinen
Developing business intelligenceFrom measurement data to smart actions
8
Heidi Niskanen
Risky BusinessSimulate accidents – reduce risks
4
Virgin Island– A vision for Vallisaari in Helsinki
16
If you would like to receive a copy of the Top Engineer, or would like to be added to our Top Engineer mailing list please send your request to [email protected].
Elomatic believes that all information provided in this publication is correct at the time of printing. Elomatic is not responsible for any inadvertent errors.
Elomatic holds the copyright to all materials con-tained in this publication, unless specified otherwise. Written permission from Elomatic is required for the reproduction of articles in whole or in part.
Cover: Heidi Niskanen, Technical Analysis Design Manager at Elomatic Turku Office. Cover photo © Olli Tuomola / Elomatic.
Finnish maritime cluster flexes its muscles 12
Optimizing ship design and operationEU-funded HOLISHIP project takes an integrated life cycle approach 14
Kalle VirtaThe A to Z of getting medical devices to market 20
Amit R. IngleHarmonic Distortion in Pharmaceutical Industry Power Systems 24
Samu Sundberg and Teemu Launis3D scanning supports 3D printing 28

The Elomatic Magazine · 4 | 5

Industrial plants and production sites commonly handle hazardous materials and waste that hold potential risks to humans and the environment. The owners of such sites have both a moral and legal obligation to minimise these risks. How can they best prepare for potentially dangerous situations? How can they minimise risks so that accidents can be avoided completely, or their harmful effects reduced to a minimum? There are no simple answers, but help is available. Computer-assisted simulation, for example, can nowadays accurately and cost-efficiently simulate an infinite amount of scenarios, from the most common to the highly unlikely. With precise information at their disposal, decision-makers can take appropriate actions to safeguard their businesses, employees and the environment.
Even though we have tools availa-ble to prepare for risks, it is under-
standable that operators, for example, want to get a new production plant up and running as fast as possible. These are economic realities. Some-times, it is tempting to overlook risks and search for shortcuts. Why would one want to take a risk like that, how-ever, when simulation can easily and cost-efficiently produce all the infor-
mation needed to evaluate the risks operations are exposed to? It makes much more sense to make a reason-able investment in safeguarding busi-ness operations from predictable risks and their consequences.
Only recently in Kemi, Finland, on 29 June 2016, a dangerous explosion occurred at paper and pulp manufac-turer Stora Enso’s mill during a process malfunction. The factory had to be shut down as the machinery, the building, and its piping were damaged. Fortu-nately, in this case, there was no loss of life.
Malfunctions such as these can-not always be prevented, but we can prepare for and plan how we will re-act should they occur. It is alarming that even when the potential risks are known, the desire to prepare for them is not always there. Why is the safe-guarding of human life and the envi-ronment not sufficient motivation for such risks to be taken seriously?
Loss of human life estimated to cost 1 million euros
In a factory environment, there are generally three elements that require protection: staff, machinery or the facil-ity itself, and the environment. Loss of human life seems to be the most con-crete of the three – a factory employee is somebody’s child, parent, or partner. Putting a value on the loss of a human life is an unenviable task, but if pushed to do that, one could roughly estimate the cost to be one million euros.
Even though the loss of human life is felt more acutely on a personal lev-el, it is production downtime that is feared the most. It is undoubtedly an essential risk from a business perspec-tive. If a critical device breaks, it can take weeks or even months to replace and start up. This scenario is not very attractive.
Occupational safety legislation obliges employers to ensure the safe-ty of employees. In the event of an ac-cident the employer should have evi-dence that this situation was evaluated from the employees’ perspective, oth-erwise the law may come down hard on the employer.
Accidents will happen
Naturally, nobody wants employees or nature to be harmed by business operations. In an ideal world nothing would go wrong, nor would accidents happen. Reality, however, is different. Potential dangerous situations caused by human error or unexpected events can trigger explosions and spills. Some chemicals are not hazardous by them-selves, but when spread in the air can become flammable.
It is also not unheard of that a safe-ty valve or tank starts leaking liquids or gases into the environment. In the worst-case scenario the substances are poisonous and can threaten human lives. In such cases, what is the smallest investment possible that would reduce the harmful effects as much as possible or avoid them completely?
Risky BusinessSimulate accidents – reduce risks
Text: Heidi Niskanen
Photo © Vladimir Vitek, dep
ositp
hotos.c
om/vladv
itek

The Elomatic Magazine · 6 | 7
Simulation can accurately predict risks
The vast increases in computing ca-pacity in recent times have enabled modelling techniques to be used in the study of divergent and complex phenomena. Modelling can be used to study a myriad of scenarios in process events and their consequences. The information can be used to minimise harmful effects and to evaluate what actions are required if a dangerous situ-ation should arise.
The Computational Fluid Dynamics (CFD) modelling technique can, for ex-ample, be used to simulate the spread of hazardous chemicals in a facility or building, or into the environment. In such cases, it is essential to contain the spill as quickly as possible. If the loca-tion of an emission source is known, modelling can reveal how ventilation can prevent dangerous situations from occurring or how the emission can be contained within the building. In the case of a leak into the environment, it is necessary to be familiar with evac-
uation requirements in order to pro-tect humans from exposure to harm-ful chemicals.
Smoke and soot significantly affect visibility when explosions or fires occur, which necessitates the evaluation of worst-case scenarios in advance. CFD can accurately model the spread of smoke inside and outside a building in such cases. Based on this information, a working evacuation plan can be drawn up. Different kinds of explosions and subsequent shock waves, heat, and ra-diation levels can also be modelled. Knowing what chemical is used in a process, for instance, is enough to eval-uate the effect of an explosion on sur-rounding buildings. This information can be used to dimension structures to be sufficiently durable or to reduce pressure waves as much as possible.
The severity of the harmful effects of a leak or spill on the environment is de-pendent on the landscape, wind and, in some cases, humidity. These factors can all be taken into account in a CFD model. Once the geometry of a pro-duction facility and its surroundings is
known, different situations incor-porating, for example, changing wind speeds and directions can be mod-elled. This information can be used to locate buildings optimally to prevent pollution or reduce its harmful effects. If there are several potentially hazard-ous sources, they can be studied indi-vidually or in combination for a worst-case scenario situation.
How can health factors, costs and operational reliability
be taken into account?
Almost all chemicals and particles have known threshold limits that allow the evaluation of health and other effects on persons exposed to such materi-als. It is crucial to have accurate infor-mation about the concentrations of particles and chemicals so that clear-ance distances and other preventative measures can be taken. Modelling can be used to check whether threshold values are exceeded in certain circum-stances or whether the concentrations
Modelling can be used to study a myriad of scenarios in process events and their consequences.

will remain below the thresh-old values. This information can,
where needed, be provided to the rel-evant authorities to obtain operational permits etc.
The time of exposure is sometimes also significant in the amount of dam-age caused. It is, therefore, important to be able to evaluate the duration of different events. Some alarm systems
measure both concentration levels and the time of exposure. The alarms are triggered when threshold limits are exceeded, leading to production downtime. When designing a produc-tion facility it is, therefore crucial that potentially dangerous situations are studied.
Based on the results of these stud-ies production lines and storage tanks can be located to prevent domino ef-fects. The information should be used to design alarm systems so that they function safely, but also to avoid un-necessary alarms that cause produc-tion downtime. An unnecessary alarm can, for instance, be triggered due to sensors that are badly located.
With modelling we can predict risks and plan accordingly to save human lives, increase well-being at work and boost productivity should an accident occur. We cannot mitigate all risk, but thorough preparation with the help of an expert can go a long way to en-suring long-term cost savings and the safety of human lives, property and the environment.
About the author
Heidi Niskanen
Ph.D. (Technical Physics)
Heidi Niskanen graduated from the University of Oulu in 2006 with a ma-jor in space physics. She completed her doctoral dissertation on paper-making fibre suspension flows in 2011 at the University of Eastern Finland. Heidi has extensive experience in vari-ous modelling methods and diverse knowledge in physics. She works as a design manager at the Elomatic Turku office and is responsible for marketing and developing CFD services. Heidi is passionate about resource efficiency, renewable technologies and the miti-gation of climate change.
Computational fluid dynamics (CFD)CFD is a branch of fluid mechanics that uses numerical analysis and algorithms to solve and analyse problems that involve fluid flows. Computers are used to perform the calculations required to simu-late the interaction of liquids and gases with surfaces defined by boundary conditions. With high-speed supercomputers, better solutions can be achieved.
Source: Wikipedia
◄ Figure 1. An example of CFD utilisa-tion in risk analysis. The contour repre-sents a pressure wave generated by a dissolvent exploding at a Tikkurila Oy factory. Tikkurila performed the risk analysis in order to ensure that they were prepared sufficiently for possi-ble accidents. The analysis was done in collaboration with Elomatic’s CFD and energy consulting teams.
© Elomatic

The Elomatic Magazine · 8 | 9
In recent times companies have shown a growing interest in generating and using measurement data to streamline and develop their operations. Business intelligence has, in fact, become a key success factor in this regard. In order to maintain competitiveness and gain competitive advantages, data use has to be integrated into all organisational levels. Organisations that are able to collect, analyse and process key performance-related data into information that supports smart decision making, can gain competitive advantages.
Rapid developments in measure-ment and data transfer technolo-
gies have enabled the processing of large masses of data. With the help of the right tools, data analyses can be conducted quickly and cost efficient-ly. This paves the way for continuous monitoring of operations, rapid prob-lem solving, and the prediction of ac-tions required.
In some cases, large amounts of measurement data is already available but is only partially exploited due to a lack of resources. In such cases, well planned and implemented data analy-ses can produce excellent results. The measurement data can also be defi-cient or fragmented in several different systems, in which case its wholesale utilisation is demanding.
Different production problems of-ten provide the trigger to start benefit-ting from data analysis. These include, for example, fluctuations in produc-tion costs, or efficiency per production type/shift, or for some other unknown reason.
Digital transformation is driving change
Digital transformation in our societies is taking place and is accelerating con-tinuously (see Figure 1). Large changes are also looming in business structures and familiar operational models. It is time to take advantage of the possibili-ties offered by digitalisation. If we don’t, our competitiveness will weaken as our
Developing business intelligenceFrom measurement data to smart actions
Text: Teemu Turunen and Jussi Jääskeläinen
Photo © Dmitriy Shirono
sov, dep
ositp
hotos.c
om/pressmaster

competitors bring efficiencies to their operations.
In essence, competitiveness and a competitive edge can be achieved by targeting three areas: customer experi-ence, business models and operational processes. These three areas guide and integrate the digital capability to do things better, which includes measure-ment and data analysis.
By combining management skills with business intelligence, we can im-prove decision making in continuous process and business development. At the same time, we allow customers and users to see and experience the ef-fects of decision making better.
The understanding of the above-mentioned factors starts with data col-lection, but analysis and transforming
information into solutions are at the core of maintaining competitiveness. Diagram 1 presents this process in its simplest form.
Developing data collection and processing data into information
The data analysis process in compa-nies can be divided into the following three phases: 1. Measurement and monitoring de-
velopment (planning) 2. Data collection development and
system infrastructure 3. Data processing and analysis
In the measurement and monitoring development phase, it is important to
gain an understanding of what data is already available, how reliable is it, and what kind of measurement data would be useful for analysis. This development phase is very practical and includes, for example, going through and updating measurement instrumentation lists.
In addition, new measurement de-vices are dimensioned and decisions are taken regarding the device loca-tions, as well as the formats in which the measurement data is transferred to systems or databases. All procurements are evaluated in relation to needs and goals in order to minimise the invest-ment cost.
In the data collection development and system infrastructure phase, the systems and databases that host data are selected. Such systems may already
▲ Figure 1. Digital transformation
► Diagram 1. Analysis and transforming information into solutions
Source: https://www.cap
gemini-c
onsulting
.com
/digita
l-transform
ation
Customer Experience Operational Process
Digital Capabilities
Business Model
Customer understandingAnalytics-based segmentationSocially-informed knowledge
Process digitisationPerformance improvement
New features
Digitally-modified businessesProduct/service augmentationTransitioning physical to digital
Digital wrappers
Top line growthDigitally-enhanced selling
Predictive marketingStreamlined customer processes
Worker enablementWorking anywhere anytime
Broader and faster communicationCommunity knowledge sharing
New Digital BusinessesDigital products
Reshaping organisational boundaries
Customer touch pointsCustomer service
Cross-channel coherenceSelf service
Unified Data & ProcessesAnalytics Capability
Performance ManagementOperational transparency
Data-driven decision-making
Digital GlobalisationEnterprise integration
Redistribution decision authorityShared digital services
Business & IT IntegrationSolution Delivery
Goals
Real-time measurement & architecture
(IOE)
Analysis Conclusions
Corrective actions (tactics/
prediction)

The Elomatic Magazine · 10 | 11
be in place, or they can be set up if re-quired. A key factor here is that the data is collected and stored in places where it is easily accessible for analysis. This can be done, for example, with a centralised database that collects infor-mation for analyses from several differ-ent systems (see Figure 2). These differ-ent systems include, inter alia, building automation process automation sys-tems, as well as utility control systems (e.g. compressed air systems, cooling systems etc.).
The data processing and analysis phase is the most important of the en-tire process. It is here where essential information from the large data mass is summarised and processed into us-able formats. In practice, data has to be handled in many different ways, such as sorting, filtering, calculating refinements and taking time delays into account. In this phase, it is crucial to analyse the in-terdependence of measurement varia-bles at different operating points.
Root cause analysis can also be used to produce useful information for pro-cess development and prediction needs. These kinds of analyses are of-ten very difficult to fully automate. It is important to generate concrete meas-ures that can be implemented. This means that the analyst also requires know-how about the process and its operation.
Benefitting from results and implementation
A company’s management group is responsible for making use of data analysis results and implementing the recommended measures. It is, there-fore, important that recommendations based on analysis results contain suffi-
ciently detailed supporting reasoning so that management can justify trying new operational models or make in-vestments.
Once measures have been imple-mented, it is important that results can be authenticated with data. Thus, dif-ferent measurement periods that are
viable for comparison need to be iden-tified. In these measurement periods, for example, the time of year, produc-tion quantity and production type can be similar.
Root-cause analysis may lead to ob-servations that can help prediction of the cost-efficiency and maintenance
► Figure 2. Data collection development and system infrastructure. Current vs ideal situation.
Current situationEnergy company
Management
Plant systems Building maintenance Process/Production
DB
Ideal situationCloud
applications
Plant systems Building maintenance Process/Production
DB

needs of production processes. These predictions can be used to ease the definition of different instruction and alarm limits for process control systems.
Significant savings can be achieved
Data analysis can identify significant savings measures. Recently, at a chem-ical plant in Finland, for example, data analysis was used to identify meas-ures to improve energy efficiency. The plant’s energy consumption data was analysed alongside measurement data from production and peripheral pro-cesses. The analysis identified optimi-sation targets in process cooling and heating systems, as well as the poten-tial to benefit from heat recovery. The recommended measures are current-ly being implemented and the plant
is on the verge of reducing its ener-gy consumption by about 10%, result-ing in annual savings of approximately 120,000 euros.
It needs to be noted that the imple-mentation of data analysis does not necessarily require the procurement of new analysis applications. Existing applications can, in some cases, be uti-lised. If suitable applications are not available, the use of a remote connec-tion is an alternative. There are several operating models in this approach, for example, analyses and reports that are conducted periodically, or checks and analyses that are conducted when a given indicator is exceeded.
This kind of approach lends itself to cost-efficient implementation and enables quick access to experts when required. The whole data analysis sys-tem can also be integrated with man-agement systems such as ISO 14001 or ISO 50001, thereby infusing it into the company’s daily operations.
Conclusion
With the help of data analysis, process measurement information can be effec-tively used to streamline and improve business operations. Data processing identifies problem areas in production processes and can be used to develop production efficiency. The results can be used to boost production process models and enhance the predictability of the process from maintenance and cost efficiency perspectives.
Now is the time to take advantage of the possibilities offered by the digi-tal age. Failure to do so could hand hard-earned competitive advantages to competitors that have sensed these opportunities better.
With the help of data analysis, process measurement information can be effectively used to streamline and improve business operations.
About the authors
Teemu Turunen
Phil. Lic. (Env. Science)
Teemu Turunen has worked within industrial measurement and control since 2005. He has extensive expe-rience of different field studies and audits for a wide range of industrial areas based on data analysis. He cur-rently works as a project manager at Elomatic’s Jyväskylä office and is re-sponsible for developing Elomatic’s data analysis services.
Jussi Jääskeläinen
M.Sc. (Physics)
Jussi Jääskeläinen has worked in pro-cess industry development and ener-gy efficiency service positions since 2004. He has experience in process development, production line ener-gy efficiency and industrial energy audits. He is also thoroughly famil-iar with energy efficiency monitoring systems and process diagnostics. He currently works as a project manager at Elomatic’s Jyväskylä office and is responsible for developing Elomatic’s data analysis services.
Business intelligenceBusiness intelligence (BI) can be described as a set of techniques and tools for the acquisition and transformation of raw data into meaningful and useful information for business analysis purposes. […] BI technologies are capable of han-dling large amounts of structured and sometimes unstructured data to help identify, develop and oth-erwise create new strategic busi-ness opportunities. The goal of BI is to allow for the easy interpreta-tion of these large volumes of data. Identifying new opportunities and implementing an effective strategy based on insights can provide busi-nesses with a competitive market advantage and long-term stability. Source: Wikipedia

The Elomatic Magazine · 12 | 13
Finnish maritime cluster flexes its muscles The future of the Finnish maritime cluster looks bright. The majority of companies in the cluster believe that there are vast development opportunities for big and small players alike. They consider the ability to partake in global activities and networks and to rapidly take advantage of new business opportunities as key success factors. Equally important is the need to be innovative and to have the desire and ability to take risks. These are some of the findings contained in a recently published report – The Finnish maritime cluster: towards the 2020s.
The report stems from a study con-ducted by the University of Turku,
which was coordinated and funded by the Finnish Maritime Society under the auspices of the Ministry of Economic Affairs and Employment. This follows
a similar study that was carried out in 2008.
The winds of change
Much has changed since 2008, a year that for many marks the starting point of a decline that characterised the maritime industry in Finland for sev-eral years. In is no coincidence that it also marked the start of the global fi-nancial crisis. The resultant recession af-fected ship orders, leading to closures and redundancies globally. In Finland, especially the Rauma shipyard was af-fected when its South Korean owner, STX, closed the shipyard down com-pletely in 2013.
At the time, it was not uncommon to hear industrial and political com-mentators refer to the maritime indus-try as unprofitable and unsustainable, or that the sun was setting on it. As it turns out, these doomsday predictions were somewhat off the mark. The sec-tor has, in fact, bounced back strong-
ly and is undergoing a renaissance in many respects. It is showing itself to be robust and viable with an outlook that has improved markedly.
In addition to the global financial meltdown, the post 2008 period has also seen dramatic changes in the mar-itime industry’s operational environ-ment. The same goes for shipowners and harbours that are faced with dis-ruptive maritime transport, logistics and legislative changes that provide opportunities and threats alike.
During the period of slowdown in Finland, its marine cluster companies were forced to look abroad or to other industrial sectors for new customers. Many were successful in internation-alising and diversifying their custom-er base.
A big growth driver in Finland was the German Meyer family’s acquisition of the Turku Shipyard from STX in 2014. Currently, Meyer Turku shipyard has a full order book that extends to 2024. A spin-off effect of the Meyer’s acquisi-tion has been an increase in calls for of-
Photo © Meyer Turku

The Finnish maritime cluster – facts and figuresTotal turnover 2014: EUR 12.7 billion Added value created by cluster: EUR 3.8 billionNumber of companies: Approx. 3,000Employees: 48,400
Versatile, partly specialised regional cluster
Extensively diversified regional cluster
Ship owner cluster
Maritime industry subcontractor cluster
Port operations oriented regional cluster
▼ Figure 2. Significant regional clusters in Finland
▲ Figure 1. The Finnish maritime cluster
ShipownersOther Business
Related to Shipping
Ports
Port Operators, Other Port
Companies
Classification Societies, Financing
and Insurance
MARITIME CLUSTER
Public Sector
Marine Construction
Renewable Maritime Energy
Production
Marine Industry
fers from Germany. An example of the increased cooperation between Ger-many and Finland was the announce-ment on 28 July 2016 that Elomatic Ltd and Deltamarin Ltd (both from Turku, Finland) had signed an agreement with MW Werften for a Global Class mega cruise ship.
The Rauma shipyard has also re-in-vented itself with a new business mod-el under the Rauma Marine Construc-tions banner. Offshore companies are, however, still suffering from the low oil price and a lack of investment.
Innovation a key future success factor
The report indicates that companies in the Finnish maritime cluster consider innovation to be one of the key driv-ers that will give them a competitive edge. Due to its sensitive and strategic nature, most companies do not out-source innovation, but rather do it in-house or keep it very “close” in their net-
works. It is noteworthy that for many respondents their extensive interna-tional networks and partnerships are significant when it comes to innova-tion development.
Foreign ownership in Finnish maritime cluster growing
The report also reveals that foreign ownership in the Finnish maritime cluster has grown since 2008. About 20% of the cluster is at least in part for-eign-owned. The share these compa-nies contribute to the total revenue of the cluster, however, was almost 70% in 2014. The growth in foreign ownership is an indication of the attractiveness of the sector, but also points to the lack of domestic capital in Finland.
Positive outlook
The combined turnover of the Finn-ish maritime cluster has grown year on
year since 2010 and the outlook is for this to continue. This is, in particular, due to the excellent situation in cruise ship construction, which is very posi-tive beyond 2020.
The report points to several poten-tial areas of future specialisation for the Finnish maritime cluster. These include, among others, arctic know-how, bat-tery technologies and hybrid energy solutions. New business opportunities may also exist in innovative production chain approaches and maritime bio-economy related products. Digitalisa-tion is a further area that should be ex-ploited. The digitisation of shipbuilding, vessel operation and cargo handling, for example, is advancing rapidly.
Maritime cluster companies that are agile and quick to adapt to the chang-ing environment will stand the best chance of seizing these future oppor-tunities.
Source: ”Suomen meriklusteri kohti 2020- lukua”, Finnish Ministry of Economic Affairs and Employment

The Elomatic Magazine · 14 | 15
The face of ship design is changing. The vastly increasing complexity of European-built ships and maritime structures as well as the growing number of rules and regulations call for novel concepts of product design and testing. A consortium of 40 leading European maritime industry and research partners has been awarded an 11.4 million euro grant from the EU to develop the next generation ship design system for the European maritime industry.
HOLISHIP (HOLIstic optimisation of SHIP design and operation for life
cycle) sets out to address urgent prob-
lems in today’s ship design and opera-tion, focusing on future requirements by developing a holistic approach to ship design capable of meeting tomor-row’s challenges.
The HOLISHIP project started in Sep-tember 2016 and will be completed over four years. The project is funded by the European Commission in the HORIZON 2020 Transport Programme.
Most maritime products are typi-cally associated with large investments and are seldom built in big series. Un-like other modes of transport that benefit from the scale effects of se-ries, maritime products are typically designed to refined customer require-ments increasingly determined by the need for high efficiency, flexibility and
low environmental impact at a com-petitive price.
Product design is thus subject to global trade-offs among traditional constraints (customer needs, technical requirements, cost) and new require-ments (life-cycle, environmental im-pact, rules).
One of the most important design objectives is to minimise total cost over the economic life cycle of the prod-uct, taking into account maintenance, refitting, renewal, manning, recycling, and the environmental footprint, etc. The trade-off among all these require-ments must be assessed and evaluat-ed in the first steps of the design pro-cess on the basis of customer / owner specifications.
Optimizing ship design and operationEU-funded HOLISHIP project
takes an integrated life cycle approach

Innovative design technologies
Advanced product design needs to adapt to profound, sometimes contra-dictory requirements and assure flex-ible and optimised performance over the entire life cycle for varying opera-tional conditions. This calls for greatly improved design tools including mul-ti-objective optimisation and finally vir-tual testing of the overall design and its components.
HOLISHIP addresses these urgent in-dustry needs by developing innova-tive design methodologies, combining design requirements (technical con-straints, performance indicators, life cy-cle cost, environmental impact) at an early design stage and for the entire life cycle in an integrated design envi-ronment.
Design integration will be imple-mented in practice by the develop-ment of integrated design s/w plat-forms and demonstrated by digital mock-ups and a large range of indus-try led application studies on the de-sign and performance of ships’ mari-time structures.
Focus on early design phase
The early design stage of any maritime product offers the widest range of solu-tions to be explored. It is at this design stage that the multi-disciplinary design approach has the highest flexibility and impact. ‘Higher design freedom’ and life cycle cost control at this preliminary design step allow the optimisation of product design, taking into account all requirements.
Intelligent General Arrangement tool
Elomatic will be closely involved on the project by developing a new tool for creating a ship’s early phase general ar-rangement, a so-called Intelligent GA. It will include the ability to easily make modifications and to sketch in the 3D model and handle data.
The Intelligent GA is a new way to present the ship’s arrangement as well as data storage for related information. It is parametric for easy modification and optimisation. It also allows also the use of virtual reality for e.g. ergonomic studies. The model can also be used for visualisation in order to enhance the communication of the early phase con-cept with the end customer, for dem-onstrating functions and characteristics more effectively.
Being faced with the need to re-duce operational costs and environ-mental impact, while at the same time increasing safety, the maritime indus-try urgently needs to take up new life cycle based design concepts including means for virtual testing of products.
It adds to the complexity of the problem that ship design is typical-ly shared between design offices and yards in close cooperation with system and equipment suppliers, all request-ed to work on a design for optimal op-erational performance which increas-ingly becomes a prime selling point for a vessel.
HOLISHIP brings together all Euro-pean stakeholders to improve the de-sign of maritime products by combin-ing the design objectives of the various disciplines involved.
Elomatic HOLISHIP Project Manager: Antti Yrjänä[email protected]
The HOLISHIP project holds distinct advantages for society and differ-ent industry groups:
1. Society Innovative energy grids for ferries, passenger ships, workboats, offshore and cargo vessels will be developed. These solutions will be efficient and environmentally friendly over the vessels’ entire life cycles.
2. Design (Yards, design / engi-neering companies, suppliers): Reduce the duration of the de-sign process, improve the de-signs and satisfy customer needs by exploration of an en-larged design space, while con-trolling the associated costs and risks.
3. Production (Yards, suppliers): Optimise the production pro-cess in terms of cost and dura-tion.
4. Operation (Owners): Optimise vessel operations and associat-ed cost for varying conditions.
5. Maintenance (Owners, ship-yards, suppliers): Reduce the number, duration and cost of interventions and optimise the health monitoring of the vessels.
HOLISHIP addresses urgent maritime industry needs by developing innovative design methodologies, combining design requirements at an early design stage and for the
entire life cycle in an integrated design environment.

Virgin Island – A vision for Vallisaari in Helsinki
See overleaf for map key
The Elomatic Magazine · 16 | 17

In March 2016 the City of Helsinki and Metsähallitus, the Finnish State Forest Enterprise, launched the Clean Vallisaari Innovation Competition. The goal was to identify creative and viable solutions for the development of the historic Vallisaari Island. Just a short boat ride from the centre of Helsinki, the formerly closed military island was opened to the public in May 2016. The Virgin Island entry, a team effort by Gaia Consulting and Elomatic, won joint first prize. The Virgin Island vision is based on the desire to preserve the island’s natural and cultural heritage, while at the same time creating a world class destination for ecotourism, nature visits, recreation and cleantech innovation.
The Virgin Island concept is built on the idea of development that pre-
vents negative impacts and enhances the restoration of Vallisaari, as well as on solutions that minimise energy and resource use. Visitors to the island are encouraged to experience the unique nature in harmony with the restored cultural heritage in a respectful, yet in-vigorating way. The goal is to strike a balance between visitor impacts, pres-ervation and restoration needs.
Encouraging innovation
According to Anita Vuorenmaa, the Elo-matic Vallisaari project coordinator, the development team firmly believes that the most optimal long-term solutions may not yet exist. Therefore, a prime component in the concept is the en-couragement of innovation.
“Our concept encourages visitors to think in new ways about resource
Photo © Helsing
in kau
pung
in aineistop
ankki / Kalle Kataila
Map
© M
aanm
ittau
slaitos
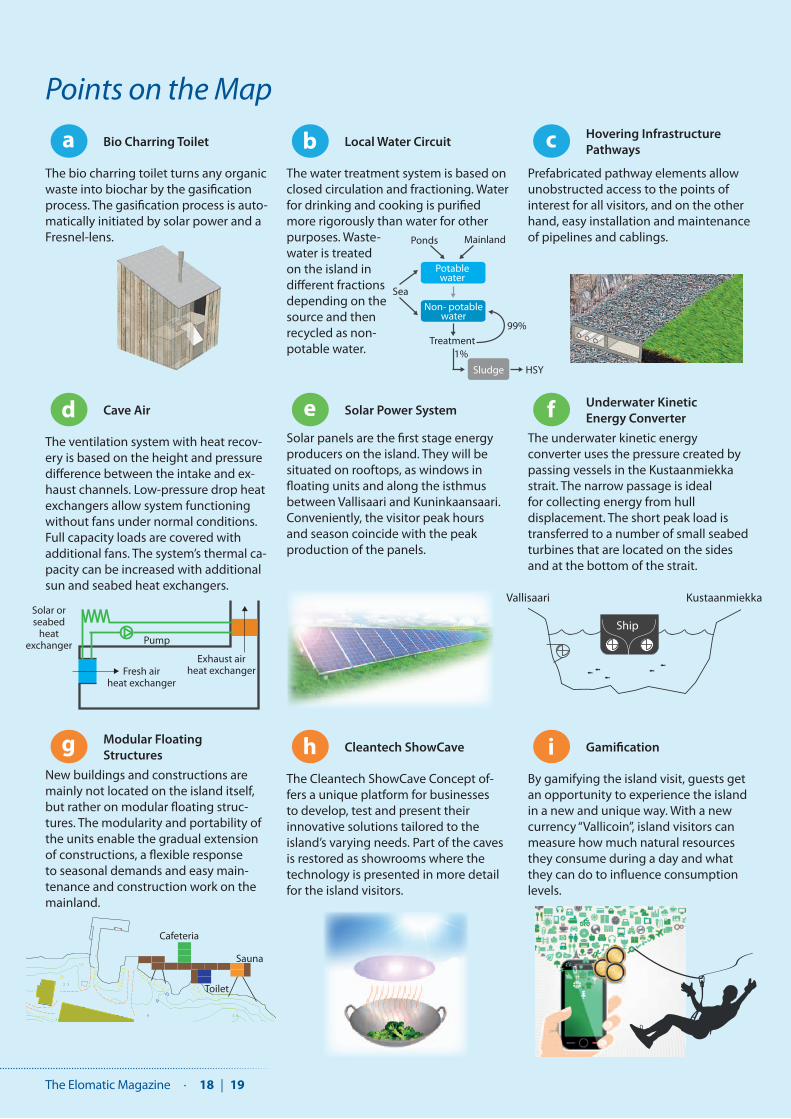
a Bio Charring Toilet
The bio charring toilet turns any organic waste into biochar by the gasification process. The gasification process is auto-matically initiated by solar power and a Fresnel-lens.
b Local Water Circuit
The water treatment system is based on closed circulation and fractioning. Water for drinking and cooking is purified more rigorously than water for other purposes. Waste-water is treated on the island in different fractions depending on the source and then recycled as non-potable water.
c Hovering Infrastructure Pathways
Prefabricated pathway elements allow unobstructed access to the points of interest for all visitors, and on the other hand, easy installation and maintenance of pipelines and cablings.
d Cave Air
The ventilation system with heat recov-ery is based on the height and pressure difference between the intake and ex-haust channels. Low-pressure drop heat exchangers allow system functioning without fans under normal conditions. Full capacity loads are covered with additional fans. The system’s thermal ca-pacity can be increased with additional sun and seabed heat exchangers.
e Solar Power System
Solar panels are the first stage energy producers on the island. They will be situated on rooftops, as windows in floating units and along the isthmus between Vallisaari and Kuninkaansaari. Conveniently, the visitor peak hours and season coincide with the peak production of the panels.
f Underwater Kinetic Energy Converter
The underwater kinetic energy converter uses the pressure created by passing vessels in the Kustaanmiekka strait. The narrow passage is ideal for collecting energy from hull displacement. The short peak load is transferred to a number of small seabed turbines that are located on the sides and at the bottom of the strait.
g Modular Floating Structures
New buildings and constructions are mainly not located on the island itself, but rather on modular floating struc-tures. The modularity and portability of the units enable the gradual extension of constructions, a flexible response to seasonal demands and easy main-tenance and construction work on the mainland.
h Cleantech ShowCave
The Cleantech ShowCave Concept of-fers a unique platform for businesses to develop, test and present their innovative solutions tailored to the island’s varying needs. Part of the caves is restored as showrooms where the technology is presented in more detail for the island visitors.
i Gamification
By gamifying the island visit, guests get an opportunity to experience the island in a new and unique way. With a new currency “Vallicoin”, island visitors can measure how much natural resources they consume during a day and what they can do to influence consumption levels.
CURRENT
SHIP
3 87 5
2 3
Vallisaari KustaanmiekkaSolar or seabedheat
exchanger
Fresh air heat exchanger
Cafeteria
Sauna
Toilet
Exhaust air heat exchanger
PumpShip
Ponds
Sea
HSY
99%
1%
Mainland
Treatment
Potable water
Non- potable water
Sludge
Points on the Map
The Elomatic Magazine · 18 | 19

consumption. We also want to create a unique development platform for rev-olutionary cleantech and eco-innova-tions. The vision is based on a combi-nation of maximizing the use of current structures, the use of ShowCaves (see point h), and creating additional float-ing solutions for the required infra-structure and service spaces,” explains Ms Vuorenmaa.
Competition entrants had to pro-vide solutions built around three main themes: sustainable water supply and sewage treatment, sustainable energy solutions and efficient use of materials, as well as innovative solutions for user interface and systems management.
Sustainable water supply and sewage treatment
The main Virgin Island concepts for sustainable water supply and sewage treatment are dry composting toilets, a local water circuit and hovering infra-structure pathways (see points a, b and c). Water consumption and wastewater treatment are minimised on the island. This is achieved, in particular, by using dry toilets instead of water closets. This not only reduces the requirements for sewage treatment but also enables the circulation of nutrients.
Water is mostly locally sourced, pu-rified and treated within closed wa-ter circuits. The required water sup-
ply pipes and sewage drains needed for the closed water circuit are hidden within hovering infrastructure path-ways. This also enables easier, more ef-ficient maintenance and optimisation of lifecycle costs.
Sustainable energy solutions and efficient use of materials
With regards sustainable energy so-lutions and efficient use of materials, the team has proposed cave air, a so-lar power system, and other renewa-ble energy generation methods such as retro windmills and underwater ki-netic energy converters (see points d, e and f ). Energy consumption is mini-mised by the cave air concept and by supporting Island businesses to devel-op new and energy efficient solutions. Green lease contracts are used and visi-tors are motivated to reduce energy use. In addition, local renewable ener-gy production is emphasised by utilis-ing solar, eolic and geothermal energy, as well as underwater kinetic energy from passing ferries.
Innovative solutions for user interface and system management
The main concepts in this theme are modular floating structures, Clean-tech ShowCaves and gamification (see
points g, h and i). Unnecessary infra-structure construction on the island itself is avoided by utilizing modular floating structures, which adjust ac-cording to seasonal fluctuation in visi-tor numbers and the development of the island.
The Cleantech ShowCave concept offers a cleantech platform for busi-nesses to develop and present their innovative solutions on the island and attracts tourists. User input becomes a crucial part of the cleantech devel-opment process, as users try out, and evaluate pilot cleantech solutions shown in the Cleantech ShowCave concept. Visitors are encouraged to participate in the island development with the help of gamification of the is-land visit. Gamification is also utilised to demonstrate different sustainability themes, such as the impact of different consumption choices.
Virgin Island project team
Elomatic: Anita Vuorenmaa (Project Coordinator), Sebastian Kankkonen, Antti Yrjänäinen, Rami Raute, Pekka Koivukunnas, Mika Patrakka, Jukka Mikkonen, Henrik Bachér.
Gaia Consulting Oy: Laura Descombes (Project Coordinator), Minna Päällysaho (Consultant), Pekka Pokela (Business Director).
A unique solution for a unique island
Photo © M
etsähallitus/ Tuomo H
äyrinen

The Elomatic Magazine · 20 | 21
A The
Z
to
of getting medical devices to market
Aging populations with higher life expectancies around the globe are fuelling demand for medical devices. Digitalisation is, furthermore, disrupting the entire health care sector, which is characterised by vast opportunities for established players and new entrants. Getting a medical device to market may seem cumbersome, time-consuming and a little daunting. The process is indeed demanding, but it is intended to ensure that products launched on the market have been properly designed, are safe and reliable. There is a natural temptation to look for shortcuts or alternatives, but this should be avoided. In most cases, such approaches are doomed to cause delays and increase costs further down the road.
Text: Kalle Virta

Consider the following scenario: Company A has a great product
idea, a product design or even a prod-uct prototype. The market is ripe and ready for the product and thoughts of international success are not far from the developers’ minds.
When considering how to develop and get the product launched, Com-pany A begins to consider whether a medical device classification for the product will result in an unnecessarily expensive and lengthy project. What if competitors use this time to fill the space? Would it not be better to avoid the medical device classification and fast-track development, thereby ensur-ing success? In short, the answer is a re-sounding NO.
If a device is erroneously classified as serving a purpose other than that of a medical device, and the classifi-cation needs to be changed later, the entire process needs to be started from scratch. It makes much more sense to
reduce uncertainty by adhering to proper processes.
There are six steps involved in devel-oping and launching a medical device successfully:1. Defining device use and product
classification2. Medical device’s essential require-
ments 3. User and safety instructions 4. Evaluation of compliance with re-
quirements 5. CE marking6. Registering device and product to
market
Phase 1 Defining device use
and product classification
In the first phase of getting a medical product to market, the device designer or manufacturer has to define the de-vice use. In practice, this is where the
manufacturer decides whether the de-vice is a medical device or not.
The definition of use also defines the entire process of getting the prod-uct to market and, therefore, this phase requires special attention. In Europe, guidelines for defining use are provid-ed in the European Medical Devices Di-rective 93/42/EEC.
Once a device has been defined as a medical device, the manufacturer is obliged to classify the device ap-propriately according to the directive (see Figure 1). The EU’s Medical De-vices Info internet pages (http://med-dev.info/) are an invaluable resource
High risk
Low risk
Class III
Class IIB
Class IIA
Class I
▲ Figure 1. Classification of medical de-vices. Manufacturers are obliged to classify medical devices appropriate-ly according to the directive.
© Elomatic

The Elomatic Magazine · 22 | 23
in this regard, and manufacturers and developers are well advised to make full use of it.
Phase 2 Fulfilling essential
requirements of device
The manufacturer is responsible for en-suring that the medical device fulfils the essential requirements as set out in the Medical Devices Directive for its intended use. The directive defines which standards are to be adhered to when designing, manufacturing and storing the device. The European com-mission also maintains and updates these harmonised standards on its web pages.
By fulfilling the essential require-ments, the manufacturer ensures that the device can meet its defined per-formance levels and does not endan-ger the lives of patients and users. For
this reason, the manufacturer also has to perform a risk analysis of patient and user safety for the device.
Phase 3 User and
safety instructions
The device or its packaging needs to be labelled with information regard-ing the manufacturer and safe use. High quality user instructions should also accompany the product. The level of required detail in labelling usually becomes clear when fulfilling the es-sential requirements of the directive in phase 2.
In Finland instructions for safe use intended for end users and/or patients are required in both Finnish and Swed-ish. General user instructions or simi-lar information is required in Finnish, which is to be supplemented with ei-ther Swedish or English.
Legislation requires that high quality user instructions are drawn up and pro-vided with medical devices. The proper use and operation of medical devices is essential from the perspective of the patient’s and user’s safety. It is, there-fore, imperative that sufficient time and effort is put into drawing up such in-structions.
If necessary, the help of experts with experience in producing high quality instructions should be considered. The quality of instructions is one of the are-as the authorities consider when evalu-ating whether a device complies with the set requirements.
▼ Figure 2. Developing and launching a medical device successfully
Phase 1 Defining device use and product classification
Phase 2 Fulfilling essential requirements of device
Phase 3 User and safety instructions
Phase 4 Evaluation of compliance with requirements
Phase 5 CE marking
Phase 6 Registering device and product to market
Photo © Darko
Stojano
vić/pixaba
y.com

Phase 4 Evaluation of compliance
with requirements
The manufacturer is obliged to draw up technical documentation regard-ing the fulfilment of essential require-ments, as well as about the measures that enable the evaluation of the de-vice’s compliance with requirements.
A clinical trial should always be con-ducted in order to verify compliance with requirements. The clinical approxi-mate values define the device features and performance. The results of the risk analysis in phase 2 are also evaluated during the clinical device trial.
Specific procedures have been set out for different device classifications to prove compliance with the require-ments. The provisions for acceptable clinical device trials are set out in na-
tional legislation. It is mandatory for all medical devices to undergo clini-cal trials.
For devices with IIA, IIB and III classi-fications the evaluation of compliance with requirements can be conducted only by facilities that have been de-clared by EU country governments. In Finland there are currently two such facilities.
Phase 5 CE marking
When the compliance with require-ments has been evaluated and prov-en, the manufacturer can attach a CE marking to the device. By attaching the marking the manufacturer con-firms that the device fulfils its defined essential requirements. The marking also confirms that the manufacturer accepts responsibility for the design and manufacture of the product.
Phase 6 Registering device
and product to market
When the first five phases have been completed the manufacturer has to register the device with the appropri-ate national authorities. In Finland, Val-vira (http://www.valvira.fi/) is responsi-ble for maintaining the device register.
At this stage one can say that the manufacturer has diligently followed the process and taken responsibility for
ensuring that the device meets its de-fined requirements. It also at this stage the product could be considered ready for the market.
The marketing and launching of the medical device is in itself a challenging project, but if the process described in this article has been followed, the man-ufacturer can at least feel that all bases have been covered before the actual marketing and launch of the product.
The WHO definition for a medical deviceAn article, instrument, apparatus or machine that is used in the pre-vention, diagnosis or treatment of illness or disease, or for detecting, measuring, restoring, correcting or modifying the structure or func-tion of the body for some health purpose. Typically, the purpose of a medical device is not achieved by pharmacological, immunologi-cal or metabolic means.www.who.int/medical_devices/definitions/en/
The six-phase process to launching medical devices ensures that the products have been properly designed,
are safe and reliable.
About the author
Kalle Virta
B.Sc. (Health Technology)
Kalle Virta graduated as a physiothe-rapist from the Jyväskylä Institute of Health Care in 1995. After some years in the health care sector, he gradua-ted as an engineer, majoring in health technology, from the Jyväskylä Uni-versity of Applied Sciences in 2004. Kalle has extensive healthcare expe-rience in health and assistive techno-logy. He works as a product engineer at the Elomatic Jyväskylä office and is responsible for marketing and deve-loping medical engineering services.

The Elomatic Magazine · 24 | 25
The Indian pharmaceutical industry currently tops the list of the country’s science-based industries and is set to grow at a compound annual growth rate of 20% over the coming years. One of the challenges faced by the growing sector is ensuring the required power quality to sustain high-speed production. Harmonic distortion, which generally results from nonlinear loads in the power system, poses one of the greatest threats to power quality in the sector. For power utility boards, the goal is to meet the pharmaceutical industry’s power demand, while ensuring low losses and improved electrical loading patterns.
Pharmaceuticals production is in-creasingly relying on the use of mi-
croprocessors and/or electronics-based
automated machinery. The use of such equipment increases nonlinear loads in the system and induces a lagging pow-er factor. A nonlinear load with a low power factor draws more current from the source and increases energy losses.
Such losses and the high current drawn adversely affect the life-ex-pectancy of electrical switchgears, equipment and cables. This also re-sults in significant losses in the elec-trical energy being supplied by the state. Power utility boards, as such, are quick to issue heavy penalties on end-users in an attempt to curb such energy wasting.
Capacitator banks can recover lagging power factor
In order to minimise such losses and the adverse effects on the electronic systems of the plant, it is critical to re-cover the lagging power factor. Many companies have opted to install a ca-
pacitor bank at source level to achieve this. The disadvantage, however, is that it results in an increase in the total har-monics level in the system, which in turn, may create problems in switch-gears and cause the electrical failure of a unit or the entire plant.
The power utility board supplies the ideal sinusoidal voltage waveform (a wave with a smooth repetitive oscil-lation) at every consumer point. How-ever, the end-user (or the plant utility equipment in this case) may not be able to maintain these ideal conditions. This results in a distorted voltage and current waveform, which is known as harmonic distortion (see the info box overleaf for more on harmonic distor-tion). The main concern of the power utility board is to maintain a sinusoi-dal voltage waveform at user-points to minimise energy losses.
Harmonics can be generated in the plant, or it may enter a plant from the power utility board (at the main sup-ply level). The generation of harmonics
Harmonic Distortion in Pharmaceutical Industry Power Systems
Text: Amit R. Ingle

can cause a wide range of problems, including power losses, malfunction-ing of equipment and reduced life-ex-pectance of switchgears etc. Ultimately, the impact is on the power-factor. If the power utility board needs to correct the power factor, it may sanction users for this intervention.
Reducing harmonic current with filters
As capacitor banks do not solve har-monic distortion problems, other in-novative solutions such as filters are required. The following paragraphs outline the different kinds of filters available on the market.
Passive harmonic filters are installed at the individual load level. The filter size is calculated based on the con-nected load and the reactive power requirements. Harmonic frequencies can be adjusted as per the composed LC circuit within the device.
A clear advantage of passive har-monic filters is that they reduce the total harmonic distortion at the volt-age level THD (U). At full load condi-tions they improve the power factor and minimise harmonic currents. These filters are, however, expensive and re-quire advanced design skills to imple-ment on connected and running loads. If the system overloads, the current and voltage characteristics may change and exhibit a non-linear load pattern. The range of losses for passive harmon-ic filters is between 0.5–1.5%.
Active harmonic filters can be con-nected in series as well as in parallel to the AC networks to reduce harmon-ic current at non-linear loads and for voltage alteration in grids. The stand-ard voltage distortion range is 5–9%. This range is recommended in some areas, but adherence is, however, not mandatory.
Industrial areas and power utility boards follow the standard guidelines of IEEE 519. This enables them to pro-
vide a disturbance-free and pure sinu-soidal waveform at the end point.
Harmonic filters offer the following advantages:
■ Increase the productivity and effi-ciency of equipment
■ Reduce energy losses in the system ■ Resolve power quality issues ■ Energy savings of 10–20% can be
achieved ■ Reduce total energy cost of the fa-
cility ■ Increase the life-expectancy of
switchgears, cables and other elec-trical equipment
■ Reduce the overall system mainte-nance cost
■ Power factor can be maintained at above 0.95
■ Breakeven period for the invest-ment is short
Hybrid filters can be connected either in series or in parallel to the electri-cal loads and are, in essence, a com-bination of active and passive filters.
Original artwork © fotographic1980/depositphotos.com

The Elomatic Magazine · 26 | 27
Basics of Harmonic Distortion
Better power quality is achieved with a sinusoidal voltage and cur-rent waveform, i.e. a wave with a smooth repetitive oscillation. This kind of wave is produced by linear loads, such as those drawn by most household appliances. Non-linear loads distort the sinu-soidal waveform due to improper distribution of electrical loads. The amount of distortion in the wave from its pure sinusoidal values is called harmonic distortion. Non-linear loads include, for example, AC / DC converters and reactors, all equipment controlled by devices using thyristors, as well as saturation in transformers and derated transformers.
Some effects of harmonics on electrical power systems
■ Losses and heating issues in transformers and rotating ma-chines
■ Overloading and excessive cur-rent can cause fuses to trip as shunt capacitors draw more cur-rent in the system while correct-ing the power factor
■ Electrical equipment insulation may be weakened due to over-heating. It also decreases the efficiency of power generation, transmission and consumption.
■ Machines may trip at normal loads
■ Increases fire risk
Square wave
3rd harmonic
5th harmonic
7th harmonic
Fundamental sine wave component
▲ The frequency of each harmonic is a whole number multiple of the fundamental frequency.
▲ The ideal sine wave (top) versus a distorted waveform (bottom)
0
0
Time
Time
Curren
t or v
oltage
Curren
t or v
oltage
+
+
–
–

The passive filter provides the basic fil-tering in the system and the active filter mitigates the other harmonics present in the system.
High pass filters are used to mini-mise the 5th and 7th harmonics levels produced in the system. According to EN-61000-3-4 and IEEE-519 the follow-ing factors, among others, should be considered when incorporating high pass filters in designs:
■ It reduces losses at the lower and higher harmonic levels. As high pass filters are very expensive, the level of losses needs to be sufficiently high to generate a proper ROI.
■ The filter capacity should be de-signed and calculated as per the requirement, otherwise it may be affected by fast flickering and tran-sient spikes during the process.
■ Sometimes harmonics are gener-ated in the system due to sudden momentary spikes. In such cas-es the harmonics need to be miti-gated immediately. As such, the re-sponse time is also crucial.
■ Inter-harmonics is a major issue in a facility’s electrical systems. Hence, load synchronisation needs to be conducted properly. If inter-har-monics occurs in a system at source, the type of active filter needs to be reviewed and changed.
■ The active harmonics filter rating selection is determined based on the nominal load at the end point.
■ The common range of active filters is 380V to 415V and up to 480V. A higher voltage range is also availa-ble between 600 and 690V without a step-up transformer.
Conclusion
Capacitor banks can be used at the consumer level to maintain a power factor close to unity and the supplied sinusoidal waveform. A thorough un-derstanding and monitoring of power quality is required in order to minimise losses and save energy.
Active harmonics filters are required for some industrial applications, such as variable frequency drives (VFD), heaters, furnaces, wind and solar plants, CFL lighting, UPS systems and weld-ing etc. All these applications gener-ate harmonics in the power network. An active filter is a guaranteed solu-tion to mitigate harmonics present in the system, meet all the requirements and save energy.
References
1. IEEE Standard 519-2014, http://standards.ieee.org/findstds/ standard/519-2014.html
2. “Electric Utility Power System”. A text book by John Smith & McGraw-Hill.
About the author
Amit R. Ingle
B.E. (Electrical Engineering), MBA (Project Management)
Amit presently leads the Electri-cal, Instrumentation and Automa-tion Department at Elomatic India. He has over 12 years of experience in electrical and instrumentation design of pharmaceutical and bio-pharmaceutical plants. He is profi-cient in planning and executing pro-jects with a flair for adopting modern methodologies in compliance with the quality and regulatory standards. He has vast exposure to and under-standing of IS, IEC and European gui-delines. He has been with Elomatic India since 2009. Prior to joining Elo-matic he worked at Lupin and RPG as a project engineer.
The generation of harmonics can cause a wide range of problems, including power losses, malfunctioning of equipment,
and reduced life-expectance of switchgears.

The Elomatic Magazine · 28 | 29

Green values and ecological thinking are accelerating the development of lightweight and efficient structures, while new generations are placing a lower burden on the environment by consuming less energy and materials. In order to continue this trend, product development requires ever increasing amounts of accurate information about product application areas. This ensures that products can be produced as efficiently as possible and that they meet their set requirements. 3D scanning and 3D printing are complementary technologies that are coming strongly to the fore in this regard.
In lightweight and optimised struc-tures, it is of particular importance
to have thorough knowledge of the surrounding environment, as a part or product can be included in a complex or cramped entity. Traditionally, bound-ary surface management and shape
measurements have been demanding and labour-intensive tasks. The advent of 3D scanning has solved this prob-lem; it can produce highly accurate measurements of complex shapes in a fraction of the time required by con-ventional measurement techniques.
3D printing, on the other hand, is a production method that allows more complex and free shapes than tradi-tional production methods. This means that design can strive to deliver optimal features for a product, e.g. being light-weight and flexible, while at the same time taking life cycle loads into consid-eration. If a product is used or operated in a flow or heat transfer environment, for example, the flow resistance and heat transfer properties of the product can be optimised.
3D printing and design challenges
In product development the design process of printed and optimised prod-ucts is more complex than that of tra-ditional design methods. This is due to the fact that the goal is to develop
a product that meets the increasing amount of requirements more closely. In this case, more information is pro-duced and used in product design than with traditional products and pro-duction methods. The product’s physi-cal demands are met with the help of technical analysis, which strives to gain as clear a picture as possible of the load levels the product will be exposed to during its life cycle.
3D printing allows optimised struc-tural design as the production meth-od allows the production of more complex shapes. This means that heat and strength loads, as well as flow de-mands can be met more closely. To-pology optimisation is the term used to describe the geometrical optimisa-tion of a product.
In the end, products need to be tested even if they were analysed and developed with the help of technical analysis. This is due to the fact that the material characteristics are dependent on the printing process and materials used. In order to control the quality of printed products the printing environ-ment, material, and the part placement in the printer are standardised.
3D scanning supports 3D printingText: Samu Sundberg and Teemu Launis
Photo © Grig
oriy M
anuk
yan, dep
ositp
hotos.c
om/ B
est3d

The Elomatic Magazine · 30 | 31
The duration of optimised prod-uct development projects is not great-er than of traditional products, even though significantly more data is pro-duced and used in the former. This is due to the fact that designers and ana-lysts nowadays have extremely efficient tools at their disposal. A technical anal-ysis project that took days to perform in the 1980s can nowadays be done in a few hours. Optimised product design, however, requires designers with high-er know-how levels so that the right information is at the right place at the right time.
Limits of 3D printing
As with other production methods, the possibilities and limitations of 3D print-ing as a production method need to be understood.
Metal prints are almost always sand-blasted. In addition, the surfaces of printed parts require finishing if rough-ness under Ra10 is required. The surfac-es of printed pieces remain rough and it is a feature of the production meth-od. In many cases rough surfaces are not a deterrent. Production tools, for example, can be used in the form they are printed. In consumer products aes-thetic features and handling comfort are of greater importance and, there-fore, require surface finishing.
3D printing is not currently suited to mass production as it is too slow. New printing methods and more ef-ficient devices are, however, continu-ously being developed and in future we may see 3D printing used even in mass production.
3D scanning produces accurate information
for design
3D scanners for individual parts have been available for years already. Scan-ners aimed at consumers are common-ly available, even though they are not sufficiently accurate to be used in in-dustrial projects. The great supply of consumer-targeted devices has also been affected by the high price of bet-ter quality accuracy scanners.
With the help of scanning a 3D model can be created of an existing part or its environment. The digitised materials can be used in producing a replacement part or to create a better optimised entity in design. Hand-pro-duced prototypes can also be digitised into production models, while shape analysis can be conducted by compar-ing scanned materials with the design model. Scanning can furthermore be used to evaluate production success, quality or to identify errors.
By combining 3D printing and scanning cost and time savings can be achieved. It also allows spare parts to be produced quickly.

As a measurement method, scan-ning is at its most efficient when double-curved surfaces have to be measured. The measurement of even complex parts can usually be done in an hour. The point cloud surface model is usable practically immediately after scanning. Often a point cloud model is sufficient as surface and solid mod-elling is not always needed. Design programs have also developed rapidly with regards to the import and use of scanned materials.
Combining scanning and printing
Tools that wear during use need to be stored as they tend to have long deliv-ery times. If tools are printed they can be produced cheaply according to de-mand – there is no need to store tools.
Part of the price of an individual tool also does not change significantly as the production amount increases.
Vibrating feeders transfer small components to assembly stations. The feeders are often produced as castings or plate structures. For some compo-nents optimised vibratory feeders can be printed one at a time, instead of producing a large series that is kept in storage. Because the tool can be tested quickly, its development cycle is mark-edly faster than that of a casting.
A significant benefit can be gained when all the printed structure’s func-tions are combined into a single part. Brackets, grips and supports are typi-cal examples of customised parts of products.
By combining 3D printing and scanning cost and time savings can be achieved. It also allows required spare parts to be produced quickly. This means that large amounts of spare parts are not required in storage, which eases warehousing and logistics. Parts produced with this method fit within a millimetre’s accuracy, even in dou-ble-curved shapes. Material losses can also be reduced in lightweight and de-manding structures.
See 3D scanning and 3D printing video on YouTube:https://youtu.be/I73YBFUMNZI
About the authors
Teemu Launis
M.Sc. (Mechanical Engineering)
Teemu Launis graduated from the Tampere University of Technology in 1999 and has worked on mechanical engineering projects in different po-sitions from designer to project man-ager. Teemu and the Elomatic Light Weight Structures team actively fol-low additive manufacturing technol-ogy development. In 2010 Teemu set up the Elomatic Tampere office. He is responsible for marketing and sales of Elomatic’s mechanical engineering services in the Tampere region.
Samu Sundberg
B.Sc. (Mechanical Engineering)
Samu Sundberg holds a mechanical engineering degree from the Jyväsky-lä University of Applied Sciences. He has worked in paper machine and ve-hicle design and has been responsi-ble for developing innovative design methods and service productisation. Samu started working at Elomatic in 1999 and is currently the Design Man-ger of the Elomatic Advanced Tech-nologies team.
The Creaform Handyscan 700 is a light hand-held scanner that boasts accuracy up to one hun-dredth of a millimetre. The main advantage of the scanner is that it is handy and fast, but at the same time boasts high quality.
Photo www.creaform
3d.com

Scientia vires estAt Elomatic we believe that our human capital is our most precious asset. With knowledge comes the power to shape the future.
We continuously develop our employees’ know-how and strive to be leaders in our respective technical fields. We focus on packaging and delivering this know-how to ensure that our customers stay ahead of their competition.
The Top Engineer magazine offers our experts the opportunity to share their ex-pertise and knowledge and to engage other technical experts with their writing. It is a publication by engineers, for engineers, and other technically-minded readers.
www.elomatic.com
In November 2016 Elomatic’s Martin Fält defended his doctoral thesis in which he argues that the sky should not only be seen as a potential source of energy in the form of sunlight, but also as a low temperature reservoir for cooling.
According to the research a roof-top window can be used actively
for both heating and cooling purposes and also reduce the energy consump-tion of buildings. Fält indicates that cooling of up to 100 watts per square metre can be achieved on a clear night.
This cooling can be obtained through a longwave radiative heat ex-change between a radiator, located on the surface of the earth, and the cold air masses above it.
Passive cooling methods such as radiative cooling can significantly re-
duce dependence on carbon-based fuels and reduce energy consumption.
Link to doctoral thesis: The utilisa-tion of participating gases and long-wave thermal radiation in a passive cooling skylight: http://urn.fi/URN:ISBN:978-952-12-3432-3
Radiative cooling from the sky
© Dep
ositp
hotos.c
om/gyn
9037