the emerging “quiet revolution” in african agrifood systems: challenges for mozambique
Upload: international-food-policy-research-institute-development-strategy-and-governance-division
Post on 16-Jul-2015
39 views
TRANSCRIPT


The Emerging “Quiet Revolution” in African Agrifood Systems: Challenges for Mozambique
David Tschirley, Michael Dolislager, Jason Snyder, Thomas ReardonPresentation at MSU/IFPRI conference on “Agricultural Public Investments, Policies, and Markets for Mozambique’s Food Security and Economic Transformation”
Maputo, Mozambique
20 November 2014

Urbanization
& per capita
income growth
Diet & other
transformations(farm, midstream,
downstream)
Approach

Policy Private
Investment
Public Investment
Rate & nature of
transformations
Rate of
change
Approach
Urbanization
& per capita
income growth
Diet & other
transformations(farm, midstream,
downstream)

Policy Private
Investment
Public Investment
Rate & nature of
transformations
Rate of
change
Approach
Urbanization
& per capita
income growth
Diet & other
transformations(farm, midstream,
downstream)

Approach (2)
• Focus primarily on East and Southern Africa
• LSMS data from Ethiopia, Uganda, Tanzania, Mozambique, Malawi, Zambia
• Mozambique’s characteristics fit very well into the regional picture
• Possible exceptions / differences
• Pattern of urban population settlement
• Import dependence now and moving forward

Focus
• African urbanization
• Is African income growth being captured by a small elite?
• Diet change is a major driver of agrifood system transformation, and it starts very early in the income distribution
• Important implications for the pace of change over the next decade
• How can Africa capture booming African demand for food?
Urbanization
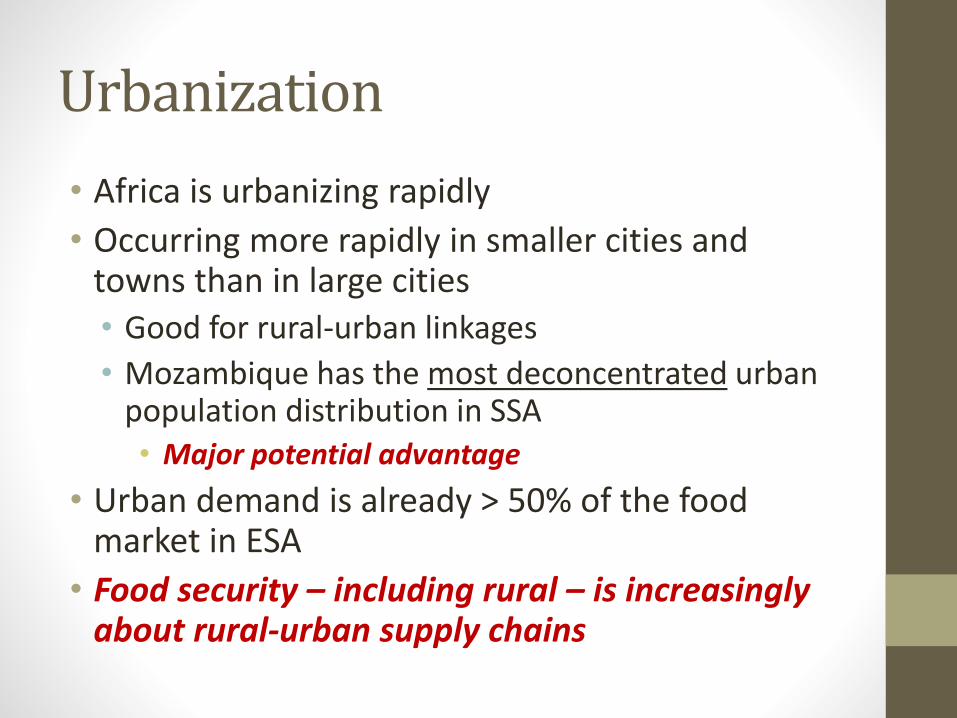
• Africa is urbanizing rapidly
• Occurring more rapidly in smaller cities and towns than in large cities• Good for rural-urban linkages
• Mozambique has the most deconcentrated urban population distribution in SSA• Major potential advantage
• Urban demand is already > 50% of the food market in ESA
• Food security – including rural – is increasingly about rural-urban supply chains

Income growth
• Widely known that growth has been much faster over past 15 years
• Its distribution across HHs in ESA – the equity of growth in the region - has been:
• Generally unequal, but
• Highly variable, and
• Overall, broad enough to drive rapid transformation if it continues

If growth continues like this …
2010 2040
Income Class
(per capita PPP income)Share Share
ESA-wide 100% 100%
Poor ($0-$2) 72.5% 19.3%
Vulnerable middle ($2-$4) 19.9% 28.7%
Lower middle ($4-$10) 6.5% 33.9%
Upper Middle ($10-$20) 0.9% 12.0%
Upper (>$20) 0.2% 6.1%
Populations and shares by income class in East and Southern Africa, 2010 and2040 assuming continuation of rate and distribution of recent GDP growth
Source: Author calculations from PovcalNet

Focus• African urbanization
• Is African income growth being captured by a small elite?
• Diet change is a major driver of agrifood system transformation, and it starts very early in the income distribution
• Important implications for the pace of change over the next decade
• How can Africa capture booming African demand for food?
Focus primarily on East and Southern Africa

The rise of processed foods
UnprocessedProcessed,Low Value
Added
Processed, High Value
Added
Non-perishable
LegumesMaize grain
others
Maize mealMilled Rice
SugarOthers
Veg oilsBreads
Food away from homeOthers
Perishable
VegetablesFresh fish
FruitOthers
BeefOther meat
(incl. poultry)Dried/pkgd fish
Others
Food away from homeDairy
Others

The rise of processed foods
• Processed foods have penetrated
• Deeply (69% share of all purchased food)
• Broadly
• comparable in rural- and urban areas,
• among poor and upper class
• Dramatic change in consumption patterns below the international poverty line

Kernel regression results on purchased food budget shares,additionally weighted by population across 5 countries of ESA
Unprocessed non-perishable Low processed non-perishable
High processed non-perishable Unprocessed perishable
Low processed perishable High processed perishable
Source: Author calculations from LSMS data sets
Most diet change has already occurred by the time a household
rises up to the international poverty line

ESA measure of total impact on food system change by level of income
Source: Author calculations from LSMS data sets

ESA measure of total impact on food system change by level of income
This group – all belowinternational poverty line
– is driving food system change
Major implications for structuralchange over coming decade
and beyond
Source: Author calculations from LSMS data sets

Food Category Rural Urban ESA-Wide
Consumed own production 0.95 0.39 0.82
Non-perishable
Unprocessed 0.81 0.55 0.75
Processed Low 0.87 0.70 0.83
Processed High 1.07 1.00 1.05
Perishable
Unprocessed 0.73 0.80 0.75
Processed Low 1.20 1.18 1.19
Processed High 1.36 1.28 1.34
Expenditure elasticities by perishability and processingclassification, income class, and rural/urban (2010)
Source: Author calculations from LSMS data

Focus• African urbanization
• Is African income growth being captured by a small elite?
• Diet change is a major driver of agrifood system transformation, and it starts very early in the income distribution
• Important implications for the pace of change over the next decade
• How can Africa capture booming African demand for food?
Focus primarily on East and Southern Africa

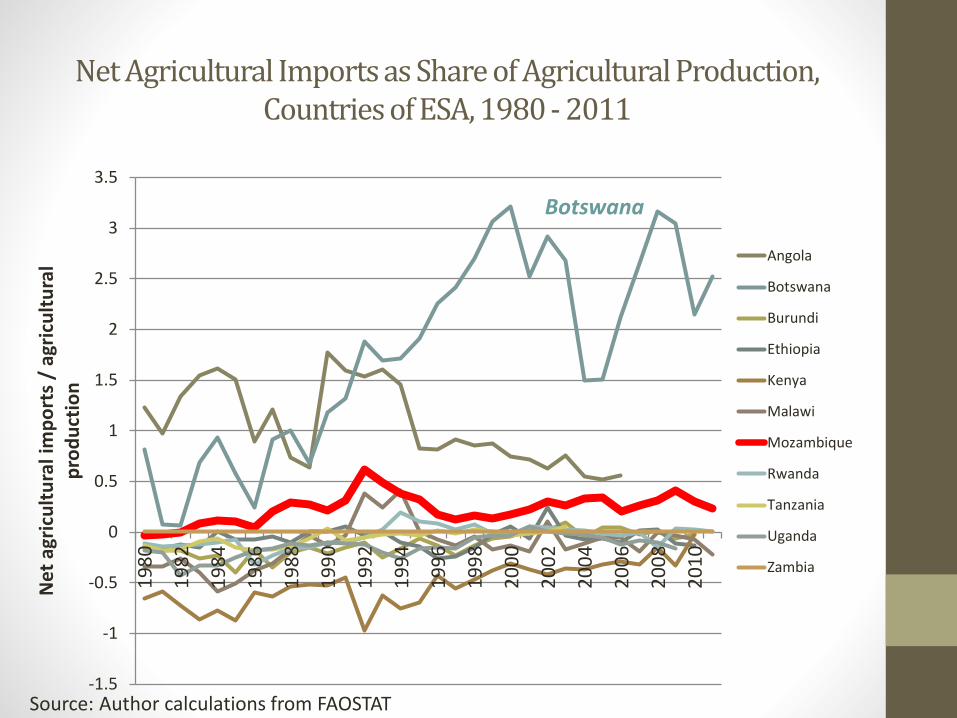
Will imports capture the surge in demand?
• We found in the region that net import shares in food consumption fall with income in urban areas
• Why?
• Local cereals imported cereals, BUT
• Bennett’s Law: Cereals meat, dairy (also fresh produce)
• all largely locally produced
• But Mozambique may be very different

Net Agricultural Imports as Share of Agricultural Production, Countries of ESA, 1980 - 2011
-1.5
-1
-0.5
0
0.5
1
1.5
2
2.5
3
3.5
19
80
19
82
19
84
19
86
19
88
19
90
19
92
19
94
19
96
19
98
20
00
20
02
20
04
20
06
20
08
20
10
Net
agr
icu
ltu
ral i
mp
ort
s /
agri
cult
ura
l p
rod
uct
ion
Angola
Botswana
Burundi
Ethiopia
Kenya
Malawi
Mozambique
Rwanda
Tanzania
Uganda
Zambia
Source: Author calculations from FAOSTAT
Net Agricultural Imports as Share of Agricultural Production, Countries of ESA, 1980 - 2011
-1.5
-1
-0.5
0
0.5
1
1.5
2
2.5
3
3.5
19
80
19
82
19
84
19
86
19
88
19
90
19
92
19
94
19
96
19
98
20
00
20
02
20
04
20
06
20
08
20
10
Net
agr
icu
ltu
ral i
mp
ort
s /
agri
cult
ura
l p
rod
uct
ion
Angola
Botswana
Burundi
Ethiopia
Kenya
Malawi
Mozambique
Rwanda
Tanzania
Uganda
Zambia
Botswana
Source: Author calculations from FAOSTAT

Net Agricultural Imports as Share of Agricultural Production, Countries of ESA, 1980 - 2011
-1.5
-1
-0.5
0
0.5
1
1.5
2
2.5
3
3.5
19
80
19
82
19
84
19
86
19
88
19
90
19
92
19
94
19
96
19
98
20
00
20
02
20
04
20
06
20
08
20
10
Net
agr
icu
ltu
ral i
mp
ort
s /
agri
cult
ura
l p
rod
uct
ion
Angola
Botswana
Burundi
Ethiopia
Kenya
Malawi
Mozambique
Rwanda
Tanzania
Uganda
Zambia
Angola
Botswana
Source: Author calculations from FAOSTAT

Net Agricultural Imports as Share of Agricultural Production, Countries of ESA, 1980 - 2011
-1.5
-1
-0.5
0
0.5
1
1.5
2
2.5
3
3.5
19
80
19
82
19
84
19
86
19
88
19
90
19
92
19
94
19
96
19
98
20
00
20
02
20
04
20
06
20
08
20
10
Net
agr
icu
ltu
ral i
mp
ort
s /
agri
cult
ura
l p
rod
uct
ion
Angola
Botswana
Burundi
Ethiopia
Kenya
Malawi
Mozambique
Rwanda
Tanzania
Uganda
Zambia
AngolaMozam-bique
Botswana
Source: Author calculations from FAOSTAT
Implications
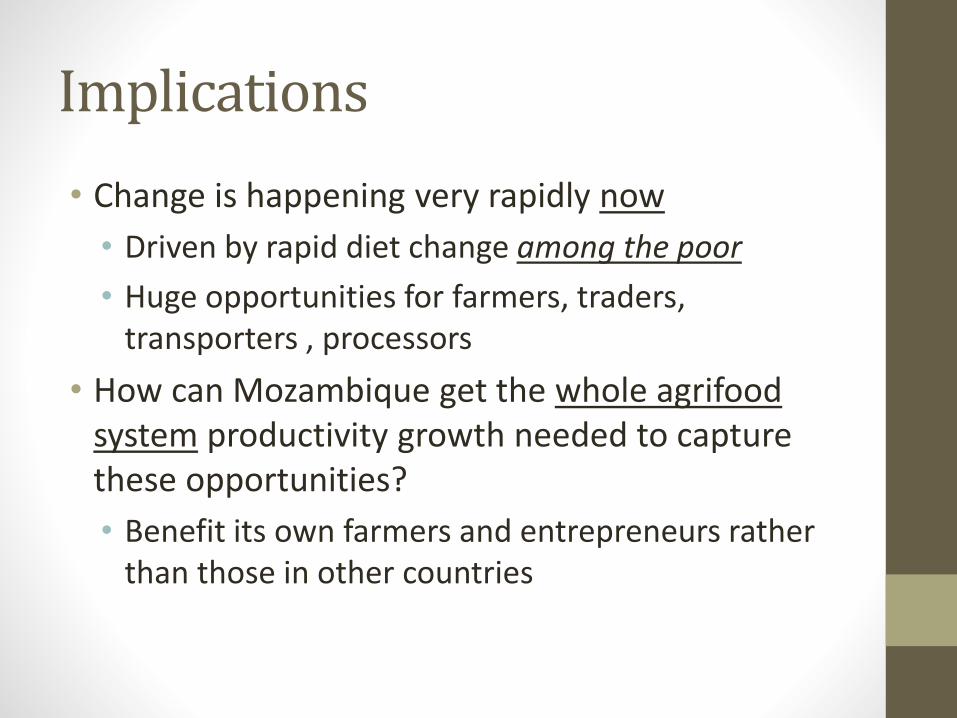
• Change is happening very rapidly now
• Driven by rapid diet change among the poor
• Huge opportunities for farmers, traders, transporters , processors
• How can Mozambique get the whole agrifoodsystem productivity growth needed to capture these opportunities?
• Benefit its own farmers and entrepreneurs rather than those in other countries

Implications (2)
• The emerging Quiet Revolution
• Local micro-small-medium businesses
• Non-western multi-nationals becoming major players
• OLAM, Export Trading Group, others
• South Africans (Shoprite/Checkers, Tiger Brands, others)
• Also well known players such as Walmart, Carrefour, Nestle, Parmalat

Implications (3)
• Can micro, small, and medium local firms compete?
• What packages of assistance can be effectively delivered?
• Can farmers respond?
• Ag investment needs to increase dramatically and move away from subsidies towards productivity enhancers

“Take Home”
Mozambique’s spatially dispersed urban settlement pattern should be a huge help in building rural-urban
supply chains to capture these opportunities
But its low productivity, current high import dependence, and coming resource boom present
huge challenges for doing so
Public policy (enabling environment) and productivity enhancing public investment will be
crucial

Questions?