the employers’ perspective on
TRANSCRIPT

© Transamerica Center for Retirement Studies, 2011
The Employers’ Perspective on Retirement Benefits and Planning
12th Annual Transamerica Retirement Survey
TCRS 1056-0611

© Transamerica Center for Retirement Studies, 2011
PAGE
Introduction to the Retirement Study: Employer Perspective 3
• About The Center 4
• About The Survey 5
• Methodology 6
• Terminology 7
• Profile of Companies 8
• Executive Summary 9
Detailed Findings: Detailed Exploration into the American Company in Today’s Economic
Climate and the Employers’:
• Economic Expectations 17
• Perceptions of the Relative Importance of Various Employee Benefits 22
• Benefit Offerings, including Non-Retirement Benefits 31
• Perceptions and Management of Current Retirement Plan Offerings 74
• Perceptions of Employee Involvement with Retirement Planning 116
Appendix 144
Table of Contents
2

© Transamerica Center for Retirement Studies, 2011
• About The Center
• About the Survey
• Methodology
• Terminology
• Company Profile
Introduction to the Retirement Study: Employer Perspective
3

© Transamerica Center for Retirement Studies, 2011
• The Transamerica Center for Retirement Studies® (“The Center”) is a non-profit private foundation dedicated to educating the public on emerging trends surrounding retirement security in the United States. The Center’s research emphasizes employer-sponsored retirement plans, issues faced by small to mid-sized companies and their employees, and the implications of legislative and regulatory changes.
• The Center is funded by contributions from Transamerica Life Insurance Company and its affiliates and may receive funds from unaffiliated third-parties. For more information about The Center, please refer to www.transamericacenter.org.
• The Center and its representatives cannot give ERISA, tax or legal advice. This material is provided for informational purposes only and should not be construed as ERISA, tax or legal advice. Interested parties must consult and rely solely upon their own independent advisors regarding their particular situation and the concepts presented here.
• Although care has been taken in preparing this material and presenting it accurately, The Center disclaims any express or implied warranty as to the accuracy of any material contained herein and any liability with respect to it.
About The Center
4

© Transamerica Center for Retirement Studies, 2011
• Since 1999, the Transamerica Center for Retirement Studies® has conducted a national survey of U.S. business employers and workers regarding their attitudes toward retirement. The overall goals for the study are to illuminate emerging trends, promote awareness, and help educate the public.
• Harris Interactive was commissioned to conduct the Twelfth Annual Retirement Survey for Transamerica Center for Retirement Studies®. Transamerica Center for Retirement Studies® is not affiliated with Harris Interactive.
About The Survey
5

© Transamerica Center for Retirement Studies, 2011
• A telephone survey was conducted among a nationally representative sample of 743 employers. Potential respondents were targeted based on job title at for-profit companies and met the following criteria:
– Business executives who make decisions about employee benefits at his or her company
– Employ 10 employees or more across all locations
• 17-minute telephone interviews were conducted between January 28, 2011 and February 25, 2011.
• Quotas were set for large and small companies and results were weighted as needed on employee size using weighting targets from the Dun & Bradstreet database to ensure each quota group had a representative sample based on the number of companies in each employee size range. A full methodology is available.
• Percentages were rounded to the nearest whole percent. Differences in the sums of combined categories/answers are due to rounding.
• Significance was tested at 95% confidence and has been indicated throughout the report in the following ways:
– Significance between sub-groups is identified by the letters A, B, C, D, etc. next to the significantly higher number for that corresponding sub-group.
– Significance between 11th Annual (2009/10 data) and 12th Annual surveys (2011 data) has been indicated as follows:
= 12th annual result is significantly higher than the result from the 11th annual survey
= 12th annual result is significantly lower than the result from the 11th annual survey
• The base size was 299 for large companies and 444 for small companies. Other reduced bases have been noted throughout the report.
Methodology
6

© Transamerica Center for Retirement Studies, 2011
This report uses the following terminology:
• Small company: 10 to 499 employees
• Large company: 500 or more employees
Terminology
7

© Transamerica Center for Retirement Studies, 2011
Profile of CompaniesN=743
Revenue
Less than $500,000 3%
$500,000 to $999,999 6%
$1 million to less than $5 million 26%
$5 million to less than $10 million 8%
$10 million to less than $50 million 10%
$50 million to less than $200 million 3%
$200 million to less than $500 million 1%
$500 million to less than $1 billion 1%
$1 billion or more 1%
DK/Refused 40%
MEAN (in millions) $59.7
MEDIAN (in millions) $2.5
Number of Full-time Employees
10-499 NET 89%
10 to 24 57%
25 to 99 26%
100 to 499 7%
500+ NET 11%
500 to 999 4%
Over 1,000 7%
MEAN 142.7
MEDIAN 16.2
N=743
Title (mentions 1% or greater are shown)
GENERAL (NET) 50%
Office Manager 8%
Controller 7%
Vice President 5%
President 4%
Owner 3%
Accountant/Accounts Manager 3%
Operations Manager 2%
Manager 2%
Business Manager 2%
CEO/Chairman 2%
General manager 1%
Executive Assistant 1%
Secretary 1%
CFO 1%
Administrator/Administrative Manager 1%
Other Vice President mentions 3%
All other director mentions 2%
All other manager mentions 1%
HUMAN RESOURCE (NET) 46%
Director of HR 19%
Human Resources Manager 8%
Benefits Manager 8%
Vice President of Human Resources 2%
HR assistant 1%
HR officer 1%
Human Resource 1%
Benefits Analyst/Specialist 1%
Other Human Resource mentions 4%
OTHER 4%
N=743
Industry (mentions 1% or greater are shown)
Manufacturing 25%
Professional services including finance, legal, engineering, and healthcare
24%
Service industries such as retail trade, hospitality, or administration
12%
Agriculture, mining or construction 11%
Transportation, communications, or utilities
7%
Wholesale distribution 3%
Non profit organization 2%
Education 2%
Software company 2%
Property/Housing/Real estate 2%
Government agency 1%
Distributor 1%
Printing/Publishing (newspaper, etc.) 1%
Insurance 1%
Technology 1%
Marketing 1%
Some Other business 2%
Geography
East 17%
Midwest 36%
South 28%
West 19%
8

© Transamerica Center for Retirement Studies, 2011
Executive Summary
9
© Transamerica Center for Retirement Studies, 2011
The 12th Annual Transamerica Retirement survey found that employers in the U.S. are beginning to show renewed signs of confidence in both the economy and their companies’ financial outlook. Fewer employers reported downsizing and layoffs in the last year – and more reported positive signs of growth including hiring additional employees. These positive indicators also translated into an increase in employers enhancing their retirement benefits as well as reinstating benefits (e.g., 401(k) matching contributions) that had been suspended since the recession began.
Importance and Offering of Employee Benefits
• Most employers (85 percent) believe that 401(k) or similar retirement plans are important for attracting and retaining employees.
• The majority of employers continue to believe their employees view health insurance (99 percent) and 401(k)s or other employee self-funded plans (85 percent) as important benefits.
• 78 percent of employers offer a 401(k) or similar plan. Plan sponsorship rates are higher for large companies (94 percent) than small companies (76 percent).
• Of those employers who do not offer a 401(k) or similar plan:
– The most frequently cited reason was “encountering difficult business conditions” (47 percent).
– Only 20 percent indicated that they are likely to offer a plan in the next two years; however, 33 percent said they would be likely to consider joining a multiple employer plan that is offered by “a reputable vendor who handles many of the fiduciary and administrative duties at a reasonable cost.”
• Employers believe their employees view company-funded defined benefit plans as important (65 percent); however, only 20 percent of employers offer one.
Executive Summary
10

© Transamerica Center for Retirement Studies, 2011
Importance and Offering of Employee Benefits (Continued)
• The percentage of employers offering matching contributions is consistent with the previous year’s survey. The survey found an encouraging sign in that half (51 percent) of companies that recently decreased or suspended the match plan to reinstate it within the next two years.
• For those companies that offer a 401(k) plan, only about a quarter (22 percent) automatically enroll new employees in the plan. Large companies are much more likely (46 percent) to automatically enroll new employees than small companies (19 percent). For those that do not have automatic enrollment, high participation rate and employee choice are both cited as reasons not to auto enroll in the future.
• Most employers (84 percent) report their default investment option satisfies their QDIA requirement.
• Enhanced offerings like Roth 401(k)s saw a significant increase to 31 percent in adoption compared to last year (24 percent). However, this adoption rate may be close to saturation as only 4 percent of companies that don’t offer it plan to do so in the future. Many employers cite lack of interest (33 percent) as the number one reason for not adopting.
• Only two-thirds (65 percent) of companies that provide an employee-funded retirement plan also offer investment guidance or advice to their employees. Of the third that don’t offer advice, 10 percent plan to in the future. Of those with no plans to offer, many cite potential liability (42 percent) as the reason.
Executive Summary
11

© Transamerica Center for Retirement Studies, 2011
Perceptions and Management of Current Retirement Plan Offerings
• Since the recession began, relatively few employers (15 percent) indicated they or their retirement plan provider have done anything to help their employees get back on track with their retirement savings. Large companies were more likely to have done so (34 percent) than small companies (13 percent).
• The majority of companies offering 401(k) or similar plans offer education and/or advice about the retirement savings plan.
– Typically they offer: on-line tools and resources (78 percent), printed brochures and flyers (63 percent), one-on-one counseling (62 percent), group meetings (60 percent) and informative emails (46 percent).
– In most cases, large companies were more likely to offer these resources than small companies.
• The majority of employers who offer a 401(k) or similar plan help employees transition to retirement in some way.
– Employers most often: provide information about distribution options (77 percent), allow terminated participants to leave their balances in the plan (76 percent), distribute retirement planning materials (56 percent), and allow systematic withdrawals by participants (51 percent).
– A minority of employers offer: financial counseling (43 percent), an income annuity as a payout option in the retirement plan (21 percent), or pre-retirement seminars (19 percent).
– Large companies are more likely to offer assistance than small ones.
• Of those employers who do not offer a 401(k) or similar plan, three out of four (78 percent) said they do “nothing” to help their employees transition to retirement.
Executive Summary
12

© Transamerica Center for Retirement Studies, 2011
Perceptions and Management of Current Retirement Plan Offerings (Continued)
• Almost all (95 percent) employers believe their employees are satisfied with the retirement plan offered and the quality of the investment options within the retirement plan (96 percent).
– Among employers who offer self-funded plans, the majority (70 percent) feel their employees have enough investment options in their retirement plan.
– Two-thirds (67 percent) of employers who offer self-funded plans feel their employees do not need to receive any more information from the plan provider about fees and expenses.
• Additionally, most employers (78 percent) made no changes to the 401(k) in the previous year, nor do they plan to make changes in the coming year (84 percent).
– Significantly less employers made a change to their 401(k) plan in 2011 compared to 2009/10.
– More small companies that made changes to their plans added a managed account this year and increased the match.
• Overall, only about one in ten companies (9 percent) who offer a 401(k) or other self-funded plan are considering changing the plan in the next year.
– However, large companies (19 percent) are more likely than small companies (8 percent) to consider making changes in the next twelve months.
• Most companies (65 percent) are aware of the Department of Labor’s new fee disclosure regulations and of those companies that are aware, over half (55 percent) say they will reevaluate their retirement plan’s fees and expenses when the regulations go into effect.
Executive Summary
13

© Transamerica Center for Retirement Studies, 2011
Perceptions and Management of Current Retirement Plan Offerings (Continued)
• Similar to previous years, about two-thirds (65 percent) of employers offering a self-funded plan use an outside advisor, but since 2006, the level of employers using one has slowly declined from 74 percent.
– Financial planners/brokers are the most frequently used type of financial advisor.
– There is no clear consensus on who should be held accountable for selecting and monitoring plan fees and plan options, but the plan provider/administrator and plan sponsor are the two most popular options for each responsibility respectively.
Executive Summary
14

© Transamerica Center for Retirement Studies, 2011
Perceptions of Employee Involvement with Retirement Planning
• Over the last three years, there has been a gradual decline in employers that believe employees could work until age 65 and still not save enough to meet their retirement needs, from a high of 80 percent in 2008/09 to 70 percent in 2011.
• Many employers (82 percent) feel their employees do not know as much as they should about retirement investing, but surprisingly most (68 percent) believe their employees will still be able to achieve a comfortable lifestyle in retirement.
– Large companies remained more critical of their employees with nine in ten (88 percent) believing their employees don’t know as much as they should about retirement investing compared with 81 percent of employers at smaller companies believing the same.
• About three-quarters (76 percent) of employers agree that most of their employees would prefer to rely on outside experts to monitor and manage their retirement savings and a similar amount of employers (70 percent) feel most employees prefer not to concern themselves with retirement investing until they get closer to their retirement date.
– This attitude is reflected by many employers (51 percent) believing most employees would not like to receive more information and advice from the company on how to reach one’s retirement goals.
– Employers at small companies are more likely to believe most of their employees would not like any more information on retirement (53 percent) compare to only 36 percent of large companies that say the same thing.
Executive Summary
15

© Transamerica Center for Retirement Studies, 2011
Perceptions of Employee Involvement with Retirement Planning (Continued)
• Over three-quarters (78 percent) of employers are likely to believe their employees have a clear understanding of the fees associated with participating in the retirement plan.
– Almost a third of small companies (31 percent) strongly agree their employees have a clear understanding of retirement fees, a significant increase over last year’s sentiment (19 percent) and a feeling that is shared by more small companies than large companies (19 percent).
• Similar to perceptions reported in 2007-2009, more employers (54 percent) believe their employees want a break-down of fees for services and investments.
– The popularity of a high level break-down was only significantly more popular this year among large companies. It was more likely that small companies believe their employees have no preference for how they receive fee information.
Executive Summary
16

© Transamerica Center for Retirement Studies, 2011
• Economic Expectations
• Perceptions of the Relative Importance of Various Employee Benefits
• Benefit Offerings, including Retirement Benefits
• Perceptions and Management of Current Retirement Plan Offerings
• Perceptions of Employee Involvement with Retirement Planning
Detailed Findings
17

© Transamerica Center for Retirement Studies, 2011
Employer Economic Expectations
BASE: TOTAL RESPONDENTSQ1400. In the next 12 months, do you expect the U.S. economy to:Q1405. In the next 12 months, do you expect your company’s financial situation to:
In the next 12 months, they expect the U.S. economy to: (%)
In the next 12 months, they expect their company’s financial situation to: (%)
18
■ Get Better■ Stay the Same■ Get Worse■ Not sure
Survey‘11 (N=743)
’09/’10 (N=601)’08/’09 (N=596)
• Employers continue to grow more optimistic about the U.S. economy.
• Employers also continue to grow more optimistic about their company’s financial
situation with three-fifths indicating their company’s financial situation will get
better in the next 12 months.
42 2
10
19
27
38
4332
4845
39
'11 '09/'10 '08/'09
1 1 2
7
13
2933
37
46
5949
23
'11 '09/'10 '08/'09

© Transamerica Center for Retirement Studies, 2011
Total Small Companies Large Companies(A) (B)
Frozen salaries
Layoffs or downsizing
Eliminated bonuses
Reduced or eliminated non-retirement benefits
Reduced or eliminated retirement benefits
None of the above
Negative Measures in Last 12 Months
BASE: TOTAL RESPONDENTS Total : ’08/’09 (N=596), ’09/’10 (N=601), ‘11 (N=743) Small Companies: ’08/’09 (N=296), ’09/’10 (N=300), ‘11 (N=444); Large Companies: ’08/’09 (N=300), ’09/’10 (N=301), ‘11 (N=299)Q1410. Has your company implemented any of the following measures in the last 12 months? Choose ALL that apply.
19
• There is an overall significant decline in cost-reducing measures employers have enacted
in the past 12 months.
• However, large companies performed more layoff /downsizing and reducing/eliminating
non-retirement benefits than smaller companies.
23
39
20
10
8
51
54
48
37
15
15
32
35
33
22
12
10
48
'11'09/'…'08/'…
'11'09/'…'08/'…
'11'09/'…'08/'…
'11'09/'…'08/'…
'11'09/'…'08/'…
'11'09/'…'08/'…
22
37
21
9
8
52
53
46
37
15
14
33
35
32
22
11
9
49
'11'09/'…'08/'…
'11'09/'…'08/'…
'11'09/'…'08/'…
'11'09/'…'08/'…
'11'09/'…'08/'…
'11'09/'…'08/'…
25
47
19
12
9
41
60
61
41
15
19
23
36
40
22
17
13
39
'11'09/'…'08/'…
'11'09/'…'08/'…
'11'09/'…'08/'…
'11'09/'…'08/'…
'11'09/'…'08/'…
'11'09/'…'08/'…
A
B
A
A
B

© Transamerica Center for Retirement Studies, 2011
Total Small Companies Large Companies(A) (B)
Hired additional employees
Increased salaries
Added or increased bonuses
Added or enhanced retirement benefits
Added or enhancednon-retirement benefits
None of the above
54
40
9
6
15
32
69
64
18
11
16
16
'11
'09/'…
'11
'09/'…
'11
'09/'…
'11
'09/'…
'11
'09/'…
'11
'09/'…
Positive Measures in Last 12 Months
BASE: TOTAL RESPONDENTS Total : ’09/’10 (N=601), ‘11 (N=743) Small Companies: ’09/’10 (N=300), ‘11 (N=444); Large Companies: ’09/’10 (N=301), ‘11 (N=299)NEW QUESTION IN WAVE 11: Q1411. Has your company implemented any of the following positive measures over the last 12 months?
20
• In addition to fewer cost-cutting measures, employers report higher levels of positive
staffing actions in the past 12 months.
• More than half report hiring and increasing salaries.
• Large companies are more likely to have hired workers, increased salaries, and added or
enhanced non-retirement benefits.
37
40
9
2
8
41
54
54
23
7
7
29
'11
'09/'…
'11
'09/'…
'11
'09/'…
'11
'09/'…
'11
'09/'…
'11
'09/'…
39
40
9
3
9
40
55
55
23
8
7
27
'11
'09/'…
'11
'09/'…
'11
'09/'…
'11
'09/'…
'11
'09/'…
'11
'09/'…
A
A
A
A
A
B

© Transamerica Center for Retirement Studies, 2011
Negative Measures Positive Measures
Frozen salaries Increased salaries
Layoffs or downsizing Hired additional employees
Eliminated bonuses Added or increased bonuses
Reduced or eliminated retirement benefits
Added or enhanced retirement benefits
Reduced or eliminated non-retirement benefits
Added or enhanced non-retirement benefits
None of the above None of the above
40
39
9
3
9
40
55
55
23
8
7
27
'11
'09/'10
'11
'09/'10
'11
'09/'10
'11
'09/'10
'11
'09/'10
'11
'09/'10
54
48
37
15
15
32
35
33
22
12
10
48
'11
'09/'10
'11
'09/'10
'11
'09/'10
'11
'09/'10
'11
'09/'10
'11
'09/'10
Negative vs. Positive Measures in Last 12 Months
21
• The situation is looking more positive with higher positive measures regarding
salaries, headcount, and bonuses.
• Close to half of employers indicated that they did not implement any cost reduction
measures in the past 12 months.
BASE: TOTAL RESPONDENTS Total : ’09/’10 (N=601), ‘11 (N=743) Q1410. Has your company implemented any of the following measures in the last 12 months? Choose ALL that apply.Q1411. Has your company implemented any of the following positive measures over the last 12 months?

© Transamerica Center for Retirement Studies, 2011
• Economic Expectations
• Perceptions of the Relative Importance of Various Employee Benefits
• Benefit Offerings, including Retirement Benefits
• Perceptions and Management of Current Retirement Plan Offerings
• Perceptions of Employee Involvement with Retirement Planning
Detailed Findings
22

© Transamerica Center for Retirement Studies, 2011
◄ NOT IMPORTANT IMPORTANT ►
Not sure/Refused
Health Insurance 0%
401(k) or Other Employee Self-Funded Plans 2%
Disability Insurance 1%
Life Insurance1%
Company-funded Defined Benefit Pension Plan 7%
Long-term Care Insurance 4%
1
8
14
15
16
37
4
5
4
12
19
1%
12%
19%
19%
28%
9
25
49
47
29
34
90
60
31
33
36
6
99%
85%
80%
79%
65%
40%
Not too important Not at all important Somewhat important Very important
Employee Benefits: Importance
BASE: TOTAL RESPONDENTS (N=743)Q520 Do you think your company’s employees see this benefit as very important, somewhat important, not too important, or not at all important?
23
• Employers believe a 401(k) or other employee-funded plan is the second most
important benefit to employees after health insurance.
• More than half of employers believe defined benefit plans are important to
employees and slightly more than a third indicate they are very important to
employees.
56%
© Transamerica Center for Retirement Studies, 2011
Small Companies Large Companies(A) (B)
Disability Insurance
Life Insurance
401(k) or Other Employee Self-Funded Plans
Long-term Care Insurance
Company-funded Defined Benefit Pension Plan
Health Insurance
73
76
78
33
63
99
74
77
80
36
57
98
78
77
84
40
64
99
'11'09/'…'08/'…
'11'09/'…'08/'…
'11'09/'…'08/'…
'11'09/'…'08/'…
'11'09/'…'08/'…
'11'09/'…'08/'…
97
98
96
43
65
100
95
97
95
40
72
100
95
98
96
39
70
100
'11'09/'…'08/'…
'11'09/'…'08/'…
'11'09/'…'08/'…
'11'09/'…'08/'…
'11'09/'…'08/'…
'11'09/'…'08/'…
Employee Benefits: Importance
BASE: TOTAL RESPONDENTS; Small Companies: ’08/’09 (N=296), ’09/’10 (N=300), ‘11 (N=444); Large Companies: ’08/’09 (N=300), ’09/’10 (N=301), ‘11 (N=299)Q520 Do you think your company’s employees see this benefit as very important, somewhat important, not too important, or not at all important?
Top 2 Box Importance (Very/Somewhat) (%)
AAA
24
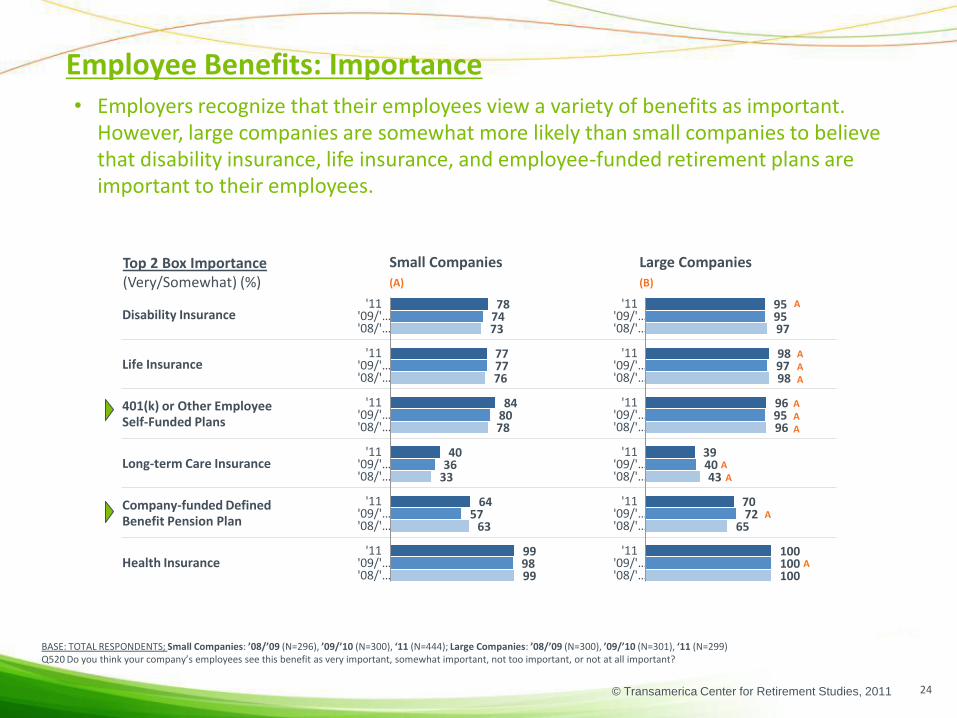
• Employers recognize that their employees view a variety of benefits as important. However, large companies are somewhat more likely than small companies to believe that disability insurance, life insurance, and employee-funded retirement plans are important to their employees.
AAA
AA
A
A
A

© Transamerica Center for Retirement Studies, 2011
◄ NOT IMPORTANT IMPORTANT ►
Not sure/Refused
2011 (N=743) 0%
2009/10 (N=601) 0%
2008/09 (N=596) 0%
2007 (N=652) 0%
2006 (N=659) 2%
2005 (N=597) 0%
Importance of Health Insurance
BASE: TOTAL RESPONDENTSQ520 Do you think your company’s employees see this benefit as very important, somewhat important, not too important, or not at all important?
25
• The vast majority of employers consider health insurance to be viewed as a “very
important” benefit by their employees.
1
1
2
1
1
1
1
1
1
1
1%
2%
1%
3%
2%
1%
9
6
7
6
6
7
90
92
92
91
90
92
99%
98%
99%
97%
97%
99%
Not at all important Not too important Somewhat important Very important

© Transamerica Center for Retirement Studies, 2011
Small Companies Large Companies
(A) (B)
Very important
Somewhat important
Not too important
Not at all important
Importance of Health Insurance
BASE: TOTAL RESPONDENTS Small Companies: ‘07 (N= 369) ’08/’09 (N=296), ’09/’10 (N=300), ‘11 (N=444); Large Companies: ‘07 (N=283) ’08/’09 (N=300), ’09/’10 (N=301), ‘11 (N=299)Q520 Do you think your company’s employees see this benefit as very important, somewhat important, not too important, or not at all important?
26
• Although large and small companies believe health insurance is an important
benefit, large companies are more likely to believe it is a very important benefit.
100
0
0
0
98
1
0
0
97
3
0
0
99
1
<1
0
'11'09/'10'08/'09
'07
'11'09/'10'08/'09
'07
'11'09/'10'08/'09
'07
'11'09/'10'08/'09
'07
90
7
3
1
91
8
1
0
91
6
2
1
90
10
<1
1
'11'09/'…'08/'…
'07
'11'09/'…'08/'…
'07
'11'09/'…'08/'…
'07
'11'09/'…'08/'…
'07
‘11: 99%‘09/’10: 98%‘08/’09: 99%
‘07: 96%
‘11: 1%‘09/’10: 2% ‘08/’09: 1%
‘07: 4%
’11: 100%‘09/’10: 100%‘08/’09: 100%
‘07: 100% A
’11: 0%‘09/’10: 0%‘08/’09: 0%
‘07: 0%
Not Important
Important
Not Important
Important
B
A
AA
BB
A
B
© Transamerica Center for Retirement Studies, 2011
◄ NOT IMPORTANT IMPORTANT ►
Not sure/Refused
2011 (N=743) 2%
2009/10 (N=601) <1%
2008/09 (N=596) 2%
2007 (N=652) <1%
2006 (N=659) 2%
2005 (N=597) <1%
Importance of 401(k) or Other Employee Self-Funded Plans
BASE: TOTAL RESPONDENTSQ520 Do you think your company’s employees see this benefit as very important, somewhat important, not too important, or not at all important?
8
12
12
11
9
7
4
6
6
6
4
8
12%
18%
17%
17%
13%
15%
25
23
28
26
29
25
60
59
52
56
56
61
85%
82%
81%
82%
85%
85%
Not at all important Not too important Somewhat important Very important
27
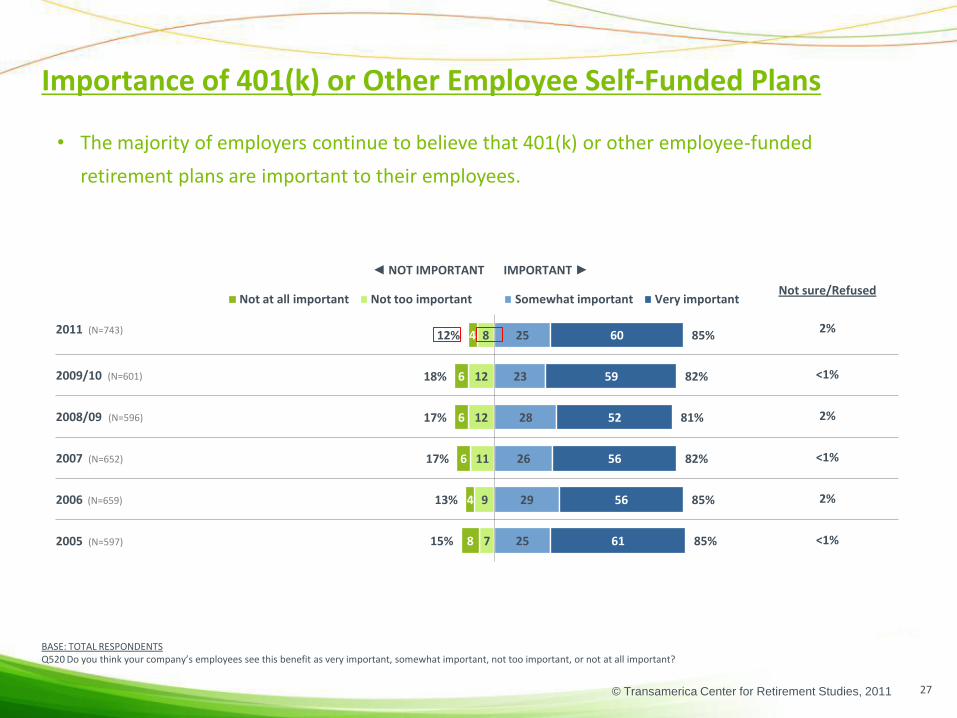
• The majority of employers continue to believe that 401(k) or other employee-funded
retirement plans are important to their employees.

© Transamerica Center for Retirement Studies, 2011
Small Companies Large Companies
(A) (B)
Very important
Somewhat important
Not too important
Not at all important
Not sure/Refused
74
23
2
0
1
71
25
2
1
1
74
21
2
1
1
71
24
3
1
1
'11'09/'…'08/'…
'07
'11'09/'…'08/'…
'07
'11'09/'…'08/'…
'07
'11'09/'…'08/'…
'07
'11'09/'…'08/'…
'07
54
27
12
7
0
49
29
13
7
2
57
23
13
7
0
59
25
9
5
2
'11'09/'…'08/'…
'07
'11'09/'…'08/'…
'07
'11'09/'…'08/'…
'07
'11'09/'…'08/'…
'07
'11'09/'…'08/'…
'07
Importance of 401(k) or Other Employee Self-Funded Plans
BASE: TOTAL RESPONDENTS: Small Companies: ‘07 (N= 369) ’08/’09 (N=296), ’09/’10 (N=300), ‘11 (N=444); Large Companies: ‘07 (N=283) ’08/’09 (N=300), ’09/’10 (N=301), ‘11 (N=299)Q520 Do you think your company’s employees see this benefit as very important, somewhat important, not too important, or not at all important?
‘11: 84%‘09/’10: 80%‘08/’09: 78%
‘07: 80%
‘11: 14% B‘09/’10: 20% B‘08/’09: 20% B
‘07: 19% B
’11: 96% A‘09/’10: 95% A‘08/’09: 96% A
‘07: 97% A
’11: 3%‘09/’10: 3%‘08/’09: 3%
‘07: 2%
28
• Large companies continue to be more likely than small companies to think employee
self-funded plans are important to their employees.
Not Important
Important
BBBB
BBBB
AAA
Not Important
Important A

© Transamerica Center for Retirement Studies, 2011
◄ NOT IMPORTANT IMPORTANT ►
Not sure/Refused
2011 (N=743) 7%
2009/10 (N=601) 8%
2008/09 (N=596) 10%
2007 (N=652) 4%
2006 (N=659) 4%
2005 (N=597) 4%
Importance of Company-Funded Defined Benefit Pension Plan
BASE: TOTAL RESPONDENTSQ520 Do you think your company’s employees see this benefit as very important, somewhat important, not too important, or not at all important?
29
• Importance of a company-funded defined benefit pension plan has risen significantly
over last year back to levels seen in 2008/09.
16
18
16
19
14
11
12
16
11
12
10
19
28%
34%
27%
30%
24%
30%
29
25
33
30
34
27
36
33
31
36
38
39
65%
58%
63%
66%
72%
66%
Not too important Not at all important Somewhat important Very important

© Transamerica Center for Retirement Studies, 2011
BASE: TOTAL RESPONDENTS Small Companies: ‘07 (N= 369) ’08/’09 (N=296), ’09/’10 (N=300), ‘11 (N=444); Large Companies: ‘07 (N=283) ’08/’09 (N=300), ’09/’10 (N=301), ‘11 (N=299)Q520 Do you think your company’s employees see this benefit as very important, somewhat important, not too important, or not at all important?
30
• Large companies tend to be more likely than small companies to believe defined
benefit plans are very important to their employees.
Small Companies Large Companies
(A) (B)
Very important
Somewhat important
Not too important
Not at all important
Not sure/Refused
47
27
12
10
4
38
27
11
10
14
45
28
14
7
8
44
26
14
9
7
'11'09/'10'08/'09
'07
'11'09/'10'08/'09
'07
'11'09/'10'08/'09
'07
'11'09/'10'08/'09
'07
'11'09/'10'08/'09
'07
34
30
19
12
4
30
34
16
12
9
32
25
19
17
8
35
29
16
13
7
'11'09/'10'08/'09
'07
'11'09/'10'08/'09
'07
'11'09/'10'08/'09
'07
'11'09/'10'08/'09
'07
'11'09/'10'08/'09
'07
‘11: 64%‘09/’10: 57%‘08/’09: 63%
‘07: 65%
‘11: 29%‘09/’10: 35% B‘08/’09: 28%
‘07: 31%
’11: 70%‘09/’10: 72% A‘08/’09: 65%
‘07: 74% A
’11: 23%‘09/’10: 21%‘08/’09: 21%
‘07: 23%
Not Important
Important
Not Important
Important
B
Importance of Company-Funded Defined Benefit Pension Plan
A
A
A

© Transamerica Center for Retirement Studies, 2011
• Economic Expectations
• Perceptions of the Relative Importance of Various Employee Benefit
• Benefit Offerings, including Non-Retirement Benefits
• Perceptions and Management of Current Retirement Plan Offerings
• Perceptions of Employee Involvement with Retirement Planning
Detailed Findings
31

© Transamerica Center for Retirement Studies, 2011
2011 2009/10 2008/09 2007(N=743) (N=601) (N=596) (N=652)
Health Insurance
Life Insurance
Disability Insurance
Long-Term Care Insurance
None of these
Not sure/Refused
Benefit Offerings: Health & Voluntary Benefits
BASE: TOTAL RESPONDENTSQ1021. Now we would like to ask you what benefits your company currently offers to its employees. Does you company currently offer…? CHOOSE ALL THAT APPLY.
94
75
69
22
4
0
97
79
69
22
3
0
97
85
74
20
3
0
32
• The vast majority of employers offer health insurance. This year’s survey found a decrease in
the number of employers offering life insurance; however, the percentage reported is
consistent with years prior to 2009/2010.
96
78
70
18
3
0

© Transamerica Center for Retirement Studies, 2011
Benefit Offerings: Health & Voluntary Benefits
BASE: TOTAL RESPONDENTS Small Companies: ‘07 (N= 369) ’08/’09 (N=296), ’09/’10 (N=300), ‘11 (N=444); Large Companies: ‘07 (N=283) ’08/’09 (N=300), ’09/’10 (N=301), ‘11 (N=299)Q1021. Now we would like to ask you what benefits your company currently offers to its employees. Does you company currently offer…? CHOOSE ALL THAT APPLY.
Small Companies Large Companies
(A) (B)
Health Insurance
Life Insurance
Disability Insurance
Long-Term Care Insurance
None of these
Not sure/Refused
33
• Large companies are more likely than small companies to offer non-retirement
benefits to their employees.
100
100
97
37
0
0
100
100
97
32
0
0
100
100
98
37
0
0
100
99
96
31
0
0
'11'09/'10'08/'09
'07
'11'09/'10'08/'09
'07
'11'09/'10'08/'09
'07
'11'09/'10'08/'09
'07
'11'09/'10'08/'09
'07
'11'09/'10'08/'09
'07
93
72
66
20
4
<1
96
76
65
20
4
0
97
83
71
18
3
0
95
76
67
16
4
0
'11'09/'10'08/'09
'07
'11'09/'10'08/'09
'07
'11'09/'10'08/'09
'07
'11'09/'10'08/'09
'07
'11'09/'10'08/'09
'07
'11'09/'10'08/'09
'07
AA
AAA
AAA
BB
A
AA
A
A
A
A
B
© Transamerica Center for Retirement Studies, 2011
2011 2009/10 2008/09 2007 2006(N=743) (N=601) (N=596) (N=652) (N=659)
Employee-funded 401(k) plan
Company-funded defined benefit pension plan
Other employee self-funded plan, such as SIMPLE, SEP, or other plans not 401(k)s
Separate retirement program for select executives or senior management
Not sure/Refused
None of these
69
20
15
9
<1
17
Benefit Offerings: Retirement Plans
BASE: TOTAL RESPONDENTS Q530. Which of the following retirement benefits does your company offer? CHOOSE ALL THAT APPLY.
34
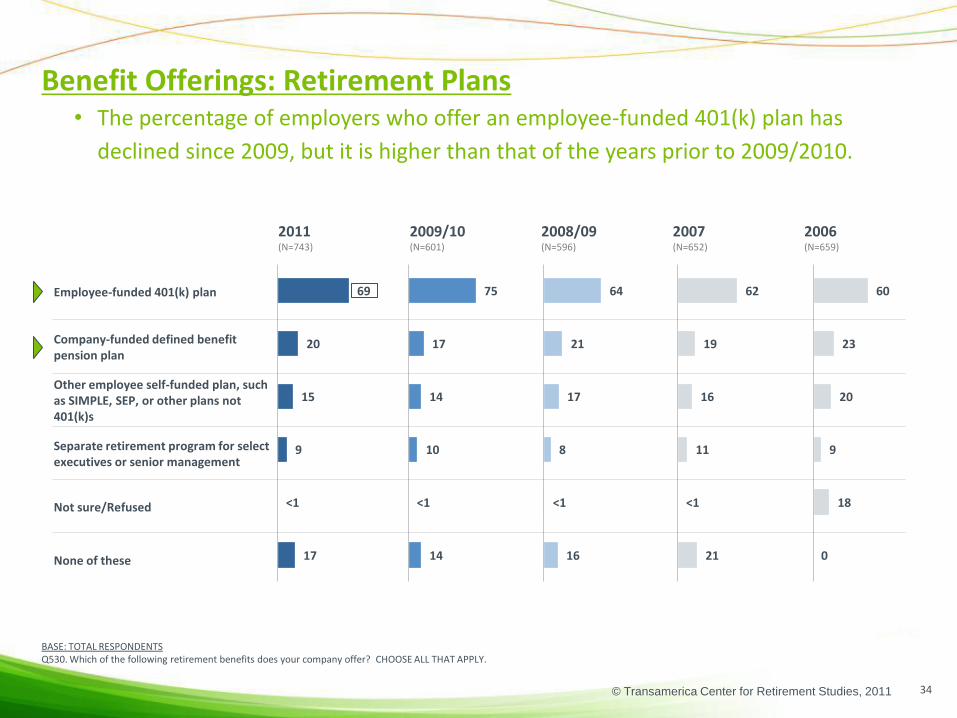
• The percentage of employers who offer an employee-funded 401(k) plan has
declined since 2009, but it is higher than that of the years prior to 2009/2010.
62
19
16
11
<1
21
64
21
17
8
<1
16
75
17
14
10
<1
14
60
23
20
9
18
0

© Transamerica Center for Retirement Studies, 2011
Small Companies Large Companies(A) (B)
Employee-funded 401(k) plan
Company-funded defined benefit pension plan
Other employee self-funded plan, such asSIMPLE, SEP, or other plans not 401(k)s
Separate retirement program for selectexecutives or senior management
Not sure/Refused
None of these
59
17
15
9
<1
23
60
19
17
4
0
18
74
14
13
7
<1
15
67
18
14
6
0
19
'11'09/'…'08/'…
'07
'11'09/'…'08/'…
'07
'11'09/'…'08/'…
'07
'11'09/'…'08/'…
'07
'11'09/'…'08/'…
'07
'11'09/'…'08/'…
'07
Benefit Offerings: Retirement Plans
BASE: TOTAL RESPONDENTS BASE: Small Companies: ‘07 (N= 369) ’08/’09 (N=296), ’09/’10 (N=300), ‘11 (N=444);Large Companies: ‘07 (N=283) ’08/’09 (N=300), ’09/’10 (N=301), ‘11 (N=299)Q530. Which of the following retirement benefits does your company offer? CHOOSE ALL THAT APPLY.
AAA
35
• The percentage of small companies that offer a 401(k) plan has decreased from 2009
but remains higher than levels reported in 2007 and 2008.
• In contrast, the percentage of large companies that offer a 401(k) plan remains
steady.
82
39
19
29
0
3
83
35
16
34
0
3
84
40
21
34
0
2
83
38
21
31
<1
1
'11'09/'…'08/'…
'07
'11'09/'…'08/'…
'07
'11'09/'…'08/'…
'07
'11'09/'…'08/'…
'07
'11'09/'…'08/'…
'07
'11'09/'…'08/'…
'07
A
AA
A
BB
B
AAA
A
A
A
A
B
© Transamerica Center for Retirement Studies, 2011
◄ NOT LIKELY LIKELY►
Not sure/Refused
2011 (N=98) 4%
2009/10 (N=68) 1%
2008/09 (N=70) 14%
2007 (N=85) 1%
2006 (N=86) 1%
2005 (N=67) 4%
34
13
16
27
23
15
41
74
43
48
49
60
14
9
21
19
23
14
7
3
5
5
4
8
20%
12%
26%
24%
27%
22%
Not at all likely Not too likely Somewhat likely Very likely
75%
87%
75%
72%
74%
59%
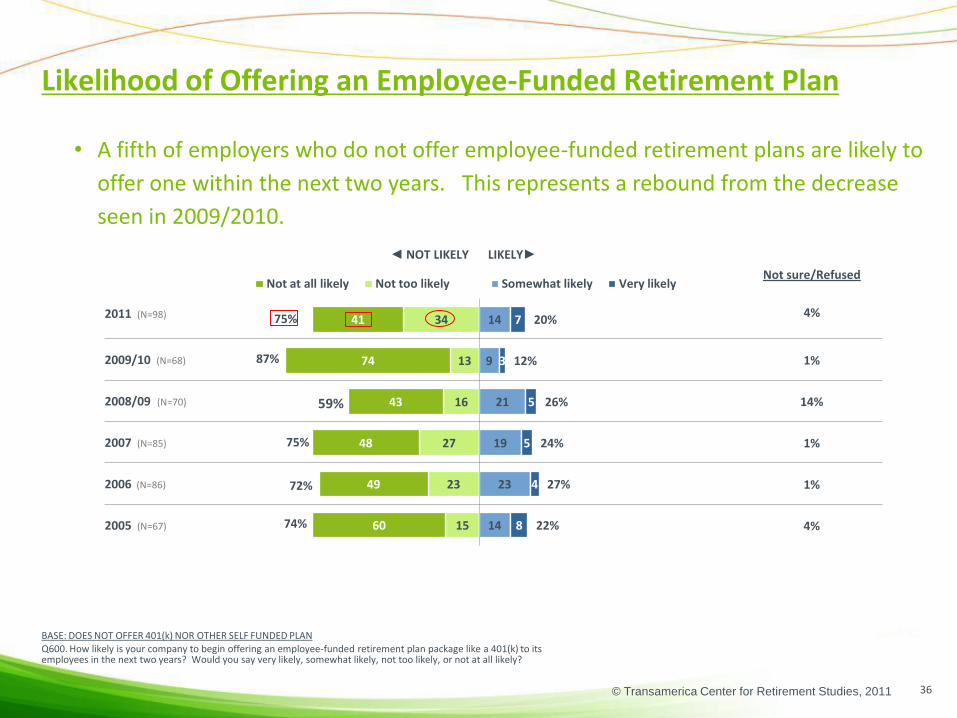
Likelihood of Offering an Employee-Funded Retirement Plan
BASE: DOES NOT OFFER 401(k) NOR OTHER SELF FUNDED PLAN Q600. How likely is your company to begin offering an employee-funded retirement plan package like a 401(k) to its employees in the next two years? Would you say very likely, somewhat likely, not too likely, or not at all likely?
36
• A fifth of employers who do not offer employee-funded retirement plans are likely to
offer one within the next two years. This represents a rebound from the decrease
seen in 2009/2010.

© Transamerica Center for Retirement Studies, 2011
Likelihood of Offering an Employee-Funded Retirement Plan
37
*Small base size BASE: DOES NOT OFFER 401(k) NOR OTHER SELF FUNDED PLAN Small Companies: ‘07 (N= 65*) ’08/’09 (N=48*), ’09/’10 (N=44*), ‘11 (N=80*);Large Companies: ‘07 (N=20*) ’08/’09 (N=22*), ’09/’10 (N=24*), ‘11 (N=18*)
Q600. How likely is your company to begin offering an employee-funded retirement plan package like a 401(k) to its employees in the next two years? Would you say very likely, somewhat likely, not too likely, or not at all likely?
Small Companies Large Companies
(A) (B)
Very likely
Somewhat likely
Not too likely
Not at all likely
Not sure/Refused
• Of those companies that do not offer a 401(k) or similar plan, small companies are
more likely than large ones to begin offering a plan in the next two years.
10
20
25
40
5
29
8
8
42
16
25
8
9
49
9
0
6
17
61
11
'11'09/'…'08/'…
'07
'11'09/'…'08/'…
'07
'11'09/'…'08/'…
'07
'11'09/'…'08/'…
'07
'11'09/'…'08/'…
'07
5
19
27
48
1
4
21
17
43
15
2
9
13
75
0
7
14
35
41
2
'11'09/'…'08/'…
'07
'11'09/'…'08/'…
'07
'11'09/'…'08/'…
'07
'11'09/'…'08/'…
'07
'11'09/'…'08/'…
'07
‘11: 21%‘09/’10: 11%‘08/’09: 26%
‘07: 24%
‘11: 75%‘09/’10: 89%‘08/’09: 60%
‘07: 75%
’11: 6%‘09/’10: 33%‘08/’09: 37%
‘07: 30%
’11: 78%‘09/’10: 58%‘08/’09: 50%
‘07: 65%
Not Likely
Likely
Not Likely
Likely

© Transamerica Center for Retirement Studies, 2011
Reasons Not Likely to Offer Employee-Funded Plan
38
BASE: NOT LIKELY TO OFFER 401(k) IN NEXT 2 YEARSQ610. Why is your company not likely to offer a plan in the next two years? CHOOSE ALL THAT APPLY.
2011 2009/10 2008/09 2007(N=74) (N=50) (N=39) (N=59)
Company encountering difficult business conditions
Concerned about cost
Employees not interested
Company or management not interested
Company is not big enough
Concerned about fiduciary liability
Concerned about administrative complexity and amount of work involved
Already have/satisfied with current plan
Work in a not for profit
Work for government
Some other reason
• Companies chose many more reasons for why they were not likely to offer an
employee fund when compared to previous years with difficult business conditions
becoming the most common reason this year.
10
48
31
28
21
1
9
4
24
28
13
47
21
3
11
35
12
5
31
33
24
31
24
1
1
28
8
2
1
47
43
43
39
37
24
22
18
11
0
_
_
_
_
_

© Transamerica Center for Retirement Studies, 2011
Total Small Companies Large Companies
(A) (B)
Very likely
Somewhat likely
Not too likely
Not at all likely
Not sure/Refused
Likelihood of Considering a Multiple Employer Plan
39
Base: Does Not Offer 401(k) Nor Other Self Funded Plan Total ’11 (N=)98); Small Companies: ‘11 (N=80); Large Companies: ‘11 (N=18*)NEW QUESTION IN WAVE 12 Q1605. As an alternative to establishing a stand-alone 401(k) plan, if your company had the ability to join a multiple employer plan which is offered by a reputable vendor who handles many of the fiduciary and administrative duties and at a reasonable cost, how likely would you be to consider it?
• Of those small companies that do not offer a 401(k) or similar plan, one-third (34
percent) would be likely to consider joining a multiple employer plan.
8
25
30
34
3
'11
'11
'11
'11
'11
8
26
30
33
3
'11
'11
'11
'11
'11
0
6
17
78
0
'11
'11
'11
'11
'11
‘11: 64%
Not Likely
‘11: 33%
Likely
‘11: 63%
Not Likely
‘11: 34%
Likely
‘11: 94%
Not Likely
‘11: 6%
Likely

© Transamerica Center for Retirement Studies, 2011
Matching Contributions
BASE: OFFERS 401(k) PLAN OR OTHER SELF-FUNDED PLANQ640. Does your company offer a matching contribution as part of its 401(k) or other company-sponsored retirement plan?
40
• The proportion of employers offering a matching contribution is similar to last year.
This may signal a stabilization or bottoming out of the number of companies that do
not offer a matching contribution.
Not sure/Refused
2011 (N=645) 0%
2009/10 (N=533) 1%
2008/09 (N=526) 1%
2007 (N=567) 0%
2006 (N=573) <1%
2005 (N=530) <1%
29
30
24
20
20
28
70
69
76
80
80
72
No Yes

© Transamerica Center for Retirement Studies, 2011
Small Companies Large Companies
(A) (B)
Yes
No
Not sure/Refused
87
13
<1
78
22
1
79
21
0
79
21
0
'11
'09/'10
'08/'09
'07
'11
'09/'10
'08/'09
'07
'11
'09/'10
'08/'09
'07
79
21
0
75
24
1
68
31
1
69
31
0
'11
'09/'10
'08/'09
'07
'11
'09/'10
'08/'09
'07
'11
'09/'10
'08/'09
'07
Matching Contributions
41
BASE: OFFERS 401(k) PLAN OR OTHER SELF-FUNDED PLAN Small Companies: ‘07 (N= 304) ’08/’09 (N=248), ’09/’10 (N=256), ‘11 (N=364); Large Companies: ‘07 (N=263) ’08/’09 (N=278), ’09/’10 (N=277), ‘11 (N=281)Q640. Does your company offer a matching contribution as part of its 401(k) or other company-sponsored retirement plan?
• Large companies continue to be more likely than small companies to offer a
matching contribution.
B
A
A
B

© Transamerica Center for Retirement Studies, 2011
Total Small Companies Large Companies
(A) (B)
Yes, increased or started thematch
Yes, decreased the match
Yes, suspended the match
Yes, decreased or suspended and then later reinstated
No, never had a match
No, match stayed the same
Not sure/Refused
Changes to Matching Contribution
42
Base: Offers 401(k) or Other Self Funded Plan Total ’11 (N=645); Small Companies: ‘11 (N=364); Large Companies: ‘11 (N=281)NEW QUESTION IN WAVE 12 Q1610. Since the recession began in 2008, has your company made any of the following changes to the matching contribution?
• The majority of companies that have a 401(k) or other employee-funded plan did
not change the match since the recession began in 2008.
4
5
8
6
17
56
4
'11
'11
'11
'11
'11
'11
'11
4
6
8
5
18
55
4
'11
'11
'11
'11
'11
'11
'11
5
5
9
12
10
58
1
'11
'11
'11
'11
'11
'11
'11

© Transamerica Center for Retirement Studies, 2011
Small Companies Large Companies
(A) (B)
Yes
No
Not sure/Refused
Reinstating Matching Contributions in the Next Two Years
43
Base: Decreased or Suspended the Match Total ’11 (N=92); Small Companies: ‘11 (N=52); Large Companies: ‘11 (N=40)NEW QUESTION IN WAVE 12 Q1615. Does your company plan to reinstate the matching contribution to its previous level in the next 2 years?
• Half of companies that decreased or suspended the match plan to reinstate it within
the next two years, signaling employer optimism. Directionally, this sentiment was
similar for small and large companies.
52
28
20
'11
'11
'11
50
20
30
'11
'11
'11
Yes51
No27
Not sure/
Refused22
Plan to Reinstate Match in 2 Years
Total (%)

© Transamerica Center for Retirement Studies, 2011
Adoption of Roth 401(k) Option
BASE: OFFERS 401(k) PLANQ540. Has your company adopted the Roth 401(k) option?
44
• Adoption of the Roth 401(k) option significantly increased; almost a third of
employers are providing the Roth 401(k) option for their employees.
2011 2009/10 2008/09 2007(N=583) (N=480) (N=469) (N=507)
31
67
2
■ Yes
■ No
■ Not sure/Refused
24
76
23
75
219
76
5
31
67
2

© Transamerica Center for Retirement Studies, 2011
Adoption of Roth 401(k) Option
BASE: OFFERS 401(k) PLAN: Small Companies: ‘07 (N=275) ’08/’09 (N=220), ’09/’10 (N=226), ‘11 (N=336); Large Companies: ‘07 (N=232) ’08/’09 (N=249), ’09/’10 (N=254), ‘11 (N=247)Q540. Has your company adopted the Roth 401(k) option?
Small Companies Large Companies
(A) (B)
Yes
No
Not sure/Refused
45
• Small and large companies adopted the Roth 401(k) option at about the same rate.
19
75
5
21
77
2
24
76
0
31
67
2
'11
'09/'…
'08/'…
'07
'11
'09/'…
'08/'…
'07
'11
'09/'…
'08/'…
'07
20
79
0
29
70
1
25
74
0
33
66
2
'11
'09/'…
'08/'…
'07
'11
'09/'…
'08/'…
'07
'11
'09/'…
'08/'…
'07
© Transamerica Center for Retirement Studies, 2011
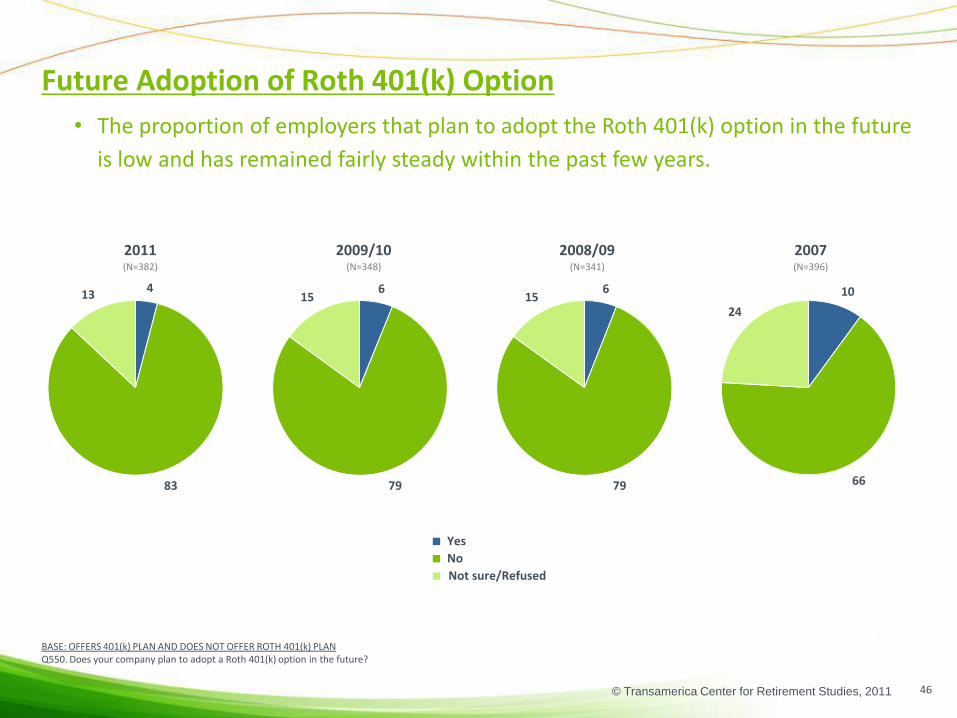
Future Adoption of Roth 401(k) Option
BASE: OFFERS 401(k) PLAN AND DOES NOT OFFER ROTH 401(k) PLANQ550. Does your company plan to adopt a Roth 401(k) option in the future?
46
• The proportion of employers that plan to adopt the Roth 401(k) option in the future
is low and has remained fairly steady within the past few years.
2011 2009/10 2008/09 2007(N=382) (N=348) (N=341) (N=396)
4
83
13
■ Yes
■ No
■ Not sure/Refused
6
79
156
79
15 10
66
24

© Transamerica Center for Retirement Studies, 2011
Future Adoption of Roth 401(k) Option
BASE: OFFERS 401(k) PLAN AND DOES NOT OFFER ROTH 401(k) PLAN; Small Companies: ‘07 (N= 212) ’08/’09 (N=168), ’09/’10 (N=159), ‘11 (N=220); Large Companies: ‘07 (N=184) ’08/’09 (N=173),’09/’10 (N=189), ‘11 (N=162)Q550. Does your company plan to adopt a Roth 401(k) option in the future?
47
• The majority of employers, regardless of company size, do not plan to offer the Roth
401(k) option to their employees.
• Large companies continue to be more likely than small companies to consider
offering this option in the future.
Small Companies Large Companies
(A) (B)
Yes
No
Not sure/Refused
9
65
25
6
81
14
5
80
15
3
85
12
'11
'09/'…
'08/'…
'07
'11
'09/'…
'08/'…
'07
'11
'09/'…
'08/'…
'07
10
70
20
8
69
23
12
73
15
12
72
15
'11
'09/'…
'08/'…
'07
'11
'09/'…
'08/'…
'07
'11
'09/'…
'08/'…
'07
B
A
A
B

© Transamerica Center for Retirement Studies, 2011
2011 2009/10 2008/09 2007(N=300) (N=264) (N=255) (N=278)
Employees not interested
Concerned about cost
Concerned about administrative complexity
Not interested/Satisfied with current plan
Unaware of Roth 401(k)s
Need more information
Economy – –
Not considered as an option yet
Non profit organization – –
Different pay scale/Does not benefit all –
Government agency – –
Communication Complexity –
Others make the decision/not employee – –
Concerned about sunset provision* –
Tax concerns – – –
None/Nothing – – –
Do not need it, already have plan(s) –
Some other reason
All of the above – – –
Not sure
Reasons For Not Adopting Roth 401(k)
*The Pension Protection Act eliminated the sunset provisions, however there may be a few companies who are unaware.BASE: HAS NO PLANS TO OFFER ROTH 401(k) PLANQ560. What would you say is the main reason your company is not planning to adopt a Roth 401(k) in the future?
48
• Employers indicate lack of employee interest as the most common reason for not
planning to adopt a Roth 401(k) option.
• Concerns about cost and administrative complexity are the next common reasons.
33
12
11
6
4
3
2
1
<1
<1
<1
<1
<1
11
6
10
37
7
14
1
9
0
2
1
2
0
0
0
3
0
0
11
5
0
6
28
10
10
12
12
0
3
<1%
0
1
<1%
4
7
12
26
13
11
7
10
2
6
3
9
12

© Transamerica Center for Retirement Studies, 2011
Small Companies(A)
Large Companies(B)
2011 2009/10 2008/09 2007 2011 2009/10 2008/09 2007(N=183) (N=126) (N=135) (N=149) (N=117) (N=138) (N=120) (N=129)
Employees not interested
Concerned about cost
Concerned about administrative complexity
Not interested/Satisfied with current plan
Unaware of Roth 401(k)s
Need more information – – – – – –
Economy – – – – – –
Not considered as an option yet
Different pay scale/Does not benefit all – – – – –
Government agency – – – – – –
Communication Complexity – – – – –
Non profit organization – – – – – –
Tax concerns – – – – – – –
Concerned about sunset provision* – – –
None/Nothing – – – – – – –
Others make the decision/not employee – – – – –
Do not need it, already have plan(s) – –
Some other reason
All of the above – – – – – – –
Not sure
39
6
13
1
9
2
1
2
3
12
5
6
28
9
8
12
14
3
<1
1
4
7
13
27
14
8
7
10
2
7
3
9
12
29
5
24
5
2
2
2
1
1
1
7
2
15
Reasons For Not Adopting Roth 401(k)
*The Pension Protection Act eliminated the sunset provisions, however there may be a few companies who are unaware.BASE: HAS NO PLANS TO OFFER ROTH 401(k) PLANQ560. What would you say is the main reason your company is not planning to adopt a Roth 401(k) in the future?
49
• Concerned about administrative complexity continues to be a more common
concern for large companies than for small companies.
34
13
9
7
4
3
2
1
<1
<1
11
6
9
22
12
25
2
6
2
1
1
1
1
1
1
9
6
1
8
28
14
21
9
4
2
3
1
3
10
7
23
9
27
7
6
1
3
13
10
B
AA
A
A
A
A
A
A
A

© Transamerica Center for Retirement Studies, 2011
Automatic Enrollment in Retirement Plans
BASE: OFFERS 401(k) PLANQ1025. When a new employee qualifies to join the employee-funded 401(k) plan, are they (A) initially given a choice to participate or not participate in the plan, or (B) automatically enrolled in the plan with the choice to opt out at a later date?
50
• The majority of companies that offer a 401(k) plan give their new employees the
option to enroll in the program, while one in five automatically enroll new
employees.
• The proportion of employers who automatically enroll has decreased from last year.
2011 2009/10 2008/09 2007(N=583) (N=480) (N=469) (N=507)
76
22
1
■ New employee is given a choice to participate
■ New employee is automatically enrolled in the plan
■ Not sure/Refused
73
27
1
71
24
5
75
23
1
© Transamerica Center for Retirement Studies, 2011
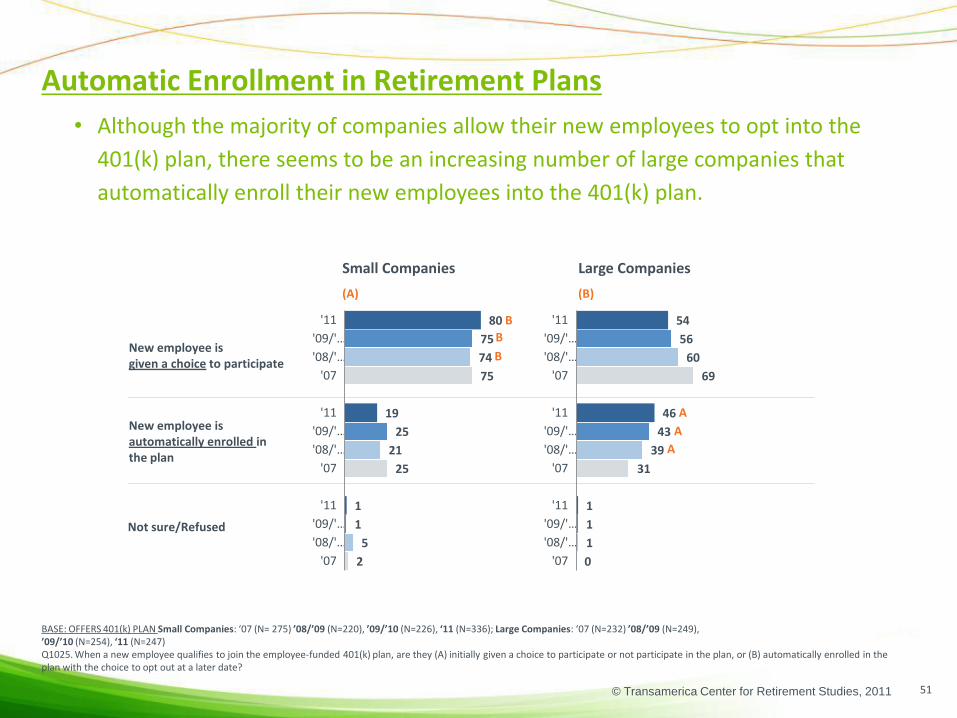
Automatic Enrollment in Retirement Plans
BASE: OFFERS 401(k) PLAN Small Companies: ‘07 (N= 275) ’08/’09 (N=220), ’09/’10 (N=226), ‘11 (N=336); Large Companies: ‘07 (N=232) ’08/’09 (N=249),’09/’10 (N=254), ‘11 (N=247)Q1025. When a new employee qualifies to join the employee-funded 401(k) plan, are they (A) initially given a choice to participate or not participate in the plan, or (B) automatically enrolled in the plan with the choice to opt out at a later date?
51
• Although the majority of companies allow their new employees to opt into the
401(k) plan, there seems to be an increasing number of large companies that
automatically enroll their new employees into the 401(k) plan.
Small Companies Large Companies
(A) (B)
New employee isgiven a choice to participate
New employee is automatically enrolled in the plan
Not sure/Refused
75
25
2
74
21
5
75
25
1
80
19
1
'11
'09/'…
'08/'…
'07
'11
'09/'…
'08/'…
'07
'11
'09/'…
'08/'…
'07
69
31
0
60
39
1
56
43
1
54
46
1
'11
'09/'…
'08/'…
'07
'11
'09/'…
'08/'…
'07
'11
'09/'…
'08/'…
'07
B
B
A
A
B
A

© Transamerica Center for Retirement Studies, 2011
Automatic Enrollment - Default Contribution Rates
BASE: AUTOMATICALLY ENROLLS NEW EMPLOYEES INTO THE RETIREMENT PLANQ1027. What is the default employee-funded 401(k) plan contribution rate (excluding the company match)?
52
• Three percent is the median contribution rate among employers who automatically
enroll their new workers in the employee-funded 401(k) plan.
2011 2009/10 2008/09 2007(N=190) (N=173) (N=154) (N=128)
Median 3% 3% 3% 3%
0-4
5-8
9-12
13-15
16+
Not sure/Refused
47
11
0
2
4
37
51
8
8
0
1
32
62
6
0
2
2
28
62
12
<1
0
3
22

© Transamerica Center for Retirement Studies, 2011
Automatic Enrollment - Default Contribution Rates
BASE: AUTOMATICALLY ENROLLS NEW EMPLOYEES INTO THE RETIREMENT PLAN Small Companies: ‘07 (N= 57) ’08/’09 (N=56), ’09/’10 (N=64), ‘11 (N=77); Large Companies: ‘07 (N=71) ’08/’09 (N=98), ’09/’10 (N=109), ‘11 (N=113)Q1027. What is the default employee-funded 401(k) plan contribution rate (excluding the company match)?
53
• Benefits decision-makers in small companies are more likely to be unsure or less
likely to disclose the default contribution rate.
Small Companies Large Companies(A) (B)
<5
5-8
9-12
13-15
16+
Not sure/Refused
Mean Median Mean Median
20112009/102008/092007
4.13.94.68.0
3333
4.04.73.78.0
3333
40
12
0
3
3
43
39
8
9
0
0
43
59
4
0
2
2
33
58
12
0
0
3
27
'11'09/'10'08/'09
'07
'11'09/'10'08/'09
'07
'11'09/'10'08/'09
'07
'11'09/'10'08/'09
'07
'11'09/'10'08/'09
'07
'11'09/'10'08/'09
'07
77
6
0
0
7
10
78
9
3
0
1
8
74
15
1
0
2
8
75
14
1
0
2
8
'11'09/'10'08/'09
'07
'11'09/'10'08/'09
'07
'11'09/'10'08/'09
'07
'11'09/'10'08/'09
'07
'11'09/'10'08/'09
'07
'11'09/'10'08/'09
'07
B
© Transamerica Center for Retirement Studies, 2011
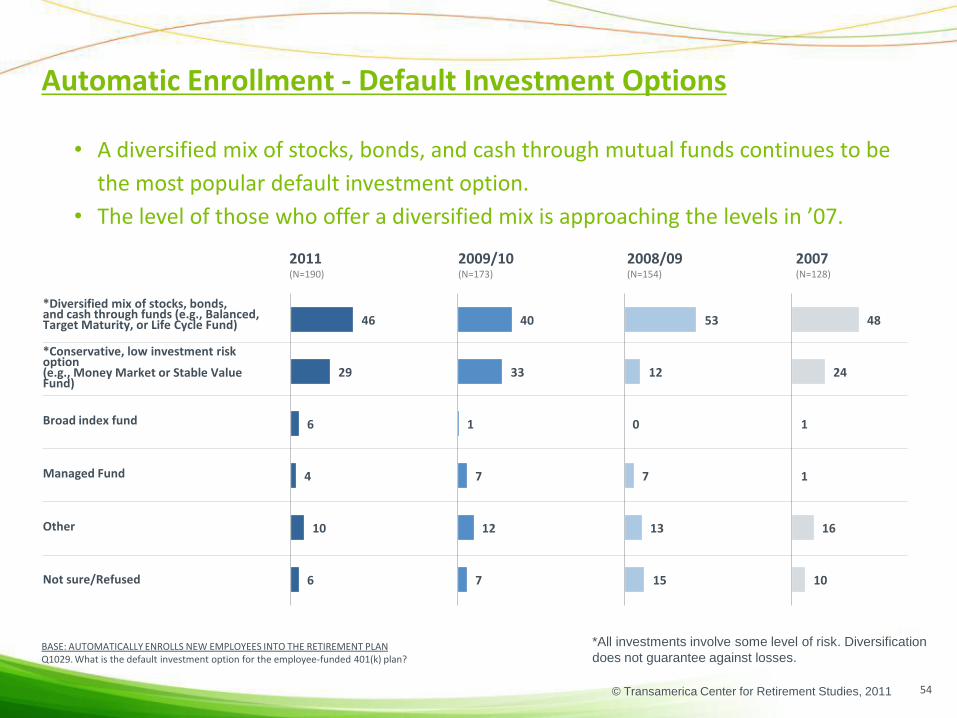
Automatic Enrollment - Default Investment Options
BASE: AUTOMATICALLY ENROLLS NEW EMPLOYEES INTO THE RETIREMENT PLAN Q1029. What is the default investment option for the employee-funded 401(k) plan?
54
• A diversified mix of stocks, bonds, and cash through mutual funds continues to be
the most popular default investment option.
• The level of those who offer a diversified mix is approaching the levels in ’07.
*All investments involve some level of risk. Diversification
does not guarantee against losses.
2011 2009/10 2008/09 2007(N=190) (N=173) (N=154) (N=128)
*Diversified mix of stocks, bonds, and cash through funds (e.g., Balanced, Target Maturity, or Life Cycle Fund)
*Conservative, low investment risk option (e.g., Money Market or Stable Value Fund)
Broad index fund
Managed Fund
Other
Not sure/Refused
48
24
1
1
16
10
53
12
0
7
13
15
40
33
1
7
12
7
46
29
6
4
10
6

© Transamerica Center for Retirement Studies, 2011
Small Companies Large Companies(A) (B)
Diversified mix of stocks, bonds, and cash through funds (e.g., Balanced, Target Maturity, or Life Cycle Fund)
Conservative, low investment risk option (e.g., Money Market or Stable Value Fund)
Broad index fund
Managed Fund
Other
Not sure/Refused
Automatic Enrollment - Default Investment Options
BASE: AUTOMATICALLY ENROLLS NEW EMPLOYEES INTO THE RETIREMENT PLANSmall Companies: ‘07 (N= 57) ’08/’09 (N=56), ’09/’10 (N=64), ‘11 (N=77); Large Companies: ‘07 (N=71) ’08/’09 (N=98), ’09/’10 (N=109), ‘11 (N=113)Q1029. What is the default investment option for the employee-funded 401(k) plan?
55
• Large companies are more likely to have a diversified mix as the default investment
option when they automatically enroll their new employees.
49
22
0
1
18
10
47
9
0
8
17
19
35
37
0
8
12
8
40
30
8
3
12
7
'11'09/'10'08/'09
'07
'11'09/'10'08/'09
'07
'11'09/'10'08/'09
'07
'11'09/'10'08/'09
'07
'11'09/'10'08/'09
'07
'11'09/'10'08/'09
'07
46
35
3
3
4
8
67
19
1
5
4
4
63
17
3
4
9
5
62
25
0
5
4
4
'11'09/'10'08/'09
'07
'11'09/'10'08/'09
'07
'11'09/'10'08/'09
'07
'11'09/'10'08/'09
'07
'11'09/'10'08/'09
'07
'11'09/'10'08/'09
'07
A
*All investments involve some level of risk. Diversification
does not guarantee against losses.
© Transamerica Center for Retirement Studies, 2011
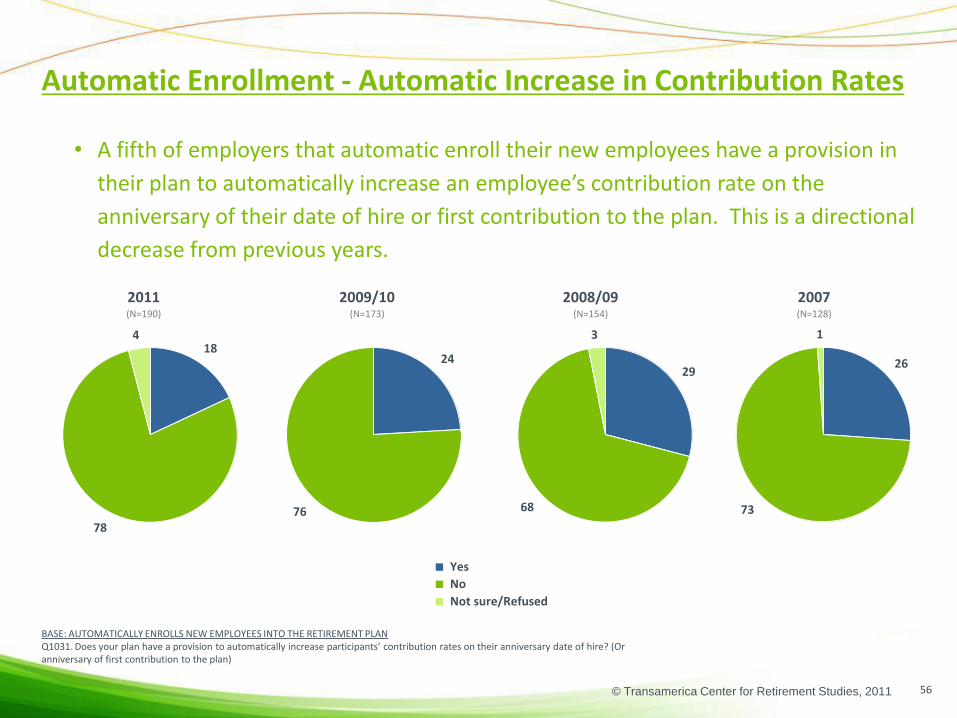
Automatic Enrollment - Automatic Increase in Contribution Rates
BASE: AUTOMATICALLY ENROLLS NEW EMPLOYEES INTO THE RETIREMENT PLANQ1031. Does your plan have a provision to automatically increase participants’ contribution rates on their anniversary date of hire? (Or anniversary of first contribution to the plan)
■ Yes
■ No
■ Not sure/Refused
56
• A fifth of employers that automatic enroll their new employees have a provision in
their plan to automatically increase an employee’s contribution rate on the
anniversary of their date of hire or first contribution to the plan. This is a directional
decrease from previous years.
2011 2009/10 2008/09 2007(N=190) (N=173) (N=154) (N=128)
18
78
4
24
76
29
68
3
26
73
1
© Transamerica Center for Retirement Studies, 2011
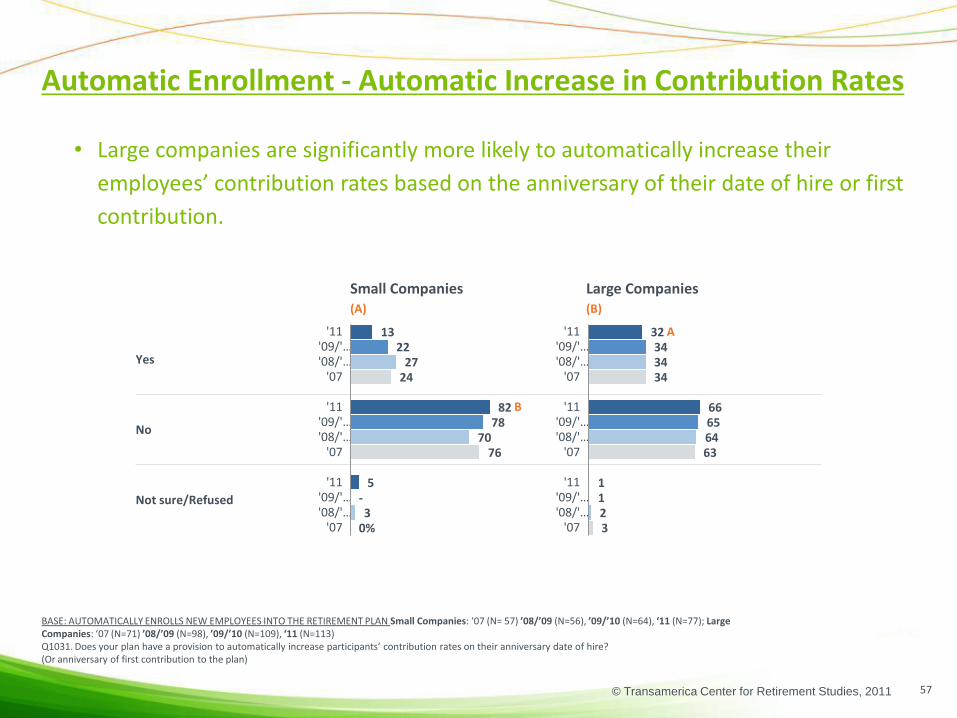
Automatic Enrollment - Automatic Increase in Contribution Rates
BASE: AUTOMATICALLY ENROLLS NEW EMPLOYEES INTO THE RETIREMENT PLAN Small Companies: ‘07 (N= 57) ’08/’09 (N=56), ’09/’10 (N=64), ‘11 (N=77); Large Companies: ‘07 (N=71) ’08/’09 (N=98), ’09/’10 (N=109), ‘11 (N=113)Q1031. Does your plan have a provision to automatically increase participants’ contribution rates on their anniversary date of hire?(Or anniversary of first contribution to the plan)
Small Companies Large Companies(A) (B)
Yes
No
Not sure/Refused
57
• Large companies are significantly more likely to automatically increase their
employees’ contribution rates based on the anniversary of their date of hire or first
contribution.
24
76
0%
27
70
3
22
78
-
13
82
5
'11'09/'…'08/'…
'07
'11'09/'…'08/'…
'07
'11'09/'…'08/'…
'07
34
63
3
34
64
2
34
65
1
32
66
1
'11'09/'…'08/'…
'07
'11'09/'…'08/'…
'07
'11'09/'…'08/'…
'07
A
B

© Transamerica Center for Retirement Studies, 2011
Small Companies Large Companies
(A) (B)
Yes
No
Not sure/Refused
QDIA Requirement
58
Base: Automatically Enrolls New Employees Into The Retirement Plan: Total ’11 (N=190); Small Companies: ‘11 (N=77); Large Companies: ‘11 (N=113)NEW QUESTION IN WAVE 12 Q1600. Does the default investment option for the 401(k) plan satisfy the Department of Labor’s requirements to be recognized as a Qualified Default Investment Alternative, commonly referred to as a QDIA?
• A large majority of companies that auto-enroll employees into a retirement plan
believe that the default investment option satisfies the QDIA requirement.
82
5
13
'11
'11
'11
91
5
7
'11
'11
'11
Yes84
No4
Not sure/
Refused12
Satisfies QDIA Requirement
Total (%)

© Transamerica Center for Retirement Studies, 2011
Automatic Enrollment - Employee Response
BASE: AUTOMATICALLY ENROLLS NEW EMPLOYEES INTO THE RETIREMENT PLANQ1033. Generally, has your employees’ response to being automatically enrolled been…?
■ Positive
■ Neutral
■ Negative
■ Not sure/Refused
59
• The majority of employers continue to report their employees’ response to being
automatically enrolled as positive.
2011 2009/10 2008/09 2007(N=190) (N=173) (N=154) (N=128)
5735
27
5437
73
66
18
3
14
5831
110

© Transamerica Center for Retirement Studies, 2011
Automatic Enrollment - Employee Response
BASE: AUTOMATICALLY ENROLLS NEW EMPLOYEES INTO THE RETIREMENT PLAN Small Companies: ‘07 (N= 57) ’08/’09 (N=56), ’09/’10 (N=64), ‘11 (N=77); Large Companies: ‘07 (N=71) ’08/’09 (N=98), ’09/’10 (N=109), ‘11 (N=113)Q1033. Generally, has your employees’ response to being automatically enrolled been…?
Small Companies Large Companies(A) (B)
Positive
Neutral
Negative
Not sure/Refused
60
• There aren’t significant differences between small and large companies.
69
12
3
16
57
31
0
13
53
37
7
3
55
35
2
8
'11'09/'…'08/'…
'07
'11'09/'…'08/'…
'07
'11'09/'…'08/'…
'07
'11'09/'…'08/'…
'07
51
42
1
6
62
32
3
3
56
35
4
5
62
35
1
3
'11'09/'…'08/'…
'07
'11'09/'…'08/'…
'07
'11'09/'…'08/'…
'07
'11'09/'…'08/'…
'07

© Transamerica Center for Retirement Studies, 2011
Future Adoption of Automatic Enrollment
BASE: DOES NOT AUTOMATICALLY ENROLLQ580. Does your company plan to adopt an automatic enrollment provision in the future?
61
• The majority of companies do not plan to adopt automatic enrollment; however,
one-tenth plan on adopting automatic enrollment in the future.
• These results are consistent with the previous year.
2011 2009/10 2008/09 2007(N=385) (N=301) (N=307) (N=377)
6
84
10 4
84
12 6
80
14 11
77
13
■ Yes
■ No
■ Not sure/Refused

© Transamerica Center for Retirement Studies, 2011
Small Companies Large Companies(A) (B)
Yes
No
Not sure/Refused
27
60
12
12
70
18
24
64
13
18
65
17
'11'09/'…'08/'…
'07
'11'09/'…'08/'…
'07
'11'09/'…'08/'…
'07
Future Adoption of Automatic Enrollment
BASE: DOES NOT AUTOMATICALLY ENROLL Small Companies: ‘07 (N= 216) ’08/’09 (N=158), ’09/’10 (N=159), ‘11 (N=253); Large Companies: ‘07 (N=161) ’08/’09 (N=149), ’09/’10 (N=142), ‘11 (N=132)Q580. Does your company plan to adopt an automatic enrollment provision in the future?
62
• Large companies are more likely to adopt automatic enrollment, with one-fifth
indicating they plan to adopt the provision in the future.
8
79
13
5
82
13
2
86
12
5
86
9
'11'09/'…'08/'…
'07
'11'09/'…'08/'…
'07
'11'09/'…'08/'…
'07
A
A
BB
B
A
B
A

© Transamerica Center for Retirement Studies, 2011
Reasons For Not Adopting Automatic Enrollment
BASE: HAS NO PLANS TO AUTO ENROLLQ590. What would you say is the main reason your company is not planning to adopt an automatic enrollment provision in the future? CHOOSE ONE.
2011 2009/10 2008/09 2007(N=298) (N=216) (N=224) (N=262)
Participation rate is already high
Allow employees to choose
Concerned about cost
Concerned about administrative complexity
Employees not interested
Concerned about current regulations
Never considered/Not a priority
High Turnover
There's no need
Lack of knowledge/understanding
Economic Challenges/Company Closing
Happy/Satisfied with what we have
Issues regarding employee/affordability
Union workers/Up to the Union
Already have it
Some other reason
DK/Refused
63
• Current high participation continues to be the most cited reason for not adopting
automatic enrollment in the future, followed by allowing employees to choose.
36
22
10
8
7
2
1
1
0
0
-
-
-
-
-
3
9
38
7
14
9
2
7
1
<1
1
0
3
1
1
0
0
9
7
32
13
14
7
8
5
3
-
1
<1
-
-
-
-
-
8
8
34
15
10
6
8
4
-
<1
-
<1
-
-
-
-
-
6
14

© Transamerica Center for Retirement Studies, 2011
Small Companies(A)
Large Companies(B)
2011 2009/10 2008/09 2007 2011 2009/10 2008/09 2007(N=212) (N=126) (N=120) (N=165) (N=86) (N=90) (N=104) (N=97)
Participation rate is already high
Allow employees to choose
Concerned about cost
Concerned about administrative complexity
Employees not interested
Concerned about current regulations
Never considered/Not a priority
High Turnover
Economic Challenges/Company Closing
Happy/Satisfied with what we have
There's no need
Issues regarding employee/affordability
Union workers/Up to the Union
Already have it
Lack of knowledge/understanding
Some other reason
DK/Refused
33
14
14
6
8
4
3
-
-
-
<1
-
-
-
0
9
8
35
15
9
4
8
4
-
0
-
-
-
-
-
-
<1
6
14
30
3
16
9
6
6
3
2
-
-
-
-
-
-
-
1
-
26
2
13
19
2
11
3
2
-
-
1
4
2
1
1
8
3
23
9
21
13
6
6
2
1
-
-
4
-
-
-
1
7
7
A
A
36
23
10
8
7
2
<1<1
-
-
-
-
-
-
<1
4
-
Reasons For Not Adopting Automatic Enrollment
BASE: HAS NO PLANS TO AUTO ENROLLQ590. What would you say is the main reason your company is not planning to adopt an automatic enrollment provision in the future? CHOOSE ONE.
64
• Small companies are more likely to cite allowing employees to choose, while large
companies cite concern about current regulations and lack of consideration/priority
as reasons for not implementing automatic enrollment.
22
8
15
20
5
6
-
3
-
-
-
-
-
-
3
7
8
A
A
A
A
A
A
A
A
B
A
A
39
8
14
8
2
7
1
0
3
1
1
<1
-
-
-
10
7

© Transamerica Center for Retirement Studies, 2011
Current Offerings of Investment Guidance/Advice
BASE: OFFERS 401(k) PLAN OR OTHER EMPLOYEE FUNDED PLANQ592. Does your company currently offer investment guidance or advice for employees as part of your retirement plan?
65
• Two-thirds of companies that provide an employee-funded retirement plan also
offer investment guidance or advice to their employees. This is directionally higher
than the previous two years.
2011 2009/10 2008/09 2007(N=645) (N=533) (N=526) (N=567)
65
35
1
58
42
58
42
1
61
38
1
■ Yes
■ No
■ Not sure/Refused

© Transamerica Center for Retirement Studies, 2011
Small Companies Large Companies
(A) (B)
Yes
No
Not sure/Refused
65
34
2
66
33
0
69
31
1
68
31
2
'11
'09/'10
'08/'09
'07
'11
'09/'10
'08/'09
'07
'11
'09/'10
'08/'09
'07
Current Offerings of Investment Guidance/Advice
BASE: OFFERS 401(k) PLAN OR OTHER EMPLOYEE FUNDED PLAN Small Companies: ‘07 (N= 304) ’08/’09 (N=248), ’09/’10 (N=256), ‘11 (N=364); Large Companies: ‘07 (N=263) ’08/’09 (N=278), ’09/’10 (N=277), ‘11 (N=281)Q592. Does your company currently offer investment guidance or advice for employees as part of your retirement plan?
A
A
66
• In contrast to the previous year, there is not a significant difference between the
levels of small and large companies offering investment guidance/advice to their
employees.
60
39
1
56
43
1
56
44
0
64
35
<1
'11
'09/'10
'08/'09
'07
'11
'09/'10
'08/'09
'07
'11
'09/'10
'08/'09
'07
B
A
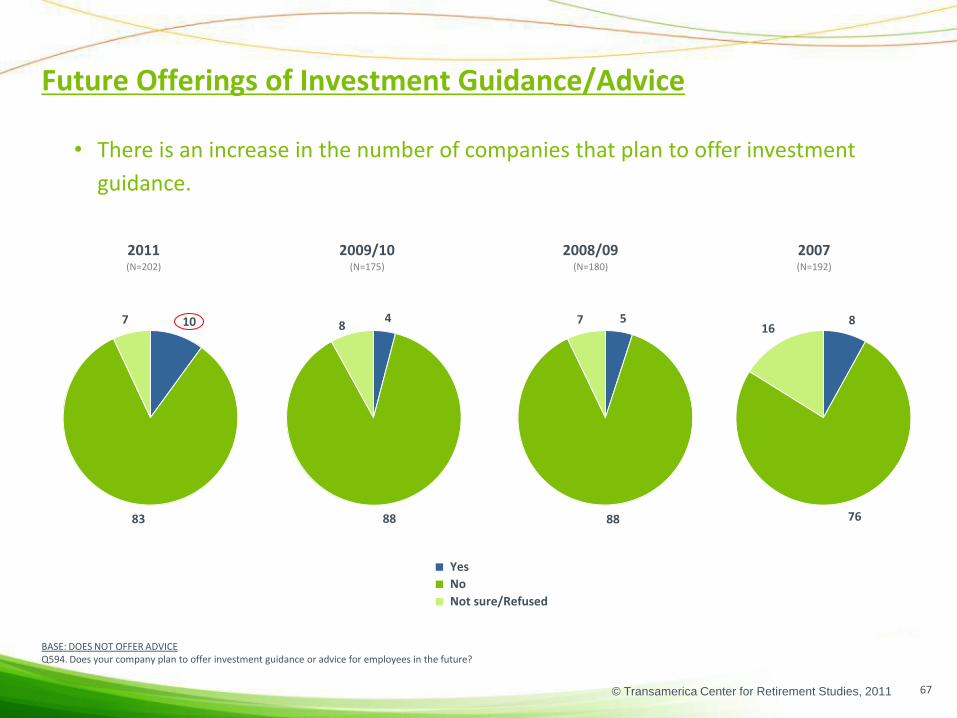
© Transamerica Center for Retirement Studies, 2011
Future Offerings of Investment Guidance/Advice
BASE: DOES NOT OFFER ADVICEQ594. Does your company plan to offer investment guidance or advice for employees in the future?
67
• There is an increase in the number of companies that plan to offer investment
guidance.
2011 2009/10 2008/09 2007(N=202) (N=175) (N=180) (N=192)
■ Yes
■ No
■ Not sure/Refused
10
83
7 4
88
85
88
7 8
76
16

© Transamerica Center for Retirement Studies, 2011
Future Offerings of Investment Guidance/Advice
BASE: DOES NOT OFFER ADVICE Small Companies: ‘07 (N= 103) ’08/’09 (N=90), ’09/’10 (N=90), ‘11 (N=116); Large Companies: ‘07 (N=89) ’08/’09 (N=90), ’09/’10 (N=85), ‘11 (N=86)Q594. Does your company plan to offer investment guidance or advice for employees in the future?
68
Small Companies Large Companies
(A) (B)
Yes
No
Not sure/Refused
18
69
13
17
72
11
14
77
8
19
71
11
'11
'09/'10
'08/'09
'07
'11
'09/'10
'08/'09
'07
'11
'09/'10
'08/'09
'07
7
77
16
3
90
6
4
89
8
9
85
6
'11
'09/'10
'08/'09
'07
'11
'09/'10
'08/'09
'07
'11
'09/'10
'08/'09
'07
B
A
A
A
A
B
• One-fifth of large companies plan to offer investment guidance/advice in the future
and overall are more likely than small companies to plan on offering guidance/advice
in the future.
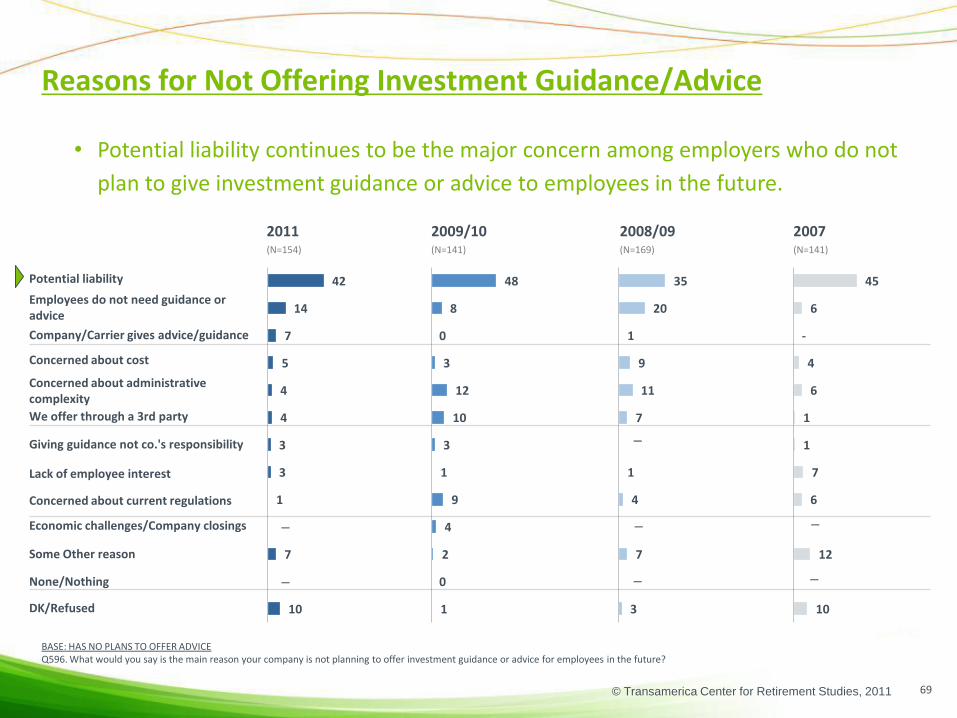
© Transamerica Center for Retirement Studies, 2011
2011 2009/10 2008/09 2007(N=154) (N=141) (N=169) (N=141)
Potential liability
Employees do not need guidance or advice
Company/Carrier gives advice/guidance
Concerned about cost
Concerned about administrative complexity
We offer through a 3rd party
Giving guidance not co.'s responsibility
Lack of employee interest
Concerned about current regulations
Economic challenges/Company closings
Some Other reason
None/Nothing
DK/Refused
35
20
1
9
11
7
1
4
7
3
Reasons for Not Offering Investment Guidance/Advice
BASE: HAS NO PLANS TO OFFER ADVICEQ596. What would you say is the main reason your company is not planning to offer investment guidance or advice for employees in the future?
69
• Potential liability continues to be the major concern among employers who do not
plan to give investment guidance or advice to employees in the future.
45
6
-
4
6
1
1
7
6
12
10
48
8
0
3
12
10
3
1
9
4
2
0
1
42
14
7
5
4
4
3
3
1
7
10
–
–
–
–
–
–
–
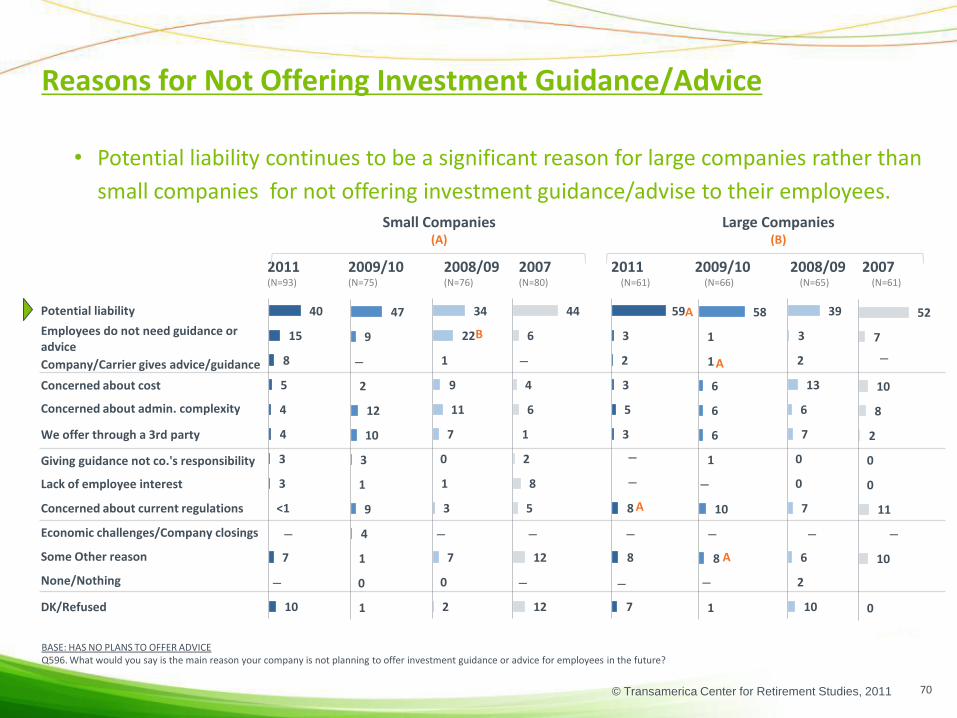
© Transamerica Center for Retirement Studies, 2011
Small Companies(A)
Large Companies(B)
2011 2009/10 2008/09 2007 2011 2009/10 2008/09 2007(N=93) (N=75) (N=76) (N=80) (N=61) (N=66) (N=65) (N=61)
Potential liability
Employees do not need guidance or advice
Company/Carrier gives advice/guidance
Concerned about cost
Concerned about admin. complexity
We offer through a 3rd party
Giving guidance not co.'s responsibility
Lack of employee interest
Concerned about current regulations
Economic challenges/Company closings
Some Other reason
None/Nothing
DK/Refused
59
3
2
3
5
3
8
8
7
58
1
1
6
6
6
1
10
8
1
40
15
8
5
4
4
3
3
<1
7
10
47
9
2
12
10
3
1
9
4
1
0
1
Reasons for Not Offering Investment Guidance/Advice
BASE: HAS NO PLANS TO OFFER ADVICEQ596. What would you say is the main reason your company is not planning to offer investment guidance or advice for employees in the future?
70
• Potential liability continues to be a significant reason for large companies rather than
small companies for not offering investment guidance/advise to their employees.
34
22
1
9
11
7
0
1
3
7
0
2
44
6
4
6
1
2
8
5
12
12
39
3
2
13
6
7
0
0
7
6
2
10
52
7
10
8
2
0
0
11
10
0
– A
A
B
– –
––
––
– – – –
–
–
–
A
A
–
–
–

© Transamerica Center for Retirement Studies, 2011
Defined Benefit Plans – Status of Plan
BASE: OFFERS COMPANY-FUNDED DEFINED BENEFIT PLANQ1010. Is your company-funded defined benefit pension plan open to all employees, or frozen to new employees?
2011 2009/10 2008/09 2007(N=203) (N=189) (N=169) (N=184)
■ Open to all employees
■ Frozen to new employees
■ Some other distinction/limitation
■ Not sure/Refused
71
• The vast majority of employers that offer defined benefit plans indicate they are
open to all employees, and this is consistent with results from the previous year.
80
12
3 4
6019
20
71
19
7 2
73
16
10 1

© Transamerica Center for Retirement Studies, 2011
Small Companies Large Companies
(A) (B)
Open to all employees
Frozen to new employees
Some other distinction/limitation
Not sure/Refused
87
6
2
5
61
17
22
0
76
15
7
3
77
12
10
1
'11'09/'10'08/'09
'07
'11'09/'10'08/'09
'07
'11'09/'10'08/'09
'07
'11'09/'10'08/'09
'07
Defined Benefit Plans – Status of Plan
BASE: OFFERS COMPANY-FUNDED DEFINED BENEFIT PLAN Small Companies: ‘07 (N= 74) ’08/’09 (N=64), ’09/’10 (N=67), ‘11 (N=89);Large Companies: ‘07 (N=110) ’08/’09 (N=105), ’09/’10 (N=122), ‘11 (N=144)Q1010. Is your company-funded defined benefit pension plan open to all employees, or frozen to new employees?
A
B
72
• While the majority of companies that offer defined benefit plans open them to all
employees, small companies are more likely to open the plan to new employees and
large companies are more likely to have frozen them to new employees.
56
34
7
3
59
25
16
0
59
33
8
1
57
31
10
1
'11'09/'…'08/'…
'07
'11'09/'…'08/'…
'07
'11'09/'…'08/'…
'07
'11'09/'…'08/'…
'07
B
A

© Transamerica Center for Retirement Studies, 2011
Total Small Companies Large Companies
(A) (B)
No
Yes – increasing benefits
Yes – decreasing benefits,freezing, and/orterminating plan
Not sure/Refused
Defined Benefit Plans – Changes in Next 12 Months
BASE: OFFERS COMPANY-FUNDED DEFINED BENEFIT PLAN Total ’08/’09 (N=169), ’09/’10 (N=189), ‘11 (N=203) Small Companies:’08/’09 (N=64), ’09/’10 (N=67), ‘11 (N=89); Large Companies:’08/’09 (N=105), ’09/’10 (N=122), ‘11 (N=144)Q1425. Is your company considering changes to its company-funded defined benefit pension plan in the next twelve months?
73
• There was a significant increase in companies not planning to make any changes to
their benefits plans; however, large companies are more likely than small companies
to plan to decrease/freeze/terminate their company’s defined benefit plan.
85
3
3
9
81
1
11
7
93
2
4
1
'11
'09/'…
'08/'…
'11
'09/'…
'08/'…
'11
'09/'…
'08/'…
'11
'09/'…
'08/'…
86
4
0
10
82
<1
10
8
95
3
2
<1
'11
'09/'…
'08/'…
'11
'09/'…
'08/'…
'11
'09/'…
'08/'…
'11
'09/'…
'08/'…
82
0
11
7
78
3
13
6
84
1
10
5
'11
'09/'…
'08/'…
'11
'09/'…
'08/'…
'11
'09/'…
'08/'…
'11
'09/'…
'08/'…
B
A
A

© Transamerica Center for Retirement Studies, 2011
• Economic Expectations
• Perceptions of the Relative Importance of Various Employee Benefits
• Benefit Offerings, including Retirement Benefits
• Perceptions and Management of Current Retirement Plan Offerings
• Perceptions of Employee Involvement with Retirement Planning
Detailed Findings
74
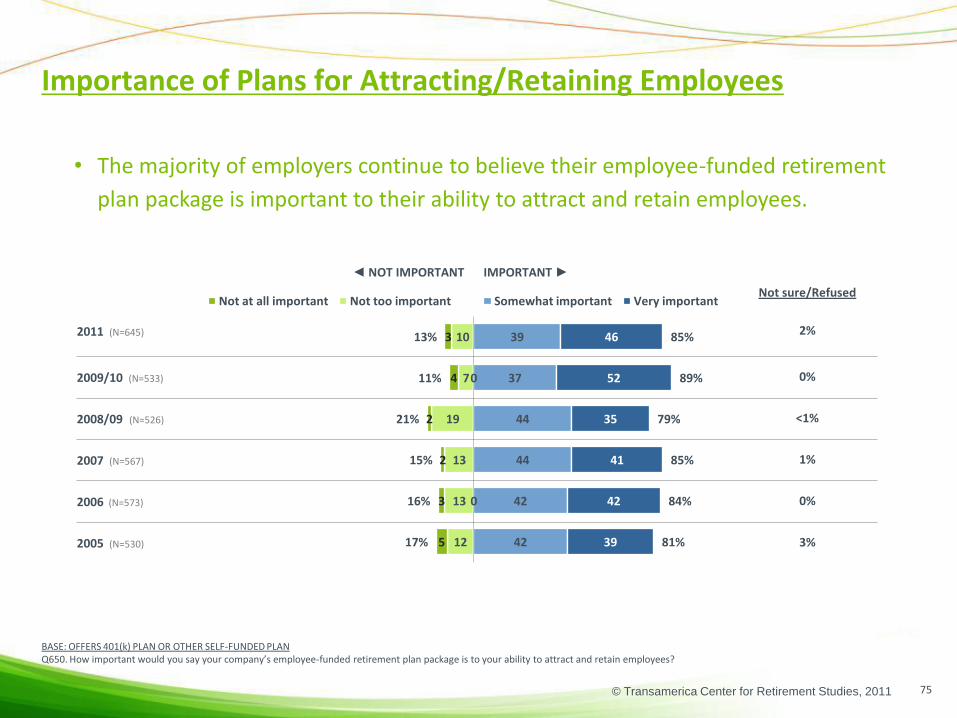
© Transamerica Center for Retirement Studies, 2011
◄ NOT IMPORTANT IMPORTANT ►
Not sure/Refused
2011 (N=645) 2%
2009/10 (N=533) 0%
2008/09 (N=526) <1%
2007 (N=567) 1%
2006 (N=573) 0%
2005 (N=530) 3%
0
0
10
7
19
13
13
12
3
4
2
2
3
5
13%
11%
21%
15%
16%
17%
39
37
44
44
42
42
46
52
35
41
42
39
85%
89%
79%
85%
84%
81%
Not at all important Not too important Somewhat important Very important
Importance of Plans for Attracting/Retaining Employees
BASE: OFFERS 401(k) PLAN OR OTHER SELF-FUNDED PLANQ650. How important would you say your company’s employee-funded retirement plan package is to your ability to attract and retain employees?
75
• The majority of employers continue to believe their employee-funded retirement
plan package is important to their ability to attract and retain employees.

© Transamerica Center for Retirement Studies, 2011
Importance of Plans for Attracting/Retaining Employees
76
BASE: OFFERS 401(k) PLAN OR OTHER SELF-FUNDED PLAN: Small Companies: ‘07 (N= 304) ’08/’09 (N=248), ’09/’10 (N=256), ‘11 (N=364); Large Companies: ‘07 (N=263) ’08/’09 (N=278), ’09/’10 (N=277), ‘11 (N=281)Q650. How important would you say your company’s employee-funded retirement plan package is to your ability to attract and retain employees?
• Large companies are more likely than small companies to indicate that employee-
funded retirement plans are important in retaining/recruiting employees.
Small Companies Large Companies
(A) (B)
Very important
Somewhat important
Not too important
Not at all important
Not sure/Refused
60
35
3
2
0
57
38
3
1
1
61
35
4
0
0
62
35
1
1
<1
'11'09/'…'08/'…
'07
'11'09/'…'08/'…
'07
'11'09/'…'08/'…
'07
'11'09/'…'08/'…
'07
'11'09/'…'08/'…
'07
38
45
15
2
1
31
45
22
2
0
50
38
8
4
0
43
40
12
3
2
'11'09/'…'08/'…
'07
'11'09/'…'08/'…
'07
'11'09/'…'08/'…
'07
'11'09/'…'08/'…
'07
'11'09/'…'08/'…
'07
‘11: 83%‘09/’10: 88%‘08/’09: 76%
‘07: 83%
‘11: 15% B‘09/’10: 12% B‘08/’09: 24% B
‘07: 16% B
’11: 97% A‘09/’10: 96% A‘08/’09: 95% A
‘07: 95% A
’11: 3%‘09/’10: 4%‘08/’09: 4%
‘07: 5%
Important
Not Important
Important
Not Important
B
B B
A A
A
A
B
A

© Transamerica Center for Retirement Studies, 2011
◄ NOT IMPORTANT IMPORTANT ►
Not sure/Refused
2011 (N=645) 2%
2009/10 (N=533) 2%
2008/09 (N=526) 3%
2007 (N=567) <1%
2006 (N=573) <1%
2005 (N=530) 1%
Importance of Matching Contributions
77
BASE: OFFERS 401(k) PLAN OR OTHER SELF-FUNDED PLANQ660. How important is it to your employees that their company provides a matching contribution in their retirement savings plan?
• A large majority of companies that offer an employee-funded plan continue to
perceive matching contributions as important to their employees.
0
0
7
8
9
10
8
6
5
2
4
4
4
13
13%
10%
13%
13%
13%
19%
30
30
28
22
26
23
54
58
56
65
61
57
85%
88%
84%
86%
87%
79%
Not at all important Not too important Somewhat important Very important

© Transamerica Center for Retirement Studies, 2011
Importance of Matching Contributions
78
BASE: OFFERS 401(k) PLAN OR OTHER SELF-FUNDED PLAN Small Companies: ‘07 (N= 304) ’08/’09 (N=248), ’09/’10 (N=256), ‘11 (N=364); Large Companies: ‘07 (N=263) ’08/’09 (N=278), ’09/’10 (N=277), ‘11 (N=281) Q660. How important is it to your employees that their company provides a matching contribution in their retirement savings plan?
Small Companies Large Companies
(A) (B)
Very important
Somewhat important
Not too important
Not at all important
Not sure/Refused
• Large companies are more likely than small companies to believe that matching
contributions are “very important” to their employees.
76
18
3
2
1
74
19
2
2
2
70
23
3
3
1
71
21
5
2
2
'11'09/'…'08/'…
'07
'11'09/'…'08/'…
'07
'11'09/'…'08/'…
'07
'11'09/'…'08/'…
'07
'11'09/'…'08/'…
'07
63
22
11
4
0
53
29
10
5
3
56
31
9
2
2
52
32
8
6
2
'11'09/'…'08/'…
'07
'11'09/'…'08/'…
'07
'11'09/'…'08/'…
'07
'11'09/'…'08/'…
'07
'11'09/'…'08/'…
'07
‘11: 84%‘09/’10: 87%‘08/’09: 82%
‘07: 85%
‘11: 14%‘09/’10: 11%‘08/’09: 15%
‘07: 15%
Not Important
Important
‘11: 91%‘09/’10: 93%‘08/’09: 93%
‘07: 94%
‘11: 7%‘09/’10: 6%‘08/’09: 5%
‘07: 5%
Not Important
Important
B
B B
B B
A A
A
A
B
B
B

© Transamerica Center for Retirement Studies, 2011
◄ TOTAL DISAGREE TOTAL AGREE ►
Not sure/Refused
2011 (N=645) 2%
2009/10 (N=533) 3%
2008/09 (N=526) 1%
2007 (N=567) 1%
2006 (N=573) 4%
2005 (N=530) 1%
1
3
2
2
1
3
1
1
1
3
1
1
2%
3%
2%
5%
3%
4%
28
31
29
25
34
16
67
62
67
69
59
79
95%
93%
96%
94%
93%
95%
Strongly disagree Somewhat disagree Somewhat agree Strongly agree
Giving Employees the Right Information
79
BASE: OFFERS 401(k) PLAN OR OTHER SELF-FUNDED PLANQ730. Our company gives employees the right information they need to make decisions about the retirement plan.
• Nearly all companies believe that they give their employees the right information
they need to make decisions about the retirement plan.

© Transamerica Center for Retirement Studies, 2011
Small Companies Large Companies
(A) (B)
Strongly agree
Somewhat agree
Somewhat disagree
Strongly disagree
Not sure/Refused
Giving Employees the Right Information
BASE: OFFERS 401(k) PLAN OR OTHER SELF-FUNDED PLAN Small Companies: ‘07 (N= 304) ’08/’09 (N=248), ’09/’10 (N=256), ‘11 (N=364); Large Companies: ‘07 (N=263) ’08/’09 (N=278), ’09/’10 (N=277), ‘11 (N=281) Q730. Our company gives employees the right information they need to make decisions about the retirement plan.
80
• Small and large companies believe they give their employees the right information
they need to make decisions about the retirement plan.
66
31
2
1
0
66
30
2
0
1
67
30
2
1
1
68
29
2
0
1
'11'09/'…'08/'…
'07
'11'09/'…'08/'…
'07
'11'09/'…'08/'…
'07
'11'09/'…'08/'…
'07
'11'09/'…'08/'…
'07
69
24
2
3
1
67
29
2
1
1
62
31
3
1
4
67
28
1
1
2
'11'09/'…'08/'…
'07
'11'09/'…'08/'…
'07
'11'09/'…'08/'…
'07
'11'09/'…'08/'…
'07
'11'09/'…'08/'…
'07
‘11: 95%‘09/’10: 93%‘08/’09: 96%
‘07: 93%
‘11: 2%‘09/’10: 4%‘08/’09: 2%
‘07: 5%
Disagree
Agree
‘11: 97%‘09/’10: 97%‘08/’09: 96%
‘07: 97%
‘11: 2%‘09/’10: 3%‘08/’09: 3%
‘07: 2%
Disagree
Agree

© Transamerica Center for Retirement Studies, 2011
Total Small Companies Large Companies(N=645) (N=364) (N=281)
(A) (B)
Only during initial enrollment
Monthly
Quarterly*
A few times a year**
Annually
Every few years
Never
Not sure
Refused
10
3
16
20
37
5
5
2
1
10
4
N/A
37
38
5
4
2
0
'11'09/'10
'11'09/'10
'11'09/'10
'11'09/'10
'11'09/'10
'11'09/'10
'11'09/'10
'11'09/'10
'11'09/'10
Educating Employees About Their Retirement Plan
BASE: OFFERS 401(k) PLAN OR OTHER SELF-FUNDED PLANQ2665. How often does your company proactively engage employees with additional education and/or advice about the retirement savings plan?* Quarterly removed as a choice in ‘11** Changed from “Twice a year” to “A few times a year” in ‘11
81
• The vast majority of employers engage with employees at least annually with
additional retirement plan education/advice.
• Larger companies tend to engage more frequently throughout the year.
11
2
14
21
39
5
6
2
1
11
3
N/A
34
40
5
4
3
0
'11'09/'10
'11'09/'10
'11'09/'10
'11'09/'10
'11'09/'10
'11'09/'10
'11'09/'10
'11'09/'10
'11'09/'10
7
12
35
16
26
3
0
1
0
6
11
N/A
53
25
3
2
0
1
'11'09/'10
'11'09/'10
'11'09/'10
'11'09/'10
'11'09/'10
'11'09/'10
'11'09/'10
'11'09/'10
'11'09/'10
B
A
B
B
A
B
B
A
A

© Transamerica Center for Retirement Studies, 2011
Total Small Companies Large Companies(A) (B)
Online tools and resources
Printed brochures and flyers sent in the mail
One-on-one counseling
Group meetings, workshops, or seminars
Informative emails
Other
Not sure/Refused
Types of Education and/or Advice Offered
82
Base: Offers 401(k) or Other Self Funded Plan Total ’11 (N=645); Small Companies: ‘11 (N=364); Large Companies: ‘11 (N=281)NEW QUESTION IN WAVE 12 Q1620. Which of the following does your company offer to its employees regarding education and/or advice about the retirement savings plan?
• Over three-quarters of companies offer online tools and resources as means of
educating and advising employees about retirement savings plans.
• Large companies tend to offer more education and advice than smaller companies.
78
63
62
60
46
6
7
'11
'11
'11
'11
'11
'11
'11
76
61
62
57
43
6
7
'11
'11
'11
'11
'11
'11
'11
95
80
64
79
67
8
1
'11
'11
'11
'11
'11
'11
'11
A
A
A
A

© Transamerica Center for Retirement Studies, 2011
34
64
213
82
5
Helping Employees Get Back on Track with Retirement Savings
BASE: TOTAL RESPONDENTSQ2785 In the last 12 months, has your company and/or your retirement plan provider implemented any programs to help employees get back on track with their retirement savings?
TOTAL Small Companies(A)
Large Companies(B)
(N=743) (N=444) (N=299)
83
• Only 15 percent of companies have implemented programs to get their employees
back on track with their retirement savings in the past 12 months.
• A third of large companies provide these programs, significantly more than small
companies.
15
80
4
■ Yes
■ No
■ Not sure/Refused
A
B

© Transamerica Center for Retirement Studies, 2011
2011 2009/10 2008/09 2007 2006(N=645) (N=533) (N=526) (N=567) (N=573)
Provide information about the distribution options available in your retirement plan*
Allow terminated retirement plan participants to leave their money in the plan*
Distribute retirement planning materials
Allow systematic withdrawals by terminated plan participants
Offer financial counseling
Offer an income annuity as a payout option in your retirement plan
Offer pre-retirement seminars
Nothing
Not sure
Something
68
76
57
47
32
24
21
10
3
<1
77
76
56
51
43
21
19
6
4
<1
79
80
58
55
37
26
24
6
1
0
69
72
54
47
37
27
23
7
3
2
67
70
50
40
36
26
22
7
3
<1
Helping Employees Transition to Retirement with their 401(k)
BASE: OFFERS 401(k) PLAN OR OTHER SELF-FUNDED PLAN Q770. Does your company do any of the following to help employees transition to retirement? CHOOSE ALL THAT APPLY
*While regulations concerning terminated participants may require that companies perform these actions, these statistics only reflect companies’ responses at the time of the survey.
84
• While most companies that offer a 401(k) or other employee-funded plan provide
information about distribution options and allow terminated employees to leave their
savings in the plan, relatively few offer financial counseling, income annuities, or pre-
retirement seminars to assist their employees who are transitioning into retirement.

© Transamerica Center for Retirement Studies, 2011
Helping Employees Transition to Retirement with a 401(k)
Small Companies(A)
Large Companies(B)
2011 2009/10 2008/09 2007 2011 2009/10 2008/09 2007(N=364) (N=256) (N=248) (N=304) (N=281) (N=277) (N=278) (N=263)
Provide information about the distribution options available in your retirement plan*
74% 77% 63% 65% 91%A 90% A 89% A 82% A
Allow terminated retirement plan participants to leave their money in the plan*
74% 78% 72% 67% 90%A 91% A 93% A 89% A
Distribute retirement planning materials 54% 56% 54% 48% 73%A 73% A 73% A 65% A
Allow systematic withdrawals by terminated plan participants
48% 54% 43% 37% 65%A 63% 62% A 59% A
Offer financial counseling 42% 35% 28% 33% 53%A 52% A 50% A 50% A
Offer an income annuity as a payout option in your retirement plan
18% 24% 22% 23% 41%A 43% A 31% 40% A
Offer pre-retirement seminars 15% 20% 17% 19% 46%A 47% A 41% A 42% A
Nothing 7% B 6% 12% B 8% B 1% 1% 0% 0%
Something else <1% 0% 0% <1% <1% 0% 2% A 0%
Not sure 4% B 1% 4% 3% 0% 1% 0% 2%
BASE: OFFERS 401(k) PLAN OR OTHER SELF-FUNDED PLAN Q770. Does your company do any of the following to help employees transition to retirement? CHOOSE ALL THAT APPLY
*While regulations concerning terminated participants may require that companies perform these actions, these statistics only reflect companies’ responses at the time of the survey.
85
• Large companies are more likely to do or offer more than small companies to help
employees who are transitioning into retirement. This finding is consistent with the
previous years’ data.

© Transamerica Center for Retirement Studies, 2011
Helping Employees Transition to Retirement without a 401(k)
BASE: DOES NOT OFFER 401(k) NOR OTHER SELF FUNDED PLANQ780. Does your company do any of the following to help employees transition to retirement? Choose ALL that apply.
2011 2009/10 2008/09 2007 2006(N=98) (N=68) (N=70) (N=85) (N=86)
Distribute retirement planning materials
Offer financial counseling
Offer pre-retirement seminars
Nothing
86
• Most companies that do not offer a 401(k) or employee-funded plan do nothing to
help their employees transition into retirement.
16
15
2
74
15
12
6
83
23
8
15
75
13
11
7
78
22
12
5
77

© Transamerica Center for Retirement Studies, 2011
◄ TOTAL DISAGREE TOTAL AGREE ►
Not sure/Refused
2011 (N=645) <1%
2009/10 (N=533) 1%
2008/09 (N=526) 1%
2007 (N=567) <1%
2006 (N=573) 1%
2005 (N=530) 1%
Employer Satisfaction with Plan Provider
BASE: OFFERS 401(k) PLAN OR OTHER SELF-FUNDED PLANQ740. Our company is satisfied with our retirement plan provider.
87
• The vast majority of companies agree that they are satisfied with their retirement
plan provider.
2
1
4
5
3
2
3
1
1
4
2%
4%
4%
6%
4%
6%
24
26
25
19
22
16
73
70
69
74
73
77
97%
95%
95%
94%
95%
93%
Strongly disagree Somewhat disagree Somewhat agree Strongly agree

© Transamerica Center for Retirement Studies, 2011
Small Companies Large Companies(A) (B)
Strongly agree
Somewhat agree
Somewhat disagree
Strongly disagree
Not sure/Refused
70
26
2
1
1
72
23
4
0
1
72
24
2
1
1
74
20
4
<1
2
'11'09/'…'08/'…
'07
'11'09/'…'08/'…
'07
'11'09/'…'08/'…
'07
'11'09/'…'08/'…
'07
'11'09/'…'08/'…
'07
75
18
5
1
<1
69
26
4
<1
1
70
26
1
3
1
73
25
2
<1
<1
'11'09/'…'08/'…
'07
'11'09/'…'08/'…
'07
'11'09/'…'08/'…
'07
'11'09/'…'08/'…
'07
'11'09/'…'08/'…
'07
Employer Satisfaction with Plan Provider
BASE: OFFERS 401(k) PLAN OR OTHER SELF-FUNDED PLAN Small Companies: ‘07 (N= 304) ’08/’09 (N=248), ’09/’10 (N=256), ‘11 (N=364);Large Companies: ‘07 (N=263) ’08/’09 (N=278), ’09/’10 (N=277), ‘11 (N=281)Q740. Our company is satisfied with our retirement plan provider.
88
• The vast majority of small and large companies agree that their company is satisfied
with their retirement plan provider.
Agree
Disagree
Agree
DisagreeA
‘11: 98%‘09/’10: 95%‘08/’09: 95%
‘07: 93%
‘11: 2%‘09/’10: 4%‘08/’09: 4%
‘07: 6%
‘11: 94%‘09/’10: 96%‘08/’09: 95%
‘07: 96%
‘11: 5%‘09/’10: 3%‘08/’09: 4%
‘07: 3%
A
B
A
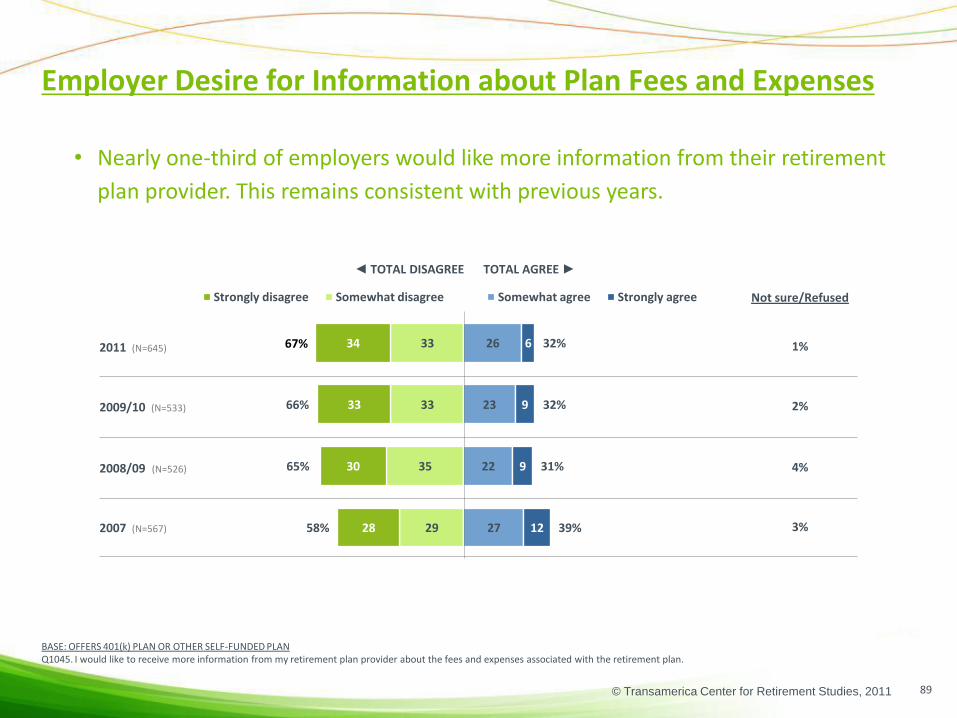
© Transamerica Center for Retirement Studies, 2011
◄ TOTAL DISAGREE TOTAL AGREE ►
Not sure/Refused
2011 (N=645) 1%
2009/10 (N=533) 2%
2008/09 (N=526) 4%
2007 (N=567) 3%
Employer Desire for Information about Plan Fees and Expenses
BASE: OFFERS 401(k) PLAN OR OTHER SELF-FUNDED PLANQ1045. I would like to receive more information from my retirement plan provider about the fees and expenses associated with the retirement plan.
89
• Nearly one-third of employers would like more information from their retirement
plan provider. This remains consistent with previous years.
33
33
35
29
34
33
30
28
66%
65%
58%
26
23
22
27
6
9
9
12
32%
32%
31%
39%
Strongly disagree Somewhat disagree Somewhat agree Strongly agree
67%

© Transamerica Center for Retirement Studies, 2011
Small Companies Large Companies(A) (B)
Strongly agree
Somewhat agree
Somewhat disagree
Strongly disagree
Not sure/Refused
13
30
34
22
1
10
26
40
22
2
7
24
37
28
4
6
33
33
25
2
'11'09/'…'08/'…
'07
'11'09/'…'08/'…
'07
'11'09/'…'08/'…
'07
'11'09/'…'08/'…
'07
'11'09/'…'08/'…
'07
12
27
29
30
3
9
21
34
31
4
9
23
33
33
1
6
25
33
35
1
'11'09/'…'08/'…
'07
'11'09/'…'08/'…
'07
'11'09/'…'08/'…
'07
'11'09/'…'08/'…
'07
'11'09/'…'08/'…
'07
Employer Desire for Information about Plan Fees and Expenses
BASE: OFFERS 401(k) PLAN OR OTHER SELF-FUNDED PLAN Small Companies: ‘07 (N= 304) ’08/’09 (N=248), ’09/’10 (N=256), ‘11 (N=364);Large Companies: ‘07 (N=263) ’08/’09 (N=278), ’09/’10 (N=277), ‘11 (N=281)Q1045. I would like to receive more information from my retirement plan provider about the fees and expenses associated with the retirement plan.
90
• Nearly 40 percent of large companies would like more information regarding fees and
expenses from their retirement plan provider compared to only 30 percent of small
companies.
Agree
Disagree
Agree
Disagree
‘11: 30%‘09/’10: 32%‘08/’09: 30%
‘07: 39%
‘11: 68%‘09/’10: 66%‘08/’09: 65%
‘07: 58%
‘11: 39%‘09/’10: 31%‘08/’09: 36%
‘07: 43%
‘11: 58%‘09/’10: 65%‘08/’09: 62%
‘07: 56%
A
B
B
A
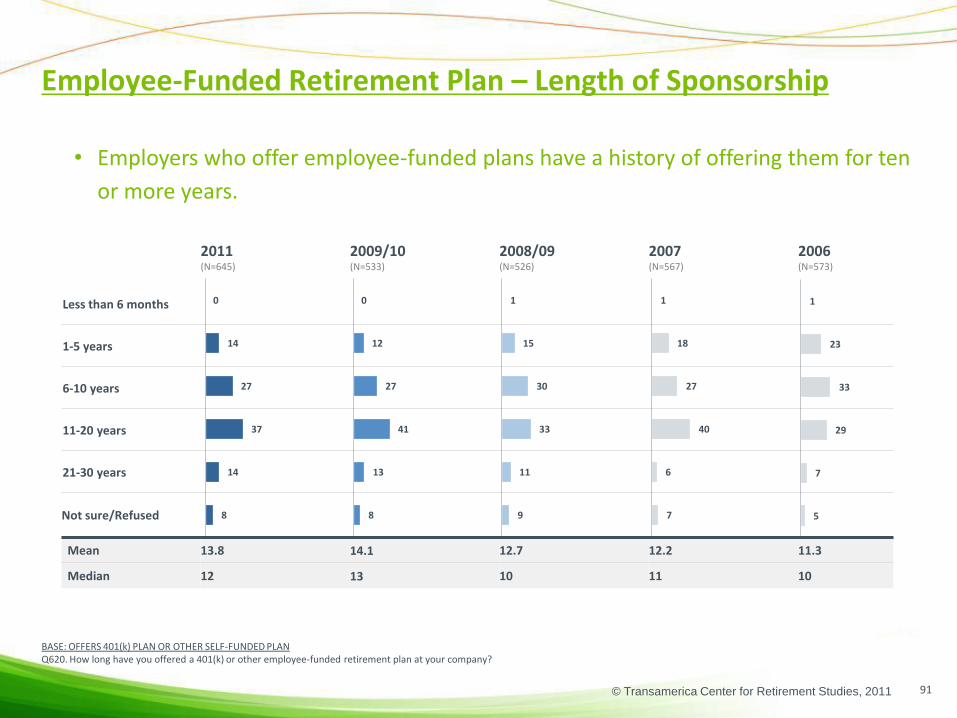
© Transamerica Center for Retirement Studies, 2011
Employee-Funded Retirement Plan – Length of Sponsorship
91
BASE: OFFERS 401(k) PLAN OR OTHER SELF-FUNDED PLANQ620. How long have you offered a 401(k) or other employee-funded retirement plan at your company?
2011 2009/10 2008/09 2007 2006(N=645) (N=533) (N=526) (N=567) (N=573)
Less than 6 months
1-5 years
6-10 years
11-20 years
21-30 years
Not sure/Refused
Mean 13.8 14.1 12.7 12.2 11.3
Median 12 13 10 11 10
• Employers who offer employee-funded plans have a history of offering them for ten
or more years.
0
14
27
37
14
8
1
18
27
40
6
7
1
15
30
33
11
9
0
12
27
41
13
8
1
23
33
29
7
5

© Transamerica Center for Retirement Studies, 2011
Small Companies Large Companies
(A) (B)
Less than 6 months
1-5 year(s)
6-10 years
11-20 years
21-30 years
Not sure/Refused
Mean Median Mean Median20112009/102008/09
13.113.712.1
121210
18.7 A17.2 A16.1 A
20 1515
2007 11.8 10 14.9 A 15 A
1
11
22
36
17
11
1
7
20
38
19
14
0
5
19
41
22
13
<1
3
18
36
30
13
'11'09/'10'08/'09
'07
'11'09/'10'08/'09
'07
'11'09/'10'08/'09
'07
'11'09/'10'08/'09
'07
'11'09/'10'08/'09
'07
'11'09/'10'08/'09
'07
B
1
19
28
41
5
6
2
16
32
32
10
8
0
13
29
41
11
7
0
16
29
37
10
7
'11'09/'10'08/'09
'07
'11'09/'10'08/'09
'07
'11'09/'10'08/'09
'07
'11'09/'10'08/'09
'07
'11'09/'10'08/'09
'07
'11'09/'10'08/'09
'07
Employee-Funded Retirement Plan – Length of Sponsorship
BASE: OFFERS 401(k) PLAN OR OTHER SELF-FUNDED PLAN; Small Companies: ‘07 (N= 304) ’08/’09 (N=248), ’09/’10 (N=256), ‘11 (N=364);Large Companies: ‘07 (N=263) ’08/’09 (N=278), ’09/’10 (N=277), ‘11 (N=281)Q620. How long have you offered a 401(k) or other employee-funded retirement plan at your company?
92
B
A
A
B
B
A
A
B
• Larger companies have generally offered employee-funded plans for a longer time
than small companies.
A
B
B
A
A

© Transamerica Center for Retirement Studies, 2011
Not sure/Refused
2011 (N=645) 10%
2009/10 (N=533) 7%
2008/09 (N=526) 11%
2007 (N=567) 7%
2006 (N=573) 7%
2005 (N=530) 11%
25
26
22
23
19
21
65
67
67
70
74
68
No Yes
Use of Outside Advisors
BASE: OFFERS 401(k) PLAN OR OTHER SELF-FUNDED PLANQ690. Did you use an outside advisor to help you select your retirement plan?
93
• About two-thirds of employers offering an employee-funded plan use an outside
advisor to help select the retirement plan, similar to previous years, but there appears
to be a gradual trend of fewer companies using an outside advisor since 2006.

© Transamerica Center for Retirement Studies, 2011
Small Companies Large Companies(A) (B)
Yes
No
Not sure/Refused
Use of Outside Advisors
94
BASE: OFFERS 401(k) PLAN OR OTHER SELF-FUNDED PLAN: Small Companies: ‘07 (N= 304) ’08/’09 (N=248), ’09/’10 (N=256), ‘11 (N=364);Large Companies: ‘07 (N=263) ’08/’09 (N=278), ’09/’10 (N=277), ‘11 (N=281)Q690. Did you use an outside advisor to help you select your retirement plan?
A
• Employers are likely to use an outside advisor regardless of company size.
70
24
7
68
22
10
68
26
6
66
25
9
'11'09/'…'08/'…
'07
'11'09/'…'08/'…
'07
'11'09/'…'08/'…
'07
70
21
9
62
23
15
58
27
15
62
26
12
'11'09/'…'08/'…
'07
'11'09/'…'08/'…
'07
'11'09/'…'08/'…
'07

© Transamerica Center for Retirement Studies, 2011
2011 2009/10 2008/09 2007 2006(N=409) (N=334) (N=334) (N=395) (N=370)
Financial Planner/Broker
Other Benefits Consultant
Accountant/CPA
Insurance Agent
Bank Advisor
TPA/Benefits Administrator
Attorney/Lawyer
Investment Advisor/Broker
Broker/Agent
Other type of advisor
Not sure
50
17
11
8
7
6
5
2
1
5
3
62
9
16
8
11
17
8
<1
0
5
2
Types of Advisors
BASE: USED OUTSIDE ADVISOR TO HELP SELECT PLANQ700. What type of advisor did you use? SELECT ALL THAT APPLY
69
13
16
11
8
18
10
1
<1
-
3
95
66
11
13
13
6
15
7
0
<1
<1
4
57
12
14
10
2
13
1
1
2
2
3
• Financial planners/brokers are the most frequently used type of financial advisor.
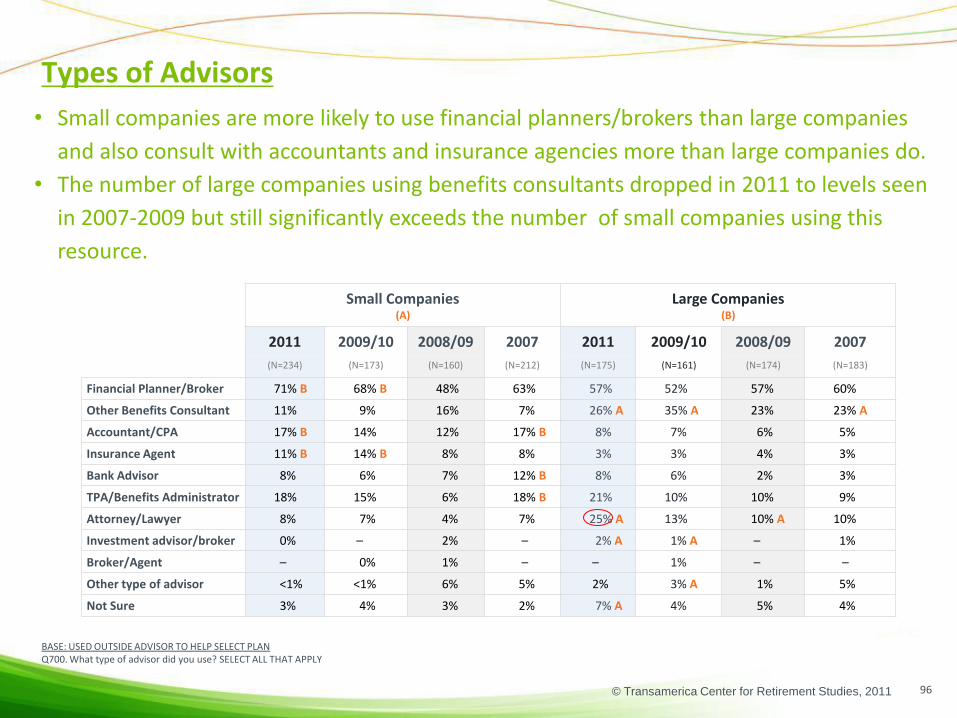
© Transamerica Center for Retirement Studies, 2011
Types of Advisors
96
• Small companies are more likely to use financial planners/brokers than large companies
and also consult with accountants and insurance agencies more than large companies do.
• The number of large companies using benefits consultants dropped in 2011 to levels seen
in 2007-2009 but still significantly exceeds the number of small companies using this
resource.
BASE: USED OUTSIDE ADVISOR TO HELP SELECT PLANQ700. What type of advisor did you use? SELECT ALL THAT APPLY
Small Companies(A)
Large Companies(B)
2011 2009/10 2008/09 2007 2011 2009/10 2008/09 2007
(N=234) (N=173) (N=160) (N=212) (N=175) (N=161) (N=174) (N=183)
Financial Planner/Broker 71% B 68% B 48% 63% 57% 52% 57% 60%
Other Benefits Consultant 11% 9% 16% 7% 26% A 35% A 23% 23% A
Accountant/CPA 17% B 14% 12% 17% B 8% 7% 6% 5%
Insurance Agent 11% B 14% B 8% 8% 3% 3% 4% 3%
Bank Advisor 8% 6% 7% 12% B 8% 6% 2% 3%
TPA/Benefits Administrator 18% 15% 6% 18% B 21% 10% 10% 9%
Attorney/Lawyer 8% 7% 4% 7% 25% A 13% 10% A 10%
Investment advisor/broker 0% – 2% – 2% A 1% A – 1%
Broker/Agent – 0% 1% – – 1% – –
Other type of advisor <1% <1% 6% 5% 2% 3% A 1% 5%
Not Sure 3% 4% 3% 2% 7% A 4% 5% 4%

© Transamerica Center for Retirement Studies, 2011
Plan Administrator History
BASE: OFFERS 401(k) PLAN OR OTHER SELF-FUNDED PLANQ630. How long have you used your current retirement plan administrator?
97
• Most employers have stayed with the same plan administrator for at least five years.
2011 2009/10 2008/09 2007 2006(N=645) (N=533) (N=526) (N=567) (N=573)
Less than 6 months
1-5 years
6-10 years
11-20 years
21+ years
Not sure/Refused
Mean 8.8 8.4 7.1 7.1 6.7
Median 7 6 5 6 5
5
34
27
20
5
9
4
37
35
13
2
9
8
40
26
17
3
6
3
40
31
18
4
4
4
48
26
12
4
6

© Transamerica Center for Retirement Studies, 2011
Plan Administrator History
BASE: OFFERS 401(k) PLAN OR OTHER SELF-FUNDED PLAN: Small Companies: ‘07 (N= 304) ’08/’09 (N=248), ’09/’10 (N=256), ‘11 (N=364);Large Companies: ‘07 (N=263) ’08/’09 (N=278), ’09/’10 (N=277), ‘11 (N=281)Q630. How long have you used your current retirement plan administrator?
98
• Both large and small companies tend to have a long-standing history with their
administrators.
Small Companies Large Companies(A) (B)
Less than 6 months
1-5 year(s)
6-10 years
11-20 years
21+ years
Not sure/Refused
Mean Median Mean Median20112009/102008/09
8.58.26.8
665
10.4 A9.7 8.8 A
8 87
2007 7.0 6 7.4 5
3
44
25
14
5
10
4
37
23
23
4
8
3
33
29
19
7
10
5
30
27
19
9
10
'11'09/'…'08/'…
'07
'11'09/'…'08/'…
'07
'11'09/'…'08/'…
'07
'11'09/'…'08/'…
'07
'11'09/'…'08/'…
'07
'11'09/'…'08/'…
'07
4
36
37
13
2
8
8
41
27
16
2
6
3
41
32
18
3
3
5
35
27
20
5
8
'11'09/'…'08/'…
'07
'11'09/'…'08/'…
'07
'11'09/'…'08/'…
'07
'11'09/'…'08/'…
'07
'11'09/'…'08/'…
'07
'11'09/'…'08/'…
'07
B
A
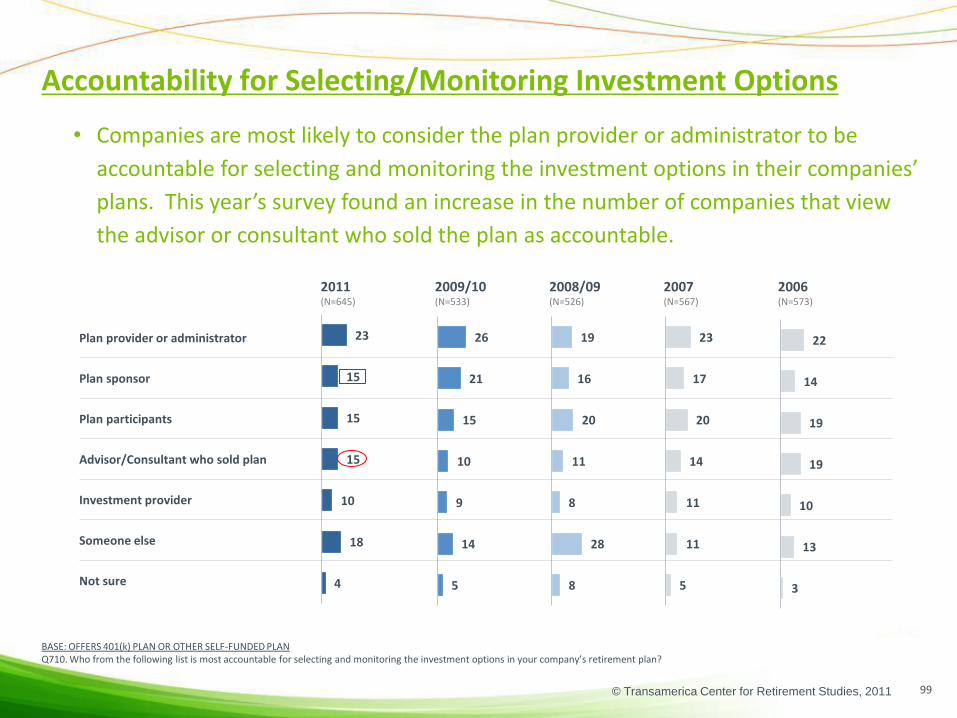
© Transamerica Center for Retirement Studies, 2011
2011 2009/10 2008/09 2007 2006(N=645) (N=533) (N=526) (N=567) (N=573)
Plan provider or administrator
Plan sponsor
Plan participants
Advisor/Consultant who sold plan
Investment provider
Someone else
Not sure
23
17
20
14
11
11
5
23
15
15
15
10
18
4
19
16
20
11
8
28
8
26
21
15
10
9
14
5
22
14
19
19
10
13
3
Accountability for Selecting/Monitoring Investment Options
BASE: OFFERS 401(k) PLAN OR OTHER SELF-FUNDED PLANQ710. Who from the following list is most accountable for selecting and monitoring the investment options in your company’s retirement plan?
99
• Companies are most likely to consider the plan provider or administrator to be
accountable for selecting and monitoring the investment options in their companies’
plans. This year’s survey found an increase in the number of companies that view
the advisor or consultant who sold the plan as accountable.
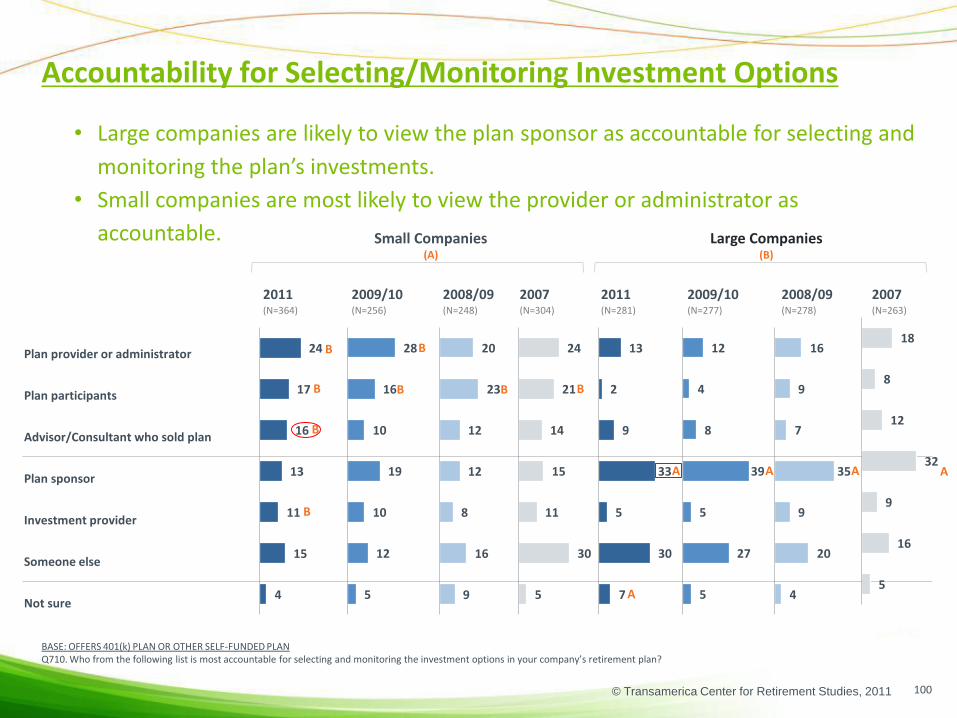
© Transamerica Center for Retirement Studies, 2011
• Large companies are likely to view the plan sponsor as accountable for selecting and
monitoring the plan’s investments.
• Small companies are most likely to view the provider or administrator as
accountable.
Accountability for Selecting/Monitoring Investment Options
100
BASE: OFFERS 401(k) PLAN OR OTHER SELF-FUNDED PLANQ710. Who from the following list is most accountable for selecting and monitoring the investment options in your company’s retirement plan?
Small Companies(A)
Large Companies(B)
2011 2009/10 2008/09 2007 2011 2009/10 2008/09 2007(N=364) (N=256) (N=248) (N=304) (N=281) (N=277) (N=278) (N=263)
Plan provider or administrator
Plan participants
Advisor/Consultant who sold plan
Plan sponsor
Investment provider
Someone else
Not sure
24
17
16
13
11
15
4
28
16
10
19
10
12
5
20
23
12
12
8
16
9
24
21
14
15
11
30
5
13
2
9
33
5
30
7
12
4
8
39
5
27
5
16
9
7
35
9
20
4
18
8
12
32
9
16
5
B B
A
B
A
B
A
B
B
B
B
A
A

© Transamerica Center for Retirement Studies, 2011
Responsibility for Monitoring Fees & Expenses
BASE: OFFERS 401(k) PLAN OR OTHER SELF-FUNDED PLANQ1035. Who is ultimately responsible for monitoring fees and expenses associated with the retirement plan?
101
• The number of companies that view themselves as responsible for monitoring fees
and expenses dropped significantly this year.
2011 2009/10 2008/09 2007(N=645) (N=533) (N=526) (N=567)
Plan sponsor
Plan provider or administrator
Plan participants
Advisor/Consultant who sold plan
Investment provider
Someone else
DK/Refused
23
32
10
7
5
17
6
32
20
7
7
5
25
4
38
18
9
8
3
20
4
41
18
9
7
3
16
6
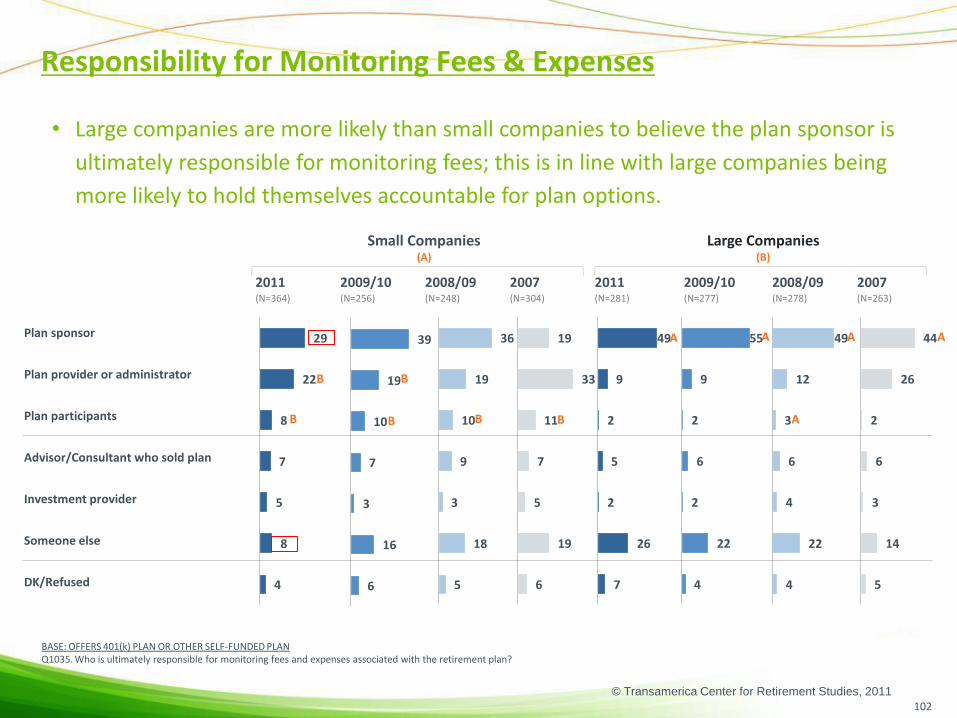
© Transamerica Center for Retirement Studies, 2011
Responsibility for Monitoring Fees & Expenses
BASE: OFFERS 401(k) PLAN OR OTHER SELF-FUNDED PLANQ1035. Who is ultimately responsible for monitoring fees and expenses associated with the retirement plan?
102
• Large companies are more likely than small companies to believe the plan sponsor is
ultimately responsible for monitoring fees; this is in line with large companies being
more likely to hold themselves accountable for plan options.
Small Companies(A)
Large Companies(B)
2011 2009/10 2008/09 2007 2011 2009/10 2008/09 2007(N=364) (N=256) (N=248) (N=304) (N=281) (N=277) (N=278) (N=263)
Plan sponsor
Plan provider or administrator
Plan participants
Advisor/Consultant who sold plan
Investment provider
Someone else
DK/Refused
29
22
8
7
5
8
4
39
19
10
7
3
16
6
36
19
10
9
3
18
5
19
33
11
7
5
19
6
49
9
2
5
2
26
7
55
9
2
6
2
22
4
49
12
3
6
4
22
4
44
26
2
6
3
14
5
B B B
B
A A A
A
A
B
B

© Transamerica Center for Retirement Studies, 2011
Employer Understanding of Plan Fees/Expenses
103
BASE: OFFERS 401(k) PLAN OR OTHER SELF-FUNDED PLANQ1039. People at our company, who are responsible for overseeing the company’s retirement plan, have a clear understanding of the fees and expenses associated with the retirement plan.
• The vast majority of companies agree that those in their firms who are responsible
for overseeing their retirement plans have a clear understanding of fees and
expenses associated with the retirement plan.
◄ TOTAL DISAGREE TOTAL AGREE ►
Not sure/Refused
2011 (N=645) 1%
2009/10 (N=533) 1%
2008/09 (N=526) 2%
2007 (N=567) 1%
3
3
3
4
1
1
2
4
4%
5%
6%
8%
35
42
44
34
59
52
48
57
94%
94%
92%
91%
Strongly disagre Somewhat disagree Somewhat agree Strongly agree

© Transamerica Center for Retirement Studies, 2011
Small Companies Large Companies
(A) (B)
Strongly agree
Somewhat agree
Somewhat disagree
Strongly disagree
Not sure/Refused
BB
B
Disagree
Agree
68
25
4
2
2
67
30
2
0
1
71
23
2
1
3
67
25
5
1
2
'11'09/'…'08/'…
'07
'11'09/'…'08/'…
'07
'11'09/'…'08/'…
'07
'11'09/'…'08/'…
'07
'11'09/'…'08/'…
'07
56
36
4
5
<1
44
47
4
3
2
49
45
3
1
1
58
37
3
1
2
'11'09/'…'08/'…
'07
'11'09/'…'08/'…
'07
'11'09/'…'08/'…
'07
'11'09/'…'08/'…
'07
'11'09/'…'08/'…
'07
Employer Understanding of Plan Fees/Expenses
BASE: OFFERS 401(k) PLAN OR OTHER SELF-FUNDED PLAN Small Companies: ‘07 (N= 304) ’08/’09 (N=248), ’09/’10 (N=256), ‘11 (N=364); Large Companies: ‘07 (N=263) ’08/’09 (N=278), ’09/’10 (N=277), ‘11 (N=281)Q1039. People at our company, who are responsible for overseeing the company’s retirement plan, have a clear understanding of the fees and expenses associated with the retirement plan.
104
A
• Small companies level of agreement that the people responsible at their company
have a clear understanding of fees and expenses has steadily increased .
Agree
Disagree
A
B
‘11: 4%‘09/’10: 5%‘08/’09: 6%
‘07: 8%
’11: 6%‘09/’10: 3%‘08/’09: 2%
‘07: 5%
‘11: 95%‘09/’10: 94%‘08/’09: 92%
‘07: 91%
AA
’11: 91%‘09/’10: 94%‘08/’09: 96%
‘07: 93%

© Transamerica Center for Retirement Studies, 2011
12
11
51
9
10
5
2
8
9
47
11
7
16
3
2011 2009/10 2008/09 2007 2006(N=743) (N=601) (N=596) (N=652) (N=659)
At least once per quarter
About every six months
About once a year
About every two years
Less than every two years
Never
Not sure/Refused
Frequency of Retirement Benefits Evaluation
BASE: TOTAL RESPONDENTSQ790. How frequently does your company evaluate the retirement benefits offered to employees?
105
• Seven of ten employers evaluate retirement benefit offerings at least once a year.
11
9
48
10
8
12
2
12
9
47
15
3
9
4
15
8
46
11
5
11
4
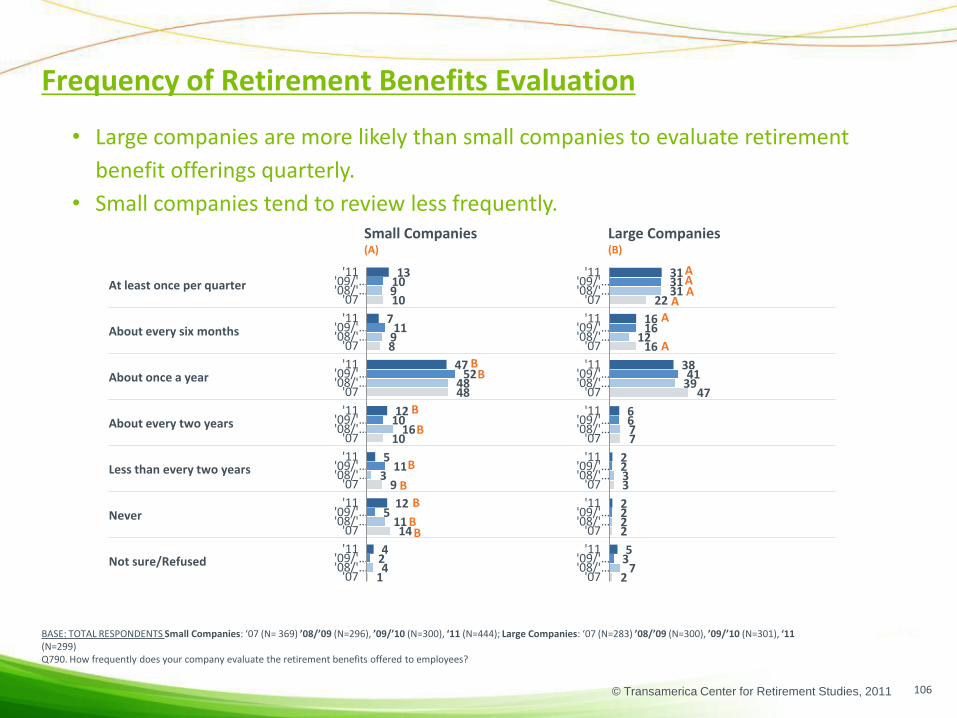
© Transamerica Center for Retirement Studies, 2011
Small Companies Large Companies(A) (B)
At least once per quarter
About every six months
About once a year
About every two years
Less than every two years
Never
Not sure/Refused
22
16
47
7
3
2
2
31
12
39
7
3
2
7
31
16
41
6
2
2
3
31
16
38
6
2
2
5
'11'09/'…'08/'…
'07
'11'09/'…'08/'…
'07
'11'09/'…'08/'…
'07
'11'09/'…'08/'…
'07
'11'09/'…'08/'…
'07
'11'09/'…'08/'…
'07
'11'09/'…'08/'…
'07
10
8
48
10
9
14
1
9
9
48
16
3
11
4
10
11
52
10
11
5
2
13
7
47
12
5
12
4
'11'09/'…'08/'…
'07
'11'09/'…'08/'…
'07
'11'09/'…'08/'…
'07
'11'09/'…'08/'…
'07
'11'09/'…'08/'…
'07
'11'09/'…'08/'…
'07
'11'09/'…'08/'…
'07
A
B
A
A
B
B
A
B
B
B
Frequency of Retirement Benefits Evaluation
BASE: TOTAL RESPONDENTS Small Companies: ‘07 (N= 369) ’08/’09 (N=296), ’09/’10 (N=300), ‘11 (N=444); Large Companies: ‘07 (N=283) ’08/’09 (N=300), ’09/’10 (N=301), ‘11 (N=299)Q790. How frequently does your company evaluate the retirement benefits offered to employees?
106
• Large companies are more likely than small companies to evaluate retirement
benefit offerings quarterly.
• Small companies tend to review less frequently.
A
A
B
B
B

© Transamerica Center for Retirement Studies, 2011
Changes Made to the 401(k) Plan In the Past 12 Months
BASE: OFFERS 401(k) PLAN OR OTHER SELF-FUNDED PLANQ670. In the past 12 months, has your company made any changes to its 401(k) plan or other employee self-funded plan?
107
• Only 22 percent of companies reported making any changes to their 401(k) or similar
plan in the last 12 months. This represents a decrease in the number of companies
that made a change to their 401(k) plan compared to 2009/10.
Not sure/Refused
2011 (N=645) 0%
2009/10 (N=533) 0%
2008/09 (N=526) <1%
2007 (N=567) <1%
2006 (N=573) <1%
2005 (N=530) <1%
78
73
76
76
81
77
22
27
24
23
19
22
No Yes

© Transamerica Center for Retirement Studies, 2011
Small Companies Large Companies(A) (B)
Yes
No
Not sure/Refused
22
78
<1
21
79
0
25
75
0
21
79
0
'11
'09/'…
'08/'…
'07
'11
'09/'…
'08/'…
'07
'11
'09/'…
'08/'…
'07
34
65
1
36
63
1
40
59
1
26
74
0
'11
'09/'…
'08/'…
'07
'11
'09/'…
'08/'…
'07
'11
'09/'…
'08/'…
'07
Changes Made to the 401(k) Plan In the Past 12 Months
BASE: OFFERS 401(k) PLAN OR OTHER SELF-FUNDED PLAN Small Companies: ‘07 (N= 304) ’08/’09 (N=248), ’09/’10 (N=256), ‘11 (N=364); Large Companies: ‘07 (N=263) ’08/’09 (N=278), ’09/’10 (N=277), ‘11 (N=281)Q670. In the past 12 months, has your company made any changes to its 401(k) plan or other employee self-funded plan?
108
B
A
A
B
A
B
A
• Fewer companies, both large and small, made changes to their plan this year.

© Transamerica Center for Retirement Studies, 2011
Changes Made to the 401(k) Plan In the Past 12 Months
109
BASE: MADE CHANGES TO PLAN IN LAST YEARQ680. What was changed in the plan? CHOOSE ALL THAT APPLY
2011 2009/10 2008/09 2007(N=159) (N=185) (N=172) (N=177)
Changed investment selections/fund choices
Changed plan providerAdded Roth 401(k) optionAdded strategic allocation or target maturity funds
Increased company match
Added a managed account option
Changed form of company match
Added a new plan
Decreased company match
Reduced eligibility period/waiting period
Changed vesting schedule
Changed regulations/compliance
Increased employee contribution limit
Terminated the plan
Added an auto-enrollment feature
Froze Pension Plan
Some other change
None/ Nothing
Not sure/Refused
• The number of employers changing investment selections/fund choices and plan
providers both returned to 2007 levels, occurring in many more companies in 2011.
• Fewer companies decreased their company match.
61
29
18
18
14
14
13
13
12
12
8
8
7
7
6
5
3
3
48
15
25
12
5
5
23
14
28
11
8
1
11
0
5
1
1
4
1
38
20
17
9
9
7
12
10
19
11
16
1
5
4
10
1
13
0
60
27
19
22
15
12
15
18
9
13
16
6
23
3
11
2– –
–
–
–

© Transamerica Center for Retirement Studies, 2011
Small Companies(A)
Large Companies(B)
2011 2009/10 2008/09 2007 2011 2009/10 2008/09 2007(N=87) (N=73) (N=72) (N=87) (N=72) (N=112) (N=100) (N=90)
Changed investment selections/fund choices
Changed plan provider
Added Roth 401(k) option
Added strategic allocation or target maturity funds
Added a managed account option
Increased company match
Added a new plan
Reduced eligibility period/waiting period
Decreased company match
Changed form of company match
Changed regulations/compliance
Increased employee contribution limit
Changed vesting schedule
Terminated the plan
Added an auto-enrollment feature
Froze Pension Plan
Some other change
None/ Nothing
Not sure
56
12
12
23
15
7
9
8
32
24
5
10
1
12
4
5
1
45
12
16
15
9
19
5
15
16
18
1
17
9
1
17
3
7
1
61
18
12
26
19
20
10
14
2
16
14
18
22
4
12
0
64
19
14
22
7
8
7
8
12
15
3
4
7
1
10
3
0
1
Changes Made to the 401(k) Plan In the Past 12 Months
110
BASE: MADE CHANGES TO PLAN IN LAST YEARQ680. What was changed in the plan? CHOOSE ALL THAT APPLY
A
• More small companies that made changes to their plans added a managed account
this year and increased the match.
60
30
19
17
16
15
14
13
12
12
9
8
8
8
5
5
3
3
46
15
27
10
3
5
15
12
28
23
2
13
8
0
4
1
1
5
2
36
22
18
7
6
6
11
9
21
11
1
2
18
6
7
0
15
0
60
29
21
21
11
14
19
13
11
15
4
16
23
3
10
2
– – –
–
–
– –
–
– –
–
–

© Transamerica Center for Retirement Studies, 2011
Total Small Companies Large Companies
(A) (B)
Yes
No
Not sure/Refused
20
73
8
24
70
5
19
75
7
'11
'09/'…
'08/'…
'11
'09/'…
'08/'…
'11
'09/'…
'08/'…
Considering Changes to 401(k) Plan in the Next 12 Months
111
BASE: OFFERS 401(k) PLAN OR OTHER SELF-FUNDED PLAN : Total :’08/’09 (N=526), ’09/’10 (N=533), ‘11 (N=645); Small Companies:’08/’09 (N=248), ’09/’10 (N=256), ‘11 (N=364); Large Companies: ’08/’09 (N=278), ’09/’10 (N=277), ‘11 (N=281)Q1430. In the next 12 months, is your company considering making any changes to its 401(k) plan or other employee self-funded plan?
B
A
B
• Overall, only about one in ten companies are considering making any changes to
their 401(k) or similar plans in the 12 months.
• However, large companies are more likely than small companies to consider making
changes.
10
85
5
11
83
6
8
85
7
'11
'09/'…
'08/'…
'11
'09/'…
'08/'…
'11
'09/'…
'08/'…
11
83
5
13
82
5
9
84
7
'11
'09/'…
'08/'…
'11
'09/'…
'08/'…
'11
'09/'…
'08/'…
A
B

© Transamerica Center for Retirement Studies, 2011
Considering Changes to 401(k) Plan in the Next 12 Months
112
•No Significance testing due to small base sizes
BASE: Plans to MAKE CHANGES TO PLAN IN NEXT 12 MONTHSQ1435. What changes is your company considering to make in its 401(k) or other employee self-funded plan in the next 12 months? Choose ALL that apply.
Total Small Companies Large Companies
2011 2009/10 2008/09 2011 2009/10 2008/09 2011 2009/10 2008/09(N=88) (N=101) (N=87) (N=35*) (N=34*) (N=33*) (N=53) (N=67) (N=54)
Change investment selections/fund choices
45% 34% 36% 41% 29% 33% 59% 54% 43%
Change plan provider 32% 30% 13% 31% 34% 10% 36% 18% 20%
Increase company match 26% 21% 18% 25% 17% 18% 26% 36% 16%
Add an auto-enrollment feature 13% 7% 19% 12% 1% 22% 17% 27% 11%
Add Roth 401 (k) option 10% 30% 23% 8% 32% 30% 17% 26% 8%
Change form of company match 8% 22% 22% 7% 22% 24% 13% 24% 17%
Decrease company match 8% 13% 9% 9% 16% 6% 6% 3% 17%
Add a new plan 6% 18% 10% 6% 22% 13% 6% 6% 4%
Add strategic allocation or target maturity funds
6% 4% 14% 5% 2% 14% 9% 10% 13%
Increase employee contribution limit 6% 4% 6% 7% 4% 6% 4% 4% 7%
Terminate the plan 6% 3% – 8% 3% – 0% – –
Add a managed account option 4% 3% 10% 3% 1% 7% 6% 9% 16%
Reduce eligibility period/waiting period 4% 5% 2% 3% 4% 1% 6% 6% 4%
Change vesting schedule 2% 6% 10% 1% 8% 12% 4% 3% 5%
Consolidation of plans – 0% 2% – 0% 1% – 0% 4%
Freeze the plan – <1% – – 1% – – – –
Some other change – 1% 5% – 1% 6% – 3% 2%
None/Nothing – 0% 1% – 0% 0% – – 2%
Not sure/Refused 7% <1% 1% 9% – 1% 4% 2% 2%
• Of those considering a change to their 401(k) or similar plan in the next 12 months,
“changing investment selections/fund choices” was the most frequently cited change.
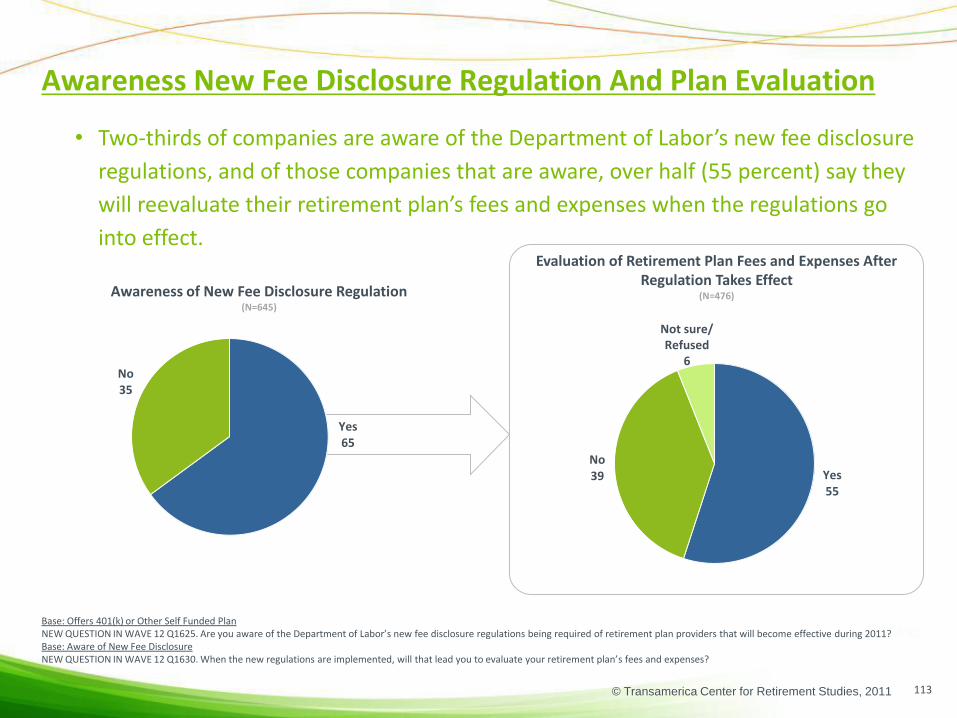
© Transamerica Center for Retirement Studies, 2011
Awareness New Fee Disclosure Regulation And Plan Evaluation
113
Base: Offers 401(k) or Other Self Funded Plan NEW QUESTION IN WAVE 12 Q1625. Are you aware of the Department of Labor’s new fee disclosure regulations being required of retirement plan providers that will become effective during 2011?Base: Aware of New Fee Disclosure NEW QUESTION IN WAVE 12 Q1630. When the new regulations are implemented, will that lead you to evaluate your retirement plan’s fees and expenses?
• Two-thirds of companies are aware of the Department of Labor’s new fee disclosure
regulations, and of those companies that are aware, over half (55 percent) say they
will reevaluate their retirement plan’s fees and expenses when the regulations go
into effect.
Yes65
No 35
Yes55
No 39
Evaluation of Retirement Plan Fees and Expenses After Regulation Takes Effect
(N=476)Awareness of New Fee Disclosure Regulation(N=645)
Not sure/ Refused
6

© Transamerica Center for Retirement Studies, 2011
Awareness New Fee Disclosure Regulation And Plan Evaluation
114
Base: Offers 401(k) or Other Self Funded Plan Small Companies: ‘11 (N=364); Large Companies: ‘11 (N=281)NEW QUESTION IN WAVE 12 Q1625. Are you aware of the Department of Labor’s new fee disclosure regulations being required of retirement plan providers that will become effective during 2011?Base: Aware of New Fee Disclosure Small Companies: ‘11 (N=246); Large Companies: ‘11 (N=230)NEW QUESTION IN WAVE 12 Q1630. When the new regulations are implemented, will that lead you to evaluate your retirement plan’s fees and expenses?
• While the majority of companies are aware of the new regulations, large companies
are more likely to be aware. Large companies are also more likely to evaluate their
retirement plan’s fees and expenses when the new regulations are implemented.
62
37
1
'11
'11
'11
82
17
1
'11
'11
'11
A
Small Companies Large Companies(A) (B)
Yes
No
Not sure/ Refused
54
40
6
'11
'11
'11
61
35
3
'11
'11
'11
Small Companies Large Companies(A) (B)
Yes
No
Not sure/ Refused
Evaluation of Retirement Plan Fees and Expenses After Regulation Takes Effect
Awareness of New Fee Disclosure Regulation

© Transamerica Center for Retirement Studies, 2011
• Economic Expectations
• Perceptions of the Relative Importance of Various Employee Benefits
• Benefit Offerings, including Retirement Benefits
• Perceptions and Management of Current Retirement Plan Offerings
• Perceptions of Employee Involvement with Retirement Planning
Detailed Findings
115
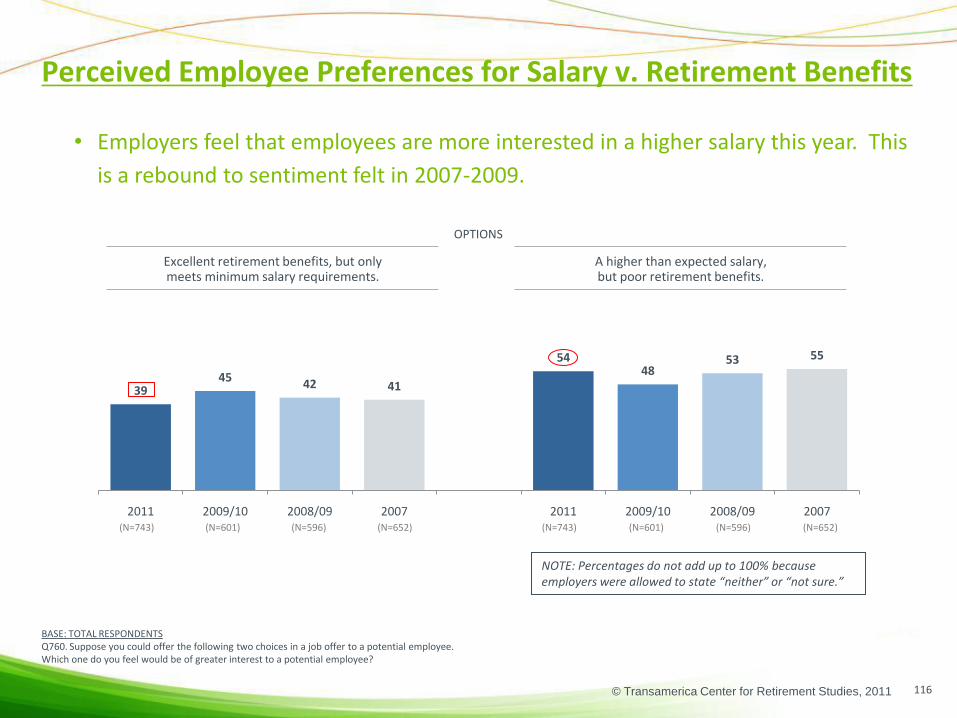
© Transamerica Center for Retirement Studies, 2011
Perceived Employee Preferences for Salary v. Retirement Benefits
Excellent retirement benefits, but only meets minimum salary requirements.
A higher than expected salary, but poor retirement benefits.
(N=743) (N=601) (N=596) (N=652) (N=743) (N=601) (N=596) (N=652)
OPTIONS
BASE: TOTAL RESPONDENTSQ760. Suppose you could offer the following two choices in a job offer to a potential employee. Which one do you feel would be of greater interest to a potential employee?
116
• Employers feel that employees are more interested in a higher salary this year. This
is a rebound to sentiment felt in 2007-2009.
NOTE: Percentages do not add up to 100% because employers were allowed to state “neither” or “not sure.”
3945
42 41
5448
53 55
2011 2009/10 2008/09 2007 2011 2009/10 2008/09 2007

© Transamerica Center for Retirement Studies, 2011
Small Companies Large Companies
(A) (B)
Option A: Excellent retirement benefits, but only meets the potential employee’s minimum salary requirements
Option B: A higher than expected salary, but with poor retirement benefits
Neither
Not sure/Refused
Perceived Employee Preferences for Salary v. Retirement Benefits
BASE: TOTAL RESPONDENTS; Small Companies: ‘07 (N= 369) ’08/’09 (N=296), ’09/’10 (N=300), ‘11 (N=444); Large Companies: ‘07 (N=283) ’08/’09 (N=300), ’09/’10 (N=301), ‘11 (N=299)Q760. Suppose you could offer the following two choices in a job offer to a potential employee. Which one do you feel would be of greater interest to a potential employee?
117
• Large companies are more likely to believe that their employees would favor
excellent retirement benefits, while small companies believe that their employees
would prefer higher salaries.
39
57
3
1
41
55
3
1
45
48
3
4
37
55
2
6
'11'09/'…'08/'…
'07
'11'09/'…'08/'…
'07
'11'09/'…'08/'…
'07
'11'09/'…'08/'…
'07
B
B
B
51
43
2
4
47
44
4
5
45
47
3
5
50
41
3
5
'11'09/'…'08/'…
'07
'11'09/'…'08/'…
'07
'11'09/'…'08/'…
'07
'11'09/'…'08/'…
'07
A
A

© Transamerica Center for Retirement Studies, 2011
◄ TOTAL DISAGREE TOTAL AGREE ►
Not sure/Refused
2011 (N=645) 1%
2009/10 (N=533) 1%
2008/09 (N=526) <1%
2007 (N=567) 2%
2006 (N=573) 1%
2005 (N=530) 1%
Perceived Employee Satisfaction with Plan
BASE: OFFERS 401(k) PLAN OR OTHER SELF-FUNDED PLANQ750. Our employees are satisfied with the retirement plan the company offers.
118
• The vast majority of companies agree their employees are satisfied with the
retirement plan offered.
0
0
3
2
4
2
1
3
1
1
2
3%
2%
4%
2%
2%
5%
34
37
40
34
41
27
61
60
55
62
56
68
95%
97%
95%
96%
98%
95%
Strongly disagree Somewhat disagree Somewhat agree Strongly agree
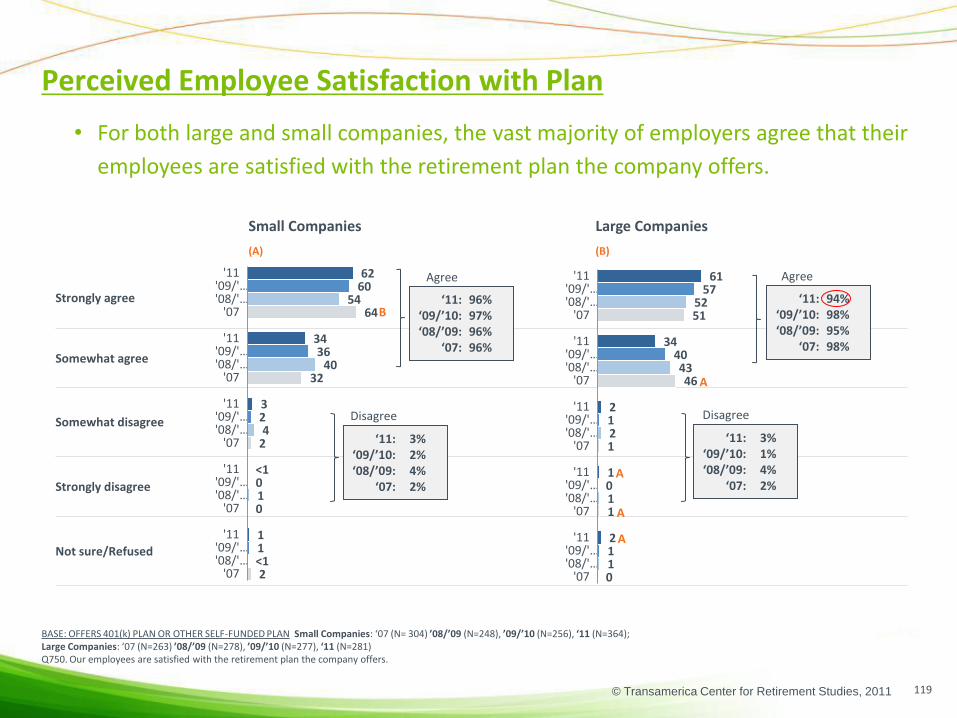
© Transamerica Center for Retirement Studies, 2011
Small Companies Large Companies
(A) (B)
Strongly agree
Somewhat agree
Somewhat disagree
Strongly disagree
Not sure/Refused
51
46
1
1
0
52
43
2
1
1
57
40
1
0
1
61
34
2
1
2
'11'09/'…'08/'…
'07
'11'09/'…'08/'…
'07
'11'09/'…'08/'…
'07
'11'09/'…'08/'…
'07
'11'09/'…'08/'…
'07
64
32
2
0
2
54
40
4
1
<1
60
36
2
0
1
62
34
3
<1
1
'11'09/'…'08/'…
'07
'11'09/'…'08/'…
'07
'11'09/'…'08/'…
'07
'11'09/'…'08/'…
'07
'11'09/'…'08/'…
'07
Perceived Employee Satisfaction with Plan
BASE: OFFERS 401(k) PLAN OR OTHER SELF-FUNDED PLAN Small Companies: ‘07 (N= 304) ’08/’09 (N=248), ’09/’10 (N=256), ‘11 (N=364);Large Companies: ‘07 (N=263) ’08/’09 (N=278), ’09/’10 (N=277), ‘11 (N=281)Q750. Our employees are satisfied with the retirement plan the company offers.
119
• For both large and small companies, the vast majority of employers agree that their
employees are satisfied with the retirement plan the company offers.
Agree
Disagree
Agree
Disagree
B
A
A
A
‘11: 96%‘09/’10: 97%‘08/’09: 96%
‘07: 96%
‘11: 3%‘09/’10: 2%‘08/’09: 4%
‘07: 2%
‘11: 94%‘09/’10: 98%‘08/’09: 95%
‘07: 98%
‘11: 3%‘09/’10: 1%‘08/’09: 4%
‘07: 2%
A
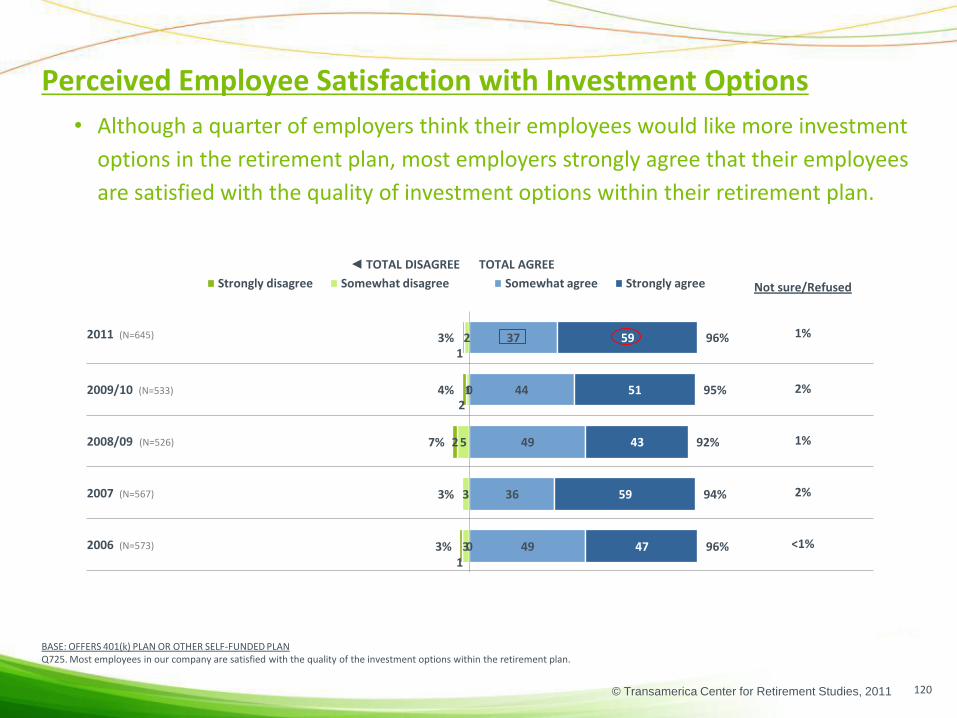
© Transamerica Center for Retirement Studies, 2011
Perceived Employee Satisfaction with Investment Options
120
BASE: OFFERS 401(k) PLAN OR OTHER SELF-FUNDED PLANQ725. Most employees in our company are satisfied with the quality of the investment options within the retirement plan.
• Although a quarter of employers think their employees would like more investment
options in the retirement plan, most employers strongly agree that their employees
are satisfied with the quality of investment options within their retirement plan.
◄ TOTAL DISAGREE TOTAL AGREE
Not sure/Refused
2011 (N=645) 1%
2009/10 (N=533) 2%
2008/09 (N=526) 1%
2007 (N=567) 2%
2006 (N=573) <1%
0
0
2
1
5
3
3
1
2
2
1
3%
4%
7%
3%
3%
37
44
49
36
49
59
51
43
59
47
96%
95%
92%
94%
96%
Strongly disagree Somewhat disagree Somewhat agree Strongly agree

© Transamerica Center for Retirement Studies, 2011
Perceived Employee Satisfaction with Investment Options
BASE: OFFERS 401(k) PLAN OR OTHER SELF-FUNDED PLAN Small Companies: ‘07 (N= 304) ’08/’09 (N=248), ’09/’10 (N=256), ‘11 (N=364);Large Companies: ‘07 (N=263) ’08/’09 (N=278), ’09/’10 (N=277), ‘11 (N=281)Q725. Most employees in our company are satisfied with the quality of the investment options within the retirement plan.
121
• Regardless of company size, the majority of employers strongly agree their
employees are satisfied with the quality of their investment options within the
retirement plan.
Small Companies Large Companies
(A) (B)
Strongly agree
Somewhat agree
Somewhat disagree
Strongly disagree
Not sure/Refused
53
41
2
0
3
40
51
6
0
3
51
44
3
0
1
58
39
<1
0
3
'11'09/'…'08/'…
'07
'11'09/'…'08/'…
'07
'11'09/'…'08/'…
'07
'11'09/'…'08/'…
'07
'11'09/'…'08/'…
'07
60
35
3
<1
2
44
48
4
3
1
51
43
1
3
2
59
37
2
1
1
'11'09/'…'08/'…
'07
'11'09/'…'08/'…
'07
'11'09/'…'08/'…
'07
'11'09/'…'08/'…
'07
'11'09/'…'08/'…
'07
Agree
Disagree
Agree
Disagree
‘11: 96%‘09/’10: 94%‘08/’09: 92%
‘07: 94%
‘11: 3%‘09/’10: 4%‘08/’09: 7%
‘07: 3%
‘11: 97%‘09/’10: 95%‘08/’09: 91%
‘07: 94%
‘11: <1%‘09/’10: 4%‘08/’09: 6%
‘07: 2%
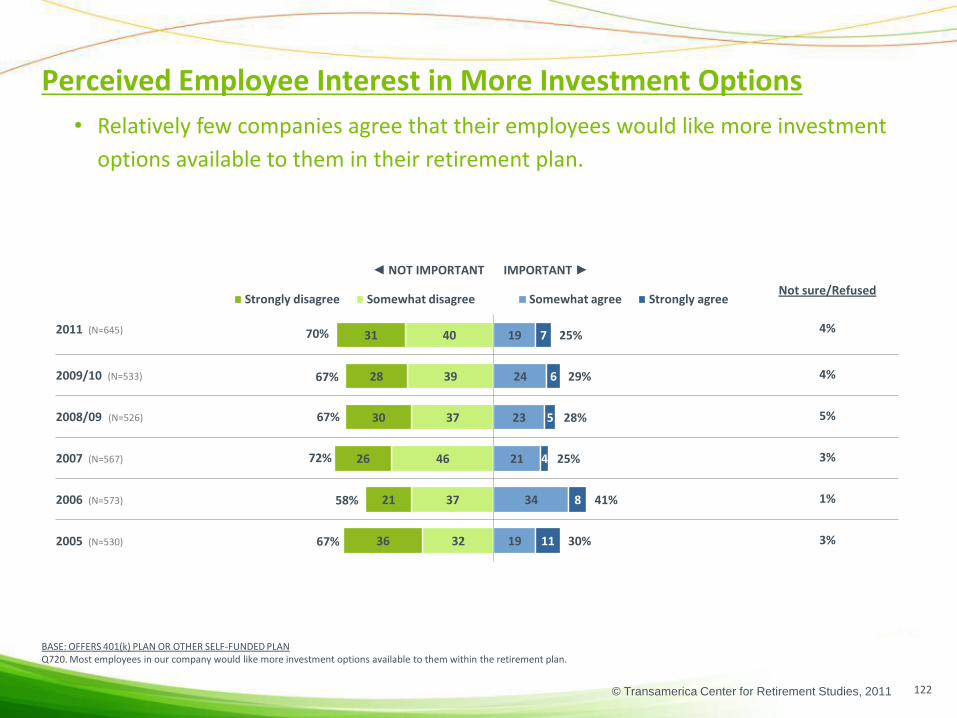
© Transamerica Center for Retirement Studies, 2011
Perceived Employee Interest in More Investment Options
BASE: OFFERS 401(k) PLAN OR OTHER SELF-FUNDED PLANQ720. Most employees in our company would like more investment options available to them within the retirement plan.
122
• Relatively few companies agree that their employees would like more investment
options available to them in their retirement plan.
◄ NOT IMPORTANT IMPORTANT ►
Not sure/Refused
2011 (N=645) 4%
2009/10 (N=533) 4%
2008/09 (N=526) 5%
2007 (N=567) 3%
2006 (N=573) 1%
2005 (N=530) 3%
40
39
37
46
37
32
31
28
30
26
21
36
19
24
23
21
34
19
7
6
5
4
8
11
25%
29%
28%
25%
41%
30%
Strongly disagree Somewhat disagree Somewhat agree Strongly agree
70%
67%
67%
72%
58%
67%
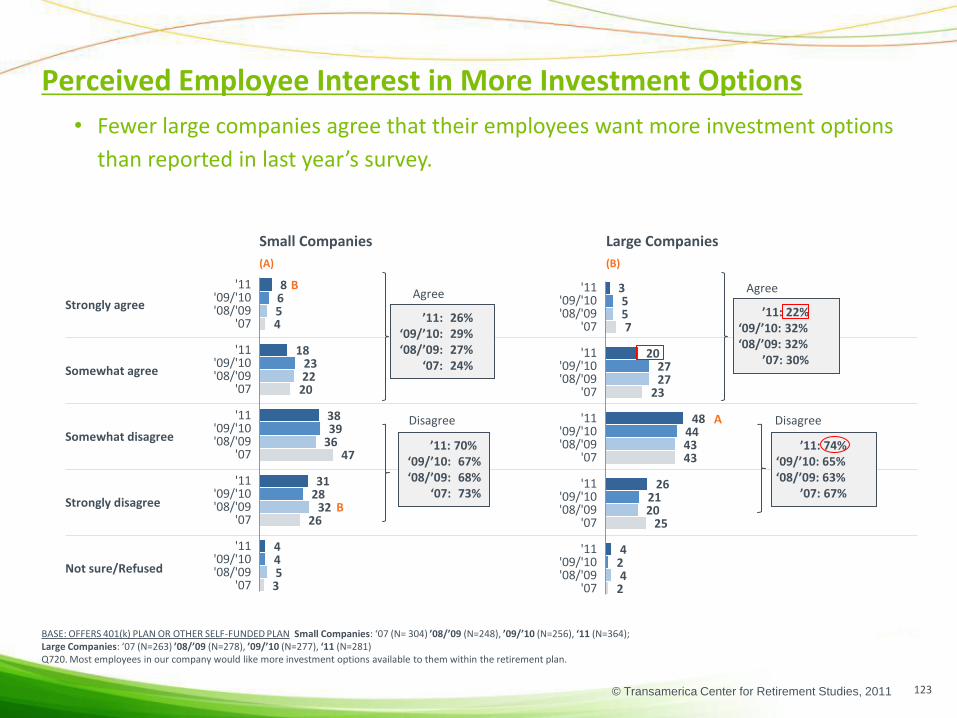
© Transamerica Center for Retirement Studies, 2011
Perceived Employee Interest in More Investment Options
123
BASE: OFFERS 401(k) PLAN OR OTHER SELF-FUNDED PLAN Small Companies: ‘07 (N= 304) ’08/’09 (N=248), ’09/’10 (N=256), ‘11 (N=364); Large Companies: ‘07 (N=263) ’08/’09 (N=278), ’09/’10 (N=277), ‘11 (N=281)Q720. Most employees in our company would like more investment options available to them within the retirement plan.
• Fewer large companies agree that their employees want more investment options
than reported in last year’s survey.
Small Companies Large Companies
(A) (B)
Strongly agree
Somewhat agree
Somewhat disagree
Strongly disagree
Not sure/Refused
7
23
43
25
2
5
27
43
20
4
5
27
44
21
2
3
20
48
26
4
'11'09/'10'08/'09
'07
'11'09/'10'08/'09
'07
'11'09/'10'08/'09
'07
'11'09/'10'08/'09
'07
'11'09/'10'08/'09
'07
4
20
47
26
3
5
22
36
32
5
6
23
39
28
4
8
18
38
31
4
'11'09/'10'08/'09
'07
'11'09/'10'08/'09
'07
'11'09/'10'08/'09
'07
'11'09/'10'08/'09
'07
'11'09/'10'08/'09
'07
B
’11: 26%‘09/’10: 29%‘08/’09: 27%
‘07: 24%
’11: 70%‘09/’10: 67%‘08/’09: 68%
‘07: 73%
’11: 22%‘09/’10: 32%‘08/’09: 32%
’07: 30%
’11: 74%‘09/’10: 65%‘08/’09: 63%
’07: 67%
Agree
Disagree
Agree
Disagree
B
A

© Transamerica Center for Retirement Studies, 2011
Perceived Employee Involvement with Retirement Savings
BASE: TOTAL RESPONDENTSQ810. Employees at my company are generally very involved in monitoring and managing their retirement savings.
124
• There is an increase this year in employers’ level of agreement that employees are
very involved in monitoring and managing their retirement savings.
◄ TOTAL DISAGREE TOTAL AGREE ►
Not sure/Refused
2011 (N=743) 8%
2009/10 (N=601) 5%
2008/09 (N=596) 5%
2007 (N=652) 4%
2006 (N=659) 2%
2005 (N=597) 6%
26
26
29
24
27
20
15
21
19
22
25
22
40%
47%
48%
47%
42%
40
36
34
36
36
30
13
12
13
13
10
22
53%
48%
47%
49%
46%
52%
Strongly disagree Somewhat disagree Somewhat agree Strongly agree
52%

© Transamerica Center for Retirement Studies, 2011
Small Companies Large Companies
(A) (B)
Strongly agree
Somewhat agree
Somewhat disagree
Strongly disagree
Not sure/Refused
10
45
29
15
0
11
44
34
10
2
14
46
30
9
1
10
44
34
10
1
'11'09/'…'08/'…
'07
'11'09/'…'08/'…
'07
'11'09/'…'08/'…
'07
'11'09/'…'08/'…
'07
'11'09/'…'08/'…
'07
14
34
24
23
5
14
32
28
20
6
12
35
25
22
6
13
39
25
15
8
'11'09/'…'08/'…
'07
'11'09/'…'08/'…
'07
'11'09/'…'08/'…
'07
'11'09/'…'08/'…
'07
'11'09/'…'08/'…
'07
Perceived Employee Involvement with Retirement Savings
BASE: TOTAL RESPONDENTS Small Companies: ‘07 (N= 369) ’08/’09 (N=296), ’09/’10 (N=300), ‘11 (N=444); Large Companies: ‘07 (N=283) ’08/’09 (N=300), ’09/’10 (N=301), ‘11 (N=299)Q810. Employees at my company are generally very involved in monitoring and managing their retirement savings.
125
B
AA
B
A
B
• This year’s survey found that large and small companies generally share the same
level of agreement that their employees are very involved in managing and
monitoring their retirement savings.
Agree
Disagree
Agree
Disagree
B
A
‘11: 52%‘09/’10: 47%‘08/’09: 46%
‘07: 48%
‘11: 40%‘09/’10: 47%‘08/’09: 48%
‘07: 47%
‘11: 55%‘09/’10: 60% A‘08/’09: 55%
‘07: 55%
‘11: 44%‘09/’10: 39%‘08/’09: 43%
‘07: 45%
B

© Transamerica Center for Retirement Studies, 2011
Perceived Employee Knowledge About Retirement Investing
BASE: TOTAL RESPONDENTSQ820. Most employees at my company do not know as much as they should about retirement investing.
126
• About four in five employers agree their employees do not know as much as they
should about retirement investing.
• However, consistent with the past three years’ findings, there has been an overall
shift from “strongly agree” to “somewhat agree.”
◄ TOTAL DISAGREE TOTAL AGREE ►
Not sure/Refused
2011 (N=743) 3%
2009/10 (N=601) 4%
2008/09 (N=596) 1%
2007 (N=652) 2%
2006 (N=659) 3%
2005 (N=597) 5%
10
12
9
10
8
9
5
6
4
9
2
9
15%
18%
14%
19%
9%
18%
44
45
42
32
33
26
37
34
43
47
55
52
82%
79%
85%
79%
87%
77%
Strongly disagree Somewhat disagree Somewhat agree Strongly agree

© Transamerica Center for Retirement Studies, 2011
Perceived Employee Knowledge About Retirement Investing
127
BASE: TOTAL RESPONDENTS Small Companies: ‘07 (N= 369) ’08/’09 (N=296), ’09/’10 (N=300), ‘11 (N=444); Large Companies: ‘07 (N=283) ’08/’09 (N=300), ’09/’10 (N=301), ‘11 (N=299)Q820. Most employees at my company do not know as much as they should about retirement investing.
• Large companies more often agree that their employees don’t know as much as they
should about retirement investing.
Small Companies Large Companies(A) (B)
Strongly agree
Somewhat agree
Somewhat disagree
Strongly disagree
Not sure/Refused
48
39
10
3
0
48
40
8
2
2
43
43
9
4
2
45
43
7
4
1
'11'09/'…'08/'…
'07
'11'09/'…'08/'…
'07
'11'09/'…'08/'…
'07
'11'09/'…'08/'…
'07
'11'09/'…'08/'…
'07
47
31
10
10
2
42
42
10
5
1
32
45
12
6
4
37
44
10
5
4
'11'09/'…'08/'…
'07
'11'09/'…'08/'…
'07
'11'09/'…'08/'…
'07
'11'09/'…'08/'…
'07
'11'09/'…'08/'…
'07
‘11: 81%‘09/’10: 78% ‘08/’09: 84%
‘07: 78%
‘11: 15%‘09/’10: 18% ‘08/’09: 15%
‘07: 19%
‘11: 88% A‘09/’10: 85%‘08/’09: 88%
‘07: 87% A
‘11: 10%‘09/’10: 13% ‘08/’09: 10%
‘07: 12%
Agree
Disagree
Agree
Disagree
AA
B

© Transamerica Center for Retirement Studies, 2011
◄ TOTAL DISAGREE TOTAL AGREE ►
Not sure/Refused
2011 (N=743) 6%
2009/10 (N=601) 5%
2008/09 (N=596) 3%
2007 (N=652) 3%
2006 (N=659) 6%
2005 (N=597) 6%
Perceived Employee Preference to Rely on Experts
BASE: TOTAL RESPONDENTSQ830. Most employees at my company would prefer to rely on outside experts to monitor and manage their retirement savings.
128
• About three-quarters of employers agree that most of their employees would prefer
to rely on outside experts to monitor and manage their retirement savings.
10
9
15
12
10
11
7
8
11
8
7
15
17%
17%
26%
20%
17%
26%
41
40
37
36
35
29
35
37
35
41
42
39
76%
77%
71%
77%
77%
68%
Strongly disagree Somewhat disagree Somewhat agree Strongly agree

© Transamerica Center for Retirement Studies, 2011
Small Companies Large Companies(A) (B)
Strongly agree
Somewhat agree
Somewhat disagree
Strongly disagree
Not sure/Refused
34
48
15
2
1
37
48
9
2
4
27
50
12
6
5
34
45
15
4
2
'11'09/'…'08/'…
'07
'11'09/'…'08/'…
'07
'11'09/'…'08/'…
'07
'11'09/'…'08/'…
'07
'11'09/'…'08/'…
'07
41
35
12
9
3
34
35
16
12
3
39
39
9
8
5
35
41
10
7
7
'11'09/'…'08/'…
'07
'11'09/'…'08/'…
'07
'11'09/'…'08/'…
'07
'11'09/'…'08/'…
'07
'11'09/'…'08/'…
'07
Perceived Employee Preference to Rely on Experts
BASE: TOTAL RESPONDENTS Small Companies: ‘07 (N= 369) ’08/’09 (N=296), ’09/’10 (N=300), ‘11 (N=444); Large Companies: ‘07 (N=283) ’08/’09 (N=300), ’09/’10 (N=301), ‘11 (N=299)Q830. Most employees at my company would prefer to rely on outside experts to monitor and manage their retirement savings.
129
• Overall, agreement that employee preference for outside experts to manage
retirement savings is similar for both large and small companies.
‘11: 76%‘09/’10: 78% ‘08/’09: 69%
‘07: 76%
‘11: 17%‘09/’10: 17% ‘08/’09: 28% B
‘07: 20%
‘11: 79%‘09/’10: 77%‘08/’09: 85% A
‘07: 82%
‘11: 19%‘09/’10: 18% ‘08/’09: 11%
‘07: 17%
Agree
Disagree
Agree
Disagree
AAA
BB
B
B

© Transamerica Center for Retirement Studies, 2011
Perceived Employee Inclinations to Procrastinate
BASE: TOTAL RESPONDENTSQ840. Most employees at my company prefer not to think about or concern themselves with retirement investing until they get closer to their retirement date.
130
• About three-quarters of employers agree their employees prefer not to think about
or concern themselves with retirement investing until they get closer to their
retirement date.
◄ TOTAL DISAGREE TOTAL AGREE ►
Not sure/Refused
2011 (N=743) 4%
2009/10 (N=601) 3%
2008/09 (N=596) 2%
2007 (N=652) 2%
2006 (N=659) 1%
2005 (N=597) 3%
18
17
19
14
15
8
8
8
11
10
7
17
25%
25%
30%
24%
22%
24%
38
36
39
32
35
27
32
36
29
42
42
46
70%
72%
68%
74%
77%
73%
Strongly disagree Somewhat disagree Somewhat agree Strongly agree

© Transamerica Center for Retirement Studies, 2011
Perceived Employee Inclinations to Procrastinate
BASE: TOTAL RESPONDENTS Small Companies: ‘07 (N= 369) ’08/’09 (N=296), ’09/’10 (N=300), ‘11 (N=444); Large Companies: ‘07 (N=283) ’08/’09 (N=300), ’09/’10 (N=301), ‘11 (N=299)Q840. Most employees at my company prefer not to think about or concern themselves with retirement investing until they get closer to their retirement date.
131
• There is little difference in the sentiment between small and large companies that
employees prefer not to think about retirement until its close.
Small Companies Large Companies
(A) (B)
Strongly agree
Somewhat agree
Somewhat disagree
Strongly disagree
Not sure/Refused
‘11: 69%‘09/’10: 72% ‘08/’09: 67%
‘07: 74%
‘11: 26%‘09/’10: 25% ‘08/’09: 31%
‘07: 25%
‘11: 74%‘09/’10: 72%‘08/’09: 74%
‘07: 76%
‘11: 25%‘09/’10: 24% ‘08/’09: 24%
‘07: 23%
Agree
Disagree
Agree
Disagree
32
44
19
4
1
27
48
17
7
1
27
46
18
6
3
31
43
19
6
1
'11'09/'…'08/'…
'07
'11'09/'…'08/'…
'07
'11'09/'…'08/'…
'07
'11'09/'…'08/'…
'07
'11'09/'…'08/'…
'07
44
30
14
11
2
29
38
20
11
2
37
35
16
9
3
32
38
17
8
5
'11'09/'…'08/'…
'07
'11'09/'…'08/'…
'07
'11'09/'…'08/'…
'07
'11'09/'…'08/'…
'07
'11'09/'…'08/'…
'07
A
A
B
B
B
B

© Transamerica Center for Retirement Studies, 2011
Perceived Employee Savings Adequacy
BASE: TOTAL RESPONDENTSQ850. Most employees at my company could work until age 65 and still not save enough to meet their retirement needs.
132
• The majority of employers agree that employees could work until age 65 and still not
save enough to meet their retirement needs, down slightly from previous years.
◄ TOTAL DISAGREE TOTAL AGREE ►
Not sure/Refused
2011 (N=743) 9%
2009/10 (N=601) 9%
2008/09 (N=596) 6%
2007 (N=652) 6%
2006 (N=659) 6%
2005 (N=597) 6%
14
14
10
15
9
10
6
4
5
7
4
7
20%
18%
14%
22%
13%
17%
33
32
40
33
35
23
37
40
40
39
47
55
70%
73%
80%
72%
82%
78%
Strongly disagree Somewhat disagree Somewhat agree Strongly agree

© Transamerica Center for Retirement Studies, 2011
Perceived Employee Savings Adequacy
BASE: TOTAL RESPONDENTS Small Companies: ‘07 (N= 369) ’08/’09 (N=296), ’09/’10 (N=300), ‘11 (N=444); Large Companies: ‘07 (N=283) ’08/’09 (N=300), ’09/’10 (N=301), ‘11 (N=299)Q850. Most employees at my company could work until age 65 and still not save enough to meet their retirement needs.
133
• The majority of both large and small companies agree their employees could work
until age 65 and not save enough to meet their retirement needs.
Small Companies Large Companies
(A) (B)
Strongly agree
Somewhat agree
Somewhat disagree
Strongly disagree
Not sure/Refused
‘11: 70%‘09/’10: 73% ‘08/’09: 80%‘07: 71%
‘11: 20%‘09/’10:18% ‘08/’09:14% ‘07: 22%
‘11: 72%‘09/’10:72%‘08/’09:79% ‘07: 76%
‘11: 24%‘09/’10:23% ‘08/’09:15%‘07:21%
Agree
Disagree
Agree
Disagree
35
41
16
5
2
34
45
12
3
6
29
43
17
5
5
34
38
19
5
4
'11'09/'…'08/'…
'07
'11'09/'…'08/'…
'07
'11'09/'…'08/'…
'07
'11'09/'…'08/'…
'07
'11'09/'…'08/'…
'07
39
32
15
7
6
41
39
9
5
6
41
31
14
4
10
37
33
13
7
10
'11'09/'…'08/'…
'07
'11'09/'…'08/'…
'07
'11'09/'…'08/'…
'07
'11'09/'…'08/'…
'07
'11'09/'…'08/'…
'07 B
B
B
A

© Transamerica Center for Retirement Studies, 2011
Confidence in Employees Achieving a Comfortable Retirement
134
BASE: TOTAL RESPONDENTSQ800. How confident do you feel your employees are that they will be able to achieve a comfortable lifestyle in their retirement? Are you very confident, somewhat confident, not too confident, or not at all confident?
• Only 58 percent of companies are confident in their employees’ ability to achieve a
comfortable lifestyle in retirement. Although this number is relatively low, it has
increased back to levels reported in 2007 and prior years.
◄ TOTAL NOT CONFIDENT TOTAL CONFIDENT►
Not sure/Refused
2011 (N=743) 7%
2009/10 (N=601) 5%
2008/09 (N=596) 4%
2007 (N=652) 5%
2006 (N=659) 5%
2005 (N=597) 9%
24
32
30
26
26
24
10
10
15
11
11
12
34%
42%
45%
37%
37%
36%
48
44
43
46
53
45
10
9
7
12
6
10
58%
53%
51%
58%
59%
55%
Not at all confident Not too confident Somewhat confident Very confident

© Transamerica Center for Retirement Studies, 2011
Small Companies Large Companies
(A) (B)
Very confident
Somewhat confident
Not too confident
Not at all confident
Not sure/Refused
12
46
25
12
5
7
42
30
16
5
9
43
32
11
5
10
46
24
11
8
'11'09/'…'08/'…
'07
'11'09/'…'08/'…
'07
'11'09/'…'08/'…
'07
'11'09/'…'08/'…
'07
'11'09/'…'08/'…
'07
Confidence in Employees Achieving a Comfortable Retirement
BASE: TOTAL RESPONDENTS Small Companies: ‘07 (N= 369) ’08/’09 (N=296), ’09/’10 (N=300), ‘11 (N=444); Large Companies: ‘07 (N=283) ’08/’09 (N=300), ’09/’10 (N=301), ‘11 (N=299)Q800. How confident do you feel your employees are that they will be able to achieve a comfortable lifestyle in their retirement? Are you very confident, somewhat confident, not too confident, or not at all confident?
135
• As in previous years, large companies are more confident their employees will
achieve a comfortable lifestyle in retirement.
‘11: 57%‘09/’10: 52% ‘08/’09: 49%
‘07: 58%
‘11: 35%‘09/’10: 43% ‘08/’09: 46%
‘07: 38%
‘11: 66% A‘09/’10: 65% A‘08/’09: 60% A
‘07: 63%
‘11: 31%‘09/’10: 34% ‘08/’09: 37%
‘07: 35%
11
52
29
6
2
9
51
29
7
3
11
54
28
6
2
8
58
27
4
3
'11'09/'…'08/'…
'07
'11'09/'…'08/'…
'07
'11'09/'…'08/'…
'07
'11'09/'…'08/'…
'07
'11'09/'…'08/'…
'07
BB
A
Confident
Not Confident
Confident
Not Confident
A
B
B
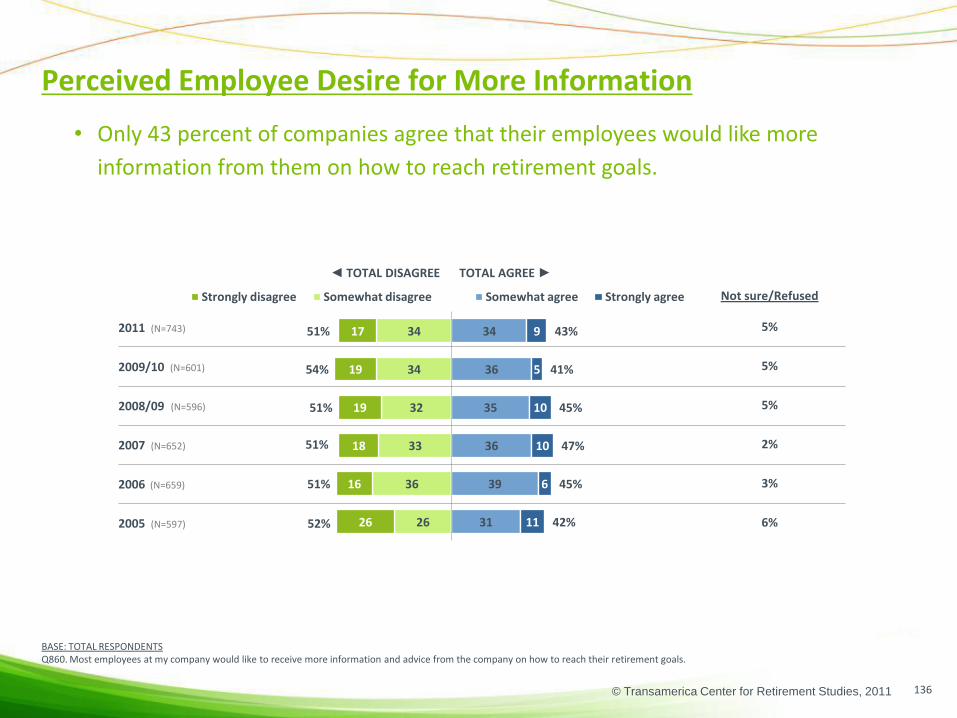
© Transamerica Center for Retirement Studies, 2011
◄ TOTAL DISAGREE TOTAL AGREE ►
Not sure/Refused
2011 (N=743) 5%
2009/10 (N=601) 5%
2008/09 (N=596) 5%
2007 (N=652) 2%
2006 (N=659) 3%
2005 (N=597) 6%
Perceived Employee Desire for More Information
BASE: TOTAL RESPONDENTSQ860. Most employees at my company would like to receive more information and advice from the company on how to reach their retirement goals.
136
34
34
32
33
36
26
17
19
19
18
16
26
51%
54%
51%
51%
51%
52%
34
36
35
36
39
31
9
5
10
10
6
11
43%
41%
45%
47%
45%
42%
Strongly disagree Somewhat disagree Somewhat agree Strongly agree
• Only 43 percent of companies agree that their employees would like more
information from them on how to reach retirement goals.

© Transamerica Center for Retirement Studies, 2011
Perceived Employee Desire for More Information
BASE: TOTAL RESPONDENTS : Small Companies: ‘07 (N= 369) ’08/’09 (N=296), ’09/’10 (N=300), ‘11 (N=444); Large Companies: ‘07 (N=283) ’08/’09 (N=300), ’09/’10 (N=301), ‘11 (N=299)Q860. Most employees at my company would like to receive more information and advice from the company on how to reach their retirement goals.
137
• Small companies are more likely to disagree their employees would like more
information on retirement from them while more large companies think their
employees would like to receive more information.
Small Companies Large Companies(A) (B)
Strongly agree
Somewhat agree
Somewhat disagree
Strongly disagree
Not sure/Refused
18
52
23
5
3
12
50
30
4
5
8
52
32
6
3
10
51
31
5
3
'11'09/'…'08/'…
'07
'11'09/'…'08/'…
'07
'11'09/'…'08/'…
'07
'11'09/'…'08/'…
'07
'11'09/'…'08/'…
'07
10
34
34
20
2
10
32
32
21
5
4
35
35
21
5
9
32
35
19
6
'11'09/'…'08/'…
'07
'11'09/'…'08/'…
'07
'11'09/'…'08/'…
'07
'11'09/'…'08/'…
'07
'11'09/'…'08/'…
'07
‘11: 41%‘09/’10: 39%‘08/’09: 42%
‘07: 44%
‘11: 53% B‘09/’10: 56% B‘08/’09: 54% B
‘07: 54% B
’11: 61% A‘09/’10: 60% A‘08/’09: 61% A
‘07: 70% A
’11: 36%‘09/’10: 37%‘08/’09: 34%
‘07: 28%
Agree
Disagree
Agree
Disagree
A
B
AAA
B
BBB
A

© Transamerica Center for Retirement Studies, 2011
2011 2009/10 2008/09 2007
(N=645) (N=533) (N=526) (N=567)
Somewhat summarized with a high level break-down of fees for services and investments
A high level summary with a total all-in cost
A highly detailed accounting of every component of every service and investment option
No preference
Not sure/Refused
48
31
11
4
6
Perceived Employee Preferences About Fee Information
BASE: OFFERS 401(k) PLAN OR OTHER SELF-FUNDED PLANQ1047. When it comes to disclosing plan fees to participants, what level of detail would your employees prefer in receiving information about the fees associated with participating in your company’s retirement plan?
138
• Most companies believe that their employees would prefer to receive information
about the retirement plan’s fees in a somewhat summarized or highly summarized
fashion. Very few companies believe that their employees would prefer a highly
detailed accounting.
57
18
9
8
7
54
23
9
6
7
53
22
10
8
6
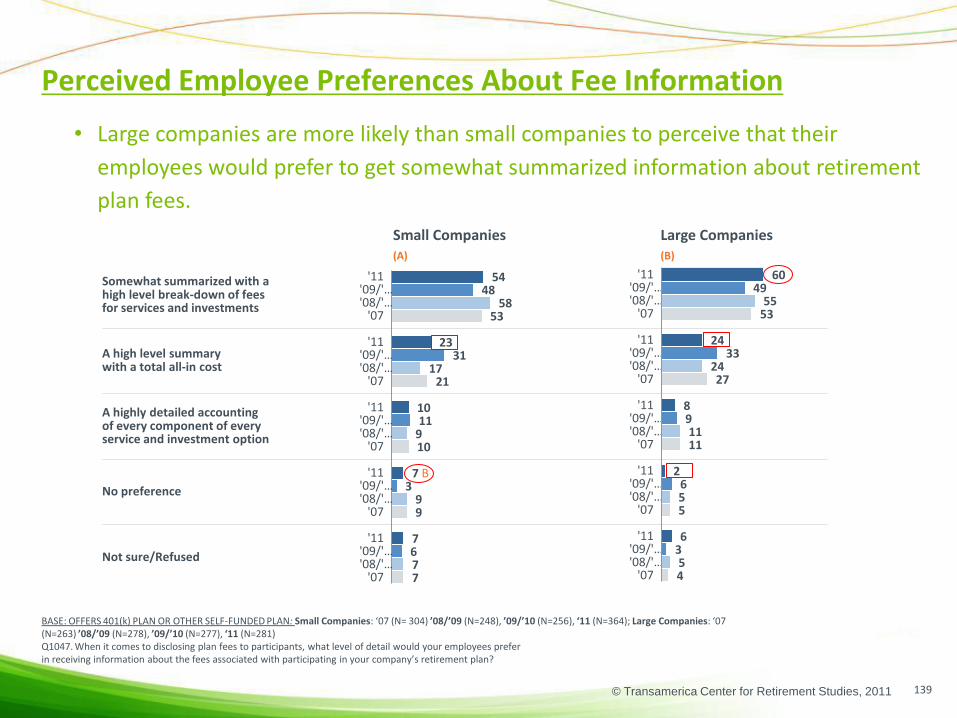
© Transamerica Center for Retirement Studies, 2011
Small Companies Large Companies(A) (B)
Somewhat summarized with a high level break-down of fees for services and investments
A high level summary with a total all-in cost
A highly detailed accounting of every component of every service and investment option
No preference
Not sure/Refused
53
27
11
5
4
55
24
11
5
5
49
33
9
6
3
60
24
8
2
6
'11'09/'…'08/'…
'07
'11'09/'…'08/'…
'07
'11'09/'…'08/'…
'07
'11'09/'…'08/'…
'07
'11'09/'…'08/'…
'07
53
21
10
9
7
58
17
9
9
7
48
31
11
3
6
54
23
10
7
7
'11'09/'…'08/'…
'07
'11'09/'…'08/'…
'07
'11'09/'…'08/'…
'07
'11'09/'…'08/'…
'07
'11'09/'…'08/'…
'07
Perceived Employee Preferences About Fee Information
BASE: OFFERS 401(k) PLAN OR OTHER SELF-FUNDED PLAN: Small Companies: ‘07 (N= 304) ’08/’09 (N=248), ’09/’10 (N=256), ‘11 (N=364); Large Companies: ‘07 (N=263) ’08/’09 (N=278), ’09/’10 (N=277), ‘11 (N=281)Q1047. When it comes to disclosing plan fees to participants, what level of detail would your employees prefer in receiving information about the fees associated with participating in your company’s retirement plan?
139
• Large companies are more likely than small companies to perceive that their
employees would prefer to get somewhat summarized information about retirement
plan fees.
B

© Transamerica Center for Retirement Studies, 2011
◄ TOTAL DISAGREE TOTAL AGREE ►
Not sure/Refused
2011 (N=645) 3%
2009/10 (N=533) 4%
2008/09 (N=526) 3%
2007 (N=567) 2%
Perceived Employee Understanding of Plan Fees/Expenses
140
BASE: OFFERS 401(k) PLAN OR OTHER SELF-FUNDED PLANQ1041. Our employees have a clear understanding of the fees associated with participating in the retirement plan.
14
12
18
18
4
11
6
9
18%
23%
24%
28%
48
54
49
46
30
19
24
24
78%
73%
73%
70%
Strongly disagree Somewhat disagree Somewhat agree Strongly agree
• Employers are more likely this year to believe their employees have a clear
understanding of the fees associated with participating in the retirement plan.

© Transamerica Center for Retirement Studies, 2011
Small Companies Large Companies(A) (B)
Strongly agree
Somewhat agree
Somewhat disagree
Strongly disagree
Not sure/Refused
14
46
27
12
0
19
48
23
6
4
19
48
18
11
3
19
49
21
9
2
'11'09/'…'08/'…
'07
'11'09/'…'08/'…
'07
'11'09/'…'08/'…
'07
'11'09/'…'08/'…
'07
'11'09/'…'08/'…
'07
26
46
17
9
2
25
49
17
6
3
19
55
11
11
4
31
48
13
3
3
'11'09/'…'08/'…
'07
'11'09/'…'08/'…
'07
'11'09/'…'08/'…
'07
'11'09/'…'08/'…
'07
'11'09/'…'08/'…
'07
‘11: 80% B‘09/’10: 74%‘08/’09: 74%
‘07: 72% B
’11: 68%‘09/’10: 67%‘08/’09: 67%
‘07: 60%
’11: 30% A‘09/’10: 30%‘08/’09: 30%
‘07: 39% A
Agree
Disagree
Agree
Disagree
Perceived Employee Understanding of Plan Fees/Expenses
BASE: OFFERS 401(k) PLAN OR OTHER SELF-FUNDED PLAN: RESPONDENTS: Small Companies: ‘07 (N= 304) ’08/’09 (N=248), ’09/’10 (N=256), ‘11 (N=364); Large Companies: ‘07 (N=263) ’08/’09 (N=278), ’09/’10 (N=277), ‘11 (N=281)Q1041. Our employees have a clear understanding of the fees associated with participating in the retirement plan.
141
A
B
• Almost a third of small companies strongly agree their employees have a clear
understanding of retirement fees, a significant increase over last year’s sentiment
and a feeling that is shared by more small companies than large companies.
‘11: 17%‘09/’10: 22%‘08/’09: 23%
‘07: 26%
B
A
A
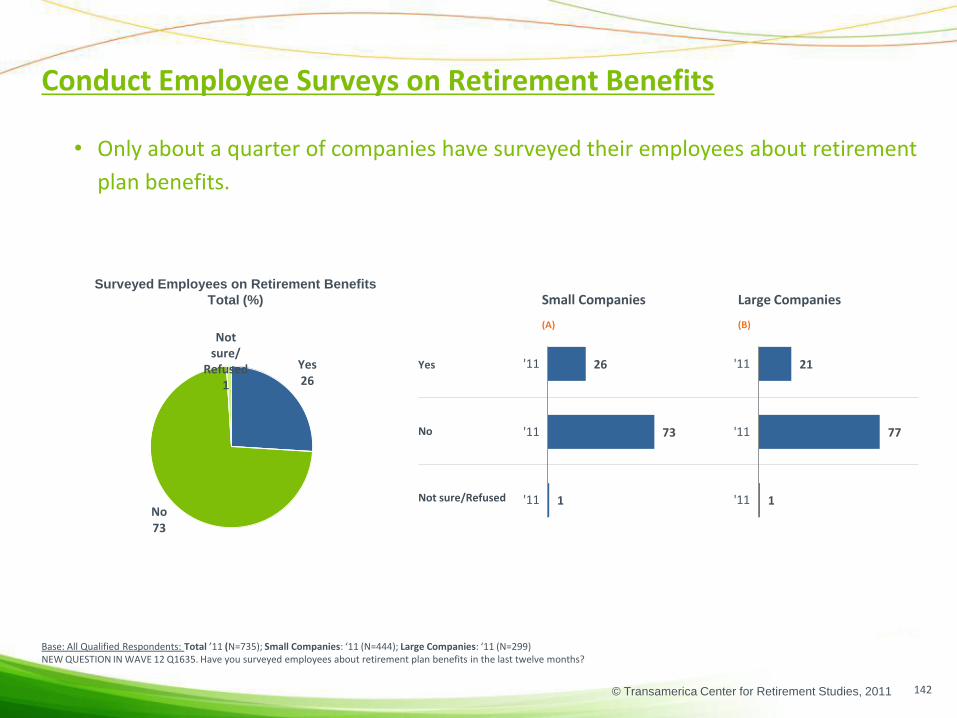
© Transamerica Center for Retirement Studies, 2011
Small Companies Large Companies
(A) (B)
Yes
No
Not sure/Refused
Conduct Employee Surveys on Retirement Benefits
142
Base: All Qualified Respondents: Total ’11 (N=735); Small Companies: ‘11 (N=444); Large Companies: ‘11 (N=299)NEW QUESTION IN WAVE 12 Q1635. Have you surveyed employees about retirement plan benefits in the last twelve months?
• Only about a quarter of companies have surveyed their employees about retirement
plan benefits.
26
73
1
'11
'11
'11
21
77
1
'11
'11
'11
Yes26
No73
Not sure/
Refused1
Surveyed Employees on Retirement Benefits
Total (%)
© Transamerica Center for Retirement Studies, 2011
Appendix
143
Importance of Other Benefits:
• Life Insurance
• Disability Insurance
• Long-term Care Insurance

© Transamerica Center for Retirement Studies, 2011
Importance of Life Insurance
BASE: TOTAL RESPONDENTSQ520 Do you think your company’s employees see this benefit as very important, somewhat important, not too important, or not at all important?
144
• Employers believe that their employees view life insurance as an important benefit.
◄ NOT IMPORTANT IMPORTANT ►
Not sure/Refused
2011 (N=743) 1%
2009/10 (N=601) 1%
2008/09 (N=596) 3%
2007 (N=652) 1%
2006 (N=659) 2%
2005 (N=597) 0%
15
15
12
17
13
13
4
4
5
5
6
4
19%
19%
18%
22%
19%
16%
47
46
46
45
49
43
33
33
33
32
30
40
79%
79%
79%
77%
79%
83%
Not at all important Not too important Somewhat important Very important

© Transamerica Center for Retirement Studies, 2011
A
Importance of Life Insurance
BASE: TOTAL RESPONDENTS Small Companies: ‘07 (N= 369) ’08/’09 (N=296), ’09/’10 (N=300), ‘11 (N=444);Large Companies: ‘07 (N=283) ’08/’09 (N=300), ’09/’10 (N=301), ‘11 (N=299)Q520 Do you think your company’s employees see this benefit as very important, somewhat important, not too important, or not at all important?
145
• Large companies are more likely than small companies to believe that their
employees view life insurance to be an important benefit.
Small Companies Large Companies
(A) (B)
Very important
Somewhat important
Not too important
Not at all important
Not sure/Refused
56
42
2
0
0
57
41
2
0
0
56
41
3
0
0
53
45
1
0
0
'11'09/'…'08/'…
'07
'11'09/'…'08/'…
'07
'11'09/'…'08/'…
'07
'11'09/'…'08/'…
'07
'11'09/'…'08/'…
'07
29
45
18
6
1
30
46
14
6
4
31
47
16
5
2
30
47
17
5
1
'11'09/'…'08/'…
'07
'11'09/'…'08/'…
'07
'11'09/'…'08/'…
'07
'11'09/'…'08/'…
'07
'11'09/'…'08/'…
'07
‘11: 77%‘09/’10: 77%‘08/’09: 76%
‘07: 74%
‘11: 22% B‘09/’10: 21% B‘08/’09: 20% B
‘07: 24% B
’11: 98% A‘09/’10: 97% A‘08/’09: 98% A
‘07: 98% A
’11: 2%‘09/’10: 3%‘08/’09: 2%
‘07: 2%
Not Important
Important
B
BB
A
Not Important
Important
BB
B
A
A
B
B

© Transamerica Center for Retirement Studies, 2011
Importance of Disability Insurance
BASE: TOTAL RESPONDENTSQ520 Do you think your company’s employees see this benefit as very important, somewhat important, not too important, or not at all important?
146
• Employers believe that their employees view disability insurance as an important
benefit.
◄ NOT IMPORTANT IMPORTANT ►
Not sure/Refused
2011 (N=743) 1%
2009/10 (N=601) 3%
2008/09 (N=596) 2%
2007 (N=652) 1%
2006 (N=659) 2%
2005 (N=597) 1%
14
16
16
16
11
8
5
5
6
5
5
4
19%
21%
22%
21%
17%
12%
49
40
43
41
51
43
31
36
33
37
30
44
80%
76%
76%
79%
82%
87%
Not at all important Not too important Somewhat important Very important

© Transamerica Center for Retirement Studies, 2011
Importance of Disability Insurance
BASE: TOTAL RESPONDENTS Small Companies: ‘07 (N= 369) ’08/’09 (N=296), ’09/’10 (N=300), ‘11 (N=444);Large Companies: ‘07 (N=283) ’08/’09 (N=300), ’09/’10 (N=301), ‘11 (N=299)Q520 Do you think your company’s employees see this benefit as very important, somewhat important, not too important, or not at all important?
147
• Large companies are more likely than small companies to believe disability insurance
is important to their employees.
Small Companies Large Companies
(A) (B)
Very important
Somewhat important
Not too important
Not at all important
Not sure/Refused
52
44
3
0
1
54
43
2
1
1
55
40
4
<1
1
52
43
4
0
1
'11'09/'…'08/'…
'07
'11'09/'…'08/'…
'07
'11'09/'…'08/'…
'07
'11'09/'…'08/'…
'07
'11'09/'…'08/'…
'07
36
41
17
5
1
30
43
19
6
2
34
40
17
6
3
29
49
16
5
1
'11'09/'…'08/'…
'07
'11'09/'…'08/'…
'07
'11'09/'…'08/'…
'07
'11'09/'…'08/'…
'07
'11'09/'…'08/'…
'07
‘11: 78%‘09/’10: 74%‘08/’09: 73%
‘07: 76%
‘11: 21% B‘09/’10: 23% B‘08/’09: 25% B
‘07: 23% B
’11: 95% A‘09/’10: 95% A‘08/’09: 97% A
‘07: 96% A
’11: 4%‘09/’10: 4%‘08/’09: 2%
‘07: 4%
Not Important
Important
B
A
Not Important
Important
BB
BBB
AA
A
B
B

© Transamerica Center for Retirement Studies, 2011
◄ NOT IMPORTANT IMPORTANT ►
Not sure/Refused
2011 (N=743) 4%
2009/10 (N=601) 5%
2008/09 (N=596) 8%
2007 (N=652) 4%
Importance of Long-term Care Insurance
BASE: TOTAL RESPONDENTSQ520 Do you think your company’s employees see this benefit as very important, somewhat important, not too important, or not at all important?
37
37
36
35
19
22
22
22
56%
59%
58%
57%
34
28
28
28
6
8
7
11
40%
36%
34%
39%
Not at all important Not too important Somewhat important Very important
148
• Compared with other benefits, employers are less likely to believe long-term care
insurance is important to employees.
• Four in 10 employers think it is important to their employees.
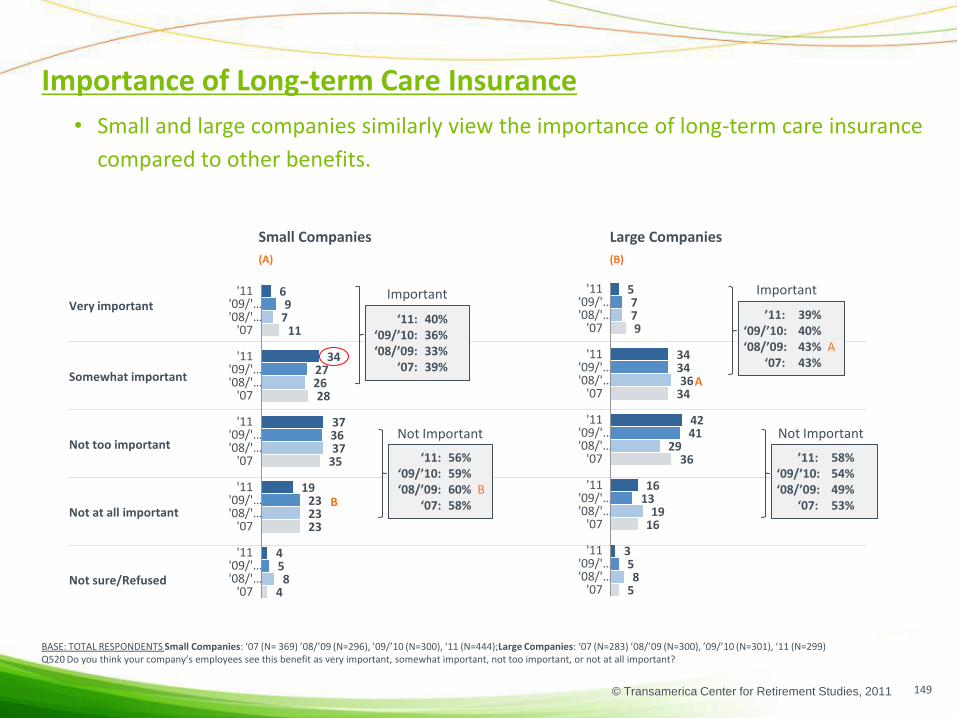
© Transamerica Center for Retirement Studies, 2011
Small Companies Large Companies
(A) (B)
Very important
Somewhat important
Not too important
Not at all important
Not sure/Refused
9
34
36
16
5
7
36
29
19
8
7
34
41
13
5
5
34
42
16
3
'11'09/'…'08/'…
'07
'11'09/'…'08/'…
'07
'11'09/'…'08/'…
'07
'11'09/'…'08/'…
'07
'11'09/'…'08/'…
'07
11
28
35
23
4
7
26
37
23
8
9
27
36
23
5
6
34
37
19
4
'11'09/'…'08/'…
'07
'11'09/'…'08/'…
'07
'11'09/'…'08/'…
'07
'11'09/'…'08/'…
'07
'11'09/'…'08/'…
'07
Importance of Long-term Care Insurance
BASE: TOTAL RESPONDENTS Small Companies: ‘07 (N= 369) ’08/’09 (N=296), ’09/’10 (N=300), ‘11 (N=444);Large Companies: ‘07 (N=283) ’08/’09 (N=300), ’09/’10 (N=301), ‘11 (N=299)Q520 Do you think your company’s employees see this benefit as very important, somewhat important, not too important, or not at all important?
149
• Small and large companies similarly view the importance of long-term care insurance
compared to other benefits.
‘11: 40%‘09/’10: 36%‘08/’09: 33%
‘07: 39%
‘11: 56%‘09/’10: 59%‘08/’09: 60% B
‘07: 58%
’11: 39%‘09/’10: 40%‘08/’09: 43% A
‘07: 43%
’11: 58%‘09/’10: 54%‘08/’09: 49%
‘07: 53%
Not Important
Important
B
A
Not Important
Important