the end is (not quite) nigh! the impact of mass customization on
TRANSCRIPT

Abstract number: 002-0528
The end is (not quite) nigh! The impact of mass customisation on manufacturing trade-
offs
Second World Conference on POM and 15th Annual POM Conference, Cancun, Mexico,
April 30 – May 3, 2004.
Brian Squire a
Centre for Technology and Innovation Management School of Management
University of Bath Bath, BA2 7AY
E-mail address: [email protected] Tel: +44 (0) 1225 385265 Fax: +44 (0) 1225 386473
Steve Brown
Centre for Technology and Innovation Management School of Management
University of Bath Bath, BA2 7AY
E-mail address: [email protected] Tel: +44 (0) 1225 383841 Fax: +44 (0) 1225 386473
Jeff Readman
Centre for Research in Innovation Management University of Brighton
Falmer, Brighton BN1 9QE
E-mail address: [email protected] Tel: +44 (0) 1273 642190 Fax: +44 (0) 1273 685896
John Bessant
Cranfield Management School Cranfield, UK
E-mail address: [email protected] Tel: +44 (0) 1234 751122
a Corresponding author

The end is (not quite) nigh! The impact of mass customisation on manufacturing trade-
offs
Abstract: Management literature has suggested that the advent of mass customisation marks
the end for trade-offs between customisation and other competitive priorities (Pine et al,
1993; Westbrook and Williamson, 1993; Tu et al, 2001). However, evidence supporting this
proposition is anecdotal. This paper examines the impact of product customisation on four
competitive priorities, drawing upon the results of a survey conducted in 2003 of 101 UK
manufacturing firms from eight industry sectors. The study indicates significant
compatibility between customisation and quality, flexibility, delivery reliability and non-
manufacturing costs. On the other hand, trade-offs remain between customisation and
manufacturing costs and delivery lead times. The results contradict the initial proposition
that customisation can be ‘free’, and have important implications for firms embarking upon a
mass customisation strategy.
Keywords: Mass customization, trade-offs, manufacturing strategy, empirical research
1
1.0 Introduction
Mass customisation denotes the ability to provide customised products and services at a
comparable price and speed of equivalent standardised offerings. The introduction of
innovative product strategies, advanced manufacturing technologies and organisational
structures has minimised the traditional sacrifices of customised products. This has lead
scholars to claim that mass customisation offers superior customer value compared to other
strategies (Gilmore and Pine, 2000; Tu et al, 2001).
The advent of mass customisation has important implications for the debate surrounding
manufacturing trade-offs. The literature suggests that mass customisation effectively
eliminates the trade-off between customisation and other competitive priorities (Pine et al,
1993; Westbrook and Williamson, 1993; Tu et al, 2001). However such a position is largely
based on anecdotal evidence, formed through the examination of a few well known case
studies (Pine, 1993; Kotha, 1995; 1996; Berman, 2002). Indeed the few empirical studies
that do examine the relationship between product customisation and other priorities indicate
the reverse situation, that customisation is not ‘free’ but traded-off with lead-time, cost and
other factors (New, 1992; Filippini et al, 1998). The purpose of this paper is to evaluate
empirically whether the degree of product customisation affects four competitive priorities:
cost, quality, delivery and flexibility. Consistent with related research (Duray et al, 2000;
Duray, 2002) the current study identifies three degrees of product customisation: full, partial
and standard.
This study contributes to the literature in three areas. First, it provides empirical evidence for
the largely anecdotal claims of mass customisation. The study provides systematic evidence
of the degree to which customisation can be considered ‘free’. Second, the study answers the
2

call for increased empirical research in the area of mass customisation (Tu et al, 2001). If
mass customisation is to gain further acceptance within the field of operations management,
rigorous research is required to assess and extend previous anecdotal studies. Third, the
study contributes to the wider debate surrounding the existence of trade-offs. Conflicting
evidence appears to support both arguments for (New, 1992; Mapes et al, 1997; Filippini et
al, 1998) and against (Schonberger, 1986; Ferdows and De Meyer, 1990; Flynn et al, 1999)
the existence of manufacturing trade-offs. The current study provides further evidence within
a specific instance of trade-off; the conflict between product customisation and other
identified priorities.
2.0 Literature review
2.1 Mass customisation
Firms have entered a new era in operations management, which includes the requirement of
mass customisation (Brown, 2000). Futurist Alvin Toffler was one of the first to glimpse this
new paradigm (Kotha, 1995), to see beyond mass production. Toffler noted a trend towards
“de-massification” (1981, p192), a move towards customisation using continuous flow
processes. The theme was taken up by Stanley Davis (1987) who coined the term mass
customisation: “mass customisation of markets means that the same large number of
customers can be reached as in mass markets of the industrial economy, and simultaneously
they can be treated individually as in customized markets of pre-industrial economies”
(Davis, 1987, p.169). In other words, mass customisation combines the best of the craft era,
where products were individualised but at high cost, with the best of mass production, where
products were affordable but highly standardised (Fralix, 2001). This shift is shown in figure
1.
3

[Please insert figure 1 about here]
In an ideal world, firms would mass-produce standardised goods as efficiently as possible to
gain economies of scale (Meredith et al, 1994). However, a shift towards mass customisation
is justified, based on three main reasons. First, there has been a collapse in mass markets
(Kotler, 1989; Mueller-Heumann, 1992; Hart, 1995; Kara and Kaynak, 1997). The advent of
a post modernistic culture means that customers are no longer satisfied with a ‘one size fits
all’ product (Pine, 1993). Instead, they demand increased levels of variety and
personalisation (Firat and Schultz, 1997). Second, new production and information
technologies enable firms to produce to customer specification at the low cost and high speed
of standardised offerings. In particular, e commerce has changed the way firms interact with
customers and suppliers, providing a quick and efficient means of introducing customisation
(Lee et al, 2000; Bhat and Emadad, 2001). Third, mass customisation may be seen as a
response to shortening product life cycles and increased global competition (Ahlstrom and
Westbrook, 1999; Berman, 2002).
The concept of mass customisation appears to contradict the traditional notion of trade-offs.
Customised products are conventionally positioned in the top left hand corner of Hayes and
Wheelwright’s (1979) ‘product-process matrix’. The authors argue that products that are
non-standard, or one of kind, necessitate low volumes and job shop production processes.
There is, then, an implied trade-off between the degree of product customisation and the
efficiency of the production process, high levels of customisation are not commensurate with
economies of scale; customisation is traded off with time and cost. Mass customisation turns
this logic on its head. The introduction of innovative product strategies (Pine, 1993,
Eastwood, 1996, Duray, 2002), advanced manufacturing technologies (Hart, 1995, Lau, 1995,
4

Kotha, 1996) and organisational structures (Vickery et al, 1999) mean that customised
products are no longer confined to the top left hand corner. Instead, mass customisation is
positioned below the diagonal, approaching the bottom left hand corner. Low product
standardisation is now coupled with line or continuous flows. Thus, customisation is no
longer in trade-off with other priorities, firms can seek high performance in customisation
along side high performance in cost and delivery.
2.2 Trade-offs
The concept of trade-off in manufacturing can be traced back to Skinner’s pioneering work in
the field of manufacturing strategy. Skinner recognised that while the production function
should support the overarching corporate strategy, it cannot achieve high levels of
performance for multiple competitive priorities (Skinner, 1969). In other words, priorities
such as cost, time, quality, technology and customer satisfaction are in conflict, improvement
in one necessitates a decrease in performance in another (Slack, 1991).
Skinner’s original work was subsequently refined, however the core concept of trade-offs as
necessary choices between priorities has been retained. Skinner (1974) argues for the
focussed factory, plants should focus on a narrow range performance measures while
compromising, or trading-off, less important priorities. Further support for the concept of
focus is offered by Hayes and Wheelwright (1984) and Fine and Hax (1985, p29): “Normally
manufacturing objectives are expressed in terms of four major dimensions of performance
measurement…Important trade-offs must be made among these objectives; it is impossible to
excel in all of them simultaneously”. Parallels to the notion of trade-offs are found in the
field of strategy. Porter (1985) posits a trade-off between low cost and differentiation; firms
5

must make a choice between these two types of competitive advantage, the pursuit of both
will ultimately result in mediocrity and below average performance.
Two approaches to manufacturing trade-offs have emerged in recent years. The first
approach holds that trade-offs can be eliminated; manufacturers can achieve high levels of
performance for all priorities. In an analysis of ‘World Class Manufacturing’ Schonberger
(1986) contends that highly competitive firms have abandoned the notion that competitive
priorities must be in trade-off, but rather may be viewed as cumulative. In other words, high
performance in one priority can lead to high performance in other priorities. Ferdows and De
Meyer (1990) develop this argument; their ‘sand cone’ model suggests that capabilities can
be built in a logical sequence, starting with quality, advancing to delivery, flexibility and
finally cost. The rigid flexibility model (Collins and Schmenner, 1993; Collins et al, 1998)
also recognises the complementarity between competitive priorities. However, unlike the
sand cone model, it does not impose such a rigid structure on the sequence of capability
building, instead, firms must be sufficiently responsive to perform highly on any dimension.
Several scholars have found empirical support for the concept of cumulative capabilities. In
a study of manufacturing performance, Roth and Miller (1992) found that one group of
companies outperformed the others across four competitive priorities: cost, quality,
dependability and flexibility. Their results suggest that some firms have effectively
eliminated trade-offs between priorities. White (1996) found significant relationships
between a number of pairs of competitive priorities. Employing a meta analysis of several
empirical works, the author concludes that although the research supports the notion of
cumulative capabilities, the order of capability building need not be as rigid as the sand cone
model suggests. Firms are not constrained to starting with quality, but may begin with
6

flexibility or delivery. In support of the concept of world class manufacturing, Flynn et al
(1999) found synergies between most competitive priorities including cost, quality,
dependability and flexibility.
The second approach represents something of a compromise between the original ideas of
Skinner and the position adopted by Schonberger. It is recognition that while certain
competitive priorities are compatible, trade-offs can never be completely eliminated. In a
vigorous attack on Schonberger, New (1992) found that while new manufacturing practices
had overcome several trade-offs, many remained. New (1992, p31) concluded, “…perhaps it
would be a good idea for journalists [in reference to Schonberger] to stick to journalism
rather than indulge in gross simplifications for the sake of sensationalism without any
research basis”.
In support of this approach Mapes et al (1997) found that the relationships between
competitive priorities were moderated by product variety. Product variety is linked to
decreased performance in several priorities including cost, quality and delivery. Filippini et
al (1998) found that while 80% of plants studied demonstrated high performance in at least
two competitive priorities, none of the plants demonstrated high performance across all six
priorities. In particular trade-offs were found in the areas of delivery reliability and quality
capability. Adopting a case based approach, Da Silveira and Slack (2001) note that all cases
acknowledge the existence of trade-offs, that the idea that trade-offs could be eliminated was
“simplistic”. However the case firms also recognised that trade-offs are dynamic and can be
changed over time.
7

A strategy of mass customisation necessitates that the first approach to trade-offs is accurate:
“The development of the continuous-improvement and mass customization models show that
companies can overcome the traditional trade-offs. In other words, companies can have it
all” (Pine et al, 1993, p111). However the development of mass customisation is based
primarily on a few well known case studies (Pine, 1993; Kotha, 1995; 1996; Berman, 2002).
There is little empirical evidence to suggest that trade-offs between customisation and other
competitive priorities have been overcome. Indeed, the limited empirical evidence available
contradicts the notion that customisation can be ‘free’. For instance, New (1992) found that
despite advances in manufacturing, trade-offs still existed between customisation and lead-
time, and, customisation and price. Moreover, Filippini et al (1998) found product
customisation was a significant factor in discriminating trade-off situations. Firms producing
customised products were more likely to incur higher levels of trade-offs than firms
producing standardised products. The purpose of this study is to evaluate empirically
whether the advent of mass customisation has eliminated manufacturing trade-offs between
product customisation and other competitive priorities.
Common to much of the trade-off literature are four key competitive priorities: cost, quality,
delivery, and flexibility. That is not to deny the existence of other trade-offs, but that these
four are widespread in the literature and appear consistent with recent research (Da Silveira
and Slack, 2001). If we are to accept the claims of mass customisation, these four priorities
should be compatible with product customisation. This leads us to formulate the following
hypotheses:
H1: Customisation does not increase costs
H2: Customisation does not reduce quality
8

H3a: Customisation does not increase delivery lead times
H3b: Customisation does not reduce delivery reliability
H4: Customisation does not reduce flexibility
3.0 Methods
3.1 Sample design and data collection approach
The five hypotheses were tested through a mail survey that collected information about a
firm’s environment, capabilities, products, trade-offs and performance. The sample of firms
was drawn from a database held by Conquest Business Media. Conquest Business Media,
publishers of The Manufacturer and other similar publications, hold a UK manufacturing
database tracking 11,901 firms. Respondents were selected by job function (head of
production or equivalent), plant size (at least 50 employees) and industry (SIC code: 28.00
fabricated metal products, 29.00 machinery and equipment not elsewhere classified, 30.00
office machinery and computers, 31.00 electrical machinery and apparatus not elsewhere
classified, 33.00 medical, precision and optical instruments, watches, 34.00 motor vehicles,
trailers and semi-trailers, 35.00 other transport equipment, 36.00 furniture). It has been
suggested elsewhere that customisation is prevalent in these industries (Duray et al, 2000;
Duray, 2002). These criteria generated a possible 1196 contacts from which 500 respondents
were selected at random.
Pilot testing of the survey was conducted in two phases. First, the draft questionnaire was
sent to 15 academic colleagues and industry contacts. Rather than completing the
questionnaire, this group were asked to comment on all aspects of the design, content and
scaling. Several significant changes were made as a result of this feedback. Second, the
9

revised questionnaire was sent to 15 firms from the database (these were not included in the
final sample) to test protocol and survey design. No changes were made at this stage.
The survey was mailed to a named respondent in early November 2003. Each respondent
received a letter explaining the purpose of the research, a survey and a business reply
envelope. The non-respondent problem was addressed in two ways (Forza, 2002). First, the
response rate was improved by two further mailings; a reminder postcard after two weeks and
a letter and replacement survey after five weeks. 102 useable responses were received,
yielding a response rate of 20.4% (see table 1). Second, non-response bias was assessed by
comparing early and late respondents (Armstrong and Overton, 1977; Lambert and
Harrington, 1990). For the purposes of this research early respondents were classified as
responses received before the reminder postcards were sent. The two groups were compared
for each of the variables under study; the data indicate no significant differences (for
example: degree of customisation t = 0.61, P = 0.54).
[Please insert table 1 about here]
3.2 Customisation measurement
The independent variable ‘degree of customisation’ was based on Mintzberg (1988) and
Duray et al (2000). Here, the point of customer involvement in the production process
differentiates the level of customisation. Three levels of customisation were identified:
1. Full customisation (customer input into product design or fabrication)
2. Partial customisation (customer input into product assembly or delivery)
3. Standard (no customer input)
10
Respondents were asked to indicate the level of customisation for their plant’s primary
product (measured in terms of turnover).
3.3 Performance measurement
The study measures the impact of customisation on four competitive priorities: cost, quality,
delivery and flexibility. Respondents were asked to indicate the performance of their primary
product compared to that of their major competitors. The performance scale was a five-point
likert scale with anchors labelled ‘much below’ (=1) and ‘much above’ (=5). Here,
subjective measures were preferred for two reasons. First, it was felt that objectives measures
might reduce the response rate. Previous studies have noted the reluctance of respondents to
divulge sensitive financial information (Boyer et al, 1996), leading to a reduction in
responses (Ward and Duray, 2000). Second, it was felt that accounting measures might not
tap the concepts at the level of aggregation required. As further support, prior research has
shown significant relationships between subjective and objective measures (Boyer et al,
1996; 1997; Ward and Duray, 2000), signifying that subjective measures may be considered
reliable. However, objective measures were also obtained for the quality and delivery
dimensions. Details of the measures are shown in table 2.
[Please insert table 2 about here]
4.0 Results and discussion
4.1 Hypothesis 1
One-way analyses of variance were performed between the degree of customisation and each
of the five cost variables. The results are summarised in table 3. Mixed support is found for
hypothesis 1; customisation does not have a significant effect on four of the five dependent
11

variables. The data suggest that there are no trade-offs between customisation and design (F
= 0.17), component (F = 1.07), delivery (F = 1.17) and servicing (F = 0.50) costs for the
sample firms.
However, contrary to hypothesis 1 customisation does have a significant effect on
manufacturing costs (F = 3.71, p < 0.05). The Scheffé test showed that manufacturing costs
differed significantly between fully customised and standard products (p < 0.10), and
between fully customised and partially customised products (p < 0.10). These findings
support an earlier exploratory study where increased manufacturing costs were found to be
one of the key negative outcomes of increased product customisation (Ahlstrom and
Westbrook, 1999).
[Please insert table 3 about here]
The results offer mixed support for one of the key tenets of mass customisation; that
customised products can be offered at the low cost of standardised products (Pine, 1993;
Hart, 1995). Costs beyond the shop floor did not differ significantly between the three levels
of customisation, suggesting that these capabilities are cumulative. Importantly,
customisation did not significantly impact component costs. Previous studies (Ahlstrom and
Westbrook, 1999) have found a positive relationship between product customisation and
component costs, the results of this study suggest this trade-off has been overcome.
However, despite the advances in flexible manufacturing and product design, manufacturing
costs remain higher for full customisation than either partial customisation or standard
products.
12

4.2 Hypothesis 2
One way analyses of variance were performed between the degree of customisation and each
of the five quality variables. The results are summarised in table 4. The results fully support
hypothesis 2; customisation does not have a significant effect on product durability (F =
0.78), product reliability (F = 0.40), conformance quality (F = 0.43), the percentage of
products returned defective (F = 1.94), and the percentage of products that pass final
inspection (F = 0.80).
[Please insert table 4 about here]
Given the almost obsessive focus on quality by many Western manufacturers in the 1980s,
the lack of trade-off is to be expected. High levels of quality are currently so universal that
quality is no longer sufficient for customer loyalty or sustainable competitive advantage
(Vokurka and Fliedner, 1998; Yusuf and Adeleye, 2002). Quality has become what Terry
Hill (2000) would call an ‘order qualifier’. In order to win new orders companies must look
to sustain competitive levels of quality whilst improving performance for other competitive
priorities. The data suggest that the degree of customisation could be improved whilst
retaining comparable levels of quality. This finding is consistent with the principles of the
sand cone model (Ferdows and De Meyer, 1990), insomuch as capabilities may be built in a
cumulative sequence starting with quality as a base.
4.3 Hypothesis 3a
One way analyses of variance were performed between the degree of customisation and both
measures of delivery speed. The results are summarised in table 5. The results do not
support hypothesis 3a; customisation has a significant effect on the speed of delivery (F =
13

3.91, p < 0.05) and average lead time (F = 7.57, p < 0.00). The Scheffé test showed that the
speed of delivery differed significantly between fully customised and standard products (p <
0.05) and fully customised and partially customised products (p < 0.10). Moreover, average
lead time differed significantly between fully customised and standard products (p < 0.01)
and fully customised and partially customised products (p < 0.01).
[Please insert table 5 about here]
Mass customisation suggests that customised products can be delivered without a
concomitant increase in lead time (Pine, 1993). The data suggest this is not the case; both
measures indicated delivery speed was significantly slower for fully customised products.
However in a trend similar to that of manufacturing costs, the delivery speed of partial
customisation was not significantly different from that of standard products.
4.4 Hypothesis 3b
One way analyses of variance were performed between the degree of customisation and both
measures of delivery reliability. The results are summarised in table 5. The results support
hypothesis 3b; customisation does not have a significant effect on the reliability of delivery
times (F = 2.05) or the percentage of products delivered on time (F = 1.57).
4.5 Hypothesis 4
One way analyses of variance were performed between the degree of customisation and four
flexibility factors. The results are summarised in table 6. The results fully support
hypothesis 4; customisation does not have a significant effect on the ability of the sampled
firms to operate efficiently at different production levels (F = 2.00), to operate profitably at
14

different production levels (F = 0.17), to economically run various batch sizes (F = 0.37), and
to vary aggregate output between production periods (F = 1.03).
[Please insert table 6 about here]
The data posit that flexibility and customisation capabilities are cumulative. It is suggested
that customisation builds on flexibility, that a level of flexibility is required to produce
customised products (Da Silveira et al, 2001). If a strategy of mass customisation is to be
successful, plants must be able to handle fluctuating batch sizes and changes to capacity
(Holweg and Pil, 2001).
4.6 Controlling for size and industry
To control for the effects of size and industry, one way analyses of covariance were
conducted between the degree of customisation and each of the dependent variables applying
firm size (number of employees) and industry (dummy coded SIC codes) as the covariates.
The results were not significantly different from those of the analyses of variance (results
available on request). The fact that no major changes were detected increases the probability
that the independent variable (degree of customization) is indeed having an effect on the
dependent variables (cost, quality, delivery and flexibility).
5.0 Managerial implications
The findings of the study have several important implications for the business community.
First, the current study suggests that product customisation is not free; full customisation
represents a trade-off with both manufacturing costs and delivery lead-times. This finding is
particularly pertinent given the hype surrounding mass customisation. The advent of mass
15
customisation was assumed to eliminate trade-offs between customisation and other
objectives, companies could ‘have it all’ (Pine et al, 1993). Despite the claimed success of a
limited number of case studies, this study shows that in the wider context the introduction of
product customisation will lead to a significant decrease in other areas of manufacturing
performance. For firms considering a shift to mass customisation it is imperative that they
understand what the customer really values. The results suggest that the introduction of full
customisation may be successful only where customers are somewhat price and time
insensitive.
Second, the results show that partial customisation is a cumulative capability; it does not
trade-off with cost, quality, delivery or flexibility. Given that customisation is argued to
increase customer value (Tu et al, 2001), a firm that can provide sufficiently meaningful
differentiation at the level of assembly or delivery may create competitive advantage.
Customer value comprises both benefits and sacrifices (Zeithaml, 1988; Mazumdar, 1993);
partial customisation offers a potential method of increasing benefits without a concomitant
rise in sacrifices, thus augmenting total value. The customising firm may also benefit;
customers may be willing to pay more for a partially customised product. The partially
customised product will generate higher gross profit margins as customers pay more for a
product that does incur any increases to marginal costs.
Third, the current study adds to the debate surrounding manufacturing trade-offs. It has been
suggested that advanced production models, such as mass customisation, overcome
traditional notions of manufacturing trade-offs. The study shows that at the level of full
customisation, customer input into design or fabrication, significant trade-offs still exist. The
existence of trade-offs has important implications for manufacturing strategy. Trade-offs
16

force choices between strategic positions, firms cannot be all things to all people, but must
choose to compete in those areas that offer the highest customer value.
6.0 Limitations and future research directions
One threat to the validity of the findings is the distribution of the sample firms. Although
there is no reason to suspect that the results would vary between countries, future research
could be extended beyond the UK and may compare differences between countries. Two
further concerns are the subjective performance measures and the potential for single
respondent bias. The use of subjective measures was a deliberate choice on the part of the
research team, however, future research may use objective measures to ensure the reliability
of the findings. Single respondent bias is a concern, especially given the use of subjective
measures; future research may either seek multiple respondents for the survey data or use a
form of triangulation between quantitative and qualitative data (Forza, 2002). Furthermore,
we would greatly encourage the use of longitudinal work in this area; studies may assess the
impact of the introduction of mass customisation on the four competitive priorities. This
would greatly help establish causality between the measures of performance.
Acknowledgements
This research was partly funded by a grant from the Engineering and Physical Sciences
Research Council, number GR/R26559/01.
17

References
Ahlstrom, P. & Westbrook, R. 1999. Implications of mass customisation for operations
management. International Journal of Operations and Production Management, 3: 262-274.
Armstrong, J. S. & Overton, T. S. 1977. Estimating nonresponse bias in mail surveys. Journal
of Marketing Research, 14(3): 396-402.
Berman, B. 2002. Should your firm adopt a mass customization strategy? Business Horizons,
45(4): 51-60.
Bhatt, G. D. & Emdad, A. F. 2001. An analysis of the virtual value chain in electronic
commerce. Logistics Information Management, 14: 78-84.
Boyer, K., K., Leong, G. K., Ward, P. T., & Krajewski, L. J. 1997. Unlocking the potential of
advanced manufacturing technologies. Journal of Operations Management, 15: 331-347.
Boyer, K., K., Ward, P. T., & Leong, G. K. 1996. Approaches to the factory of the future. An
empirical taxonomy. Journal of Operations Management, 14(4): 297-313.
Brown, S. 2000. Manufacturing the future - Strategic resonance for enlightened
manufacturing. London: Financial Times.
Collins, R. S., Cordon, C., & Julien, D. 1998. An empirical test of the rigid flexibility model.
Journal of Operations Management, 16: 133-146.
Collins, R. S. & Schmenner, R. 1993. Achieving rigid flexibility: factory focus for the 1990s.
European Management Journal, 11(4): 443-447.
Da Silveira, G., Borenstein, D., & Fogliatto, F. S. 2001. Mass customization: Literature
review and research directions. International Journal of Production Economics, 72: 1-13.
Da Silveira, G. & Slack, N. 2001. Exploring the trade-off concept. International Journal of
Operations and Production Management, 21(7): 949-964.
Davis, S. 1987. Future perfect. Reading, M.A.: Addison-Wesley Publishing.
Duray, R. 2002. Mass customisation origins: mass or custom manufacturing? International
18

Journal of Operations and Production Management, 22(3): 314-328.
Duray, R., Ward, P. T., Milligan, G. W., & Berry, W. L. 2000. Approaches to mass
customisation: configurations and empirical validation. Journal of Operations Management,
18: 605-625.
Eastwood, M. A. 1996. Implementing mass customization. Computers in Industry, 30: 171-
174.
Ferdows, K. & DeMeyer, A. 1990. Lasting improvements in manufacturing performance.
Journal of Operations Management, 9: 168-184.
Filippini, R., Forza, C., & Vinelli, A. 1998. Trade-off and compatibility between
performance: definitions and empirical evidence. International Journal of Production
Research, 36(12): 3379-3406.
Fine, C., H. & Hax, A. C. 1985. Manufacturing strategy: A methodology and an illustration.
Interfaces, 15(6): 28-46.
Firat, A. F. & Schultz II, C., J. 1997. From segmentation to fragmentation: markets and
marketing strategy in the postmodern era. European Journal of Marketing, 31(3/4): 183-207.
Flynn, B. B., Schroeder, R. G., & Flynn, E. J. 1999. World class manufacturing: an
investigation of Hayes and Wheelwright's foundation. Journal of Operations Management,
17: 249-269.
Forza, C. 2002. Survey research in operations management: a process-based perspective.
International Journal of Operations and Production Management, 22(2): 152-194.
Fralix, M. 2001. From mass production to mass customisation. Journal of Textile and
Apparel, Technology and Management, 1(2): 1-7.
Gilmore, J. H. & Pine, B., Joe. 2000. Markets of one: Creating customer-unique value
through mass customisation. Boston, MA: Harvard Business School Press.
Hart, C. 1995. Mass customization: Conceptual underpinnings, opportunities and limits.
19

International Journal of Service Industry Management, 6(2): 36-45.
Hayes, R. H. & Wheelwright, S. 1984. Restoring our competitive edge: Competing through
manufacturing. New York: Wiley.
Hayes, R. H. & Wheelwright, S. 1979. Link manufacturing process and product life cycles.
Harvard Business Review, 57(1): 133-140.
Hill, T. 2000. Manufacturing strategy: text and cases (2 ed.). Basingstoke: Palgrave.
Holweg, M. & Pil, F., K. 2001. Successful build-to-order strategies start with the customer.
Sloan Management Review, 43(1): 74-83.
Kara, A. & Kaynak, E. 1997. Markets of a single customer: exploiting conceptual
developments in market segmentation. European Journal of Marketing, 31(11/12): 873-895.
Kotha, S. 1995. Mass customization: Implementing the emerging paradigm for competitive
advantage. Strategic Management Journal, 16: 21-42.
Kotha, S. 1996. From mass production to mass customisation: The case of the National
Industrial Bicycle Company of Japan. European Management Journal, 14: 442-450.
Kotler, P. 1989. From mass marketing to mass customization. Planning Review, 17(5): 10-13.
Lambert, M. & Harrington, T. C. 1990. Measuring nonresponse bias in customer service mail
surveys. Journal of Business Logistics, 11(2): 5-25.
Lau, S. R. M. 1995. Mass customisation: The next industrial revolution. Industrial
Management, 37(5): 18-19.
Lee, S. C. H., Barua, A., & Whinston, A. B. 2000. The complementarity of mass
customisation and electronic commerce. Economics of Innovation & New Technology, 9: 81-
109.
Mapes, J., New, C., & Szwejczewski, M. 1997. Performance trade-offs in manufacturing
plants. International Journal of Operations and Production Management, 17: 1020-1033.
Mazumdar, T. 1993. A value-based orientation to new product planning. Journal of consumer
20
marketing, 10(1): 28-41.
Meredith, J., McCutcheon, D., & Hartley, J. 1994. Enhancing competitiveness through the
new market value equation. International Journal of Operations and Production Management,
14(11): 7-22.
Mintzberg, H. 1988. Generic strategies: toward a comprehensive framework. Advances in
strategic management, 5: 1-67.
Mueller-Heumann, G. 1992. Market and technology shifts in the 1990s: Market
fragmentation and mass customization. Journal of Marketing Management, 8: 303-314.
New, C. 1992. World class manufacturing versus strategic trade-offs. International Journal of
Operations and Production Management, 11: 6-22.
Pine, B., Joe. 1993. Mass customisation: The new frontier in business competition. Boston,
MA: Harvard Business School Press.
Pine, B., Joe, Victor, B., & Boynton, A., C. 1993. Making mass customisation work. Harvard
Business Review, 71(5): 108-119.
Porter, M., E. 1985. Competitive advantage. New York: The Free Press.
Roth, A. V. & Miller, J. G. 1992. Success factors in manufacturing. Business Horizons,
35(4): 73-81.
Schonberger, R. 1986. World Class Manufacturing. New York: Free Press.
Skinner, W. 1974. The focused factory. Harvard Business Review, 52(3): 113-122.
Skinner, W. 1969. Manufacturing-missing link in corporate strategy. Harvard Business
Review, 47(3): 136-145.
Slack, N. 1991. The manufacturing advantage. London: Mercury Books.
Toffler, A. 1981. The third wave. London: Pan Books Ltd.
Tu, Q., Vonderembse, M., & Ragu-Nathan, T. S. 2001. The impact of time-based
manufacturing practices on mass customization and value to customer. Journal of Operations
21

Management, 19: 201-217.
Vickery, S., Dröge, C., & Germain, R. 1999. The relationship between product customisation
and organizational structure. Journal of Operations Management, 17: 377-391.
Vokurka, R. J. & Fliedner, G. 1998. The journey towards agility. Industrial Management &
Data Systems, 98(4): 165-171.
Ward, P. T. & Duray, R. 2000. Manufacturing strategy in context: environment, competitive
strategy and manufacturing strategy. Journal of Operations Management, 18(2): 123-138.
Westbrook, R. & Williamson, P. 1993. Mass customization: Japan's new frontier. European
Management Journal, 11(1): 38-45.
White, G. P. 1996. A meta-analysis model of manufacturing capabilities. Journal of
Operations Management, 14: 315-331.
Yusuf, Y. Y. & Adeleye, E. O. 2002. A comparative study of lean and agile manufacturing
with a related survey of current practices in the UK. International Journal of Production
Research, 40(17): 4545-4562.
Zeithaml, V. A. 1988. Consumer perceptions of price, quality and value: A means-end model
and synthesis of evidence. Journal of Marketing, 52(3): 2-22.
22

Figure 1: Positioning mass customisation
Mass Production
Mass Customisation
Batch Production
Craft Production
Scal
e of
Pro
duct
ion
Degree of Customer Input
23

Table 1: Summary of respondents
Turnover Under £10
million £11-50 million
£51-101 million
£101 – 500 million
Total
28.00 3 9 1 0 13 29.00 8 12 4 1 25 30.00 0 1 1 1 3 31.00 5 3 0 1 9 33.00 3 7 2 0 12 34.00 7 8 1 3 19 35.00 2 4 0 1 7
SIC
36.00 6 8 0 0 14 Total 34 52 9 7 102
24
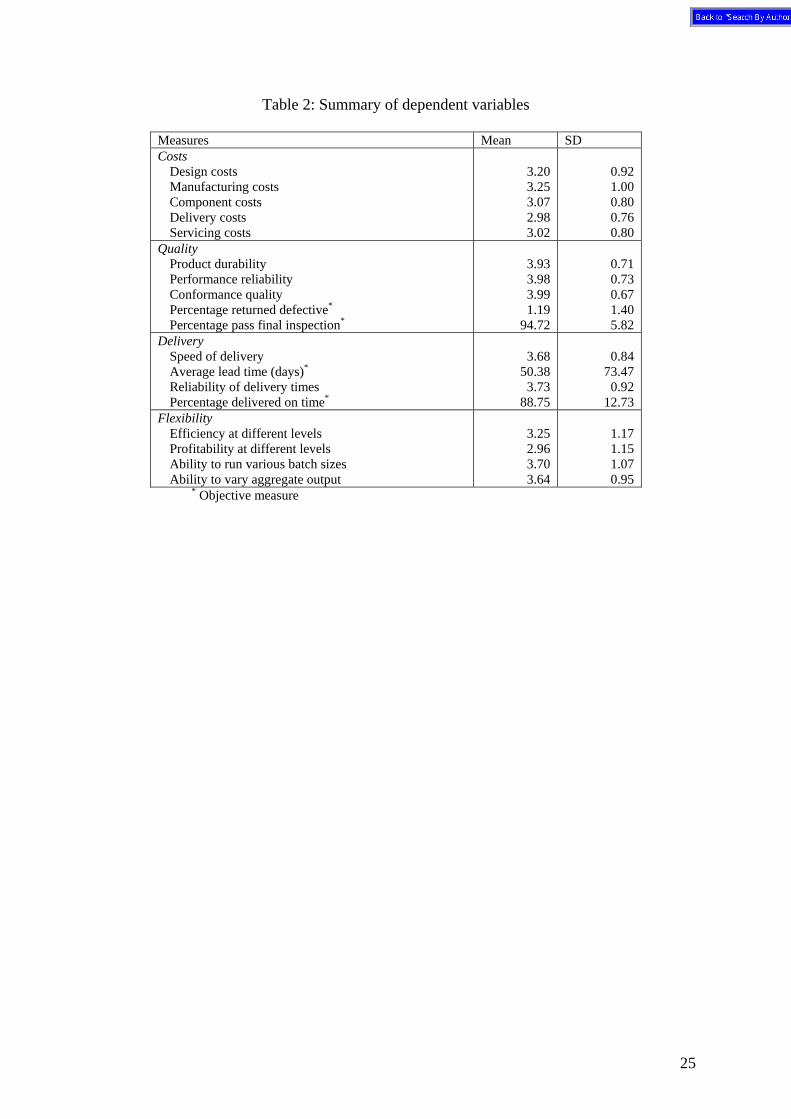
Table 2: Summary of dependent variables
Measures Mean SD Costs
Design costs Manufacturing costs Component costs Delivery costs Servicing costs
3.20 3.25 3.07 2.98 3.02
0.92 1.00 0.80 0.76 0.80
Quality Product durability Performance reliability Conformance quality Percentage returned defective*
Percentage pass final inspection*
3.93 3.98 3.99 1.19
94.72
0.71 0.73 0.67 1.40 5.82
Delivery Speed of delivery Average lead time (days)*
Reliability of delivery times Percentage delivered on time*
3.68
50.38 3.73
88.75
0.84
73.47 0.92
12.73 Flexibility
Efficiency at different levels Profitability at different levels Ability to run various batch sizes Ability to vary aggregate output
3.25 2.96 3.70 3.64
1.17 1.15 1.07 0.95
* Objective measure
25

Table 3: Differences in costs across product types
* P < 0.10 ** P < 0.05 *** P < 0.01
Product type Cost Factor Standard (a) Partial custom (b) Full custom (c)
Pairwise Differences
F Value Significance
Design costs 3.16 3.26 3.15 NS 0.17 0.85
Manufacturing costs 2.93 3.06 3.56 (a, c)* (b, c) * 3.71 0.03
Component costs 2.86 3.02 3.20 NS 1.07 0.35
Delivery costs 2.71 2.98 3.07 NS 1.17 0.31
Servicing costs 2.86 3.00 3.10 NS 0.50 0.61
26
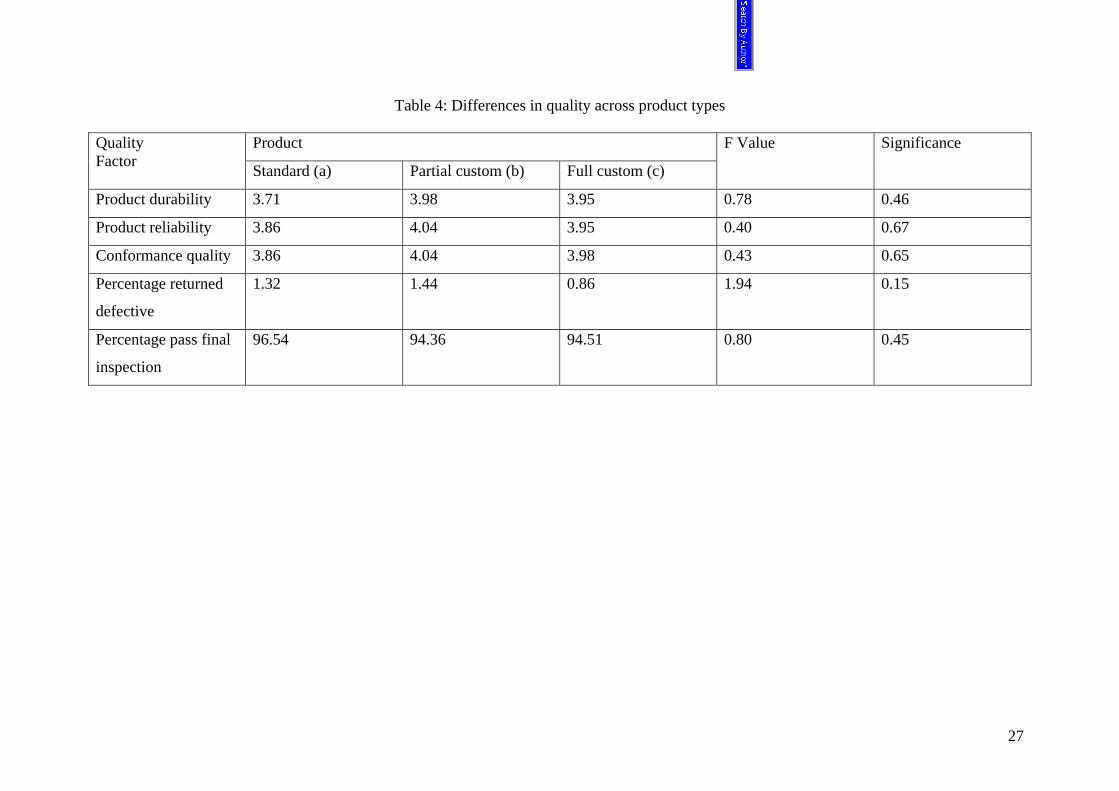
Table 4: Differences in quality across product types
Product Quality Factor Standard (a) Partial custom (b) Full custom (c)
F Value Significance
Product durability 3.71 3.98 3.95 0.78 0.46
Product reliability 3.86 4.04 3.95 0.40 0.67
Conformance quality 3.86 4.04 3.98 0.43 0.65
Percentage returned
defective
1.32 1.44 0.86 1.94 0.15
Percentage pass final
inspection
96.54 94.36 94.51 0.80 0.45
27

Table 5: Differences in delivery across product types
Product Delivery Factor Standard (a) Partial custom (b) Full custom (c)
Pairwise Differences
F Value Significance
Speed of delivery
4.21 3.68 3.50 (a, c)** (b, c)* 3.91 0.02
Average lead time
(days)
11.07 35.00 81.44 (a, c)*** (b, c) *** 7.57 0.00
Reliability of
delivery times
4.00 3.83 3.51 NS 2.05 0.13
Percentage
delivered on time
92.00 90.04 86.15 NS 1.57 0.21
* P < 0.10 ** P < 0.05 *** P < 0.01
28

Table 6: Differences in flexibility across product types
Product Flexibility Factor Standard (a) Partial custom (b) Full custom (c)
F Value Significance
Operate efficiently at
different levels
3.14 3.49 3.00 2.00 0.14
Operate profitably at
different levels
2.79 3.15 2.80 0.17 0.32
Economically run
various batch sizes
3.93 3.68 3.65 0.37 0.69
Vary aggregate output
between periods
3.64 3.78 3.49 1.03 0.36
29