the endocannabinoid system is modulated in reward and
TRANSCRIPT

Vol.:(0123456789)1 3
European Journal of Nutrition (2021) 60:4621–4633 https://doi.org/10.1007/s00394-021-02613-0
ORIGINAL CONTRIBUTION
The endocannabinoid system is modulated in reward and homeostatic brain regions following diet‑induced obesity in rats: a cluster analysis approach
Romain Bourdy1 · Alexandra Hertz1 · Dominique Filliol1 · Virginie Andry2 · Yannick Goumon2 · Jorge Mendoza2 · Mary C. Olmstead3 · Katia Befort1
Received: 13 January 2021 / Accepted: 8 June 2021 / Published online: 24 June 2021 © Springer-Verlag GmbH Germany, part of Springer Nature 2021
AbstractObjectives Increased availability of high-calorie palatable food in most countries has resulted in overconsumption of these foods, suggesting that excessive eating is driven by pleasure, rather than metabolic need. The behavior contributes to the rise in eating disorders, obesity, and associated pathologies like diabetes, cardiac disease, and cancers. The mesocorticolimbic dopamine and homeostatic circuits are interconnected and play a central role in palatable food intake. The endocannabinoid system is expressed in these circuits and represents a potent regulator of feeding, but the impact of an obesogenic diet on its expression is not fully known.Methods Food intake and body weight were recorded in male Wistar rats over a 6-week free-choice regimen of high fat and sugar; transcriptional regulations of the endocannabinoid system were examined post-mortem in brain reward regions (prefrontal cortex, nucleus accumbens, ventral tegmental area, and arcuate nucleus). K-means cluster analysis was used to classify animals based on individual sensitivity to obesity and palatable food intake. Endocannabinoid levels were quantified in the prefrontal cortex and nucleus accumbens. Gene expression in dopamine and homeostatic systems, including ghrelin and leptin receptors, and classical homeostatic peptides, were also investigated.Results The free-choice high-fat -and sugar diet induced hyperphagia and obesity in rats. Cluster analysis revealed that the propensity to develop obesity and excessive palatable food intake was differently associated with dopamine and endocan-nabinoid system gene expression in reward and homeostatic brain regions. CB2 receptor mRNA was increased in the nucleus accumbens of high sugar consumers, whereas CB1 receptor mRNA was decreased in obesity prone rats.Conclusions Transcriptional data are consistent with observations of altered dopamine function in rodents that have access to an obesogenic diet and point to cannabinoid receptors as GPCR targets involved in neuroplasticity mechanisms associated with maladaptive intake of palatable food.
Keywords Endocannabinoids · Diet-induced obesity · Reward · Dopamine · Gene expression · Mass spectrometry
Abbreviations2-AG 2-Arachidonoyl glycerolAEA Anandamide
AgRP Agouti-related peptideArc Arcuate nucleusBMI Body Mass IndexCART Cocaine and amphetamine regulated
transcriptCB1 Cannabinoid receptor type 1CB2 Cannabinoid receptor type 2COMT Catechol O-methyltransferaseD1 Dopamine receptor D1D2 Dopamine receptor D2DA DopamineDAGL Diacylglycerol lipaseDAT Dopamine transporterDS Dorsal striatum
* Katia Befort [email protected]
1 Laboratoire de Neurosciences Cognitives Et Adaptatives (LNCA), UMR7364, Université́ de Strasbourg, CNRS, 12 rue Goethe, 67000 Strasbourg, France
2 Institut Des Neurosciences Cellulaires Et Intégratives (INCI), UPR3212, CNRS, 8 Allée du Général Rouvillois, 67000 Strasbourg, France
3 Department of Psychology, Center for Neuroscience Studies, Queen’s University, Kingston, ON K7L 3N6, Canada

4622 European Journal of Nutrition (2021) 60:4621–4633
1 3
FAAH Fatty acid amide hydrolaseGPCR G protein-coupled receptorGPR55 G protein-coupled receptor 55GR Growth hormone secretagogue receptorHFC High Fat ConsumersHSC High Sucrose ConsumersLPC Low Palatable ConsumersLR Leptin receptorMGL Monoacylglycerol lipaseNAc Nucleus accumbensNAPE-PLD N-acyl phosphatidylethanolamine phospho-
lipase DNPY Neuropeptide YOP Obesity ProneOR Obesity ResistantPFC Prefrontal cortexPOMC ProopiomelanocortinTH Tyrosine hydroxylaseVTA Ventral tegmental area
Introduction
Obesity has increased worldwide in the past few decades and represents one of the biggest contemporary health chal-lenges. The condition is associated with severe health prob-lems, such as Type 2 Diabetes, hypertension, cardiovascular diseases, and multiple cancers [1]. Most recently, obesity has been identified as a primary risk factor for poor outcomes related to Coronavirus disease [2]. Increased availability of low cost, energy-dense food and sugary drinks is a major contributor to overeating, which is the largest determinant of obesity [3]. Interestingly, ingestion of palatable food acti-vates brain reward systems and shares common mechanisms of action with drugs of abuse. These could explain a switch from controlled to excessive food intake that leads to obesity, although the possibility that “addiction” develops to palat-able food remains controversial [4].
Food intake is regulated by a complex interplay between peripheral physiological signals and brain reward circuits [5]. These interactions involve metabolic and nutritional signals that regulate homeostatic eating and reward signals coding pleasurable aspects of food that drive hedonic intake. More specifically, the homeostatic system maintains energy balance between caloric intake and energy expenditure. This system is located in the mediobasal hypothalamus includ-ing the arcuate nucleus (Arc), which contains two distinct subsets of neurons. The first expresses pro-opiomelanocor-tin (POMC) and cocaine-amphetamine-regulated transcript (CART) and suppresses feeding while increasing meta-bolic rate. The second expresses neuropeptide Y (NPY) and agouti-related peptide (AgRP) which increases food intake. These are under the control of peripheral signals,
including ghrelin and leptin that convey information to the brain regarding available energy stores, then initiate adap-tive behaviors (i.e., food intake) in response to deficits [6]. Hedonic feeding is mediated via the reward system, consist-ing of mesolimbic dopamine (DA) projections from the ven-tral tegmental area (VTA) to the nucleus accumbens (NAc) and prefrontal cortex (PFC). Drugs of abuse and highly palatable food both increase DA release in the NAc [7, 8], leading to overlapping neuroadaptations in reward circuitry that alter the motivation to obtain a reward [9]. Both obese humans and animals, that have undergone excessive food intake, exhibit altered reward processing [10, 11]. Among suggested mechanisms, heightened cue reactivity has been proposed to predispose individuals to overeat. Compulsive eating may also result from this alteration combined with deficient prefrontal inhibitory circuits [12, 13]. Another hypothesis proposes that a hypofunctioning reward system increases consumption of highly palatable food; in this case, excessive food intake is a compensatory mechanism to deal with diminished rewarding effects of palatable food [11, 14, 15]. These results converge on the idea that a DA deficiency syndrome (i.e., hypodopaminergic function) underlies exces-sive eating that leads to obesity.
In addition to DAergic systems, regulation of food intake and energy balance involves other systems, including the endocannabinoid system [16]. Centrally, this system is composed of two well-characterized G-protein coupled receptors (CB1 and CB2). Other receptors, including the orphan GPR55, are also targets of cannabinoid compounds. Endogenous compounds that act at these receptors have been described, with the best studied being anandamide (AEA) and 2-arachidonoylglycerol (2AG). The system is expressed both in hypothalamic and mesolimbic brain regions where it regulates both homeostatic and hedonic feeding [17]. In the hypothalamus, endocannabinoid levels are modulated in response to metabolic states with an increase during fasting and a decrease when animals are sated [16]. Endocannabi-noids in the NAc and VTA modulate palatable food-evoked DA release [18, 19], increasing palatability and the hedonic impact of food [20]. As in the hypothalamus, food depri-vation increases endocannabinoid levels whereas food con-sumption decreases these in the limbic forebrain, including the NAc [21]. Indeed, endocannabinoids promote overeating when administered centrally either in the hypothalamus or the NAc [21, 22]. The endocannabinoid system, therefore, links homeostatic and hedonic circuits involved in energy balance regulation [17], which may explain cannabinoid sig-nal dysfunction in eating disorders and obesity [23]. Indeed, obesity is associated with an overactive endocannabinoid system in humans and animal models, including elevated plasmatic levels of AEA and 2-AG [24–26].
One diet-induced obesity rodent model, based on a free-choice high-fat high-sucrose (fcHFHS) paradigm, has proven
4623European Journal of Nutrition (2021) 60:4621–4633
1 3
to be a valuable preclinical model for obesogenic studies as it induces caloric overconsumption and excessive weight gain (for a review, see [27]). In this paradigm, rodents have the opportunity to choose from several diet components, het-erogeneous in palatability, form and nutritive content [28], which mimics an important feature of modern-day human diets. Extended exposure to this fcHFHS diet increases motivation to work for sugar pellets, an effect not observed following no choice diets [29]. Interestingly, this increased motivation occurs specifically in obesity prone rats following food withdrawal [30]. We used this paradigm to investigate the consequences of a fcHFHS diet on gene expression in DA and endocannabinoid systems using qPCR; we focused on brain regions associated with homeostatic and hedonic control of food intake. A k-means cluster analysis approach was used to analyze these data, based on obesity or palat-able food intake hallmarks. Furthermore, endocannabinoid levels were measured in both the NAc and PFC using mass spectrometry.
Methods
Subjects
Forty-eight male Wistar rats (Janvier Labs, Le Genest-Saint-Isle, France) weighing 200 ± 10 g at arrival were individually housed in standard cages in a light-controlled room (lights on 07:00–19:00) maintained at a temperature of 23 °C. Rats were allowed to adapt to their environment for 2 weeks with access to ad libitum standard chow (Standard Diet, Muced-ola, Italy) and water. All experiments were approved by the CREMEAS (Comité d’Éthique pour l’Expérimentation Ani-male de Strasbourg, France, APAFIS #2017040311573635) and performed by certified scientists to work with living animals. All efforts were made to minimize animal suffering and to reduce the number of animals used.
Diet
Following the habituation period, animals were divided into two groups: a control group (n = 23) exposed to a standard chow diet (4RF21, 3.952 kcal/g containing 19.42% proteins, 2.58% lipids, 5.54% fibers, 6.76% ash, 54.61% nitrogen-free extract, Mucedola, Italy) and a free-choice high-fat high-sugar group (fcHFHS, n = 25) exposed to standard chow with normal tap water, combined with availability of satu-rated fat (“blanc de boeuf”, Vandermoortele, France) and a bottle of 10% sugar dissolved in water (Powder Sugar, Erstein, France), as previously described [28]. The regi-men lasted 6 weeks (Fig. 1a). The sucrose concentration was chosen to be comparable to most sweetened beverages consumed by humans, and as a preferred sugar concentration
in rats [31]. Animals were weighed once per week and daily food and liquid intake were recorded every 24 h. Group randomization was established based on the initial animal weight. Total calorie intake was then calculated per day for each rat.
Sample collection and quantitative polymerase chain reaction (qPCR)
Animals were given an overdose of pentobarbital (182 mg/rat, i.p.). Weight and body length were recorded to calcu-late body mass index (BMI, distance tip of nose-anus2/body mass). Individual mesenteric, epididymal, subcutaneous (inguinal), and perirenal white adipose tissues were dis-sected from the left side, cleaned and weighed. Fresh brains were collected, cut in 1-mm slices in a rat brain matrix, and regions were collected bilaterally (except for the Arc) according to a rat brain stereotaxic atlas [32]. PFC (3 mm punch, 4.68 to 2.5 mm from bregma, 2 slices), NAc (1.9 mm punch, 3 to 0.6 mm from bregma, 2 slices), VTA (1 mm punch, − 5 to − 6 mm from bregma, bilateral, 1 slice), and Arc (1.9 mm punch, − 2.04 to − 3.6 mm from bregma, central, 1 slice) samples were kept at -80 °C. Gene expres-sion was analyzed using qPCR as described previously [33]. Briefly, qPCR was run in triplicate using Sso Advanced™ Universal SYBR Green supermix in a CFX96 Touch™ apparatus (Biorad) with following thermal cycling param-eters: 30 s at 95 °C followed by 40 amplification cycles of 5 s at 95° and 45 s at 60 °C. Primer sequences were established using primer3 software (see Supplemental Table 1). Expres-sion levels were normalized to Rplp0 housekeeping gene levels, commonly used in brain or food-related studies [34, 35] and compared between controls and fcHFHS samples using the 2-ΔΔCt method [36].
Mass spectrometry
PFC and NAc samples, distinct from the qPCR experiment were prepared as previously described [33]. Briefly, they were sonicated (2 times 5 s, 90 W) in 200 µl of H2O. The homogenate was centrifuged (20,000 g, 30 min, 4 °C) and supernatant (150 µl) was mixed with 50 µl of acetonitrile (ACN) 100% containing 400.26 pmol of D8-2AG (sc-480539; Santa Cruz, Heidelberg, Germany) and 100.15 pmol of D4-AEA (Tocris/Biotechne, Lille, France). Samples were centrifuged (20,000 g for 30 min, 4 °C), the supernatant was collected and evaporated to dryness. Samples were re-sus-pended in 20 µl of ACN 30%/H2O 69.9%/formic acid 0.1% (v/v/v). We did not have enough material to perform the same analysis on individual VTA or Arc samples. Analyses were performed on a Dionex Ultimate 3000 HPLC system coupled with a triple quadrupole Endura mass spectrometer (Thermo Scientific, San Jose, USA), controlled by Xcalibur
4624 European Journal of Nutrition (2021) 60:4621–4633
1 3
v. 2.0 software (Thermo Electron, San Jose, USA). Samples (3 µl) were loaded onto the column heated at 40 °C. Elution was performed by applying a gradient of mobile phases A/B (flow rate of 50 µl/min). Column, mobile phases, gradient, and MS parameters are detailed in Supplemental Table 2. Qualification and quantification were performed with the multiple reaction monitoring mode (MRM) and based on precursor ion, selective fragment ions and retention times obtained for 2-AG, AEA, D8-2-AG, and D5-AEA. All amounts of endocannabinoids fit within the standard curve limits, with typical analytical ranges from 1fmol–100 pmol to 150fmol–100 pmol. Precision (CV% between repeated
injections of the same sample) values were < 1% for same-day measurements and < 5% for inter-day measurements.
Statistical analysis
k-means clustering and correlograms were performed using R software (https:// www. datan ovia. com/ en/ lesso ns/k- means- clust ering- in-r- algor ith- and- pract ical- examp les/). Obesity clusters (k = 2; obesity prone, OP and obesity resistant, OR) were generated using fat pad weight, body mass index, and total weight gain as the 3 variables. Palat-able food consumption-based clusters (k = 3; low palatable
4625European Journal of Nutrition (2021) 60:4621–4633
1 3
consumers, LPC, high sucrose consumers, HSC and high fat consumers, HFC) were generated using total palatable food, total sucrose, and total fat consumption as the 3 variables. Because the data contained more than 2 variables, scatter plot visualization was performed by applying a dimension-ality reduction algorithm (PCA) that outputs two new vari-ables from the three original variables. All qPCR data were analyzed throughout obesity hallmarks and palatable food intake-based subgroups, with the main limitation being a low number of animals in some subgroups. Only statistically significant results are reported.
All data were tested for normality and homoscedasticity before applying parametric statistical tests. Statistical analy-sis for body weight gain, food consumption, qPCR, and mass spectrometry results were performed using Graphpad Prism 6.0 software. Differences between control and fcHFHS groups were assessed using unpaired two-tailed t-tests, and by one-way ANOVA with Tukey’s post hoc test for multiple comparisons to assess differences between more than two
groups (cluster comparisons). Repeated measures two-way ANOVA and multiple comparison tests including Sidak cor-rection were used to assess differences in food intake and body weight changes over time between groups. Correlation and linear regressions were performed to compare sucrose/fat intake with time, CB2, and GPR55 relative expression between them and in relation to sucrose consumption.
Results
Feeding behavior and body composition
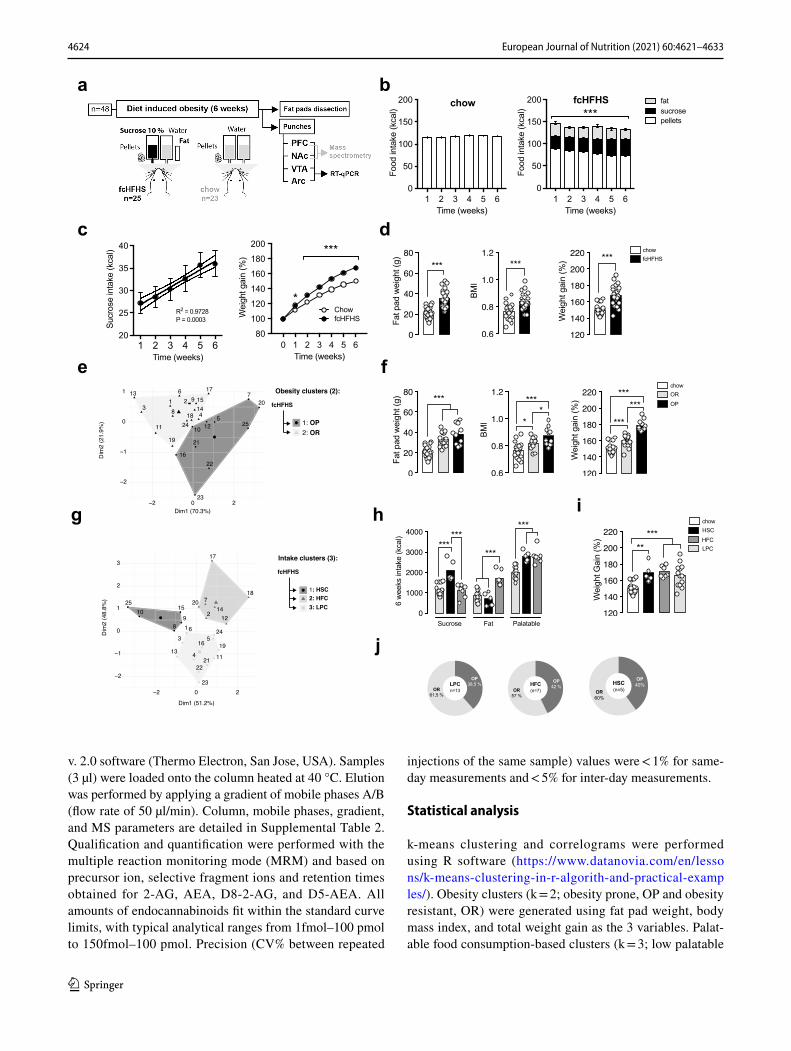
Over the 6-week diet, the fcHFHS group consumed signifi-cantly more total calories than the control group, showing a persistent hyperphagia (Fig. 1b; F(1,46) = 38.72, p < 0.0001, p < 0.006 for each time point). In the fcHFHS group, whereas calorie intake from fat was stable over weeks (Supplemental Fig. 1a), calorie intake from sucrose progressively increased (Fig. 1c left; Y = 1.936 * x + 24.94, R2 = 0.973, p = 0.0005) and conversely, calorie intake from standard chow progres-sively decreased (Supplemental Fig. 1b; Y = − 3362 * x + 92.14, R2 = 0.965 p = 0.0005). Calories consumed from fat or sucrose solution did not significantly differ, although standard chow provided higher calories than palatable food (Fig. 1b; F(1, 48) = 50.85, p < 0.0001, p < 0.0007 for each time point). Hyperphagia of the fcHFHS group resulted in a rapid increase in weight gain compared to the control group, and was significantly different, already following the first week of the diet (Fig. 1c, d; F(1, 46) = 44.12, p < 0.0001, p = 0.027 for the first week, p < 0.0001 for other time points). Diet exposure also increased abdominal fat pads, weight gain and BMI, two other obesity hallmarks (Fig. 1d; p < 0.0001 for each obesity hallmark).
K‑means clustering analysis
Besides data analysis of control and fcHFHS groups, we also generated statistical analysis using a k-mean clusters to highlight distinct populations inside the obesogenic group, without a prior assumption (see methods). Using three obe-sity hallmarks (fat pad weight, BMI, and weight gain) as variables to generate “obesity clusters”, the fcHFHS group was divided into two subgroups: obesity prone (OP; n = 10) and obesity resistant (OR; n = 15) animals (Fig. 1e). There were no differences in weight between OP, OR, and con-trols before the regimen (see Supplemental Fig. 2b). Both OP and OR groups showed increased fat pad weight (F(2, 45) = 27.55, p < 0.0001; chow vs OR and chow vs OP: ps < 0.0001), BMI (F(2, 45) = 14.23, p < 0.0001, chow vs OR: p = 0.014, chow vs OP: p < 0.0001) and weight gain (F(2, 45) = 65.39, p < 0.0001, chow vs OR and chow vs OP: ps < 0.0001) compared to the control group (Fig. 1f).
Fig. 1 Effects of a 6-week free choice high fat high sugar (fcHFHS) diet on hyperphagia and obesity. a Experimental design. b Mean daily caloric intake in fcHFHS versus control (chow) animals. Caloric intake was significantly higher in the fcHFHS group compared to the chow group over the 6 weeks of the diet. c left panel. Linear regres-sion between mean daily sucrose consumption and time (n = 25). Dashed lines represent the 95% confidence bands of the best-fit line. Sucrose consumption progressively increased over weeks in both groups. Right panel. Mean weekly weight gain during the diet (% of the body weight at the start of the diet). The fcHFHS diet led to a sig-nificant, rapid, and higher increase in weight gain in rats compared to the chow-control animals. d Mean fat pads weight, BMI, and weight gain at the end of the 6-week regimen. These three obesity hallmarks were increased following the diet. e Graphical representation of OP and OR clusters resulting from Km Clustering based on the 3 obesity criteria mean values measured at the end of the experiment (Fat pad weight, BMI and weight gain). X and y axes represent the first two components of the principal component analysis after dimensional reduction (3 to 2 variables). % = percentage of variance. f Compari-son of the 3 obesity criteria between groups. BMI and weight gain were significantly higher in OP than OR rats. The 3 obesity criteria were increased in the 2 clusters when compared with the chow group. g Graphical representation of HSC, HFC, and LPC clusters result-ing from Km Clustering based on the 3 palatable food intake-based criteria mean values measured at the end of the experiment (total sucrose intake, total fat intake, and total palatable food intake). Minor geometric forms represent individual values, major geometric forms represent cluster centroids. h Comparison of palatable food intake between clusters. HSC consumed more sucrose, HFC more fat, and LPC less palatable food than animals belonging to the other clusters. i Comparison of weight gain between the chow group and the 3 pal-atable food intake-based clusters. Weight gain was increased in the 3 clusters compared to the chow group. j Proportion of OP/OR rats belonging to the 3 palatable intake-based clusters. The same propor-tions of OP and OR animals were observed in the 3 clusters. In bar graphs, white dots represent individual data. *p < .005; **p < .001; ***p < .0001, n = 5–23 per group. fcHFHS (n = 25); OP obesity prone (n = 10); OR obesity resistant (n = 15); BMI body mass index; LPC low palatable consumers (n = 13); HSC high sucrose consumers (n = 5); HFC high fat consumers (n = 7)
◂

4626 European Journal of Nutrition (2021) 60:4621–4633
1 3
Although fat pad weight at the end of the diet did not differ between OR and OP groups, BMI and weight gain were significantly increased in the OP group (BMI: p = 0.048; weight gain: p < 0.0001). The analysis of chow intake over the 6-week regimen revealed that the OP group consumed more chow than the OR group (p = 0.016, Supplemental Fig. 2a).
In a parallel cluster analysis, total sucrose intake, total fat intake, and total palatable food intake over the 6 week-diet were used as variables and generated 3 “palatable food clus-ters” subgroups: high-sucrose consumers (HSC; n = 5), high-fat consumers (HFC; n = 7) and low palatable food consum-ers (LPC; n = 13) (Fig. 1g). HSC, HFC, and LPC consumed, respectively, more sucrose (F(2, 22) = 14.78, p < 0.0001, HSC vs LPC: p = 0.0001, HSC vs HFC: p = 0.0002), more fat (F(2, 22) = 22,43, p < 0.0001, HFC vs LPC: p < 0.0001, HFC vs HSC: p < 0.0001), and less palatable food (F(2, 22) = 20.67, p < 0.0001, LPC vs HSC: p = 0.0002, LPC vs HFC: p < 0.0001) than the two other groups for each com-parison (Fig. 1h). Total chow intake was not significantly different across groups (Supplemental Fig. 2c). Importantly, weight gain at the end of the diet was increased compared to the control group [F(3, 44) = 14.18, p < 0.0001; HFC vs LPC: p < 0.0001, HSC vs chow: p = 0.0012, HFC vs chow: p < 0.0001, LPC vs chow: p < 0.0001], but did not differ across these three subgroups (Fig. 1i), neither before the regimen (Supplemental Fig. 2d). The proportion of OP and OR rats was similar in HSC, HFC, and LPC groups, indicat-ing that obesity and palatable food clusters were independent (Fig. 1j).
Dopamine gene expression and dopamine levels
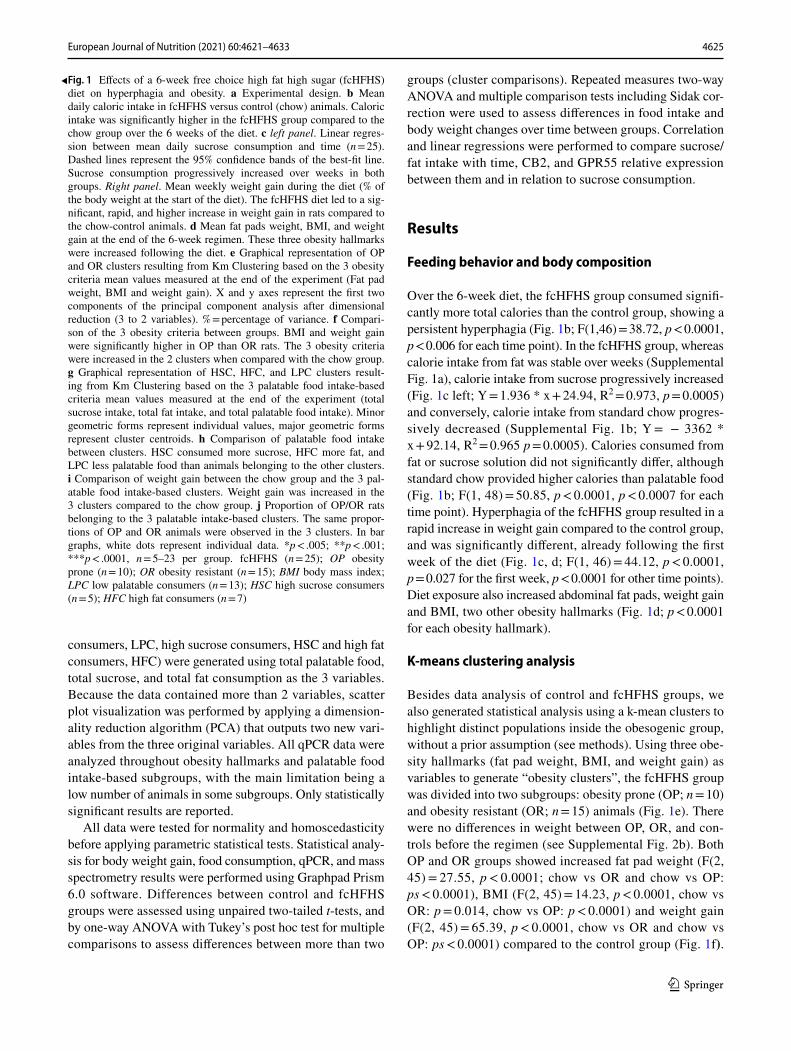
We first investigated the effects of a fcHFHS diet on the expression of genes from the DA system. Catechol-O-methyl transferase (degradation enzyme for DA, COMT) mRNA was increased in the PFC (Fig. 2a; p = 0.024) and NAc (Fig. 2b, p = 0.012) following the diet. Interestingly, and as previously shown by others using a clustering approach in a diet-induced obesity model [37], separation of the fcHFHS group into OP/OR subgroups revealed a decrease in DA D1 receptor transcripts in the OP group compared to the control group (F(2, 34) = 3.939, p = 0.029), although no difference was observed between control and OR groups (Fig. 2c). DA contents in the NAc, obtained using mass spectrom-etry, were no different between fcHFHS and control groups (Fig. 2d). In the VTA, the fcHFHS diet induced an increase in D1 receptor transcripts (p = 0.0067) and a decrease in D2 receptor (p = 0.0042), DAT (p < 0.001), and TH (p < 0.001) synthesis enzyme transcripts (Fig. 2e). No significant dif-ferences were detected following the cluster analysis in OP and OR samples, or with the palatable food clusters (data not shown).
Cannabinoid gene expression and endocannabinoid levels
We first investigated the effects of a fcHFHS diet on gene expression from the endocannabinoid system in the NAc. Transcripts coding for an AEA synthesis enzyme, NAPE-PLD, and AEA degradation enzyme, FAAH, were, respec-tively, increased (p = 0.030) and decreased (p = 0.034) in the NAc of the fcHFHS group compared to the control group (Fig. 3a, left graph). Both transcripts coding for a 2-AG synthesis enzyme, DAGL, and degradation enzyme, MGL, were decreased following fcHFHS diet exposure (Fig. 3a, left graph; DAGL: p = 0.013, MGL: p = 0.022). The can-nabinoid receptors CB1, CB2, and GPR55 showed dis-tinct regulation patterns in the NAc. CB1 transcripts were not regulated, whereas levels of CB2 and GPR55 recep-tor transcripts showed a strong variability in the fcHFHS group (Fig. 3a, left graph). The palatable food-clustering explained this variability with an increase in CB2 and GPR55 transcripts in the HSC compared to control, HF, and LPC groups (Fig. 3b; CB2: [F(3, 25) = 12.45, p < 0.0001, HSC vs chow: p = 0.0037, HSC vs HFC: p = 0.0003, HSC vs LPC: p < 0.0001]; GPR55: [F(3, 25) = 9.716, p = 0.0002, HSC vs chow: p = 0.0008, HSC vs HFC: p = 0.001, HSC vs LPC: p < 0.0003]. Interestingly, we observed a trend for an opposite regulation with a decrease in CB2 and GPR55 transcripts in HFC and LPC groups. A strong correlation between the CB2 and GPR55 receptor transcript levels was observed (Fig. 3c, left graph; R2 = 0.916, p < 0.0001). Impor-tantly, this correlation was found in all animals, including the control group. Interestingly, CB2 and GPR55 transcript levels were correlated with total sucrose intake at the end of the fcHFHS diet (Fig. 3c, right graph; R2 = 0.39, p = 0.0127; Supplemental Fig. 1c; R2 = 0.38, p = 0.015). No significant correlations were observed for CB2 or GPR55 and fat mass (Supplemental Fig. 1d). In the NAc, mass spectrometry measurements revealed a decrease in 2-AG levels in the fcHFHS group compared to the control group (Fig. 3a, right graph; p = 0.0004) whereas no difference was observed for AEA (Fig. 3a, middle graph). In the VTA, CB1 and CB2 receptor transcript levels were oppositely regulated follow-ing the fcHFHS diet with a decrease and an increase, respec-tively, in this group compared to the control group (Fig. 3d; CB1: p = 0.012, CB2: p = 0.002). Moreover, fcHFHS diet exposure induced a global decrease in transcripts for AEA and 2-AG synthesis and degradation enzymes (Fig. 3d; NAPE: p = 0.0002, FAAH, DAGL and MGL: ps < 0.0001). Finally, in the Arc, GPR55 transcripts were decreased in the fcHFHS group compared to the control group (Fig. 3e; p = 0.0009). The variability observed for levels of CB1 tran-scripts in the fcHFHS group (Fig. 3e) could be explained by a decrease in the OP compared to the OR subgroup [Fig. 3f; F(2, 23) = 4.95, p = 0.016, OP vs OR: p = 0.013].

4627European Journal of Nutrition (2021) 60:4621–4633
1 3
No regulation of cannabinoid gene expression or endocan-nabinoid levels was detected in the PFC in our conditions (Supplemental Fig. 3 a,b).
Gene expression regulation in the homeostatic system
We also investigated the effects of a fcHFHS diet on gene expression from the homeostatic system in the VTA and Arc. In the VTA, diet exposure decreased the expression of POMC anorexigenic peptide (Fig. 4a; POMC: p = 0.029). In the Arc, transcripts for the growth hormone secreta-gogue receptor or ghrelin receptor (GR) were significantly decreased in the fcHFHS group compared to the control group (Fig. 4b, left; p = 0.026). Separation of the fcHFHS group into OP/OR subgroups using the obesity hallmarks-clustering revealed a significant increase in NPY transcripts in the OP group compared to the OR and control groups
(Fig. 4c, right; F(2, 21) = 4.66, p = 0.021; OP vs chow: p = 0.034, OP vs OR: p = 0.038).
Discussion
Here we provide a detailed summary (Fig. 5) of endo-cannabinoid system modulation by a fcHFHS diet, with cluster analysis revealing increases in both CB2 and GPCR55 in the NAc of the HSC. As well we observed a decrease in CB1 transcripts in the Arc of OP animals and an increase in the same measure for OR subgroups. High sugar intake induced an increase in both CB2 and GPR55 transcripts in the NAc, levels that were correlated with each other and with total sucrose intake following the 6-week diet. Interestingly, a saturated fat diet can induce inflammatory processes in the mouse NAc, an effect that mediated anxio-depressive behavior and compulsive
Fig. 2 Effects of fcHFHS on dopamine related gene expression in the reward system and dopamine content in the NAc. a In the PFC, COMT transcripts were increased following the diet. b In the NAc, COMT transcripts were increased in the fcHFHS group compared to the chow group and D1 receptor transcripts were decreased in the OP group compared to the chow group. c Dopamine levels in the NAc did not differ between chow and fcHFHS groups. d In the VTA, fcH-FHS oppositely regulated D1 and D2 receptor transcripts (increase
and decrease, respectively). Both DAT and TH transcripts were decreased in the fcHFHS group compared to the chow group. (White dots represent individual data. *p < .005; **p < .001; ***p < .0001, n = 5–15 per group. COMT Catechol O-methyltransferase; D1 Dopa-mine receptor D1; D2 Dopamine receptor D2; DAT Dopamine trans-porter; MAO A Monoamine oxidase A; TH tyrosine hydroxylase; NAc nucleus accumbens; VTA ventral tegmental area; fcHFHS free choice high fat high sugar

4628 European Journal of Nutrition (2021) 60:4621–4633
1 3
sucrose seeking [38]. CB2 receptors participate in the regulation of cytokine release and immune cell function [39], and both CB2 and GPR55 receptors are expressed in
microglia. Up-regulation of their transcripts may under-line NAc inflammatory responses following diet expo-sure; based on similar findings with high-fat diet in mice
Fig. 3 Effects of fcHFHS on endocannabinoid system-related gene expression and endocannabinoid levels in the PFC and the NAc. a In the NAc, fcHFHS increased NAPE transcripts and decreased FAAH, DAGL, and MGL transcripts and 2-AG levels. b In the NAc, palatable food intake-based Km clustering explained the variability observed for CB2 and GPR55 transcripts by revealing an increase in the HSC group. c GPR55 and CB2 transcript levels were correlated in animals from the two groups (graph on the left). CB2 gene expres-sion was also correlated with total sucrose intake consumed through-out the experiment. d In the VTA, transcripts for CB1 and endocan-nabinoid synthesis and degradation enzymes were decreased in the fcHFHS group compared to the chow group. In contrast, fcHFHS was responsible for increased CB2 transcripts. e In the arcuate nucleus,
GPR55 transcripts were decreased in the fcHFHS group compared to the chow group. f Obesity hallmark-based Km clustering revealed a decrease in CB1 transcripts in the OP cluster compared to the OR cluster. White dots represent individual data. * p < .005; ** p < .001; *** p < .0001, n = 3–16 per group. 2-AG 2-Arachidonoyl glycerol; AEA Anandamide; CB1 Cannabinoid receptor type 1, CB2 Cannabi-noid receptor type 2; GPR55 G protein-coupled receptor 55; DAGL Diacylglycerol lipase; FAAH Fatty acid amide hydrolase; MGL Mon-oacylglycerol lipase; NAPE N-acyl phosphatidylethanolamine phos-pholipase D; HFC High Fat Consumers; HSC High Sucrose Consum-ers; LPC Low Palatable Consumers; OP Obesity Prone; OR Obesity Resistant; NAc nucleus accumbens; Arc Arcuate nucleus VTA ventral tegmental area; fcHFHS free choice high fat high sugar

4629European Journal of Nutrition (2021) 60:4621–4633
1 3
[38], we hypothesize that these changes could increase excessive sucrose intake, although mechanisms underly-ing such adaptations are still unknown. CB2 receptors are also expressed on neurons and could, therefore, play a role on the rewarding effects of palatable food through distinct mechanisms. Less is known about the potential role of GPR55 in eating disorders, but a functional polymorphism in its gene may be a risk factor for anorexia nervosa [40] and this receptor has been proposed as a new pharmaceu-tical target to treat obesity and type 2 diabetes [41]. In
addition, direct interaction between CB2 and GPR55 in cancer cells could participate in modulation of receptor signaling [42, 43]; similar signaling modulation of these two receptors as heterodimers may contribute to feeding behavior. In addition, other heterodimerization of recep-tors may participate in the adaptations observed in the control of palatable food intake, as CB1 receptors have been shown to form heteromers with NAc opioid receptors [44, 45] which mediate the hedonic aspects of sweet foods [46]. Further examination of such molecular adaptations
Fig. 4 Effects of fcHFHS on homeostatic system-related gene expres-sion in the reward system and the Arc. a In the VTA, POMC was decreased in the fcHFHS group compared to the chow group. b In the Arc, GR transcripts were decreased in the OP group compared to the chow group. c Obesity hallmark-based Km clustering explained the variability observed for NPY transcripts by revealing an increase in the OP cluster. White dots represent individual data. *p < .005;
**p < .001; ***p < .0001, n = 5—14 per group. AgRP Agouti-related peptide; CART Cocaine and amphetamine regulated transcript; GR Growth hormone secretagogue receptor; LR Leptin receptor; NPY Neuropeptide Y; OP Obesity Prone; OR Obesity Resistant; POMC Proopiomelanocortin; Arc arcuate nucleus; VTA ventral tegmental area; fcHFHS free choice high fat high sugar
Fig. 5 Schematic summary of results. a Endocannabinoid levels and dopamine, endocannabinoid and homeostatic systems-related gene expression changes in the mesocorticolimbic system following the 6-week fcHFHS diet. b Regulation of endocannabinoid or homeo-
static system-related gene expression in the Arc following the fcH-FHS diet. DA dopamine; ECB endocannabinoid; Arc arcuate nucleus; NAc nucleus accumbens; PFC prefrontal cortex; VTA ventral tegmen-tal area
4630 European Journal of Nutrition (2021) 60:4621–4633
1 3
would bring insights into the mechanisms mediating bio-logical changes associated with palatable food intake.
We observed a decrease in 2-AG levels in the NAc of fcH-FHS rats, consistent with the local decrease in DAGL and MGL transcripts. Decreased 2-AG levels have been reported in the limbic forebrain during food consumption [21]. Injec-tions of endocannabinoids in the NAc induced hyperpha-gia, an effect reversed by CB1 receptor antagonism [21, 47]. Genetically modified mice with reduced 2-AG levels in the forebrain showed a decreased fat preference [48]. Moreover, systemic injections of CB1R antagonists decreased palatable food-evoked local DA release [18]. Altogether, this suggests that the decrease in 2-AG levels following the 6-week diet could reflect an endocannabinoid-mediated compensatory mechanism that functions to decrease palatable food-induced hyperphagia and restore “homeostatic” feeding.
In the VTA, we observed an opposite regulation of CB1 (decrease) and CB2 (increase) receptor transcripts in fcH-FHS rats, whereas mRNA coding for the synthesis and deg-radation enzymes for both endocannabinoids were decreased following the diet. CB1 receptors are expressed, primarily, in afferent terminals (excitatory or inhibitory) where they con-tribute to short- and long-term endocannabinoid-mediated synaptic plasticity [16]. Activation of CB1 receptors on axon terminals of GABAergic neurons in the VTA inhibits GABA transmission, leading to an increase in the firing pattern of DA neurons [49]. In this context, cocaine-induced DA release in the NAc is partially due to an endocannabinoid-mediated disinhibitory mechanism of VTA DA neurons [50]. Based on similitudes observed between drugs of abuse and excessive food intake [11], we hypothesize that a similar mechanism could arise for food-induced DA release with reduced DA neuronal activity in the VTA. Increases in AEA and 2-AG tone enhance DA transmission in the NAc through CB1 receptors [19, 51] and 2-AG is synthetized in the VTA after cocaine exposure to suppress GABAergic inhibition of VTA DA neurons [50]. A global decrease in endocan-nabinoids in the VTA following the diet would be consistent with a reduced activity of VTA DA neurons. Altogether, regulation of endocannabinoid-related transcripts in the VTA following the fcHFHS diet could contribute to a DA deficiency syndrome of obesity or reflect a compensatory mechanism to decrease the hedonic value of palatable food and this remains to be investigated at the protein level.
In the Arc, the fcHFHS diet induced a decrease of GPR55 transcripts, in both OP and OR rats, suggesting a compen-satory mechanism to reduce hyperphagia by limiting activ-ity of AgRP/NPY neurons. However, little is known about the role of GPR55 at central synapses. Interestingly, CB1 receptor transcripts were decreased in OP compared to OR rats. A recent neuroanatomical study in mice showed that CB1 receptors are expressed by GABA terminals contacting AgRP/NPY neurons in the Arc [52]. Thus, if the regulated
transcripts reflect a similar regulated level of protein, a decrease in CB1 receptor expression in these GABA ter-minals of OP rats could reduce the GABAergic tone over AgRP/NPY orexigenic neurons, leading to increased firing and hyperphagia. This will need to be further investigated.
In the present study, we confirmed that long-term expo-sure to palatable food resulted in prolonged hyperphagia and an obese phenotype, as previously reported [28]. We observed increased COMT transcripts in the PFC and NAc of fcHFHS rats (Fig. 2a,b), which could result in increased protein expression and activity and, therefore, potentially a higher DA degradation at the synaptic cleft, thus reducing local DA levels. It has been shown that COMT activity can modulate DA in the PFC, with a COMT inhibitor enhanc-ing pharmacologically evoked dopamine release in the PFC without affecting catecholamine basal levels [53]. The same inhibitor also enhanced food-evoked dopamine release in the rat PFC [54]. Such effect could be linked to the DA defi-ciency syndrome and altered reward responsivity observed in obese patients. Nevertheless, given the PFC roles in mul-tiple processes associated with compulsive behaviors (e.g., inhibition, decision making etc.), the contribution of DA in the PFC to palatable food intake likely occurs through multi-ple mechanisms. Also, in addition to an association between body weight and COMT genetic variants [55], subjects with genetic variants in DAT and COMT genes displayed altered activity in several reward-related brain regions during reward anticipation and delivery [56]. In line with previous studies using similar diet [37], we observed decreased D1 transcripts in the NAc of OP rats (Fig. 2c), validating the obesity hallmarks-based clustering. In addition, these data and those showing decreased TH in the VTA are consist-ent with previous reports of increased striatal D1 mRNA in junk-food non-gainers versus junk-food gainers, as well as a decreased TH in the VTA of gainers versus non-gainers [12]. Our results, if correlated with regulation at the protein level, would also be in accordance with decreased D1 receptor protein levels and impaired D1 receptor signaling observed in the NAc of hyperphagic rats, and reduced hedonic food intake following D1 receptor stimulation [57]. In addition, the fcHFHS diet induced an increase of D1, but a decrease in regulation of D2 receptor transcripts, in the VTA. On the other hand, recent studies reported that obesity prone rats exhibit increased DA system sensitivity prior to diet manipu-lation [58, 59]. Thus, the question of whether these differ-ences reflect vulnerability factors or are the consequence of the diet itself remains an open question.
The increased NPY expression in the Arc of OP rats provided further validation of molecular changes in diet-induced obesity paradigms [60–63], suggesting an impor-tant role of this peptide in the pathogenesis of obesity. This up-regulation could lead OP rats to consume more calories, resulting in weight gain. In our conditions, a

4631European Journal of Nutrition (2021) 60:4621–4633
1 3
difference between OP and OR rats in food intake was only observed with standard normocaloric food intake (Sup-plemental Fig. 2a), suggesting the ability to differentiate feeding driven by homeostatic versus hedonic cues using this clustering approach. These findings, therefore, help to strengthen the fcHFHS paradigm as a reliable preclinical model for human diet-induced obesity and metabolic dys-function [27]. Indeed, this preclinical model provided rats with the choice between four different food items with dis-tinct fluidity, texture, form, and nutritive content [28]. All experiments included a control group that only had access to regular chow, allowing us to identify behavioural and biological changes specifically associated with a high-fat and high-sugar diet. This model has been used repeatedly in experimental research, effectively producing overeat-ing, body weight gain, and body fat accumulation in both rats and mice [27]. Despite the limitations of translating preclinical findings to human studies, these models have consistently provided data that are useful in developing and testing hypothesis regarding molecular mechanisms underlying weight disorders [64, 65]. Moreover, and this will be our future goal, analysis of the effects of this fcH-FHS diet in females may provide novel insight into endo-cannabinoid system adaptations following palatable food intake, which may contribute to sex differences in human pathology [66].
Conclusion
Cluster analysis allowed us to distinguish between rodents that gain different amounts of weight and those that consume excessive amounts of sugar or fat. These distinctions helped to decipher subtle molecular adaptations of the endocan-nabinoid system that were specific to sugar or fat, weight gain, or excessive intake of sugar. This analysis, therefore, provided insight into cannabinoid mechanisms of action and how these relate to maladaptive feeding. Current cannabi-noid treatment strategies for obesity include CB1 antagonists to limit depressive side effects observed with inverse ago-nists, such as rimonabant, inhibitors of synthesis enzymes to increase endocannabinoids, and peripheral ligands to limit central cannabinoid-mediated psychologic effects (see [16, 67]). Unfortunately, these strategies have limited utility due to side effects or minimal effects on eating. Our results high-lighted CB2 as a regulated gene following an obesogenic diet, in link with the level of sugar consumption. Future studies should explore the implications of this receptor at the neuronal and glial levels, examine the effect of selective CB2 compounds to minimize neuronal changes or neuro-inflammatory states and propose novel strategies to refine treatments for obesity.
Supplementary Information The online version contains supplemen-tary material available at https:// doi. org/ 10. 1007/ s00394- 021- 02613-0.
Acknowledgements This project was supported by the Université de Strasbourg, the Centre National de la Recherche Scientifique (CNRS), by the Programme International de Cooperation Scientifique (PICS CNRS), and by the Natural Sciences and Engineering Research Council of Canada (NSERC). RB received a postdoctoral fellowship from the Fondation pour la Recherche Médicale (FRM). We thank datanovia.com for data analysis resources. The authors declare no conflict of interest.
Authors contribution RB, MCO, KB conceived the study and wrote the paper. RB, AH, DF, VC, KB performed the experiments. RB, DF, AH, KB analyzed the data and designed the figures. YG, VC contributed to the design and analysis of the mass spectrometry experiment. JM contributed to the design of the regimen and the discussion of the data. All authors approved the final version of the manuscript.
Data availability statement All the data supporting the findings of this study can be provided upon request from the corresponding author.
Declarations
Conflict of interest The authors have no competing financial interests in relation to the work described.
References
1. Guh DP, Zhang W, Bansback N, Amarsi Z, Birmingham CL, Anis AH (2009) The incidence of co-morbidities related to obesity and overweight: a systematic review and meta-analysis. BMC Public Health 9:88. https:// doi. org/ 10. 1186/ 1471- 2458-9- 88
2. Clement K, Coupaye M, Laville M, Oppert JM, Ziegler O (2020) COVID-19: a lever for the recognition of obesity as a disease? The french experience. Obesity (Silver Spring) 28:1584–1585. https:// doi. org/ 10. 1002/ oby. 22924
3. Hill JO, Peters JC (1998) Environmental contributions to the obe-sity epidemic. Science 280:1371–1374. https:// doi. org/ 10. 1126/ scien ce. 280. 5368. 1371
4. Fletcher PC, Kenny PJ (2018) Food addiction: a valid concept? Neuropsychopharmacology 43:2506–2513. https:// doi. org/ 10. 1038/ s41386- 018- 0203-9
5. Ferrario CR, Labouebe G, Liu S, Nieh EH, Routh VH, Xu S et al (2016) Homeostasis meets motivation in the battle to control food intake. J Neurosci 36:11469–11481. https:// doi. org/ 10. 1523/ JNEUR OSCI. 2338- 16. 2016
6. Morton GJ, Meek TH, Schwartz MW (2014) Neurobiology of food intake in health and disease. Nat Rev Neurosci 15:367–378. https:// doi. org/ 10. 1038/ nrn37 45
7. Geiger BM, Haburcak M, Avena NM, Moyer MC, Hoebel BG, Pothos EN (2009) Deficits of mesolimbic dopamine neurotrans-mission in rat dietary obesity. Neuroscience 159:1193–1199. https:// doi. org/ 10. 1016/j. neuro scien ce. 2009. 02. 007
8. Hoebel BG, Hernandez L, Schwartz DH, Mark GP, Hunter GA (1989) Microdialysis studies of brain norepinephrine, serotonin, and dopamine release during ingestive behavior. Theoretical and clinical implications. Ann N Y Acad Sci 575:171–191. https:// doi. org/ 10. 1111/j. 1749- 6632. 1989. tb532 42.x
9. Lutter M, Nestler EJ (2009) Homeostatic and hedonic signals interact in the regulation of food intake. J Nutr 139:629–632. https:// doi. org/ 10. 3945/ jn. 108. 097618
4632 European Journal of Nutrition (2021) 60:4621–4633
1 3
10. Garcia-Garcia I, Jurado MA, Garolera M, Segura B, Marques-Iturria I, Pueyo R et al (2013) Functional connectivity in obesity during reward processing. Neuroimage 66:232–239. https:// doi. org/ 10. 1016/j. neuro image. 2012. 10. 035
11. Volkow ND, Wise RA, Baler R (2017) The dopamine motive sys-tem: implications for drug and food addiction. Nat Rev Neurosci 18:741–752. https:// doi. org/ 10. 1038/ nrn. 2017. 130
12. Robinson MJ, Burghardt PR, Patterson CM, Nobile CW, Akil H, Watson SJ et al (2015) Individual differences in cue-induced motivation and striatal systems in rats susceptible to diet-induced obesity. Neuropsychopharmacology 40:2113–2123. https:// doi. org/ 10. 1038/ npp. 2015. 71
13. Small DM (2009) Individual differences in the neurophysiology of reward and the obesity epidemic. Int J Obes (Lond) 33(Suppl 2):S44–S48. https:// doi. org/ 10. 1038/ ijo. 2009. 71
14. Johnson PM, Kenny PJ (2010) Dopamine D2 receptors in addic-tion-like reward dysfunction and compulsive eating in obese rats. Nat Neurosci 13:635–641. https:// doi. org/ 10. 1038/ nn. 2519
15. Vucetic Z, Carlin JL, Totoki K, Reyes TM (2012) Epigenetic dysregulation of the dopamine system in diet-induced obesity. J Neurochem 120:891–898. https:// doi. org/ 10. 1111/j. 1471- 4159. 2012. 07649.x
16. Lau BK, Cota D, Cristino L, Borgland SL (2017) Endocannabi-noid modulation of homeostatic and non-homeostatic feeding cir-cuits. Neuropharmacology 124:38–51. https:// doi. org/ 10. 1016/j. neuro pharm. 2017. 05. 033
17. Di Marzo V, Ligresti A, Cristino L (2009) The endocannabinoid system as a link between homoeostatic and hedonic pathways involved in energy balance regulation. Int J Obes (Lond) 33(Suppl 2):S18-24. https:// doi. org/ 10. 1038/ ijo. 2009. 67
18. Melis T, Succu S, Sanna F, Boi A, Argiolas A, Melis MR (2007) The cannabinoid antagonist SR 141716A (Rimonabant) reduces the increase of extra-cellular dopamine release in the rat nucleus accumbens induced by a novel high palatable food. Neurosci Lett 419:231–235. https:// doi. org/ 10. 1016/j. neulet. 2007. 04. 012
19. Solinas M, Justinova Z, Goldberg SR, Tanda G (2006) Ananda-mide administration alone and after inhibition of fatty acid amide hydrolase (FAAH) increases dopamine levels in the nucleus accumbens shell in rats. J Neurochem 98:408–419. https:// doi. org/ 10. 1111/j. 1471- 4159. 2006. 03880.x
20. Mahler SV, Smith KS, Berridge KC (2007) Endocannabinoid hedonic hotspot for sensory pleasure: anandamide in nucleus accumbens shell enhances “liking” of a sweet reward. Neuropsy-chopharmacology 32:2267–2278. https:// doi. org/ 10. 1038/ sj. npp. 13013 76
21. Kirkham TC, Williams CM, Fezza F, Di Marzo V (2002) Endo-cannabinoid levels in rat limbic forebrain and hypothalamus in relation to fasting, feeding and satiation: stimulation of eating by 2-arachidonoyl glycerol. Br J Pharmacol 136:550–557. https:// doi. org/ 10. 1038/ sj. bjp. 07047 67
22. Jamshidi N, Taylor DA (2001) Anandamide administration into the ventromedial hypothalamus stimulates appetite in rats. Br J Pharmacol 134:1151–1154. https:// doi. org/ 10. 1038/ sj. bjp. 07043 79
23. Parsons LH, Hurd YL (2015) Endocannabinoid signalling in reward and addiction. Nat Rev Neurosci 16:579–594. https:// doi. org/ 10. 1038/ nrn40 04
24. Di Marzo V, Goparaju SK, Wang L, Liu J, Batkai S, Jarai Z et al (2001) Leptin-regulated endocannabinoids are involved in main-taining food intake. Nature 410:822–825. https:// doi. org/ 10. 1038/ 35071 088
25. Matias I, Di Marzo V (2006) Endocannabinoid system and its role in energy regulation. Expert Rev Endocrinol Metab 1:557–569. https:// doi. org/ 10. 1586/ 17446 651.1. 4. 557
26. Mazier W, Saucisse N, Gatta-Cherifi B, Cota D (2015) The endo-cannabinoid system: pivotal orchestrator of obesity and metabolic
disease. Trends Endocrinol Metab 26:524–537. https:// doi. org/ 10. 1016/j. tem. 2015. 07. 007
27. Slomp M, Belegri E, Blancas-Velazquez AS, Diepenbroek C, Eggels L, Gumbs MCR et al (2019) Stressing the importance of choice: Validity of a preclinical free-choice high-caloric diet para-digm to model behavioural, physiological and molecular adapta-tions during human diet-induced obesity and metabolic dysfunc-tion. J Neuroendocrinol 31:e12718. https:// doi. org/ 10. 1111/ jne. 12718
28. la Fleur SE, Luijendijk MC, van der Zwaal EM, Brans MA, Adan RA (2014) The snacking rat as model of human obesity: effects of a free-choice high-fat high-sugar diet on meal patterns. Int J Obes (Lond) 38:643–649. https:// doi. org/ 10. 1038/ ijo. 2013. 159
29. la Fleur SE, Vanderschuren LJ, Luijendijk MC, Kloeze BM, Ties-jema B, Adan RA (2007) A reciprocal interaction between food-motivated behavior and diet-induced obesity. Int J Obes (Lond) 31:1286–1294. https:// doi. org/ 10. 1038/ sj. ijo. 08035 70
30. Pickering C, Alsio J, Hulting AL, Schioth HB (2009) Withdrawal from free-choice high-fat high-sugar diet induces craving only in obesity-prone animals. Psychopharmacology 204:431–443. https:// doi. org/ 10. 1007/ s00213- 009- 1474-y
31. Spector AC, Smith JC (1984) A detailed analysis of sucrose drink-ing in the rat. Physiol Behav 33:127–136. https:// doi. org/ 10. 1016/ 0031- 9384(84) 90023-4
32. Paxinos G, Watson C (2007) The rat brain in stereotaxic coordi-nates. Academic Press, London
33. De Sa Nogueira D, Bourdy R, Filliol D, Awad G, Andry V, Gou-mon Y et al (2021) Binge sucrose-induced neuroadaptations: A focus on the endocannabinoid system. Appetite. https:// doi. org/ 10. 1016/j. appet. 2021. 105258
34. Li B, Matter EK, Hoppert HT, Grayson BE, Seeley RJ, Sandoval DA (2014) Identification of optimal reference genes for RT-qPCR in the rat hypothalamus and intestine for the study of obesity. Int J Obes (Lond) 38:192–197. https:// doi. org/ 10. 1038/ ijo. 2013. 86
35. Silberberg G, Baruch K, Navon R (2009) Detection of stable refer-ence genes for real-time PCR analysis in schizophrenia and bipo-lar disorder. Anal Biochem 391:91–97. https:// doi. org/ 10. 1016/j. ab. 2009. 05. 026
36. Livak KJ, Schmittgen TD (2001) Analysis of relative gene expres-sion data using real-time quantitative PCR and the 2(-Delta Delta C(T)) Method. Methods 25:402–408. https:// doi. org/ 10. 1006/ meth. 2001. 1262
37. Alsio J, Olszewski PK, Norback AH, Gunnarsson ZE, Levine AS, Pickering C et al (2010) Dopamine D1 receptor gene expression decreases in the nucleus accumbens upon long-term exposure to palatable food and differs depending on diet-induced obesity phenotype in rats. Neuroscience 171:779–787. https:// doi. org/ 10. 1016/j. neuro scien ce. 2010. 09. 046
38. Decarie-Spain L, Sharma S, Hryhorczuk C, Issa-Garcia V, Barker PA, Arbour N et al (2018) Nucleus accumbens inflammation mediates anxiodepressive behavior and compulsive sucrose seek-ing elicited by saturated dietary fat. Mol Metab 10:1–13. https:// doi. org/ 10. 1016/j. molmet. 2018. 01. 018
39. Pertwee RG (2006) The pharmacology of cannabinoid receptors and their ligands: an overview. Int J Obes 30:S13–S18. https:// doi. org/ 10. 1038/ sj. ijo. 08032 72
40. Ishiguro H, Onaivi ES, Horiuchi Y, Imai K, Komaki G, Ishikawa T et al (2011) Functional polymorphism in the GPR55 gene is associated with anorexia nervosa. Synapse 65:103–108. https:// doi. org/ 10. 1002/ syn. 20821
41. Tuduri E, Imbernon M, Hernandez-Bautista RJ, Tojo M, Ferno J, Dieguez C et al (2017) GPR55: a new promising target for metabolism? J Mol Endocrinol 58:R191–R202. https:// doi. org/ 10. 1530/ JME- 16- 0253
42. Balenga NA, Martínez-Pinilla E, Kargl J, Schröder R, Pein-haupt M, Platzer W et al (2014) Heteromerization of GPR55 and

4633European Journal of Nutrition (2021) 60:4621–4633
1 3
cannabinoid CB <sub>2</sub> receptors modulates signalling. Br J Pharmacol 171:5387–5406. https:// doi. org/ 10. 1111/ bph. 12850
43. Moreno E, Andradas C, Medrano M, Caffarel MM, Perez-Gomez E, Blasco-Benito S et al (2014) Targeting CB2-GPR55 recep-tor heteromers modulates cancer cell signaling. J Biol Chem 289:21960–21972. https:// doi. org/ 10. 1074/ jbc. M114. 561761
44. Rios C, Gomes I, Devi LA (2006) mu opioid and CB1 cannabinoid receptor interactions: reciprocal inhibition of receptor signaling and neuritogenesis. Br J Pharmacol 148:387–395. https:// doi. org/ 10. 1038/ sj. bjp. 07067 57
45. Rodriguez JJ, Mackie K, Pickel VM (2001) Ultrastructural locali-zation of the CB1 cannabinoid receptor in mu-opioid receptor patches of the rat Caudate putamen nucleus. J Neurosci: Offi J Soc Neurosci 21:823–833. https:// doi. org/ 10. 1523/ JNEUR OSCI. 21- 03- 00823. 2001
46. Pecina S, Berridge KC (2005) Hedonic hot spot in nucleus accum-bens shell: where do mu-opioids cause increased hedonic impact of sweetness? J Neurosci 25:11777–11786. https:// doi. org/ 10. 1523/ JNEUR OSCI. 2329- 05. 2005
47. Soria-Gomez E, Matias I, Rueda-Orozco PE, Cisneros M, Pet-rosino S, Navarro L et al (2007) Pharmacological enhancement of the endocannabinoid system in the nucleus accumbens shell stimulates food intake and increases c-Fos expression in the hypothalamus. Br J Pharmacol 151:1109–1116. https:// doi. org/ 10. 1038/ sj. bjp. 07073 13
48. Wei D, Lee D, Li D, Daglian J, Jung KM, Piomelli D (2016) A role for the endocannabinoid 2-arachidonoyl-sn-glycerol for social and high-fat food reward in male mice. Psychopharmacol-ogy 233:1911–1919. https:// doi. org/ 10. 1007/ s00213- 016- 4222-0
49. Lupica CR, Riegel AC, Hoffman AF (2004) Marijuana and can-nabinoid regulation of brain reward circuits. Br J Pharmacol 143:227–234. https:// doi. org/ 10. 1038/ sj. bjp. 07059 31
50. Wang H, Treadway T, Covey DP, Cheer JF, Lupica CR (2015) Cocaine-induced endocannabinoid mobilization in the ventral teg-mental area. Cell Rep 12:1997–2008. https:// doi. org/ 10. 1016/j. celrep. 2015. 08. 041
51. De Luca MA, Valentini V, Bimpisidis Z, Cacciapaglia F, Caboni P, Di Chiara G (2014) Endocannabinoid 2-arachidonoylglycerol self-administration by sprague-dawley rats and stimulation of in vivo dopamine transmission in the nucleus accumbens shell. Front Psychiatry 5:140. https:// doi. org/ 10. 3389/ fpsyt. 2014. 00140
52. Morozov YM, Koch M, Rakic P, Horvath TL (2017) Cannabinoid type 1 receptor-containing axons innervate NPY/AgRP neurons in the mouse arcuate nucleus. Mol Metab 6:374–381. https:// doi. org/ 10. 1016/j. molmet. 2017. 01. 004
53. Tunbridge EM, Bannerman DM, Sharp T, Harrison PJ (2004) Catechol-o-methyltransferase inhibition improves set-shifting performance and elevates stimulated dopamine release in the rat prefrontal cortex. J Neurosci 24:5331–5335. https:// doi. org/ 10. 1523/ JNEUR OSCI. 1124- 04. 2004
54. Lapish CC, Ahn S, Evangelista LM, So K, Seamans JK, Phillips AG (2009) Tolcapone enhances food-evoked dopamine efflux and executive memory processes mediated by the rat prefrontal cor-tex. Psychopharmacology 202:521–530. https:// doi. org/ 10. 1007/ s00213- 008- 1342-1
55. Annerbrink K, Westberg L, Nilsson S, Rosmond R, Holm G, Eriksson E (2008) Catechol O-methyltransferase val158-met poly-morphism is associated with abdominal obesity and blood pres-sure in men. Metabolism 57:708–711. https:// doi. org/ 10. 1016/j. metab ol. 2008. 01. 012
56. Dreher JC, Kohn P, Kolachana B, Weinberger DR, Berman KF (2009) Variation in dopamine genes influences responsivity of the human reward system. Proc Natl Acad Sci U S A 106:617–622. https:// doi. org/ 10. 1073/ pnas. 08055 17106
57. Durst M, Konczol K, Balazsa T, Eyre MD, Toth ZE (2019) Reward-representing D1-type neurons in the medial shell of the accumbens nucleus regulate palatable food intake. Int J Obes (Lond) 43:917–927. https:// doi. org/ 10. 1038/ s41366- 018- 0133-y
58. Oginsky MF, Maust JD, Corthell JT, Ferrario CR (2016) Enhanced cocaine-induced locomotor sensitization and intrinsic excitability of NAc medium spiny neurons in adult but not in ado-lescent rats susceptible to diet-induced obesity. Psychopharmacol-ogy 233:773–784. https:// doi. org/ 10. 1007/ s00213- 015- 4157-x
59. Vollbrecht PJ, Mabrouk OS, Nelson AD, Kennedy RT, Ferrario CR (2016) Pre-existing differences and diet-induced alterations in striatal dopamine systems of obesity-prone rats. Obesity (Silver Spring) 24:670–677. https:// doi. org/ 10. 1002/ oby. 21411
60. Cifani C, Micioni Di Bonaventura MV, Pucci M, Giusepponi ME, Romano A, Di Francesco A et al (2015) Regulation of hypo-thalamic neuropeptides gene expression in diet induced obesity resistant rats: possible targets for obesity prediction? Front Neu-rosci 9:187. https:// doi. org/ 10. 3389/ fnins. 2015. 00187
61. la Fleur SE, van Rozen AJ, Luijendijk MC, Groeneweg F, Adan RA (2010) A free-choice high-fat high-sugar diet induces changes in arcuate neuropeptide expression that support hyperphagia. Int J Obes (Lond) 34:537–546. https:// doi. org/ 10. 1038/ ijo. 2009. 257
62. Levin BE (1999) Arcuate NPY neurons and energy homeostasis in diet-induced obese and resistant rats. Am J Physiol 276:R382–R387. https:// doi. org/ 10. 1152/ ajpre gu. 1999. 276.2. R382
63. Wang C, Yang N, Wu S, Liu L, Sun X, Nie S (2007) Difference of NPY and its receptor gene expressions between obesity and obesity-resistant rats in response to high-fat diet. Horm Metab Res 39:262–267. https:// doi. org/ 10. 1055/s- 2007- 973073
64. Kleinert M, Clemmensen C, Hofmann SM, Moore MC, Renner S, Woods SC et al (2018) Animal models of obesity and diabe-tes mellitus. Nat Rev Endocrinol 14:140–162. https:// doi. org/ 10. 1038/ nrendo. 2017. 161
65. Lutz TA (2018) Considering our methods: Methodological issues with rodent models of appetite and obesity research. Physiol Behav 192:182–187. https:// doi. org/ 10. 1016/j. physb eh. 2018. 02. 026
66. Bulik C, Yilmaz Z, HArdaway A (2015) Genetics and epigenetics of eating disorders. Adv Genom Genet 5:131. https:// doi. org/ 10. 2147/ AGG. S55776
67. Murphy T, Le Foll B (2020) Targeting the endocannabinoid CB1 receptor to treat body weight disorders: a preclinical and clinical review of the therapeutic potential of past and present CB1 drugs. Biomolecules. https:// doi. org/ 10. 3390/ biom1 00608 55