the environmental implementation review 2019
TRANSCRIPT

Environment
The Environmental Implementation Review 2019
COUNTRY REPORT SWEDEN
SWEDEN
© g
etty
imag
es, B
rzoz
owsk
a

EN EN
EUROPEAN COMMISSION
Brussels, 4.4.2019
SWD(2019) 117 final
COMMISSION STAFF WORKING DOCUMENT
The EU Environmental Implementation Review 2019
Country Report - SWEDEN
Accompanying the document
Communication from the Commission to the European Parliament, the Council, the
European Economic and Social Committee and the Committee of the Regions
The EU Environmental Implementation Review 2019:
A Europe that protects its citizens and enhances their quality of life
{COM(2019) 149 final} - {SWD(2019) 111 final} - {SWD(2019) 112 final} -
{SWD(2019) 113 final} - {SWD(2019) 114 final} - {SWD(2019) 115 final} -
{SWD(2019) 116 final} - {SWD(2019) 118 final} - {SWD(2019) 119 final} -
{SWD(2019) 120 final} - {SWD(2019) 121 final} - {SWD(2019) 122 final} -
{SWD(2019) 123 final} - {SWD(2019) 124 final} - {SWD(2019) 125 final} -
{SWD(2019) 126 final} - {SWD(2019) 127 final} - {SWD(2019) 128 final} -
{SWD(2019) 129 final} - {SWD(2019) 130 final} - {SWD(2019) 131 final} -
{SWD(2019) 132 final} - {SWD(2019) 133 final} - {SWD(2019) 134 final} -
{SWD(2019) 135 final} - {SWD(2019) 136 final} - {SWD(2019) 137 final} -
{SWD(2019) 138 final} - {SWD(2019) 139 final}

1
This report has been written by the staff of the Directorate-General for Environment, European Commission. Comments are welcome, please send them to [email protected]
More information on the European Union is available at http://europa.eu.
Photographs: p. 11 — ©gettyimages/Mats Lindberg; p. 12 — ©gettyimages/RainbowJoe; p. 21 — ©iStock/anderm; p. 27 — ©iStock/Birgittas; p. 30 — ©iStock/RudyBalasko
For reproduction or use of these photos, permission must be sought directly from the copyright holder.
©European Union, 2019
Reproduction is authorised provided the source is acknowledged

2
Table of Contents
EXECUTIVE SUMMARY ................................................................................................................................... 3
PART I: THEMATIC AREAS .............................................................................................................................. 4
1. TURNING THE EU INTO A CIRCULAR, RESOURCE-EFFICIENT, GREEN AND COMPETITIVE LOW-CARBON ECONOMY .............................................................................................................................. 4
Measures towards a circular economy ................................................................................................. 4
Waste management .............................................................................................................................. 6
Climate change ...................................................................................................................................... 8
2. PROTECTING, CONSERVING AND ENHANCING NATURAL CAPITAL .................................................. 10
Nature and biodiversity ....................................................................................................................... 10
Maintaining and restoring ecosystems and their services .................................................................. 11
Estimating natural capital ................................................................................................................... 12
Invasive alien species .......................................................................................................................... 13
Soil protection ..................................................................................................................................... 13
Marine protection ............................................................................................................................... 14
3. ENSURING CITIZENS’ HEALTH AND QUALITY OF LIFE ........................................................................ 16
Air quality ............................................................................................................................................ 16
Industrial emissions ............................................................................................................................. 17
Noise ................................................................................................................................................. 18
Water quality and management ......................................................................................................... 18
Chemicals ............................................................................................................................................ 20
Making cities more sustainable ........................................................................................................... 21
PART II: ENABLING FRAMEWORK: IMPLEMENTATION TOOLS ................................................................... 24
4. GREEN TAXATION, GREEN PUBLIC PROCUREMENT, ENVIRONMENTAL FUNDING AND INVESTMENTS ..................................................................................................................................... 24
Green taxation and environmentally harmful subsidies ..................................................................... 24
Green public procurement .................................................................................................................. 25
Environmental funding and investments ............................................................................................ 26
5. STRENGTHENING ENVIRONMENTAL GOVERNANCE ......................................................................... 29
Information, public participation and access to justice ...................................................................... 29
Compliance assurance ......................................................................................................................... 30
Effectiveness of environmental administrations................................................................................. 32
International agreements ................................................................................................................... 33
Sustainable development and the implementation of the UN SDGs .................................................. 34

Environmental Implementation Review 2019 – Sweden
3
Executive summary
Sweden and the Environmental Implementation Review (EIR)
In the 2017 EIR, the main challenges identified with regard to implementation of EU environmental policy and law in Sweden were:
improving the status of habitats, in particular grassland, all types of which have an unfavourable conservation status;
improving the quality of the monitoring programme for Sweden’s marine waters;
reducing emissions of air pollutants.
Sweden has not yet organised an EIR national dialogue to address these challenges.
However, the Swedish environmental authorities participated in a peer-to-peer workshop on reducing air pollution in zones or agglomerations where the levels of pollutants in ambient air exceed limit or target values. In addition, the city of Växjö participated in a peer-to-peer workshop in Ireland.
Progress on meeting challenges since the 2017 EIR
The 2019 EIR shows that the standard of environmental policy implementation in Sweden remains high.
Nevertheless, the conservation status of all grassland habitats and many of their associated species is still unfavourable, although the use of agri-environmental schemes to support the conservation of grasslands seems to be yielding results. The conservation status of many forest types also remains inadequate and many forest species are threatened. The rate of biodiversity loss has not been reduced over the past 15 years, with agriculture, natural systems modification, forestry and natural biotic/abiotic processes as the most frequently reported pressures.
One priority action related to the marine environment is ensuring that the effects and effectiveness of measures aiming to achieve a good environmental status are monitored through Sweden’s monitoring programme.
For air quality, the emission of several air pollutants has decreased significantly in Sweden. There has been a reduction in the emissions of fine particulate matter. Despite this progress, however, additional efforts are needed to reach the emission reduction commitments made for the 2020-2029 period and for the years after 2030.
The 2019 EIR suggests that the tax system can be used for environmental policy while also generating revenue: further alignment and equal treatment of transport fuels
(e.g. diesel) would lead to environmental improvements and incentives to reduce nitrogen dioxide pollution.
Sweden’s performance with regard to eco-innovation is outstanding. The country has a highly developed innovation ecosystem, which forms the foundation for a successful cleantech-specific start-up sphere. Sweden’s eco-innovation is highly incentivised by government policy and benefits from the large number of domestic cleantech investors, relative to GDP.
Examples of good practice
Swedish municipalities are generally involved in EU initiatives related to environmental protection and climate change. Växjö is the first Swedish city to win the European Green Leaf title. It regards itself as a role model for environmental action in Sweden. It was the first Swedish city to use biomass for district heating and one of the first to start working on the UN 2030 Agenda for Sustainable Development. It also committed to being climate fossil fuel free over 20 years ago.
The use of alternative fuels in new passenger cars sold in Sweden has considerably increased over the past few years. The share of new passenger cars using alternative fuels in 2016 was twice that in 2013. In public transport, the use of alternative fuels is also encouraged, though the most common alternative fuel is biodiesel. Sweden is one of the few EU countries with more than 5 % of new cars using alternative fuels.

Environmental Implementation Review 2019 – Sweden
4
Part I: Thematic areas
1. Turning the EU into a circular, resource-efficient, green and competitive low-carbon economy
Measures towards a circular economy
The Circular Economy Action Plan emphasises the need to move towards a life-cycle-driven ‘circular’ economy, reusing resources as much as possible and bringing residual waste close to zero. This can be facilitated by developing and providing access to innovative financial instruments and funding for eco-innovation.
Following the adoption of the Circular Economy Action Plan in 2015 and the setting up of a related stakeholder platform in 2017, the European Commission adopted a new package of deliverables in January 2018
1. This
included additional initiatives such as: (i) an EU strategy for plastics; (ii) a Communication on how to address the interplay between chemical, product and waste legislation; (iii) a report on critical raw materials; and (iv) a framework to monitor progress towards a circular economy
2.
The circular (secondary) use of material in Sweden was 7.1 % in 2016 (below the EU-28 average of 11.7 %. Sweden ranks below the EU-28 average in terms of the number of people employed in the circular economy (1.56 % of total employment in 2016, whereas the EU-28 average is 1.73 %).
In the 2017 Special Eurobarometer3 on attitudes of EU
citizens towards the environment, 94 % of Swedish citizens said they were concerned about the effects of plastic products on the environment (EU-28 average is 87 %). 92 % said they were worried about the impact of chemicals (EU-28 average 90 %). There appears to be very strong support for circular economy initiatives and environmental protection actions in Swedish society.
As shown in Figure 1, Sweden’s level of resource productivity
4 (how efficiently the economy uses material
resources to produce wealth) is below the EU average, at 1.87 EUR/kg in 2017 (the EU-28 average is 2.04 EUR/kg)
5.
This is largely due to the structure of the Swedish economy and its large primary sector.
1 European Commission, 2018 Circular Economy Package. 2 COM(2018) 029. 3 European Commission, 2017, Special 468 Eurobarometer, ‘Attitudes of European citizens towards the environment’. 4 Resource productivity is defined as the ratio between gross domestic product (GDP) and domestic material consumption (DMC). 5 Eurostat, Resource productivity.
Figure 1: Resource productivity 2010-20176
An example of Sweden’s approach is the Sweden-India Innovation Partnership for a Sustainable Future, signed by Sweden and India’s Prime Minister Narendra Modi in April 2018 and holding the circular economy high among its priorities. This is in line with what the Commission advocates in international fora, linking the circular economy to the implementation of the 2030 UN Agenda.
According to the agreement, Sweden and India will work together to develop and implement joint innovation projects. Indian and Swedish businesses and other key innovation players are set to work together to find solutions to common challenges in several strategic areas, including the circular economy.
The Swedish Government advocated for an even more ambitious EU Strategy for Plastics, and asked for a complete ban on intentionally used microplastics in the EU. Sweden is currently planning to adopt a national ban.
In 2016, the Swedish Government examined policy instruments that prevent waste and promote a circular economy via an inquiry. The report that summarised the main findings of the exercise indicated a lack of clearly stated goals and ambitions as well as of a strategic context that would make it possible for policy makers to support the circular transition in Sweden. The Swedish Government has set up a task force dealing with circular economy.
Swedish civil society is getting more and more engaged in the circular transition. For example, the Royal Swedish
6 Eurostat, Resource productivity.

Environmental Implementation Review 2019 – Sweden
5
Academy of Engineering Sciences (IVA) — composed of decision-makers and experts from business, industry, academia and public administration — is gathering best practices on resource efficiency and the circular economy in Sweden to help trigger change at the ground level.
The number of EU Ecolabel products and EMAS-licensed organisations (EMAS is the European Commission’s Eco-Management and Audit Scheme – a programme to encourage organisations to behave in a more environmentally sustainable way) in a specific country can give a rough measurement of the circular economy transition. These two indicators show to what extent this transition is engaging the private sector and other national stakeholders. These two indicators also show the commitment of public authorities to policies that support the circular economy. As of September 2018, Sweden had 3 400 products and 39 licences registered in the EU Ecolabel scheme, out of a total of 71 707 in the EU covered by 2 167 licences, showing a high take-up of these licences
7. Moreover, 17 organisations from Sweden
are currently registered in EMAS8, the European
Commission's Eco-Management and Audit Scheme.
SMEs and resource efficiency
Swedish SMEs continue to be in line with average EU performance in the environmental aspects of the Small Business Act
10, as shown in Figure 2. The proportion of
Swedish SMEs that recently put in place resource efficiency measures is below the EU average, however.
The extent to which companies taking resource efficiency measures benefit from public support is higher in Sweden that in the EU on average. The percentage of SMEs that offer green products or services is significantly higher than the EU average. Sweden was already a strong performer in terms of environmental policies and support measures — which explains the moderate policy developments of recent years.
A new project called ‘Resource effectiveness and the circular economy’ aims to create a common platform and draw conclusions about Sweden’s future policies in the sector.
The latest Eurobarometer on ‘SMEs, resource efficiency and green markets’
9 asked companies about both recent
resource-efficiency actions they had taken and additional resource-efficiency actions they planned to take in the
7 European Commission, Ecolabel Facts and Figures. 8 As of May 2018. European Commission, Eco-Management and Audit Scheme. 9 Flash Eurobarometer 456 ‘SME, resource efficiency and green markets’ January 2018. The 8 dimensions were Save energy; Minimise waste; Save materials; Save Water; Recycle by reusing material internally; Design products easier to maintain, repair or reuse; Use renewable energy; Sell scrap materials to another company.
next 2 years. The Eurobarometer compared these responses with responses given to the same questions in 2015. While overall plans are in line with the EU average, Swedish companies show a decline in the intention to invest in the more established resource efficiency measures (saving water, energy, materials) and an increase in more recent developments (e.g. renewable energy use).
Figure 2: Environmental performance of SMEs10
Only 17 % of Swedish companies rely on external support in their efforts to be more resource efficient, compared to 22 % in the EU on average (based on a range of 3 %-38 %). Private sector consultancy gained in importance (+16 % to 39 %) whereas public sector advice (-23 % to 20 %) and advice from business associations (-15 % to 34 %) declined significantly compared to 2015.
Among Swedish companies, 29 % find grants and subsidies useful; consultancy on resource efficiency is considered of similar importance (30 %), and more important than assistance to networking, self-assessment and technology demonstration (23-25 %).
Swedish SMEs need to maintain their level of investment in resource efficiency. The many frontrunners that produce green products and services, in combination with the open cooperation culture, could make it possible to innovate along value chains and gain strategic advantage in the circular economy.
10 European Commission, 2018 SBA fact sheet - Sweden, p.14.

Environmental Implementation Review 2019 – Sweden
6
In this context, it could be interesting to investigate why SMEs’ perception of the importance of public and business associations’ consulting services related to resource efficiency is in a steep decline.
Eco-innovation
Sweden ranked 1st on the 2018 European Innovation Scoreboard, with a 5.5 percentage point increase since 2010
11. With a total score of 144, Sweden was also a
leader on the 2017 Eco-innovation index, up from 5th place in 2015.
Figure 3: 2017 Eco-innovation index (EU=100)12
Sweden has historically performed well on this index, having been among the top five every year since 2010 and scoring 1st in 2013 and in 2017.
The 2017 Global Cleantech Innovation Index report states that Sweden shows evidence of a highly developed innovation ecosystem, which forms the foundation of a successful cleantech-specific start-up sphere.
Sweden’s cleantech innovation is highly incentivised by government policy, and benefits from the large number of domestic cleantech investors, relative to GDP. One example is Swedish Cleantech, a business-to-business platform for Swedish companies aiming to contribute to the development, commercialisation and export of Swedish environmental technology.
The Swedish government agency that administers state funding for research and development (Vinnova) is in charge of the national coordinating mechanism, Testbed Sweden. Vinnova also finances different testbed projects
11 European Commission, European Innovation Scoreboard 2018, p. 15. 12 Eco-innovation Observatory: Eco-Innovation scoreboard 2017.
and one of their first initiatives related to demonstration and test environments was the ‘environmental technology testbeds programme’. Another Vinnova initiative is ‘challenge-driven innovation’, a programme that aims to solve social challenges that require broad cooperation.
Figure 4: Sweden’s eco-innovation performance
The National Innovation Council has contributed to the five innovation partnership programmes aiming to find innovative solutions to today’s societal challenges as well as strengthening Sweden’s competitiveness. There is a clear focus on eco-innovation and the circular economy in these partnership programmes and they will likely have a positive effect on Sweden’s capacities in these areas.
The Swedish Government presented a re-industrialisation strategy for the industry, called ‘smart industry’. The strategy has four focus areas, of which one is sustainable production.
Additionally, the Swedish Government launched a support initiative for Swedish industry, called ‘The Industrial Leap’. In total, SEK 300 million per year is to be invested between 2018 and 2040 to support Swedish industry in the shift towards zero emissions of greenhouse gases
13.
Waste management
Turning waste into a resource is supported by: (i) fully implementing EU waste legislation, which includes the waste hierarchy, the need to ensure separate collection of waste, the landfill diversion targets, etc.; (ii) reducing waste generation and waste generation per capita in absolute terms; and (iii) limiting energy recovery to non-recyclable materials and phasing out landfilling of recyclable or recoverable waste.
13 European Commission, Eco-Innovation Observatory, Country profile 2016-2017: Sweden.

Environmental Implementation Review 2019 – Sweden
7
This section focuses on management of municipal waste
14 for which EU law sets mandatory recycling
targets15
.
After a drop in 2013, municipal waste generation in Sweden increased slightly again in 2017 to 452 kg/y/inhabitant), but remains below the EU average (487 kg/y/inhabitant)
16.
Figure 5 shows Sweden’s municipal waste by treatment in terms of kg per capita. Incineration accounts for 52 % and landfilling for only 1 %.
Figure 5: Municipal waste by treatment in Sweden 2010-2017
17
Figure 6 shows that Sweden was close to reach the EU 2020 recycling rate target of 50 % in 2017 (47 %). There has been some minor downward fluctuations in the last years, but Sweden still stayed ahead of the EU average (45 %)
18. However, more effort will be needed to comply
with recycling targets for the post-2020 period, in particular by shifting municipal waste away from incineration and towards recycling
19.
14 Municipal waste consists of mixed waste and separately collected waste from households and from other sources, where such waste is similar in nature and composition to waste from households. This is without prejudice to the allocation of responsibilities for waste management between public and private sectors. 15 See Article 11.2 of Directive 2008/98/EC. This Directive was amended in 2018 by Directive (EU) 2018/851, and more ambitious recycling targets were introduced for the period up to 2035. 16 Eurostat, Municipal waste and treatment, by type of treatment method, accessed November 2016. 17 Eurostat, Municipal waste by waste operations , accessed April 2018. 18 Member States may choose a different method than the one used by ESTAT (and referred to in this report) to calculate their recycling rates and track compliance with the 2020 target of 50 % recycling of municipal waste. 19 Directive (EU) 2018/851, Directive (EU) 2018/852, Directive (EU) 2018/850 and Directive (EU) 2018/849 amend the previous waste legislation and set more ambitious recycling targets for the period up to
The Swedish waste management plan for the years 2012 to 2017 includes measures to promote material recycling; additional steps may be needed to meet future EU recycling targets. New municipal waste management plans are under preparation.
Figure 6: Recycling rate of municipal waste 2010-201720
Sweden has ‘extended producer responsibility’ schemes for paper, packaging, waste electrical and electronic equipment, tyres, cars, batteries and pharmaceuticals. Separate collection is well rolled out across the country; over 70 % of municipalities separately collect food waste from households, restaurants and catering companies. The objective is for at least 50 % of food waste to be treated biologically to recover nutrients and at least 40 % to recover both nutrients and energy (via anaerobic digestion)
21.
Sweden aims to reduce the generation of municipal waste, including food waste, better and more efficient collection (e.g. via underground containers, vacuum waste collection) and treatment of waste textiles. The quantities of material collected for re-use have been steadily increasing in recent years, including furniture, textiles and household appliances. Sweden incentivises the repair of items by applying tax breaks (there are reduced VAT rates on certain minor repair services as well as tax reductions for part of the labour costs for repair and maintenance of larger household appliances when the work is carried out in a dwelling).
2035. These targets will be taken into consideration to assess progress in future Environmental Implementation Reports. 20 Eurostat, Recycling rate of municipal waste. 21 Afvall Sverige, Swedish Waste Management 2017.

Environmental Implementation Review 2019 – Sweden
8
Almost half of Sweden’s municipal waste was sent for energy recovery in 2016, and most of the output was used for heating. Sweden recovers more energy from waste than any other EU country. It has 34 incineration plants for municipal waste. The capacity for energy recovery is higher than domestic production
22 and
therefore Sweden imports waste for incineration from other countries.
2019 priority actions
Introduce new policy instruments, including economic ones, to promote prevention, make reuse and recycling more economically attractive
Shift reusable and recyclable waste away from incineration.
Climate change
The EU has committed to undertaking ambitious climate action internationally as well as in the EU, having ratified the Paris Climate Agreement on 5 October 2016. The EU targets are to reduce greenhouse gas (GHG) emissions by 20 % by 2020 and by at least 40 % by 2030, compared to 1990. As a long-term target, the EU aims to reduce its emissions by 80-95 % by 2050, as part of the efforts required by developed countries as a group. Adapting to the adverse effects of climate change is vital to alleviate its already visible effects and improve preparedness for and resilience to future impacts.
The EU emissions trading system (EU ETS) covers all large greenhouse gas emitters in the industry, power and aviation sectors in the EU. The EU ETS applies in all Member States and has a very high compliance rate. Each year, installations cover around 99 % of their emissions with the required number of allowances.
For emissions not covered by the EU ETS, Member States have binding national targets under the Effort Sharing legislation. Sweden had lower emissions than its annual emission allocations (AEAs) in each of the years 2013-2017.Sweden has cancelled its spare units, rather than banking them, in order to enhance the environmental integrity of the system. For 2020, Sweden's national target under the EU Effort Sharing Decision is to reduce emissions by 17 % compared to 2005. For 2030, Sweden's national target under the Effort Sharing Regulation will be to reduce emissions by 40 % compared to 2005.
With regard to regional cooperation, Sweden highlights its generally good dialogue with the other Nordic countries. The Swedish Parliament adopted a national Climate Policy Framework in June 2017. It consists of a Climate Act, new national climate targets and a climate
22 Afvall Sverige, Swedish Waste Management 2017.
policy council. The strategy includes the following targets:
No net emissions of greenhouse gases into the atmosphere by 2045 and thereafter negative emissions. This means emissions from activities in Swedish territory are to be at least 85 % lower by 2045 compared to 1990 levels. Supplementary measures may count towards achieving zero net emissions, such as increased uptake of carbon dioxide in forests and land, and investments in other countries;
Emissions in Sweden outside of the EU ETS should, by 2030, be at least 63 % lower than emissions in 1990, and by 2040 at least 75 % lower. To achieve these targets by 2030 and 2040, no more than 8 and 2 percentage points, respectively, of the emissions reductions may be realised through supplementary measures; emissions from domestic transport are to be reduced by at least 70 % by 2030 compared to 2010. Domestic aviation is not included in the target since this subsector is included in the EU ETS.
Figure 7: Change in total greenhouse gas emissions 1990-2017 (1990=100%)
23.
Transport represents almost a quarter of Europe's greenhouse gas emissions and is the main cause of air pollution in cities. Transport emissions in Sweden decreased by 7 % from 2013 to 2016.
The F-gas Regulation requires Member States to run training and certification programmes, introduce rules for penalties and notify these measures to the Commission by 2017. Sweden has notified both measures.
23 Annual European Union greenhouse gas inventory 1990–2016 (EEA greenhouse gas data viewer). Proxy GHG emission estimates for 2017Approximated EU greenhouse gas inventory 2017 (European Environment Agency). Member States national projections, reviewed by the European Environment Agency.

Environmental Implementation Review 2019 – Sweden
9
The accounting of GHG emissions and removals from forests and agriculture is governed by the Kyoto Protocol. Preliminary accounting for 2013-2016 shows net credits of, on average, -1.1 Mt CO2-eq, which corresponds to 1.0% of the EU-28 accounted sink of -115.7 Mt CO2-eq. Sweden is one of eight EU Member States that exceed the cap of 3.5% from emissions of the base year (1990).
The EU Strategy on adaptation to climate change, adopted in 2013, aims to make Europe more climate-resilient, by promoting action by Member States, better-informed decision making, and promoting adaptation in key vulnerable sectors. By adopting a coherent approach and providing for improved coordination, it seeks to enhance the preparedness and capacity of all governance levels to respond to the impacts of climate change.
Figure 8: Targets and emissions for Sweden under the Effort Sharing Decision and Effort Sharing Regulation
24.
The Swedish policy for adapting to climate change is laid out in the 2018 bill “National strategy for adaptation to climate change” (prop.2017/18:163). Adaptation policy efforts are supported by a range of strategic documents and action plans that are implemented at national, regional and local levels. Within the existing adaptation framework, Sweden is carrying out work in sectors that are of relevance to climate change adaptation such as biodiversity and ecosystem services, fresh water supply, health, infrastructure, rural businesses, technical supply systems, and urban areas. In June 2018 32 national authorities and the administrative boards of the regions (County Administrative Boards) were assigned through an ordinance to develop action plans action plans within its own area of responsibilities. 17 of these agencies had already developed, or were in the process of developing, action plans for the sectors for which they are responsible. Since 2009, the CABs are responsible for
24 Proxy GHG emission estimates for 2017Approximated EU greenhouse gas inventory 2017 (European Environment Agency). Member States national projections, reviewed by the European Environment Agency.
climate adaptation at regional level and supporting the adaptation work of municipalities. All 21 regions have undertaken climate impact studies and adopted regional action plans. In the National strategy, a five-year policy cycle is established for the strategy, this cycle includes implementation, follow-up, evaluation and revision25. The Expert council for adaptation has the task of monitoring and evaluating the work on adaptation to climate change. The council will also provide evidence for the focus of the national work on climate change for the revision of the strategy, planned in 2023.
Figure 9: Greenhouse gas emissions by sector (Mt. CO2-eq.). Historical data 1990-2016. Projections 2017-2030
26.
The total revenues from the auctioning of emission allowances under the EU ETS over the years 2013-2017 were EUR 213 million
27. Sweden does not earmark
auctioning revenues for specific uses. An amount equalling on average 73 % of the auctioning revenues has been reported as spent on climate and energy purposes.
2019 priority action
In this report, no priority actions have been included on climate action, as the Commission will first need to assess the draft national energy and climate plans which the Member States needed to send by end of 2018. These plans should increase the consistency between energy and climate policies and could therefore become a good example of how to link sector-specific policies on other interlinked themes such as agriculture-nature-water and transport-air-health.
25 Regeringen, 2018, Regeringens proposition 2017/2018:163 Nationell strategi for klimatanpassning 26 Annual European Union greenhouse gas inventory 1990–2016 (EEA greenhouse gas data viewer). Proxy GHG emission estimates for 2017Approximated EU greenhouse gas inventory 2017 (European Environment Agency). Member States national projections, reviewed by the European Environment Agency. 27 ???Reference

Environmental Implementation Review 2019 – Sweden
10
2. Protecting, conserving and enhancing natural capital
Nature and biodiversity
The EU biodiversity strategy aims to halt the loss of biodiversity in the EU by 2020. It requires full implementation of the Birds and Habitats Directives to achieve favourable conservation status of protected species and habitats. It also requires that the agricultural and forest sectors help to maintain and improve biodiversity.
Biodiversity strategy
In 1999, the Swedish Parliament adopted the ‘generational goal’
28 — the overarching objective
defining the direction of all environmental policy in Sweden, where 16 environmental quality objectives (EQOs)
29 describe the environmental quality that Sweden
wishes to achieve by 2020.
There is no Swedish strategy specifically on achieving good conservation status of protected species and habitats. Instead, biodiversity is integrated into the broad system of EQOs. To achieve these, Swedish nature conservation follows three general themes: (i) protection and management of nature; (ii) species protection; and (iii) sustainable use. The Bill on biodiversity and ecosystem services (2014) constitutes Sweden’s overall strategy for biodiversity and ecosystem services for the
period up to 202030
.
The area covered by old forest and protected forest in Sweden is increasing. However, the conservation status of many forest types is still inadequate and many forest species are threatened.
The latest Swedish Red List31
(2015) shows that the rate of biodiversity loss has neither increased nor decreased over the past 15 years. Logging in old-growth forests and overgrowth of habitats including meadows, pastures forests and wetlands poses a threat to most of species.
28 Swedish Environmental protection Agency, ‘The overall goal of Swedish environmental policy is to hand over to the next generation a society in which the major environmental problems in Sweden have been solved, without increasing environmental and health problems outside Sweden’s borders.’ Sweden's environmental objectives 29 The objectives are related to climate, air quality, acidification, forest, wetlands, oceans and coasts, lakes, mountains, urban environment, agriculture, toxic substances, radiation, ozone, groundwater and biodiversity. 30 A Swedish Strategy for Biodiversity and Ecosystem Services 31 SLU, Red List.
Setting up a coherent network of Natura 2000 sites
On the basis of the latest update of the assessment, Sweden’s terrestrial Natura 2000 network under the Birds and Habitats Directives is now considered to be complete.
Designating Natura 2000 sites and setting conservation objectives and measures
The designation process is ongoing, and available data indicate a slight increase in the part of the Swedish national territory that is covered by Natura 2000 (by 0.1 %). By May 2017, 13.4 % of Sweden’s national territory was covered by Natura 2000 (the EU average is 18.2 %), with Birds Directive SPAs covering 6.1 % (against an EU average of 12.4 %) and Habitats Directive SCIs covering 13.3 % (against an EU average of 13.9 %). Altogether, there are 4 084 Natura 2000 sites in Sweden (compared with 27 758 in the EU).
In the light of the recent designation of marine sites, the sufficiency of the marine part of the Swedish Natura 2000 network is under assessment.
The process for the designation of sites as special areas of conservation is complete and all sites now have a management plan. Management plans for marine sites also already exist or are being developed.
The organisation of the Natura 2000 network in Sweden is good and its funding is not currently a critical issue. Sweden has a high level of expertise in restoring habitats and various restoration activities show good results e.g. on grasslands, bogs and sand dunes.
Progress in maintaining or restoring favourable conservation status of species and habitats
Member States report on progress made under both directives every 6 years, and the report for the present period (2013-2018) is currently being compiled. Therefore, no new information is available yet on the state of natural habitats and species, nor on progress made on improving the conservation status of species and habitats in Sweden as compared to the 2017 EIR.
In general, agriculture, natural systems modification, forestry and natural biotic/abiotic processes are the most frequently reported pressure categories of high importance, and also apply to birds. As a result of changes in agricultural systems and animal farming, land abandonment, which leads to overgrowth of habitats, is identified as a significant threat to the conservation of

Environmental Implementation Review 2019 – Sweden
11
grasslands and birds nesting in well-grazed wetlands. The loss of agricultural land is also due to urbanisation.
As the conservation status of all grassland habitats and many of their associated species is unfavourable, there is a substantial need for the management and restoration of these habitats, as well as for enlarging nationally protected areas. The pressures related to urbanisation could be tackled at land-use planning level. It should be noted though that all permanent grasslands in Swedish Natura 2000 sites have been designated as environmentally sensitive permanent grasslands. In addition, although the use of agri-environmental schemes to support the conservation of grasslands seems to be yielding results, the sufficiency of funding levels can be questioned.
Sweden has substantially invested in land purchase and compensation payments over the years to protect its forests (including through LIFE funding), mainly in its high-latitude and high-altitude areas. However, the expert-based assessment carried out under Article 17 of the Habitats Directive clearly recognises a further need to increase the protection of various forest habitats to achieve the targets related to good conservation status.
The level of nature-related complaints and infringements in Sweden is not very high. Main topics include hunting of wolves (use of derogations), wind farms and other land-use activities, e.g. quarries, and access to justice.
2019 priority actions
Complete the process of designating special areas of conservation (SACs) for the marine component, put in place clearly defined conservation objectives and the necessary conservation measures for the new sites and provide adequate resources for the implementation of the management plans. This is in order to maintain/restore species and habitats of community interest to a good conservation status across their natural range, especially for the benefit of grassland habitats and species.
Improve the conservation status of forest, grassland and dune habitats through targeted actions developed with the land users in order to better integrate biodiversity goals, including outside Natura 2000.
Maintaining and restoring ecosystems and their services
The EU biodiversity strategy aims to maintain and restore ecosystems and their services by including green infrastructure in spatial planning and restoring at least 15 % of degraded ecosystems by 2020. The EU green infrastructure strategy promotes the incorporation of green infrastructure into related plans and programmes.
The EU has provided guidance on the further deployment of green and blue infrastructure in Sweden
32 and a
country page on the Biodiversity Information System for Europe (BISE)
33. This information will also contribute to
the final evaluation of the EU Biodiversity Strategy to 2020.
Sweden has a range of policies and strategies in place to develop and improve green infrastructure (GI) across the country and across different sectors. For example, the environmental quality objectives (EQOs)
34 set out by the
Swedish Parliament aim to integrate biodiversity and ecosystem services into economic and political decision making throughout society by 2018. Moreover, the Swedish strategy for biodiversity and ecosystem services (2013) includes a number of proposed legislative changes with relevance to GI; it commissioned Sweden’s 21 Country Administrative Boards to develop regional action plans for GI by 2017.
Progress towards achieving the EQOs is monitored and reported on annually. The 2017 summary report
35
published by the Swedish Environmental Protection Agency in late March states that progress on the regional action plans for GI is under way, but that there are significant differences between regions. It also shows that aspects related to the GI strategy have been particularly time consuming. A first version of action plans that cover the post-2018 period should be developed to ensure that work continues.
Other policies and laws relevant to GI include the Swedish Planning and Building Act (2010), for which
32 European Commission, The recommendations of the green infrastructure strategy review report and the EU Guidance on a strategic framework for further supporting the deployment of EU-level green and blue infrastructure. 33 Biodiversity Information System for Europe. 34 Swedish Environmental protection Agency, Sweden's environmental objectives 35The Swedish Environmental Protection Agency, the 2017 summary report
Environmental Implementation Review 2019 – Sweden
12
guidance on ecosystem services and green infrastructure in planning and building is currently being developed.
Sweden has launched several projects related to GI, and these have been of varying size and at various geographic and governance levels. Work on mainstreaming GI is ongoing. The Swedish Board of Agriculture has started work on managing, restoring and creating biotopes in the landscape, and on building transition zones between forestry and agricultural land to support GI and biodiversity.
The EQOs related to sustainable forests also include references to GI. For example, the state-owned forestry company Sveaskog’s system of ‘eco-parks’ (ekoparker) are important from a GI perspective in that the project is long term and covers large, connected forested areas of particular ecological value. In an eco-park, at least 50 % of the productive forest must be used for conservation purposes, more specifically to protect and actively support the function of its natural values. However, despite these and other efforts, the protection of valuable forests is listed as a key challenge in the 2017 EQO progress report.
In recent years, the ecosystem service concept has been a focal point in Sweden’s work relating to sustainable urban development. It is also being integrated into environmental impact assessments and land-use plans. Work on GI in water management, transport infrastructure and tourism is ongoing.
The development of GI and related initiatives is funded from various sources in Sweden and has been allocated relatively large resources in recent years. EU-level funding has been made available through a number of LIFE projects. In 2016, for instance, an EU grant of almost EUR 5 million was awarded to a new LIFE project in Sweden for the restoration of valuable oak habitats. The current Swedish Government increased the funding available for protecting particularly valuable natural assets in 2016.
An interesting example of innovative funding for GI was initiated by the City of Gothenburg in 2013. As the world’s first initiative of this kind at municipal level,
Gothenburg issued green bonds earmarked for investment in ‘green’ projects, including various GI-related projects.
Sweden’s main challenges related to developing GI are: structural administrative barriers, inter-country collaboration and knowledge gaps.
Estimating natural capital
The EU biodiversity strategy calls on Member States to map and assess the state of ecosystems and their services
36 in their national territories by 2014, assess the
economic value of such services and integrate these values into accounting and reporting systems at EU and national level by 2020.
Sweden has not reported on its progress on mapping and assessing the state of ecosystems and their services (MAES) during 2016 and 2017. It has not provided any new information on its work in this area on the MAES webpage of the BISE since 2015.
At the MAES working group meeting held in Brussels in September 2018, it was shown that Sweden has not provided updated information and therefore no progress in implementing MAES has been recorded since January 2016 (Figure 10). This assessment was made by the ESMERALDA project
37 and based on 27 implementation
questions. The assessment is updated every 6 months.
Figure 10: Implementation of MAES (September 2018)
Business and biodiversity platforms, networks and communities of practice are key tools for promoting and facilitating natural capital assessments among business and financial service providers, for instance via the Natural Capital Coalition’s protocol
38. The assessments
contribute to the EU biodiversity strategy by helping private businesses better understand and value both their impact and dependence on nature. Biodiversity platforms have been established at EU level
39 and in a
36 Ecosystem services are benefits provided by nature such as food, clean water and pollination on which human society depends. 37 EU project, Esmeralda 38 Natural Capital Coalition, Natural Capital Protocol. 39 Business and Biodiversity, The European Business and Biodiversity Campaign aims to promote the business case for biodiversity in the EU Member States through workshops, seminars and a cross media communication strategy.

Environmental Implementation Review 2019 – Sweden
13
number of Member States. Sweden has not yet set up such a platform.
2019 priority action
Strengthen support to the mapping and assessment of ecosystems and their services, valuation and development of natural capital accounting systems.
Invasive alien species
Under the EU biodiversity strategy, the following are to be achieved by 2020: (i) invasive alien species identified; (ii) priority species controlled or eradicated; and (iii) pathways managed to prevent new invasive species from disrupting European biodiversity. This is supported by the Invasive Alien Species (IAS) Regulation, which entered into force on 1 January 2015.
Sweden proposed one species for the first update of the EU list: the American lobster (Homarus americanus). While the risk assessment received a positive opinion from the Scientific Forum, the Committee finally decided that the species does not comply with the criteria for listing.
Figure 11: Number of IAS of EU concern, based on available georeferenced information for Sweden
40
The report on baseline distribution (Figure 11), for which Sweden reviewed its country and grid-level data, shows that from the 37 species on the first EU list, six have been observed in the environment in Sweden, among which five are established, with signal crayfish (Pacifastacus leniosculus) being the most widely spread.
40 Tsiamis K; Gervasini E; Deriu I; D`amico F; Nunes A; Addamo A; De Jesus Cardoso A. Baseline Distribution of Invasive Alien Species of Union concern. Ispra (Italy): Publications Office of the European Union; 2017, EUR 28596 EN, doi:10.2760/772692
Between the entry into force of the EU list and 18 May 2018, Sweden has not notified the Commission of any new appearances of invasive alien species of EU concern under Article 16(2) of the IAS Regulation.
Sweden has notified the Commission of its competent authorities responsible for implementing the IAS Regulation as required by Article 24(2) of the Regulation. Sweden has also notified the Commission of the adoption of the national act containing the relevant national provisions on penalties applicable to infringements as required by Article 30(4) of the IAS Regulation is in progress, which entered into force on 1 August 2018. The act also included an authorization for the Government to adopt provisions necessary to prevent the introduction or spread of invasive alien species. Work on a Swedish ordinance on invasive alien species is progressing.
Soil protection
The EU soil thematic strategy underlines the need to ensure a sustainable use of soils. This entails preventing further soil degradation and preserving its functions, as well as restoring degraded soils. The 2011 Roadmap to a Resource Efficient Europe states that by 2020, EU policies must take into account their direct and indirect impact on land use.
Soil is a finite and extremely fragile resource and it is increasingly degrading in the EU. The percentage of artificial land
41 in Sweden (Figure 12) can show the
relative pressure on nature and biodiversity and the environmental pressure on people living in urbanised areas. Population density is a similar measure.
Contamination can severely reduce soil quality and threaten human health or the environment. A recent report of the European Commission
42 estimated that
potentially polluting activities have taken or are still taking place on approximately 2.8 million sites in the EU. At EU level, 650 000 of these sites have been registered in national or regional inventories. 65 500 contaminated sites already have been remediated. Sweden has registered 83 000 sites where potentially polluting activities have taken or are taking place, and already has remediated or applied aftercare measures on 1 930 sites.
Soil erosion by water is a natural process, but this natural process can be aggravated by climate change and human
41 Artificial land cover is defined as the total of roofed built-up areas (including buildings and greenhouses), artificial non built-up areas (including sealed area features, such as yards, farmyards, cemeteries, car parking areas etc. and linear features, such as streets, roads, railways, runways, bridges) and other artificial areas (including bridges and viaducts, mobile homes, solar panels, power plants, electrical substations, pipelines, water sewage plants, and open dump sites). 42 Ana Paya Perez, Natalia Rodriguez Eugenio (2018), Status of local soil contamination in Europe: Revision of the indicator “Progress in the management Contaminated Sites in Europe”

Environmental Implementation Review 2019 – Sweden
14
activities such as inappropriate agricultural practices, deforestation, forest fires or construction works. High levels of soil erosion can reduce productivity in agriculture and can have negative and transboundary impacts on biodiversity and ecosystem services. High levels of soil erosion can also have negative and transboundary effects on rivers and lakes (due to increased sediment volumes and transport of contaminants).
Figure 12: Proportion of artificial land cover, 2015 43
According to the RUSLE2015 model44
, Sweden has an average soil loss rate by water of 0.41 tonnes per hectare per year (t ha
−a yr
−y) compared to the EU mean of 2.46
t ha−a
yr−y
. This indicates that soil erosion in Sweden is low. Note that these figures are the output of an EU level model and can therefore not be considered as locally measured values. The actual rate of soil loss can vary strongly within a Member State depending on local conditions.
Soil organic matter plays an important role as a carbon sink in the carbon cycle and in climate change.
43 Eurostat, Land covered by artificial surfaces by NUTS 2 regions. 44 Panagos, P., Borrelli, P., Poesen, J., Ballabio, C., Lugato, E., Meusburger, K., Montanarella, L., Alewell, C., The new assessment of soil loss by water erosion in Europe, (2015) Environmental Science and Policy, 54, pp. 438-447.
Marine protection
EU coastal and marine policy and legislation require that by 2020 the impact of pressures on marine waters be reduced to achieve or maintain good environmental status (GES) and ensure that coastal zones are managed sustainably.
The Marine Strategy Framework Directive (MSFD)45
aims to achieve good environmental status of the EU’s marine waters by 2020. To that end, Member States must develop a marine strategy for their marine waters, and cooperate with the EU countries that share the same marine (sub)region.
For Sweden, the Convention for the protection of the marine environment of the North-East Atlantic (OSPAR Convention) and the Baltic Marine Environment Protection Commission (Helsinki Commission) play an important role in achieving the goals of the Directive. These marine strategies comprise different steps to be developed and implemented over six-year cycles. The latest step required Member States to set up and report to the Commission their programme of measures by 31 March 2016. The Commission assessed whether the Swedish measures would help reach good environmental status
46.
Sweden reported a mix of measures put in place to help it achieve good environmental status, some stemming from other legal acts, some newly defined for the purposes of achieving MSFD objectives, some directly addressing pressures, and others addressing them more indirectly (e.g. through monitoring and research). For instance, new measures directly addressing pressures are reported for commercial fish and shellfish, and marine litter, while for non-indigenous species and underwater noise most of the measures consist of research and coordination efforts, which will not directly affect the marine environment, but will positively contribute to characterising pressures better and filling knowledge gaps.
Although Sweden addresses a number of relevant pressures and targets, it does not cover certain pressures, activities and associated impacts identified as important at the subregional level, such as for instance physical damage from shipping, and contaminants from agricultural activities, tourism and recreation activities.
Sweden reports that it cannot determine if good environmental status will be achieved by 2020 given this lack of knowledge. It acknowledges that there are risks to
45 European Union, Marine Strategy Framework Directive 2008/56/EC 46 Commission report assessing Member States’ programme of measures under the MSFD to be added once published (forthcoming publication).

Environmental Implementation Review 2019 – Sweden
15
not achieving it by 2020 and provides explanations of these. It states that details will become more evident in the second MSFD implementation cycle. Overall, the Swedish programme of measures partially addresses the requirements of the MSFD.
2019 priority actions
Define ‘good environmental status’ and set targets where these do not exist.
Provide more information about measures to achieve good environmental status, put in place more measures that have a direct impact on the sources of pressure and quantify the expected reduction of pressure as a result.
Ensure regional cooperation with Denmark, Estonia, Finland, Germany, Latvia, Lithuania and Poland in the Baltic Sea region to address the leading sources of pressure.

Environmental Implementation Review 2019 – Sweden
16
3. Ensuring citizens’ health and quality of life
Air quality
EU clean air policy and legislation require the significant improvement of air quality in the EU, moving the EU closer to the quality recommended by the World Health Organisation. Air pollution and its impacts on human health, ecosystems and biodiversity should be further reduced with the long-term aim of not exceeding critical loads and levels. This requires strengthening efforts to reach full compliance with EU air quality legislation and defining strategic targets and actions beyond 2020.
The EU has developed a comprehensive body of air quality legislation
47, which establishes health-based
standards and objectives for a number of air pollutants.
According to the European Court of Auditors (ECA)48
, EU action to protect human health from air pollution has not delivered its expected impact. There is a risk that air pollution is being underestimated in some instances because it may not always be monitored in the right places. Member States are now required to report both real-time and validated air quality data to the Commission
49.
The emission of several air pollutants has decreased significantly in Sweden
50.
The emission reductions achieved between 1990 and 2014, and mentioned in the 2017 EIR, continued between 2014 and 2016. Emissions of sulphur oxides (SOx) fell by 4.27 %; emissions of nitrogen oxides (NOx) by 5.95 %; emissions of ammonia (NH3) by 2.41 %; emissions of fine particulate matter PM2.5 by 2.75 %, and; emissions of volatile organic compounds (NMVOCs) by 1.34 % (see also Figure 13 on the total PM2.5 and NOx emissions per sector).
47 European Commission, 2016. Air Quality Standards 48 European Court of Auditors, Special report no 23/2018, Air pollution: Our health still insufficiently protected, p.41. 49 Article 5 of Commission Implementing Decision 2011/850/EU of 12 December2011 laying down rules for Directives 2004/107/EC and 2008/50/EC of the European Parliament and of the Council as regards the reciprocal exchange of information and reporting on ambient air quality (OJ L 335, 17.12.2011, p. 86) requires Member States to provide Up-To-Date data. 50 See EIONET Central Data Repository and Air pollutant emissions data viewer (NEC Directive).
Figure 13: PM2.5 and NOx emissions by sector in Sweden
Despite these emission reductions, additional efforts are needed to meet the emission reduction commitments (compared to 2005 emission levels) set out in the new National Emissions Ceilings Directive
51 for the period
2020 to 2029 and for any year from 2030.
Air quality in Sweden continues to give cause for concern. For the year 2015, the European Environment Agency estimated that about 3 710 premature deaths were attributable to fine particulate matter
52 concentrations,
150 to ozone53
concentrations and over 990 to nitrogen dioxide
54 concentrations
55.
In 201756
, levels of particulate matter (PM10,) exceeded EU air quality standards in two (out of 6) Swedish air quality zones (Visby on Gotland and Middle Sweden). See also Figure 14 on the number of air quality zones in which NO2, PM2.5, and PM10 levels exceeded EU air quality standards.
The Commission is following up on the persistent breaches of air quality requirements (for PM10), which
51 Directive 2016/2284/EU. 52 Particulate matter (PM) is a mixture of aerosol particles (solid and liquid) covering a wide range of sizes and chemical compositions. PM10 (PM2.5) refers to particles with a diameter of 10 (2.5) micrometres or less. PM is emitted from many anthropogenic sources, including combustion. 53 Low level ozone is produced by photochemical action on pollution. 54 NOx is emitted during fuel combustion e.g. from industrial facilities and the road transport sector. NOx is a group of gases comprising nitrogen monoxide (NO) and nitrogen dioxide (NO2). 55 EEA, Air Quality in Europe – 2018 Report, p.64. Please see details in this report as regards the underpinning methodology. 56 EEA, EIONET Central Data Repository.

Environmental Implementation Review 2019 – Sweden
17
have severe negative effects on health and the environment, through infringement procedures covering all Member States concerned, including Sweden. The aim is that adequate measures are put in place to bring all zones into compliance.
Figure 14: Air quality zones exceeding EU air quality standards in 2017
57
2019 priority actions
In the context of the forthcoming national air pollution control programme (NAPCP), take action towards reducing main emission sources, including through the priority actions identified below.
Accelerate reductions in particulate matter (PM2.5 and PM10) emission and concentration; this will require, in the particular case of Sweden, addressing emissions due to the use of studded tyres.
Industrial emissions
The main objectives of EU policy on industrial emissions are to: (i) protect air, water and soil; (ii) prevent and manage waste; (iii) improve energy and resource efficiency; and (iv) clean up contaminated sites. To achieve this, the EU takes an integrated approach to the prevention and control of routine and accidental industrial emissions. The cornerstone of the policy is the Industrial Emissions Directive
58 (IED).
The below overview of industrial activities regulated by the IED is based on the ‘industrial emissions policy country profiles’ project
59.
57 EEA, EIONET Central Data Repository. Data reflects the reporting situation as of 26 November 2018. 58 Directive 2010/75/EU covers industrial activities carried out above certain thresholds. It covers energy industry, metal production, mineral and chemical industry and waste management, as well as a wide range of industrial and agricultural sectors (e.g. intensive rearing of pig and poultry, pulp and paper production, painting and cleaning). 59 European Commission, Industrial emissions policy country profile – Sweden.
In Sweden, the IED requires around 1040 industrial installations to have a permit
60. In 2015, Sweden’s
industrial sectors with the most IED installations were: waste management (25 %), intensive rearing of poultry or pigs (25 %), energy — power (12 %) and surface treatment (12 %).
Figure 15: Number of IED industrial installations by sector, Sweden (2015)
61
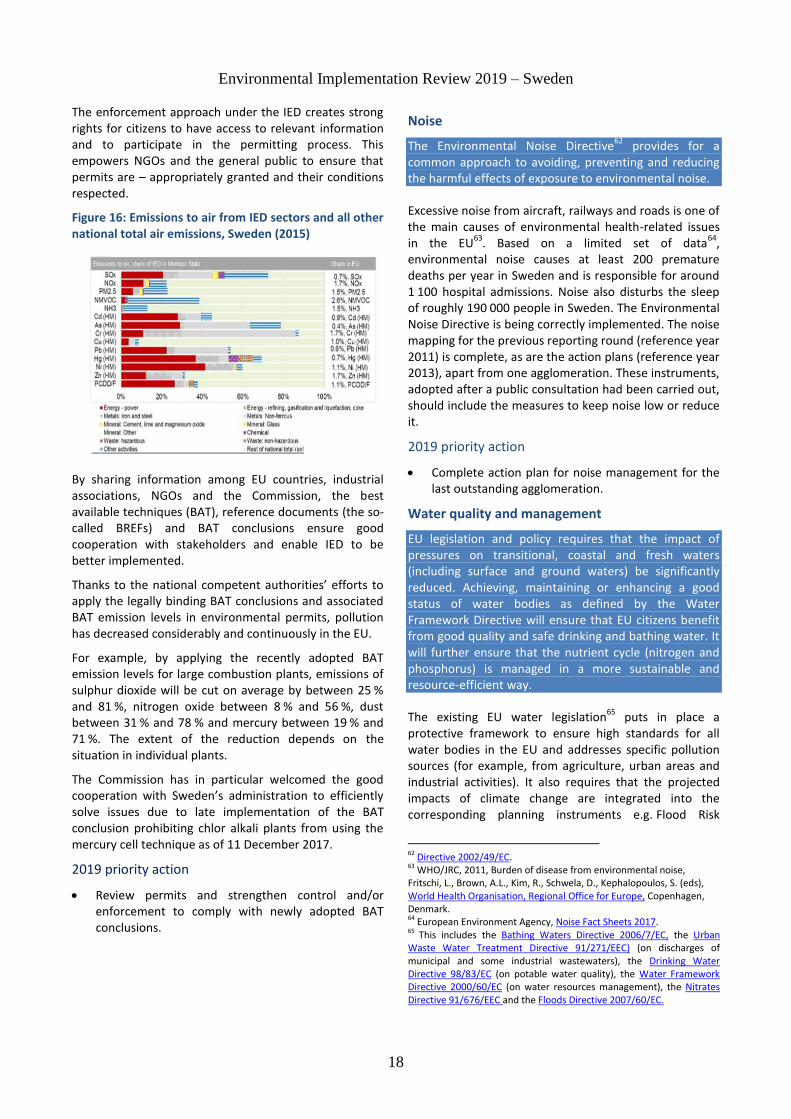
The sectors identified as contributing the most emissions to air in Sweden are: (i) the non-ferrous metal production sector for sulphur oxides (SOx), arsenic (As), chromium (Cr), and lead (Pb); (ii) the energy-power sector for sulphur oxides (SOx), nitrogen oxides (NOx), cadmium (Cd), arsenic (As), lead (Pb), mercury (Hg) nickel (Ni), zinc (Zn) and polychlorinated dibenzodioxins and polychlorinated dibenzofurans (PCDD/F); (iii) the iron and steel production sector for chromium (Cr), mercury (Hg), nickel (Ni) and zinc (Zn); (iv) the ‘other activities’ sector (mostly intensive rearing of poultry or pigs, surface treatment and pulp, paper and wood products) for sulphur oxides (SOx), particulate matter (PM2.5), non-methane volatile organic compounds (NMVOCs), ammonia (NH3) and arsenic (As); and (v) the iron and steel sector for chromium (Cr), mercury (Hg), nickel (Ni) and Zinc (Zn). The breakdown is shown in Figure 16.
Regarding water emissions, the ‘other activities’, metal production and the energy-power sectors were identified as responsible for the largest environmental burden as regards emissions into water. ‘Other activities’, energy-power, metal production and the waste management sectors were identified as making significant contributions in terms of non-hazardous waste generation. Waste management, energy-power and metal production were singled out for hazardous waste generation.
60 This overview of industrial activities regulated by IED is based on the project on Industrial Emissions policy Country profiles. 61 European Commission, Industrial emissions policy country profile – Sweden.
Environmental Implementation Review 2019 – Sweden
18
The enforcement approach under the IED creates strong rights for citizens to have access to relevant information and to participate in the permitting process. This empowers NGOs and the general public to ensure that permits are – appropriately granted and their conditions respected.
Figure 16: Emissions to air from IED sectors and all other national total air emissions, Sweden (2015)
By sharing information among EU countries, industrial associations, NGOs and the Commission, the best available techniques (BAT), reference documents (the so-called BREFs) and BAT conclusions ensure good cooperation with stakeholders and enable IED to be better implemented.
Thanks to the national competent authorities’ efforts to apply the legally binding BAT conclusions and associated BAT emission levels in environmental permits, pollution has decreased considerably and continuously in the EU.
For example, by applying the recently adopted BAT emission levels for large combustion plants, emissions of sulphur dioxide will be cut on average by between 25 % and 81 %, nitrogen oxide between 8 % and 56 %, dust between 31 % and 78 % and mercury between 19 % and 71 %. The extent of the reduction depends on the situation in individual plants.
The Commission has in particular welcomed the good cooperation with Sweden’s administration to efficiently solve issues due to late implementation of the BAT conclusion prohibiting chlor alkali plants from using the mercury cell technique as of 11 December 2017.
2019 priority action
Review permits and strengthen control and/or enforcement to comply with newly adopted BAT conclusions.
Noise
The Environmental Noise Directive62
provides for a common approach to avoiding, preventing and reducing the harmful effects of exposure to environmental noise.
Excessive noise from aircraft, railways and roads is one of the main causes of environmental health-related issues in the EU
63. Based on a limited set of data
64,
environmental noise causes at least 200 premature deaths per year in Sweden and is responsible for around 1 100 hospital admissions. Noise also disturbs the sleep of roughly 190 000 people in Sweden. The Environmental Noise Directive is being correctly implemented. The noise mapping for the previous reporting round (reference year 2011) is complete, as are the action plans (reference year 2013), apart from one agglomeration. These instruments, adopted after a public consultation had been carried out, should include the measures to keep noise low or reduce it.
2019 priority action
Complete action plan for noise management for the last outstanding agglomeration.
Water quality and management
EU legislation and policy requires that the impact of pressures on transitional, coastal and fresh waters (including surface and ground waters) be significantly reduced. Achieving, maintaining or enhancing a good status of water bodies as defined by the Water Framework Directive will ensure that EU citizens benefit from good quality and safe drinking and bathing water. It will further ensure that the nutrient cycle (nitrogen and phosphorus) is managed in a more sustainable and resource-efficient way.
The existing EU water legislation65
puts in place a protective framework to ensure high standards for all water bodies in the EU and addresses specific pollution sources (for example, from agriculture, urban areas and industrial activities). It also requires that the projected impacts of climate change are integrated into the corresponding planning instruments e.g. Flood Risk
62 Directive 2002/49/EC. 63 WHO/JRC, 2011, Burden of disease from environmental noise, Fritschi, L., Brown, A.L., Kim, R., Schwela, D., Kephalopoulos, S. (eds), World Health Organisation, Regional Office for Europe, Copenhagen, Denmark. 64 European Environment Agency, Noise Fact Sheets 2017. 65 This includes the Bathing Waters Directive 2006/7/EC, the Urban Waste Water Treatment Directive 91/271/EEC) (on discharges of municipal and some industrial wastewaters), the Drinking Water Directive 98/83/EC (on potable water quality), the Water Framework Directive 2000/60/EC (on water resources management), the Nitrates Directive 91/676/EEC and the Floods Directive 2007/60/EC.

Environmental Implementation Review 2019 – Sweden
19
Management Plans and River Basin Management Plans, including Programmes of Measures which include the actions that Member States plan to take in order to achieve the environmental objectives.
Water Framework Directive
Sweden has adopted and reported the second generation of River Basin Management Plans under the Water Framework Directive and the European Commission has assessed the status and the development since the adoption of the first River Basin Management Plans, including suggested actions in the EIR report 2017.
The most significant pressure on surface water is atmospheric deposition (100% of surface water bodies), followed by dams, barriers and locks (24%). For groundwater bodies the most significant pressure is diffuse pollution from transport (10%) and contaminated and abandoned industrial sites (7%).
Chemical pollution was the most significant impact on surface water (100% of surface water bodies) followed by altered habitats due to morphological changes (41%).
Overall, ecological status/potential is less than good in the majority of water bodies: 51 % of lakes, 68 % of rivers and 82 % of coastal waters (surface water illustrated in figure 17). This shows that Sweden has a long way to go to achieve the good status/potential objectives laid down in the Water Framework Directive.
66 EEA, WISE dashboard.
The ecological status/potential has apparently deteriorated in many rivers and lakes since the first River Basin Management Plans. This deterioration is largely due to changes in classification methods and to the inclusion of river basin specific pollutants in the classification.
Where environmental objectives are not yet achieved exemptions can be applied in case the respective conditions are met. The required justifications are explained in the River Basin Management Plans but Sweden has not reported application of the exemption regarding new projects (Article 4(7)) and information is therefore needed.
All surface water bodies fail to achieve good chemical status. The River Basin Management Plans indicate that the exceedance of the mercury environmental quality standard in biota and that for brominated diphenylethers (where monitored) were extrapolated to all surface water bodies resulting in the observed assessment of chemical status.
The monitoring situation of groundwater bodies has improved. The number of monitoring sites increased as well as the number of monitored groundwater bodies. The number of groundwater bodies failing good quantitative status increased but the affected groundwater body area remained almost the same. 99.7% of groundwater bodies are in good quantitative status and all groundwater bodies now have a clear status which is a significant improvement since the first River Basin Management Plans.
Most significant pressures are identified in the River Basin Management Plans and addressed by measures (Key type of measures). Some measures have been completed since the first Programme of Measures but obstacles such as lack of finance and lack of mechanisms in all River Basin Districts have occurred in relation to their implementation. The most significant progress seems to be the definition of a significant number of national measures in relation to specific pressures (although not all pressures appear to have been addressed) and the planning of more measures (for example to control nutrients and in particular phosphorus loads).
Nitrates Directive
The 2012-2015 report on the Nitrates Directive confirmed overall low concentrations in ground and surface waters and a slight improvement in the trophic level of surface waters, rivers and lakes. However, Sweden must continue to pay close attention to nutrient pollution as it borders the Baltic Sea, which is heavily affected by this kind of pollution.
Significant investment needs still exist in Sweden to accelerate compliance with the Water Framework
Figure 17: Ecological status or potential of surface water bodies in Sweden
66

Environmental Implementation Review 2019 – Sweden
20
Directive and the Floods Directive, such as the removal of obstacles to fish migration, renaturalisation of the flow of rivers, and various measures for flood prevention and mitigation.
Drinking Water Directive
No new data on drinking water is available since the last EIR
67.
Bathing Water Directive
Figure 18 shows that in 2017, out of Sweden’s 441 bathing waters, 58.7 % were of excellent quality, 27.9 % of good quality and 3.2 % of sufficient quality (71.8 %, 13.3 % and 3.8 % respectively in 2015). Four of Sweden’s bathing waters were of poor quality in 2017
68. Detailed
information on Swedish bathing waters is available from a national portal
69 and via an interactive map viewer
developed by the European Environment Agency70
.
Figure 18: Bathing water quality 2014–201771
Urban Waste Water Treatment Directive
Sweden has a satisfactory level of compliance with the Urban Waste Water Treatment Directive. Overall, 100 % of Sweden’s wastewater is collected. 330 out of 344 agglomerations comply with the Directive’s requirements concerning secondary treatment and 131 agglomerations out of 153 comply with requirements for more stringent water treatment. An infringement case is currently open to follow up on the few cases of non-compliance.
The estimated investment needed to ensure adequate collection and treatment of water in the remaining
67 Compliance with the Drinking Water Directive microbiological and chemical parameters as last reported was very high. 68 European Environment Agency, 2017. European bathing water quality in 2016, p. 17. 69 Swedish national bathing waters portal. 70 EEA, State of bathing waters. 71 European Environment Agency, 2018. European bathing water quality in 2017, p. 21.
agglomerations is EUR 120 million72
.
Floods Directive
The Floods Directive established a framework for the assessment and management of flood risks, aiming at the reduction of the adverse consequences associated with significant floods.
Sweden has adopted and reported its first Flood Risk Management Plans under the Directive and the European Commission conducted an assessment.
The Commission’s assessment found that good efforts were made with positive results in setting objectives and devising measures focusing on prevention, protection and preparedness. The assessment also showed that, as was the case for other Member States, Sweden’s Flood Risk Management Plans do not yet include concrete enough measures, clearly prioritised, that are linked to the objectives set and an as complete as possible estimation of the cost of measures. In addition, there is scope for reinforcing coordination between Flood Risk Management Plans and the River Basin Management Plans.
2019 priority actions
Ensure that Environmental Quality Standards are available and adequate for all relevant River Basin Specific Pollutants.
Ensure progress in the justification of exemptions by further substantiating the related assessments with additional data and information and by reducing the remaining degree of uncertainties.
Strengthen control and enforcement of measures to prevent and reduce nutrients pollution.
Take steps to reinforce coordination between Flood Risk Management Plans and the River Basin Management Plans.
Chemicals
The EU seeks to ensure that by 2020 chemicals are produced and used in ways that minimise any significant adverse effects on human health and the environment. An EU strategy for a non-toxic environment that is conducive to innovation and to developing sustainable substitutes, including non-chemical options, is being prepared.
The EU’s chemicals legislation73
provides baseline protection for human health and the environment. It also
72 European Commission, Ninth Report on the Implementation Status and the Programmes for Implementation of the Urban Waste Water Treatment Directive (COM(2017) 749) and Commission Staff Working Document accompanying the report (SWD(2017)445). 73 Principally for chemicals: REACH (OJ L 396, 30.12.2006, p.1.); for Classification, Labelling and Packaging, the CLP Regulation (: OJ L 252,

Environmental Implementation Review 2019 – Sweden
21
ensures stability and predictability for businesses operating within the internal market.
In 2016, the European Chemicals Agency (ECHA) published a report on REACH and the CLP Regulation
74
that showed that enforcement activities are still evolving. Member States cooperate closely within the Forum for Exchange of Information on Enforcement
75. This
cooperation has shown that there is scope to increase the effectiveness of enforcement activities, particularly for registration obligations and safety data sheets where the level of non-compliance is still relatively high.
While progress has been made, there is room to further improve and harmonise enforcement activities across the EU, including controls on imported goods. Enforcement remains weak in some Member States, particularly for controls on imports and supply chain obligations. The enforcement architecture is complex in most EU countries and enforcement projects reveal differences in compliance between Member States (e.g. some tend to systematically report higher compliance than the EU average, others lower).
A 2015 Commission study highlighted the importance of harmonising the implementation of REACH at national level, in terms of market surveillance and enforcement; it is a critical factor in successfully operating a harmonised single market
76.
In March 2018, the Commission published an evaluation of REACH
77. The evaluation concludes that REACH
delivers on its objectives, but that progress made is slower than anticipated. In addition, the registration dossiers often are incomplete. The evaluation underlines the need to enhance enforcement by all actors, including registrants, downstream users and in particular for importers, to ensure a level playing field, meet the objectives of REACH and ensure consistency with the actions envisaged to improve environmental compliance and governance. Consistent reporting of Member State enforcement activities was considered important in that respect.
The Swedish Chemicals Agency (KEMI) is the body that is mostly responsible for enforcing REACH, CLP and BPR in Sweden. There are some exceptions: REACH provisions concerning the safety of workers are the responsibility of the Swedish Work Environment Authority and those concerning the safety of workplaces, with a focus on the
31.12.2006, p.1.), together with legislation on biocidal products and plant protection products. 74 ECHA, Report on the Operation of REACH and CLP 2016. 75 ECHA, on the basis of the projects REF-1, REF-2 and REF-3. 76 European Commission. (2015). Monitoring the Impacts of REACH on Innovation, Competitiveness and SMEs. Brussels: European Commission. 77 COM(2018) 116.
environment, are the responsibility of local and regional authorities.
In Sweden, REACH, CLP and BPR are enforced under the Environmental Code. Penalty provisions for non-compliance are listed in its Chapter 29. Sanctions for infringement of REACH, CLP and BPR provisions are generally either a fine or imprisonment for a maximum of two years.
Making cities more sustainable
EU policy on the urban environment encourages cities to put policies in place for sustainable urban planning and design. These should include innovative approaches to urban public transport and mobility, sustainable buildings, energy efficiency and urban biodiversity conservation.
The population living in urban areas in Europe is projected to rise to just over 80% by 2050
78. Urban areas
pose particular challenges for the environment and human health, but they also provide opportunities for using resources more efficiently. The EU encourages municipalities to become greener through initiatives such as the Green Capital Award
79, the Green Leaf Award
80
and the Green City Tool81
.
Financing greener cities
Sweden participates in the European urban development network (UDN)
82, which includes more than 500 cities
across the EU responsible for implementing integrated actions based on sustainable urban development strategies financed by the ERDF in the 2014-2020 period.
The ERDF supports the UDN’s urban innovative actions as a way of testing new and unproven solutions that address urban challenges. Urban innovative actions have
78 European Commission, Eurostat, Urban Europe, 2016, p.9. 79European Commission, European Green Capital 80 European Commission, European Green Leaf 81 European Commission, Green City Tool 82 European Commission, The Urban Development Network

Environmental Implementation Review 2019 – Sweden
22
a total ERDF budget of EUR 372 million for 2014-202083
.
One urban innovative action project with a budget of EUR 4.7 million project (FED — fossil free energy districts) is taking place in Gothenburg. It supports the energy transition in urban areas by:
demonstrating scalable and replicable solutions for energy efficiency and smart energy management in public infrastructure and the housing sector;
adopting low carbon energy production and moderating the demand for heating and cooling;
deploying innovative, renewable-based solutions to heating/cooling buildings and neighbourhoods.
Participation in EU urban initiatives and networks
Swedish municipalities are generally involved in EU initiatives on environment protection and climate change.
Växjö is the first Swedish city to win the European Green Leaf title. It regards itself as a role model for environmental action in Sweden. It was the first city in Sweden to use biomass for district heating, one of the first to start working on the UN 2030 Agenda for Sustainable Development and it committed to being climate fossil fuel free over 20 years ago.
Växjö has many protected natural areas and green spaces. The city has developed strategies to conserve these areas and has made them more accessible to inhabitants by creating cycle paths and walkways. It is also developing urban agriculture to ensure that its people have access to local and organic produce.
Växjö regularly includes its citizens in sustainable transport planning and has introduced a range of measures to improve mobility. Cycling and walking are prioritised and encouraged, for example through the creation of new cycle paths. The city has also made improvements to its public transport system, increasing the number of buses by 40 % and switching to a biogas fuelled fleet.
The improvements in Växjö’s transport system will positively impact air quality and the acoustic environment, as traffic is one of its main sources of air and noise pollution. In addition, Växjö adopted an action plan against traffic noise for 2015-2020, which includes measures such as using silent asphalt and including noise-related requirements in public tenders.
A total of 13 Swedish cities, communities and regions are involved in the URBACT initiative to support sustainable urban development, through 20 different thematic networks
84. These experiences are now influencing the
83 European Commission, Urban Innovative Actions 84 URBACT, Associated Networks by country
development of the Swedish urban development platform, whose purpose is to improve collaboration, coordination, knowledge sharing, dissemination and exchange of experiences related to sustainable urban development. The platform is an important link between practice and policy at local, regional and national levels. It will also support the regional structural fund programme’s work on sustainable urban development.
Several Horizon 2020 network projects have also contributed to the sustainability of Swedish cities. For example, CIVITAS includes six Swedish municipalities, which represent Sweden in a common effort to make city transport cleaner and better
85.
58 Swedish cities are involved with the EU Covenant of Mayors under the coordination of the Region Örebro county. As of May 2018, Alvesta, Botkyrka, Finspång, Gislaveds, Göteborg, Halmstad, Haninge, Helsingborg, Jokkmokk, Jönköping, Kristianstad, Ljungby, Lund, Malmö, Piteå, Stockholm, Södertälje, Tyresö, Västerås, Växjö and Älmhults have already submitted their 2020 action plans and their results are being monitored. Another eight cities have at least presented their climate action plans and commitments for 2020 or 2030
86.
These urban initiatives and networks should be welcomed and encouraged, as they contribute to a better urban environment. In 2017, 9.7 % of the Swedish population living in cities considered that their residential area was affected by pollution, grime or other environmental problems, down from 10.10 % in 2016 and 12 % in 2015. These figures are significantly lower than the EU-28 levels (20 % in 2017, 18.9 % in 2016 and 19.2 % in 2015)
87.
Figure 19: Proportion of Natura 2000 network in Functional Urban Areas (FUA)
88
85 European Commission, Horizon 2020 Civitas Project. 86 Covenant of Mayors for Climate and Energy, Country signatories. 87 European Commission, Eurostat, Pollution, grime or other environmental problems by degree of urbanisation. 88 European Commission, The 7th Report on Economic, Social and Territorial Cohesion, 2017, p. 121.

Environmental Implementation Review 2019 – Sweden
23
Nature and cities
In Sweden, around 5 % of the Natura 2000 network lies within functional urban areas
89, below the EU average of
15 % (see Figure 19).
Urban sprawl
Sweden had a weighted urban proliferation rate, at 0.42 UPU/m
2 90 in 2009 compared to a European average (EU-
28+4) of 1.64 UPU/m2, having increased by 23 % from
2006 to 200991
.
Traffic congestion and urban mobility
Traffic congestion is not one of the main environmental issues affecting Sweden. However, many subjects addressed in this report, especially air quality and noise, are to some extent related to traffic congestion.
The total number of road vehicles in Sweden has increased to 4.7 million in 2016. This means that the number of vehicles per 1000 inhabitants increased from 470 in 2014 to 474 in 2016.
This slight increase was accompanied by a marginally lower number of hours that the average driver spends in road congestion each year, down from 21.3 hours in 2014 to 21.2 hours in 2016. In this, Sweden scores well below the EU’s worst performer: the UK with 45.1 hours
92.
Road traffic intensity per unit of GDP in Sweden in 2014 was 224 vehicle kilometres per 1000 USD, below the OECD European average of 254 veh.-km/1000 USD
93.
The modal split of passenger transport94
in 2015 shows that, in Sweden, passenger cars accounted for 83.2 % of inland passenger transport (83.4 % in the EU-28), with buses and trolley buses accounting for around 7.3 % (9.1 % in the EU-28) and trains for 9.5 % (7.6 % in the EU-28)
95.
89 European Commission, Definition of Functional Urban Areas. 90 Urban Permeation Units measure the size of the built-up area as well as its degree of dispersion throughout the region. 91 EEA, Urban Sprawl in Europe, Annex I, 2014, pp.4-5. 92 European Commission, Hours spent in road congestion annually. 93 OECD, Road traffic intensity per unit of GDP, 2014 or latest available year », in Sectoral and Economic Trends of Environmental Significance, OECD publications, Paris, 2015. 94 The relation between mode of transport and kilometres travelled (excluding bicycles and other alternative methods). 95 Eurostat, Passenger transport Statistics by modal split.

Environmental Implementation Review 2019 – Sweden
24
Part II: Enabling framework: implementation tools
4. Green taxation, green public procurement, environmental funding and investments
Green taxation and environmentally harmful subsidies
Financial incentives, taxation and other economic instruments are effective and efficient ways to meet environmental policy objectives. The circular economy action plan encourages their use. Environmentally harmful subsidies are monitored in the context of the European Semester and the energy union governance process.
Sweden’s revenue from environment-related taxes remains below the EU average. Environmental taxes accounted for 2.22 % of GDP in 2016 (EU-28 average: 2.44 %) as shown in Figure 20 and energy taxes for 1.75 % of GDP (EU-28 average: 1.88 %)
96. In the same year,
environmental tax revenue accounted for 5.05 % of total revenue from taxes and social security contributions (lower than the EU-28 average of 6.29 %).
The structure of taxation shows that the proportion of revenue from labour tax in total tax revenue was higher than the EU average, with 58.3 % in 2016, while the implicit tax burden on labour was 40.2 %
97. Consumption
taxes remained relatively low (at 27.5 %, in 23rd place in the EU-28), showing considerable potential for shifting taxes from labour to consumption and in particular to the environment.
In the European Semester, the Commission has repeatedly seen that revenue from environmental taxes in Sweden has fallen and is relatively low, compared to in other Member States. In Sweden’s 2018 Country Report, it was said that that reduction had been partially due to the intended behavioural impact of the taxes and that there had been a focus on removing or limiting exemptions and reductions in tax rates for carbon and energy, which should help increase environmental revenues
98.
There are nevertheless numerous cases showing the use of sound fiscal measures to protect the environment. Good examples are the NOx-charge and the SO2 tax,
96 Eurostat, Environmental tax revenues, 2018. 97 European Commission, Taxation Trends Report, 2017. 98 European Commission, European Semester Country Report 2018, p. 17.
which led to the reduction of these air pollutants99
. Also, a tax on chemicals in certain electronics was introduced in 2017, as was a tax on air travel and a system of indexation of environmental taxes (tax on air travel and chemical tax with Consumer Price Index, natural gas tax and waste tax with CPI + 2 %).
Figure 20: Environmental tax revenues as % of GDP (2017)
100
This 2019 EIR suggests that the tax system can be used for environmental policy while also generating revenue. For example:
Economic instruments, such as taxes or charges, can be used to promote waste prevention, make reuse and recycling more economically attractive and shift reusable and recyclable waste away from incineration (see Chapter 1 on waste management).
Further alignment and equal treatment of transport fuels (for example, diesel) would lead to
99 Institute for European Environmental Policy, Case Studies on Environmental Fiscal Reform, Air taxes in Sweden. 100 Eurostat, Environmental tax revenues, 2018.

Environmental Implementation Review 2019 – Sweden
25
environmental improvements and incentives to reduce nitrogen dioxide pollution (see Chapter 3 on air quality).
Meanwhile, fossil fuel subsidies decreased in the past decade and almost disappeared by 2016. Tax exemptions, although decreased in importance, remained in place in 2016 for fossil fuel use in for example motor vehicles, domestic shipping and aviation, Combined Heat and Power plants, mining, industry, agriculture, forestry and aquaculture, heating. These exceptions added up to SEK 16 billion in 2016
101.
Substantial progress has been made on reducing the ‘diesel differential’ (difference in the price of diesel versus petrol) since 2005. In 2016, there was a 13 % gap between petrol and diesel tax rates, while in 2005 it was 36 %
102. Excise tax rates levied on petrol and diesel in
2016 at SEK 6.31 per litre for petrol and SEK 5.56 for diesel were higher than in 2015
103.
CO2-based motor vehicle taxes are in place in Sweden. The annual circulation tax is based on emissions. A new bonus-malus system for incentives and taxation of light vehicles was introduced as of 1 July 2018
104.
Incentives to encourage purchase of cars with lower CO2 emissions have been in place since 2011
105, linked to
annual circulation taxes and subsidies, as well as to the acquisition of cleaner vehicles. Emissions of new vehicles purchased in Sweden are higher than the average in the EU, with CO2 emissions of 123.1 grams per kilometre (the EU average was at 118 grams in 2016)
106.
The use of alternative fuels in new passenger cars sold in Sweden has considerably increased over the past few years. In 2016, the proportion of new passenger cars using alternative fuels was twice that in 2013
107. In public
transport, the use of alternative fuels is also encouraged, though the most common alternative fuel is biodiesel. Sweden is one of the few EU countries with more than 5 % of new cars using alternative fuels.
101 OECD, Inventory of Support Measures for Fossil Fuels, 2018. 102 European Environment Agency 2017, Environmental taxation and EU environmental policies, p. 27. 103 European Commission, Taxes in Europe Database, 2018. 104 ACEA, CO2 based motor vehicle taxes in Europe. 105See Förordning (2011:1590) om supermiljöbilspremie and Vägtrafikskattelag Section 11(a) (2006:227). 106 European Environment Agency, Average CO2 emissions from new passenger cars sold in EU-28 Member States plus Norway, Iceland and Switzerland in 2016 . 107 European Commission, Transport in the European Union Current Trends and Issues, 2018, pp.27-28.
Green public procurement
The EU green public procurement policies encourage Member States to take further steps to apply green procurement criteria to at least 50 % of public tenders. The European Commission is helping to increase the use of public procurement as a strategic tool to support environmental protection.
The purchasing power of public procurement amounts to around EUR 1.8 trillion in the EU (approximately 14% of GDP). A substantial proportion of this money goes to sectors with a high environmental impact such as construction or transport. Therefore, green public procurement (GPP) can help to significantly lower the negative impact of public spending on the environment and can help support sustainable innovative businesses. The Commission has proposed EU GPP criteria
108.
Sweden is one of the EU’s forerunners in green public procurement. The government endorsed a national strategy on public procurement, including green public procurement, in 2016. Green public procurement criteria are developed at the national level for construction and real estate, cleaning and chemicals, vehicles and transportation, office and textiles, electricity and lighting, food, health and care, services, and toxic free childcare.
Since 2013, green and sustainable public procurement have been at the forefront of government initiatives to strengthen public procurement. To this end, the budget dedicated to actions that support green public procurement was increased.
In 2016, the Swedish National Agency for Public Procurement (UHM) was founded. The agency has an overall responsibility for developing and supporting the procurement carried out by contracting authorities and entities. Sweden has adopted a voluntary approach to green public procurement and the UHM’s criteria library supports efforts by providing a comprehensive database of sustainability standards. With the help of an online wizard, contracting authorities are guided through the different environmental criteria available for a number of products. The wizard allows the selection of three levels of criteria: basic, advanced and frontrunner.
In addition to the ready-to-use criteria, contracting authorities are able to ‘design’ their own green public procurement criteria with the support available on the UHM website. These self-designed criteria consist predominantly of eco-labels and environmental
108 In the Communication ‘Public procurement for a better environment’ (COM (2008) 400) the Commission recommended the creation of a process for setting common GPP criteria. The basic concept of GPP relies on having clear, verifiable, justifiable and ambitious environmental criteria for products and services, based on a life-cycle approach and scientific evidence base.

Environmental Implementation Review 2019 – Sweden
26
management systems109
.
According to a green public procurement monitoring survey, carried out by the Swedish Environmental Protection Agency in 2013, 53 % of organisations have internal environmental objectives and/or internal green public procurement policies. Where internal environmental objectives are set up, they are monitored in 56 % of cases. The survey showed that environmental requirements are applied by respondents in the following sectors: transportation: 74 %, energy: 69 %, IT equipment: 66 %, food products: 58 %, and construction: 52 %
110.
A European Parliament study shows that Sweden is a frontrunner in implementing the green public procurement national action plan
111.
Environmental funding and investments
European Structural and Investment Fund (ESIF) rules oblige Member States to promote environment and climate in their funding strategies and programmes for economic, social and territorial cohesion, rural development and maritime policy.
Achieving sustainability involves mobilising public and private financing sources112. Use of the European Structural and Investment Funds (ESIFs)
113 is essential if
countries are to achieve their environmental goals and integrate these into other policy areas. Other instruments such as Horizon 2020, the LIFE programme
114
and the European Fund for Strategic Investments (EFSI)115
may also support the implementation and spread of good practices.
According to the 2017 Special Eurobarometer116
on attitudes of EU citizens towards the environment, 94 % of Swedish citizens support greater EU investment in environmental protection in general (with the EU-28 average being 85 %).
109 PwC, 2015. Strategic use of public procurement in promoting green, social and innovative policies, study for the European Commission. 110 PwC, 2015. Strategic use of public procurement in promoting green, social and innovative policies, study for the European Commission. 111 European Parliament, Green Public Procurement and the Action Plan for the Circular Economy, 2017, pp. 79-80. 112 See, for example, Action plan on financing sustainable growth (COM(2018) 97). 113 i.e. the European Regional Development Fund (ERDF), the Cohesion Fund (CF), the European Social Fund (ESF), the European Agricultural Fund for Rural Development (EAFRD) and the European Maritime and Fisheries Fund (EMFF). The ERDF, the CF and the ESF are referred to as the ‘cohesion policy funds’. 114 European Commission, LIFE programme. 115 European Investment Bank, European Fund for Strategic Investments, 2016. 116 European Commission, 2017, Special 468 Eurobarometer, ‘Attitudes of European citizens towards the environment’.
European Structural and Investment Funds 2014-2020
Cohesion policy
In 2014-2020, Sweden manages 11 operational programmes under the EU’s cohesion policy. Of these, eight regional and one national programme will receive funding from the European Regional Development Fund (ERDF), one national programme will receive funding from the ERDF and one programme will receive funding from the European Social Fund (ESF). In addition, there will be one national multi-fund operational programme on community-led local development, financed by the ERDF and the ESF.
Figure 21: ESIF 2014-2020 - EU allocation by theme, Sweden (EUR billion)
117
For 2014-2020, Sweden has been allocated a total of around EUR 2.1 billion (in current prices) for cohesion policy:
EUR 1.51 billion is allocated to more developed regions (all);
EUR 207 million is allocated to the Northern sparsely populated areas (Övre Norrland and Mellersta Norrland);
EUR 342.3 million is allocated for European territorial cooperation;
117 European Commission, European Structural and Investment Funds Data By Country.
Sweden has been allocated EUR 3.65 billion from ESIF over 2014-2020, through 13 national and regional programmes. With a national contribution of EUR 4.33 billion, Sweden has a total budget of EUR 7.98 billion to be invested in various areas, from smart specialisation to employment and the preservation of ecosystems and aquaculture.

Environmental Implementation Review 2019 – Sweden
27
EUR 44.2 million is allocated to Norra Mellansverige, Östra Mellansverige and Skåne-Blekinge for the youth employment Initiative.
The multi-fund programme for community-led local development will be supported with EUR 8.5 million from the ERDF and EUR 8.3 million from the ESF.
The ESF has allocated a minimum of EUR 730 million to Sweden. The actual amount will be set in light of the specific challenges the country needs to address in the areas covered by the ESF.
Rural development
The rural development programme (RDP) for Sweden outlines the country’s priorities for using nearly EUR 4.3 billion of public money that is available for the 7-year period from 2014 to 2020. This includes EUR 1.8 billion from the EU budget, including EUR 18 million transferred from the 2014-2015 budget for common agricultural policy (CAP) direct payments, and EUR 2.5 billion of national co-funding, plus EUR 2.9 million of additional national funding top-ups.
The RDP for Sweden focuses on restoring, preserving and improving ecosystems related to agriculture and forestry. More than 28 % of agricultural land will come under contracts for biodiversity and around 33 % for better water management.
European Maritime and Fisheries Fund (EMFF)
Sweden’s investment package for its maritime, fisheries and aquaculture sectors amounts to EUR 172.9 million, including EUR 120.2 million of EU funding.
One of the Swedish programme’s main objectives is to facilitate implementation of the discard ban. Support from the EMFF will therefore boost investments aimed at reducing and handling bycatches. Measures related to the protection and restoration of marine biodiversity will also receive significant support.
The EMFF supports initiatives run by local groups to promote sustainable fisheries and aquaculture as well as economic growth and job-creation. Projects financed by
the EMFF typically involve the marketing of fisheries products (local products and shorter distribution circuits) and the diversification of fisheries businesses (coastal tourism and restaurants).
Horizon 2020
Sweden has benefited from Horizon 2020 funding since the programme started in 2014. As of January 2019, 991 participants have been granted a maximum amount of EUR 376 million for projects from the Societal Challenges work programmes dealing with environmental issues
118 119
.
In addition to the abovementioned work programmes, climate and biodiversity expenditure is present across the entire Horizon 2020. In Sweden, projects accepted for funding in all Horizon 2020 working programmes until December 2018 included EUR 352 million destined to climate action (26.1 % of the total Horizon 2020 contribution to the country) and EUR 44 million for biodiversity-related actions (3.3 % of the Horizon 2020 contribution to the country)
120.
LIFE programme
The LIFE programme is the EU’s funding instrument for the environment and climate action. Since 1992, when the LIFE programme was launched, a total of 144 projects have been co-financed in Sweden
121. Altogether, they
represent a total investment of EUR 455 million, of which EUR 196 million has been provided by the EU. Of the projects funded, 77 have focused on environmental innovation (under the ‘resource efficiency priority’ of LIFE Environment), 57 on nature conservation and three on
information and communication.
European Investment Bank (EIB)
EIB loans in Sweden amounted to nearly EUR 10.4 billion in 2013-2017
122. In 2018 alone, the EIB Group (the
European Investment Bank and the European Investment Fund)
123 loaned Swedish businesses and public
institutions EUR 1.6 billion, as shown in Figure 20. Of this, EUR 432 million (27 %) went directly to environmental projects.
118 European Commission own calculations based on CORDA (COmmon Research DAta Warehouse). A maximum grant amount is the maximum grant amount decided by the Commission. It normally corresponds to the requested grant, but it may be lower. 119 i.e. (ii) Food security, sustainable agriculture and forestry, marine and maritime and inland water research and the bioeconomy; (iii) Secure, clean and efficient energy; (iv) Smart, green and integrated transport; and (v) Climate action, environment, resource efficiency and raw materials. 120 European Commission own calculations based on CORDA (COmmon Research DAta Warehouse). 121 European Commission, LIFE in Sweden, 2017. 122 Missing. 123 The EIB Group includes EIB and EFSI investments and loans.

Environmental Implementation Review 2019 – Sweden
28
Figure 22: EIB loans to Sweden in 2018124
European Fund for Strategic Investments
The European Fund for Strategic Investments (EFSI) addresses the current investment gap in the EU. As of January 2019, it has mobilised more than EUR 2.7 billion in Sweden, and the secondary investment triggered by these funds is expected to be EUR 10.6 billion
125.
National environmental financing
Sweden spent EUR 1 419.7 billion on environmental protection in 2016, an increase of 9 % from 2015
126.
53.6 % of these payments were allocated to waste management activities (the average in the EU is 49.7 %). EUR 56.5 million were allocated to pollution abatement (3.9 % of total) and 14.3)
127. Between 2012 and 2016, the
general government funding for environmental protection added up to EUR 6 940 billion
128.
In addition to EU funding, the Swedish Government provides state funding for green infrastructure via the EPA, the County Administrative Boards and different foundations that manage national parks and other protected areas. In 2016 alone, approximately SEK 400 million (c. EUR 42 million) was granted, some 35 % of which was allocated to nature maintenance and restoration, in particular of pastures and meadows.
As it has been mentioned in the report, one of the challenges for Sweden is to ensure that environmental financing remains at an adequate level. Existent financial gaps in nature protection are delaying the correct implementation of EU environmental law and policies. Therefore, ensuring financial resources to reduce the implementation gap should be considered as a priority for the country.
2019 priority action
Take advantage of the funding possibilities for Natura 2000 under the next Multiannual Financial
124 EIB, Sweden and the EIB, 2018. 125 European Investment Bank, EFSI project map. 126 Eurostat, General Government Expenditure by function, 2018. 127 No data is available on the funds used for waste water management. 128 Eurostat, General Government Expenditure by function, 2018.
Framework, including in relation to preventive measures against potential damage caused by protected species and the promotion of coexistence.

Environmental Implementation Review 2019 – Sweden
29
5. Strengthening environmental governance
Information, public participation and access to justice
Citizens can more effectively protect the environment if they can rely on the three ‘pillars’ of the Aarhus Convention: (i) access to information; (ii) public participation in decision making; and (iii) access to justice in environmental matters. It is of crucial importance to public authorities, the public and business that environmental information is shared efficiently and effectively
129. Public participation allows
authorities to make decisions that take public concerns into account. Access to justice is a set of guarantees that allows citizens and NGOs to use national courts to protect the environment
130. It includes the right to bring
legal challenges (‘legal standing’)131
.
Environmental information
Sweden has a partly centralized system for the dissemination of environmental data. The portal of the Swedish Environmental Protection Agency
132 is
comprehensive and offers a pleasant user experience. It includes many useful information on different environmental domains. The Environmental Data Portal
133, also governed by the EPA, plays an important
role as well. The Swedish INSPIRE portal seems to have no link to the EPA’s portals.
Sweden’s performance on implementing the INSPIRE Directive is good. It has been reviewed based on Sweden’s 2016 implementation report
134 and its most
recent monitoring data from 2017135
. However, additional efforts are needed to further improve data accessibility through services, to improve the conditions for data reuse and to prioritise environmental datasets in implementation, in particular those identified as high-
129 The Aarhus Convention, the Access to Environmental Information Directive 2003/4/EC and the INSPIRE Directive 2007/2/EC together create a legal foundation for the sharing of environmental information between public authorities and with the public. This EIR focuses on INSPIRE. 130 The guarantees are explained in Commission Notice on access to justice in environmental matters, OJL 275, 18.8.2017 and a related Citizen’s Guide. 131 This EIR looks at how well Member States explain access to justice rights to the public, and at legal standing and other major barriers to bringing cases on nature and air pollution. 132 Naturvardsverket: Swedish Environmental Protection Agency 133 Miljödataportalen 134 INSPIRE SE country sheet 2017. 135 INSPIRE monitoring dashboard.
value spatial data sets for the implementation of environmental legislation
136.
Figure 23: Access to spatial data through view and download services in Sweden (2017)
Public participation
In Sweden, public participation is guaranteed in the Swedish Environment Code (1998:08) since quite some time. In particular, Chapter 6 sets out the rules on participation in the environmental assessment of projects, plans and programmes in Sweden and across borders
137. Several sectoral provisions also exist.
Overall, according to a recent EUPACK study, Sweden makes possible strong public participation in decision-making
138. Society is active, which is shown by the fact
that around 80 % of the adult population are members of an association and 48 % state that they volunteer in an NGO. There is also a whole range of new forms of participation, both practised and recognised, including more informal networks and groups, as well as donor activism
139. Moreover, the Swedish environment
movement is seen as a movement that has managed to push environmental questions to the top of the political agenda without large resources
140.
The 2017 Eurobarometer141
shows that, in Sweden, there is very strong agreement (96 % of respondents) that an
136 European Commission, List of high value spatial data sets. 137 Swedish Environment Code. 138 European Commission, EUPACK study. 139 Framtidens civilsamhälle. 140the Swedish environment movement, p. 368. 141 European Commission, 2017, Special 468 Eurobarometer, ‘Attitudes of European citizens towards the environment’.

Environmental Implementation Review 2019 – Sweden
30
individual can play a role in protecting the environment; this has remained unchanged since 2014.
Access to justice
More progress is needed when it comes to informing the general public about effective remedies for individuals and environmental associations to access justice in environmental matters under Swedish and EU law. Even if Swedish Environmental Protection Agency (SEPA) has an updated and user-friendly website about laws and ordinances relevant to environmental questions as well as procedures and costs, it lacks clear information on how to proceed if a person should want to appeal a decision, or what options a member of the public has in terms of access to justice on environmental matters. Most of the practical implementation of decisions happens at regional and local level and thus some of the information is provided through the websites of the 21 County Administrative Boards (CABs) and the 290 local authorities, but this varies greatly. Structured and user-friendly information should be available online, and this should be ensured by public authorities, at central or local level.
For administrative procedures, the Administrative Procedure Act
142 states that individuals that have a direct
concern or private interest in a particular matter can be seen as concerned parties. The notion of direct concern or private interest is interpreted broadly by the administration
In judicial procedures, the Environmental Code generally interprets the notion of concerned parties in the same way as the Administrative Procedure Act, thus individuals seen as concerned parties have legal standing. NGOs have a legal standing under the Environmental Code on procedures relating to permit matters, revocation of nature conservation, shoreline protection cases and administrative decisions concerning environmental liability. However, not all projects (such as forestry or mining) fall under the Environmental Code.
142 The Swedish Administrative Procedure Act.
As regards air quality plans, there are existing cases where citizens and NGOs have had legal standing on issues relating to them, but not specifically relating to the absence of an air quality plan. Therefore, it remains unclear whether individuals and NGOs have legal standing in all cases.
There are no fees for appeals of decisions on permits, participation or the release of environmental information. The ‘loser pays’ principle does not apply in judicial procedures. Moreover, no court, expert or witness fees are envisaged for these. It is not mandatory to have a lawyer, but if a party decides to hire one they must pay the cost themselves.
2019 priority actions
Improve access to spatial data and services by making stronger linkages between the country INSPIRE portals , identify and document all spatial datasets required to implement environmental law, and make the data and documentation at least accessible 'as is' to other public authorities and the public through the digital services envisaged in the INSPIRE Directive.
Better inform the public about their access to justice rights, notably in relation to air pollution and nature.
Compliance assurance
Environmental compliance assurance covers all the work undertaken by public authorities to ensure that industries, farmers and others fulfil their obligations to protect water, air and nature, and manage waste
143. It
includes support measures provided by the authorities, such as: (i) compliance promotion
144;
(ii) inspections and other checks that they carry out, i.e. compliance monitoring
145; and
(iii) the steps that they take to stop breaches, impose sanctions and require damage to be remedied, i.e. enforcement
146.
Citizen science and complaints enable authorities to focus their efforts better. Environmental liability
147
ensures that the polluter pays to remedy any damage.
143 The concept is explained in detail in the Communication on ‘EU actions to improve environmental compliance and governance’ COM(2018)10 and the related Commission Staff Working Document, SWD(2018)10. 144 This EIR focuses on the help given to farmers to comply with nature and nitrates legislation. 145 This EIR focuses on inspections of major industrial installations. 146This EIR focuses on the availability of enforcement data and co-ordination between authorities to tackle environmental crime. 147 The Environmental Liability Directive 2004/35/EC, creates the framework.

Environmental Implementation Review 2019 – Sweden
31
Compliance promotion and monitoring
The quality of online information to farmers on how to comply with obligations on nitrates and nature is an indicator of how actively authorities promote compliance in subject-areas with serious implementation gaps. In Sweden, the Board of Agriculture (Jordbruksverket) provides easily available and clear guidance for farmers on fertiliser use and storage, modalities for economic compensation for the actions, and the controls required
148.
For landowners of Natura 2000 sites, there is general Natura 2000 information on the SEPA website
149. This
information is mainly aimed at the CABs and local authorities. In addition, there is also a handbook on Natura 2000 areas, with includes information for example on how to classify areas, how they should be managed, and how environmental impact assessments related to Natura 2000 sites should be carried out.
Major industrial installations can present serious pollution risks. Public authorities are required to have plans to inspect these installations and to make individual inspection reports available to the public
150.
The SEPA website provides statistical information related to industrial inspections. SEPA also publishes an annual activity report which is based on reports from the CABs and local authorities and includes information on the number of industrial inspections and self-monitoring activities carried out by operators. However, these reports do not include details of individual cases nor of identified non-compliance. No public inspection plans or individual inspection reports were found on Sweden’s official websites.
In Sweden, satellite data is used to monitor logging of protected forests
151, and drones are used to deter and
detect illegal waste shipping152
. Networks are set up to coordinate environmental inspections in a number of regions and all relevant information relating to these is accessible on the environmental cooperation website (Miljösamverkan)
153.
Citizen science and complaint handling
Engagement of citizens, including through citizen science, can deepen knowledge about the environment and help the authorities in their work. In Sweden, the government uses statistics from civil society, e.g. bird and deer counts produced by affiliated organisations
154. In the specific
148 The Swedish Board of Agriculture, guidance. 149 SEPA, Natura 2000 website. 150 Article 23, Industrial Emissions Directive, 2010/75/EU. 151 Kingdom of Sweden, Budget proposition,2016 . 152 IMPEL, Drones, court cases and data visualisation. 153Miljösamverkan, environmental cooperation website. 154Statistic Sweden, publication, p. 47.
case of introduced and invasive species, citizen observation is used in order to get a better picture of the situation
155. In addition to this, there are a number of
specific observation databases and apps which feed into monitoring, such as a species portal
156 or the Skandobs,
app on predator observation157
. However, there is no clear information on the extent to which this information is used to ensure compliance.
The availability of clear online information about how to make a complaint is an indicator of how responsive authorities are to complaints from the public. In Sweden, there is easily accessible information on how citizens can report environmental crimes or crimes related to nature to the police and the CABs
158. The police website also
includes a specific section on environmental crimes and how to report them
159. Most complaints on
environmental nuisance and damage should be submitted to the competent local authority as this is the responsible entity. The level of accessible information varies depending on the municipality.
The SEPA website has a section where maladministration can be reported, including a form for whistle-blowers
160.
Enforcement
When monitoring identifies problems, a range of responses may be appropriate. The SEPA annual report on environmental inspections published in 2018 highlights the need for a better follow up from the relevant authorities in relation to identified cases of non-compliance; it also states that better coordination and information exchange are needed between the authorities working with environmental inspections
161.
SEPA has a database that provides information on court cases and trials relating to a wide range of environmental topics
162. The Land and Environment Court of Appeal also
runs an open database of cases163
.
Information on follow-up to detected cross-compliance breaches is not available
164.
Tackling waste, wildlife crimes and other environmental offences is especially challenging. It requires close cooperation between inspectors, customs authorities, police and prosecutors. To combat environmental crime
155Swedish University of Agricultural Sciences, campaign. 156 Artportalen. 157 SEPA, app on predator observation. 158 SEPA, information on how to report environmental crimes. 159 Swedish police website. 160 SEPA, form for reporting maladministration. 161 SEPA, Annual report on environmental inspections, 2018. 162 SEPA, database on environmental court cases. 163 The Land and Environment Court of Appeal , open database. 164 The information available on the website of the Board of Agriculture includes explanations about cross compliance and what happens in case a breach is detected, but no statistics are available

Environmental Implementation Review 2019 – Sweden
32
in general, there are cooperation mechanisms set up between the Swedish Police (Polisen), SEPA, customs authorities (Tullverket)
165, the Agriculture Agency, the
Swedish Coast Guard (Kustbevakningen)166
and the Swedish Chemicals Inspection. Specific information on cooperation related to wildlife crimes is available. The Swedish Agriculture Agency, as Sweden's administrative CITES authority, convenes the National Operational CITES Group
167, which offers a cooperation forum where
individual current cases and selected phenomena regarding (CITES-related) nature conservation violations can be discussed and further measures planned
168.
Environmental liability
The Environmental Liability Directive (ELD) establishes a framework based on the ‘polluter pays’ principle to prevent and remedy environmental damage. The 2017 EIR focused on gathering better information on environmental damage, on financial security and guidance. The Commission is still collecting evidence on the progress made.
2019 priority actions
Better inform the public about compliance promotion, monitoring and enforcement. At a minimum this should involve providing more online information on inspection plans and reports on industrial inspections.
Publish information on the follow-up to detected cross-compliance breaches on nitrates and nature.
Ensure more information is available on how professionals dealing with environmental crime work together.
Improve financial security for liabilities and ELD-guidance and publish information on environmental damage.
Effectiveness of environmental administrations
Those involved in implementing environmental legislation at EU, national, regional and local levels need to have the knowledge, tools and capacity to ensure that the legislation and the governance of the enforcement process bring about the intended benefits.
Administrative capacity and quality
Central, regional and local administrations must have the ability to carry out their own tasks and work effectively
165 Swedish Customs authorities. 166 Swedish Coast Guard. 167 The group consists of representatives from CAB, SEPA, SWAM, Coast Guard, Customs, Police Office (NOA's Art Protection Crime Group) and Prosecutor's Office (REMA). 168The Swedish Agency for Agriculture, Report 2016:02, Reinforce measures against species protection offenses.
with each other, within a system of multi-level governance.
In order to ensure effective environmental governance, environmental authorities have to employ staff with the appropriate administrative and technical knowledge and skills. With the 2017 EIR, the Commission introduced TAIEX-EIR peer-to-peer (P2P) as a new instrument that facilitates peer learning between experts from Member States’ environmental authorities.
Sweden shared its expertise on two particular occasions:
The city of Växjö participated in a TAIEX-EIR P2P workshop in Galway, Ireland on 21–22 February 2018; cities participating in the Green Leaf Network, from Spain, Ireland, Belgium, Portugal and Sweden, worked together and shared best practices in waste management and the green economy in urban areas.
A TAIEX-EIR P2P workshop on 10–11 September 2018 in Graz, Austria brought together environmental authorities, regions and cities from Austria, Croatia, Estonia, Germany, Hungary, Italy, Lithuania, Poland, Romania, Slovak Republic, Spain and Sweden. Participants exchanged experiences and good practices in reducing air pollution and improving the effectiveness of air quality plans in zones and agglomerations where the levels of pollutants in ambient air exceeded limit or target values.
Coordination and integration
As mentioned in the 2017 EIR, the transposition of the revised Environmental Impact Assessment (EIA) Directive into national law provides an opportunity for countries to streamline their regulatory framework on environmental assessments. Despite a delay, Sweden has now transposed the revised Directive.
The Commission encourages the streamlining of environmental assessments to reduce duplication and avoid overlaps in environmental assessments for projects. Streamlining helps to reduce unnecessary administrative burden. It also accelerates decision making, without compromising the quality of the environmental assessment procedure
169. Sweden has
introduced the streamlining of environmental assessments under the EIA Directive and the Habitats and Water Framework Directives.
169 The Commission issued a guidance document in 2016 regarding the setting up of coordinated and/or joint procedures that are simultaneously subject to assessments under the EIA Directive, Habitats Directive, Water Framework Directive, and the Industrial Emissions Directive, OJ C 273, 27.7.2016, p. 1. .

Environmental Implementation Review 2019 – Sweden
33
Adaptability, reform dynamics and innovation (eGovernment)
On digital public services, Sweden performs well. The country is a frontrunner in the delivery of digital public services among EU countries, ranked fifth in the EU with a score of 70.8/100 based on Europe's Digital Progress Report 2018, well above the EU28 average (57.5/100)
170.
Digital public services are well developed in Sweden on both the demand and supply sides. A challenge to further development and uptake is the decentralised public administration. Moreover, Sweden continues to lag behind when it comes to open data even with a marked improvement based on Europe's Digital Progress Report 2018 to 65/100 compared to the previous year’s score of 44/100
171.
In the DESI Report 2018, Sweden had a score of 70 out of 100 on digital public services, higher than the EU average of 58
172.
Enabling financing and effective use of funds
The Swedish authorities, at national and regional level, have extensive experience in the management of EU funding and no major problems arise in this respect.
2019 priority action
Sweden can further improve its overall environmental governance (such as transparency, citizen engagement, compliance and enforcement, as well as administrative capacity and coordination).
International agreements
The EU Treaties require the EU environmental policy to promote measures at international level to deal with regional or worldwide environmental problems.
The EU is committed to strengthening environmental law and its implementation globally. It therefore continues to support the Global Pact for the Environment process, which was launched by the United Nations General Assembly in May 2018
173. The EIR is one of the tools to
ensure that the Member States set a good example by respecting European Union environmental policies and laws and international agreements. Sweden has signed and ratified almost all multilateral environmental agreements. It has signed but not yet ratified the Nagoya Protocol.
170 European Commission, Europe's Digital Progress Report (EDPR) 2018 Country Profile Sweden, p. 10. 171 European Commission, Europe's Digital Progress Report (EDPR) 2018 Country Profile Sweden, p. 10/11. 172 European Commission, Digital Economy and Society Index Report 2018, Digital Public Services. 173 UN General Assembly Resolution 72/277 and Organizational session of the ad hoc open-ended working group.
Forests: EU Timber Regulation (EUTR)174
/ Forest Law Enforcement, Governance and Trade (FLEGT) Regulation
175
In accordance with the EUTR, which prohibits the placing on the EU market of illegally harvested timber, competent authorities in EU Member States must conduct regular checks on operators and traders, and apply penalties in cases of non-compliance.
Between March 2015 and February 2017, Sweden carried out all 14 planned checks on operators of domestic timber, and all 71 planned checks on operators importing timber. These numbers remain low compared to the estimated number of operators whose first placement of timber on the EU market is in Sweden
176. Sweden has
taken several enforcement actions against operators who infringed the due diligence requirement and prohibition; however, no penalties have been imposed so far.
With regard to cooperation (Article 12 EUTR), Sweden reported working with various institutions and other EU competent authorities, mainly through participation in meetings of the FLEGT/EUTR expert group and the ad hoc expert group on FLEGT. Sweden also provided training to delegates of non-EU countries, notably to the State Forest Agency of China and to Norwegian operators.
Genetic resources: Nagoya Protocol on Access to Genetic Resources and the Fair and Equitable Sharing of Benefits Arising (ABS)
177
In accordance with the EU ABS Regulation, which transposes into EU law the required compliance measures under the Nagoya Protocol, Sweden has designated competent authorities and imposed sanctions for infringements of the Regulation. No due diligence declaration was submitted so far and no penalties have been applied. Sweden has submitted its first report on implementation of the EU ABS Regulation to the Commission (end 2017).
International wildlife trade: the Convention on International Trade in Endangered Species of Wild Fauna and Flora (CITES)
178
Under the Basic Regulation (Reg. 338/97), which transposes the major obligations stemming from the Convention on International Trade in Endangered Species of Wild Fauna and Flora (CITES) into EU law, Sweden has set up the required national authorities and processes
174 Regulation (EU) No 995/2010. 175 Regulation (EC) No 2173/2005. 176 Based on customs’ data, it was estimated that 100 Swedish operators placed domestic timber on the EU market for the first time and 4’500 imported timber. 177 Regulation (EU) No 511/2014. 178 The Convention on International Trade in Endangered Species of Wild Fauna and Flora (CITES).

Environmental Implementation Review 2019 – Sweden
34
(requests for) import, (re-) export and intra-EU trade documents on a regular basis.
Reports on seizures of illegal shipments, in particular those reported every six months to TRAFFIC under its contract with the Commission, and those exchanged through the EU-TWIX platform, show that Sweden’s customs authorities are active in this area.
To ensure full implementation of the EU Wildlife Action Plan (2016), Sweden provides its enforcement agencies, e.g. custom officers, with specific training to develop knowledge of EU wildlife regulations.
Sustainable development and the implementation of the UN SDGs
Sustainable development links environmental, social and economic policies in a coherent framework and therefore helps to implement environmental legislation and policies.
All environmental policy and governance in Sweden is guided by environmental quality objectives, which span all administrative sectors. There is funding allocated to their implementation.
All Swedish ministries have instructions to mainstream the SDGs into their specific areas. The government has also asked agencies and the CABs to start work on implementing the SDGs. A delegation for Agenda 2030 has been appointed, with one of the tasks being to propose a national action plan for Agenda 2030. It shared a first draft in May 2017, but a final version has not been approved yet. In line with the draft action plan submitted, current work is focused on mapping the overlaps between existing national decisions and Agenda 2030.
The delegation for Agenda 2030 is also working on spreading knowledge about the SDGs and informing the public about SDG related work.
A Nordic Council working group has prepared a report on the most relevant SDGs and how they are implemented in the Nordic countries
179.
Sweden submitted its National Voluntary Review on the implementation of the SDGs to the UN in 2017.
179 Nordic Council working group, report.