the epa manual for waste minimization audits - draftinfohouse.p2ric.org/ref/32/31702.pdf · n the...
TRANSCRIPT

United States Office of Research and Development EPA ###-XX-##-### Environmental Protection Hazardous Waste Engineering August 1987
CincinnafiXJFl45268 ~
~~ ~ ~~
- 1 Agency Research Laboratory
The EPA Manual for Waste Minimization Audits
I 1
n
n
The EPA Manual for Waste Minimization Audits
Gregory A. Lorton, Carl H. Fromm, Michael P. Meltzer, Michael S. Callahan, and Srinivas Budaraju
Jacobs Engineering Group Hazardous and Toxic Materials Division
251 S. Lake Avenue Pasadena, CA 91 101
Submitted to
Harry M. Freeman Research Program Manager
Hazardous Waste Engineering Research Laboratory Office of Research and Development
U. S. Environmental Protection Agency Cincinnati, OH 45268
August 14, 1987

1
1 1. 1 2. I 3. 1 4.
5. 11
6. 3 3 7.
Introduction
Waste Minimization Audit Overviews
WM Audit Program Planning and Organization
WM Audit Preparation and Information Gathering
Waste Minimization Auditing
Feasibility Analysis
Implementing Waste M ini mizati on Options
n Appendices
A. WM Audit Program Worksheets 6. Waste Minimizatiw Techniques C, State TechnicallFinancial Assistance Programs 0. Economic Evaluation Example
3 1
- * ~ ~ ~ . * ~ ~ ~
paqe
1
3
11
22
30
41
51
A- 1
B- 1 c- 1 D- 1

Waste minimization (WM) is a policy specifically mandated by the U.S. Congress in i t s
Hazardous and Solid Waste Amendments of 1984 t o the Resource Conservation and
Recovery A c t (RCRA) of 1976. These Amendments state that:
"The Congress hereby declares it t o be the national policy of the
Uni ted States that, wherever feasible, the generation of hazardous waste is
t o be reduced or eliminated as expeditiously as possible. Waste that i s
nevertheless generated should be treated, stored or disposed of so as t o
minimize the present and fu ture threat t o human health and the environ-
ment" (RCRA 1003(b), PL 98 -616).
This mandate, coupled w i th other RCRA provisions that have led t o unprecedented
increases in costs o f waste management, have heightened general interest in waste
minimization. A strong contributing factor has been a desire, on the par t of
generators, t o reduce their environmental impairment l iabi l i t ies under the provisions
o f the Comprehensive Environmental Response, Compensation and Liabi l i t ies A c t
(CERCLA or "Superfund").
In i t s e f fo r t to assist waste generators t o meet current demands t o reduce waste, the
EPA has sponsored the preparation of th is guide. The guide is intended t o provide
basic information t o individuals interested in developing a waste minimization audit
program in their firm. This includes activi t ies such as conducting waste reduction
audits, implementing W M measures, and assessing their progress.
The guide is t o be used as a source of concepts and ideas. It begins wi th a br ie f
definit ion of waste minimization and related terms. Next, incentives for WM are
described and a br ie f discussion of economic considerations is provided. Five phases of
a W M audit program are outl ined in this manual: planning and organization;
information gathering; waste minimization audits; feasibil i ty analysis; and program
implement a t i on.
Throughout the manual the terms "company1', "firm", and "corporationrr are used. It
should be recognized tha t this mater ia l is applicable in large part t o other
1
organizations, such as government agencies and non-profit organizations. Similarly, although most of t h e material is aimed a t manufacturing facilities, much of t h e
material is applicable t o other segments o f industry, government, or business.
~ - _ - _ - ~ _ _ _ - - ~ - ~ - - ~
1 The manual has been prepared for t h e people responsible for planning, managing, and
implementing waste minimization activities at t h e plant and corporate levels. The manual concentrates mainly on waste minimization audit procedures that mot iva te people t o search, sc reen and put into practice measures involving administrative, material , or technology changes tha t result in decreased waste generation. A partial ca ta log and brief discussion of these measures is provided in t h e appendices f o r
common waste-intensive operations. There, t h e prime emphasis is given to source reduction, in accordance with the EP A-recognized hierarchy.
n n 3 13
IJ 1 3 I) 2

. I
EFINITION OF WASTE MINIMIZATION
The working definit ion of Waste Minimization used by EPA in i t s recent Report t o
Congress i s presented in Figure 2-1. WM is viewed as consisting of three components:
(source reduction, recycling, and treatment), o f which source reduction clearly i s the
most preferable approach in terms of environmental considerations. The components
o f source reduction are shown in Figure 2-2.
The EPA does not consider the reduction of waste tox ic i ty by di lut ion or of quantity by
dewatering (or more generally, by the removal of iner t components) as valid W M
activi t ies in and o f themselves. However, i f a dilution or dewaterinq step i s necessary
t o render the resulting waste recyclable or treatable, then such a step i s considered as
an integral par t of t h e recycling or treatment operation, both of which are viable WM
m e as ur es.
It should also be noted that the present focus of WM activit ies are hazardous wastes
tha t f a l l under RCRA jurisdiction. There are, however, strong reasons for using a
mult imedia approach when structuring and executing a WM audit program. Such an
approach calls fo r consideration of releases of environmental pollutants in to a l l media,
Le. air, water and land, t o prevent shift ing of pollutants f rom one media t o another.
Examples of such shift ing include land disposal of treatment sludges resulting f rom
wastewater cleanup or of condensates resulting f r o m steam regeneration of carbon
beds used t o control volati le organic emissions. An emissions inventory ideally should
account fo r all pollutants leaving the plant in a l l media including air, water, and land.
INCENTIVES FOR WASTE MIMMlZATlON
There are several powerful and compelling reasons fo r minimizing waste generation.
summarized in Table 2-1.
3

. . #
WASTE MINIMIZATION
SOURCE REDUCTION RECYCLING TREATMENT
RELATIVE ENVIRONMENTAL DESIRABILITY HIGH LOW
ORDER OF EXPLOWTON FIRST LAST
WASTE MINIMIZATION Tho reduction. to the extent fwbk, of hazardous waste that k generated or subsequently treated, stored or di8po8.d d. A includoa any aoum reduction or recycling activw undertrken by 8 generator that results in either (1) the redudion of total wlume or quantity of hazardous wasto or (2) the redudion of toxicity of the hptardou8 waste, or both, so bng a8 such reduction is consistent with the goal of minimizing present and future throat8 to human h d t h and the environment (€PA8 Report to Congreu, 1986, EPA630-SW-86-033).
SOURCE REDUCTION
Any activity that reducw or eliminatw the generation of hazardous waste a! the aoura, usually within a pmceu (op. Cit.).
RECYCLING A material is "yded' if it k used, reused, or rdaimed (40 CFA 261 .l (c) (7)). A materkl k ' u d or reused' if 1 k either (1) employed 01 an ingredient (including b use a8 an intermediate) to mako 8 product: however a material will not satisfy this condition W distinct components of the matorial are recovered a8 separate end product8 (aa whon metab are mxrvered from m.W aontoining seandary materials) or (2) empbyed in a particular fundion u UI effective suktitute for a commercial product (40 CFR 261.1 (c) (5)). A material k 'reclaimed' if W k pmcaood b reawor a usoful product or if it ir regenerated. Example$ of recovery of kad valuoa from apnt bdtoriea ud regeneration of spent solvents (40 CFR 261 .l (c) (4)).
TREATMENT
Any mothod, tochniqw, or m, including neutralization, duigned to change tho phy8iUl. chemical, or biobgicrl chmu or compooitbn of any huardow waste 10 a8 to neutnlite such wort0 or w 88 to render such waste m-hazardous, safer for transport, amenabk for recovery, amensMe for stongo or reduwd in volume. Such term mludes my activity or pmceuing designed to chango the phyriUr form or chemical comporition of hazardous w a r so sr to render it non-huordour (RCRA, Subtitk A, S.ctkn 1004(34). PL- 98-61 6).
Figure 2-1. Components of waste minimization, their hierarchy and definitions.
4 1

I SOURCE REDUCTION -1
TECHNOLOGY CHANGES
PRODUCT CHANGES 1
I
Product Substitution Product Conservation Change in Product
Composition
I INPUT MATERIAL r CHANGES
I MaterialPuffiiion Material Substitution
Processchanges Equipment, Piping, or
Layout changes Additional Automation Changes in Operational
settings Energy Conservation Water Conservation
TECHNOLOGY CHANGES
Processchanges Equipment, Piping, or
Layout changes Additional Automation Changes in Operational
settings Energy Conservation Water Conservation
PROCEDURAL OR INSTITUTIONAL CHANGES
~~
Procedural Measures Loss Prevention Personnel Practices Waste Stream Segregation Material Handling
Improvements
Figure 2-2. Elements of Source Reduction

1 I
Economics o Landfill disposal cost increases. o Costly alternative t rea tment technologies. o Savings in raw material costs.
Regulations o o Biennial WM program reporting. o
Certif ication of a WM program on t h e Hazardous Waste Manifest.
Phase-in of land disposal restrictions.
Liability o Reduction in generator liability fo r environmental
problems a t offsite TSD facilities.
Economic performance of WM projects has been enhanced by the rising costs of land disposal and other forms of waste management. Regulation-driven upgrading of RCRA-approved landfills has increased the costs of land disposal from as l i t t le as $10-$15/ton in t h e early 1970's t o $200-300/ton today. The costs for land disposal increased by a f ac to r of 2 t o 6 over the last 3 years depending on t h e type of waste and locality. These costs have not yet shown any signs of stabilizing.
Future increases in was te management costs are likely because of t h e difficulties associated with siting and permitt ing new t rea tment , storage and disposal facilities (TSDF) and with t h e increasing scope of land disposal bans. Current and fu ture land disposal restrictions will force the generators t o turn t o expensive t r ea tmen t or incineration ($500 -51200 per met r ic ton) and/or seek more cost e f fec t ive source reduction or recycling alternatives. In addition t o accounting fo r t hese rising costs, t h e economic performance of WM projects improves if raw materials savings are included along with the savings related t o avoided processing costs. The details of economic feasibility analysis are discussed in Section 8.
The cur ren t regulations for hazardous waste generations (40 CFR 262) provide several direct and indirect incentives for waste minimization. Di rec t incentives include:
6

1 1 A t h e m a n d a t a r y VfM certification requirement tha t must be signed by t h e
generators on every Uniform Hazardous Waste Manifest (Figure 2-3).
o the mandatory biennial reporting detailing progress of WM programs.
Indirect incentives consist of:
Land disposal restrictions, enac ted in stages, beginning with solvents on November 8, 1986, continuing with t h e ''California List" (liquid hazardous wastes containing f r e e cyanides, PCBs, corrosives, or cer ta in heavy metals; and hazardous wastes containing halogenated organic compounds) on July 1987 and with successive tiers by "thirds" coming on August 8, 1988, June 1989 and May 8, 1990).
Low regulatory permitting burden for projects involving on-site source reduction and recycling. Many source reduction measures do not require any permitting whatsoever. Installation of equipment for onsite recycling, such as stills for solvent recovery, does not require RCRA permits, although air permits may be required. \&&$*
@i"k- F,;lkm LU.&uy L/Pc&bL.%&4j I t l L t 4 S J L h d ( G ' J b anAp4 / h L e L A k * ? L + 4 ' L c v h ,
An often used argument for minimizinq waste is t h e reduction of risk associated with environmental impairment liability of the generator. Waste management using offsite t rea tment , storage and disposal facilities (TSDF) poses the risk of release of such was te to the environment due t o poor handling by transporters or TSDF operators or due t o flaws in the design or construction of such facilities. The risks can be reduced by careful inspection of TSOFs and their management, but never totally eliminated. If there is migration of t h e wastes off t h e TSOF site, the waste generators can be held liable for clean-up costs merely because their wastes were taken t o tha t facility. Under provisions of CERCLA, Section 106 and 107, the generator can be held financially liable for t h e en t i re cos t of cleaning or restoring t h e TSDF site.
PHASES IN A WASTE MIMMIZATION PROGRAM
Although the main objective of a waste minimization audit program is t o reduce or eliminate waste, t h e program can also bring about an improvement in a company's production efficiency. In th i s sense, t h e W M audit program is similar in concept t o
7

1
other proqrams and -€unctinns that are aimed at improving concentrating on a specific aspect of a company's operation.
1 1
overall performance by
Four examples of these
types of programs and functions a r e energy conservation programs, environmental audits, value engineering, and managerial accounting. Descriptions of these programs and functions are shown in Table 2-2.
The conception and a waste minimization audit program will typically
involve several
o program planning and organization o information gathering o was te minimization audit o feasibility analysis o implementation of W M options
Each of these phases is briefly described in Table 2-3. The following chapters discuss t h e details of each of t h e W M audit program phases outlined here.
8

~~~!J~.QJ"-"-~~~~~~~~~~~~
Table 2-2. PROGRAMS AND FUNCTIONS SIMILAR TO WASTE MINIMIZATION AUDIT
Program/Function
PROGRAMS
Energy Conservation program
Environmental Audits
Value Engineering W
Managerial Accounting
Description
This program centers around energy audits of a facility, with the goal of reducing energy losses and energy consumption.
These a u d i provide a systematic examination of a firm's activ51ies to determine its compliance status with environmental regulations.
This discipline is a systematic approach toward reducing a project's (or a product's) cost, while maintaining its functionality.
This function is the use of accounting data to control (and reduce) a firm's costs, and improve eff icincy and effectiveness.
~~
Relevance to Waste Minimization
I Energy conservation is analogous to WM, with the emphasis on energy losses, rather than waste reduction. Energy audit procedures are generally applicable to W audiis, and the programs can benefit each other. Energy audits have been widely used in industry since the 1970%.
Environmental audts deal with the same waste streams as the WM audl. However. in environmental audits, the emphasis is more on effluent treating processes than on production processes or maintenance activities, and the focus is on regulatory compliance, rather than improving efficiency. Environmental audits and WM audits can be carried out together.
Value engineering concentrates on reducing costs. The principles and procedures are well-established and are directly applicable to WMaudits.
Managerial accounting (or cost accounting) deals with all aspects of a firm's operations. Managerial accounting data is useful in analyzing waste management operations. Also, managerial accounting procedures can be used or modiiied to bring about waste reduction. (For example, waste treatment and disposal fees can be included into the internal costs of input materials charged to the waste generating departments.)

- - - I- ~-Luuuud d L J - . A 2 “ 1
Table 2-3. PHASES OF THE WASTE MINIMIZATION AUDIT PROGRAM
Program Phase
WM Program Planning andOrganizatbn
WM AudiP Preparation and Infomation Gathering
w Waste Minimization Auditii 0
Feasibility Analysis
Implementation of WMopt i i
Stem or Tasks
Get top management commilment Set goals for the program Organize the program task force and audi teams
I
Identify and track waste streams Collect and compile process and facility data Select the waste streams or faci l i areas to audit
Inspect the site Generate options Screen and rank the options Select the promising options for further study
Perform technical evaluation Perform economic evaluation Select the attractive options and issue final report
. Obtain funding Install the option Evaluate the option’s performance . Continre looking for potential new options
Remarks
An effective planning and organization phase necessary to overcome potential barriers and eff eaively irrQement the WM program
11
- is to
Effective preparation is criiical to understanding the mechanisms by which wastes are produced, and how waste generation can be reduced.
The audit is a systematic procedure by which options are proposed that will minimize waste. The procedure also provides a means for screening potential options for further study.
The feasibility analysis is aimed at determining whether a promising option will wok, and do SO economically. in a specific application.
Attractive options generally require funding, followed by installation. Performance, measured by waste reduction, determines whether an option is truly effective. The WM audii program should be an ongoing one.

SECTION 3 ___ -- - -.
WM AUDIT PROGRAM PLANNING AND ORGANIZATION
A comprehensive waste minimization audit program affects many functional groups within a company. A good program will bring these different groups together t o solve or reduce the company's waste problem. The formality of the program depends upon the s ize and complexity of t h e organization and i t s waste problem. The program s t ruc ture must be flexible enough to accommodate unforeseen changes and unexpected occurrences. The developmental activit ies of a waste minimization audit program include:
o initiating the program o set t ing goals and objectives o staffing the program o gett ing commitment and dealing with conflict
INITIATING A WM PROGRAM
The successful WM audit program begins with a formal policy s ta tement or directive f rom top management. The person in charge of t he company's environmental affairs is responsible t o advise top management of the need for this formal commitment. An example of a formal policy s t a t emen t is t h e following:
~
[A mapr chemical compmny] ..." is committed to continue excellence, kadership, and stewardship in protecting the environmont. Environmental protection is a primary management r ~ n r b i l i t y , as well as the responsibility of evory empbyw.
In keeping with thb policy, our objodivo aa a company k to reduce waste and achiove minimal adverse imp.d on tho air, water, and land through excellence in environmental control.
The Environmental Guidelinoe induck the folbwing points:
Environmontal protection h a lino rmponaibility and an importrnt moaoun d unpkyw petfmaolr. In addition, ovory emp@oe ia reaponsiblo for environmental protection in the m o manrul ho or rho is for safety.
Minimizing or eliminating tho generation d waute has beon and continues to be a prime considuatbn in rosmafch, ploceu design, and plant opwstions; and is v h o d by management~like safhy, yie#, and h a prevention.
Rwuw and roqding d moderiak has been and will continuo to bo given first conrider8tbn prior to daasifiiion and disposal of waste:
11

1 1 7 1 :I
GOALS
To faci l i tate the WM audit program, establish goals to define the program's objectives.
Waste reduction goals can be qualitative. For example, the goal might be "a
significant reduction o f toxic substance emissions into the workplace environment.''
However, it i s better to establish measurable, quantifiable goals, since qualitative
goals can be interpreted ambiguously. Quantifiable goals establish a clear guide as to
the degree of success expected of the program. A major chemical company has
adopted a corporate-wide goal of 5% waste reduction per year. In addition, each
fac i l i ty within the company i s setting i t s own waste reduction goal. Many o f the
plants have alceady reported signifiFant reductions in waste. ' j A 4 & *AiL?' /
As part of i t s general policy on hazardous waste, a large defense contractor has
established an ambitious corporate-wide goal of zero discharge o f hazardous wastes
f rom their faci l i t ies by the end of 1988. Each division within the corporation is given
the responsibility and freedom to develop i t s own program (with intermediate goals) t o
meet this overall goal. This has resulted in an extensive investigation of procedures
and technologies to accomplish source reduction, resource recovery, and onsi te
treatment.
?( "%&k p.& * f h L L c 1 . L b d t h G & f -ru\.c_Y T U b m fq y; .h 'M * W k G d i b d 4 t )ah- ye-13 _. 3
Table 3-1 l ists the qualities that the goals should possess. It i s important that the
company's overall waste minimization goals be incorporated into the appropriate
individual departmental goals.
Table 3-1. ATTRIBUTES OF EFFECTIVE GOALS
o o o MEASURABLE over time. o MOTIVATIONAL. o o UNDERSTANDABLE. o ACHIEVABLE.
ACCEPTABLE to those who w i l l work t o achieve them. FLEXIBLE and adaptable t o changing requirements.
SUITABLE t o the overall corporate goals and mission.
Source: Pearce and Robinson, Strateqic Management (1985)*
12

1
-1 :1 7
:-I ... 'I
3 1
I .1
The waste minimization audit program w i l l affect a number of groups wi th in a large
company. For th is reason, a program team or task force should be assembled. This
team should include members of any group or department in the company that has a
significant interest in the outcome of the program. Table 3-2 l ists departments or groups of a typical manufacturing company that should be involved in the program.
Table 3-2 IMPORTANT PARTICIPANTS H A WASTE MINIMIZATION PRO(#AM
For a manufacturing company, include representatives f rom
the following departments/functions:
o Production
o
o Process Engineering
o Quality Contro l
o Environmental Staf f
Faci l i t ies E ngi neeri ng/ Mai nt enance
Depending on the nature o f the W M audit program and the facil i ty,
also include representatives f rom the following
departments/functions, as appropriate:
o Safety
o Purchasing
o Mater ia l Control
o Information Systems
o Legal
o Finance / Accounti ng
o Product Inventory and Distr ibution
'7 d
The formal i ty or in formal i ty of the WM audit program w i l l depend on the nature of the
company. The program in a large, highly structured company w i l l probably develop t o
be quite formal in contrast t o a small company or a company in a dynamic industry,
where the organization's structure changes frequently.
13
J

Since the ~- program - w i l l consist of one or more projects, the program should be run as a
project task force. Table 3-3 l i s t the typical responsibilities of a W M audit program
task force. As such, i t w i l l draw on expertise wi th in the company as required. The
scope of the program w i l l determine whether ful l- t ime part icipation i s required by any
of the team members. Figure 3-1 illustrates a sample organization chart showing how
a W M audit program can fit into the structure of a large multi-division corporation.
Table 3-3. RESPoNSBUTlES OF TFE WM A m I T PROC4AM TASK FORE
0
0
0
0
0
0
0
0
0
0
0
~ ~~~~
Get commitment and policy statement f rom top management
Establish W M audit program goals
Establish a waste tracking system
Select the waste streamb) or fac i l i t y area(s) f o r audit
Select waste minimization audit team(s)
Conduct (or supervise) audits
Conduct (or supervise) technical/economic feasibi l i ty studies of favorable options
Select feasible opt ions for implement at ion
Obtain funding and establish schedule fo r implementation
Monitor (and/or direct) implementation progress
Monitor performance of the option once it i s operating
In a small company, several people a t most, w i l l be al l that are required t o implement
a WM audit program. Include the people w i th responsibility f o r production, facilities,
maintenance, quality control, and waste disposal on the team. It may be that a single
person, such as the plant manager, may have a l l of these responsibilities at a small
fac i l i ty .
Some larger companies have developed a system in which audit teams periodically
visi t the company’s dif ferent divisions. This allows the company t o benefit by sharing
the ideas and experiences of other divisions. Similar results can be achieved w i th
periodic in-house seminars workshops, or meetings. A large chemical manufacturer
held a corporate-wide symposium in 1986 dealing specifically w i th waste
minimization. The company has also developed other
wide awareness of waste minimization, including an
and an instruct ional videotape.
14
programs t o increase company-
internally-published newsletter

I I I I I I I I I I I
GROUP VICE PRESIDENT
GRbUP I VICE PflESIDENT
I I
Corporate Envlronmental
Staff
Dlvlslon Vice Presklent
Dlvlslon Vlce PresMent
I I
Waste
Program
. Facllltles Englneerlng Department
Production
Malntenance Department
Department
Production Operations
Departments
ProCeSS Englneerlng Department
I I I I I I I I I I
Director of Procurement and Materhl
Control
Raw Materlals
Supplies
ProdUd Inventory
Dlstrlbutlon
Research and Development
Dkector of tdminlstratlon
Legal Flnance
Account Ing Personnel
lnformatlon
Contract ldmlnlstratlon
Safety
............................................... Figure 3-1. Waste Management Audit Program within a Large Corporation
FormWMA 1.6 MC-7/87
J

1
SELECTING ~ ~ TI€ ALJDIT TEAM
W M audits are a principal activity of a WM audit program. The selection of audit teams, therefore, is a n important function of t h e WM audit program manager. As with the W M audit program task force, the W M audit t e a m should be represented by members of the various a f fec ted groups. While t h e WM audit program t a sk force considers t h e whole facility, the focus of t h e audit t eam is more specific, concentrating on a particular waste s t ream or a particular a rea of t h e facility. As
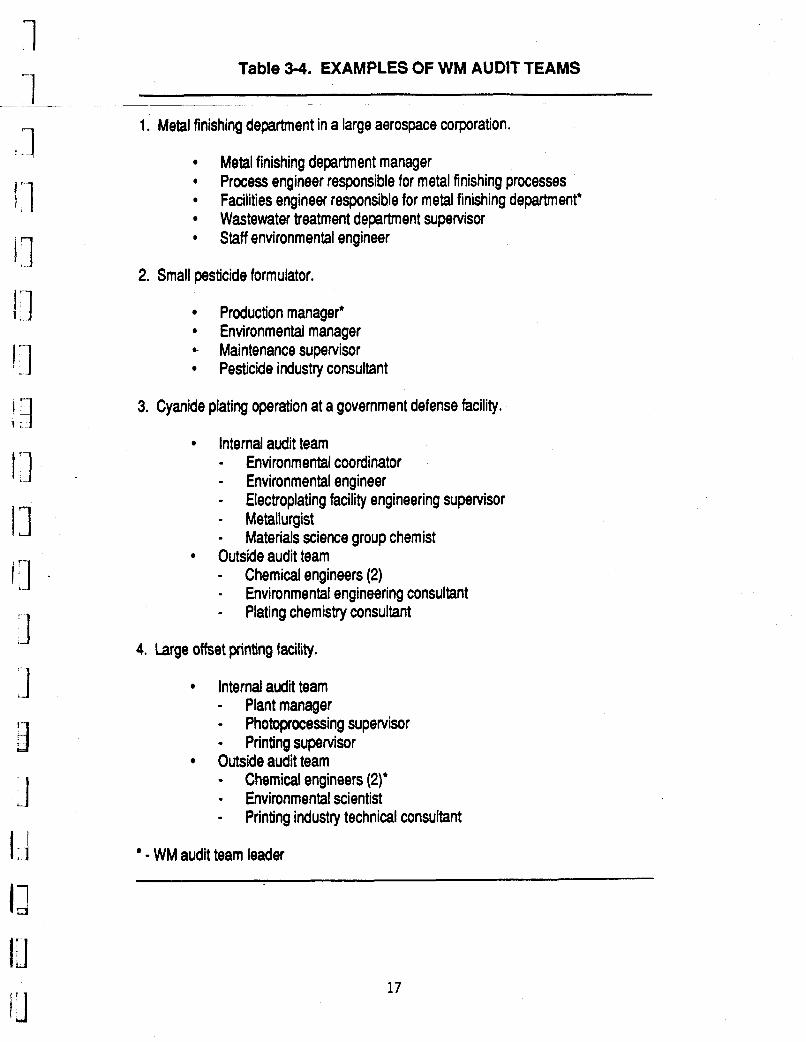
such, t h e audit t eam should include people with direct responsibility and knowledge of the particular waste s t ream or a rea of t h e facility. Table 3-4 presents four examples of audit t e a m s for facilities of various sizes in different industries.
In addition t o t h e internal s taff , consider using outside people, especially in t h e audit and implementation phases. They may be independent consultants or experts from a different facility of t h e same company. In large multi-division companies, a centralized s ta f f of experts at the corporate headquarters may be available. One or more "outsiders" can bring in new ideas and provide a n objective viewpoint. 4 n outsider also is more likely t o counteract bias brought about by inbreeding and t h e
"sacred cow" syndrome.
Outside consultants can bring a wide variety of experience and expertise t o a waste minimization audit program. Consultants may be especially useful t o smaller companies who may not have in-house expertise in t h e appropriate waste minimization techniques and technologies.
Production operators and line employees are of ten an excellent source of WM
suggestions. These people are useful in identifying important waste streams. They a l so have an intuitive feel how changes a f fec t the production process. This can be especially useful in suggesting operational or procedural changes. Companies t h a t have quality circles can use these as a means of eliciting suggestions for waste minimization. Several large manufacturing companies reported successful suggestions for waste minimization originating f rom quality circles.
16
1 " I
'1 I . 1
I:]
_-
Table 3-4. EXAMPLES OF WM AUDIT TEAMS
1. Metal finishing department in a large aerospace corporation.
Metal finishing department manager *
Wastewater treatment department supervisor * Staff environmental engineer
Process engineer responsible for metal finishing processes Facilities engineer responsible for metal finishing department'
2. Small pesticide formulator.
Production manager' Environmental manager
.- Maintenance supervisor Pesticide industry consultant
3. Cyanide plating operation at a govemment defense facility.
Internal audit team - Environmental coordinator - Environmental engineer - Electroplating facility engineering supervisor - Metallurgist - Materials science group chemist Outside audit team - Chemical engineers (2) - Environmental engineering consultant - Plating chemistry consultant
+. Large offset prillting facility.
Internal audit team - Plant manager - Photoprocessing supervisor - Printing supervisor Outside audit team - Chemical engineers (2)' - Environmental scientist - Printing industry technical consultant
- WM audit team leader
la
17

OVERCOMING ~ BARFUERS
Although waste minimization pr cts can reduce operating costs and improve
environmental compliance, they can also lead to conflicts between dif ferent groups.
For example, a change aimed at reducing waste in a plat ing operation may be
detr imental t o the production ra te or product quality. In the defense industry, the
abi l i ty t o continue meeting mi l i ta ry specifications (Mil Specs) i s an important
consideration fo r WM projects. Therefore, production and quality control personnel
must be included in the waste minimization evaluation process. Table 3-5 l i s t s
examples of confl icts tha t can arise during the implementation of a waste
minimit a t ion project.
In addition t o jurisdictional confl icts related t o these objective barriers, there are
attitude-related barriers that can disrupt a W M audit program. A commonly held
at t i tude i s "If it ain't broke, don't f i x it!" This att i tude stems f rom the desire t o
maintain the status quo and avoid the unknown. It is also based on the fear tha t a new
W M option may not work as advertised. Without the commitment t o carefully
conceive and implement the option, this att i tude can become a self-fulf i l l ing
prophecy.
Another attitude-related barrier i s the feeling that "it won't work.'' This response i s
o f ten given when a person does not fu l ly understand the nature of a proposed waste
minimization option and i t s impact on operations. The danger here i s that promising
options may be dropped before they can be evaluated. The brainstorming process for
generating WM options (described in Section 7) i s organized t o l imi t interference by
these attitudes. The W M audit procedure is designed so tha t a large number of options
are proposed, and then each option i s evaluated upon i t s merits afterword.
A n often-encountered barrier i s the fear tha t the W M option w i l l deteriorate the
product quality. This is part icularly prevalent in situations where unprocessed feed
materials are recovered from the waste and then recycled back t o the process. The
deterioration o f product quality can be a valid concern if unacceptable concentrations
o f waste materials build up in the recycle loop. The best way t o quell this belief is t o
set up a small-scale demonstration in the facil i ty, or t o observe the particular option
in operation at another faci l i ty.

Table 3-5. EXAMPLES OF BARRIERS TO WASTE MINIMIZATION
Potential Con flict or Barrier
Production
s
Facilit ies/Mai ntenance .. I; s- - . .. - - _-r- .
~ -. d
Quality Control
Inventory
Finance
Purchasing
Environmental
A new operating procedure will reduce waste but may also be a bottleneck that decreases the overall production rate.
Production will be stopped while the new process equipment is installed.
similar service. It may not work here.
Adequate space is not availabl equipment.
Adequate utilities are not available for the new equipment.
&,a .&*-. -2uy, ' )k Nj-oe, Tb yh*f*uh& A\ P&kLiW-Li M LL
o i x w
d' 4.r. $ l h c n . J T-""C A new piece of equipment 3 as not been demonstrated in a d'
r r y c-c LLJL.
/- --.
Engineering or construction manpower will not be available in time to meet the project schedule.
Extensive maintenance may be required.
More intensive QC may be needed. !
i, More rework may not be required.
A program to reduce inventory (to avoid product deterioration and reprocessing) may lead to stockouts during high customer demand.
There is not enough money to fund the project.
I replacement of a hazardous raw material with a non-hazardous substitute. I
I I 1
i, Existing stocks (or binding contracts) will delay the , \
Installation of solvent recovery equipment will be delayed in order to get air pollution control permits.
c s e of a new non-hazardous raw material will adversely 1 impact the wastewater treatment facility. Waste Treatment
i

__ ~~ ___ __- Commitment throughout an organization i s necessary in order t o resolve confl icts and
t o remove barriers t o the WM audit program. Commitment and direction f rom top
management are essential t o the success of the program, along w i th employee
n '-1
cooperation and participation. Bonuses, awards, plaques, and other forms o f
recognition are of ten used t o provide motivation. In some companies, meeting waste
reduction goals are used as one measure of employee performance.
Any WM audit program needs one or more people t o champion the cause. These "cause
champions" overcome the iner t ia present when changes t o an existing operation are
proposed. They also lead the WM audit program, either formally or informally.
Although an. environmental engineer, production manager, or plant process engineer
are good candidates, the interplay of personalities between the program members w i l l
usually determine who takes on th is role.
7 I 1 :-I 3
Table 3-6. DESIRABLE AllRlBUTES OF A W M AUDIT P R a A M CHAMPION "I
0 Fami l iar i ty w i th the companyls production departments including: - Faci l i t ies - Processes - People Fami l iar i ty w i t h the companyls waste management operations. Fami l iar i ty w i th new production and waste treatment technologies. Fami l iar i ty w i th WM principles and techniques. Aggressive managerial style. Understanding o f environmental regulations. Understanding o f product quality control requirements. Ab i l i t y t o communicate and interact wel l w i th people. Good rapport w i th top management.
I f the champion i s lacking in the t ra i ts shown in Table 3-6, then he or she must re ly
more heavily on other members of the WM audit program team.
Table 3-7 summarizes the important steps in planning and organizing the WM audit
program.
20

Table 3-7. WASTE MINIMIZATION AUDIT PROGRAM PLANNING AND ORGANIZATION ACTIVITIES SUMMARY
SETTING UP THE PROGRAM Get Top Management Commitment to:
- Establish WM as a corporate goal - Establish a WM Audit Program to meet this goal - Give authority to the WM Audit Program Task Force to implement this program
Set Goals These goals should be: - ACCEPTABLE to those who will work to achieve them I FLEXIBLE to adapt to changing requirement8 I MEASURABLE over time
- SUITABLE to the overall corporate goals I MOTIVATIONAL
- UNDERSTANDABLE I ACHIEVABLE
STAFFING
. Get Get
THE PROGRAM TASK FORCE
people who know the facllity, processes, and procedures people from affected departments or groups I
I
I
I - . I
I
I
I
Production Facilities/Maintenance Process Engineering Quality Control Environmental Staff Safety Staff Purchasing Material Control/lnventory Legal Staff Finance information Systems
Find a "cause champion", with the following attributes: - Familiar with the facility, its production processes, and its waste management operations - Familiar with the people - Familiar with quality control requirements - Good rapport with management - Familiar with new production and waste management technology - Familiar with WM principles and techniques - Familiar with environmental regulations
I Aggressive managerial style
GET COMPANY-WIDE COMMITMENT
Incorporate the company's WM goals into departmental goals Solicit employee cooperation and participation Develop incentives and/or awards for managers and employees
21

SECTION 4 W M AUOIT PREPARATION A N 3 INFORMATION GATHERING
The objective of this phase i s t o gain background information regarding the fac i l i t y t o
be studied, and t o decide on the focus for the review t o follow. Preparation for the
audit should include an examination of information sources related t o the processes,
operations, and waste management practices at the facil i ty. While audit preparation
can take many forms depending on the situation at hand, it typical ly involves the steps
shown in Table 4-1. +hll #!s L’I4cu.A-k a O-A nw-cRu 7 IX pd (0- l c 1 8 L 1
These steps are described in the following sections.
Table 4-1. W M AUOIT PREPARATION STEPS
o Ide t i f y and t rack waste streams
- Collect waste stream da a
- Develop mater ia l balances
- € s w ‘ - A 4””””
o Collect and compile data
- Design information (processes and equipment)
- Environmental information
- Raw mater ia l and production information
- Other information
o Select waste streams or process areas t o audit
WASTE STREAM IDENTIFICATION AND TRACKING
One of the first tasks o f a waste minimization audit program is t o identi fy and
characterize the facility’s waste streams. Indeed, this step is an important one for the
purpose of establishing goals for the programs. Information about waste streams can
come f rom a variety of sources.
22

Some information on waste quantities i s readily available f rom the completed
hazardous waste manifests, which include the description and quantity of hazardous
waste shipped t o a TSDF. The to ta l amount of hazardous waste shipped during a one
year period, fo r example, is a convenient means of measuring waste generation and
waste reduction efforts. Much of a company's disposal costs are based d i rect ly on this
measure. However, manifests of ten lack such information as waste analysis, source of
the waste, and the t ime period during which the waste was generated. Also, the
manifests do not cover wastewater effluents, air emissions, or non-hazardous solid
wastes.
Material Balances
Mater ia l balances should be developed t o bet ter understand the facil i ty's waste
situation. In i t s simplest form, the mater ia l balance is represented by the mass
conser vat i on principle: Lk.LL,,MG LR/y\
u[ Fu&J
01 '
SLWL irjh LhCC-. a +-'-n
,-
Mater ia l in = Material out + Material accumulated L W . C . ~ ~ ~ ph"'
The quantities are best expressed on a mass basis. The material balances should be
made individually for a l l of the components that enter and leave the process When
chemical reactions take place in a system, there is often an advantage t o doing
"elemental balances" for specific chemical elements in a system. Figure 4-1 i s a
sample mater ia l balance fo r a process that recovers copper meta l f rom copper sulfate
solution by concentration w i t h aluminum shavings.
To characterize waste streams by material balance can require considerable effort.
However, b y doing so, a more complete picture of the waste situation results. This
helps t o establish the focus of the W M activi t ies and provides a baseline fo r measuring
performance. Also, an accurate material balance can also be used t o determine
fugit ive emissions, such as evaporation of solvent f rom a parts cleaning tank.
23

I
M0l.W. kmoUh kglh kmolh kg/h
Solutlon Flows
cuso, 159.6 0.13 20.7
H,SO, 98.1 0.1 4 13.7
AI,( SO,), 342.3 0 0
H,O 18.0 65.3 1,175
Solld Flows cu 63.5
AI 27.0 0.15 4.1
TOTAL 65.57 1,209.4 0.15 4.1
I
kmoUh k g h kmolh kgh
0.01 1.6
0.14 13.7
0.04 13.7
65.3 1,175
0.12 7.6
0.07 1.9
65.49 1204.0 0.19 9.5
Figure 4-1. Material Balance Copper Cementation Tank
(to metal reclaimer)
i J 1 Copper
13 Sulfate
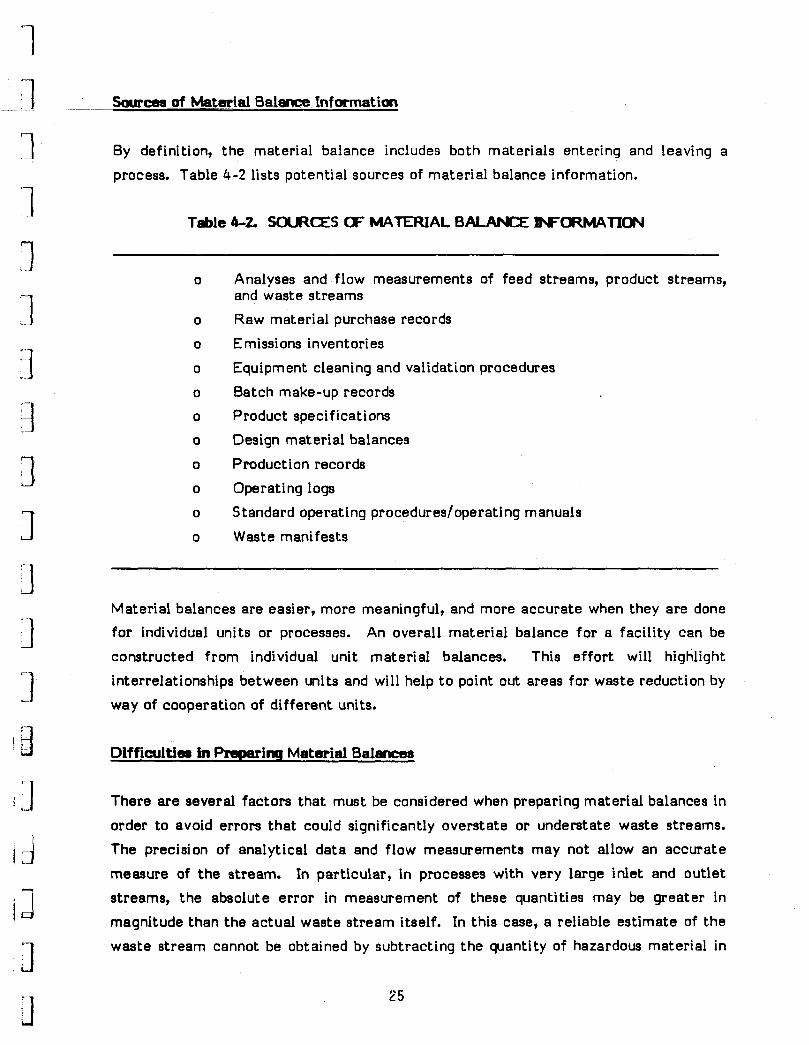
S a " of Material Balance Informatian
By definition, t h e material balance includes both mater ia l s entering and leaving a
process. Table 4-2 lists potential sources of material balance information.
Table 4-2. S o U i C E S OF MATERIAL BALANCE aFORMAlIoN
0
0
0
0
0
0
0
0
0
0
0
Analyses and flow measurements of feed streams, product streams, and waste s t reams Raw material purchase records E missions inventories Equipment cleaning and validation procedures Batch make-up records Product spe ci f icat i ons Design material balances Production records Operating logs Standard operating pr ocedur es/operat i ng manuals Waste manifests
Material balances are easier, more meaningful, and more accu ra t e when t h e y are done for individual units or processes. An overall material balance fo r a facility can be constructed f rom individual unit material interrelationships between units and will help way of cooperation of different units.
balances. This e f for t will highlight t o point out areas for waste reduction by
Difficultim in f%par inq Material Balrrnces
There are several fac tors tha t must be considered when preparing mater ia l balances in order t o avoid errors t h a t could significantly overs ta te or understate waste streams. The precision of analytical d a t a and flow measurements may not allow an accurate measure of t h e stream. In particular, in processes with very large inlet and out le t streams, t h e absolute e r ror in measurement of these quantities may be grea te r in magnitude than t h e actual was te s t r eam itself. In this case, a reliable es t imate of t he
was te s t ream cannot be obtained by subtracting t h e quantity of hazardous material in
25

I - 1 _ _
n I 1 7
-tbepmduct f rom that in the feed. Generally, subtraction of two large numbers t o
obtain a small number yields erroneous results.
In calculating material balances, it is necessary t o know how much material enters the
process. Raw mater ia l purchasing records can be used t o provide this data, if more
direct measures are not available. However, using purchasing data fo r feed streams
entails some of the same problems tha t using manifest data f o r waste streams. The
main problem is that purchasing quantities and ordering frequencies do not necessarily
correspond t o production rates. This can lead t o large errors in the calculation of
waste stream flows and compositions. For example, raw materials may be ordered
quarterly in large volumes or perhaps when prices are low.
It i s crucial to consider the t ime span when constructing a material balance. Mater ia l
balances constructed over a shorter t ime span require more accurate and more
frequent stream monitoring in order t o obtain a good balance. Mater ia l balances done
over the duration of a production campaign are typical ly the easiest t o perform and
are reasonably accurate.
Developing material balances around complex processes can be a complicated
undertaking especially if recycle streams are present. Such tasks are usually
performed by chemical engineers, o f ten w i th the assistance of computerized process
sim u l at om.
Measuring waste mass flows and compositions i s something that should not be done
only once. Indeed, waste reduction cannot be meaningfully measured unless the
information is collected both before and a f te r a waste minimization audit program is
implemented. Fortunately, i t i s easier t o do mater ia l balances the second time, and
gets even easier as more are done because of the "learning curve" effect. In some
companies, computerized database systems have been used t o track wastes. Section 7 discusses the importance o f periodic measurement of waste generation and reduction
as par t of the implementation of a WM audit program.
26

I
Table 4-3. FACILITY INFORMATION FOR WASTE MINIMIZATION AUDITS 1
I 1 ~ - -~
DESIGN INFORMATION Process flow diagrams Material and heat balances (both design balances and actual balances) for 1
1 CI
production processes pollution control processes
Operating manuals and process descriptions Equipment lists Equipment specifications and data sheets Piping and instrument diagrams Plot and elevation plans General arrangement diagrams and work flow diagrams
i ENVIRONMENTAL INFORMATION Hazardous waste manifests Emission inventories Biennial hazardous waste reports Waste assays Environmeatal audit reports
L 7 * Permits and/or permit applications
‘I 1
RAW MATERIALPRODUCTION INFORMATION ’
Product composition and batch sheets Material application diagrams Material safety data sheets Product and raw material inventory records Operator data logs Production schedules
3: 3 3
OTHER INFORMATION Company environmental policy statements 3 Organization charts
IJ
27

-1 I
~ ~ f33ttECTTBtK: A N 3 COWLING DATA
' 1 This step involves a compilation and review of information regarding the process or area t o be audited. Table 4-3 l ists information that can be useful in preparing for the
audit. A review o f this information w i l l provide important background fo r
understanding the facility's waste situation and should result in a well-defined
information needs l i s t or inspection agenda designed t o f i l l in the gaps. Comments of
1 J
operators found in the i r logs can be among the most useful data fo r identi fying
problems and possible solutions. 1 WASTE STREAM SELECTION 1 Because th is step establishes the focus of the entire audit activity, selecting a waste
stream fo r the audit requires a great deal of care. Table 4-4 l ists important cr i ter ia
t o consider when selecting which waste stream(s) t o audit. ' 1
Table 44. TYPICAL CONSIDERAT'IONS FOR SELEClNG WASTE STREAMS TO AUDIT
o Disposal cost of the waste
1 I I
J : I i
I-; 1 .I I-)
o Quantity o f the waste
o
o
o Hazardous nature o f the waste (toxicity, f lammability, reactivity,
o
o
o
Potential for (or ease of) minimization and/or recycling
Compliance w i th current and fu ture environmental regulations
corrosivity)
Potential for removing production or waste treatment bottlenecks
Other undesirable characteristics of waste (e.g., strong odors, potential degradation t o toxic compounds, etc.)
Available budget fo r waste minimization program and projects c v&q*** h & d
1
One or more of the above considerations can be the driving force behind the selection
o f a particular waste stream t o audit. A wr i t ten summary i s prepared a f te r the
selection of waste streams, and should include the following items:
28

0 - ~-
0
0
0
Facility description
Description of the process operations of concern, including diagrams necessary t o pinpoint pertinent waste generation aspects of the process.
Description of t h e was te s t r eams concentrating on waste sources, current methods of management, generation rates, composition, disposal costs, and raw material costs.
Rationale for was te s t r eam selection.
The result of a proper review preparation should be a well-defined needs list and inspection agenda t o be used during t h e ac tua l review. The needs l ist can be presented in t h e form of a checklist detailing objectives, questions and issues to be resolved, and fur ther information required. The needs list should be given to the appropriate people before t h e ac tua l site visit t o allow them t o assemble materials and information for t h e review t eam in advance. Of course, it may be t h a t t he members of the review t e a m are in the best position t o collect and compile much of this data. Af te r this is accomplished, t h e review can begin.
29

:1 SECTION 5
WASTE MINIMIZATION AUOrr 1 The objectives of the waste minimization audit include:
o generation of a comprehensive set of WM options for a specific waste stream or waste source of concern;
o prel iminary evaluation and screening of identi f ied options t o select those that
deserve additional, more detailed analysis.
The audit itself, as defined here, must be targeted on a specific waste stream or waste
source. Selection of a waste-stream for the audit was described in the previous
section. For example, consider the case of minimizing sludge produced in a ref inery
API separator unit. The API separator i s used t o separate water f rom an oi ly sludge
composed o f oi ly solids and emulsions. These can originate through cleaning o f heat
exchanger bundles, area washdowns, tank cleaning, and slop o i l emptying f rom knock-
out drums and other sources. The audit team w i l l identi fy these sources and examine
WM options related t o each source selected for analysis.
J R
Sometimes it i s beneficial t o look a t an entire operation rather than a waste stream.
For instance, consider a task involving minimizing solvent wastes produced by
numerous cold cleaning tanks located in a large a i rcraf t repair and maintenance
facility. There are three di f ferent types of wastes: spent d i r ty solvent, tank
evaporation losses and losses due t o solvent dragout. It is not ef fect ive t o focus just
on one of those wastes when analyzing a simple unit such as cleaning tanks; therefore,
a l l three types of wastes are considered. Also, basic source reduction techniques
related t o a simple cold cleaning operation do not vary f rom one tank t o another. As
a result, it is not necessary t o address each tank or cleaning stat ion individually fo r
the purpose of generating WM options. Instead, a general checklist containing WM
options i s prepared and then applied t o each station. (Appendix A contains a set of
worksheets that have been designed t o fac i l i ta te a WM audit.) Whether the focus is a
specific waste stream or a waste source, such focus must be f i rm ly in place before the
commencement of the audit .
30
--.
1-1 1-1
SlTE AN) PROCESS INSPECTION
The previous activi t ies have provided a general understanding of the faci l i ty 's
processes and wastes characteristics. Also, the focus of the audit was established in
the fo rm of a target waste stream or waste source. The audit inspection can now be
conducted. I t s governing objective is t o develop a full understandinq o f a l l causes of
waste generation, and t o examine i tems missed in previous activities.
The fac i l i t y inspection i s the u l t imate step in the information gathering process,
Typically, the inspection focuses on select aspects of the operation ident i f ied in the
preceding phase. The inspection guidelines for the audit team are presented in Table
5-1. Table 5-2 i s a sample agenda of a site inspection.
The audit team should "walk the line" f rom the suspected source of waste generation
t o the point of exit, be it a treatment unit, storage facil i ty, or haulage t o off-si te
disposal facilities. This inspection often results in forming suspicions about the causes
o f waste generation. Full resolution of these suspicions may require additional data
collection, analysis and site visits.
GEIERATION OF W M OPTIONS
Once an understanding of waste generation origins or causes has been achieved, the
audit process enters creative phase. The objective of this step is to generate a
comprehensive set of WM options fo r further consideration by the audit team. During
the review of fac i l i t y data and following the site inspection, some potential W M
options w i l l become apparent. However, t o develop a comprehensive l i s t of potential
options, it is helpful t o have a background knowledge of WM techniques tha t have been
used elsewhere. Table 5-3 l i s ts various sources of background information.
Options generation should fol low a hierarchy in which source reduction i s explored
e f fo r t stems f rom the environmental desirabil ity of source reduction over other
methods. Treatment should be considered only as a last resort. In the option
generation process, the proponents provide a l ist ing of ideas which includes br ie f
descriptions of the rationales fo r their selection, backed by l i terature references or wv discussions w i th equipment or mater ia l vendors, or consultants. Appendix B l ists W M
techniques fo r several commonly encountered waste-intensive operations.
first, followed by recycling, and then by t reatment approaches. Such a hierarchy o f
w 31

Table 5-1. GUIDELUES FOR SITE AN3 PROCESS INSPECTION
0
0
0
0
0
0
0
0
Prepare an agenda i n advance that covers a l l points that s t i l l require clarification. Provide staff contacts at the fac i l i t y w i th the agenda several days before the inspection. A sample agenda i s depicted in Table 5-2.
Schedule the inspection to coincide w i th the particular operation that is of interest, (e.g., make-up chemical addition, bath sampling, bath replacement, e tc.).
Monitor the operation at dif ferent times during the shift, and, i f needed, during a l l 3 shifts, especially when waste generation is highly dependent on human involvement (for example, in painting or parts cleaning operations).
Interview operators, sh i f t supervisors, and foremen directly. Do not hesitate t o question more than one person if an answer is no t forthcoming. Assess the operators' and their supervisors' awareness of waste generation aspects of the operation. Note the i r famil iar i ty (or the lack thereof) wi th the impacts their operation may have on other operations.
Photograph the facil i ty. Photographs are especially valuable in the absence of plan layout drawings. Many details can be captured i n photographs that otherwise could be forgotten or inaccurately recalled at a la ter date.
Observe the "housekeeping" aspect of the operation. Check fo r signs of spills or leaks. Ask t o visit the maintenance shop and inquire about their problems in maintaining the equipment leak-free. Assess the overall cleanliness and order of the site.
Assess the organizational structure and level of coordination o f environ- mental act ivi t ies between various departments.
Assess administrative controls, such as cost accounting procedures, mater ia l purchasing procedures, and waste collection procedures.
Methock for Generating Op ti0m
Option generation should occur in an environment that encourages creat iv i ty and
formulation of independent ideas by dif ferent members of the auditing team. Two
methods that are particularly e f fect ive in accomplishing th is are the "nominal group
technique" and Table 5-4 describes the methods, along w i th
advantages and disadvantages.
32

Table 52. AGENDA FOR A WASTE MlNlMlZATlON AUDIT IN A WEB OFFSET PRINTING FACILITY
A. Introduction.
8. Description of the waste minimization audit.
C. Discussion of general information. Facility size. Staffingem ployees. Products.
D. Discussion of printing operations. Photoprocessing .
Printing. Sheeting, folding, trimming, packaging.
Film processing. Plate processing.
E. Discussion of input materials and wastes. Input materials.
Photoprocessing chemicals and materials. Aluminum plates. Paper. Inks. Fountain solutions. Clean-up chemicals.
Waste materials. Waste developing solutions. Waste inks. Waste paper. Waste oils. Vapor emissions. Wastewater. Trash.
F. Discussion of maintenance operations.
G. Walk through the facility.
H. Discussion of possible causes of high waste flows.
1. Concluding remarks and additional information needs.
33

Table 5-3. SOURCES OF BACKGROUND INFORMATION ON WM OPTIONS
Published literature
State environmental agencies
Equipment vendors
Consultants
Plant engineers and operators
Technical magazines, particularly industry trade journals, have articles describing specific WM techniques. These articles tend to be quite practical in nature.
The following states have, or are developing, programs that include technical assistance, information on industry-specific waste minimization techniques, and co m pi led bibliographies.
California Connecticut Georgia Illinois Ke n t uc k y Maryland Massachusetts Minnesota New Jersey New York North Carolina Pennsylvania Ten n essee
Appendix C provides a list of addresses for state and federal programs for WM assistance.
Meetings with equipment vendors, as well as vendor literature, is particularly useful in identifying potential equipment-oriented options. Vendors are eager to assist companies in implementing projects. Remember, though, that the vendor's job is to sell his company's equipment.
Consultants can provide information about waste minimization techniques. Section 3 discusses the use of consultants in WM programs.
The employees that are intimately familiar with a facility's operations can often make significant practical suggestions.
34

Table 5-4. GROUP CREATIVITY TECHNIQUES BRAINSTORMING VERSUS NOMINAL GROUP TECHNIQUE ~ -1
1 '
Coordinator 1 par t i c i pan t 6
I - POCEDURE
1 '--I
i
ADVANTAGES
DISADVANTAGES
BRAINSTORMING
Face-to-face interaction between participants.
Before the meeting, the participants review the background information and the requirements of the project. One participant serves as the leader. Another serves as the recorder. The meeting starts with a description of the project as a problem in need of a solution. The participants propose solutions to the problem. The participants are not allowed to critique the proposed solutions, but are encouraged to build and expand on earlier responses. All responses are recorded for later review and evaluation.
The free association process stimulates creative thinking. One person's ideas stimulate others. A large number of ideas are generated.
Little thought goes into many of the ideas that are developed during the meeting. Many of the ideas generated are not practical. (This is not true, necessarily, of ideas generated by participants while reviewing information prior to the meeting.)
NOMINAL GROUP TECHNIQUE
Face-to-face interaction organized by a coordinator.
The participants are brought together for the meeting, without reviewing the problem beforehand.
The coordinator describes the problem and asks each participant to review it.
The participants individually write down as many possible solutions as they can they can think of. The participants then, one by one, read one of their responses, going around the table as often as necessary to read all of the responses. After all of the ideas have been read, the ideas are discussed individually. Duplicate responses are eliminated.
Finally, the participants individually prioritize the ideas. The results are totalled (based on "one participant, one vote") to arrive at the group consensus.
More thought goes into the responses. The responses tend to be more practical. The meeting also results in a prelimin- ary screening.
This procedure is less likely to "stumble onto" a truly innovative new idea.
35

Since detailed evaluation of economic and technical feasibil i ty i s usually costly, W M
options that were generated in the previous step may need t o be screened t o identify
those that deserve further evaluation. A variety o f methodologies exist f o r evaluating
the options. Three methods (informal evaluation, CRI/FRI method and weighted sum
method) are compared in Table 5-5. Tables 5-6, 5-7, and 5-8 describe each o f the
methods in more detail.
SELECTION OF MOST PROMISING OPTIONS FOR MORE OETAlLED EVALUATION
The above rat ing systems are, in essence, ac t i v i t y management tools fo r evaluation.
Their main advantages are that they 1) compel the audit members t o consider a wide
range of cr i ter ia before making decisions; and 2) provide a framework for resolving
differences concerning specific options. These systems should not be confused w i th
the more detailed feasibil i ty analyses, which are described in the next section.
The results of the options evaluation ac t iv i t y are used as the basis fo r choosing
options fo r more detailed analysis (i.e., technical and feasibil i ty analyses). The higher
the ranking that an option has received, the more at t ract ive it is as a candidate for
additional consideration. Options should be chosen in a joint meeting of external
auditors and in-house participants. The number of options chosen for feasibil i ty
analysis depends on the time, budget and resources available fo r such a study.
It is important t o note that some options may be considered worthy of immediate
implementation without further study. Typically, such options involve application of
good operating practices (e.g., closer supervision, keeping covers on degreasers, or training of paint spray booth operators) which require l i t t l e or no capital expenditure.
36
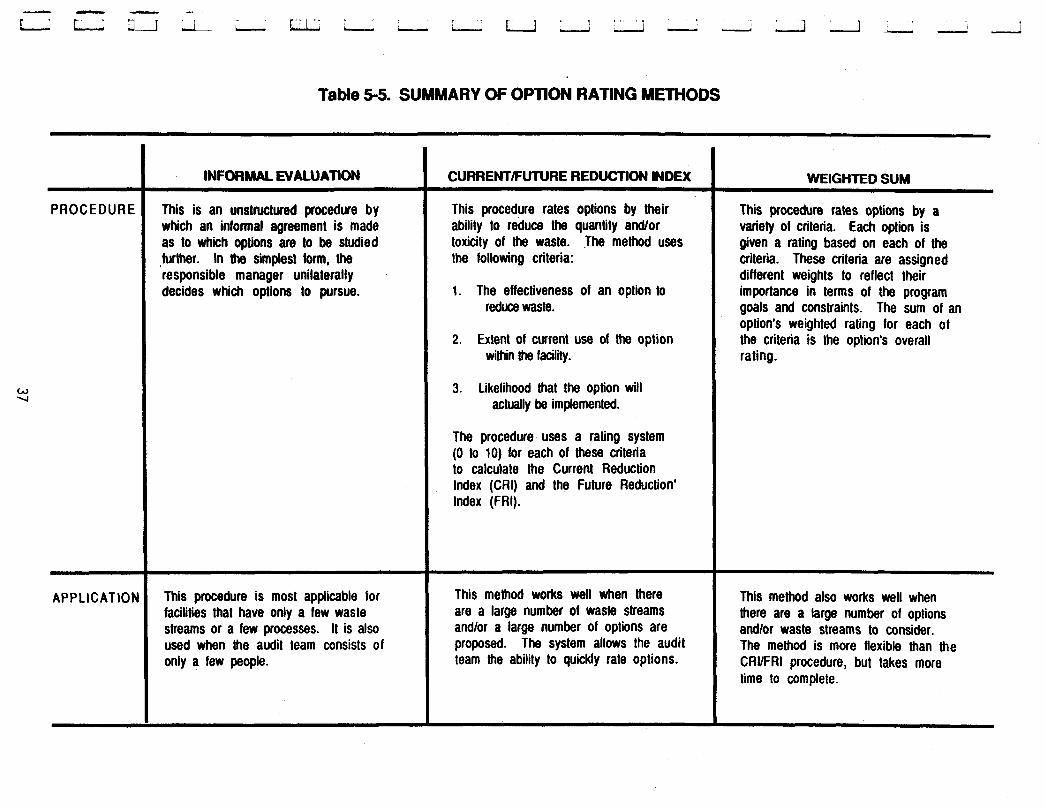
Table 5.5. SUMMARY OF OPTION RATING METHODS
PROCEDURE
w v
APP LIC AT IO!'
INFORMAL EVALUATION
This is an unstructured procedure by which an informal agreement is made as to which options are to be studied ,further. In the simples1 form, the responsible manager unilaterally decides which options to pursue.
~~~
This procedure is most applicable for facilities that have only a few waste streams or a few processes. It is also used when the audit team consists of only a few people.
CURRENTFUTURE REDUCTION INDEX ~ --
This procedure rates options by their ability to reduce the quantity andlor toxicity of the waste. The method uses the following criteria:
1. The effectiveness of an option to reduce waste.
2. Extent of current use of the option within the facility.
3. Likelihood that the option will actually be implemented.
The procedure uses a rating system (0 to 10) for each of these criteria to calculate the Current Reduction Index (CRI) and the Future Reduction' Index (FRI).
This method works well when there are a large number of waste streams and/or a large number of options are proposed. The system allows the audit team the ability to quickly rate options.
WEIGHTED SUM
This procedure rates options by a variety of criteria. Each option is given a rating based on each of the criteria. These criteria are assigned different weights to reflect their importance in terms of the program goals and constraints. The sum of an option's weighted rating for each of the criteria is the option's overall rating.
~
This method also works well when there are a large number of options andlor waste streams to consider. The method is more flexible than the CRUFRI procedure, but takes more time to complete.

1 :1
n .1 :1 1 L ..
3 3
Table 5-6. OPTION RATING INFORMAL EVALUATION
......................................................... This method is useful in small facilities, with small management groups, or in situations in which only a few options have been generated. The method consists of informal discussion and examination of each option. At the extreme, the WM audit program leader decides unilaterally which projects to pursue. Useful questions to consider for include the following:
Does the necessary technology exist to develop the option?
How much does it cost? Is it cost effective?
Can the option be implemented within a reasonable amount of time?
Does the option have a good "track record"? If not, is there convincing evidence that the option will work as required?
What other benefits will occur?
1.1
38
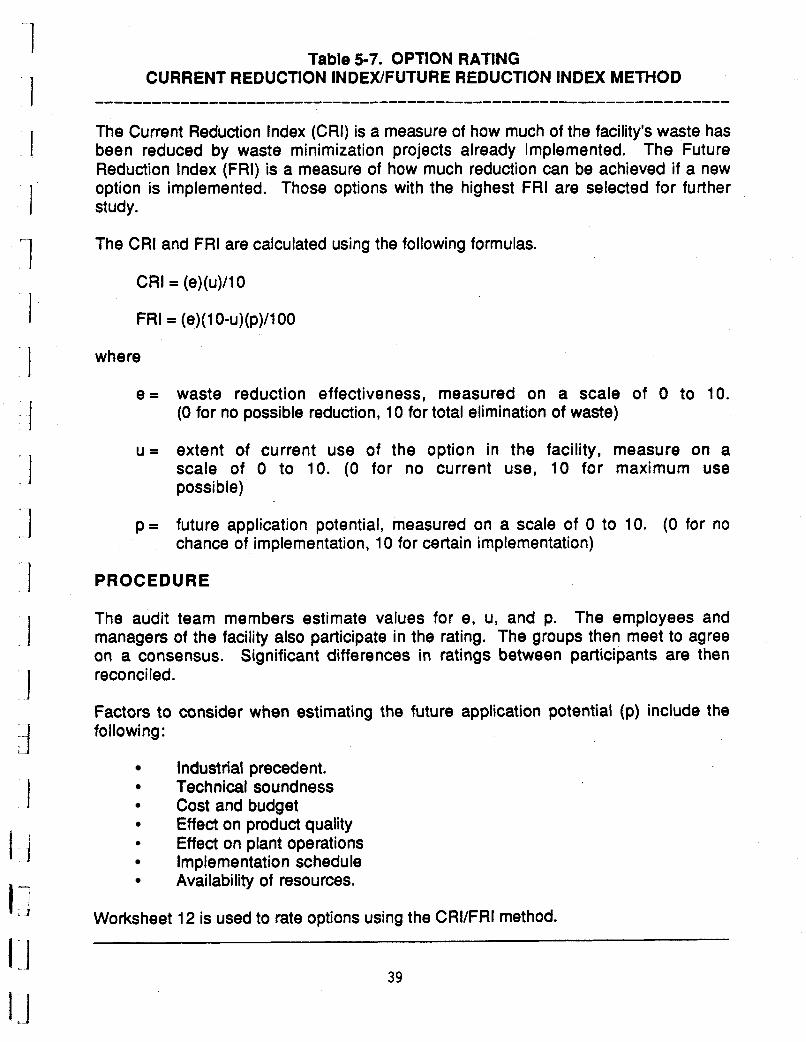
Table 5-7. OPTION RATING CURRENT REDUCTION INDUVFUTURE REDUCTION INDEX METHOD
The Current Reduction Index (CRI) is a measure of how much of the facility's waste has been reduced by waste minimization projects already implemented. The Future Reduction Index (FRI) is a measure of how much reduction can be achieved if a new option is implemented. Those options with the highest FRI are selected for further study.
The CRI and FRI are calculated using the following formulas.
CRI = (e)(~)/lO
FRI = (e)( 1 O-U)(p)/lOO
where
e = waste reduction effectiveness, measured on a scale of 0 to 10. (0 for no possible reduction, 10 for total elimination of waste)
u = extent of current use of the option in the facility, measure on a scale of 0 to 10. (0 for no current use, 10 for maximum use possible)
p = future application potential, measured on a scale of 0 to 10. (0 for no chance of implementation, 10 for certain implementation)
PROCEDURE
The audit team members estimate values for e, u, and p. The employees and managers of the facility also participate in the rating. The groups then meet to agree on a consensus. Significant differences in ratings between participants are then reconciled.
Factors to consider when estimating the future application potential (p) include the following:
Industrial precedent. Technical soundness Cost and budget Effect on product quality
4 Effect on plant operations Implementation schedule Availability of resources.
Worksheet 12 is used to rate options using the CRVFRI method.
39

n '1 1 1 -- I 1 :I 1 3 3 1 1 1
II 4 a I 1
Table 5-8. OPTION RATING WEIGHTED SUM METHOD
The Weighted Sum method evaluates each option in a more flexible manner than the CRVFRI method. This method involves three steps.
1.
2.
3.
Determine what the important criteria are in terms of the WM audit program goals and constraints, and the overall corporate goals and constraints. Examples of criteria are the following:
0
0
0
0
0
0
0
0
0
0
0
0
Reduction in waste quantity Reduction in waste hazard (e.g., toxicity, flammability,
reactivity, corrosivity, concentration, etc.) Reduction in waste treatmenVdisposa1 costs Reduction in raw material costs Reduction in liability and insurance costs Previous successful use within the company Previous successful use in industry Not detrimental to product quality Low capital cost Low operating and maintenance costs Short implementation period (and minimal disruption of
plant operations Ease of implementation
The weights (on a scale of 0 to 10, for example) are assigned to the criteria in relation to their importance. For example, if reduction in waste treatment and disposal costs are very important, while previous successful use within the company is of minor importance, then the reduction in waste costs is given a weight of 10 and the previous use within the company is given a weight of 1 or 2. Criteria that are not important are not included (or given a weight of 0).
Each option is then rated on each of the criteria. Again, a scale of 0 to 10 can be used (0 for low and 10 for high).
Finally, the rating of each option from particular criteria is multiplied by the weight of the criteria. An option's overall rating is then sum of the products of rating times the weight of the criteria, for all of the criteria.
The options with the best overall ratings are then selected for the technical and economic feasibility analyses. Worksheet 13 is used to rate options using the Weighted Sum method.
......................................................... 40

SECTION 6
FEAsH3ILlTY ANALYSIS
The f inal product of a waste minimization audit i s a l i s t o f promising WM options for a
facil i ty. The audit w i l l have screened out infeasible or unattractive options. The next
step i s to determine if the remaining options are feasible. The options are evaluated
on both a technical and an economic basis.
TECHNICAL EVALUATION
The technical evaluation determines whether a particular W M option w i l l work in a
specific application. For equipment-related options or process changes, visits t o see
existing installations are very desirable. Information on existing installations can be
obtained through equipment vendors and industry contacts. The ooerator's comments
are especially important and should be compared w i t h the vendor's claims. Bench
scale or pilot-scale demonstration i s often necessary. Of ten it is possible t o obtain
scale-up data using a rental test unit fo r bench-scale or pilot-scale experiments. Some
vendors w i l l instal l equipment on a t r i a l basis, wi th acceptance and payment after a
prescribed time, if the user is satisfied.
The technical evaluation o f an option also must consider fac i l i ty constraints and
product requirements, such as those described in Table 6-1.
Table 6-1 TYPICAL TECHNICAL EVALUATION CRITERIA
0
0
I s space available?
Are ut i l i t ies available? Or must these be installed, thereby raising capital costs?
Is the new equipment or technique compatible w i th production operating procedures, work flow, and production rates?
W i l l product qual i ty be maintained?
How long w i l l production be stopped in order t o install the system?
Is special expertise required t o operate or maintain the new system? Does the vendor provide acceptable service?
Does the system create other environmental problems?
I s the system safe?
41

Although an inabi l i ty t o meet these constraints may not present insurmountable
problems, correcting them w i l l likely add t o the capital and/or operating costs.
All affected groups in the fac i l i ty should contribute t o and review the results of the
technical evaluation. Pr ior consultation and review wi th the affected qroups (e.g.,
production, maintenance, purchasing), i s needed t o ensure the viabil ity and acceptance
of an option. I f the option calls fo r a change in production methods, the project’s
effects on the quality o f the f ina l product must be determined. If a f ter the technical
evaluation, the project appears infeasible or impractical, it should be dropped.
ECONOMlC EVALUATION
The economic evaluation i s carried out using standard measures of prof i tabi l i ty, such
as payback period, re turn on investment, and net present value. Each company has i t s
own economic cr i ter ia fo r selecting projects for implementation. In performing the
economic evaluation, various costs and savings must be considered. As in any project,
the cost elements of a WM project can be broken down in to capital costs and operating
costs.
Capital Costs
Table 6-2 l ists capital cost i tems typically associated w i t h the largest waste
minimization projects. These costs include not only the f ixed capital costs for designing, purchasing, and install ing equipment, but also costs fo r working capital,
permitting, training, start-up, and financing charges. Table 6-2 includes a number of
cost i tems that normally would not be required for many W M projects. For example,
new u t i l i t y systems are usually not required fo r WM projects, although connections t o
existing u t i l i t y systems may be required. Some WM options, especially those involving
operational or housekeeping changes, w i l l have no significant capital costs.
Wi th the increasing level of environmental regulations, in i t ia l permi t t ing costs are
becoming a significant port ion of capital costs fo r many recycling options (as wel l as
treatment, storage, and disposal options). Most source reduction techniques have the
advantage o f not requiring environmental permitt ing in order to be implemented.
42

-1 ' 1 .-I
1 :1 7
' I ' J 11 *
3 I J -1 . I 3 1
1 - 1 11 I IJ 1.1
Table 6-2. CAPITAL INVESTMENT FOR A TYPICAL LARGE WM PROJECT
Direct Capital Costs Site Development
Demolition and alteration work Site clearing and grading Walkways Fencing
Process Equipment All equipment listed on flow sheets Spare parts Taxes, freight, insurance, and duties
Piping and ducting (including valves, fittings, and hangers) Insulation and painting Electrical (including wiring, conduits, panels, switches, motors) Instrumentation and controls Buildings and structures (including foundations, structures, supports, cranes,
ladders, and platforms) Note - This includes concrete and structural steel.
Process water, cooling water, and wastewater connections Heating, ventilation, air conditioning, and dust collection Electric power Steam Refrigeration Fuels Plant air and inert gas Lighting Fire control
Materials
Connections to Existing Building Utilities and Services
New Utility and Service Facilities Storage and Handling Equipment Laboratory Equipment Other Non-Process Equipment Construct ion/lnstallation
Construction/lnstallation labor salaries and burden Safety, medical, and fringe benefits Supervision, accounting, timekeeping, purchasing, and expediting Temporary facilities Construction tools and equipment Taxes and insurance Buiiding permits, field tests, licenses
Indirect Capital Costs In-house Engineering, Procurement, and other Home Office Costs Outside Engineering, Design, and Consulting Services Permitting Costs Contractors' Fees Training Costa Start-up Costs Initial Charge of Catalysts and Chemicals Contingency Interest Accrued during Construction
TOTAL FIXED CAPITAL COSTS
Working Capital Raw Materials Inventory . Finished Product Inventory Materials and Supplies
Total Working Capital TOTAL CAPITAL INVESTMENT
Source: Adapted from Perry, $hem ical Fna ineer's H W (1 985); and Peters and Timmerhaus, Des ian and EEonomics for c hemical Fna ineers (1 980).
43

Operating Costs and Savinqs
I-II
.1
The basic economic goal of waste minimization projects i s to reduce (or eliminate)
waste disposal costs and to reduce input material costs. However, a variety of other
operating costs (and savings) should also be considered. In making the economic
evaluation, it i s convenient to use incremental operating costs in comparing the
existing system wi th the new system incorporating the waste minimization option.
('"Incremental operating costs" represent the difference between the estimated
operating costs associated w i th the WM option and the actual operating costs of the
existing system, without the option.) Table 6-3 describes incremental operating costs
and savings and incremental revenues typically associated w i t h waste minimization
projects.
Operating costs associated w i th hazardous waste treatment, storage, and disposal are
major elements of WM project economic evaluation. Companies have tended t o ignore
these costs in the past,@&kii Recent regulatory requirements imposed on generators
and waste management faci l i t ies have caused waste management costs t o increase t o
the point where waste management i s becoming a significant factor in a company's
overall operating cost structure. Table 6-4 presents typ ica l costs fo r waste treatment
and disposal.
A
For the purpose o f evaluating a project to reduce waste quantities, some types of costs
are larger and more easily quantified. These include disposal fees, transportation
costs, predisposal treatment costs, raw materials costs, and operation and
maintenance costs. It i s suggested tha t savings in these costs be taken into
consideration f i r s t because they w i l l have a greater e f fect on project economics and
will involve less e f fo r t t o estimate reliably. The remaining elements are usually
secondary in their direct impact and should be included on an as-needed basis i n fine-
tuning the analysis.
CASH FLOW
A project's prof i tab i l i ty i s measured using the estimated net cash flows (cash incomes
minus cash outlays) for each year of the project's life. Normally, internal company
projects are evaluated on a pretax basis. However, larger projects may be done on an
aftertax basis. Table 6-5 shows the revenue and cost i tems used t o calculate net cash
44
1.1

Table 6-3. OPERATiNG COSTS AND SAVINGS ASSOCIATED WITH WM PROJECTS
Reduced hazardous waste costs. This includes reductions in costs for:
Offsite treatment, storage, and disposal fees State fees and taxes on hazardous waste generators Transportation costs Onsite treatment, storage, and handling costs Permitting, reporting, and recordkeeping costs
Raw material cost savings. An option that reduces waste usually decreases the quantity of raw materials required.
Increased costs (or savings) associated with product quality. A WM option may have a positive or negative effect on product quality. This could result in higher (or lower) costs for rework, scrap, or quality control inspections.
Decreased (or increased) utilities costs. Utilities costs may increase or decrease. This includes steam, electricity, process and cooling water, plant air, refrigeration, or inert gas.
Decreased (or increased) operating and maintenance labor, burden, and benefits. An option may either increase or decrease labor requirements. This may be reflected in changes in overtime hours or in changes in the number of employees. When direct labor costs change, then the burden and benefit costs will also change. In large projects, supervision costs will also change.
Decreased (or increased) operating and maintenance supplies. An option may result in changes in the usage of O&M supplies.
Insurance and liability savings. A WM option may be significant enough to reduce a companies insurance payments. It may also lower a company's potential liability associated with remedial clean-up of TSDFs. (The magnitude of liability savings is difficult to assess.
Decreased (or increased) overhead costs. Large WM projects may affect a facility's overhead costs.
Changes in revenues from increased (or decreased) production. An option may result in an increase in the productivity of a unit. This will result in a change in revenues. (Note that operating costs may also change accordingly.)
Increased revenues from marketable by-products. A WM option may produce a by-product that can be sold to a recycler or sold to another company as a raw material. This will increase the company's revenues.
45

Table 6-4. TYPICAL COSTS OF INDUSTRIAL WASTE MANAGEMENT
Disposal Drummed waste'
Bulk waste
Lab packs
Solids Liquids
Solids Liquids
$75 to $1 10 per drum $65 to $120 per drum
$120 per cubic yard $0.60 to $2.30 per gallon $1 10 per drum
Analysis (at disposal site) $200 to $300
Transportation $65 to $85 per hour @ 45 miles per hour (round trip)
- These prices are for larger quantities of drummed wastes. Disposal of small numbers of drums can be up to four times higher per drum.
Source: Jacobs Engineering, private survey, (1 987).
46

Table 6-5. ELEMENTS OF CASH FLOW ANALYSIS
PRETAX CASH FLOWS AFTERTAX CASH FLOWS
Increased Revenues
+ Operating Cost Savings
I n c r e a ODe ratina Costs
Net Operating Savings
I- on Loans
Pretax Profits
- Loan Principal Repayment
- Capital Investment2
+ Sa lvaae Va lue2
NET CASH FLOW^
Increased Revenues
+ Operating Cost Savings
- Increased Ow ratina CQ&
Net Operating Savings
- Interest on Loans
D e w t o n
Taxable Income
Income Tax
Aftertax Profit
+ Depreciation
- Loan Principal Repayment
- Capital Investment2
j Salvaae Value2
. .
NET CASH FLOW^
Notes: 1. Net cash flows should be calculated for each year of the project life,
beginning with the construction period.
salvage value is recovered at the end of the project.
2. The capital investment outlay takes place at the start of the project and the
47

flows for typical WM projects, on both a pretax and a f t e r t ax basis. analysis example in Appendix 0 includes two cash flow tables (Figure D-3 and 0-4).
A profitability
PROFlTABLlTY ANALYSIS
Once the annual cash flows have been calculated, t h e project's profitability can be
determined. If the project has no significant capital costs, t h e project's profitability can be judged by whether an operating cos t savings occurs or not. If such a project reduces overall operating costs, i t should b e implemented as soon as practical.
For projects with significant capital costs, a more detailed profitability analysis is
required. The three standard profitability measures are:
o Payback period o o Net present value (NPV)
Internal rate of return (IRR)
Payback Period
The payback period for a project is the amount of t ime it takes t o recover the initial cash outlay on the project. The formula is the following:
Payback Period, years = Capital investment/Annual operating cos t savings
For example, suppose a waste generator installs a piece of equipment a t a total cost of $120,000. If t he piece of equipment is expected t o save $48,000 per year, then t h e
payback period is 2.5 years.
Payback periods are typically measured in years. However, a particularly attractive project may have a payback period measured in months. Payback periods in t h e range of th ree t o four years are usually considered acceptable for low-risk investments. This method is recommended for quick assessments of profitability and is usually followed by more detailed analysis.
48

IRR and NPV
The IRR and t h e NPV are both discounted cash flow (DCF) techniques for determining
profitability. Many companies use these methods as t h e means for ranking competing capital projects that are competing for funds. Capital funding for a project may well hinge on t h e ability of t h e project t o generate positive cash flows beyond the payback period t o realize an acceptable return on investment. Both t h e NPV and t h e IRR recognize t h e t ime value of money by discounting the projected future ne t cash flows t o the present. For investments with a low level of risk, a n a f t e r t ax IRR of a t least 12 t o 15 percent is typically acceptable. Most of t h e popular spreadsheet programs for personal computers will automatically ca lcu la te IRR and NPV for a series of cash flows. Re fe r t o any financial management, cost accounting, or engineering economics text for more information on determining the IRR or NPV.
As mentioned earlier, was te minimization projects may reduce t h e risk of environmental and safe ty liabilities for a company. Although these risks can be identified, i t is difficult t o predict if and when liability problems will occur and the
resulting magnitude of these liabilities. One way of accounting fo r t h e reduction of these risks is t o ease t h e financial performance requirements of t he project. For example, t he acceptable payback may be lengthened f rom four t o five years, or t h e
required internal rate of re turn may be lowered from 15 percent t o 12 percent. Such adjustments re f lec t recognition of elements which a f f e c t the risk exposure of the company but which cannot be included directly in the analyses. These adjustments are judgmental and necessarily re f lec t the individual viewpoints of the people evaluating the project for capital funding. Therefore, it is important that t h e financial analysts and t h e decision makers in the company are aware of t h e risk reduction and other benefits of t h e WM options.
While the profitability of a WM audit program is important in deciding whether t o implement a project, environmental regulations may be even more important. A
company operating in violation of environmental regulations can f a c e fines, lawsuits, and criminal penalties for t h e company's managers. Ultimately, the facility may be
forced t o shut down. In this case, the to t a l cash flow of a company can hinge upon implementing the environmental project.
49

FINAL REPORT
The product of waste minimization audit is a report that presents t h e results of the
audit and the technical and economic feasibility analyses. The report also contains recommendations to implement t h e feasible options.
A good final report can be an important tool fo r getting an attractive project implemented. It is particularly valuable in obtaining funding t h e project. In presenting t h e feasibility analyses, it is often useful t o evaluate t h e project under different scenarios. For example, comparing a project's profitability under optimistic and pessimistic assumptions (such as increasinq waste disposal costs) can be beneficial. Sensitivity analyses tha t indicate t h e e f fec t of changes of key variables on profitability are also useful.
The report should include not only performance, but also how it will be
whether t h e technology is
applications;
t h e required resources (for
how much the project will cos t and its expected done. I t is important t o discuss:
established, with brief mention of successful
example, technical expertise and labor t ime) available in-house, versus those resources t h a t must be brought in from outside;
est i mated construct ion peri od;
es t imated production downtime;
how the performance of t h e project can be evaluated after it is implemented.
Before t h e repor t is finalized, be sure t o review the results with the affected departments. I t is important t o solicit the support of t he a f fec ted departments. By having department representatives assist in preparing and reviewing t h e report , t h e chances are increased that the a t t r ac t ive projects are implemented. In summarizing the results, a qualitative assessment of intangible costs and benefits t o t he company should be included. Reduced liabilities and improved image in the eyes of its employees and the community should be considered.
50
SECTION 7 IWLEMElUfING WASTE MINIMIZATION OPTIONS
The f ina l report of the W M audit and feasibil i ty analyses provide the basis f o r
obtaining company funding of WM projects. Because projects are not always sold on
their technical merits alone. A clear description of both tangible and intangible
benefits can help edge a project past i t s competing projects fo r funding.
The champions of the WM audit program should exhibit a strong belief in their ideas
and a confidence that these ideas w i l l work. In the interest of implementing their
idea, they should be flexible enough t o develop alternatives or modifications. They
should also be committed t o the point of doing substantial backgroundlsupport work and anticipating possible problems wi th the idea's implementation. Above all, they
should keep in mind that an idea won't sell if the sponsors aren't sold on i t themselves.
Waste reduction projects generally involve improvements in process eff iciency and/or
reductions in operating costs of waste management. Cost reduction is certainly an
objective o f any well-run business. However, the firm's capital resources may be
priori t ized towards enhancing future revenues, e.g., moving into new lines of business,
expanding plant capacity, or acquiring other companies, rather than towards cutt ing
current costs. If this is the case, then a sound waste reduction project could be
postponed until the next capital budgeting period. It is then up t o the project sponsor
t o ensure that the project i s reconsidered a t tha t time.
Knowing the level wi th in the corporation that has approval authority fo r capital
projects w i l l help in enlisting the appropriate support. In large corporations, smaller
projects are typical ly approved at the plant manager level, medium-size projects at
the divisional vice president level, and larger projects a t the executive committee
level.
An evaluation team made up of f inancial and technical personnel can ensure that a
sponsor's enthusiasm is balanced by objectivity. In l ike manner, it can also serve t o
quel l opposing "can't be done" or "if it ain't broke, don't f i x it" attitudes which the idea
could encounter in the organizational structure. The team should review the project in
the context of 5 1

o past experience in this a rea o f operations;
o what t h e marke t and the competition are doing;
o how the implementation program fits into the company's overall business strategy;
o advantages of the proposal in relation t o competing requests for capital funding.
In most companies, the budget requests for WM projects must compete with budget requests for other projects. Although these projects may be attractive, t h e y a r e also supported by environment a1 regulations.
..
Even when a project promises a high internal rate of return, some companies will have difficulty raising funds internally for capital investment. In this case, t h e company can look t o outside financing. The company generally has two sources t o consider: p r iva te sec to r financing and government-assisted funding.
Pr iva te sec tor financing includes bank loans and other conventional sources of - financing. Government financing is available in some cases. Contac t t h e Small
Business Administration for information regarding loans for pollution control or hazardous waste disposal projects. Some states can provide technical and financial assistance. Appendix C includes a l ist of states providing th i s assistance and addresses t o g e t information.
The installation of a was te minimization project is essentially no different from any other capital improvement project. The phases of t he project include planning, design (pr e l iminar y and detailed), pr ocur em ent , and construct i on (or i ns t allat i on). Waste minimization options t h a t involve operational or procedural changes (without additions or modifications t o equipment) should be implemented as soon as the potential cost savings have been determined.
WM Projects compete with other company projects for manpower. If the expertise and manpower a r e limited in a company, t h e implementation schedule may be drawn out.
52

Some WM projects require high priori ties because of environmental regulations. For example, some process changes may be required t o meet the RCRA landf i l l
restrictions.
In manufacturing and process facilities, the installation of plant or process
improvements are often performed during a scheduled production shutdown. In large
aerospace facilities, production modifications and installations are made during long
holiday weekends so that the impact on the company's production is lessened. The
week-long shutdown between Christmas and New Year's Day i s o f ten used for more
complex installation projects. In chemical plants and o i l refineries, modifications are made during the scheduled annual or biennial shutdown and turnaround periods,
DEMONSTRATION AND FOLLOW-UP
A f t e r the waste minimization option has been implemented, it remains t o be seen how
ef fect ive the option actually turns out t o be. Options that don't measure up t o their
original performance expectations, may require rework or modifications. It i s
important t o get warranties f rom vendors prior t o installation.
The documentation provided through a follow-up evaluation represents an important
source of information f o r future uses of the option in other facilities. The experience
gained in implementing an option at one fac i l i t y can be used t o reduce the problems
and costs of implementing options at subsequent facilities.
MEASURING WASTE REDUCTION
The primary measure o f effectiveness fo r a WM project for a company i s the project's
e f fect on the company's cash flow. The project should pay fo r i tself through reduced
waste disposal costs and reduced raw materials costs. However, it i s also important t o
measure the actual reduction of waste accomplished in a WM project. This
measurement can be used t o satisfy the requirement t o demonstrate waste reduction
as part of the biennial generator reports.
The easiest way t o measure waste reduction i s t o measure the quantities of waste
generated before and a f te r a W M project has been implemented. The difference,
divided by the original waste generation rate, represents the percentage reduction in
53

1 I
rl '1 -
1 . '-1
13 il .
111
t:1
a
waste quantity. affect t h e quantity of waste generated.
However, this simple measurement ignores other f ac to r s that also
Da ta on waste reduction must be collected periodically i n order t o find out if waste generation is being reduced. At a minimum, waste disposal d a t a must be collected every two years t o meet the EPA's reporting requirements. However, more frequent da ta collection is necessary so t h a t a company can effectively arrange its waste minimization, t r ea tmen t , and disposal operations.
There are three important cri teria t o consider in order t o effectively measure waste reduction:
1. Waste reduction measurement must include t h e effect of changes in
production rate.
2. Waste reduction information must be measured in t e rms of the hazardous components.
3. Waste reduction must be measured for specific processes or plant areas.
Correlate W a s t e Reduction on the Correct Basis
Waste generation usually varies proportionately with the production rate. Therefore, t he measurement of was te reduction should be based on the rat io of waste generation rate t o production rate. The equation for percentage waste reduction then becomes:
where W is t h e waste generation rate, P is t he production rate, and subscripts "old" and "new" refer t o the respective rates before and a f t e r t h e WM project is implemented. By accounting for production rate, the e f fec ts of changing production rates are fi l tered out of the measurement of a WM project's effectiveness.
Expressing waste reduction in t e rms of t h e ra t io of waste t o production r a t e s is not f r e e of problems, however. Some of these problems include t h e following:
54

o the difficulty t o account for waste "shifting" from one media t o another
o the danger of ratioing infrequent large quantities (e.9. wastes from painting t h e facility) t o the production r a t e
The first problem is demonstrated by a situation where a company considered controlled evaporation of spent solvent into an air s t r eam fed t o an existing fume incinerator. While this practice would definitely reduce the amount of spent solvent currently sen t offs i te f o r disposal, it belongs t o t h e least desirable t r ea tmen t category. To promote a source reduction or recycling approach, was te reduction should be measured by a rat io of consumed solvent rate t o production rate. Generalizing, was te red,uction can be expressed as follows:
where C is consumption (or process input) rate of a material o f concern.
The second problem is illustrated by a si tuation where a plant undergoes a major overhaul involving equipment cleaning, paint stripping, and repainting. Such overhauls are fairly infrequent and are typically performed every 3-5 years. The decision t o include th i s in te rmi t ten t s t r eam into t h e calculation of t h e waste reduction index, based on ratioing was te rate t o product rate, would lead t o an increase in t h i s index. This decision cannot be justified, since t h e infrequent generation of painting wastes is not a function of production rate. In this case, was te reduction progress should be measured in t e rms of t h e rat io of waste quantity or materials input (e.g., solvents, paint, etc) t o t h e area painted. In general, a distinction should be made between production-related wastes and maintenance-related wastes.
Finally, a f e w waste s t r eams may be inversely proportional t o production rate. For
example, waste resulting from overaged input materials is likely t o increase if the
production rate decreases. This is because the age-dated input materials in inventory are more likely t o expire when use is decreased.
These reasons, care must be taken when expressing t h e amount of waste reduction. This requires that t h e means by which wastes a re generated be well understood.
55

Measure Waste R e d u c t i m in terms of Hazardous Components
In measuring waste reduction t h e quan t i ty of t h e waste compound(s) themselves should be measured. For example, if a drum contains 450 pounds of aqueous solution containing 20% cupric chloride, the quantity of waste should be measured as 90 pounds of cupric chloride.
Many companies have reported substantial reductions in t h e quantities of waste disposed. Much of t h e reduction can be t raced t o good housekeeping and s t eps taken to concent ra te an aqueous waste. Although concentration as such does not fall within the definition of waste minimization, there are benefits t h a t result from concentrating was tewater streams. These include decreased disposal costs (which are usually based on t h e total quantity of waste, including water). Concentration is also desirable if a facility's current wastewater t r ea tmen t system is hydraulically overloaded.
Waste flow ra t e s and quantities can be measured directly. In many cases, however, this is difficult. An a l t e rna te way of determining was te quantities is by material balance. In t h e simplest sense, waste is calculated as t h e difference between t h e
amount of a material used as a raw material, and the amount of t h a t material that appears in the product (or in any by-products). The advantages and disadvantages of determining was te s t ream flows by material balance are described in Section 6.
CZ,&.,U\i %*W%f- k A
4 ~-3 ->\q w 1 9 uU-4 LLjbbt '- -t-u /-a , wd-.n . / C T ~ Y
v&.&4-Q . - & 2 L L Y l C i , c V d &"(j
Measure Waste Reduction for Specific Processes or Areas
An overall material balance that indicates t h e total waste generated by a facility will be useful in elevating a company's progress toward its overall waste minimization goals. However, t he mater ia l balances should be calculated on each individual process in order t o provide meaningful information for individual waste minimization options.
Doing mater ia l balances around individual processes and unit operations often yields
good insights into their satisfactory operation and the means by which wastes are generated. Individual mater ia l balances can be combined together t o charac te r ize a company's overall waste quantities and identify quantities of fugitive emissions.
56
A N ONGOING WASTE MINIMIZATION PROGRAM
A company's waste minimization program should not disband when al l of the feasible
options have been implemented. The program should continue w i th periodic reviews or audits. New options that are found t o be feasible should be implemented. In doing so,
the fac i l i t y can continually reduce i t s quantity of hazardous waste fo r disposal. The
continuing program should display the company's continuing interest in waste
minimization and encourage suggestions for further improvements.
57

APPENDIX A WASTE MINIMIZATION AUDIT WORKSHEETS
1 The worksheets that follows are designed to facilitate the WM audits procedure. Table A 4 lists the worksheets, according to the particular phase of the program, and a brief description of the purpose of the worksheets. $ 1
Table Al l . List of WM Audit Worksheets
Phase Number and Title Purpo8e/Remarks il 1 ] WM Audit Program Planning
and Organization 1. Projed Organization
2. Audit Team Make-up
l i I ' J
WM Audit Preparation and . ' ' 1 Information Gathering 1
i II 3.
4.
5.
6.
7. Products Summary
8. Individual Waste Stream Charademation
9. Waste Stream Summary
Records key members in the WM program task force and the WM audit teams. Also records the relevant organization.
Lists names of audit team members as well as duties. Includes a list of potential departments to consider when selecting the teams.
Site Description
Personnel
Lists background information about the facility, including location, products, and operations.
Records information about the personnel who work in the area to be audited.
This is a checklist of useful process information to look for before starting the audit.
Records input material information for a specificproduction or process area. This includes name, supplier, hazardous component or properties, cost, delivery and shelf-life information and possible substitutes. Each sheet can be used for three materials.
Identifies name hazardous components, production rate, revenues, and other information about products. Each sheet can be used for three products.
Records detailed information about the waste streams. This worksheet consist of four sheets for each waste.
Summarizes waste information, including source, hazard, generation rate, disposal cost, and method of treatment or disposal. This sheet is also used to prioritize waste streams. Each sheet can be used for three waste streams.
(continued)
Process Information
Input Materials Summary
A- 1
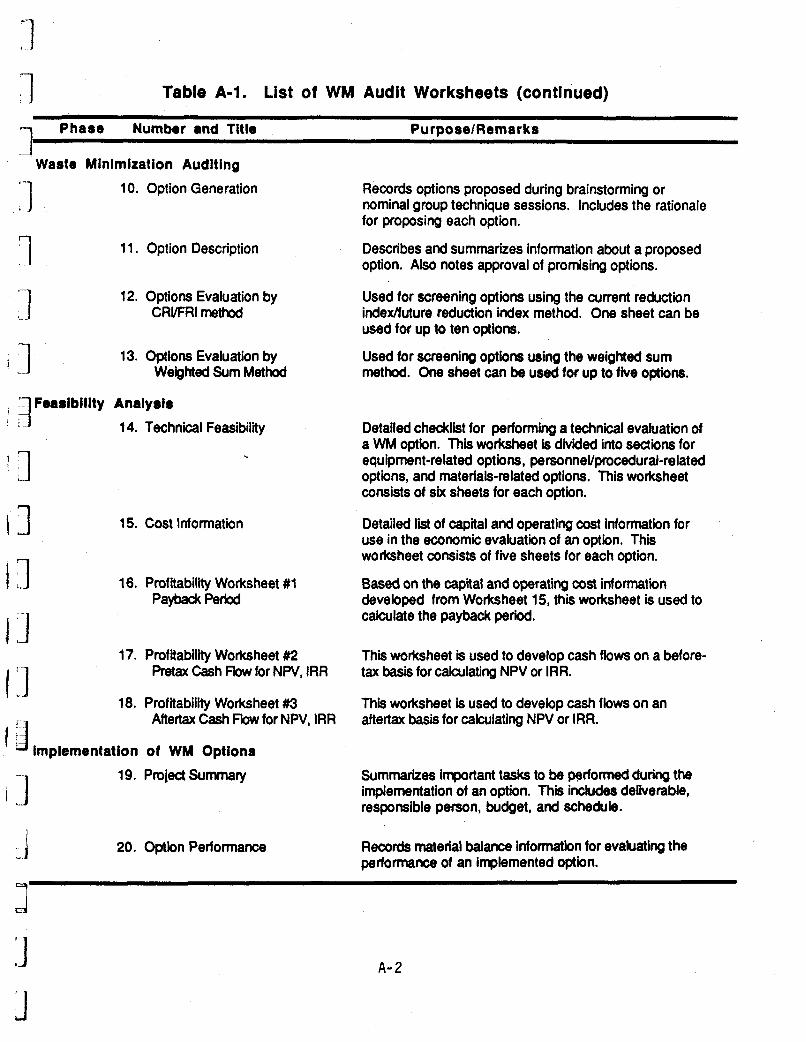
1 Table A-1. List of WM Audit Worksheets (continued)
--I Phase Number and Title PurDoselRemarkS .4
Waste Minimization Auditing n n
10. Option Generation Records options proposed during brainstorming or nominal group technique sessions. Includes the rationale for proposing each option.
11. Option Description Describes and summarizes information about a proposed option. Also notes approval of promising options.
12. Options Evaluation by Used for screening options using the current reduction
used for up to ten options.
Used for screening options using the weighted sum method. One sheet can be used for up to five options.
CRVFRI method indexlfuture reduction index method. One sheet can be
13. Options Evaluation by Weighted Sum Method
f 7 Feasibility Analysis
i L 14. Technical Feasibility
13 15. Cost Information
rl 1 ..J
I "I 1 . J
I :1
Detailed checklist for performing a technical evaluation of a WM option. This worksheet is divided into sections for equipment-related options, personneVprocedural-related options, and materials-related options. This worksheet consists of six sheets for each option.
Detailed list of capital and operating cost information for use in the economic evaluation of an option. This worksheet consists of five sheets for each option.
16. Profitability Worksheet #l Based on the capital and operating cost information developed from Worksheet 15, this worksheet is used to calculate the payback period.
Payback Period
17. Profitability Worksheet #2 This worksheet is used to develop cash flows on a before- tax basis for calculating NPV or IRR. Pretax Cash Flow for NPV, IRR
1 b . d
18. Profitabilitv Worksheet #3 This worksheet is used to develoo cash flows on an Aftertax Cash Fbw for NPV, IRR aftertax basis for calculating NPVor IRR.
d Implementation of WM Options
i j
i
19. ProjectSummary Summarizes important tasks to be performed during the implementation of an option. This includes deliverable, responsible person, budget, and schedule.
20. Option Performance Records material balance informatkn for evaluating the performance of an implemented option.
A- 2

Firm
Site
Date
FUNCTION
Program Dlrector
Project Manager
Site Coordinator
Audit Team Leader
Waste Minimization Audit Prepared BY I
NAME LOCATION TELEPHONE #
Checked By
Proj. No. I S h e e t 1 of 1 Page - of ~
WORKSHEET El
Oraanization Chan (sketch) .

Waste Minimization Audit
Proj. No.
GEPA AUDIT TEAM MAKE-UP
Prepared BY
Checked By
S h e e t 1 of 1 Page __ of -
Functlon/Department Name
Audit Team Leader
Site Coordinator
Operatlons
Englneerlng
Maintenance
Schedullng
Materials Control
Procurement
Shlpplng/Receivlng
Facllltles
Quality Control
Environmental
Account lng
Personnel
R L D
Legal
Management
Con t ractor/Co nsu it an t
Safety
Dutles LocatlorV Manhours , Telephone # Required Lead Suppofl Review

Firm
I woRYEET I
Waste Minimization Audit Prepared BY
Checked By
S h e e t 1 of 1 Page - of - Proj. No.
I SITE DESCRIPTION I 6EPA
Flm:
Plant:
Department:
Street Address :
Clty:
StateiZlP Code:
relephone: ( 1
Wajor Products:
SIC Codes:
Major Unit or: Voduct or: 3peratlons:
:acllitles/Equipment Age:

. 1 Firm
Site
Date 1 Waste Minimization Audit Prepared BY
Checked By S h e e t 1 of 1 Page __ of __ Proj. No.
Att rlbute
Total Staff
Dlrect Supv. Staff
Management
Average Age, yrs.
Annual Turnover Rate %
Senlorlty, yrs.
Yrs. of Formal Education
rralnlng, hrsJyr.
Addltlonal Remarks
I WORKSHEET I
Department/Area Overall
1 4 1 t i
I PERSONNEL I
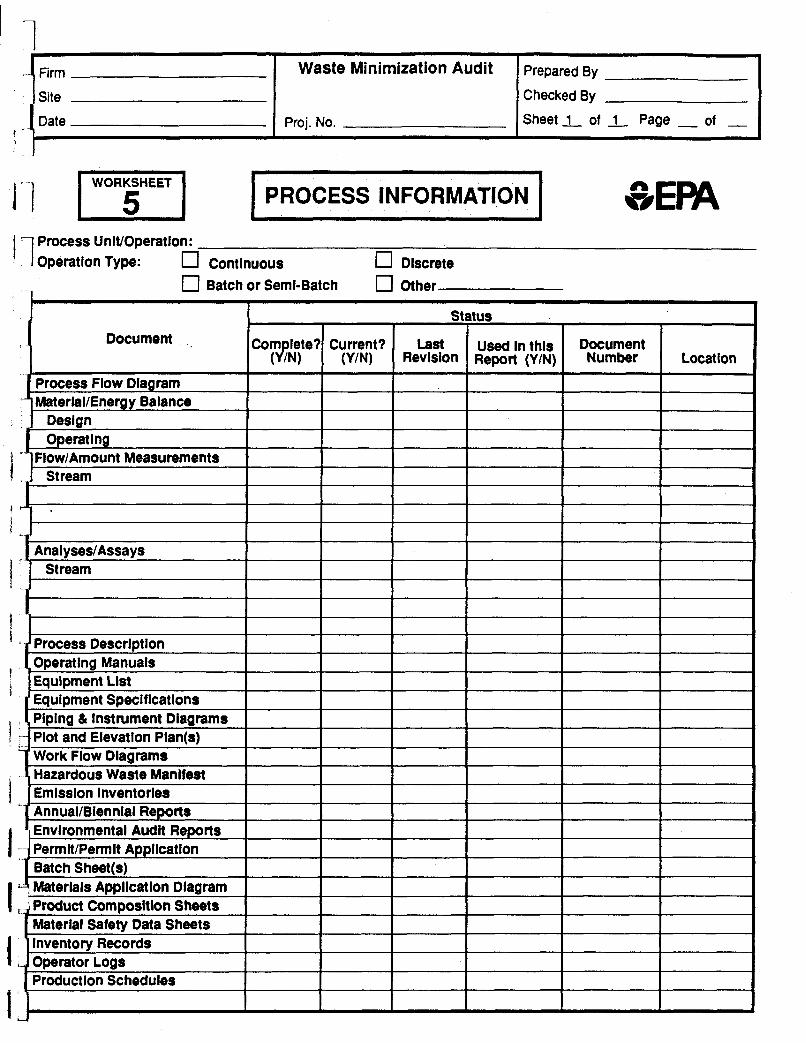
1 '
Firm
Site
Date
Waste Minimization Audit
Proj. No.
Prepared By Checked By
S h e e t 1 of 1_ Page - of -
I PROCESS INFORMATION I - 1 3 Process UniVOperation: - ' . I Operation Type: U Continuous Discrete
0 Batch or Semi-Batch 0 Other
I Status Document -1
Process Flow Diagram Material/Energy Balance
t Measurements
I I I I I I
I I I I
Operating Manuals Equipment List Eauipment Specifications Piping & instrument Diagrams Plot and Elevation Plan(s) Work Flow Dlaarams
inventory Records
Production Schedules 1 J Operator Logs
I ,

7
Firm
Site
Date n Waste Minimization Audit Prepared BY
Checked By
Sheet 1 of 1 Page __ of - Proj. No.
.~ 1 I WORKSHEET I
161 I INPUT MATERIALS SUMMARY I Description
Attribute Stream No.- Stream No.- Stream No.-
NamellD:
Source/Suppiier:
Component/Attribute of Concern:
Annual Consumption Rate Overall:
Component(s) of Concern:
Annual Cost
Purchase Price, $ per: - Overall:
Delivety Mode:
Shipping Container Size & Type: 0 Storage Mode: @ Transfer Mode: @
Shelf Life:
Supplier Would I accept expired materlai (Y/N):
I accept shipping containers (YM):
I revise expiration date (YM):
acceptable Substitute(s); If any
alternate Supplier:
TJ
9: 9:
e.g., pipeline, tank car, 100 bbl. tank truck, truck, etc. e.g., 55 gal. drum, 100 Ib. paper bag, tank, etc. e.g., outdoor, warehouse, underground, aboveground, etc. e.g., pump, forklift, pneumatic transport, conveyor, etc.

Firm Waste Minimization Audit
Site
Date Proj. No.
1 1 1 1
Prepared BY
Checked By
S h e e t 1 of 1 Page __ of -
WORKSHEET 171 Att rlbute
Name/lD:
Component/Attrlbute of Concern:
PRODUCTS SUMMARY
Descript Ion Stream No.- Stream No.- Stream No.-
Annual Productlon Rate
Overall:
Component@) of Concern:
Annual Revenues, $:
Shlpplng Mode:
Shlpplng Container Slze 81 Type:
Onslte Storage Mode:
Containers Returnable (Y/N):
Shelf Llfe:
Rework Posslble (Y/N):
Customer Would
relax sDeclflcatlon (Y/N):
- accept larger containers (Y/N):

Firm Waste Minimization Audit Prepared BY
Checked By
S h e e t 1 of 4 Page __ of - Proj. No.
1. 11
INDIVIDUAL WASTE STREAM > CHARACTERIZATION
L
1 I1 2.
13 13 ' 3.
4.
13 1.1 13
Waste Stream Name/lD: Stream Number
Process UnIVOperatlon
Waste Characterlstlcs
gas 0 liquid 0 solid c] mixed phase
Density, Ib/cuft
Viscosit y/Consistency
PH ,Flash Point *
0 air emission waste water solid waste 0 hazardous waste
Envlronmental Medla
Occurrence
0 continuous
0 discrete
discharge triggered by 0 chemical analysis
Type: 0 0 0
other (describe)
periodic length of period:
sporadic (irregular occurrence)
non-recurrent
5. Generatlon Rate
Annual Ibs per year
Maximum Ibs per
Average Ibs per
Frequency batches per
Batch Size average range

1 , I
1 Waste Minimization Audit Prepared BY
Proc. UniVOper. Checked By
Proj. No.
Firm
Site Date Sheet.3- of 4 Page - of ~
1 I . 1
WORKSHEET El 7.
I INDIVIDUAL WASTE STREAM I CHARACTERIZATION GEPA (continued)
Waste Stream
Management Method
Leaves site In 0 0 0 0
bulk
roll off bins
55 gal drums
other (describe)
Dlsposal Frequency
Applicable Regulations @
Regulatoty Ciassiflcatlon @
Managed
Recycling
0 0 0 cl
0 0 0 0
onsite 0 offsite
commercial TSDF
own TSDF
other (describe)
direct uselre-use
combusted for energy content
redistilled
other (describe)
reclaimed material returned to site? Cl Yes 0 NO 0 used by others
residue yield
residue disposaVrepository
Note 0 list federal, state & local regulations, (e.g., RCRA, TSCA, etc.)
Note 0 list pertinent regulatory classification (e.g., RCRA - Listed KO1 1 waste, etc.)

1 I Waste Minimization Audit Prepared BY 1 Firm I Proc. UniVOper.
Proj. No. I Checked By S h e e t 4 of 4 Page - of -
1 i -1 I7 1 1 ‘ I -1
I -1 I1 ! I1
. I i . I Id 1 . 1 1 i 11 I .I J
I WORKSHEET I
Isl 7.
I INDIVIDUAL WASTE STREAM I L CHARACTERIZATION I
(contlnwd)
Waste Stream Management Method (contlnued)
Treatment
Final Reposltory
biological oxidation/reduction incineration
pH adjustment precipitation
solidification
other (describe)
residue disposallrepository
landfill
pond lagoon
deep well
ocean
other (describe)
Costs as of (quarter and year)
Cost Element: I Unit Price I Reference/Source: I
Onsite Storage & Handling Pretreatment
Container
Transportation Fee
DisDosal Fee Local Taxes
State Tax Federal Tax
Total Disposal Cost I I I

1
Proc. Unitloper.
Proj. No. Checked By
S h e e t 5 of 5 Page - of __
GEM INDIVIDUAL WASTE STREAM CHARACTERIZATION
(continurd)
6. Waste OriginslSources
n Waste Stream of Concern
Mlxed 0 Segregated
Unft(s)/Operatlon(s) of Concern
Waste Orlgln
Formulatlon/Removal of Undesirable Compound
Unconverted Hazardous Raw Materials or Additive
Accumulatlon of Inert Impurity
Depletlon of Key Component(s)
Equlpment Cleanlng
Obsolete Stock
Spoiled Batch/Productlon Run
Spl WLeak
Overspray
Evaporatlve Loss
BreathlngNentlng Losses
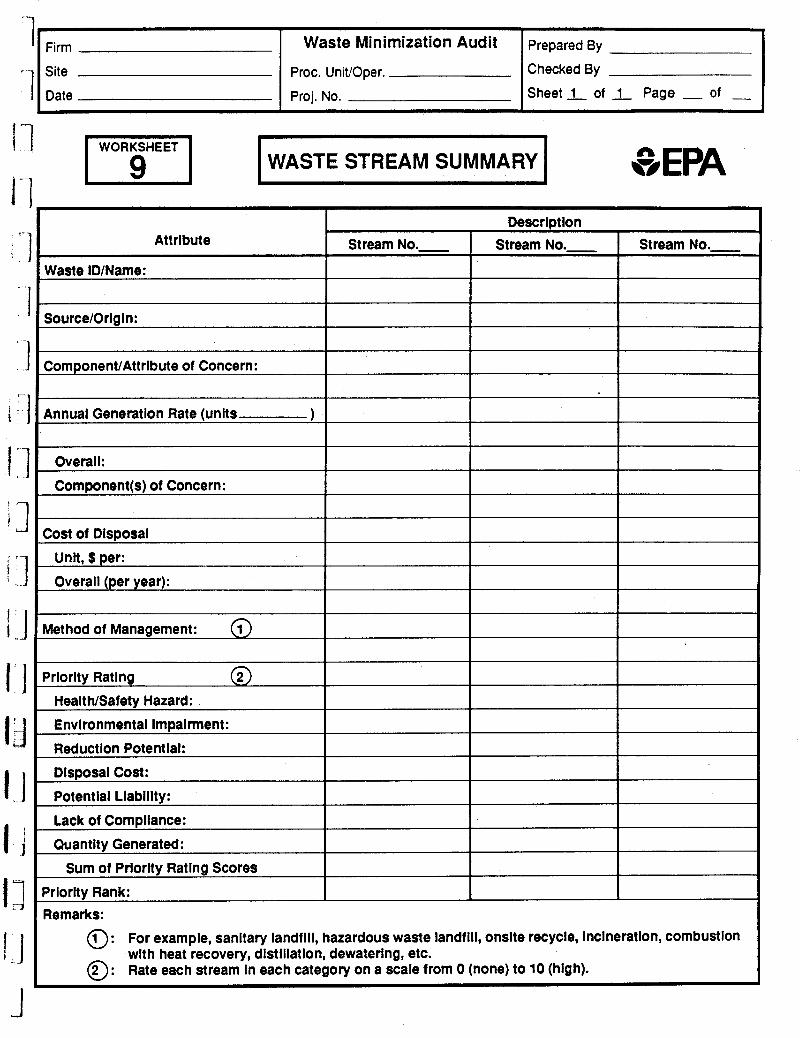
--I '1
Firm
Site
Date
Waste Minimization Audit Prepared BY
Proc. UniVOper. Checked By
Proj. No. S h e e t 1 of 1 Page - of -
I WORKSHEET I
Attrlbute
Waste IDlName:
Source/Orlgln:
Component/Attrlbute of Concern:
Annual Generatlon Rate (units 1
Overall:
Component(s) of Concern:
Cost of Dlsposal
Unlt, $ per:
Overall (per year):
Method of Management: 0
Prlority Ratlng @ Heaith/Safety Hazard:
Environmental impalrment:
Reduction Potential:
Dlsposal Cost:
Potential Llabllity:
Lack of Compliance: Quantlty Generated:
Sum of Priority Rating Scores
Priority Rank: Remarks:
191 Descriptlon
Stream No.- Stream No.- Stream No.-
I WASTE STREAM SUMMARY I GEPA

7
3 3 3 3 ,
Waste Minimization Audit Proc. UniVOper.
Proj. No.
Prepared By Checked By
Sheet 1 of t Page __ of __
7
OPTION GENERATION _I
1 1Meetlng format (e.g., bralnstormlng, nomlnal group technlque)
Meeting Coordinator
1 Meeting Particlpants
~
: I Llst Suggested Options I Ratlonale/Remarks on Optlon
_1’ I

Proc. UniVOper. Checked By
Proj. NO. S h e e t 1 of 1 Page - of -
I wo,;i”” I OPTION DESCRIPTION
Waste Stream(s) Affected:
~
input Material(s) Affected:
Product@) Affected:
indicate Type: c] Source Reduction - Equipment-Related Change
- Personnel/Procedure-Related Change
- Materials-Reiated Change
0 RecyciinglReuse - Onsite - Material reused for original purpose
- Onslte - Material used for a lower-quality purpose - Material sold
- Material burned for heat recovery
0
Briefly describe the option
Treatment
Orlginally proposed by: Date: Reviewed by: Date:
Approved for study? Yes no, by:

Firm __-___-___ Waste Minimization Audit Prepared BY
Site _ _ ~ Proc. UniVOper. Checked By
Date Proj. No. __ S h e e t 1 of 1 Page - of ~
I WORKSHEET I
Option Indexes Descriptions
110.
Notes:
I OPTIONS EVALUATION BY I CRI/FRI METHOD
Waste reduction
effectiveness Extent of
current use Future Current
application reduction potential
1. Values for e, u and p are rated on a scale of 0 (low) to 10 (high). (e)(u) 2. Current reduction index ____
@)(lO-U)(P) 3. Future reduction index = 10 -
100
GEPA
1 Future reduction Rank of options'
index (FRI)'
L
4. Rank options according to highest FRI.

Firm
Site
Date
WORKSHEET m Waste Minimization Audit
Proc. UniVOper.
Proj. No.
I Criteria
Reduction in waste’s hazard
I Reduction of disposal costs
I Reduction of treatment costs I Reduction of input material costs
I Extent of current use in industty
I ~ ~ e c t on product quality (no effect = IO) I LOW capital cost I LOW o M cost
Prepared By
Checked By
Sheet of -1 Page 1 of 1
I Short implementation period
Ease of Implementation
I OPTIONS EVALUATION BY I WEIGHTED SUM METHOD
Weight I #l Option (W)
Sum of Weighted Ratings I: Final I
Evaluation Options Ranking I
Options Rating (R) #2 Option
R I R x W
~~~ ~
#3 Option #4 Option
I
#5 Option

Firm Waste Minimization Audit Prepared BY
WORKSHEET m Proc. UniVOper.
Proj. No.
I TECHNICAL FEASIBILITY I I Checked By
S h e e t 1 of 6 Page - of __
WM Option Description
d 1
! i IJ
1. Nature of WM Option 0 Equipment-Related
0 PersonnellProcedure-Related Materials-Related
2. Equipment - Related Optlon
YES NQ G G
Equipment available commercially? G o De mnst rated commercially ? 0 G In similar application? 0 Successfully?
Describe closest industrial analog
~~~~~ ~ ~
Describe status of development
IJ
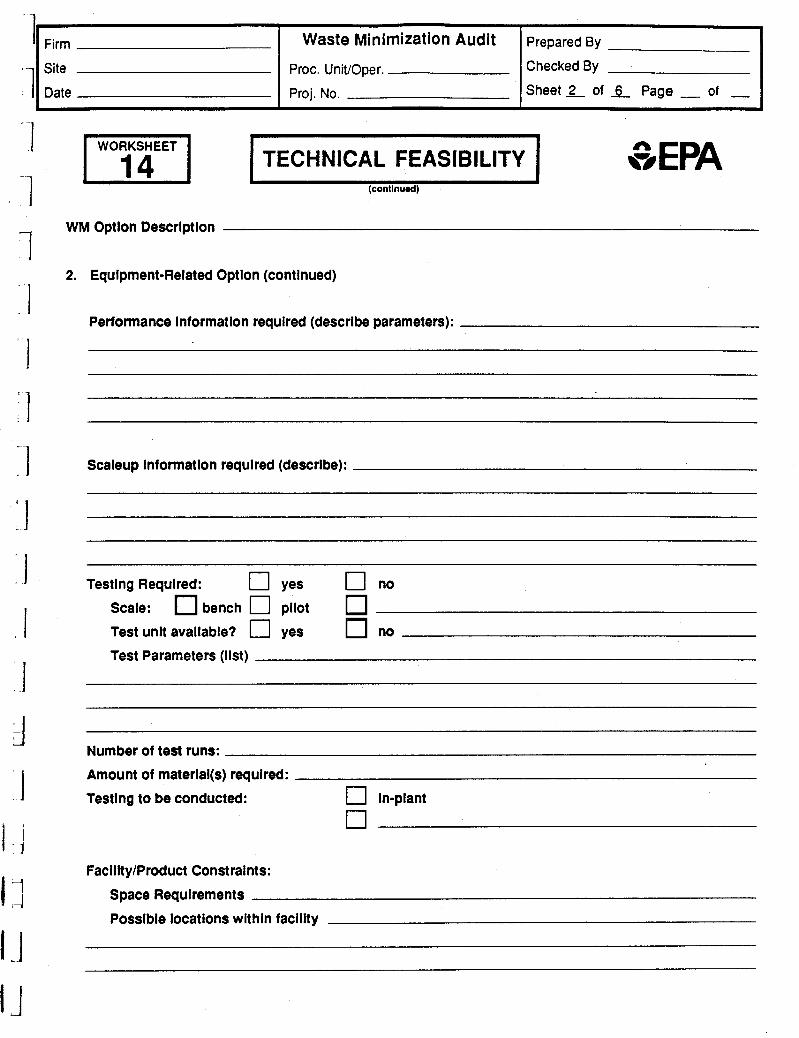
I Firm
I wo,;rET I
Waste Minimization Audit Prepared BY
Proc. UniUOper. Checked By Proj. No. Sheet 2 of .& Page __ of -
TECHNICAL FEASlB ILlTY (conllnud)
WM Optlon Descrlptlon
2. Equlpment-Related Option (continued)
Performance informatlon requlred (describe parameters):
Scaleup informatlon requlred (describe):
Testing Required: 0 yes 0 no Scale: bench 0 pilot
Test unit avallable? 0 yes no Test Parameters (list)
~~ ~~
Number of test runs:
Amount of materiai(s) requlred:
Testing to be conducted: LJ In-piant
0 Faciilty/Product Constraints:
Space Requirements
Posslbie locations within facillty

-1
1 Waste Minimization Audit Prepared BY
Checked By
Firm
Site Proc. UniVOper. Date Proj. No. S h e e t 3 of 6 Page - of -
I """i"il'" I I TECHNICAL FEASIBILITY I I - - I b I
(continuod)
WM Optlon Descrlptlon
2. Equlpment-Related Optlon (contlnued)
Utlllty Requlrements: Electric Power Volts (AC or DC) Amps
Process Water GPM Pressure (pslg)
Quality (tap, demln, etc.)
Cooling Water GPM Pressure (psig) Temp. In Temp. Out
Coolant/Heat Transfer Fluid Type Temp. In Temp. Out
Day
Duty Flow Steam Pressure (pslg) Temp.
Fuel Type Flow
Duty Plant Alr Flow Rate
Inert Gas Flow Rate
Estimated dellvery tlme (after award of contract)
Estlmated lnstallatlon tlme lnstallatlon dates Estlmated productlon downtlme
Wlll production be othewlse affected? Explaln the effect and Impact on production.
Wlll product quallty be affected? Explaln the effect and Impact on quallty.
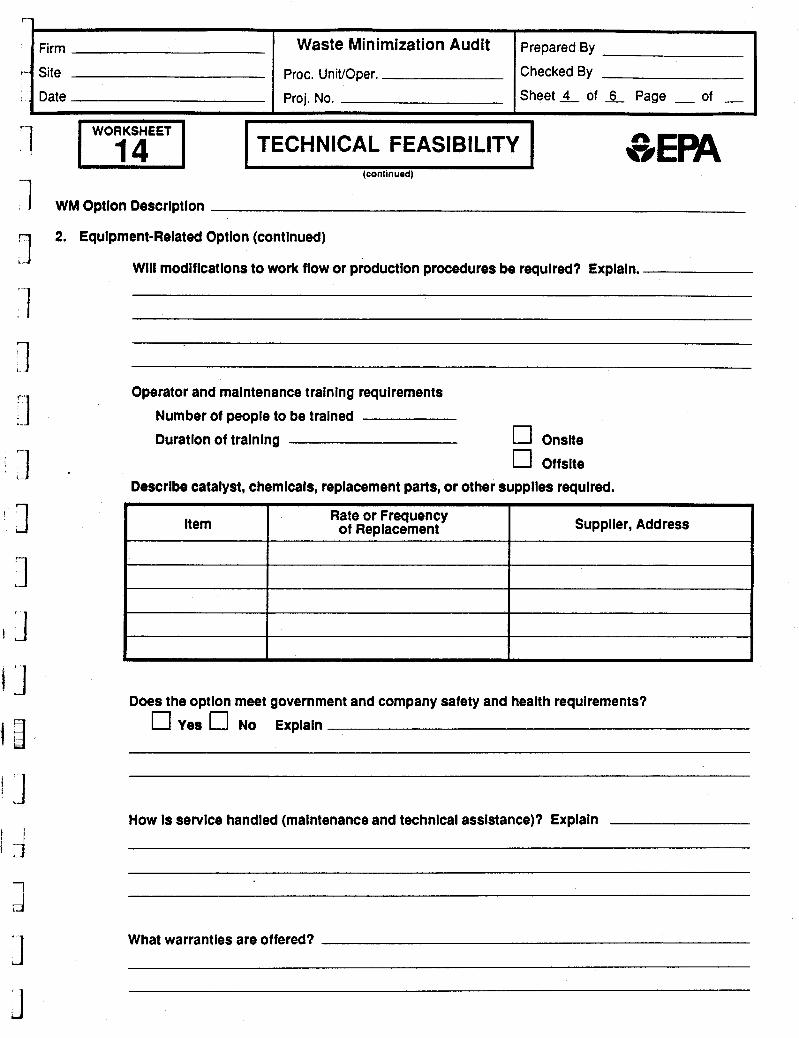
' Firm - Site
. Date
'1 1
Waste Minimization Audit Prepared BY
Proc. UniffOper. Checked By Proj. No. S h e e t 4 of 6 Page __ of -
I WORKSHEET 1
Rem
I 14 I
Suppller, Address Rate or Frequency of Replacement
TECHNICAL FEASl Bl LlTY (continued)
1 WM Optlon Descrlptlon
2. Equlpment-Related Optlon (contlnued) I . 1
:1 n 3 3 3 1 II
Wlll modlflcatlons to work flow or production procedures be required? Explaln.
Operator and malntenance tralnlng requirements
Number of people to be trained
Duratlon of tralnlng 17 Onsite 0 Offstte
Describe catalyst, chemlcals, replacement parts, or other supplles required.
Does the optlon meet government and company safety and health requirements?
0 Yes 0 No Explaln
II
How Is servlce handled (malntenance and technlcal asslstance)? Explaln
What warranties are offered?

Firm Waste Minimization Audit Prepared BY
Checked By
S h e e t 5 of _6 Page ~ of -
' I Proc. UnWOper.
Proj. No.
1 WORKSHEET I TECHNICAL FEASIBILITY
(continued)
WM Optlon Descrlptlon
2.
3.
4.
Equlpment-Related Optlon (contlnued)
Describe any addltlonal storage or materlal handllng requirements.
Describe any addltlonal laboratory or analytlcal requirements
PersonneI/Procedure-Related Changes
Affected Depart men ts/Areas
Tralnlng Requlrements
~~~ ~
Operatlng Instruction Changes. Describe responsible departments.
Materlals-Related Changes (Note: If substantlal changes In equlpment are required, then handle the
optlon as an equipment-related one.)
Has the new materlal been demonstrated commerclally?
In a slmllar appllcatlon?
Successfully ?
yes 0
0 Describe closest appllcatlon.

Firm
1 *
I WORKSHEET I
Waste Minimization Audit Prepared BY
Proc. UniVOper. Checked By
Proj. No. Sheet 6 of 6 Page - of -
I TECHNICAL FEASIBILITY I c I
(continud)
WM Optlon Descrlptlon
4. Materlals-Related Changes (continued)
Affected Departments/Areas
Wlll productlon be affected? Explaln the effect and Impact on productlon.
Wlll product quality be affected/ Explaln the effect and the Impact on product quallty.
Wlll addltlonal storage, handllng or other ancillary equlpment be requlred? Explaln.
Describe any training or procedure changes that are requlred.
Decrlbe any materlal testlng program that will be requlred.
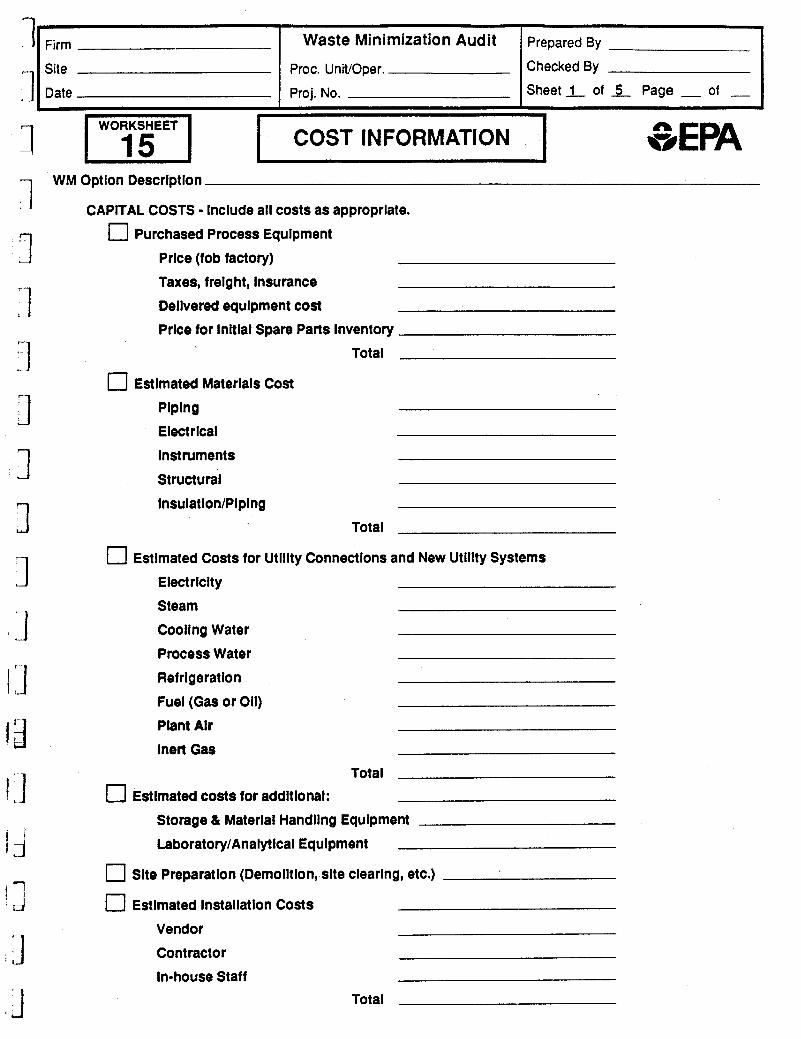
7 a Firm Waste Minimization Audit Prepared BY
Proc. UniVOper. Checked By
Proj. No. S h e e t 1 of 5 Page __ of -
COST INFORMATION ,
CAPITAL COSTS - Include all costs as appropriate.
0 Purchased Process Equipment
&EPA
Price (fob factory) Taxes, frelght, insurance
Deilvered equipment cost
Price for lnltlal Spare Parts Inventory
Total
0 Estimated Materials Cost Plplng
Electrical
Instruments
Structural
Insulatlon/Plping
Total
u Estimated Costs for Utility Connections and New Utillty Systems
0
0 0
Electricity
Steam Cooling Water
Process Water Ref rlgerat ion
Fuel (Gas or Oil) Plant Air
Inert Gas
Total Estimated costs for addltlonal:
Storage 81 Material Handling Equipment
Laboratory/Analytlcai Equipment
Site Preparation (Demolition, site clearlng, etc.)
Estimated Installation Costs
Vendor
Contractor In-house Staff
Total

Firm
I WORKSHEET I
Waste Minimization Audit Prepared BY
Proc. UniVOper. Checked By
Proj. No. S h e e t 2 of 5 Page - of -
COST INFORMATION L
0 Engineering and Procurement Costs
Item
0
cost
0 0
0
Planning
Englneerlng
Procurement
Consultants
Start-up Costs
Vendor
Contractor
In-house
Tralnlng Costs
In-house Outside
Total
Permlttlng Costs
Fees
In-house Staff Costs
lnltlal Charge of Catalysts and Chemicals
GEPA
Total
Working Capltal (Raw Materials, Product, Inventory, Materials and Supplies (not elsewhere specified).
I Item I cost I
~~~ ~
0 Estlmated Salvage Value (If any)

‘1 Proc. UniVOper. Checked By
Proj. No. S h e e t x of -5- Page - of -
Materials
Utillties
Cost item Purchased Process EaUlDment
Storage 81 Materlai Handllng Equlpment
Lab 81 Analytical Equlpment
Slte Preparatlon
cost
~
lnstaliat Ion
Englneerlng and Procurement
Start-up Cost
Unit Cost $ per unit Materlals
Training Costs
Permlttlng Costs lnltlal Charge of Catalysts and Chemicals
Reduction In Quantity Units per time
Decrease In Cost $ per time
Fixed Capital Investment
Working Capital
Total Capital Investment I INCREMENTAL OPERATING COSTS - Include all relevant operating savings. Estimate these costs on an incre-
mental basis (i.e., as decreases or increases over existing costs). 0 BASIS FOR COSTS Annual- Quarterly - Monthly - Dally ~ Other-
0 Estlmated Disposal Cost Savlng
Decrease In TSDF Fees
Decrease In State Fees and Taxes
Decrease In Transportation Costs Decrease In Onslte Treatment and Handling
Decrease In Permlttlng, Reportlng and Recordkeeping
Total Decrease in Disposal Costs
Estlmated Decrease In Raw Materlals Consumptlon

Firm
Site
Date
WORKSHEET El
Waste Minimization Audit Prepared BY
Proc. Unitloper. Checked By
Proj. No. S h e e t 4 of 5 Page - of -
COST INFORMATION (continud)
Estlmated Decrease (or Increase) In Utllitles
Utility Unit Cost Decrease (or Increase) In Quantity Total Decrease (or Increase) I $ per unit I Unit per time I $ per time I 1 I
Electricity I I I Steam
Cooling Process
Process Water
Refrigeration
Fuel (Gas or 011)
Plant Air
inert Air
0 Estimated Decrease (or Increase) in Anclliary Catalysts and Chemicals
CataiystlChemicai Unit Cost Decrease (or Increase) In Quantity Total Decrease (or increase) $ per unit Unit per time $ per time
Estlmated Decrease (or Increase) In Operatlng Costs and Maintenance Labor Costs (Include cost of supervlslon, benefits and burden).
[7 Estimated Decrease (or Increase) In Operatlng and Maintenance Supplles and Costs.
0 Estimated Decrease (or Increase) In Insurance and Llabllity Costs (explaln).

I Firm
Site
Date
Waste Minimization Audit Prepared BY
Proc. UniVOper. Checked By
Proj. No. S h e e t 5 of 5 Page - of -
0 Estlmated Decrease (or Increase) In Other Operatlng Costs (explaln). -7
COST INFORMATION L
1- I
~ ~~~
Operatlng CosWRevenue Item Decrease in Disposal Cost Decrease in Raw Materlals Cost
Decrease (or Increase) In Utliltles Cost
Decrease (or Increase) In Catalysts and Chemlcals
Decrease (or Increase) in 0 & M Labor Costs
Decrease (or Increase) In 0 & M Supplies Costs
Decrease (or Increase) In Insurance/LlabiIltles Costs
Decrease (or Increase) in Other Operatlng Costs
Incremental Revenues from Increased (Decreased) Productlon
Incremental Revenues from Marketable By-products
Net Operating Cost Savings
I WORKSHEET I
$ per year
INCREMENTAL REVENUES u Estlmated Incremental Revenues from an Increase (or Decrease) In Productlon (explain).
u Estlmated Incremental Revenues from an Increase (or Decrease) in Marketable By-products (explaln).
INCREMENTAL OPERATING COST AND REVENUE SUMMARY (ANNUAL BASIS)
Decreases in Operatlng Cost or Increases In Revenue are Positlve.
Increases In Operating Cost or Decreaes In Revenue are Negative.

7
Proc. UniVOper.
Proj. No.
I Waste Minimization Audit Prepared BY I '1 Firm
I Checked By Sheet 1 of 1 Page - of __
WORKSHEET E l I PROFITABILITY WORKSHEET # 1 I PAYBACK PERIOD
Total Capital investment ($)
Annual Net Operating Cost Savings ($ per year)
- - Total Capital Investment Annual Net Operating Cost Savings
Payback Period (in years) I

Firm
7 Waste Minimization Audit prepared By
Proc. UniVOper. Checked By Proj. No. S h e e t i of 1 Page __ of -
GEPA PROFITABILITY WORKSHEET # 2 PRETAX CASH FLOW FOR NPV, IRR
Firm
7
I Cash Incomes (such as net operating cost savings and salvage value) are shown as positive. Cash outlays (such as capital investments and Increased operating costs) are shown as negative.
Waste Minimization Audit prepared By Proc. UniVOper. Checked By Proj. No. S h e e t i of 1 Page __ of -
Llne
.
Constr. Operating' Year
0 1 1 2 I 3 4 5 1 6 7 a
.
K Cash Flow (pretax)
L
M Net Present Value (NPVY
Present Value of Cash Flow
Present Worth' (5% discount)
(10% discount)
(15% discount)
(20% dlscount)
(25% dlscount)
1 Adjust table as necessary If the antlclpated project llfe Is less than or more than 8 years. 2 Salvage value Includes scrap value of equipment plus sale of working capital minus demo=
litlon costs. 3 The present value of the cash flow Is equal to the cash flow multiplied by the present worth factor. 4 The net present value Is the sum of the present value of the cash flow for that year and all of the
preceeding years. 1
1.0000 0.9524 0.9070 0.8638 0.8227 0.7835 0.7462 0.7107 0.6768
1 .OOOO 0.9091 0.8264 0.751 3 0.6830 0.6209 0.5645 0.51 32 0.4665
1.0000 0.8696 0.7561 0.6575 0.5718 0.4972 0.4323 0.3759 0.3269
1.0000 0.8333 0.6944 0.5787 0.4823 0.4019 0.3349 0.2791 0.2326
1.0000 0.8000 0.6400 0.5120 0.4096 0.3277 0.2621 0.2097 0.1678
5 The formulafor the present worth factor Is rate.
(l;r)n where n Is years and f Is the discount
6 The Internal rate of return (IRR) Is the discount rate (r) that results in a net present value of zero over the life of the project.

I I ' ~ Firm Waste Minimization Audit Prepared BY
Proc. Unitloper. Checked By Proj. No. S h e e t 1 of 1 Page - of -
wl 3EPA PROFITABILITY WORKSHEET # 3 _AFTERTAX CASH FLOW FOR NPV, IRR
Cash Incomes (such as net operating cost savings and salvage value) are shown as positive. Cash outlays (such as capital Investments and Increased operating costs) are shown as negative.
Conrtr. Operating' Year Line Year I 1 I I I I I I
d 3
-
] A Fixed Capital Investment
B +Working Capital
C Total Capital lnvestment
L
3 E Net Operating Costs Savings
F - Interest on Loans
H Taxable Income
I -incomelax
J Aftertax Profit
K + Depreciation
M - Capital investment (line C)
N + Salvage Value (line D) 1 0 Cash Flow (aftertax)
' P Present Value of Cash Flow
0 Net Present Value (NPV).'
Present Worth' (5% discount) 1.0000 0.9524 0.9070 0.8638 0.8227 0.7835 0.7462 0.7107 0.6768
(10% discount) 1.0000 0.9091 0.8264 0.7513 0.6830 0.6209 0.5645 0.5132 0.4665
(15% discount) 1.0000 0.8696 0.7561 0.6575 0.5718 0.4972 0.4323 0.3759 0.3269
(20% discount) 1.0000 0.8333 0.6944 0.5787 0.4823 0.4019 0.3349 0.2791 0.2326
(25% discount) 1.0000 0.8000 0.6400 0.5120 0.4096 0.3277 0.2621 0.2097 0.1678
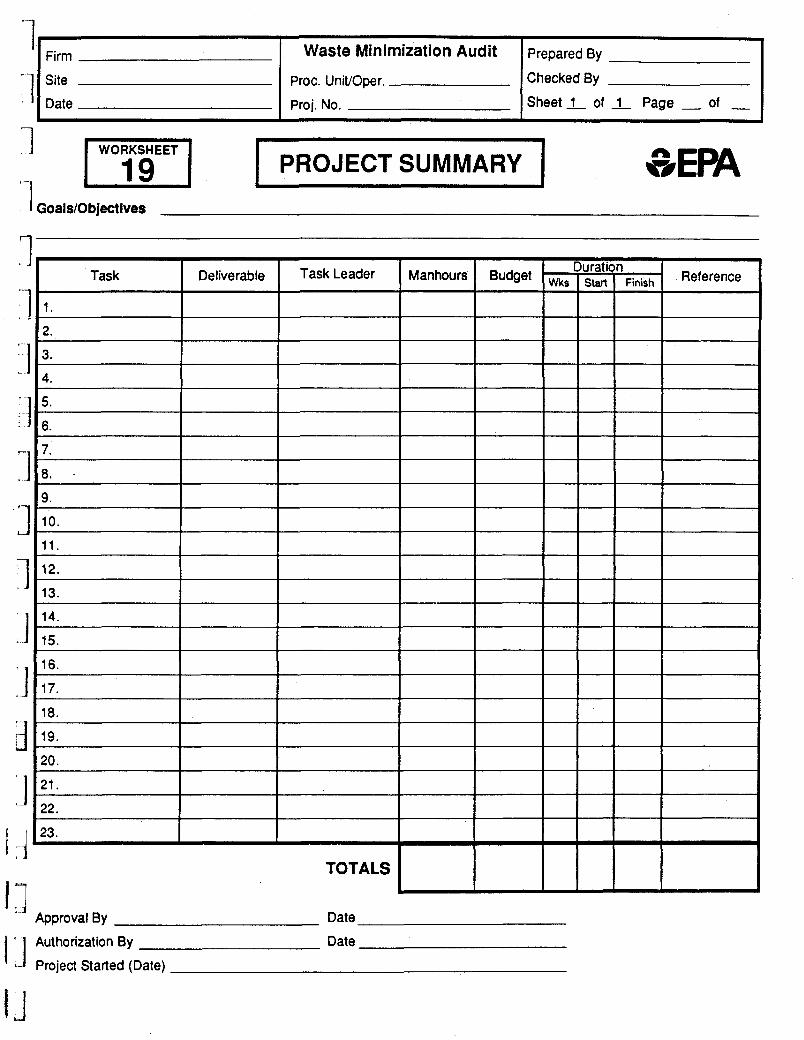
7 Firm
Site
Date
1
Waste Minimization Audit Prepared BY
Proc. UniVOper. Checked By Proj. No. S h e e t 1 of 1 Page _. of -
I 1
Task Deliverable Task Leader
1.
2.
3. 4.
5. 5.
7.
3. . 3.
10.
11.
12.
13.
14.
15.
16.
17.
18.
19.
20. 21.
22.
!3.
TOTALS
Duration Manhours Budget wks Finish Reference
~
..
I WORKSHEET I I PROJECTSUMMARY I I GoaWObjectlves
Approval By Date
Authorization By Date
Project Started (Date)

Firm Waste Minimization Audit Prepared BY
Site Proc. UnWOper. Checked By
Date Proj. No. S h e e t 1 of 1 Page __ of -
W 0 R KS H E ET LLJ I OPTION PERFORMANCE I WM Option Description
Baseline (without optlon)
Projected 0 Actual
Perlod Duration From To
input Materlais Consumption per Period Production per Period UnRs ( 1
Materlai Pounds
Waste Generation per Period
Waste St ream Pounds
Substance(s) of Concern - Generation Rate per Period
Waste St ream Substa ncg Pounds
pounds/Unit Produd
pounds/Unit Product
pounds/Unit Product

1 1 1 n
A P E N X X B WASTE MINIMIZATION TECHNIQUES
The following tables l i s t techniques and practices tha t f o r waste reduction t h a t are
applicable a wide range of industries. Most of the techniques l isted here are source
reduction.
Table 8-1. Waste Reduction Measures for Surface Coating Operations
Table 6-2. Waste Reduction Measures for Parts Cleaning Operations
Table 6-3. Waste Reduction Measures for Equipment Cleaning Operations
Table 6-4. Waste Reduction through Goods Operating Practices
Table 6-5. Waste Minimization by Materials Handling, Storage, and Transfer
Table 8-6. Waste Reduction Options for Electroplat ing Operations.
B- 1

TABLE B-1. WASTE REDUCTION MEASURES FOR SURFACE COATING OPERATIONS
Coating overspray Coating materiel that f a i l s . Maintain 50 X overlap of spray pattern The coated object does not look streaked and wastage of coating
gun i s arched 45 degrees the over- spray can be as high as 65 %.
1.2 t o reach the object being coated and the workpiece material i s avoided. I f the spray
- Maintain 6-8" distance between spray g m
- Maintain a gun speed of about 250 ft/min. . Hold gun perpendicular t o the surface ~ Trigger gun at beginning and end of each
pass - Proper t ra in ing of operators - Use spray robots ~ Avoid excessive a i r pressure for coating
- Recycle overspray
By a i r pressure adjustlnent over- spray can be reduced t o 40 %. atorizat ion
2 2 2
3
W I Iv
- Use electrostat ic spray systems - Use air-assisted a i r - less spray guns
Can reduce overspray by 40% Increases transfer ef f ic iency
in place of air-spray guns
- Avoid adding excess thinner ~ Use abrasive media str ipping - Use bead-blasting for paint str ipping - Use cryogenic str ipping - Use caustic str ipping solutions ~ Clean coating equipment a f te r each use
- Keep sotvent soak tanks away from heat
- Use high-sol ids formulations Lowered usage of solvents ~ Use powder coatings Avoids solvent usage - Use water-borne formulations Avoids solvent usage
S t r i p p i n g wastes Coating removal fron parts Reduces str ipping wastes dw t o rework Solvent usage i s eliminated Solvent usage i s eliminated Solvent usage i s eliminated Solvent usage i s eliminated
p r io r t o applying neu coat.
Solvent emissions Evaporative losses from process equipent and sources coated parts
Equipment c l e w Process equipment cleaning ~ l i gh t - to -dark batch sequencing uas t es w i t h solvents - Produce large batches of s im i la r ly coated
objects instead of slaall batches of d i f fe ren t ly coated i tens
. Isolate solvent-based spray booths from water-based spray booths
- Proper labeling of a l l containers - Standardize solvent usage l h i s results i s a larger, and more
- Segregate waste streaas l h i s improves recyc lab i l i t y
. Close f loor drains to encourage the use of dry cleanup methods
recyclable waste
spi I I s inadvertent releases of process l iqu ids
Useful only when co l lec t ion and rework of s p i l l s 1s not erryloyed
~- ____ -. . -. -. -- - .
4 4
5
6 7 8 1
9
10'11 4,12
13
14
12

I A L E 8-2. WASTE REDUCTON MEASURES FOR PARTS EANtNG WERATK)NS
-~ _ _ - - __________ -- -
Reference Remarks Uas t e Source/Or i g i n Uaste Reduction Measures
- - _- -
S p e n t solvent Contiminated solvent from . Use water-soluble cu t t ing f lu ids instead
- Use peel coatings in place of protective
~ Use aqwous cleaners - Use aqueous paint str ipping sotutions - Use cryogenic str ipping - Use bead blast ing for paint str ipping - Use u l t i - s t a g e countercurrent cleaning - Maintain solvent qua l i t y - Prevent cross-contarination - Prevent drag-in from other processes - P r o q t removal of sludge from the tank - Standardize solvent usage
parts cleaning operations of oil-based f lu ids
o i l s
A i r emissions
9" W
Rinse uater
Solvent leakage fram ~ Use r o l l type covers, not hinged covers degreasers and cold tanks - Increase freeboard height - I ns ta l l freeboard ch i l l e rs - Avoid disturbing vapor space in the tank - Use si lhouette entry covers - Proper equipent layout - Avoid rapid insert ion and removal of itens
- Avoid "piston ef fect" uhen objects are
- Reduce solvent dragout by proper design and operation of rack system - I ns ta l l a i r je ts t o blow parts dry
* Use fog nozzles on r inse tanks ~ Proper design P operation of barrel system + Use countercurrent r inse tanks
inserted in the tank
Uater-rinse t o remove solvent carr ied out with the parts leaving the cleaning tank
- Use water sprays on r inse tanks
This could eliminate the need for solvent cleaning S a n e as above
Solvent usage i s eliminated Solvent usage i s eliminated Solvent usage i s eliminated Solvent usage is e l i a i m t e d
Prevent solvent f r a going "acidi1
larger and a single waste that i s nore amenable t o recycl ing resu l ts
24 t o 50 X reduction in emissions 39 X reduction in solvent emissions
The speed of workpiece in to and out of tank should be below 11 ft/lain. Cross-sectional area of the items should be less than 50% of tank area
The drag-out can be 0.4 ga1/1000 f t 2 t o 24 for poorly drained parts
Uater f l o w i s 0.1 gpm for 3 cwn te r - r inses corpared to 10 gpn for a single r inse tank More e f f i c i en t r ins ing i s achieved
8 7 6
15 1s 15
16
17
15
15 15
15 .

TABLE 8-3. WASTE REDUCTION MEASURES FOR EQUIPMENT CLEANING OPERATIONS
__.__ _ _ - _- __-_ Uaste Source/Origln Uaste Reduction Measures Remarks Reference
___-_ ._ - -
Spent solvent or inorganic media; based cleaning . Proper production scheduling solutions
Tank cleaning operations - Maximize dedication of process equipnent - Avoid unnecessary cleaning
- Closed storage and transfer systems - Provide suff ic ient drain t i m e for l iqu ids Minimizes leftover material - Lining the equipment.to prevent clingage Reduce clingage - Vigging" of process lines - Use Yflou-over61 method of cleaning - Use high-pressure spray nozzles - Use courltercurrent r insing - Use clean-in-place system - Clean equiplent innediately a f te r use
- Reuse cleanup solut ion several times - Reuork cleanup solvent in to useful products - Segregate uastes by solvent type - Standardize solvent usage - Reclaim solvent by d i s t i l l a t i o n
Scaling and drying up can be prevented
Minimizes solvent consurption
Prevent hardening of scates that require increased degree of cleaning
Onsite or o f f s i t e recycling
18 19
m P
Spent acidic Heat exchanger cleaning solutions, waste-
- Use bypass control or punped recycle t o maintain turbulence during turndoun
uater sludges - Use saDoth heat exchange surfaces Electroplated or Teflon tubes 20 - Use on-stream cleaning techniques For example, "Superscrubbern8 21 - Use hydroblasting over chemical cleaning
h e r e possible ______

TABLE 8-4. WASTE REDUCTION THROUGH Gooi) OPERATING PRACTES _______ -. -
Reference Good Operating Practice Program ingredients Remarks
Uaste minimization progr- - Forming a team of qua l i f ied individuals These are conducted t o develop and 22 - Establishing pract ical short term and
- A t lo t resources and budget for the program - periodic monitoring of program effectiveness
screen waste minimizations options short term goals
E n v i r m t a l audits/reviews - A s s d l e pert inent docunents These audits are conducted to monitor 23,24 - Conduct envirornental process reviews - Conduc t a procedure evaluation - Carry Out a s i t e inspection - Report on and fol low-up on the findings
colpliance with regulations
W I vl
Loss prevention program - Establish S p i l l Prevention Control and Cocnteraeasure (SPCC) plans storage f a c i l i t i e s
- Conchct hazard assessment in the design and operating phase
- use properly designed tanks/vessels only fo r the i r intended purposes
- i n s t a l l overflow alarms fo r a l l containers - Test alarms per iodical ly - Maintain physical i n teg r i t y of a l l containers - Set y, wr i t ten procedures for a l l loading/
unloading end transfer operations - I ns ta l l secondary containrnent areas - forbid operators t o bypass interlocks, alarms, or a l te r set points without authorization
- isolate equipent or process l ines that leak or that are not in service
- Use seal- less p u p s - use bellows-seal valves - Docunent a l l spi l lage and related economics - ~ i s c i p l i n a r y actions fo r any violat ions - Perform overal l material balances and estimate
the quanti ty and do l la r value of a l l losses - Use f loa t ing roof tanks for VOC storage ~ Use special conservation vents on f i x e d roof
tanks ~ Use vapor recovery systems
Required by law (40 CFR 112) fo r o i l
3,25,26

TABLE 84. WASTE REDUCTION THROUGH GOOD OPERATING PRACTICES (CONTINUED)
W I 0,
Good Operating Practice Program Ingredients
Preventive maintenance program - Use equipnent data cards on equipment characteristics, location, and maintenance - Maintain a master preventive maintenance (PH) schedule - Deferred PM reports on equipment
- Maintain equipment history cards - Maintain equipent breakdom reports - K e e p vendor maintenance manuals hardy - Maintain a manual or computerized repair
Training to be provided on: - Safe operation of the equipnent - Proper materials handling - Proper spill-cleanup procedures - Economic and enviromtental ramifications of hazardous uaste generation/disposal
- Detecting releases of hazardous materials - Emergency procedures - Use of safety gear and equipnent
hi s tor ies
Training/Auareness Building Prograr
Effective SLpervision
Uaste Segregation
- Better coordination among the various parts of an overall operation
- Increased opportunity for early detection of mistakes
- lessened chance of uaste generation due to spills or off-specification materials due to the carelessness of the operators
- Prevention of mixing of hazardous uaste with nonhazardous uaste
- Isolate hazardous uaste by contaminant - Isolate liquid uastes from solid uastes
Reference Renarks --.___
These progrants are conducted to cut production costs and decrease equiplent dountime in addition to preventing uaste releases due to equipment failure
27,28,29
These programs are conducted to reduce occrpational health and safety hazards in addition to reducing uaste generation due to operator or procedural errors
30
Closer supervision i s necessary to increase production efficiency and inadvertent uaste generation
These measures can result in louer 4 uaste haulage volumes and easier disposal of the hazardous uaste

TABLE 84. WASTE REDUCTION THROUGH GOOD +ERATING PRACTICES (CONTINUED)
Good Operating Practice Program lngredients Renarks Reference -_
Uaterial/Uaste Tracking and - Avoid over-purchasing These procedures are enployed t o find 31.32 Inventory Control - Ensure inventory q w n t i t y does not go uaste - Periodic inventory of bulk material e f fo r t s are to be concentrated - Ensure that no containers stay in the
inventory longer than a specif ic period - Order neu material only on as-needed basis - Revieu material procurement specifications - El ia inate s h e l f - l i f e requirements for
- Validate s h e l f - l i f e expirat ion dates - Use ccclputer-assisted plant evaluation system - CaneLuct frequent materials tracking - Set rp "ed stations fo r chemicals
areas where the uaste minimization
stable coapouds
dispensing and uaste colkection
Cost Accounting/Apportiorrnent - Cost accounting done fo r a l l uaste streams leaving the f a c i l i t i e s - Apportioning uaste disposal cost t o operation based on uaste generated by that operation
Altering production schedule can have a major irpact on uaste minimization
W Production scheduling/Pl#ning - Uaximize batch size I v - Dedicate equipnent t o a single product
- Al ter batch sequencing t o minimize cleaning
- Clean equipnent pronptly frequency (e.9. l igh t - to -dark batch sequence)

TABLE B-5. WASTE MINIMIZATION BY MATERIALS HANDLING, STORAGE. AND TRANSFER
W
03
Uaste/Source Uaste Hininizat ion Heasure Remarks Reference
Exp i red raw material
Sp i l l s and leaks
- Avoidance of excess rau material purchase - Accept raw material only a f te r inspection - Return expired material t o supplier - C o n h c t frequent inventory checks - Proper label ing of a l l containers
- Store containers in such a uay as t o allow for visuat inspection for corrosion P leaks
- Stack containers in a uey t o minimize the c h m e of tipping, pnctur ing, or breaking
- Prevent concrete %westing" by rais ing the d r u o f f storage area - Maintain material safety data sheets t o correct ly handle s p i l l si tuations - Provide .dcquete l i gh t i ng in the storage area
- Maintain a clean, even surface in transportat ion areas - Keep ais les clean of obstructions
- Haintain distance between incompatible chemicals - Haintain distance betwen d i f fe ren t types of chemicals t o prevent cross-contamination
- Avoid stacking containers against process
- Follow manufacturers1 suggestions on the storage and handling of a l l raw materials
- Insulat ion and inspection of e lec t r i c c i r c u i t r y fo r corrosion P potential sparking
equipPnt
C L i ngage - Use Large containers instead of small containers uhenever possible
~ Use of aspect r a t i o of 1 for cy l indr ica l containers t o minimize wetted area
- Enpty druas and containers thoroughly before cleaning or disposal

~ ~ ~ ~ ~ ~ ~ ~ ~ " ~ ~ f ~ ~ ~ ~ ~ ~
TABLE B-6. WASTE REDUCTION OPTIONS FOR ELECTROPLATING OPERATIONS
W
W
Drag-out minimization Workplace positioning Withdrawal speed and drainage Drag-out recovery Concentration Temperature Surfactants
Extension of bath life Drag-in reduction Deionized water Impurity removal
Rack maintenance Anodes
Retum Solution
Minimization of rinse water Automatic flow control Agitation Sprayflog nozzles Cbsed-loop rinsing
Non-cyanide solutions Copper plating Cadmium plating Silver stripping
Alternate plating techniques Ion vapor deposition
Good operating practices Segregation Traininglsupervision Spill and leak prevention Maintenance Mat e rial t racki ngko nt ro I
- By reducing drag-out, less of the plating solution leaves the tank. - Proper positioning of the part on the rack reduces solution drag-out. - Slow speeds reduce drag out. Parts should be allowed to drain over tank. - Drain boards and drip tanks can be used to recover plating solutions. - Reducing the concentration of the bath reduces bsses due to drag-out. - increased temperature reduces solution viscosity / surface tension. - Lower the surface tension of the solution which reduces drag-out.
- Reduces the frequency of spent bath replacement. - Efficient rinsing prevents crossantamination of solutions. - Reduces the build up of calcium and magnesium ions in the bath. - Can be performed by chemical precipitation, freezing (carbonates), or by filtering
(particulates). - Corrosion and salt deposits on the rack can contaminate plating baths. - Use of purer anodes and bags will prevent insoluble impurities in the anodes from
entering the bath. Anodes should be removed when not in use. - Some manufacturers of plating solutions will reprocess spent baths.
- Reducing flow promotes recovery of metals and makes treatment more effective. - Reduces water use while insuring required degree of rinsing. - Increases rinsing efficiency which reduces the volume of water needed. - More efficient than rinsing a part in a tank of water. - Susceptible to impurity build-up and may require the use of a recovery system, e.g.
- Eliminates the generation of a cyanide-bearing waste. - Pyrophosphate copper plating solution may be used as a replacement. - Substitutes include cadmium fluohrate and acid sulfate cadmium baths. - May be performed with potassium nitrate and ammonium hydroxide.
- Eliminates the use of hazardous plating solutions. - Can be used to plate parts with cadmium or aluminum. Required equipment is very
- Helps to minimize waste generation through procedural policies. - Proper segregation can prevent mixing of hazardous and non-hazardous waste. - Operator awareness can help identify and eliminate wasteful practices. - Reduces the loss of materials and the generation of clean-up wastes. - Preventative and corrective maintenance reduces spills, leaks, and upsets. - Provides the facility with accurate material balances which can be used to identify
evaporation, ion exchange, reverse osmosis, electrodialysis.
complex and expensive.
and quantify material and waste handling problems.

1 I I
' 1 I 1 1 - 1 . 3 .
J . I
1 ." -1
1. Kohl, J., J. Pearson, and P.Wright. Managing and recycling solvents in the furniture industry. North Carolina State University, Raleigh, NC, 1986.
2. Lenckus, D. Increasing productivity. Finishing wood and wood products magazine. May 1982, pp 44-66.
3 . Campbell, M.E., and W.M. Glenn. Profit from pollution prevention. The pollution probe foundation. Toronto, Canada, 1982.
4. Kohl, J., P. Moses, and B. Triplett. Managing and recycling solvents: North Carolina practices, facilities and regulations. North Carolina State University, Raleigh, 1984.
5. Durney, J.J. How to improve your paint stripping. Product finishing. Dec. 1982, pp 52-53.
6. Higgins, T.E. Industrial process modifications to reduce generation of hazardous waste at DOD facilities: phase I report. CHZM Hill, Washington, DC, 1985.
7. Cryogenic paint stripping. Product Finish. December 1982.
8. Mallarnee, W. M. Paint and varnish removers, in Kirk- Othmer encyclopaedia of chemical technology, 3rd ed, vol. 16, pp 762-767, 1981.
9. Sandberg, J. Final report on the internship served at Gage Tool Company. Minnesota Technical Assistance Program, Minnesota Waste Management Board, Minnesota, 1985.
10. Powder Coatings Institute. Information brochure. Washington, 1983.
11. Cole, G . E . VOC emission reduction ands and other benefits achieved by ma] or powder coating operations. Paper no. 84-38.1 presented at the Air Pollution Control Association. June 25, 1984.
12. Department of Health Services, State of California. Alternative technology for recycling and treatment of hazardous waste. 3rd Biennial report. Sacramento, 1986.
I I .I 1 1
i .&I
13. California Department of Health Services. Guide to _ _
solvent waste reduction alternatives. October 1986, pp 4-25 to 4-49.
14. Kenson, R . E . Recovery and reuse of solvents from VOC air emissions. Environmental Progress. Aug. 1985, pp 161-165.
IJ B- 10

15. Durney, L.J., ed. Electroplating engineering handbook. 4th ed. Van Nostrand Reinhold Co, New York, NY, 1984.
16. ASTM. Handbook of vapor degreasing, special technical publication 310-A. ASTM, Philadelphia, PA, April 1976.
17. Smith, C. Troubleshooting vapor degreasers. Product Finish. November, 1981.
18. Loucks, C.M. Boosting capacities with chemicals. Chemical Engineering Deskbook Issue. Vol. 80, No. 5, 1973, pp 79-84.
19. 3M Corporation. Ideas - a compendium of 3M success stories. St. Paul, MN.
20. Fromm, C.H.,, S . Budaraju, and S.A. Cordery. Minimization of process equipment cleaning waste. Conference proceedings HAZTECH International, Denver, Colorado, August 13-15, 1986, pp 291-307.
21. Versar and Jacobs. Waste minimization: issues and options, Vol. 11. U.S. Environmental Protection Agency, Washington, DC, October 1, 1986.
22. Fromm, C.H., and M.S. Callahan. Waste redcution audit procedure. Hazardous Materials Control Research Institute Conference Proceedings. Atlanta, GA, 1986, pp 427-435.
23. State of North Carolina, North Carolina pollution prevention program. Environmental Auditing. 1985.
24. Baumer, R.A. Making environmental audits. Chemical Engineering. November 1, 1982, p101.
25. Kletz, T.A. Minimize your product spillage. Hydrocarbon Progress. Vo1.61, no.3, 1982, p207.
26. Sarokin, D. Reducing hazardous wastes at the source: case studies of organic chemical plant in New Jersey. Paper presented at source reduction of hazardous waste conference, Rutgers University, August 22, 1985.
27. Singh, J.B., and R.M. Allen. Establishing a preventive maintenance program. Plant Engineering. Feb. 27, 1986, p 46.
28. Rimberg, D. Minimizing maintenance makes money. Pollution Engineering. Vol. 12, no. 3 , 1980, p.46.
29. Parker, N.H. Corrective maintenance and performance optimization. Chemical Engineering. April 16, 1984, p 93.
30. Lenchkus, D. Increasing productivity. Finishing Wood and Wood Products Magazine. Vol. 87, no. 4.
B-11

31. Giltenan, E. Keeping chemical records on track. Chemical Business. Vo1.6, no. 11, 1984, p 47.
32. Hickman, W.E., and W . D . Moore. Managing the maintenance dollar. Chemical Engineering. April 24, 1986, p 68.
B- 12
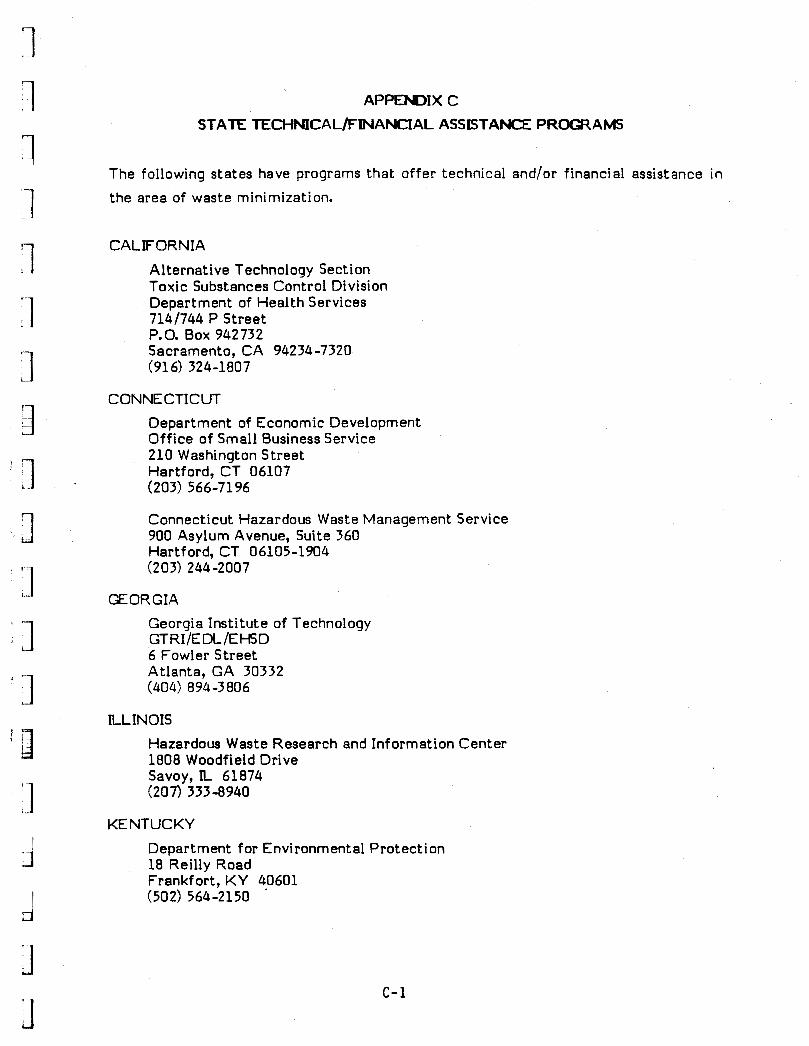
APPENDIX C
STATE TECHMCAL/FJNANCIAL ASSISTANCE P R m A M S
The following states have programs that offer technical and/or financial assistance in
the area of waste minimization.
CALIFORNIA
Alternative Technology Section Toxic Substances Control Division Department of Health Services 714/744 P Street P.O. Box 942732 Sacramento, CA 94234-7320 (916) 324-1807
CONNECTICUT Department of Economic Development Off ice of Small Business Service 210 Washington Street Hartford, CT 06107 (203) 566-7196
Connecticut Hazardous Waste Management Service 900 Asylum Avenue, Suite 360 Hartford, CT 06105-1904 (203) 244-2007
GEORGIA Georgia Institute of Technology
6 Fowler Street Atlanta, GA 30332
GT RI /E DL /E HS D
(404) 894-3806
ILLINOIS Hazardous Waste Research and Information Center 1808 Woodf ield Drive Savoy, R, 61874 (207) 333-8940
KENTUCKY De part m ent for Environment a1 Protect i on 18 Reil ly Road Frankfort, KY 40601 (502) 564-2150 .
c- 1

I I 1 I I
I I
-1 I
I, I ) I i1
I
! I l i
MARYLAND
Hazardous Waste Faci l i t ies Siting Board 60 West Street, Suite 200-A Annapolis, MD 21401 (301) 269-3432
MASSACHUSETTS
Department of Environmental Quality Engineering Division o f Solid Waste 1 Winter Street, 4th Floor Boston, M A 02108 (617) 292-5982
Department of Environment a1 Management Of f ice of Safe Waste Management 100 Cambridge, Room 1904 Boston, M A 02207 (617) 727-3260
MINNESOTA
W140 Bointon Heal th Service University o f Minnesota Minneapolis, MN 55455 (612) 625-4949
NE W JE RS E Y
Hazardous Waste Faci l i ty Siting Commission 28 West State Street, Room 614 Trenton, NJ 08608 (609) 292-1459
Division of Hazardous Waste Management 408 East State Street, 5th Floor Trenton, NJ 08625 (609) 633-0737
NEW YORK
New Y ork Stat e Environmental F aci 1 i ties Corporation 50 Wolf Road Albany, N Y 12205 (518) 457-4100
NORTH CAROCINA
Division of Environmental Management Natura l Resources and Community Development 512 North Salisbury Raleigh, NC 27611 (919) 733-7015

P ENNS YLV ANIA
Center for Hazardous Mater ia l Research University of Pittsburgh Applied Research Center 320 William P i t t Way Pittsburgh, P A 15238 (412) 826-5320
PENNTAP 501 Kel ler Building University Park, P A 16802 (814) 865-1914
TENNESSEE
University of Tennessee Center for Industrial Services 102 Alumni H a l l Knoxville, TN 37996 (615) 974-2456
c- 3

AP-IX D
ECONOMIC EVALUATION EXAMPLE
The following example presents a prof i tabi l i ty analysis fo r a relat ively large
hypothetical waste minimization project. This project represents the installation of a
package unit that improves plant production while reducing raw material consumption
and disposal costs. The analysis was done on a microcomputer using a standard
spreadsheet program. The salient data used in this evaluation are summarized below.
Capital Costs
0
0
0
0
0
0
0
0
Financing
0
0
0
0
0
The delivered price of the equipment i s quoted by the vendor at $170,000. This includes taxes and insurance.
Materials costs (piping, wiring, and structural steel) are estimated at $35,000.
Installation labor is estimated at $25,000.
Internal engineering s ta f f costs are estimated at $7,000. Outside consultant and contractor costs are estimated a t $15,000.
Miscellaneous environmental permitt ing costs are estimated at $15,000.
Working capital (including chemical inventories, and materials and supplies) is estimated at $5,000.
Start-up costs are estimated by the vendor at $3,000.
A contingency of $20,000 fo r unforeseen costs and/or overruns i s included.
The project w i l l be financed 60% by retained earnings and 40% by a bank loan.
The bank loan w i l l be repaid over 5 years of equal installments of principal, plus interest a t an annual percentage rate of 13%. Interest accrued during installation w i l l be added in to the to ta l capital costs.
A one-year installation period i s assumed.
A l l capital costs, except for working capital and interest accrued during installation, w i l l be depreciated over 7 years using the double-declining balance method, switching t o the straight-line method, when the charges by th is method become greater.
The marginal income tax r a t e is 34%.
D- 1

o Escalation of a l l costs i s assumed to be 5% per year fo r the l i f e of the project.
o The firm’s cost of capital i s 15%.
o Planning, design, and installation is expected t o take one year.
Operating Costs and Revenues
o The WM project i s estimated t o decrease raw materials consumption by 300 units per year a t a cost o f $50 per unit. The project w i l l not result in an increased production. However, it w i l l allow a marketable by-product t o be recovered at a rate of 200 units per year and a price o f $25 per unit.
o The project w i l l reduce the quantity of hazardous waste disposed by 200 tons per year. The following i tems are the unit disposal costs:
- Of fs i te disposal fees $ 500 per ton of waste - State generator taxes 10 per ton of waste. - Transportation costs 25 per ton of waste - Other costs 25 per ton of waste
TOTAL DISPOSAL COSTS $ 560 per ton of waste
o Incremental operating labor costs are estimated on the basis that the project i s expected t o require one hour of an operator‘s t ime per eight-hour shift. There sre three shifts per day and fac i l i t y operates 350 days per year. The wage ra te fo r operators i s $12.50 per hour.
o Operating supplies expenses are estimated at 30% o f operating labor costs.
o Maintenance labor costs are estimated at 2% o f the sum of the capital costs fo r equipment, materials, and installation. Maintenance supplies costs are estimated at 1% of these costs.
o Incremental supervision costs are estimated a t 30% of the comined operating and maintenance (O&M) labor costs.
o The fol lowing overhead costs are estimated as a percentage of the sum of operating and maintenance labor and supervision:
- Labor burden (28% o f O&M labor and supervision) - Plant overhead (25% o f O&M labor and supervision) - Headquarter overhead (20% o f O&M labor and supervision)
o Escalation of al l costs is assumed t o be 5% per year fo r the l i f e of the project .
o The project l i f e i s expected t o be 8 years.
D- 2

Results
The four-page printout illustrated in Figures D-1 through D 4 presents t h e WM project profitability spreadsheet program. Figure D-1 represents t h e input section of t h e program. Each of the numbers in the first three columns represents an input variable in the program. The right-hand side of Figure 0-1 is a summary of t he capital requirement. This includes a calculation of the interest occrued durinq construction and t h e financing s t ruc ture fo r t he project.
Figure 0-2 i s a table of t h e revenues and operating cost i tems for each of the t en years of t he project's operating life. These costs are escalated by 5% each year for t h e l ife of the project.
Figure 0-3 presents the annual cash flows for the project. The calculation of depreciation changes and the payment of interest and repayment of loan principal is also shown here. The calculation of the internal rate of re turn and the net present value are based on t h e annual cash flows. Since t h e project is leveraged (financed par t ly by a bank loan), t h e equity portion of the investment is used as the initial cash flows. The NPV and t h e IRR are calculated on this basis. The IRR calcualted th i s way is referred t o as the "return on equity." The program is s t ructured t o present t h e N P V
and IRR a f t e r each year of t h e project's operating life. In the example, after six years t h e IRR is 19.92Oh and t h e NPV is $27,227.
Figure 0-4 is a cash flow table based entirely on equity financing. Therefore, there are no interest payments or debt principal repayments. The NPV and t h e IRR in th i s
case are based on the en t i re capital investment in the project. The IRR calculated this way is referred to as t h e "return on investment."
The results of t he profitability analysis for t he hypothetical WM project are summarized below:
Method of Financing IRR N P V
60% Equity/40% Debt 26.47Oh $ 84,844 100% Equity 23.09% $ 81,625
The IRR values are greater than the 15% cost of capital , and t h e NPVs positive. Therefore, th i s project is at t ract ive, and should be implemented.
D- 3
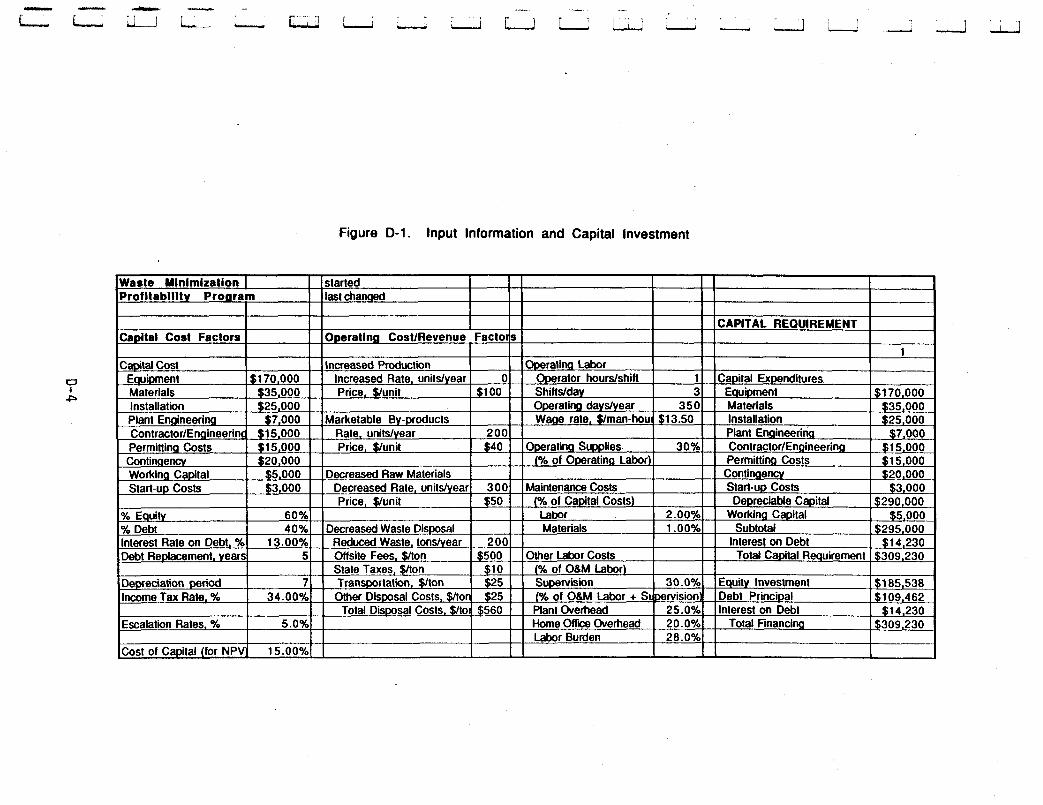
Figure D-1. Input Information and Capital Investment
Waste Mlnlmizatlon I started Profltabllltv Proaram last chan9ed
CAPITAL REQUIREMENT Capital Cost Factors Operatlng CostlRevenue Factors
0
P
Total Disposal Costs. $/to $560 Escalation Rates, % 5.0%
Cost of Capital (for NPV: 15.00%
otherlabor costs
3 13.50
3 I
2.OOYo ----t 1 .oo-Yo
Capital Expenditures Equipment Materials Installation Plant EnslineerinQ ContractoriEngineerinD Permitting Costs
Continaencv Start-up Costs Depreciable Capital
Working Capital Subtotal
Total Capital Requirement Interest on Debt
I Equity Investment ~~ ~
[% of OBM Labor + Sumvision: Plant Overhead 25.0% Interest on Debt Home O f f i i Overhead 20. OY0 Total Financiw Labor Burden 28.0%
Debt Principal
4 I
I

0 I cn
Figure D-2. Annual Revenues and Operating Costs
IOPERATlNG COST SAVINGS I I I Raw Materials $15,750 $16,545 $1 7,370 Disposal costs $1 17,600 $1 23,536 $1 29.696 Maintenance Labq ($4,830) ($ 5,074) I $ 5,3271
5,12611 ($ 5,38411 ($ 5.653) Total Operating I Costs $82.133 I $86,278 I $ 90,580
4 5 6 7 8 1.216 1.277 1.341 1.408 1.478
($6,849) ($ 7.193) ($ 7,553) I $ 7,931) ($ 8.325) ($8.310) ($ 8 . 7 2 7 ) ~ ( $ 9,165) ($ 9.622) ($ 10.1 01) ($7.420) I $ 7,792) ($ 8,183) ($ 8.592) ($ 9'01 9) ($5.93611 ($ 6,23411 ($ 6.546)l ($ 6,873)l I $ 7.21 5) $95.118 I $ 99,891 I $104,895 I $110,138 I $115,612

Figure 0-3. Cash Flow Table for Return on Equity (with debt financing)
0
m

Figure 0-4. Cash Flow Table for Return on Investment (100% equity financing)