the equilibrium of grains on the bed of a...
TRANSCRIPT
The equilibrium of grains on the bed of a stream
B y C. M . W h it e
Imperial College of Science and Technology, London
(Communicated by G. I. Taylor, F.—Received 1 August 1939)
S y m b o l s
b — breadth of channel or nozzle. c, Cj, c2, etc. = numerical coefficients. d = depth of liquid in channel. g = gravitational acceleration.
i — energy head gradient. k = diameter of sand grains.
1 = length of nozzle.p = pressure [ML~1T~r\.Q = volume flowing per unit time.U = velocity in main stream outside boundary layer.U = mean velocity in main stream. u = velocity at any point within the boundary layer.
u' = superimposed pulsation velocity.V* = f(r/p) (with dimensions of velocity). x = distance down nozzle in direction of flow. y = perpendicular distance from wall.y x = shift of origin to allow for turbulent mixing among grains.2 = y/Vvcl = numerical coefficient in equation (2).<5 = thickness of boundary layer.y = packing coefficient = k2 times number of grains per unit area.6 = angle of tilt of bed in nozzle no. 2 in experiments nos. 7 and 9.p = viscosity [M L ^ T -1].v — kinematic viscosity [L2T~X~\.p = density of fluid [jMX~3].p' = effective density of sand grains in the fluid.r and r = mean stress on bed \ML~XT~2e.g. dynes per sq. cm. <j> — angle of repose of top layer of grains in the particular fluid.
X = Z7/2-5K,., a substitution used in Appendix n.A fluid flowing over a loose flat granular bed tends to move the grains
forward, and the conditions under which movement begins depend, not only[ 322 ]
on July 13, 2018http://rspa.royalsocietypublishing.org/Downloaded from
Equilibrium of grains on the bed of a stream 323
upon the speed, but also upon the nature of the motion in the stream itself: viscous steady motion, steady inviscid motion, and turbulent motion act somewhat differently, and the speed necessary to dislodge grains differs appreciably.
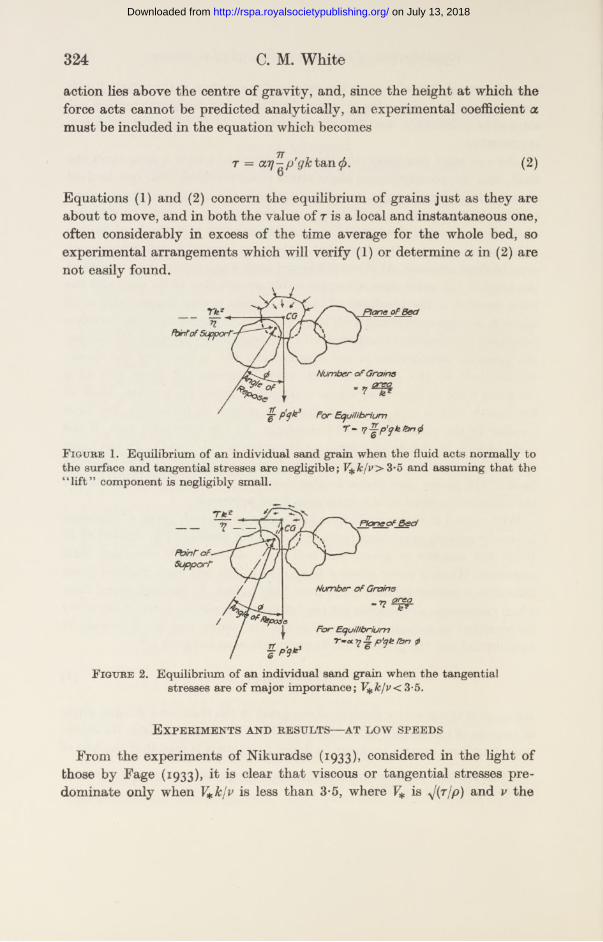
Like any solid boundary, the loose granular bed exerts a drag upon the fluid, and the accompanying shear stress is transmitted from bed to fluid almost wholly by the more prominent grains in the uppermost layer. Each such grain transmits a small force, and the manner in which it does so, again depends upon the type of motion, though it is now the local motion which is concerned, rather than that of the main stream. Two extreme cases may be distinguished. At slow speeds and with small grains the pressure at the front of the grain does not appreciably exceed that at its rear, and the force applied is the resultant of viscous stresses acting tangentially as in figure 2. At high speeds and with large grains such tangential drag becomes relatively unimportant compared with the drag due to pressure differences: the pressure distribution is not symmetrical but is less over the downstream half of the grain, so that when integrated it gives rise to a resultant force or form drag whose component resists the motion. Both a t low speeds and at high speeds, if the main stream be turbulent, the force applied to the grain fluctuates irregularly. In the low-speed case, if the main stream be steady, the force on the grain is also steady. In the highspeed case, whatever the state of the main stream, eddies are shed from the back of the grains, and grains farther downstream are at least subjected to the cumulative effect of the pulsations from upstream.
With regard to their equilibrium as they lie on the bed, grains of diameterk usually occupy more area than k2. A packing coefficient tj, defined as k2
times the number of grains per unit area, conveniently expresses their closeness. When a mean stress r is applied to the bed each exposed grain transmits a horizontal force rk2\r\ from fluid to bed. In the high-speed case, when tangential components are negligible, the resultant force, if the grain be regarded as spherical, passes through its centre, and the forces are in equilibrium and the grain about to move when, as in figure 1,*
t = r^p'gkt&n(1)
where p' is the effective density of the grain in the fluid, and <p is the angle of respose of the surface layer of grains. For the slow-speed case the corresponding force system is shown in figure 2, where it is seen that the line of
* That the force on the grain is nearly horizontal seems to be proved by an experi - ment described later (p. 333).
on July 13, 2018http://rspa.royalsocietypublishing.org/Downloaded from
324 C. M. White
action lies above the centre of gravity, and, since the height a t which the force acts cannot be predicted analytically, an experimental coefficient a must be included in the equation which becomes
7T r — ay-p'gkta, n6. ( 2)o
Equations (1) and (2) concern the equilibrium of grains just as they are about to move, and in both the value of r is a local and instantaneous one, often considerably in excess of the time average for the whole bed, so experimental arrangements which will verify (1) or determine a in (2) are not easily found.
Plane of Bed
F b i n t o f Supporf-
Number o f Grains
F igure 1. Equilibrium of an individual sand grain when the fluid acts normally to the surface and tangential stresses are negligible; 3*5 and assuming that the“ lift” component is negligibly small.
Support
Number o f Grains
For Equilibrium
F igure 2. Equilibrium of an individual sand grain when the tangential stresses are of major importance; V kjv< 3-5.
E xperiments and results—at low speeds
From the experiments of Nikuradse (1933), considered in the light of those by Fage (1933), it is clear tha t viscous or tangential stresses predominate only when V*kjv is less than 3-5, where V* is y/(r/p) and v the
on July 13, 2018http://rspa.royalsocietypublishing.org/Downloaded from
325
kinematic viscosity of the fluid. This condition in an ordinary channel necessitates the use of a fluid more viscous than water: accordingly, an experiment was made with lubricating oil, v = 1-6 cm.2 sec.-1.
An open channel, 5-08 cm. wide, 100 cm. long, with a smooth bed of sand sloping at approximately 1 in 28, was arranged in the Civil Engineering Department of Imperial College, London. The oil supply to the upper end of the channel was gradually increased until the grains began to move. The drag was measured in two ways: from the product of the slope, density, and depth; and also from the mean velocity as determined by volumetric measurement of the rate of oil flow, using the relation TdjfiU = 3,* from which U, and the equally uncertain dimension d, may be eliminated by substitution from
t = pgdi and .
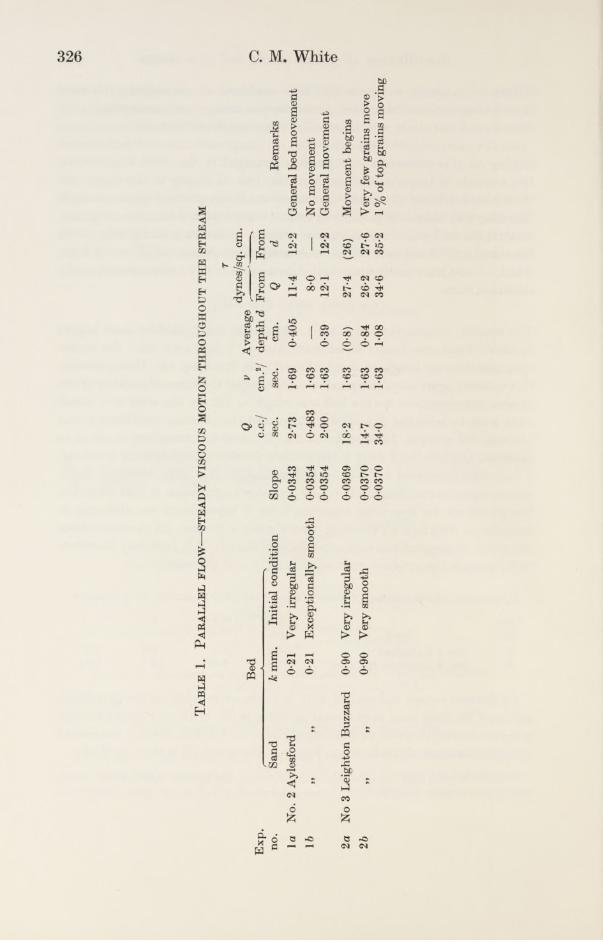
The results, summarized in table 1, show that the Aylesford sand begins to move when the drag r is between 8 and 11 dynes/sq. cm.; the corresponding drag for Leighton Buzzard sand is 26 dynes/sq. cm. Unexpectedly this value appears to be independent of the initial closeness of packing of the grains: in experiment 2 a the bed was rough as left by the edge of a metal strip used to level the dry sand surface, and the packing coefficient^ was between 0-3 and 0-4. In experiment 26, oily sand was smoothed as much as possible, and left for 2 days while surface tension completed the levelling: rj was then estimated to be 0-8-1 *0. Yet, despite this large variation, there was no significant difference in r. The probable explanation is that when the top grains are far apart the resultant force is lower down, so, although in accordance with figure 2 the drag per top grain is greater, its moment about the point of support remains sensibly unchanged. I t is sufficient therefore to determine the product ccrj in equation (2); and the values are:
Parallel flow—steady viscous motion throughout the stream
Equilibrium of grains on the bed of a stream
Exp.no. Sand
kmm.
tan 0 in oil
rdynes/sq. cm. arj
1 No. 2 Aylesford 0-21 1-4 9-5 0-372 No. 3 Leighton Buzzard 0-90 1-05 26 0-31
Of the two values, the second, 0*31, is the more reliable, as the individual grains of the finer sand were almost invisible in oil. With very close packing, 7] approximates to unity, so a is then of the order 0-3-0-4, which is consistent with the location of the forces in figure 2. Equation (2) is thus verified.
* The 3 is valid only for infinitely wide channels, for smaller width-depth ratios the value increases a little.
on July 13, 2018http://rspa.royalsocietypublishing.org/Downloaded from
Ta
bl
e 1
. P
ar
al
le
l f
low
—st
ea
dy
vis
co
us
mo
tio
n t
hr
ou
gh
ou
t t
he
str
eam
r
Bed
QV
Ave
rage
dyne
s/sq
. cm
.
Exp
.c.
c./
cm.2/
dept
h d
Fro
mF
rom
no.
Sand
k m
m.
Init
ial
cond
itio
nSl
ope
sec.
sec.
cm.
Qd
Rem
arks
laN
o. 2
Ayl
esfo
rd02
1V
ery
irre
gula
r00
343
2-73
1-69
0-40
511
-412
-2G
ener
al b
ed m
ovem
ent
1699
99
0-21
Exc
epti
onal
ly s
moo
th00
354
0-48
31-
63—
8-0
—N
o m
ovem
ent
0-03
542-
001-
630-
3912
*112
-2G
ener
al m
ovem
ent
2 aN
o 3
Lei
ghto
n B
uzza
rd0-
90V
ery
irre
gula
r0-
0369
18-2
1-63
(0-8
)27
-4(2
6)M
ovem
ent
begi
ns26
99
990-
90V
ery
smoo
th0-
0370
14-7
1-63
0-84
26-2
27-6
Ver
y fe
w g
rain
s m
ove
0-03
7034
-01-
631-
0834
-635
-21
% o
f top
gra
ins
mov
ing
326 C. M. W hit.
on
July
13,
201
8ht
tp://
rspa
.roy
also
ciet
ypub
lishi
ng.o
rg/
Dow
nloa
ded
from
Equilibrium of grains on the bed of a stream327
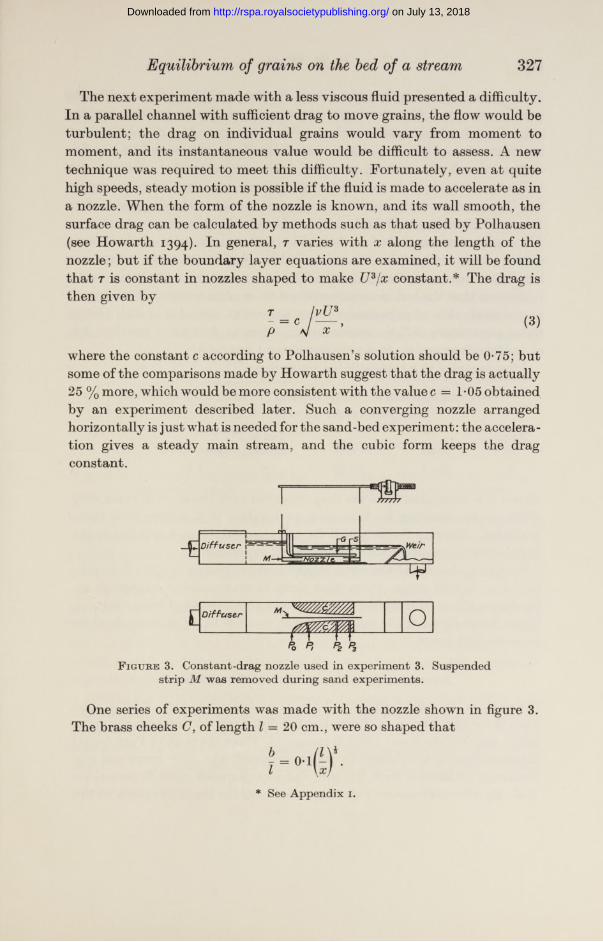
The next experiment made with a less viscous fluid presented a difficulty. In a parallel channel with sufficient drag to move grains, the flow would be turbulent; the drag on individual grains would vary from moment to moment, and its instantaneous value would be difficult to assess. A new technique was required to meet this difficulty. Fortunately, even at quite high speeds, steady motion is possible if the fluid is made to accelerate as in a nozzle. When the form of the nozzle is known, and its wall smooth, the surface drag can be calculated by methods such as that used by Polhausen (see Howarth 1394). In general, r varies with x along the length of the nozzle; but if the boundary layer equations are examined, it will be found that t is constant in nozzles shaped to make U3/x constant.* The drag is then given by
where the constant c according to Polhausen’s solution should be 0-75; but some of the comparisons made by Howarth suggest that the drag is actually 25 % more, which would be more consistent with the value T05 obtainedby an experiment described later. Such a converging nozzle arranged horizontally is just what is needed for the sand-bed experiment: the acceleration gives a steady main stream, and the cubic form keeps the drag constant.
Figure 3. Constant-drag nozzle used in experiment 3. Suspended strip M was removed during sand experiments.
One series of experiments was made with the nozzle shown in figure 3. The brass cheeks C, of length l — 20 cm., were so shaped that
* See A ppendix 1.
on July 13, 2018http://rspa.royalsocietypublishing.org/Downloaded from
328 C. M. White
These were covered with a glass sheet O, through which the sand-bed S could be observed. The speed was determined by using the pressure tapping holes P, and regarding the nozzle as a Venturi meter. As a direct check on the estimation of the drag, a thin metal stip M was suspended by two fine cotton threads 50 cm. long, mounted on a micrometer bar. Usually this strip was removed when testing for sand-bed movement. The water supply was increased gradually until the sand grains moved. Usually grains were scoured from all parts of the bed, so confirming tha t the drag was uniform. The continuous removal of sand steadily increased the cross-sectional area of the nozzle until, after an hour or so, the speed in the main stream was insufficient to remove further grains. The drag under these conditions is the maximum that the bed can resist without trace of movement. With regard to the sand, that of experiment 1 was somewhat irregular in size, and in water gave values of V* k/v approximately equal to, instead of less than 3-5, so another finer and more closely sieved sand was used.
After scouring to a standstill the result was:
Converging flow. Main stream: steady and inviscid.B oundary layer : steady
E xp. Tan ^ rno. Sand k mm. in water dynes/sq. cm. arj
3 No. 1 0 122 1 0 3-56 0-39
Here r was computed from the drag observed with the smooth brass strip which, after correcting for form drag, gave values 10 % greater than those predicted. Allowing for this, and for the uncertainty in k and tan < , the value of cc7] is consistent with the earlier oil experiments.
Together, the oil and the water experiments extending in from 0*04 to 2-1, a 50-fold range, prove that there is no significant change in Shields (1936) concludes otherwise, viz. that rjp'gk, instead of being constant, varies inversely as 1 7*k/v;but the present result is based on a much wider experimental range.
E xperiments and results—at high speeds
Equation (1), valid for V^k/vpS-5, is more difficult to test. Eddies, shed from the grains, vary r; a t the moment of dislodgement 7 exceeds the mean value, and it is the mean which is measured. From the work of Fage (1933) the magnitude of the pulsations can be estimated. The mean speed u a t any particular distance y from the wall has superimposed upon it pulsations ± u'. By ultra-microscope Fage found that near the top of pyramids on the
on July 13, 2018http://rspa.royalsocietypublishing.org/Downloaded from
Equilibrium of grains on the bed of a stream329
wall of a very rough square pipe u' = 0-5 so the maximum speed was 1-5 and the maximum stress presumably 2-25?. In the present experiments, the boundary layer is relatively a little smaller than half Fage’s pipe, and the opposite side of the pipe is of course absent, so the maximum stress should be somewhat less, possibly only about twice the mean, and in comparing the results with (1) this allowance must be made.
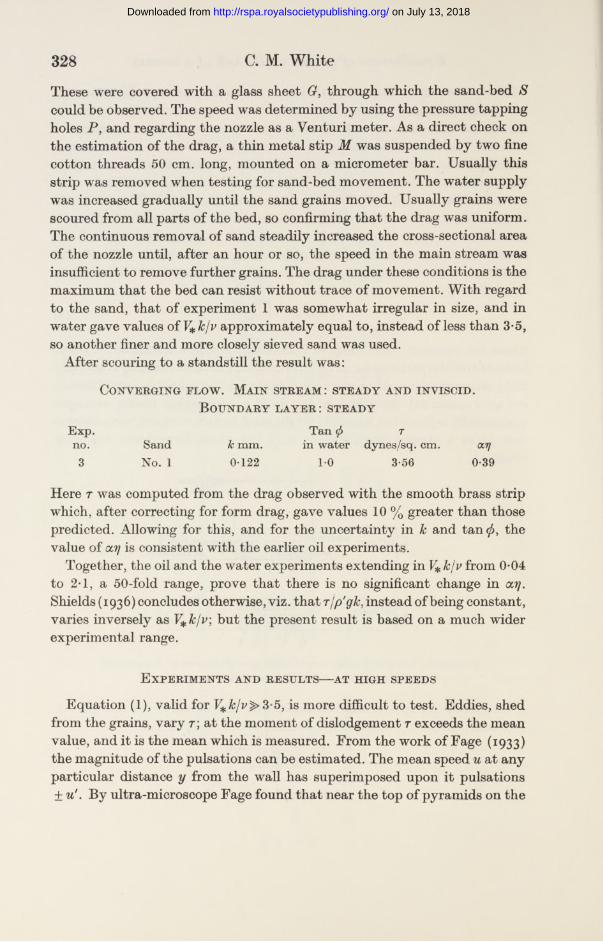
The nozzle (figure 3) used in the previous experiments was too small for larger grains, and as the proximity of the cheeks to the bed often caused secondary circulations and local scour, a larger nozzle was built with parallel sides and converging top. This arrangement, seen in figure 4, had proved very satisfactory in some earlier qualitative experiments. To give constant drag, with a turbulent boundary layer, the nozzle must converge approximately exponentially,* and the parameter depends upon the ratio of x to k, so that, strictly speaking, each size of sand requires a different nozzle:
Po Pi Pz P3 Fk-PsEnergy Line.____
DiffuserJ77777777/77777777777777777777
Figure 4. Constant-drag nozzle used for Figure 5. Converging flow over a experim ents 4-10. naturally formed weir crest.
however, the differences are small, and are compensated, when a nozzle is used with an inappropriate size of sand, by the bed adjusting itself into a slightly curved form. Again, a suspended strip was used to check the mean value of the drag, but this time it was coated with sand grains similar in size and spacing to those of the bed. The nozzle was sealed to operate under pressure, so the threads supporting the strip were made very short, and the displacement measured by travelling microscope. Equation (1) includes the variables p ', k, and tan all of which were varied. Two sands, both closely sieved, and one sample of steel shot were tested, and their apparent angle of repose varied by tilting the whole apparatus.
During the experiments the behaviour of some of the sand, which had become piled up downstream against the overflow weir, suggested that an experiment could be made with the arrangement shown in figure 5. Water was allowed to flow over a weir-like pile of sand in an ordinary glass-sided flume until the crest BC was lowered to the position of stability. In this
* See A ppendix i i .
on July 13, 2018http://rspa.royalsocietypublishing.org/Downloaded from
330 C. M. White
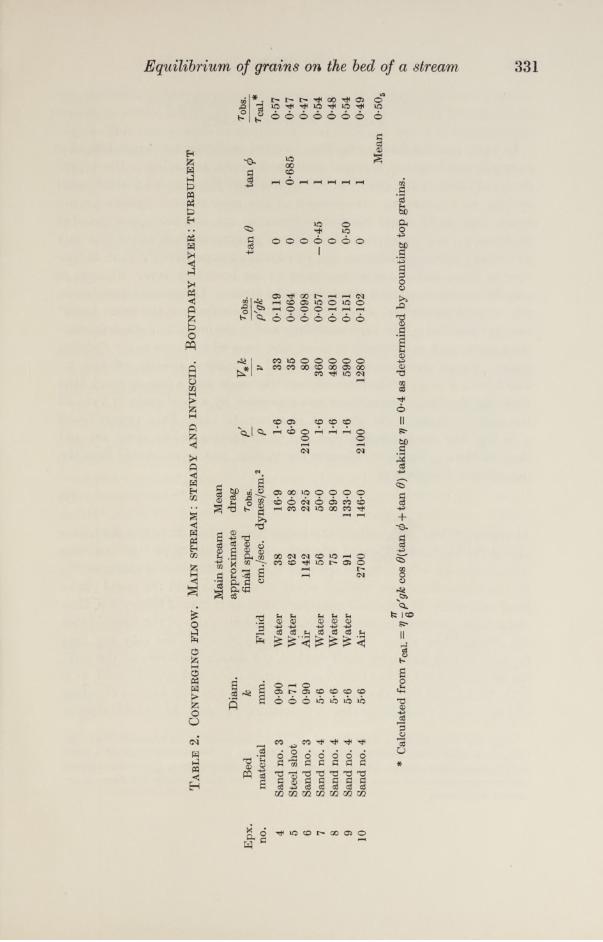
way a converging “ nozzle” was formed between the downward-sloping free surface of the water and the sand-bed The velocity U was found from the head h, which was measured directly by pointer gauge. At the point C diverging flow begins, and the bed farther downstream becomes irregular. With a suitably chosen flow, the length BC was almost long enough to mask the unsatisfactory conditions in the region The drag here may have differed considerably from that over the test length BC, but the only effect there would be like that due to change in the origin for which should accordingly be regarded as unknown. The difficulty was overcome by measuring h at two or more distances within the length BC, so that the drag could be found by trial from equation (15) of Appendix n, the unknowns being r and the origin for x. The whole experimental arrangement was very simple, and less difficult to handle than either of the nozzles. The results obtained with it agreed with those with the nozzles. The combined results are given in table 2.
As seen from the last column, the observed drag, over the wide ranges explored, main-stream speed from 38 to 2700 cm./sec., V*k/v, from 33 to 128 and p' Ip from 1*6 to 2100, was consistently one-half of that calculated fromequation (1). Indeed, the very constancy of the one-half is a little perplexing. If the one-half is the result of stress fluctuations, then the slower ones of water should have far more effect than the much more rapid ones of air, yet the experiments fail to distinguish between the two. Each value is the mean of several experiments, from which admittedly some of the individual readings varied by ± 25 %, so it is just conceivable that a difference of that order might have passed undetected. A more likely explanation is that the fluctuations are slow, more in the nature of variation with place rather than with time, just as a flame may cling to the side of one lump of coal for some time, and then, suddenly swinging over, may remain against another for a further indefinite period. However, whether this is so or not, if lift is negligible, the last column of table 2 appears to prove that in tu rbulent boundary layers a few grain diameters thick the stress is so irregular, either in time or place, that local maxima twice the mean are maintained for periods during which the fluid travels distances much greater than the grain diameter. Under these circumstances bed movement begins when the mean drag is one-half of that from (1). Experiments 7, 8 and 9 also support the inclusion of tan </> in equation (1).
on July 13, 2018http://rspa.royalsocietypublishing.org/Downloaded from
fea §Ta
ble
2.
Con
ver
gin
g f
lo
w.
Ma
in s
tr
ea
m: s
te
ad
y a
nd
in
vis
cid
. B
ou
nd
ar
y l
ay
er
: tu
rb
ul
en
t
Epx
.B
edD
iam
.
no.
mat
eria
lm
m.
4Sa
nd n
o. 3
0-90
5St
eel
shot
0-71
6Sa
nd n
o. 3
0-90
7Sa
nd n
o. 4
5-6
8Sa
nd n
o. 4
5-6
9Sa
nd n
o. 4
5-6
10Sa
nd n
o. 4
5-6
Mai
n st
ream
Mea
nap
prox
imat
edr
agfin
al s
peed
TO
l)S.
Flu
idcm
./sec
.dy
nes/
cm.2
Wat
er38
16-9
Wat
er62
30-8
Air
1142
22-5
Wat
er56
50-0
Wat
er75
89-0
Wat
er91
1330
Air
2700
146-
0
£V
*kro
bs.
pV
p'gk
1-6
330-
119
6-9
350-
064
2100
800-
098
1-6
360
0-05
71-
648
00-
101
1-6
590
0-15
121
0012
800-
102
tan
6ta
n (j)
robs
.Tc
al.*
01
0-57
00-
685
0-47
01
0-47
-0-4
51
0-54
01
0-48
0-50
10-
540
10-
49M
ean
0-50
s
*C
alcu
late
d fr
om r
cai.
=7T p'
gk c
os #
(tan
(j) +
tan
6) t
akin
g 7/
0-4
as d
eter
min
ed b
y co
unti
ng t
op g
rain
s.
CO COilibrium of grains on bed of a stream
on
July
13,
201
8ht
tp://
rspa
.roy
also
ciet
ypub
lishi
ng.o
rg/
Dow
nloa
ded
from
332 C. M. White
Results with converging, diverging, andPARALLEL FLOWS COMPARED
In open parallel flumes the drag to start movement is much less. For example, the Leighton Buzzard sand no. 3 would, according to the experiments of Casey (1935) or of the U.S. Waterways Experiment Station, start moving at 5 dynes/sq. cm. instead of the present 16-9 dynes/sq. cm.; again, sand no. 4 would start at 44 dynes/sq. cm. in a flume, instead of a t 89 dynes/sq. cm. Apart from the effect of possible surface waves, the only significant difference between the two kinds of experiment is that, in converging flow, turbulence is restricted to the boundary layer, whereas in parallel flumes it extends throughout the stream. Large-scale turbulence, well away from the bed, may not materially contribute to the mean stress* near the bed, but it does very materially add to the maximum stress fluctuations there, and particularly to those slow ones which more easily dislodge grains. Fage’s measurement of the total turbulence already referred to, which gave u' — \u a t the pyramid top, was made with a pipe so rough tha t probably the whole disturbance was generated by a local grain or two. At the other extreme, near the wall of a smooth pipe, Fage (1936) found u' = 71*. The mean speed at the top of the grains, when these are just
large enough to begin to influence the motion, can be estimated from the logarithmic distribution
« = 5-76F*log?^. (4)
At the top of the grain, taking the origin for to be below the centre line of the top layer of grains, the value of is (— | + 3) Jc, and inserting this in equation (4), the mean speed at the top of the grain is also u IV*. So the fluctuations here are just equal to the mean, and the speed varies from zero to 2 u.If a laminar sublayer exists, as it may if < 3-5, then stress is proportional to speed, and the maximum value of the drag is twice the mean. Thus, since the wall contributes nothing, one may say that large-scale turbulence by itself doubles the maximum stress a t the wall. On the other hand, if the turbulence extends up to and into the wall, as it does if I* &/ > 3-5, then the speed variation of 2 to 1 implies a stress variation of 4 to 1, and the maximum drag is four times the mean. As we have already
* In the Prandtl-Nikuradse theory o f pipe resistance it is assumed that d isturbances originating elsewhere do not appreciably influence the value of a local time-average shear-stress; but when, as in the present problem, particular instantaneous m axim um values are under discussion the more distant sources of disturbance cannot be ignored.
on July 13, 2018http://rspa.royalsocietypublishing.org/Downloaded from
seen that either large-scale turbulence or wall turbulence can individually double the stress, it is not inconsistent to find tha t the two together multiply it by 4, This factor must be inserted in equation (1) before it is applicable to large grains in parallel flumes. The comparison is then:
Drag to start movement
Equilibrium of grains on the bed of a stream 333
Type o f flow k mm.
Byexperim entdynes/cm .2
Predicted from equation (1)
In converging nozzle0-9 16-9
Turbulence factor = 2 14-9 dynes/cm .2
5 0 89 92 dynes/cm .2In parallel flume
0-9 5Turbulence factor = 4
7-5 dynes/cm .25-6 44 46 dynes/cm .2
and the agreement is good; it confirms that just one-half of the maximum stress fluctuation at the bed in a parallel flume originates in large-scale disturbances far from the bed.
In some cases such large-scale turbulence can even be the controlling factor. A nozzle twice the length of that in figure 4 was made with the upstream part converging and the downstream part diverging. The flow was increased until gentle movement occurred in the upstream part of the bed. Here, due to convergence, the drag was relatively great, whereas, due to the divergence of the downstream part, the mean drag there was zero or even slightly negative. In the converging part the main stream was steady, while in the diverging part it was strongly turbulent. The bed in the downstream part was extremely active, in spite of negligible mean drag and progressively slower speed.
Lift
Earlier workers have attempted in other ways to explain the very large difference between flume values and the static force required to dislodge an individual grain. Jeffreys (1929) suggested that fixed particles are subject to a lift component due to the particular pressure distribution on their surface. I t is self-evident that such a lifting force must exist. Fage’s experiments with closely packed pyramids gave lift* as large as the drag, but the existence of open spaces in a loosely packed bed of sand grains seems to allow some equalization of pressure, since, if the present estimate of the effect of packing and of pulsations is correct, the lift component must here
* Calculated from original data personally communicated to the author.
Vol. 174. A. 22
on July 13, 2018http://rspa.royalsocietypublishing.org/Downloaded from
334 C. M. White
be negligibly small. To verify this an experiment was made in which the grains of a loosely packed bed were so cemented that they remained in place in a stream moving at more than twice the speed necessary to sweep unfixed grains away. A test grain was modelled in wax, p' — 0-05 g./c.c., k = 5-6 mm., and fastened to the end of a piece of cotton. The test grain was placed successively in typical hollows on the fixed bed, and prevented from moving downstream by the tension on the cotton which carried the whole of the horizontal force on the grain. Despite the high speed the grain did not rise, and so the lift seems less than its weight, which was only 3 % of that of an ordinary silica grain.
Conclusion
In conclusion it can be emphasized that despite uncertainties, often as much as ± 25 %, the experiments establish that, a t low speeds, there is a wide range oiV^k/v in which, for any one size of grain, the stress to start movement is sensibly constant. Further, they establish that, other things being constant, the stress varies directly as the grain diameter. There is some evidence also that the stress varies directly as tan (j). Rounded sand grains subjected to a steady viscous drag begin to move when
r = O18yo'g&tan
This would also apply if the force were steadily applied by an inviscid fluid in the particular case when, as they usually are, the centres of the grains in the top layer are 1-75& apart. Lift seems to be negligible. If this is so, then at high speeds wall turbulence reduces the mean apparent starting stress by 40 % or more. The present experimental values are at least twice those from open flumes, a difference explained by large-scale turbulence which also causes the stress at the wall to fluctuate, and to reach a maximum twice the mean. In irregular rivers this factor is much larger, and transport of grains would begin at correspondingly lower values of mean drag, were it not for the contrary action of form drag which probably transfers more than half the total drag directly to the bed without the intermediary of tangential drag. In one experiment with a divergent nozzle, large-scale turbulence was strong enough to raise clouds of grains, though at the bed itself the time average of the tangential drag was zero.
Before equations (1) and (2) can be applied to natural rivers, allowance must be made for the fact that a large fraction of their total drag is transferred to the bed directly as form drag, that large-scale turbulence is probably greatly in excess of the values here considered, and also that it is
on July 13, 2018http://rspa.royalsocietypublishing.org/Downloaded from
Equilibrium cf grains on the bed of a stream 335
accompanied by non-uniform distribution of the time-average drag from place to place. The form drag enables the bed apparently to withstand a greater drag, while turbulence and non-uniformity have the opposite result. These opposing factors can be great or small, and in some instances they happen to neutralize each other, but this must not be interpreted as justifying the direct application of the present results to rivers.
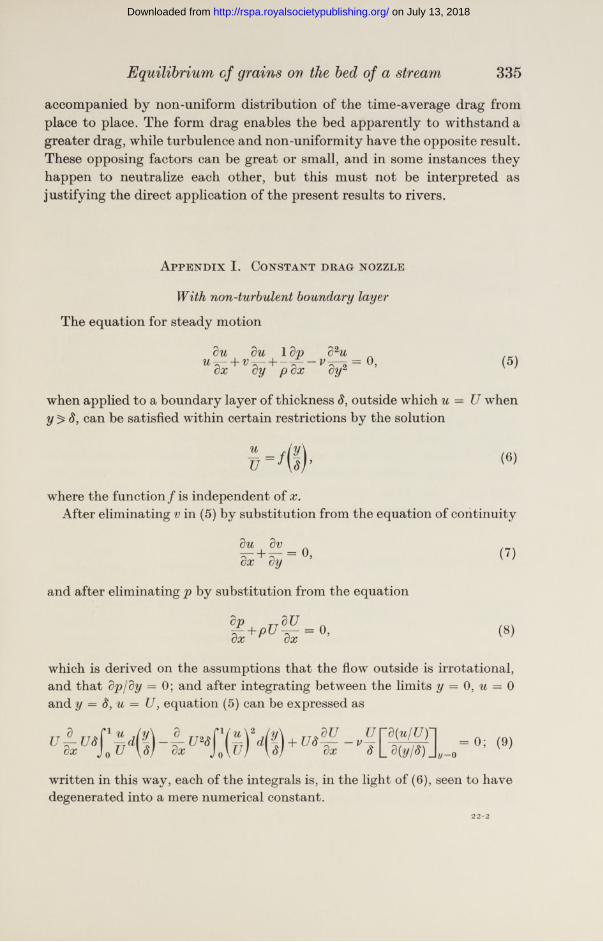
Appendix I. Constant drag nozzle
With non-turbulent boundary layer
The equation for steady motion
du 1 dp+ VTy + pT*
d2uVW 1
= 0, (5)
when applied to a boundary layer of thickness 8, outside which wheny 8, can be satisfied within certain restrictions by the solution
where the function / is independent of x.After eliminating vin (5) by substitution from the equation of continuity
du dv dx^ dy 0,
and after eliminating p by substitution from the equation
dp TJdU n
(7)
( 8 )
which is derived on the assumptions that the flow outside is irrotational, and that dpjdy — 0; and after integrating between the limits y 0, u = 0 and y = 8, u — U, equation (5) can be expressed as
V U r d(u/U)lV 8 [_% /<*) _ l= o
= 0; (9)
written in this way, each of the integrals is, in the light of (6), seen to have degenerated into a mere numerical constant.
22-2
on July 13, 2018http://rspa.royalsocietypublishing.org/Downloaded from
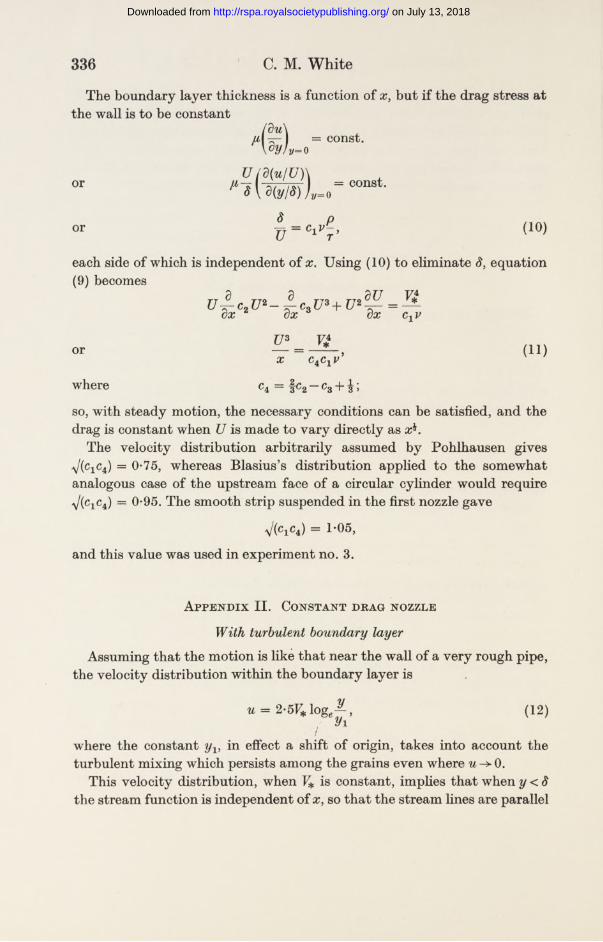
336 C. M. White
The boundary layer thickness is a function of but if the drag stress at the wall is to be constant
const.
or U ( d(u/U)\M %/<>)/*,=o
const.
s pU = C r ' ( 10)
each side of which is independent of x. Using (10) to eliminate equation (9) becomes
TT 9 TT2 TT3 T T Z ^ Uv Txc*u ~ r x c*u + v
ncx v
or
where
TP _ V£X c4 c1 p >
C4 = f C2 — c3 + i >
( 11)
so, with steady motion, the necessary conditions can be satisfied, and the drag is constant when U is made to vary directly as x*.
The velocity distribution arbitrarily assumed by Pohlhausen gives v/(c1c4) = 0-75, whereas Blasius’s distribution applied to the somewhat analogous case of the upstream face of a circular cylinder would require /(c1c4) = 0-95. The smooth strip suspended in the first nozzle gave
y/(clc4) = 1*05,
and this value was used in experiment no. 3.
Appendix II. Constant drag nozzle
With turbulent boundary layerAssuming that the motion is like that near the wall of a very rough pipe,
the velocity distribution within the boundary layer is
u = 2-5F*loge^ , (12) Vi
where the constant yx, in effect a shift of origin, takes into account the turbulent mixing which persists among the grains even where -> 0.
This velocity distribution, when V* is constant, implies that when y <8 the stream function is independent of x, so tha t the stream lines are parallel
on July 13, 2018http://rspa.royalsocietypublishing.org/Downloaded from

337
to the wall. There is a discontinuity a t the edge of the boundary layer outside which the stream lines are somewhat inclined, and they therefore turn abruptly through a small angle as they enter the boundary layer (figure 6).
Equilibrium of grains on the bed of a stream
77777777777777777777distribution at x whenX *m + -G
F igure 6. Boundary layer near rough wall w ith constant drag.Vertical scale is exaggerated sixfold.
With stream lines parallel in the boundary layer, the momentum in the cc-direction does not change, and the mean apparent shear stress, corresponding to the last term in (5), arises entirely from pressures external to the boundary layer: and these give
rx = f {P-V(13)J Vi
Since p is determined by the irrotational motion outside, and, since once it has entered the boundary layer the speed of a stream fine remains unchanged, (9) may be written
V£x = ( 2)dy, (14)J Pi
x 6-25 f e*which with (12) gives — = ——- I (y2 — log22/i ^ Ji
where y = £7/2-51* and z — ylyx. The two limits 1 and z = 8/yx correspond respectively to log2 = 0 and log = y (cf. (12)); so, making the integration and inserting these limits,
S ^ f c - o - t e - D - f n •
Nikuradse’s closely packed grains cemented to the wall of a pipe give yx = hi33, but Schlichting’s loosely packed spherical particles 1-5 apart
give yx = hi9 and this more nearly represents the present case. So
I-5? = e*(x—J) —1 2+ 1, (15)
on July 13, 2018http://rspa.royalsocietypublishing.org/Downloaded from
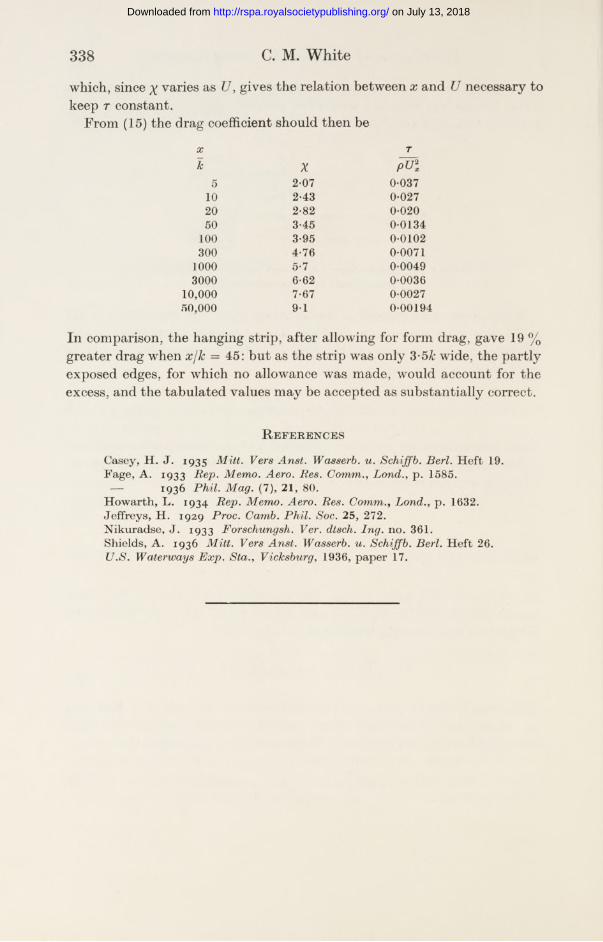
3 3 8 C. M. White
which, since x varies as U, gives the relation between x and U necessary to keep t constant.
From (15) the drag coefficient should then be
X 7
k X p u l5 2-07 0-037
10 2-43 0-02720 2-82 0-02050 3-45 0-0134
100 3-95 0-0102300 4-76 0-0071
1000 5-7 0-00493000 6-62 0-0036
10,000 7-67 0-002750,000 9 1 0-00194
In comparison, the hanging strip, after allowing for form drag, gave 19 % greater drag when xjk = 45: but as the strip was only 3-5 wide, the partly exposed edges, for which no allowance was made, would account for the excess, and the tabulated values may be accepted as substantially correct.
R eferences
Casey, H . J . 1935 M itt. Vers Anst. Wasserb. Berl. H eft 19. Fage, A. 1933 Rep. Memo. Aero. Res. Comm., Lond., p. 1585.
— 1936 Phil. M ag. (7), 21, 80.Howarth, L. 1934 Rep. Memo. Aero. Res. Comm., Lond., p. 1632. Jeffreys, H . 1929 Proc. Camb. Phil. Soc. 25, 272.Nikuradse, J. 1933 Forschungsh. Ver. dtsch. Ing. no. 361.Shields, A. 1936 M itt. Vers Anst. Wasserb. u. Schiffb. Berl. H eft 26. U .S. Waterways E xp. Sta., Vicksburg, 1936, paper 17.
on July 13, 2018http://rspa.royalsocietypublishing.org/Downloaded from