the equivalence of direct and semi-direct speaking … · direct versus direct assessment of...
TRANSCRIPT

Studies inLanguageTesting
UC
LE
SStu
die
s in L
an
gu
age T
estin
g
13
13
Studies in Language Testing 13
This book documents a comparability study of direct (face-to-
face) and semi-direct (language laboratory) versions of the
speaking component of the access: test, an English language
test designed in the 1990s as part of the selection process for
immigration to Australia. The two versions of the speaking
module were developed by the Language Testing Research
Centre at the University of Melbourne.
In the study, the issue of test equivalence is explored using a
range of quantitative and qualitative evidence including test
scores, test taker language output and feedback from various
ÔplayersÕ in the test process including members of the
development team, test candidates, interviewers and raters.
This multi-layered approach yields a complex and richly
textured perspective on the comparability of the two kinds of
speaking tests. The Þndings have important implications for
the use of direct and semi-direct speaking tests in various high-
stakes contexts such as immigration and university entrance.
As such the book will be of interest to policy-makers and
administrators as well as language teachers and language
testing researchers.
Kieran OÕLoughlin is
Melbourne.
Kieran OÕLoughlin
Series Editors
Michael Milanovic
and Cyril Weir
The Equivalence of Direct and Semi-Direct Speaking Tests
The Equivalenceof Direct andSemi-DirectSpeaking Tests
senior lecturer in Language and Literacy
Education at the University of

The equivalence of direct and semi-direct speaking tests

STUDIES IN LANGUAGE TESTING . . . 13Series editor: Michael Milanovic and Cyril J. Weir
Also in this series:
An investigation into the comparability of two tests of English as a ForeignLanguage: The Cambridge–TOEFL comparability studyLyle F. Bachman, F. Davidson, K. Ryan, I-C Choi
Test taker characteristics and performance: A structural modelling approachAntony John Kunnan
Performance testing, cognition and assessment: Selected papers from the15th Language Testing Research Colloquium, Cambridge and ArnhemMichael Milanovic, Nick Saville
The development of IELTS: A study of the effect of background knowledgeon reading comprehensionCaroline Margaret Clapham
Verbal protocol analysis in language testing research: A handbookAlison Green
A multilingual glossary of language testing termsprepared by ALTE members
Dictionary of language testingAlan Davies, Annie Brown, Cathie Elder, Kathryn Hill, Tom Lumley,Tim McNamara
Learner strategy use and performance on language testsJames Enos Purpura
Fairness and validation in language assessment: Selected papers from the19th Language Testing Research Colloquium, Orlando, FloridaAntony John Kunnan
Issues in Computer-adaptive testing of reading proficiencyMicheline Chalhoub-Deville
Experimenting with uncertainty: Essays in honour of Alan DaviesA. Brown, C. Elder, N. Iwashita, E. Grove, K. Hill, T. Lumley,K.O’Loughlin, T. McNamara
An Emperical investigation of the componentiality of L2 Reading in Englishfor academic purposesCyril J. Weir, Yang Huizhong, Jin Yan

The equivalence of direct and
semi-direct speaking tests
Kieran J. O’Loughlin

PUBLISHED BY THE PRESS SYNDICATE OF THE UNIVERSITY OF CAMBRIDGE
The Pitt Building, Trumpington Street, Cambridge, United Kingdom
CAMBRIDGE UNIVERSITY PRESS
The Edinburgh Building, Cambridge CB2 2RU, UK40 West 20th Street, New York, NY 10011–4211, USA10 Stamford Road, Oakleigh, VIC 3166, AustraliaRuiz de Alarcón 13, 28014 Madrid, SpainDock House, The Waterfront, Cape Town 8001, South Africa
http://www.cambridge.org
© University of Cambridge Local Examinations Syndicate, 2001
First published 2001
Printed in Great Britain at the University Press, Cambridge
Typeface Times 10/12pt. System QuarkXPress® [UCLES]
British Library cataloguing in publication data
University of Cambridge, Local Examinations SyndicateThe equivalence of direct and semi-direct speaking tests
Author: Kieran J. O’Loughlin
1. Education. Assessment2. Education. Tests. Setting
ISBN 0521 66098X hardback0521 667933 paperback

Series Editor’s note viiPreface ixAcknowledgements xi
Chapter OneIntroduction 1
Rationale 1Methodological approach 2Structure of the book 3Direct, semi-direct and indirect speaking tests 4Establishing the equivalence of direct and semi-direct tests 6Research findings 12Conclusion 31
Chapter TwoThe access: test 33
Background to the test 33Development of the test 34The oral interaction sub-test 35Conclusion 45
Chapter ThreeMethodology 47
The instrumental case study approach 47Research design of the study 55Summary 61
Chapter FourTrial 1: The analysis of test scores 62
Overview 62The December 1992 trial 62A preliminary study 65The current study 69Conclusion 79
Contents

Chapter FiveTrial 1: The analysis of candidate language output 80
Overview 80Rationale 80Methodology 81Discourse Study A: The qualitative analysis 84Discourse Study B: Lexical density 100Conclusion 115
Chapter SixTrial 2: The study of test processes 117
Introduction 117The June 1994 trial 117Method 121Findings 125Conclusion 143
Chapter SevenTrial 2: The analysis of test scores 145
Introduction 145Analysis with anchored item difficulty estimates 145Analysis with unanchored item difficulty estimates 150Bias analysis 157Conclusion 161
Chapter EightSummary and conclusions 163
Overview 163Summary of findings 163Implications of findings 169
References 173Appendices 180Subject index 276Author index 278

Series Editor’s note
This volume addresses the issue of spoken language assessment looking inparticular at the equivalence of direct and semi-direct oral interviews. KieranO’Loughlin’s work is based on the development and validation of the spokenlanguage component of the access: test designed in the early 1990s formigrants to Australia. It is an important language testing project in theAustralian context and was funded by the Commonwealth Department ofImmigration and Ethnic Affairs. While the project as a whole brought togetherexperts from a number of Australian universities, the oral test was developedby a team at the University of Melbourne. This volume is of particularsignificance and interest to the language testing community because it takesa multi-faceted view of the investigation of test comparability. While muchresearch of this sort has tended to look only at quantitative data, largelycorrelational analyses, O’Loughlin taps into a range of different types ofevidence and attempts to explore the process of construct validation in oralassessment to a depth that is rarely found.
The assessment of spoken language ability is a topic of enduringimportance in the work of the University of Cambridge Local ExaminationsSyndicate (UCLES) given that UCLES assesses the spoken language abilityof about 800,000 candidates around the world every year. The issue of semi-direct versus direct assessment of speaking has continued to be a topic ofinterest at UCLES and we have found that O’Loughlin’s work makes avaluable contribution to our understanding. His work closely reflects our owninterests particularly in the area of the qualitative analysis of oral interviewinteraction.
The importance of oral assessment and the need to better understand thecomplex issues and interactions that underlie performance in this particularcontext have long been a topic of debate at UCLES. As early as 1945, JackRoach, an Assistant Secretary at UCLES at the time, was writing on the topicin his internal report entitled ‘Some Problems of Oral Examinations inModern Languages: An Experimental Approach Based on the CambridgeExaminations in English for Foreign Students.’ Indeed, in his book MeasuredWords (1995), Bernard Spolsky considers Roach’s work to be ‘probably stillone of the best treatments in print of the way that non-psychometricexaminers attempted to ensure fairness in subjective traditionalexaminations’. Roach’s work is addressed in more detail by Cyril Weir in avolume currently being prepared for this series that focuses on the revision ofthe Certificate of Proficiency in English (CPE).
VII
Over the last ten years or so, a considerable amount of work has takenplace at UCLES in order to gain a better understanding of oral interviewinteractions, processes and rating scales both in quantitative and qualitativestudies. Working internally or with colleagues at universities in the UK, USAand Australia, numerous studies have been carried out. Amongst other things,projects have looked at:
discourse variation in oral interviews;rating scale validation;interlocutor frames and how their use by examiners can be described
and monitored;interlocutor language behaviour;a methodology to allow test designers to evaluate oral assessment
procedures and tasks in real time;comparisons of one-to-one and paired oral assessment formats;test takers’ language output;the development and validation of assessment criteria.
In 1998 UCLES EFL established, within its Validation Department, adedicated unit to drive research in the area of performance testing, whichessentially covers the assessment of speaking and writing.
It should also be noted that the next volume in this series, A qualitativeapproach to the validation of oral language tests, by Anne Lazaraton alsomakes a valuable contribution to the assessment of spoken language ability.Both O’Loughlin’s and Lazaraton’s volumes underline UCLES commitmentto furthering understanding of the dimensions of spoken language assessment.
VIII

Preface
This study investigates the equivalence of direct (live) and semi-direct (tape-mediated) speaking tests. The issue is explored through a comparison of liveand tape-based versions of the speaking component of the access: test, a four-skill English language test designed for prospective non-English speakingbackground (NESB) skilled migrants to Australia. The access: test wasdeveloped between 1992 and 1994 by a consortium of Australian universitiesand Adult Migrant Education Program (AMES) providers under the aegis ofthe National Centre for English Language Teaching and Research (NCELTR),Macquarie University. The project was funded by the CommonwealthDepartment of Immigration and Ethnic Affairs (DIEA). The access: test wasused in overseas test centres from January 1993 until May 1998 when it wasreplaced by the International English Language Testing System (IELTS). Theoral interaction sub-test was designed by the Language Testing ResearchCentre (LTRC) at the University of Melbourne, Australia in 1992. The twoversions of the speaking sub-test were used interchangeably in overseas testcentres and candidates normally had no choice about the version which theywould undertake. It was important, therefore, that candidates’ final resultsshould not be adversely affected by the particular method used to assess theiroral proficiency.
Much previous comparability research in language testing has reliedprimarily on concurrent validation which focuses on the equivalence betweentest scores. However, in this book, it is argued that examining the relationshipbetween test scores provides necessary but insufficient evidence as to whetherthe same language constructs are being tapped in different tests. Thisprovided the rationale for a study which employed a wide range of verydifferent types of evidence (including test taker language output, feedbackfrom the various ‘players’ in the test process such as test developers,interviewers, test takers and raters as well as test scores) and analyses (bothqualitative and quantitative) in order to investigate the equivalence of thedirect and semi-direct versions of the access: oral interaction sub-test. In sodoing, it demonstrates the need to examine language tests from multipleperspectives in order to obtain deeper insights into what they appear tomeasure and thus provide richer, more comprehensive evidence for constructvalidity of which concurrent validity is only one (albeit important)
IX

component. In turn, it is argued, this approach provides a more solid andtherefore more valid basis from which to draw conclusions about testequivalence.
The various types of data used in the study were gathered from twoseparate trials conducted in Melbourne, Australia (December 1992 and June1994) where test takers undertook both the live and tape-based versions of theoral component of the access: test.
The statistical analysis of test scores from the two versions in theDecember 1992 trial were contradictory insofar as conflicting results wereobtained from the different measures used to measure their equivalence.However, the most rigorous measure indicated a lack of equivalence.
A comparative study of test taker language output under the two testconditions was then undertaken using audio recordings obtained from theDecember 1992 trial. While broad qualitative analyses of a range of discoursefeatures suggested that there were important similarities between nearly all ofthe tasks on the two versions, a more detailed quantitative analysis of lexicaldensity suggested that all tasks on the live version were characterised by asignificantly higher level of interactivity than on the tape version. This resultsuggested the possibility that different oral skills were being tapped in the liveand tape versions despite the attempt to equate them at the design stage, i.e.interactive versus monologic speaking ability.
The examination of test processes in the June 1994 trial provided furtherevidence in support of this conclusion but suggested that the apparent lack ofequivalence between test scores obtained in the two versions could also partlybe explained by the impact of a number of contaminating factors other thanoral proficiency on the measurement process. These factors included thequality of the interaction between candidate and interlocutor on the liveversion, the adequacy of preparation and response times on the tape version,candidates’ level of comfort with the two versions as test environments andthe existence of rater bias in relation to individual candidates on bothversions.
Finally, the analysis of test scores and especially the band levels obtainedby candidates in the June 1994 trial confirmed the apparent lack ofequivalence between test scores reported in the December 1992 trial.
Overall, these findings suggested that the live and tape-based versions ofthe oral interaction sub-test could not be safely substituted for each otherprimarily because they were drawing on different components of the oralproficiency construct but also because the measurement process appeared tohave been insufficiently constrained so as to yield a satisfactory level ofreliability across the two formats.
X

Acknowledgements
I am grateful to the following organisations for permission to reproducepreviously published material in this book: firstly, Arnold Publishers for anarticle entitled ‘Lexical density in candidate output on direct and semi-directversions of an oral proficiency test’ appearing in Language Testing (1995)12, 2: pp. 217–37 (see Chapter 5) and secondly, NCELTR publications,Macquarie University, for a chapter entitled ‘Test taker performance on directand semi-direct versions of the oral interaction module’ published in access:issues in language test design and delivery (1997): pp. 117– 46 (see Chapters6 and 7).
I dedicate this book to Don Hay, and to all of the other unsung heroes ofthe AIDS pandemic – the living and the dead.
J'ai toujours pensé que j'étais étranger à cette ville et que je n'avaisrien à faire avec vous. Mais maintenant j'ai vu ce que j'ai vu, je saisque je suis d'ici, que je le veuille ou non. Cette histoire nous concernetous.
La Peste, Albert Camus
XI


Introduction
RationaleThis study explores the equivalence of direct (live) and semi-direct (tape-mediated) speaking tests. This has become an important issue in languagetesting with the recent advent of semi-direct tests which claim to representfirstly, a valid and reliable substitute for direct procedures in many contextsand secondly, a more standardised and cost-efficient approach to theassessment of oral language proficiency than their direct counterparts. Thekey question examined in this study is whether or not the two test formats canbe considered equivalent in both theoretical and practical terms. Thisequivalence issue is examined here in the context of the oral interactioncomponent of the access: test (the Australian Assessment of CommunicativeEnglish Skills), a ‘high stakes’ English language test targeted at prospectiveskilled migrants from non-English speaking backgrounds (NESB).
The access: oral interaction sub-test was developed in two versions – direct(live) and semi-direct (tape-mediated) – and administered in test centresaround the world between 1993 and 1998. The direct version was designed tobe used on an individual face-to-face basis (i.e. a single candidate speakingwith a trained interlocutor) while the semi-direct version was developed foruse in a language laboratory setting where groups of test takers undertake thetest simultaneously. Administrators at the overseas test centres were thereforeable to make a choice between the two versions based on the human and/ortechnical resources available to them at any given time. Specifically, thisdecision depended on first, the number of candidates being tested at eachcentre; secondly, the technological facilities available (including languagelaboratories); and thirdly, the availability of suitable interlocutors for the liveversion.
Since test takers were assigned arbitrarily to either version depending onthe location where they undertook the test, it was important that theirperformance should not be adversely affected by the particular format towhich they were allocated. This issue provided the practical motivation forthe investigation into the interchangeability of the two versions of the access:oral interaction sub-test undertaken in this study.
Given the constraints placed on overseas test centres it is important to noteat this point that the central validation question did not involve determining
1
1

which version of this speaking test was preferable but, instead, to what extentthe two versions could be considered equivalent on the basis of data drawnfrom test trials. The development of the test is described in more detail inChapter 2.
Methodological approachFrom a theoretical perspective it should be noted that much previouscomparability research in language testing has been based on concurrentvalidation, which focuses on the degree of equivalence between test scores.Traditionally, this validation procedure has examined the strength ofcorrelation between scores derived from two tests. High correlations are takento indicate that the two tests measure the same language abilities while lowcorrelations suggest this is not the case. Many of the empirical studiesreported later in this chapter attempt to establish the equivalence of direct andsemi-direct speaking tests in this way. However, as Shohamy (1994)convincingly argues, investigating the relationship between test scoresprovides necessary but insufficient evidence as to whether the same languageabilities are being tapped in different tests. She suggests that this issue canonly be answered through the more complex process of construct validationin which concurrent validation plays an important but nevertheless partialrole.
This study therefore attempts to go beyond concurrent validation in orderto examine the comparability or equivalence of the direct and semi-directversions of the access: oral interaction sub-test. A case study approach(Merriam 1988; Yin 1989; Johnson 1992; Nunan 1992) was adopted to carryout the investigation because of first, its holistic focus on the ‘boundedsystem’ (i.e. the access: oral interaction sub-test); secondly, its exploratory,iterative orientation; and thirdly, its capacity to accommodate differentphilosophical perspectives and research methods (both quantitative andqualitative). This research project was conceived as an instrumental casestudy (Stake 1994) because, in examining the comparability of the live andtape-based versions of this speaking test, it aimed to shed light on thepotential equivalence of this and other pairs of direct and semi-direct oralproficiency tests.
In philosophical terms, (as outlined in Chapter 3), an accommodationiststance (Cherryholmes 1992; Lynch 1996) was used to address the researchquestion. This stance enabled the equivalence issue to be investigated fromwithin both the positivistic and naturalistic research paradigms. Because of itsdual emphasis on both product and process and its reliance on bothquantitative and qualitative research methods, this strategy eventuallyallowed for more solidly grounded, valid conclusions than would have beenthe case if only one paradigm had been used.
2
1 Introduction

The data for the study were collected from two separate trials of this test(December 1992 and June 1994) where candidates undertook both the liveand tape-based versions of the access: oral interaction sub-test.
In the first ‘case’, the December 1992 trial, the comparability issue wasaddressed from within a positivistic framework and the focus was on differentkinds of products, test scores and test taker language output. Firstly, theequivalence of scores obtained by the trial candidates who had completedboth versions was examined using multi-faceted Rasch measurement.Secondly, in order to investigate whether the language produced under thetwo test conditions was comparable, the discourse features of sampleaudiorecordings from the December 1992 trial were analysed bothqualitatively and quantitatively using a framework developed by Shohamy(1994). The focus on test scores and test taker output in this trial yieldedimportant but contradictory evidence in relation to the equivalence issue. Thissubsequently led to the adoption of another very different perspective fromwhich to address the research question in a subsequent trial.
In the second ‘case’, the June 1994 trial, the comparability issue was firstexamined from a naturalistic perspective and the investigation focused on testprocesses including the processes of test design, test taking and rating. Thisinvolved tracking the various stages of the trial and gathering a variety of datausing observation, interviews and questionnaires. In this case both the dataand methods of analysis were mainly qualitative. The test scores from thistrial were then analysed quantitatively again using multi-faceted Raschanalyses and the results of selected candidates interpreted using the findingsfrom the previous study of test taking processes. This led to additionalquantitative analyses of the test scores from this trial.
By moving back and forward between the positivistic and naturalisticperspectives, therefore, the researcher was able to gather a wide range ofevidence to support the conclusions reached in the study. The necessity forthis dual perspective will become clearer as the evidence on the validity of thelive and tape-based tests unfolds in later chapters.
Structure of the bookThe rest of this chapter reviews the literature comparing direct and semi-direct tests of oral language proficiency. After introducing direct, semi-directand indirect tests of oral proficiency, it discusses the most importanttheoretical claims made about direct and semi-direct tests and then examinesthe findings reported in a range of empirical studies comparing the two kindsof tests. Chapter 2 introduces the access: test in general and the oralinteraction sub-test in particular. The comparability of the two versions of theoral interaction sub-test is also briefly examined from the perspective of therelevant test specifications. Chapter 3 describes the methodology used to
3
1 Introduction

empirically investigate the equivalence of the direct and semi-direct versionsof the access: oral interaction sub-test. Chapter 4 examines this issue inrelation to the test scores obtained from the first trial held in December 1992using multi-faceted Rasch measurement. Chapter 5 looks at the comparabilityquestion from the perspective of test taker language output on the twoversions in the same trial. Chapter 6 explores the test design, test taking andrating processes in a later trial (June 1994) in order to provide a very differentperspective on the equivalence of the two versions. Chapter 7 examines thetest scores from this second trial again using multi-faceted Rasch analyses.Chapter 8 summarises the findings of the research and then evaluates theusefulness of the various methodologies used in the study to address the mainresearch question and the significance of the findings based on thesetechniques.
Direct, semi-direct and indirect speaking testsClark (1979) provides the basis for distinguishing three distinct types ofspeaking tests, namely, indirect, semi-direct and direct tests. Indirect testsgenerally refer to those procedures where the test taker is not actually requiredto speak and belong to the ‘precommunicative’ era in language testing.Examples of this kind of procedure are the pronunciation tests of Lado (1961)in which the candidate is asked to indicate which of a series of printed wordsis pronounced differently from others. Direct speaking tests, on the otherhand, according to Clark (1979: 36) are
... procedures in which the examinee is asked to engage in a face-to-face communicative exchange with one or more human interlocutors.
Direct tests first came into use in the 1950s when the Oral ProficiencyInterview (OPI) was developed by the US Foreign Services Institute (FSI).The OPI, as it was originally conceived, is a relatively flexible, unstructuredoral interview which is conducted with individual test takers by a trainedinterviewer who also assesses the candidate using a global band scale. Thismodel has been widely adopted around the world since the 1970s as the mostappropriate method for measuring general speaking proficiency in a secondlanguage. The Australian Second Language Proficiency Ratings (ASLPR)oral interview developed by Ingram and Wylie (1984) is modelled closely onthe original OPI.
In the last decade or so different models of the OPI have evolved. Inresponse to criticisms about the validity and reliability of the original OPIthere has been a growing trend towards greater standardisation of theprocedure using a range of specified tasks which vary in terms of suchcharacteristics as topic, stimulus, participant roles and functional demands.
4
1 Introduction

An important example of this kind of test is the speaking component of theInternational English Language Testing System (IELTS), which has beendeveloped by the University of Cambridge Local Examinations Syndicate(UCLES) and is used to assess the readiness of candidates to study or train inthe medium of English. The IELTS test can presently be taken in 105 differentcountries around the world each year. The current speaking sub-test takes theform of a structured interview consisting of five distinct sections whichsystematically vary the communicative demands made on candidates. Theseinclude an introduction where the candidate and interviewer introducethemselves, an extended discourse task in which the candidate speaks atlength about a familiar topic, an elicitation task where the candidate isrequired either to elicit information from the interviewer or to solve aproblem, a speculation and attitudes task where the candidate is encouragedto talk about his/her future plans and proposed course of study, and finally aconclusion where the interview is brought to a close (UCLES 1999). UCLEShas developed other similar types of speaking tests including the PreliminaryEnglish Test, Cambridge First Certificate in English and Certificate ofProficiency in English oral interviews. This more structured, task-basedapproach to the direct testing of speaking has grown considerably inpopularity around the world in recent years. It was also adopted in thedevelopment of the direct version of the access: speaking sub-test (seeChapter 2).
The term semi-direct is employed by Clark (1979: 36) to describe thosetests which elicit active speech from the test taker
... by means of tape recordings, printed test booklets, or other ‘non-human’ elicitation procedures, rather than through face-to-faceconversation with a live interlocutor.
Normally an audio-recording of the test taker’s performance is made andlater rated by one or more trained assessors.
Semi-direct tests first appeared during the 1970s and have grownconsiderably in popularity over the last 25 years, especially in the UnitedStates. They represented an early attempt to standardise the assessment ofspeaking while retaining the communicative basis of the OPI (Shohamy 1994:101). In addition, they are clearly more cost efficient than direct tests,particularly when administered to groups in a language laboratory, andprovide a practical solution in situations where it is not possible to deliver adirect test e.g. where the training and/or deployment of interlocutors is aproblem. In recent years they have come under close scrutiny in relation totheir validity in particular as we shall see later in this chapter.
Examples of semi-direct procedures used in the US include the Test ofSpoken English (TSE) (Clark and Swinton 1979), the Recorded Oral
5
1 Introduction

Proficiency Examination (ROPE) (Lowe and Clifford 1980) and theSimulated Oral Proficiency Interview (SOPI) (Stansfield et al. 1990).Examples of semi-direct tests designed in the United Kingdom include theTest in English for Educational Purposes (TEEP) (James 1988) and theOxford-ARELS Examinations (ARELS Examinations Trust 1989).
Of the three procedures – direct, semi-direct and indirect tests of oralproficiency – indirect tests are generally viewed as the least valid measure ofthe ability to speak a language precisely because the test taker is not requiredto speak at all in the course of the test.
Establishing the equivalence of direct andsemi-direct testsThis section reviews the most important theoretical arguments and empiricalfindings to date about the potential equivalence of direct and semi-directspeaking tests in relation to their relative validity, reliability and practicality.
Theoretical claims
Validity
In opening the debate on the equivalence issue Clark (1979) argued that directtests are the most valid procedures as measures of global speaking proficiencybecause of the close relationship between the test context and ‘real life’. Inother words, direct tests more authentically reflect the conditions of the mostcommon form of ‘real world’ communication, face-to-face interaction. Yet,Clark (1979: 38) also acknowledges that the OPI, the most widely used directprocedure, fails to meet these conditions in two important respects. First, thereis the problem of the interviewer:
In the interview situation, the examinee is certainly aware that he orshe is talking to a language assessor and not to a waiter, taxi driver, orpersonal friend.
Secondly, the language elicited in an interview is unlikely to reflect thediscourse of ‘real-life’ conversation. In particular, the fact that the interviewercontrols the interview means that the candidate is normally not required to askquestions.
Hughes (1989) and van Lier (1989) also challenge the validity of the oralinterview in terms of this asymmetry which exists between the interviewerand the candidate. Hughes (1989: 104) points out that in an oral interview ‘thecandidate speaks as to a superior and is unwilling to take the initiative’.Consequently, only one style of speech is elicited, and certain functions (suchas asking for information) are not represented in the candidate’s performance.
6
1 Introduction

Hughes recommends the inclusion of tasks such as role plays and discussionsas ways of varying the type of interaction, although the underlying asymmetrybetween interviewer and candidate may not be automatically removed bysimply incorporating other tasks in which the participants seem more equal.
Van Lier pursues a stronger version of this argument. He questions whetheran interview can validly serve the purpose of assessing oral proficiency bycontrasting the essential features of conversations and interviews. Aninterview, in van Lier’s (1989: 496) terms, is distinguished by ‘asymmetricalcontingency’:
The interviewer has a plan and conducts and controls the interviewlargely according to that plan.
On the other hand, a conversation, van Lier (1989: 495) contends, ischaracterised by
face-to-face interaction, unplannedness (locally assembled),unpredictability of sequence and outcome, potentially equaldistribution of rights and duties in talk, and manifestation offeatures of reactive and mutual contingency.
The emphasis in an interview is on the successful elicitation of languagerather than on successful conversation. Van Lier (1989: 505) calls for researchinto whether or not conversation is the most appropriate vehicle to test oralproficiency. If so, he argues,
we must learn to understand the OPI, find out how to allow a trulyconversational expression of oral proficiency to take place, andreassess our entire ideology and practice regarding the design ofrating scales and procedures.
If direct tests, particularly oral interviews, can be criticised for their lack ofauthenticity then, at face value, semi-direct tests are even more open to thischarge. Clark (1979: 38), for instance, argues that they
require the examinee to carry out considerably less realistic speakingtasks (than direct tests) – such as responding to tape-recordedquestions, imitating a voice model, or describing pictures aloud –which, although they do involve active speaking, represent ratherartificial language use – situations which the examinee is not likely toencounter in a real-life (i.e. non-test) setting.
7
1 Introduction

However, it should be noted that such ‘artificial’ tasks as ‘describingpictures aloud’ have also been used in some direct tests including the liveversion of access: oral interaction sub-test (see Chapter 2).
Underhill (1987: 35) is also strongly critical of the lack of authenticity insemi-direct tests:
There are few situations in the real world in which what the learnersays has absolutely no effect on what he hears next.
Secondly, he suggests, there is the problem that the assessor misses visualaspects of the candidate’s communication in a semi-direct test since theirjudgement is normally based on an audio-recording of the test performance.Thirdly, while a direct test can be lengthened or directed more carefully if theinterviewer considers the speech sample produced by the candidate to beinadequate for assessment purposes, this is not the case in a semi-direct testwhere the amount of response time allowed is ‘set’ in advance. Lastly,speaking to a microphone rather than another person may be unduly stressfulfor some candidates, especially if they are unused to a language laboratorysetting. Possible means of reducing their anxiety include giving instructionsin the native language, or in written form, or by ensuring that all test takersare familiar with the system in advance.
Both Clark (1979) and Underhill (1987) therefore clearly favour the use ofdirect tests over their semi-direct counterparts, at least for measuring generalspeaking proficiency. Clark (1979: 38) contends that
the face-to-face interview appears to possess the greatest degree ofvalidity as a measure of global speaking proficiency and is clearlysuperior in this regard to both the indirect (non-speaking) and semi-direct approaches.
Clark (1979: 39) suggests that semi-direct tests lend themselves better towhat he calls ‘diagnostic achievement tests’ which measure discrete aspectsof speaking performance such as vocabulary items and syntactic patterns,(although this seems a rather reductive view of the potential use of this kindof test). In general, he argues against using either test type for ‘crosspurposes’, i.e. for either obtaining detailed achievement information using adirect test or measuring global proficiency using a semi-direct test. However,Clark (1979: 48) also suggests that:
semi-direct tests may be proposed as second-order substitutes fordirect techniques when general proficiency measurement is at issue butit is not operationally possible to administer a direct test. In these
8
1 Introduction

instances, it is considered highly important to determine – throughappropriate experimental means – a high level of correlation betweenthe two types of instruments when used with representative examineegroups.
In accordance with the traditional requirements for concurrent validation(Alderson et al., 1995: 178) a correlation of 0.9 or higher is argued to be theappropriate level of agreement at which test users could consider ‘the semi-direct testing results closely indicative of probable examinee performance onthe more direct measures’ (Clark 1979: 40). However, a high correlationbetween scores obtained from direct and semi-direct tests of oral proficiencydoes not in itself constitute sufficient evidence that a semi-direct test can bevalidly substituted for a direct one: the two kinds of tests may not bemeasuring the same construct. In other words, they could be assessingdifferent components of the oral proficiency trait. The inadequacy ofconcurrent validation is a central issue in this study and its limitations will beexamined more closely later in this chapter in relation to empirical studiespreviously carried out on the equivalence of direct and semi-direct tests.
Finally, while Clark’s (1979) suggestion that direct tests are preferablebecause they generally approximate ‘real-life’ communication more closelythan semi-direct tests is reasonable (albeit perhaps rather simplistic – see thediscussion of the study by Hoejke and Linnell (1994) later in this chapter), hefails to articulate precisely which speaking skills are tapped in the two testformats. In a later publication Clark (1986: 2) is more explicit about what islacking in semi-direct tests:
interactive discourse-management aspects of the student’s overallspeaking proficiency cannot be readily elicited (or by the same token,effectively assured) through semi-direct techniques.
This limitation notwithstanding, Clark (1986: 2) is now more optimisticthat the semi-direct format
can serve to validly and efficiently measure many of the otherperformance aspects that constitute overall speaking proficiency.
He argues that this is particularly true of ‘proficiency-oriented semi-directtests’ which attempt to approximate as closely as possible the ‘... linguisticcontent and manner of operation’ as well as the scoring procedures of a liveinterview.
Van Lier (1989: 493) adopts a less equivocal position than Clark (1986).He considers face-to-face direct tests to be, in principle, more valid than othertest formats including semi-direct tests in most circumstances since
9
1 Introduction

face-to-face talk is to be regarded as the unmarked form of interaction,and communicating by telephone or speaking into a microphone asmarked forms of interaction.
He argues that proficiency in these marked forms of communication is anadvanced skill which should only be tested in special instances:
Hence, although remote interaction may be part of performancetesting for specific groups of learners, it would appear to be an unfair,that is invalid, measure of general oral proficiency.
While ‘remote communication’ may be more difficult for some test takers,this may not necessarily be the case for other people unaccustomed to face-to-face interaction. However, if different speaking abilities do underlie thesetwo kinds of communication then the interchangeability of direct and semi-direct tests of oral proficiency is left in doubt.
Reliability
While semi-direct tests have been typically viewed as inferior to direct testsin relation to validity they are often seen as possessing potentially strongerreliability. Hughes (1989) argues that the chief advantages of semi-directprocedures are the uniformity of their elicitation procedures and the increasedreliability which is likely to flow from such standardisation. This uniformityis inevitably placed under threat in direct tests because of interviewervariability. As Lazaraton (1996: 154) suggests,
[t]he potential for uneven interviewer performance in a face-to-faceinterview is one reason that [semi-direct tests] are so appealing i.e.they remove the variability that a live interlocutor introduces.
This is particularly true of the relatively unstandardised OPI where thecontent and form of the questions posed to the test taker can vary considerablyfrom one interview to another.
This lack of standardisation can then have adverse effects on testperformance and reliability of scoring. Underhill (1987: 31), for example,points out that, in an oral interview, the lack of script or set tasks gives thisprocedure its flexibility and yet
this flexibility means that there will be a considerable divergencebetween what different learners say, which makes a test more difficultto assess with consistency and reliability.
10
1 Introduction

Underhill also contends that the more predictable content of candidate outputin semi-directs tests means that the scoring criteria can be more easily andaccurately constructed. This, he claims, is likely to yield more reliable results.In direct tests where the interviewer also acts as the rater (such as the OPI)there is also some doubt cast over whose performance is actually beingassessed. James (1988: 116) suggests that the situation
... can develop into a catechesis often with examiners’ marks reflectingtheir satisfaction with their own performances rather than those of thecandidates.
In general, therefore, semi-direct tests are believed to provide a morereliable measure of oral proficiency than their direct counterparts.
Practicality
It is frequently claimed that semi-direct tests offer a more practical alternativeto the assessment of speaking proficiency than direct tests. Underhill (1987)lists several important advantages which semi-direct tests possess in thisregard. First, since groups of candidates can be tested simultaneously inlanguage laboratories using this format, a semi-direct test can be conductedmore economically and efficiently. Secondly, the marking does not have to bedone in real time since the candidate’s performance is audio-recorded and cantake place whenever and wherever it is convenient to do so (although it shouldbe noted that the same provision could be built into a direct test). Thirdly, itsfixed structure allows assessors to listen to the tapes more quickly by fast-forwarding past instructions and longer task stimuli. Fourthly, tape-mediatedtests can be useful where there are logistical problems in obtaining suitableinterviewers. Finally, it is undeniable that most forms of direct procedures aremore expensive than their semi-direct counterparts because of the higher costsincurred in the selection and training of interviewers and assessors and theadministration of the test.
On the other hand, Underhill notes that technical problems can result inpoor quality recordings or even no recording at all when a semi-direct formatis adopted. Of course, either of these eventualities can occur when direct testsare being recorded for later assessment by raters other than the interviewer.However, live tests where the interviewer carries out the assessmentobviously avoid this problem.
At this point it is important to note that in much of the preceding discussionthe term ‘direct test’ is defined solely in relation to the OPI no doubt becauseof its dominance in the world of proficiency testing until very recently. Theprototypical OPI is very different from most semi-direct procedures notsimply in terms of whether the candidates speak to a microphone or another
11
1 Introduction

person but also in terms of its structure and its degree of standardisation.Taken together these differences make it extremely difficult to compare thetwo kinds of tests.
Research findingsThis section reviews the empirical research literature on the comparability ofdirect and semi-direct tests of oral proficiency.
Concurrent validation
Following Clark (1979), attempts to establish the equivalence of these twotypes of speaking test have relied primarily on concurrent validation, at leastuntil very recently. This form of validation involves correlating the test scoresobtained from the same group of test takers, who have undertaken twodifferent tests. If the correlation between the scores is strong then it has beentraditionally inferred (often prematurely) that the two tests are measuring thesame ability. Concurrent validation also assumes that one of the tests is a validmeasure of the language ability in question and can therefore serve as the‘criterion behaviour’ (Bachman 1990: 249). In most of the research reportedto date the direct test – normally the OPI – fulfils this function. It is assumedthat it is the semi-direct test whose validity needs to be established in thisprocess.
The OPI and the scale which is used to rate it have been in use in variousforms since the 1950s. The OPI was originally developed by the US ForeignService Institute which is responsible for the training of diplomats and foreignservice officers in foreign languages. It was adapted by the American Councilfor the Teaching of Foreign Languages (ACTFL), the Educational TestingService (ETS) and the Interagency Language Roundtable (ILR) in the 1970sand became known therefore as the main assessment tool of the ‘AEI’proficiency movement (Lowe 1988). The OPI, and the scale on which it isscored, have been widely accepted as a standard for assessing oral proficiencyin a foreign language in the US and other countries (Bachman 1991). It is alsothe precursor of the Australian Second Language Proficiency Ratings(ASLPR) (Ingram and Wylie 1984).
The prototypical OPI consists of a face-to-face interview conducted in thetarget language by a trained interlocutor (who usually also carries out theassessment) and can include a role play segment. The topics, language inputand timing of the interview are adjusted according to the candidate’sperceived proficiency which is probed using questions requiring increasinglymore complex responses. The topics are chosen by the interlocutor from arange of possible options as specified in the test manual. The OPI usually endswith a ‘wind down’ phase consisting of one or more easy questions designed
12
1 Introduction

to put the examinee at ease and to facilitate the ending of the test. Thecandidate’s performance is scored holistically using either the ILR orACTFL/ETS scales. The ILR scale consists of 11 levels of general oralproficiency ranging from ‘0’ (no ability to communicate effectively in thelanguage) to ‘5’ (functioning as an educated native speaker). It includes fivemid-points (i.e. 0+, 1+, 2+, 3+, 4+) for performances that surpass therequirements for a given level but which fail to reach the next level. However,these mid-points are not defined. The ACTFL/ETS scale, which is derivedfrom the ILR scale, describes different proficiency levels beginning at‘Novice’, which consists of three sub-levels, moving up to ‘Intermediate’,also comprising three sub-levels, ‘Advanced’, with two sub-levels and finally‘Superior’. Tables 1.1 and 1.2 provide the headings from the officialdescriptions of proficiency at the various levels on the ILR and ACTFL/ETSscales respectively. Table 1.3 shows the relationship between the ILR scaleand the ACTFL/ETS scale (Lowe 1987; Clark and Clifford 1988).
Table 1.1
The ILR scale
LEVEL 1Elementary proficiency: able to satisfy routine travel needs and minimumcourtesy requirements.
LEVEL 2Limited working proficiency: able to satisfy routine social demands and limitedwork requirements.
LEVEL 3Minimum professional proficiency: able to speak the language with sufficientstructural accuracy and vocabulary to participate effectively in most formal andinformal conversations on practical, social and professional topics.
LEVEL 4Full professional proficiency: able to use the language fluently and accuratelyat all levels normally pertinent to professional needs.
LEVEL 5Native or bilingual proficiency: speaking proficiency equivalent to that of aneducated native speaker.
13
1 Introduction

14
1 Introduction
Table 1.2
The ACTFL/ETS scale
NOVICEThe novice level is characterised by an ability to communicate minimally withlearned material.
INTERMEDIATEThe intermediate level is characterised by an ability to create with thelanguage by combining and recombining learned elements, though primarily ina reactive mode; initiate, minimally sustain, and close in a simple way basiccommunicative tasks; and ask and answer questions.
ADVANCEDThe advanced level is characterised by an ability to converse in a clearlyparticipatory fashion; initiate, sustain, and bring to closure a wide variety ofcommunicative tasks, including those that require an increased ability toconvey meaning with diverse language strategies due to a complication or anunforeseen turn of events; satisfy the requirements of school and worksituations; and narrate and describe with paragraph-length connecteddiscourse.
SUPERIORThe superior level is characterised by the ability to participate effectively inmost formal and informal conversations on practical, social, professional, andabstract topics; and support opinions and hypothesise using native-likediscourse strategies.
Table 1.3
Relationship between the ILR scale and the ACTFL/ETS scale
ILR ACTFL/ETS3 and above Superior2+ Advanced Plus2 Advanced1+ Intermediate-High1 Intermediate-Mid & Low0+ Novice-High, Mid & Low0 0
The OPI and its immediate successors have dominated the landscape ofspeaking tests for the last 25 years. And yet, periodically, there have beenattempts to find a more standardised, cost-effective but still sufficiently validand reliable assessment instrument to replace it. Semi-direct tests appeared tomany language testing experts to have the potential to provide such analternative.

The earliest attempt to devise a semi-direct test in the US was the TSE(Clark and Swinton 1979). The TSE was introduced by the EducationalTesting Service (ETS) in 1980 to meet a general need for an internationalstandardised test of oral English proficiency. It is now used in over 80countries around the world, often as an adjunct to the Test of English as aForeign Language (TOEFL), which does not have a speaking component. TheTSE has also been widely used by universities in the US to assess the oralproficiency of NESB international teaching assistants (ITAs). The test is tape-based, conducted entirely in English and of approximately 20 minutes’duration. It consists of six discrete tasks including answering simple personalquestions, reading aloud, sentence completion, narration using a sequence ofpictures, description and discussion of a topical issue. The test is scored forpronunciation, grammar, fluency and an overall category, comprehensibility,which represents a more general assessment of the test taker’s oralproficiency.
In an early study Clark and Swinton (1980: 18) found that scores on theTSE and OPI obtained by a group of foreign teaching assistants (N = 134)correlated at r = 0.80. This result suggested to them that the TSE was ‘areasonable alternative to the FSI interview when it is not possible to carry outface-to-face testing’ even though it is lower than the figure of 0.9 originallyproposed by Clark (1979) to be the acceptable level of agreement at which asemi-direct test might be substituted for a direct test.
In a more recent study Southard and Sheorey (1992: 54) attempted toestablish whether a rated interview ‘could serve as a substitute for astandardised measure such as the TSE’. This study is unusual insofar as it usesa semi-direct measure of oral proficiency as the ‘criterion behaviour’(Bachman 1990: 249) against which the concurrent validity of the directinterview procedure is investigated.
In Southard and Sheorey’s study the TSE results of 19 ITAs in thedepartment of English at Oklahoma State University were compared withtheir performance on a direct interview test. The interview consisted of astructured conversation between individual ITAs and a panel of five judgesincluding two experienced ESL professionals and three ‘naïve’ assessors (thedirector of the English department’s freshman composition program and twoundergraduate students). Candidates were then rated by each member of thepanel on a five point scale in the following categories: pronunciation,grammar, vocabulary, auditory comprehension and overall communicativecompetence.
On the basis of statistically significant (in most cases) but still relativelylow correlations between scores on the various criteria used in the two tests(ranging from 0.19 to 0.89) Southard and Sheorey (1992: 62) suggest that
15
1 Introduction
a well-designed, on-campus interview conducted by experienced ESLteachers who are given structured training in evaluating oralproficiency can be used as an alternative instrument if a standardisedtest like the TSE is not readily available.
However, given the mainly modest correlation figures reported and thelimitations of using such evidence to infer that the two tests are measuring thesame abilities, this conclusion appears rather dubious. It is also surprising tonote here, unlike in most other recent studies, that a semi-direct procedure isassumed to be valid from the outset and that at no stage of this study is thisassumption about the TSE seriously called into question. In the literaturegenerally, it is normally the validity of direct measures of oral proficiencywhich is taken for granted and that of semi-direct alternatives which needs tobe established.
Another early semi-direct test developed in the US, this time designed toassess foreign language oral proficiency, was the ROPE (Lowe and Clifford1980). The ROPE test more closely resembled the OPI than did the TSE inseveral important ways. In the ROPE test candidates listen to a series of tape-recorded questions in the target language and provide responses ranging from‘yes/no’ to detailed expressions of opinion. Unlike the TSE, there are nowritten or visual stimuli in this test. The ROPE is scored on the ILR scalefrom 0+ to 5 (see Table 1.1 above). While the ROPE more closelyapproximated to the OPI in terms of the kinds of questions used and themethod of scoring than the TSE, an important limitation was that not allcandidates could understand the questions since they were presented in thetarget language (Stansfield et al. 1990). Lowe and Clifford report a correlationof r = 0.90 between scores on the OPI and ROPE across several languagesincluding French, German and Spanish, which meets the level of agreementstipulated by Clark (1979) for test substitution. However, this result should beviewed cautiously given that the total number of subjects was only 27. Moreimportantly, as suggested above, this result alone may not be sufficient toconclude that the two kinds of tests are equivalent.
These studies therefore clearly illustrate the exclusive reliance which hasbeen placed on concurrent validation to establish the equivalence of direct andsemi-direct assessment procedures until very recently. As we shall see, thisapproach was also favoured, at least initially, in comparing the OPI with amore recently developed semi-direct foreign language test, the SimulatedOral Proficiency Interview test (SOPI).
The impetus for the development of the SOPI in the late 1980s was createdby problems relating to the testing of less commonly taught languages in theUS such as Chinese and Portuguese. In these instances the prohibitive costsand practical difficulties involved in training and deploying suitable
16
1 Introduction

interviewers for the OPI meant that a different test format needed to becreated, one that could be administered on a one-off basis to individualcandidates as well as to large groups throughout the country where required.A semi-direct test seemed to have the potential to meet these needs.
The first SOPI was developed by Clark and Li (1986) (although notlabelled as such) at the Center for Applied Linguistics (CAL), Washington,DC to assess oral proficiency in Chinese. Stansfield and Kenyon (1988) laterused this model (formally naming it the simulated oral proficiency interviewor SOPI) to create a similar test in Portuguese. This was followed by thedevelopment of tests in other less commonly taught languages includingHebrew (Shohamy et al. 1989), Hausa and Indonesian (Stansfield andKenyon 1989). All of these tests were developed at CAL.
Interestingly, the development of the SOPI also reflected in its designincreasing concerns emanating from language testing research about thevalidity and reliability of the OPI. In terms of its validity Shohamy (1983), forinstance, queried whether a single type of interaction (i.e. an interview) wassufficient to assess oral proficiency. Perrett (1987) argued that while the oralinterview may enable assessment of the candidate’s phonological and lexico-grammatical skills and some aspects of discourse competence, it does notprovide sufficient information about the candidate’s control over an adequaterange of text types, speech functions and exchange structures. Raffaldani(1988) suggested that the interview format is the main reason why the OPIfails to elicit some important aspects of communication: a limited number ofspeech functions are sampled and so candidates have little opportunity todisplay either discourse or sociolinguistic competence. As noted earlier in thischapter, van Lier (1989) also questioned whether an interview was the mostsuitable vehicle for the measurement of oral proficiency since it largely failsto tap the test taker’s conversational ability. In terms of reliability, Shohamy(1983) suggested that OPI scores were affected by a range of contextualvariables including topic, type of interaction and interviewer behaviour. Eachinterview is therefore different because these variables are not tightlycontrolled.
There was growing interest, therefore, amongst language testing experts inexploring the potential of semi-direct tests to enhance the reliability andvalidity of speaking tests by controlling such variables and including a rangeof task types (Shohamy 1994). Thus, by the mid-1980s, they were no longernecessarily conceived as merely ‘second order substitutes for directtechniques’ (Clark 1979: 48) but as potentially more valid and reliable thantheir direct counterparts.
The SOPI differed from the OPI in several important respects. As in theOPI, there is an initial ‘warm up’ phase where the candidate is asked a numberof simple personal background questions. The rest of the test consists of aseries of set tasks (in contrast to the more open-ended question and answer
17
1 Introduction

structure of the OPI) which elicit oral discourse through the use of both auraland visual stimuli. These tasks include giving directions using a map,describing a picture, narrating a story based on a picture sequence, talkingabout topical subjects and lastly, responding to situations in which thecommunicative tasks and the audience are specified. In addition, all tasks onthe SOPI (with the exception of the ‘warm up’ phase) are normally read aloudin English on tape and written in English in a test booklet as well as in thetarget language. As in the OPI, the test becomes progressively moredemanding as the test continues: each task is intended to probe or verify ahigher level of proficiency until the final ‘wind down’ stage where candidatesare asked one or more simple questions. Unlike the OPI, the SOPI is assessedretrospectively by trained raters using the audio-taped recording of thecandidate’s test performance. Like the OPI, however, the SOPI is assessedholistically using the ACTFL/ILR scale, which is grounded in a view oflanguage proficiency as a unitary ability. In other words, the componentsassociated with the various points on the rating scale are considered togetherrather than individually (Stansfield 1991; Stansfield and Kenyon 1992a;Stansfield and Kenyon 1992b).
On the basis of research carried out at CAL in Washington, DC, Stansfield(1991) suggested that the SOPI had shown itself to be a valid and reliablesubstitute for the OPI. In relation to a comparison of scores on the two kindsof tests, Stansfield reported high Pearson correlations (r) in the range of0.89–0.95 on the OPI and SOPI in Chinese, Portuguese, Hebrew andIndonesian. On the basis of these findings Stansfield (1991: 206) argued that
... the SOPI correlates so highly with the OPI that it seems safe to saythat both measures test the same abilities.
However, it should be noted that the numbers of test takers underinvestigation in each case were again relatively small, ranging from 10 to 30,and the correlation figures should therefore be regarded with some caution.
A more fundamental problem with Stanfield’s conclusion is that, aspreviously suggested, high correlations between scores on the two kinds oftests provide necessary but insufficient evidence that they measure the sameability: it would also be desirable, for instance, to show that the OPI and SOPIscores in these studies were not consistently related to measures of otherlanguage or non-language abilities in order to provide a sounder basis for thisconclusion (Bachman 1990: 250). Where high correlations exist between thetwo tests, it may be possible to safely predict OPI scores from SOPI scoresbut this does not necessarily imply that the same ability is being measured.Another difficulty with concurrent validation as noted previously is that itassumes that one of the tests is a valid measure of the language ability in
18
1 Introduction

question and can therefore serve as the ‘criterion behavior’. However, asBachman (1990: 249) suggests:
without independent evidence supporting the interpretation of thecriterion as an indicator of the ability in question, there is no basis forinterpreting a correlation with that criterion as evidence of validity.
Given the widespread controversy about the validity of the OPI (see above)it would appear unwise to draw any conclusion about the validity of the SOPIsimply on the basis of high correlations between scores on the two tests.
At the statistical level, another limitation of most correlation co-efficients(including the Pearson correlation used in Stansfield’s (1991) study), is thatthey provide a measure of linearity rather than equivalence between two setsof scores. It is still possible, therefore, that candidates may have performedsystematically better on either the OPI or the SOPI despite the strength of therelationship between the scores. The high correlations, therefore, may allowthe score of a candidate on either test to be fairly confidently predicted fromthe other but do not necessarily indicate that the two tests were equallydifficult. The inclusion of descriptive statistics in Stansfield’s study,particularly the means, variances and standard deviations of the OPI and SOPIscores for each language, would have assisted in providing this information.
There is an additional problem with the interpretation of high correlationsbetween the scores on the two tests. Unless the correlation is perfect in thepositive sense (i.e. +1), there will be candidates for whom the level ofperformance differed from one test to the other. A correlation of 0.9 indicatesthat this is the case for approximately 20% of test takers. Thus, in Stansfield’sstudy, it appears that the results for a significant minority of candidates ineach of the four languages could not be predicted from one test to the other.It may be that the performance of these people was affected by the twodifferent test formats (i.e. live or tape-mediated), although there may havebeen other factors influencing them as well, such as a positive or negativepractice effect resulting from taking the two tests within a short space of time.
In a later study, Stansfield and Kenyon (1992b) used generalisabilitytheory (also known as G-theory) to further explore the issue of scorecomparability using the same data as in Stansfield’s (1991) study. Generallylow levels of subject by test interaction were found for candidates who hadundertaken the two kinds of tests in all four languages. However, the resultsof this analysis did suggest a tendency for some candidates to performdifferentially on the two test formats in three of the five studies undertaken, afinding which supports the criticism of the correlational results in the earlierstudy (see above). Unfortunately, Stansfield and Kenyon (1992b: 356) wereunable to confirm from their analysis using G-theory whether this indicated
19
1 Introduction

that ‘many examinees deviated a little in their performance on the two tests orwhether a few examinees deviated a lot, or some combination in-between’.
Stansfield also examines the comparative characteristics of the OPI andSOPI tests in the light of his empirical findings based on test scores. He arguesthat the SOPI may be more reliable than the OPI first because ‘the OPIrequires that each examinee be given a unique interview, whereas the formatand questions on a SOPI are invariant’ (Stansfield 1991: 202). As a result,raters reported that it was often easier to arrive at a decision on a score in thecase of the SOPI. Secondly, the greater length of speech sample produced inthe SOPI (typically 20–23 minutes versus 15 minutes on the OPI) may makefor more accurate judgements about a candidate’s proficiency level. Thirdly,the fact that the SOPI is recorded means that it can be assessed by the mostreliable rater while the OPI is sometimes rated by interviewers who may notalways be the most accurate judges.
In relation to the issue of validity, Stansfield (1991: 203) suggests that oneimportant problem with the OPI is that the candidate’s performance may besignificantly affected by the skill of the interviewer whereas the SOPI offersthe same quality of language input to each candidate. This has since beenidentified as an important source of measurement error in speaking tests.
In addition, Stansfield (1991: 204) argues that the reason the OPI and SOPIcorrelate so highly may be because ‘neither format produces a ‘‘natural’’ or‘‘real-life’’ conversation’. Even in the OPI, he contends, both interviewer andcandidate understand that ‘it is the examinee’s responsibility to perform. Littletrue interaction takes place’ (Stansfield 1991: 205). However, such aconclusion needs to be empirically investigated by examining data other thantest scores (such as the discourse produced under the two test conditions) todiscover whether, in fact, this is indeed the case.
Notwithstanding his concerns about the reliability and validity of the OPI,Stansfield (1991: 207) still views it as ‘potentially the more valid and reliablemeasure when carefully administered by a skilled interviewer and rated by anaccurate rater’. On the other hand, given that both of these conditions are notalways met in the case of the OPI, Stansfield considers that the OPI may bemore suitable for placement and program evaluation purposes and the SOPImore appropriate when important decisions are to be based on test scoresgiven the high degree of ‘quality control’ it offers. However, this line ofreasoning is suspect since it may not always be possible to gauge in advancethe importance of the results from any assessment procedure for the lifechances of test takers in the short or long term.
From a different perspective, Stansfield appears not to have consideredpossible sources of variability arising from the semi-direct test format. Forinstance, candidates may vary considerably in their experience with languagelaboratories, particularly in a test context. Some test takers may also require
20
1 Introduction

greater preparation and response times than are provided on such an inflexibleformat. These kinds of factors could have an impact on candidateperformance as much as the sources of variability in the OPI suggested byStansfield. Total ‘quality control’, therefore, may not be guaranteed usingeither a direct or semi-direct format: the candidate may be advantaged ordisadvantaged by features of the test method under either condition. The aimin both cases, as Bachman (1990: 161) suggests, is 1) to minimise the effectof such factors and 2) to maximise the effects of the language abilities whichthe test intends to measure, thereby enhancing the reliability and validity ofthe test scores.
On the basis of their research focusing on test scores, Stansfield andKenyon (1992b: 359) conclude that the OPI and SOPI are highly comparableas measures of oral language proficiency: they may be viewed, it is asserted,as ‘parallel tests delivered in two different formats’ with the important caveatthat
... the SOPI may be better suited to elicit and measure extended speechinvolving longer turns than short responses that are more typical ofinteraction between two people. In this sense, the SOPI format may besomewhat more friendly for the examinee at the Advanced level orabove on the ACTFL scale than for the Intermediate level examinee,because Advanced level speakers (by definition) are able to useparagraph length discourse. It may also be the case that the kind ofinteraction provided by the face-to-face interview is most appropriatefor the Novice and Intermediate examinee.
Furthermore, Stansfield (1991: 207) claims that the SOPI does not provide theextensive probing that may be necessary to discriminate between candidatesat the highest level of proficiency, i.e. Superior. These qualifications suggestthat the choice of test format needs to be carefully guided by the level(s) atwhich the test is attempting to reliably discriminate.
Beyond concurrent validation
More recently, the issue of equivalence between direct and semi-directspeaking tests has begun to be addressed from different angles as researchershave become increasingly aware of the limitations of relying primarily onconcurrent validation to establish test comparability. This has led, forinstance, to careful analyses of both the test instruments used in thesecomparisons and of the test taker language produced under the twoconditions.
Shohamy (1994) was one of the first researchers to question the over-reliance on concurrent validation in exploring test equivalence. Adopting a
21
1 Introduction

sceptical view of the studies by Stansfield (1991) and Stansfield and Kenyon(1992b), she argued convincingly that high correlations between scores on theHebrew OPI and SOPI (ranging from r = 0.89 – 0.95, N = 40) providednecessary but insufficient evidence for test substitution, since the two testsmay not have necessarily been measuring the same trait. This provided herwith the impetus for a detailed study of both the elicitation tasks used and thelanguage produced in the Hebrew OPI and SOPI.
In comparing the elicitation tasks as described in the test specifications forthe Hebrew OPI and SOPI, Shohamy found important differences in theexpected range of language functions and topics featuring in the two tests.While in the SOPI it was anticipated that candidates would use 14 differentfunctions ranging from describing and narrating to hypothesising andapologising, in the OPI the range was from approximately 5 functions for lowand middle proficiency candidates to about 12 for high level candidates. Thesame pattern was reflected for the range of topics. Fifteen topics of a personal,social and political nature were required for the SOPI compared to 14 topicsof a similar range on the OPI for middle and high proficiency candidates butonly 9 topics focusing exclusively on personal information for low levelcandidates. Potentially, therefore, in the case of lower level candidates, theOPI may be realised as a test which elicits very restricted language in termsof the number and variety of functions and topics.
In the a posteriori analysis of test taker language output in the Hebrew OPIand SOPI, Shohamy found no significant differences in the number of errorsmade in the domains of morphology, syntax and lexicon. However, there wasa significantly larger number of self-corrections used on the SOPI and shiftsto the candidate’s first language on the OPI. SOPI candidates also paraphrasedor restated the stimulus questions more often in their responses.
Furthermore, qualitative analysis of the language samples showed the twotests to be quite different in terms of their genres and rhetorical structures. TheOPI turned out to be a ‘conversational interview’ and the SOPI a ‘reportingmonologue’. The structure of the OPI was question – answer – question whilethe structure of the SOPI was performance – new task – performance. In theOPI the boundaries between topics were more fluid and the shifts from onetopic to the next much smoother than in the SOPI.
Contrary to the descriptions in the test specifications, the SOPI elicited amore limited range of speech functions than the OPI. The tasks on the SOPIwhich attempted to elicit varied functions, in fact, produced language thatconsisted mainly of simple, restricted functions such as description, narrationand reporting. On the other hand, the more limited types of elicitation taskson the OPI (mainly direct questions) in fact produced language whichincluded a wide range of functions including requesting clarification,disagreeing and criticising.
22
1 Introduction

These findings suggest that the two-way interaction in the OPI produces aricher, more varied language sample, although Shohamy provides insufficientinformation about whether this difference was equally marked amongstcandidates performing at varying proficiency levels on the two tests. It isconceivable, for instance, that the weaker candidates were able to use only alimited number of functions on both tests. More importantly, perhaps, thelimited range of functions on the SOPI may have been a result of the way inwhich the tasks were constructed.
In Shohamy’s study the SOPI answers also included more self-correction,repetition of phrases in the eliciting questions and paraphrasing than in theOPI. There was also a more restricted range of prosodic and paralinguisticfeatures in the SOPI responses: first, less variation in both intonation andvoice range and secondly, mainly hesitations and silence when no answer wasavailable. The discourse produced in the SOPI was also generally moreformal and had greater cohesion.
Furthermore, Shohamy found in the OPI that the relationship between theamount of lexicon (i.e. content items) and grammar (i.e. function items) wasapproximately 40% lexicon and 60% grammar, while these figures werereversed for the SOPI i.e. 60% lexicon and 40% grammar. This relationship isknown as a measure of lexical density (usually expressed simply as thepercentage of lexicon) and has been mainly used to date as an index of thedegree of ‘orality’ versus ‘literacy’ in both spoken and written discourse. It isargued that texts which are more literate – and these include both written textsand spoken texts such as speeches – are characterised by a higher degree oflexical density (i.e. contain a higher percentage of lexical items) than moreoral texts which again include both spoken texts and written texts such ashighly informal letters (Ure 1971; Halliday 1985). On the basis of the lexicaldensity figures reported in her study, therefore, Shohamy argues that the SOPIproduced language which was significantly more ‘literate’ than the OPI.However, it is argued in Chapter 5 of this book that lexical density in spokendiscourse may be more clearly understood as an index of the degree ofinteractivity in spoken discourse.
Shohamy’s (1994: 118) interpretation of the various differences whichemerge in this study between the OPI and the SOPI is that the test context orformat (i.e. face-to-face or tape-mediated), rather than the elicitation tasks, isthe most powerful determinant of the type of language produced:
The different oral discourses that are produced by the two tests are aresult of the different contexts in which the language is elicited.Context alone seems to be more powerful than the elicitation tasksthemselves.
23
1 Introduction
However, in another study, Shohamy et al. (1993) concede that, since thetasks on the two tests were not identical, some of the observed differences incandidate output may also have resulted from differences in the elicitationtasks themselves, although they do not specify which features. It isconceivable that there are a range of test method factors which have an impacton the type of language produced in tests of oral proficiency, including theformat, (i.e. direct or semi-direct) but also characteristics of the tasks (e.g.topic structure), the degree of interactivity as well as the amount ofpreparation and response time given to candidates.
The general implication in Shohamy’s (1994) study is that the OPI andSOPI do not appear to measure the same language construct and are thereforenot necessarily interchangeable as tests of oral proficiency, even where a highcorrelation exists between scores on the two tests. Shohamy concludes thatwhile different discourse samples are obtained in the two tests, it is difficultto determine which language sample, or test from which it is produced, is infact more valid as new developments in communication technology(e.g. answering machines, dictaphones, e-mail) challenge the primacy of face-to-face talk. She suggests that, while the OPI appears to have higher validitythan the SOPI because of the centrality of conversation in oral interaction, theassessment of oral language proficiency in the future may require the use ofboth direct and semi-direct tests. Where a choice between the two test formatsneeds to be made, she suggests, a variety of factors should be consideredincluding the context and purpose of the test.
In another recent study Hoejke and Linnell (1994) examined theequivalence issue from a more theoretical standpoint. They compared threespeaking tests used to assess the oral proficiency of NESB teaching assistants(ITAs) in US universities: firstly, the semi-direct SPEAK test (the institutionalversion of the TSE), secondly, the OPI and finally, another direct test, theInteractive Performance (IP) test, a direct specific purposes performance test.
The SPEAK test is a retired form of the TSE available to institutionswishing to administer and score the test on-site. The IP test requirescandidates to give a 10-minute videotaped presentation on a topic in theirprospective teaching fields and answer questions from a panel of evaluatorscomprising three ESL specialists and, in some cases, an undergraduatestudent. The format of the IP necessitates the use of certain language functionsrequired in the instructional contexts in which ITAs work. The test alsoattempts to simulate the classroom situation by giving the audience somecontrol of the topic. The assessment focuses on language performance withina communicative competence framework.
Hoejke and Linnell compared the three tests from several relatedperspectives: first, Bachman’s (1990, 1991) conceptualisation of‘authenticity’ in language testing; secondly, his framework of test methodsfacets; and thirdly, the discourse elicited in the three tests. They focused
24
1 Introduction

particularly on Bachman’s ‘interactional/ability’ approach to the notionof authenticity. This approach identifies the fundamental characteristics oflanguage use in target and test settings through focusing on the interactionof language user, task and context. It examines the extent to which a testengages the candidate’s language ability in comparison to the tasks of thetarget-use setting without attempting to mirror ‘real life’, a goal which hasbeen criticised as naïve since no test setting exactly resembles its real-lifecounterpart (Spolsky 1985; Stevenson 1985; Bachman 1990, 1991). In thecontext of assessing ITA language performance, Hoejke and Linnell concludethat the IP test is the most satisfactory from this perspective, not so muchbecause it resembles the ‘real-life’ task of teaching, but because its tasksengage the speaker’s competence in ways similar to the tasks of the target-usecontext more comprehensively than the other two tests. The SPEAK test, onthe other hand, is found to be the least satisfactory, not simply because of itssemi-direct format per se, but, more precisely, because it does not adequatelytap the candidate’s discourse, interactional and sociolinguistic competences,all crucial to the role of language assistant. The OPI more closely resembles‘authentic’ language use in this context. However, the interaction on the OPIstill differs considerably from that of the classroom setting as it occurs onlybetween two speakers and it is the interviewer who guides the discussion.
The study by Hoejke and Linnell underscores the importance of contentvalidity or the need to demonstrate the extent to which test performancereflects the specific language abilities in question. It also highlights the factthat ‘authenticity’ is not necessarily guaranteed in oral proficiency testing,irrespective of whether a direct or semi-direct format is adopted. In essence,the study demonstrates the extent to which ‘... the test must be ‘‘authentic’’ aswell as statistically viable’ (Hoejke and Linnell 1994: 122).
Face validity
Another perspective from which the equivalence of direct and semi-directspeaking tests has traditionally been examined is face validity, in particular,test taker feedback. However, to date, this type of validity has been viewed ashaving only a subsidiary role to play in establishing test comparability.
Face validity or ‘test appeal’ is still largely regarded by many theorists inlanguage testing as having a useful, albeit limited role in making testsacceptable and ‘user friendly’ to test takers and test users but not as havingimplications for construct validation (see, for example, the range of viewspresented in Bachman 1990: 285–9). In particular, research into test takerfeedback is often seen as marginal to the main task of test validation. Wheretest developers, test takers and test users disagree about which form of a testis preferable it is most often the preference of the test ‘experts’ which holdssway. However, there has been some disagreement on this question. Shohamy(1982: 17), for instance, argues that
25
1 Introduction

... knowing that attitude and anxiety are significant factors in testperformance should lead to careful deliberation before applying anevaluation procedure that may have a negative emotional impact nomatter how statistically reliable and valid it is.
More recently, Alderson et al. (1995: 173) suggest
... face validity is important in language testing. For one thing, teststhat do not appear to be valid to users may not be taken seriously fortheir given purpose. For another, if test takers consider a test to bevalid ... they are more likely to perform to the best of their ability onthat test and to respond appropriately to items.
Questionnaire feedback from test takers on the OPI and SOPI has beengathered in a number of studies. Shohamy (1982: 15–16), for instance, reportshighly favourable test taker reactions to the OPI considered separately andprovides the following explanation for this state of affairs:
Students seem to feel that the oral interview reflected their actualknowledge of the language since they could see the direct relationshipbetween the testing procedure and their performance ... Theyperceived the oral interview as a low anxiety test and some eventhought that it was a fun test which made them feel comfortable andcreated a relaxing atmosphere. Many perceived it as a pleasantexperience.
The SOPI has consistently proved to be less popular than the OPI since itsintroduction. Clark (1988) compared the reactions of 27 candidates after theyhad undertaken both the OPI and the first SOPI (although not labelled as such)in Chinese. Notwithstanding the strong equivalence between test scores, 63%of candidates reported feeling more nervous on the tape test, 19% on theinterview and 18% equally nervous on both tests. 78% found the tape testmore difficult, 7% the live and 15% found them equally difficult. On the otherhand, a similar percentage of respondents (74% on the live and 70% on thetape) felt that their speaking ability in Chinese had been adequately probed onthe two tests. 96% of candidates thought the live questions were fair while70% felt the tape questions were fair. Individual comments indicated that themain problem on the tape format was the difficulty of some tasks for a numberof weaker test takers. Finally, 89% of candidates expressed a preference forthe live test compared to 4% for the tape test and 7% no preference. Clark’s(1988: 197) conclusion is that:
26
1 Introduction

From an administrative viewpoint, implications of the questionnairedata would seem to be that face-to-face interviewing is preferablewhenever the necessary resources can be made available, but thatwhen an alternative approach is required, the examinees involved willgenerally consider themselves adequately tested through semi-directmeans, albeit as a ‘second-choice’ procedure.
In developing the next form of the SOPI in Portuguese, Stansfield et al.(1990) similarly found test takers strongly favoured the live interview despitean average correlation of r = 0.93 between scores on the two tests. Of the 30test takers who completed a questionnaire after undertaking the OPI and SOPIin Portuguese, 69% felt more nervous on the tape test, 24% more nervous onthe live test and 7% equally nervous on the two formats. 90% of them foundthe tape test more difficult and 10% found the two tests equally difficult.Individual comments suggested that the tape format was felt to be an‘unnatural’ context in which to be tested. Overall, 86% of test takersexpressed a preference for the live interview, 7% for the tape condition and7% no preference. However, respondents were generally positive about thefairness of both tests: all of the candidates felt the questions on the live testwere fair and 83% felt similarly about the tape test. In addition, 73% of testtakers believed that their maximum level of Portuguese had been probedunder both conditions.
In a subsequent study, examining feedback from OPI and SOPI test takersin a range of languages, Stansfield (1991) reports that while most preferredthe live format because of the human contact it provided as in the earlierstudies, about a quarter either preferred the tape format or had felt there wasno difference. Where the semi-direct version was preferred it was because testtakers were not so nervous talking to a tape-recorder as to an unfamiliar andhighly competent speaker of the target language. In general, however,Stansfield (1991: 204) concedes that:
Since speaking into a tape recorder is admittedly a less naturalsituation than talking to someone directly it is possible that the SOPIformat will cause undue stress.
A number of studies have examined test taker reactions to direct and semi-direct tests apart from the OPI and SOPI. In a report to the Australian Councilof Overseas Qualifications (COPQ), McNamara (1987) investigated thereactions of 56 former and intending candidates to the then-existing tape-mediated format of the speaking component of the Occupational English test(OET), a test for overseas trained health professionals in Australia. Theoriginal speaking test consisted of a three-minute impromptu talk on a non-professional subject, delivered into a tape-recorder. McNamara found that
27
1 Introduction

52% advocated changing the test (of which more than half expressed a strongpreference for a face-to-face format), 30% found the tape-based formatacceptable and 18% offered no opinion. Specific comments included thefollowing:
No more talking into a tape recorder, please!
Candidates are not used to talking to a recording machine and voicesfrom a tape can be very hard to listen to. Anyway doctors are dealingwith patients and people mainly.
I would like to change the part played by the tape ... It is quite easy totalk to a person rather than speaking to a tape, something which isinanimate.
I didn’t like speaking to a tape. I would have preferred to speak tosomeone.
The tape-mediated procedure was subsequently changed to a directprocedure in which candidates were required to participate in face-to-face roleplays (based on situations relevant to their professional practice) with atrained interlocutor who normally also carried out the assessment. The newform of the OET speaking sub-test is more fully described in McNamara(1988, 1990a and 1990b).
However, test taker preference for a direct format should not be assumed.After piloting the semi-direct speaking component of the Test in English forEducational Purposes (TEEP) test for prospective students entering tertiarycourses, James (1988:116) reported that
in many cases, students stated in the post-test questionnaires that theypreferred a test in a language laboratory because they felt more securethan in a face to face situation.
Most negative responses focused on procedural matters (such asinsufficient response time) rather than on the test format itself. This apparentpreference on the part of most test takers for a semi-direct format (although itis unclear what percentage of test takers ‘many cases’ represents in the abovequotation) could be at least partly explained by the fact that they were allthoroughly briefed and trained in this format before the trial.
28
1 Introduction
It should be noted that the results of James’ (1988) study are atypical. In amore recent study comparing test taker performance and attitudes across arange of direct and semi-direct elicitation modes including face-to-faceinteraction, the telephone, videotape and audiotape, Shohamy et al. (1993)once again found a strong preference for the direct format: 96% of candidates(N = 10) favoured either the live face-to-face or telephone modes while only4% opted for the two modes using recorded input, the video and audiotapes.
It appears therefore, if asked to choose between the two formats, test takersgenerally prefer the direct format for speaking tests. On the other hand, thisfinding does not necessarily imply that their reactions to the tape-basedformat per se will always be negative. In a study of test taker feedback in thedevelopment of the Occupational Foreign Language Test (Japanese), a tape-mediated test of spoken Japanese for the tourism and hospitality industry inAustralia, Brown (1993) found that 57% of trial candidates (N = 53) liked thetape-based format, 25% disliked it and 18% were neutral. This result wassomewhat surprising given that many of these candidates indicated they hadhad little or no exposure to recording their voice in a language laboratory,especially in a test situation. However, the results might not have been sofavourable had the respondents been given the opportunity to compare theirreactions to this tape-mediated test with another live test. Negative reactionsto the test appeared to be largely the result of inadequate response time despitethe fact that the assessor used in the trial felt the responses were generallysufficient to rate the candidates’ levels accurately. The response time wassubsequently increased in order to reduce test taker frustration and anxiety.
In more general terms, Hamp-Lyons and Lynch (1995) have urgedlanguage testing researchers to pay greater attention to the voices of testtakers, test personnel (including interviewers and raters), test users and otherinterested groups in the validation process (i.e. face validity), rather thansimply listening to themselves. From these perspectives, test taker feedbackbecomes a legitimate, indeed valuable source of evidence for test validity.The debate on the importance of ‘test appeal’ exemplifies the currentcontroversy surrounding the conceptualisation of validity which is taken up inChapter 3.
Towards the adoption of multiple perspectives
More recently, research undertaken by Luoma (1997) into the speakingcomponent of the Intermediate level English test (which forms part of theNational Certificate of Language Proficiency in Finland) uses an even broaderrange of methods than had hitherto been the case to address the issue ofequivalence of direct and semi-direct tests. In this context, the semi-direct testconsisted of a warm up reading aloud task then three other set tasks:Simulated conversation where test takers were required to to express fairly
29
1 Introduction
simple functions e.g. greeting, making appointments, apologising for beinglate to a business appointment, reacting in situations where they were requiredto read a description of a situation and then say what might be said in such asituation at greater length than in the previous task and finally, presentingviews and opinions where they gave two mini-presentations of about twominutes each. While the tape was monolingually English the test booklet waswritten in both English and Finnish to ensure test takers understood theinstructions. The live test, on the other hand, was conducted entirely inEnglish. It consisted of a short warm up phase and two test tasks: first, a peerdiscussion among two or three candidates and secondly, a more interview-likediscussion between the interlocutor and each individual candidate. In bothtasks the topics were unkown to the test takers prior to the test.
In Luoma’s study a total of 37 candidates undertook both the live and tape-mediated versions of the test. A wide variety of quantitative and qualitativedata including test scores, audio and video recordings, transcripts of languageoutput, questionnaire feedback and interviews with both test takers and raterswere gathered and examined to investigate the comparability of the twoversions.
While the test scores in Luoma’s study correlated strongly (r = 0.89), testtakers once again overwhelmingly preferred the live test. The tape test wasfound to provide the same level of quality control for all candidates, sampleda wider range of situations and, contrary to Shohamy’s (1994) study, eliciteda broader variety of functions than the live version. On the other hand, the livetest was clearly more interactive but only two topics were covered and thequality of interlocutor input was found to be highly variable. Differences werediscovered in both test taker language output from the two tests and what theraters were paying attention to in their assessments in each instance.
In general, Luoma’s findings underscored the centrality of interaction inthe live test and its absence in the tape-mediated test. While the underlyingconstructs of the two versions were shown to be different in some senses, thestrength of the relationship between test scores indicated that scores from oneversion could be safely used to predict scores from the other. Luoma (1997:136) posits two alternative explanations for the high correlation between testscores. First, it may be that ‘where different aspects of language ability weretested, these aspects develop simultaneously in individual language learners’.Secondly, it is possible that raters were not ‘assessing the performances [onthe two versions] as such, but what the performances indicated to them of thecandidates’ ability to use language outside the test context’. In this way, theraters ‘buffer the possible variability in performances through compensatingfor the effects of test tasks [across the two versions]’. Because of theconflicting evidence, Luoma (1997: 132) concludes that there is no simpleanswer to the comparability question but rather ‘it depends on how importantthe differences are to the one asking the question.’
30
1 Introduction

Luoma’s study demonstrates the potential of combining investigations intotest outcomes and processes to obtain a richer, more complex picture of testcomparability. Yet, like most of the previous studies reported in this chapter,her findings are based on a comparison of two tests which differ not only interms of format but also in relation to the type of tasks used in each case. Thismakes it difficult to draw clear conclusions about their equivalence.
ConclusionThe literature on the comparability of direct and semi-direct speaking tests isfairly substantial. The main emphasis in the empirical research reported in thisliterature has been on concurrent validation focusing on the degree ofequivalence between test scores. There has also been a limited amountof quantitatively oriented research into test taker feedback on the two kinds oftests. More recent studies, however, have begun to explore alternative formsof comparison such as detailed examinations of the different test instrumentsand test taker language output. While these new directions have alreadyprovided important insights into the comparability issue, there is a need tocomplement them with other perspectives as well. In particular, with theexception of Luoma (1997), very limited attention has been given to theexamination of test design, test taking and rating processes and how anunderstanding of these components of assessment procedures may provide thebasis for a more complex comparison between the two kinds of tests,especially when combined with the analysis of test products (such as testscores and test taker language output). This is the methodogical approachadopted in this study.
Research in language testing has only recently begun to take up such a dualperspective. In oral proficiency testing there have been a number of recentstudies investigating the interaction between candidate and interlocutoron direct speaking tests the impact on test scores (e.g. Neeson 1985;Lazaraton 1991; Ross and Berwick 1993; Lazaraton and Saville 1994; Mortonand Wigglesworth 1994; Filipi 1995; Morton, Wigglesworth and Williams1997). Another notable example of research combining a focus on process andproduct in testing speaking is a study of how raters interpret rating scales(Pollitt and Murray 1993). To date, however, such an approach has seldombeen adopted in comparability studies. Attending to both process and producthas the potential to provide greater insight into construct validity or what testscores actually mean, and thus a stronger basis from which to compare them.In the present study, the necessity for this more complex perspective willbecome clearer as the evidence on the validity of the access: live and tape-based versions of the oral interaction sub-test unfolds.
31
1 Introduction

The other important issue which emerges from this chapter is that in moststudies to date the two tests being compared differ not only in terms of format(i.e. whether they are direct or semi-direct) but also in relation to suchimportant features as their overall rhetorical structure, the nature of the tasks,the type of stimuli and the scoring criteria. This makes investigations intotheir equivalence problematic in some senses. In Shohamy’s (1994) ground-breaking study, for instance, it is clear that no real attempt was made by testdevelopers to match the SOPI with the OPI (apart from incorporatingquestions of gradually increasing difficulty and adopting the same rating scaleto score the two tests). This is also true of most of the other studies reviewedin this chapter. Conversely, the research which will be described in this bookallowed for a more controlled investigation into the equivalence of direct andsemi-direct tests since the two versions of the access: oral interaction sub-testwere carefully matched from the outset of the development process. As aresult, the findings in this study are likely to be clearer and thereforepotentially more authoritative – hence its value and importance.
This chapter has briefly outlined the focus of the study and reviewed theliterature on the comparability of direct and semi-direct tests of oralproficiency. Chapter 2 will describe the development of the access: test ingeneral and the oral interaction sub-test in particular.
32
1 Introduction

The access: test
This chapter introduces the access: test in general and the oral interaction sub-test in particular. The comparability of the two versions of the oral interactionsub-test is also briefly examined from the perspective of the relevant testspecifications.
Background to the testThe late 1980s witnessed an unprecedented expansion of the skilled migrationprogram in Australia. However, many skilled immigrants continued to arrivein Australia with minimal competence in English. While, in theory, all skillednon-English speaking background (NESB) migration applicants wererequired to have their English language proficiency tested as part ofthe selection process, in practice, this requirement was waived for somecategories of applicants. Nor was it consistently applied to applicants in theother skilled categories, the majority of whom were permitted to self-assessgiven the lack of an adequate testing system in place at overseas posts(Hawthorne 1997).
By 1992, with Australia in recession and unemployment mounting, therewas increasing evidence to suggest that skilled migrants with limited Englishlanguage proficiency faced a disproportionate labour market disadvantage(Hawthorne 1997). The Federal Government was also seeking ways ofreducing the costs of English language training in the adult migrant sector. Itwas against this background that the then Commonwealth Department ofImmigration and Ethnic Affairs (DIEA) developed a new English languagetesting policy as part of an overhaul of its skilled migration program. Itsubsequently invested AUD$ 1.9 million in the development of a new testingsystem by a consortium directed by the National Centre for English LanguageTeaching and Research (NCELTR), Macquarie University, who would reportto a DIEA management committee. The NLLIA Language Testing ResearchCentre (LTRC) at the University of Melbourne was given principalresponsibility for the development of the oral interaction sub-test, AdultMigrant Education Services (AMES) in NSW for the reading and writing sub-tests and NCELTR for the listening sub-test. AMES, Victoria and the NLLIALanguage Testing and Curriculum Centre (LTCC), Griffith University would
33
2

also participate in an advisory capacity. Work on the development of the foursub-tests began in September 1992.
While NCELTR co-ordinated the creation of the new testing system, DIEAcontinued to develop and refine its new testing policy. In a leaflet entitledMigrating to Australia: English Language Assessment issued in January1993, DIEA set out its new regulations for verification of claims made bymigration applicants about their English language proficiency. Four levels ofproficiency (see Table 2.1 below) were distinguished for the purpose at thistime.
Table 2.1
General English language proficiency levels, DIEA, January 1993
VOCATIONALThis means that you have a good command of English in a wide range ofsocial and work situations and can communicate with a fairly high degree offluency.
FUNCTIONALThis means that you can use English well enough to deal with most commonsocial situations and some work situations, but you do not have thorough orconfident control of the language.
BASIC (SURVIVAL)This means that you know enough English to deal with familiar, everydaysituations.
LIMITED (BASIC)This means that you have some knowledge of English, but only enough tounderstand and make yourself understood in a very limited way.
Development of the testOriginally, DIEA and NCELTR agreed that there would be one test to assessVocational English language proficiency and another to assess Functionalproficiency. Thus, a Vocational level test was initially developed with plans tobegin work on its Functional level counterpart immediately after this processhad been completed. However, in early 1993 (after the first form of theVocational test had been developed), DIEA requested NCELTR to design asingle test which would reliably identify candidates at both the Vocational andFunctional levels in all four macro-skills (listening, reading, speaking andwriting).
34
2 The access: test

The access: test was first trialled in Australia during December 1992 andadministered in six overseas test centres in March 1993 with test papers andrecordings being returned to Australia to be marked by trained raters.Candidates were guaranteed a six week turnaround in results. By October1994 the test was available in 27 locations around the world and wider globalcoverage was anticipated in future years. It was envisaged that the scoring ofperformance would eventually be carried out in overseas centres wherepossible to increase administrative efficiency. Although the test was offeredon a user-pays basis, fees were scaled in line with specific location expenses.These fees were designed to cover local administration and some testdevelopment costs.
In May 1994 the access: contract was put out to tender and, at the end ofthe year, awarded to a new partnership between Griffith University and theInternational Development Program (IDP). This partnership continued tomanage the development and administration of the access: test until May1998 when the Federal government unexpectedly abandoned it in favour ofthe IELTS, primarily, it would appear, on the grounds of cost-efficiency.
The oral interaction sub-test
Choice of formats
Initially, it was envisaged that the oral interaction sub-test would bedeveloped in a direct format only. However, it soon became apparent thatoverseas test centres would need to be able to opt for a semi-direct format aswell since adequate numbers of suitably qualified native speakers of Englishto act as interlocutors on the live version could not be guaranteed in alllocations.
While trial candidates would undertake both versions of the test in order toestablish their equivalence, overseas test centres were to be given the choiceof format depending on the number of candidates presenting for the test aswell as the availability of appropriately qualified interviewers and languagelaboratories. Thus, from the outset it was the local administrators of the testrather than the candidates who made this selection.
Given these constraints on overseas test centres, the crucial comparabilityissue explored in this study is not which version of the oral interaction sub-test was preferable, but rather whether the two versions were equivalent in thecontext of the test trials.
Development of the two formats
Draft test specifications for the direct and semi-direct formats of the oralinteraction sub-test, targeted at the Vocational level only, were drawn up by atest development team from the LTRC, University of Melbourne in
35
2 The access: test

September 1992. They were then vetted and given provisional approval by theTest Development Committee (TDC) at NCELTR during the followingmonth. The discussion which follows draws heavily on these draftspecifications.
The draft specifications stated that the live version of the oral interactionsub-test was designed for use with individual candidates and a trainedinterlocutor in a face-to-face context while the tape version was designed tobe administered to a group of candidates in a language laboratory. The liveversion would not exceed 20 minutes in duration and the tape version 30minutes when administered overseas, although it was anticipated that the trialversions would be up to 15 minutes longer in both cases for the purpose oftrialling a greater number of tasks. Both versions were designed to beconducted entirely in English.
The two versions of the oral interaction sub-test consisted of a range oftasks which were derived from the current literature on oral language testingand designed to ‘reflect the variety of situations in which adult Australiansmight find themselves in the everyday course of their work, social andeducational pursuits’ (Brindley and Wigglesworth 1997: 45). In particular, thetest development process was informed by the findings of Shohamy (1994)which were reported previously in conference papers in 1991 and 1992. Asoutlined in Chapter 1, Shohamy’s results suggested that two widely usedspeaking tests, the Oral Proficiency Interview (OPI) and the Simulated OralProficiency Interview (SOPI), were not interchangeable, since the elicitationtasks and language samples obtained from candidates who had undertaken thetwo tests differed in important ways. Mindful of these results, the testdevelopers attempted to construct the two versions of the oral interaction sub-test in such a way that both the elicitation tasks and candidate responseswould match each other as closely as possible:
Tasks in the direct and semi-direct formats of the test are developed intandem in an attempt to ensure the comparability of the two formats.Before administration of a test, a trialling procedure is carried out inwhich candidates undertake direct and semi-direct formats of the test.Subsequent statistical analyses of the trial results allow for concurrentvalidation of the two types of tests.
Test specifications, September 1992
It is worth noting the assumption here that concurrent validation wouldprovide sufficient evidence that the two versions were equivalent. However,as suggested in the previous chapter, statistical comparisons of test scoresprovide necessary but insufficient evidence that two tests measure the samelanguage abilities and that other kinds of evidence, including test documents,
36
2 The access: test

test taker language output and test processes, need to be examined in order toestablish their comparability.
The draft specifications also stated that both versions would consist mainlyof tasks involving ‘one-way’ (monologic) exchange where the candidate isrequired to communicate information in response to prompts from the‘interlocutor’ in order to secure their equivalence. However, in order toexploit the possibilities of face-to-face interaction, a role play allowing for ‘amore ‘‘authentic’’ information gap activity in which meaning is negotiatedbetween candidate and interviewer’ was also included on the live version.
A key element in designing the ‘monologic’ tasks was that they would notrequire interlocutor input once the candidate had begun to speak in responseto the prompt. The prompts themselves would be carefully scripted to providecontrol over the input of interlocutors with varying levels of experience andexpertise in this role, particularly in the overseas centres. Limiting thepotential variability in their input on most of the tasks in the interest ofreliability was therefore considered highly desirable by the test developers inthe process of designing the live version.
The decision to reduce interactivity on the live version was madereluctantly given its centrality in most ‘real world’ communication and indeedmost direct speaking tests. However, at the time the specifications weredeveloped this appeared to the test developers to be the most reasonable wayfirst, to ensure comparable language output on the two versions followingShohamy’s (1994) findings and secondly, to provide greater quality control inthe live version at overseas test centres. The two-way live role playrepresented a concession to the reduced interaction of the other live tasks bythe test developers. Its inclusion therefore reflects a degree of ambivalence ontheir part about the role of interaction in the live version.
Most of the tasks would also be designed to share important characteristicsacross the two versions, including task structure and expected range oflanguage functions as shown in Tables 2.2 and 2.3 below. In terms of theirstructure tasks were characterised according to a model developed by Gardner(1992) and derived from research in second language acquisition. First, taskswere classified as either planned (allowing preparation time) or unplanned(designed to elicit spontaneous language). Secondly, they were distinguishedas either open (allowing a range of possible solutions) or closed (allowing arestricted set of possible responses).
37
2 The access: test

Table 2.2
Test tasks: live version, oral interaction sub-test, September 1992
Discourse Stimulus Language Taskform functions type
1 WARM UP
2 a) Description three describing unplanned,set open,questions monologic
b) Narration sequence narrating, planned,of cartoons explaining closed,
monologic
3 Role play role play explaining, planned,cards apologising, closed,
making dialogic,excuses convergent
4 Exposition percentage describing, planned,table comparing, closed,
analysing, monologicexplaining,speculating
5 Discussion four describing, unplanned,set narrating, open,questions explaining, monologic
givingopinions,speculating
Gardner’s model also makes a distinction between two-way exchange taskswhich are convergent (involving problem solving in which the aim is to arriveat a particular goal) and those which are divergent (without specific goal,involving decision making, opinion and argument). The only two-way task,the live role play, was designed to be convergent.
The tasks would require test takers to use a wide range of languagefunctions including describing, comparing, interpreting, narrating, explaining,summarising, apologising, analysing, speculating, discussing and givingopinions on both versions. The range of topics to be covered on the twoversions was the same involving contexts encountered by adults in Australiain the course of their everyday life, work or study.
38
2 The access: test

Table 2.3
Test tasks: tape version, oral interaction sub-test, September 1992
Discourse Stimulus Language Taskform functions type
1 WARM UP
2 a) Description three describing unplanned,set open,questions monologic
b) Narration sequence narrating, planned,of cartoons explaining closed,
monologic
c) Summary recorded summarising planned,dialogue closed,
monologic
3 Role play telephone apologising, plannedmessage explaining, closed,
making monologicexcuses
4 Exposition percentage describing, planned,table comparing, closed,
analysing, monologicexplaining,speculating
5 Discussion four describing, unplanned,set narrating, open,questions explaining, monologic
givingopinions,speculating
Both formats would include an unassessed ‘warm up’ period wherecandidates were asked three or four general questions about themselves toreduce their anxiety and help them feel comfortable with either theinterlocutor on the live version or the recorded voice on the tape version. Inthe description task on each of the two formats candidates would be askedthree questions about a setting with which they were familiar, such as a schoolor work environment. The narration task on both formats would require them
39
2 The access: test
to re-tell a story based on a sequence of eight pictures. In the summary task(tape version only) candidates would listen to a dialogue and then summariseits contents for another person. The role play task on the live version wouldconsist of a two-way exchange where the candidate and interviewer weregiven written prompts to guide them in performing their respective roles. Therole play on the tape version, by contrast, would require candidates to leave atelephone answering machine message in response to a written prompt. In theexposition task on both formats candidates would be asked to describe,explain, analyse and interpret information in the form of tables, graphs ordiagrams. Finally, the discussion task on the two formats would requirecandidates to answer three or four set questions on subjects of general orvocational interest. For the purpose of trialling, more than one example of aparticular task type would be included in some cases. A choice would then bemade between the alternatives following analysis of the test scores from thetrial. Finally, in both versions the amount of preparation time for each taskwould be set in advance; however, only on the tape version was the amountof response time fixed beforehand.
The scoring criteria chosen by the test development team to rate the testtasks on the two formats were also matched, generally focusing on fluencyand accuracy. These criteria included Fluency, Resources of grammar,Vocabulary, Coherence and cohesion, Appropriacy, Intelligibility and Overallcommunicative effectiveness. Different combinations of these criteria wereused to rate particular tasks as deemed appropriate by the test developmentteam after listening to sample audio recordings of performances on both thelive and tape-based versions of the oral interaction sub-test from the first trialheld in December 1992.
At this point a technical distinction needs to be made between a ‘task’, a‘criterion’ and an ‘item’. The term ‘task’ refers to the whole activity thecandidate is required to undertake (e.g. role play) and the term ‘criterion’denotes a rating category (e.g. Fluency, Vocabulary). An ‘item’, on the otherhand, refers to either an individual scoring criterion on a particular task (e.g.description: Resources of grammar) or a global criterion (e.g. Communicativeeffectiveness). In the first trial form of the test there were 23 items on the liveversion and 24 on the tape version, all equally weighted in the subsequentstatistical analyses of test scores. The one salient difference was that anadditional global criterion, Comprehension, was included on the live version(but not the tape) in order to assess the candidate’s interactive listening ability.The complete list of scoring criteria used to rate individual tasks on the twoversions is included in Chapter 4 (Table 4.1).
Each of the scoring criteria was assessed on a six-point Likert scale withdescriptors (these were identical for the two versions of the test). The full listof descriptors for the scoring criteria initially used to rate candidates on bothversions of the test is included in Appendix 4.1. These descriptors were
40
2 The access: test

derived empirically using the sample audio recordings of candidateperformance referred to above. This process involved members of the testdevelopment team formulating and eventually agreeing on definitions ofproficiency at six levels for each criterion. For example, levels 6 and 4 underthe category Fluency were characterised as follows:
6 Speech is as fluent as, and of a speed similar to, an educatednative speaker.
4 Speaks more slowly than native speakers, with some hesitationsand groping for words though without impeding communication.
The same levels under the category Resources of grammar were described as:
6 Range and control of a native speaker.4 Generally demonstrates control of a variety of structures. Errors
are noticeable but not systematic and do not interfere withcommunication.
The one category which did not have descriptors was the overall criterionCommunicative effectiveness.
The first set of tasks for the oral interaction sub-test was developed by theLTRC in early November 1992. They were subsequently revised in the lightof feedback from the Test Development Committee (TDC) at NCELTR.Following construction of the tasks, booklets were developed for candidatesto be used in both the live and tape-based versions. Both booklets included thestimuli for the test tasks. In addition, in the tape version, the instructions forthe tasks were written, as well as spoken on the tape, since the candidatewould not have the advantage of clarifying misunderstandings with theinterlocutor. A tapescript and sound recording were also produced for the tapeversion and an interlocutor’s booklet for the live version.
For both the test trials and overseas administrations the interlocutors wererequired to be native speakers, with formal training in the teaching of Englishto speakers of other languages (TESOL), and with at least two yearsexperience teaching at a range of proficiency levels. The test booklet forinterlocutors provided them with detailed instructions concerning languageinput to be used with candidates as well as the requirements for each task. Inaddition, with the exception of the role play, interlocutors were instructed notto intervene once the candidate was clear about the task requirements. Aspreviously suggested, it was anticipated that the highly scripted nature of theinterlocutor’s input would provide greater ‘quality control’ on the liveversion.
The first direct and semi-direct versions of the oral interaction sub-test
41
2 The access: test

(Form A) were trialled in Melbourne in December 1992 on a total of 94candidates recruited from several local tertiary institutions and languagecentres. This initial trial is the focus of Chapters 4 and 5 of this book. The 12interlocutors and 13 raters employed in the trial were all qualified andexperienced teachers of adult ESL.
A half-day training session for interlocutors was conducted prior to the trialwhere a volunteer ESL student undertook the live version with one of theinterlocutors. This led to discussion about appropriate interlocutor behaviourin both the more ‘monologic’ tasks and the more ‘dialogic’ role play as wellas further practice where pairs of teachers acted out the roles of interlocutorand candidate on selected tasks. While this was the model used for trainingsessions prior to the test trials conducted in Australia, video and printmaterials were also developed for preparing interlocutors at the overseas testcentres where the access: test was administered.
Following the first trial administration a full-day training session for raterswas conducted in January 1993. Like the interlocutors they were required tobe native speakers, with formal training in TESOL, and with at least two yearsexperience teaching at a range of proficiency levels. In the training sessionraters first listened to a sample of tasks selected from a range of audiorecordings from the live and tape versions and practised using the ratingscales for the criteria relevant to each task. Their scores were then collated andindividual raters asked to justify their assessments, particularly when theywere very different from the rest of the group. Thus, the aims of this initialtraining session were first, to acquaint raters with the test tasks and ratingscales and secondly, to encourage them to compare and critically reflect ontheir scoring. After their ratings from the trial had been examined using multi-faceted Rasch analysis (Linacre 1989–95), raters were also given individualfeedback on the internal consistency or intra-rater reliability of their scoring.Wigglesworth (1993) provides a detailed account of this aspect of the trainingprocess. Follow-up training for experienced raters consisted of shortergroup calibration sessions immediately prior to carrying out scoring of audiorecordings from other trial and overseas administrations together withcontinued individual feedback. Further whole-day training sessions were onlyheld for the purposes of inducting new raters and for re-training others whohad not rated for some time.
The oral interaction sub-test was first administered overseas together withthe other sub-tests in listening, reading and writing in March 1993. All foursub-tests were targeted at the Vocational level only. One centre, Hong Kong,administered the semi-direct version of the oral interaction sub-test to 51intending immigrants. Five centres, Moscow, Warsaw, Beirut, New Delhi andAmman, administered the direct version to a total of 80 candidates.
In April 1993 work began on a revised oral interaction sub-test which
42
2 The access: test

would reliably identify candidates at both the Vocational and Functionallevels in accordance with DIEA’s wishes at this time. By May 1994 a numberof revisions to the original test specifications for the oral interaction sub-test,including the tasks and the scoring criteria, had been completed. Chapters 6and 7 of this book focus on a trial, based on the revised test specifications (seeAppendix 1.1), which was held in Melbourne in June 1994.
The only important modification to the test tasks was in section 2a, thedescription task. On both formats the structure of this task had previouslybeen unplanned and open. Its structure was now planned and closed. Thenew task consisted of two or three questions in which candidates would beshown some visual material, such as cartoon pictures or photos, and requiredto describe, compare and discuss them. The test development team consideredthat providing stimulus material for this question would offset the risk ofcandidates remembering little or nothing about a specified past environmentwith which they were supposedly familiar and also made their responses morecomparable for the purpose of rating. One further alteration was made insection 4, the exposition task. An additional possibility now was thatcandidates could be asked to give a set of instructions about a procedureoutlined in diagrammatic or point form. The summary task on the tape versionwas still included despite the lack of counterpart on the live version.
The scoring criteria were now assessed on a seven-point scale withappropriately modified descriptors. This modification was made by the testdevelopers to encourage raters to use more points on the scale: previousanalyses of test scores had revealed that raters were reluctant to use thehighest point on the scale for all of the scoring criteria. In addition, referencesto native speaker levels of performance in the descriptors for each of thescoring criteria were removed. As suggested by a number of authors,including Alderson (1980), Bachman and Savignon (1986), Bachman (1988,1990), Davies (1991) and Hamilton et al. (1993), native speakers, like nonnative speakers, vary in their ability to handle the performance demands ofcommunicative tasks. It is therefore extremely difficult to appeal to such aslippery criterion in trying to describe levels of performance on languagetests. It is also worth noting that the criterion, Appropriacy, was no longer inuse on either version, following analysis of the first trial administration, as itappeared to be measuring a separate skill from the other criteria. Thecomplete list of scoring criteria used to rate individual tasks on both versionsof the revised test is included in Chapter 6 (Table 6.2). The revised set ofdescriptors for each of the scoring criteria is included in Appendix 6.1.
Six general levels of performance on the oral interaction sub-test weredistinguished by May 1994 for the purpose of candidate classification. Theselevels of performance and their descriptors (where applicable) are shown inTable 2.4.
43
2 The access: test

Table 2.4
Proficiency levels: oral interaction sub-test, June 1994
LEVEL 6 [Undefined]
LEVEL 5Can communicate effectively in spoken English in a range of social,educational and work situations. Communication is appropriate with a highdegree of fluency. Language is grammatically accurate most of the time with awide range of vocabulary which is used effectively in most situations.
LEVEL 4Can communicate in spoken English to handle everyday communication insocial, educational and work situations. Can communicate with a fair degreeof fluency despite some grammatical inaccuracies. Vocabulary is wide enoughto express most ideas, particularly in familiar situations.
LEVEL 3Can communicate general information in spoken English in most everydaysocial situations. Can use basic grammatical structures although inaccuraciesare frequent. Although vocabulary is limited at this level most commonconcepts can be expressed.
LEVEL 2Can communicate in spoken English well enough to hold a very simpleconversation. Limited control of basic grammatical structures. Vocabulary islimited to common words and phrases.
LEVEL 1No practical speaking ability in English.
In terms of its reliability of measurement the test was designed todiscriminate most clearly between the three upper levels, i.e. Level 4, Level 5and Level 6. Level 4 corresponded to Functional proficiency and Level 5 (andabove) to Vocational proficiency. The cut-off points for these three levelswere derived from a trial in September 1993 where the entire cohort of testtakers (N = 121) undertook the Australian Second Language ProficiencyRatings (ASLPR) interview procedure as well as both the live and tape-basedversions of the access: oral interaction sub-test.
The ASLPR (Ingram and Wylie 1984) is designed to measure languageability in the four macro-skills (speaking, listening, reading and writing) usingnine levels from zero to native-like proficiency (i.e. 0, 0+, 1-, 1, 1+, 2, 3, 4and 5). Each of these levels is accompanied by detailed descriptions of whatindividuals can typically do at each level. An additional level between 2 and3 (i.e. 2+) is also widely used although it has not yet been formally described.
44
2 The access: test
The ASLPR interview is used to assess speaking and listening skills and isconducted in the target language by a trained interviewer who normally scoresthe candidate as well. In each case, the topics, questions and timing of theinterview are chosen according to the candidate’s perceived level ofproficiency which is probed using questions requiring increasingly morecomplex responses. Reading and writing skills are normally assessedconcurrently using appropriate tasks. As the ASLPR was the instrument mostwidely used to assess the English language proficiency of adult immigrants inAustralia at this time, it was deemed by DIEA to be the most appropriatesource of information on which to draw in order to establish benchmark levelsof performance on the access: test.
In the September 1993 trial candidates’ ASLPR scores were used tobenchmark results obtained from the two versions of the oral interaction sub-test. This process seldom enabled these results to be aligned with theproficiency levels shown in Table 2.4 above by equating Level 4 with ASLPR2 (minimum social proficiency), Level 5 with ASLPR 2+ and Level 6 withASLPR 3 (minimum vocational proficiency). The cut-off scores were thencarried over to subsequent trial and overseas administrations using previouslytrialled tasks as ‘anchors’ in the statistical analyses of the test raw scores. Thisprocedure enabled candidate performance on any given form of the oralinteraction sub-test to be related directly to performance on earlier forms ofthe same test (see Chapter 7 for further details).
Although the ASLPR ratings were the primary means of establishing cut-off levels in this process, other information (such as test developers’ views ofwhat constituted typical performances at the various overall levels andanalysis of samples of candidates’ performances in relation to these levels)was also considered in order to offset over reliance on this procedure. Theissue of cut-off scores will be further discussed in relation to the findings inthis study in Chapter 7.
Finally, it is worth noting that the paragraph in the draft specifications(September 1992) cited earlier in this chapter, which refers only to concurrentvalidation as a means of establishing equivalence between the live and tapeversions of the test, remains unchanged in the revised specifications ofMay 1994. It is therefore clear that other methods of demonstrating thecomparability of the two versions were still not envisaged at this stage ofdeveloping the test.
ConclusionThis chapter has outlined the development of the access: test in general
and the oral interaction sub-test in particular. In briefly comparing the twoversions of the oral interaction sub-test in relation to the test specifications,
45
2 The access: test

the careful attempt by test developers to establish equivalence between themhas been underlined. In general, it appears that the two versions were fairlywell matched in their design in terms of the tasks and scoring criteria used ineach case. Perhaps the most distinctive – and contentious – feature of thedesign of the oral interaction sub-test raised in the discussion was theattempted minimisation of interaction on the live version (with the exceptionof the role play task) in order to maximise its comparability in terms oflanguage output with the tape version and to ensure quality control inoverseas test centres.
What is original about this study, therefore, is that, unlike previousresearch, it examines the comparability of direct and semi-direct tests whichwere carefully matched in design in a bid to secure their equivalence. Whetheror not this was actually achieved in practice, however, is the central issueexplored in subsequent chapters of this book.
Chapter 3 will describe the methodology used to compare the direct andsemi-direct versions of the access: oral interaction sub-test in the currentstudy.
46
2 The access: test

Methodology
This chapter describes the methodology used to examine the equivalence orinterchangeability of the direct and semi-direct versions of the access: oralinteraction sub-test in this study. First, it introduces the instrumental casestudy approach, outlines the philosophical perspectives underpinning theinvestigation and explores relevant issues of validity and reliability. Secondly,the chapter provides a rationale for the approach taken in the study and thenoutlines the research design, including the procedures and methods of dataanalysis adopted in the study. The chapter concludes with a discussion of therole of the researcher in the various phases of the investigation.
The instrumental case study approachThis section introduces the case study in general and the instrumental casestudy in particular, discusses the philosophical perspectives underpinning thestudy as well as relevant notions of validity and reliability and examines keymethodological principles.
The case study defined
Strictly speaking, the case study approach is not a method. Instead, it isnormally defined in terms of its unit of analysis. Merriam (1988: 9–10)provides the following definition:
a case study is an examination of a specific phenomenon such as aprogram, an event, a person, an institution or a social group. Thebounded system, or case, might be selected because it is an instance ofsome concern, issue, or hypothesis.
In a sense, of course, this could be a description of any form of empiricalresearch and yet what is distinctive about the case study is its holistic focuson the ‘bounded system’ in context. Thus, for Yin (1989: 23)
47
3

a case study is an empirical inquiry that investigates a contemporaryphenomenon within its real-life context; when the boundaries betweenphenomenon and context are not clearly evident; and in which multiplesources of evidence are used.
As Yin suggests, the other main distinguishing feature of case study researchis its use of a variety of evidence (both qualitative and quantitative) to explorethe issue(s) under investigation.
The case study is sometimes construed as a limited type of ethnography, aresearch method derived from anthropology and firmly grounded in thenaturalistic paradigm. Ethnography, like other forms of naturalistic inquiry, isbased on the assumption that human behaviour cannot be understood withoutincorporating into the research the perceptions and insights of those involvedin the study, not simply the researcher. It mainly employs observation,interviews and other sources of qualitative data as methods of data collection.However, while a case study can share the same naturalistic philosophicalassumptions as an ethnography (although, as discussed below, this is notalways true), case studies are generally more limited in scope thanethnographies, focus less on cultural interpretation and more frequently useboth qualitative and quantitative data and analyses (Nunan 1992).
Johnson (1992) provides the basis for distinguishing most case studies interms of design and methods. In developing a working design the researchermay start by delineating the research questions and the unit selected for studyand then choose initial data collection and analysis techniques. As the studyprogresses new perspectives on the ‘bounded system’ may emerge requiringdifferent methods to be utilised.
There are relatively few methodological rules for case studies. As Johnson(1992: 83) suggests, case study methodology is highly flexible and is devisedin response to the purpose of the study. The type of data gathered and themethods of data analysis employed in the study, as noted above, may be of aquantitative and/or qualitative nature.
The case study approach was adopted to carry out the research for thisinvestigation because of first, its holistic focus on the case or ‘boundedsystem’ (i.e. the access: oral interaction sub-test); secondly, its exploratory,iterative orientation; and thirdly, its capacity to accommodate differentphilosophical perspectives and research methods (both quantitative andqualitative).
The intrinsic versus instrumental case study
Stake (1994: 237) distinguishes between intrinsic and instrumental casestudies. In the intrinsic case study the researcher is focused entirely on theparticular case:
48
3 Methodology

It is not undertaken primarily because the case represents other casesor because it illustrates a particular trait or problem, but because, inall its particularity and ordinariness, this case itself is of interest.
In the instrumental case study, on the other hand, a particular case isinvestigated to throw light on an issue or theory. In this instance, Stake (1994:237) suggests
a particular case is examined to provide insight into an issue orrefinement of theory. The case is of secondary interest; it plays asupportive role, facilitating our understanding of something else. Thecase is looked at in depth, its contexts scrutinised, its ordinaryactivities detailed, but because this helps us pursue the externalinterest.
While the distinction between intrinsic and instrumental case studies is animportant one, Stake (1994: 237) points out that there is not always a clearline distinguishing them. Instead, ‘a zone of combined purpose separatesthem’ since the researcher may ‘simultaneously have several interests, oftenchanging’.
The research reported here is an example of an instrumental case study. Infocusing on whether the live and tape-based versions of the access: oralinteraction sub-test were interchangeable in the test trials conducted inAustralia (two of which became the ‘cases’ here), the study aims to shed lighton the potential equivalence of this and other pairs of direct and semi-directspeaking tests. The implications of the findings in this study are discussed inChapter 8.
Philosophical assumptions
This section outlines the philosophical assumptions underpinning the casestudy approach adopted here. The case study has been employed in the fieldof applied linguistics to date by researchers working within both thepositivistic tradition of research (see, for example, Sato 1985) and thenaturalistic tradition (see, for example, Benson 1989). However, in recentdiscussion of research methods (cf. Merriam 1988; Yin 1989; Johnson 1992;Nunan 1992) it is normally located in the second of these traditions.
The positivistic paradigm continues to dominate research in languagetesting. This is perhaps not surprising given the importance of themeasurement dimension in this enterprise. The positivistic position basicallyasserts that reality is objective, that facts can be separated from values andthat the researcher’s task is to arrive, as far as possible, at ‘context free’conclusions about what is produced in the study. It typically relies exclusively
49
3 Methodology

on the expert knowledge of the researcher, who normally employs mainlyquantitative data and methods of data analysis to test tightly framedhypotheses formulated at the outset of the study (Guba 1990b; Lynch 1996).
In more recent years this traditional form of positivism has beensuperseded by postpositivism. This viewpoint asserts that while externalreality exists it can never be fully comprehended. Moreover, while objectivityremains a regulatory ideal in social inquiry it can only be approximated.Postpositivism embraces the use of multiple methods of inquiry (although thequantitative variety is still generally favoured) to enhance reliability and tooffset the bias inherent in any one source of evidence. It also displays awillingness to consider the insights and feedback from the peopleparticipating in the research about the issue(s) at hand, not simply those ofthe researcher(s), albeit to a limited extent. Despite these concessions,postpositivism remains fundamentally tied to the positivist paradigm in termsof its underlying philosophical assumptions. Indeed, it is questionablewhether postpositivism actually represents an entirely separate paradigm at all(Guba 1990b; Phillips 1990; Lynch 1996).
Both positivism and postpositivism stand in sharp contrast to the othermain paradigm in social science research, the naturalistic or constructivistperspective. Naturalistic inquiry assumes that reality is not objective, thatfacts and values cannot be meaningfully distinguished and that phenomenaare best understood within the context in which they are explored. It primarilyuses qualitative data (such as observation and interviews) and qualitativemethods of analysis. In contrast to research based on positivistic principles,the research is exploratory and process-oriented. Naturalistic researchtherefore demands an emergent as opposed to a pre-formulated design(Guba 1990b; Lynch 1996; Merriam 1988: 17).
Most significantly, perhaps, as a logical extension of its view of reality, thenaturalistic paradigm rejects the notion of external, objective truth whichunderlies the positivistic paradigm. Instead, the naturalistic position assertsthat
truth is a negotiable commodity contingent upon the historical contextwithin which phenomena are observed and interpreted.
(Nunan 1992: xii)
The idea that truth is a ‘negotiable commodity’ also implies thatresearchers need to seriously take into account the views of the people whoparticipate in their studies in order to arrive at an understanding of what isbeing investigated, as well as their own observations and insights.
These diametrically opposed perspectives on the nature of ‘truth’ underpinvery different views of the nature, purpose and significance of social research.
50
3 Methodology

As a result, the positivistic and naturalistic research paradigms, and thus thequantitative and qualitative methods they respectively each favour, are seenby some scholars, (e.g. Guba and Lincoln 1989), as fundamentallyincompatible. From this perspective, these two different kinds of methods canonly provide information that counts as evidence within the paradigm towhich they belong.
However, as writers such as Cherryholmes (1992) and Lynch (1996) havesuggested, it is possible to find a way out of this potential stalemate byadopting an accommodationist (i.e. compatabilist) stance. In support of thisperspective Howe (1988) argues that social science research need not employonly one kind of understanding. He claims that both the ‘scientific’understanding derived from positivistically oriented research and the‘interpretive’ understanding stemming from naturalistic research should beadmitted as legitimate forms of knowledge. From this viewpoint, it ispermissible, even desirable, to mix the methods of the two paradigms(including their research designs, data gathering techniques and types of dataand analysis) in order to allow the different kinds of understanding whichresult from the use of both methods to inform each other. Theaccommodationist stance derives from pragmatic philosophy and represents amiddle ground between the positivistic and naturalistic paradigms. It isessentially according to Lynch (1996: 20)
[a] non-paradigm allowing for methods to change and develop ournotion of paradigm and vice-versa ... the pragmatist stance putsparadigm and method at the service of practice in order to be able tohave something rational and convincing to say about the object ofinquiry.
Adopting an accommodationist position does not mean that bothqualitative and quantitative methods will always be employed in any givenstudy – the appropriate choice of methods will hinge on the nature andpurpose of the research. Nor will a mixing of these methods necessarily leadto consistent or complementary findings. In fact, it may be that such acombination will result in conflicting and even contradictory perspectivesabout a given issue. This situation may then lead the researcher to furtherconsiderations about the relative merits of the different methods in theparticular research context.
The accommodationist stance is the theoretical position underlying theinstrumental case study approach used in this study. In the first instance,investigating the equivalence of test products (namely, test scores and testtaker language output) from the live and tape versions of the oral interactionsub-test necessitated a positivist orientation. Later, the naturalistic perspective
51
3 Methodology

was adopted as the most suitable model for an ‘inside’ exploration of the twotests, looking at such issues as how they are produced, what happens in thetwo test events and how they are rated.
Thus, adopting an accommodationist stance enabled the researcher tomove between two very different research perspectives. In so doing, theresearcher was able to gather a wide range of evidence and use a variety ofmethods (both quantitative and qualitative) to support the conclusions reachedin the study. The necessity for this dual perspective will become clearer as theevidence on the validity of the live and tape-based versions of the oralinteraction test unfolds.
The preceding discussion has attempted to outline the philosophical issuesand problems associated with combining quantitative and qualitative methodsin conducting empirical research. Too often, as Lynch (1996: 21) suggests,such a mixing of methods is used in applied linguistics research as if thephilosophical assumptions associated with these methods were necessarily thesame. The accommodationist stance allows the researcher to work within boththe positivistic and naturalistic research paradigms while acknowledging theirdifferences especially in relation to what counts as evidence in any giveninquiry.
Validity and reliability
The case study, particularly when undertaken from within the naturalisticparadigm, has been criticised in relation to issues of reliability and validity,both internal and external. Much of this criticism, as Nunan (1992: 58) notes,stems from the fact that it is based on a detailed examination of a particularcontext or situation.
Reliability in research relates to the consistency of the findings. A study hasinternal reliability if its conclusions are or can be independently ratified bymore than one researcher, or, at least that they seem reasonable in the light ofthe data collected. External reliability refers to whether the study can bereplicated. Given that published accounts of naturalistic case studies generallyreport only a limited proportion of a large quantity of qualitative data, it isoften difficult, as Nunan (1992) points out, for other researchers either toanalyse the data themselves or to attempt replication of the study. This is notnormally the case with more positivistically oriented research. In discussingethnographic research, LeCompte and Goetz (1982) suggest methods ofenhancing the reliability and validity which would appear to apply equallywell to most case studies. In relation to internal reliability, they recommendthe use of low inference descriptors which describe behaviour on which it iseasy to agree, multiple researchers, participant researchers, peer examinationand mechanically recorded data to guard against threats to internal reliability.LeCompte and Goetz claim that external reliability can be safeguarded by
52
3 Methodology

carefully detailing the status of the researcher(s), the choice of subject(s), thecontext and conditions under which the research is undertaken, the analyticconstructs and premises of the study and the methods of data collection andanalysis.
Validity relates to the ‘truth’ of research findings. Internal validity relatesto whether the observed relationship between variables could be inferred ascausal. This may, however, not be a crucial issue, particularly innaturalistically oriented studies. As Nunan (1992: 59) suggests,
if the researcher is not attempting to establish a causal relationshipbetween variables, the issue of internal validity will be lessproblematic than if such a relationship is being sought.
In any case, internal validity cannot be automatically guaranteed wherepositivistic methods are employed. Thus, in both positivistic and naturalisticresearch the apparent relationship between key variables needs to be closelyscrutinised before causality can be deduced.
Finally, external validity primarily concerns the issue of generalisability orto what extent can the research findings be generalised to other groups.Because of the case study’s concentrated focus on the particular instance,however, the ultimate goal may not necessarily be to arrive at a generalisationabout the whole population of instances as in many other kinds of research.Stake (1988: 256) underscores this feature of the approach:
In the case study, there may or may not be an ultimate interest in thegeneralisable. For the time being, the search is for an understandingof the particular case, in its idiosyncrasy, in its complexity.
Nunan (1992: 59) suggests that
if the researcher is not interested in the issue of generalisation, thenthe issue of external validity is not a concern.
However, the issue remains vexed for contexts in which there may be amotivation to extend the findings beyond the limits of the ‘bounded system’of the case as in the instrumental case study.
While generalising can be problematic in any empirical study, whetherpositivistically or naturalistically oriented, this does appear to be particularlytrue for the case study. LeCompte and Goetz (1982) suggest that the casestudy’s external validity can be enhanced, if necessary, by paying closeattention to particularity issues including the uniqueness of the phenomenaunder investigation to a particular site, the influence of the researcher on the
53
3 Methodology

outcomes, historical effects and the extent to which abstract terms andconstructs are shared across different groups and sites. Merriam (1988: 177)advocates first, providing a rich, thick description so that readers can maketheir own judgements about the generalisability of the findings; secondly,attempting to discuss the typicality of the case compared to others in the sameclass; and thirdly, conducting a cross-case analysis in order to strengthen thestudy’s external validity. However, none of these recommendations providesa clear answer to the question of whether the case study can lead to explicitconclusions which go beyond the particular instance being examined.
More recently, Stake (1994) suggests that the case study can be oriented tobroader issues or theories beyond the specific instance being examined. Theinstrumental case study, in particular, generally aims to take the reader beyondthe specific instance under investigation. Its methods, according to Stake(1994: 242–3),
draw the researcher towards illustrating how the concerns of [other]researchers and theorists are manifest in the case.
This could involve, for instance, using a previously developed design ormethod of data analysis. While acknowledging its potential for linking in withthese broader concerns, Stake (1994: 238) also cautions against allowing thequest for generalisations to dominate the instrumental case study:
Damage occurs when the commitment to generalise or create theoryruns so strong that the researcher’s attention is drawn away fromfeatures important for understanding the case itself.
Provided the researcher does justice to the particularity of the case, theinstrumental case study, as Stake (1994: 245) suggests, can be ‘of value inrefining theory and suggesting complexities for further investigation, as wellas helping to establish the limits of generalisability’.
As suggested previously, the research reported here is an example of aninstrumental case study. In examining the comparability of the live and tape-based versions of the access: oral interaction sub-test in two different testtrials, the study has potential implications for the equivalence of this and otherpairs of direct and semi-direct speaking tests, either presently in use or yet tobe developed. These implications are discussed in Chapter 8.
Because of what they see as a positivistic bias in the meaning of the terms‘validity’ and ‘reliability’, Guba and Lincoln (1989) have proposed analternative set of criteria for evaluating naturalistic research which they referto as trustworthiness criteria. Instead of internal validity they refer tocredibility, which is enhanced by procedures such as prolonged engagement,
54
3 Methodology

persistent observation and triangulation. Instead of external validity (orgeneralisability) the notion of transferability is proposed. This notion refers tothe degree to which working hypotheses derived from the study in questioncan be transferred to other contexts. The researcher is required to provide asufficiently thick description of the study to allow the reader to determinewhether such a transfer is possible. Rather than ensuring reliability, thenaturalistic inquirer attempts to achieve dependability by way of continuallytesting working hypotheses through prolonged engagement. Peer debriefingleading to feedback from ‘disinterested’ colleagues, member checking withparticipants in the research about conclusions drawn by the researcher andinquiry audits focusing on the degree of consistency achieved in the study areexamples of other means of enhancing dependability. This typology appearsto offer a more appropriate basis for strengthening the findings of naturalisticresearch.
Guba and Lincoln have also developed a further set of considerationswhich they call authenticity criteria (i.e. fairness, ontological authenticity,educative authenticity, catalytic authenticity and tactical authenticity) whichdo not attempt to parallel the traditional notions of validity and reliability.These criteria emphasise the representativeness of the views gathered in theresearch process, the degree to which participants’ understanding of the keyissues is increased in this process and finally, the extent to which somethingis actually done as a result of the research.
The different perspective cast by Guba and Lincoln on judging the meritsof naturalistically oriented research has important significance for the way inwhich this kind of research is carried out in the current study. Equally,however, the more traditional ways in which validity and reliability areunderstood and safeguarded are relevant to the positivistically orientedresearch which also forms part of this study. Adopting an accommodationistposition (see above) meant that care needed to be exercised in adopting themost appropriate procedures for strengthening the findings according towhich types of research methods were employed at any given stage of thestudy.
Research design of the study
Rationale
As suggested earlier in this chapter, the case study approach was adopted tocarry out the research reported here because of first, its holistic focus on thecase or ‘bounded system’; secondly, its exploratory, iterative orientation; andthirdly, its capacity to accommodate different philosophical perspectives andresearch methods (both quantitative and qualitative). The study should beunderstood as an instrumental case study because, in examining the
55
3 Methodology

comparability of the live and tape-based versions of the access: oralinteraction sub-test in the context of the test trials, it aims to shed light on thepotential equivalence of this and (with suitable caveats) other direct and semi-direct pairs of oral proficiency tests.
The accommodationist stance, outlined in the previous section, is thetheoretical position underlying this study. This strategy enabled the researchquestion to be addressed from both positivistic and naturalistic perspectives.Because of its emphasis on both product and process and its reliance on bothquantitative and qualitative research methods, this strategy eventuallyallowed for more solidly grounded, valid conclusions than would have beenthe case if only one paradigm had been used.
Procedure
The data for the study was collected from two separate trials of this test(December 1992 and June 1994) where candidates undertook both the liveand tape-based versions.
In the first ‘case’, the December 1992 trial, the comparability issue wasaddressed from within a positivistic framework and the focus was on twodifferent kinds of products: (a) test scores and (b) test taker language output.
The first question to be examined was whether the scores obtained fromcandidate performance on the two versions were equivalent. In order to dothis, the raw scores obtained from this trial were analysed using multi-facetedRasch measurement (see Chapter 4).
However, as Shohamy (1994) suggests, even when the equivalence of testscores can be established, this does not provide sufficient evidence that twotests measure identical language abilities. She argues that more convincingevidence includes examination of the test taker language output producedunder the two test conditions using the tools of discourse analysis.Accordingly, sample audio recordings from the December 1992 trial wereexamined in relation to the discourse features of test taker output on the twotest versions using a framework developed by Shohamy (1994). Two differentkinds of analyses were conducted at this stage. First, a broad qualitativediscourse analysis of the language samples was carried out. Secondly, adetailed quantitative comparison of these samples was conducted (seeChapter 5). While the analyses of test scores and test taker language outputprovided some important initial answers to the equivalence question, theywere still tentative and even partially contradictory. This led to the adoptionof another very different perspective from which to address the researchquestion in a subsequent trial.
In the second ‘case’, the June 1994 trial, the comparability issue was firstexamined from a naturalistic perspective and the investigation focused on testprocesses, including the processes of test design, test taking and rating. This
56
3 Methodology

change of perspective was motivated by the inconclusiveness of the findingsbased on test products in the December 1992 trial. In this part of the study thevarious stages of the trial were tracked (see Table 6.1 in Chapter 6). The datagathered at this time included observation notes based on the performances oftwo candidates on both the live and tape versions, video and audio recordingsof these performances, audio-taped interviews with test developers,candidates, interlocutors and raters and, finally, written questionnaires andfeedback sheets from candidates and raters. In this case both the data andmethods of analysis were mainly qualitative (Chapter 6). The test scores fromthis trial were then analysed quantitatively again from within a positivisticperspective and the results of selected candidates interpreted using thefindings from the previous study of test taking processes. This led toadditional quantitative analyses of the test scores from this trial (Chapter 7).The type of data gathered and techniques of analyses used in each phase ofthe research are summarised in Table 3.1 below.
Table 3.1
Summary of types of data gathered and techniquesof analyses used in the study
Phase Data Data type Method of analysis
A Trial 1 test scores quantitative quantitativeB Trial 1 language output qualitative qualitativeC Trial 1 language output qualitative quantitativeD Trial 2 test processes qualitative qualitativeE Trial 2 test scores quantitative quantitative
By moving back and forward between the positivistic and naturalisticperspectives, therefore, the researcher was able to gather a wide range ofevidence to support the conclusions reached in the study. As suggested earlierin this chapter, the necessity for this dual perspective will become clearer asthe evidence on the validity of the live and tape-based tests unfolds in the nextfew chapters.
Methods of data analysis
In this section the methods of analysis used to analyse the data collected fromthe two trials of the access: oral interaction sub-test are outlined.
Multi-faceted Rasch measurement
In both trials test scores were analysed quantitatively using multi-facetedRasch measurement to address the research question (see Chapters 4 and 7).
57
3 Methodology

Rasch measurement (a version of Item Response Theory based on a one-parameter model) calibrates item difficulty and person ability and calculatesa probabilistic estimate of candidate ability based on modelled predictionsof person-to-item response behaviour (McNamara 1996a). Given itsprobabilistic orientation, Rasch measurement appears to be based on themodified positivistic perspective discussed earlier in this chapter.
The computer program FACETS (Linacre 1989–95) extends this approachto include rater characteristics as another facet. In this analysis each candidatereceives a logit score which expresses the ability of the candidate in terms ofhis/her probability of obtaining a particular score (or above) on any item,given the difficulty of the item and the harshness of the rater. Thus, theprogram compensates for differences across facets. Other facets such asthe test version (i.e. live or tape-based) or interlocutor may also be includedin the analysis and contribute to the ability measure of each candidate. Inaddition to the ability measures for the candidates, the analysis provides a setof measures (also in logits) for each facet, including the difficulty of items andthe harshness of raters. Because the program FACETS compensates fordifferences in severity between raters, the main focus of their training andsubsequent assessment of test candidates is on establishing and maintainingintra- (as opposed to inter-) rater reliability, i.e. self-consistency rather thanabsolute agreement with other raters.
Following the use of the FACETS program to analyse the test score data inboth the December 1992 and June 1994 trials the equivalence of test scoresfrom the live and tape-based versions of the oral interaction sub-test wasexamined from two perspectives: first, the psychometric unidimensionality ofthe two versions (based on the degree of correspondence between candidateability estimates) and secondly, their relative difficulty. For the June 1994 trialtest scores were also compared using ‘anchored’ item ability estimates, i.e. thedifficult estimates of previously trialled tasks were preset into the FACETSanalysis. The anchoring process enabled results from one form of the test tobe meaningfully compared with earlier forms of the test. It also allowedpreviously established cut-off points for overall levels of performance to becarried forward from one administration to the next. A comparison ofcandidates’ performance in terms of the overall proficiency levels theyachieved on each of the two versions could then be made.
Further FACETS analyses, known as ‘bias analysis’ in multi-faceted Raschmeasurement, identify unexpected but consistent patterns of behaviour whichmay occur from an interaction of a particular rater with respect to somecomponent or ‘facet’ of the rating situation such as, in this test, a particularcandidate, format or item. The output of these analyses shows first, whetherindividual raters are scoring, say, a particular person or item more harshly orleniently relative to how they assess other people or items, and secondly,whether they are behaving consistently towards each individual person or
58
3 Methodology

item. It is important that these follow-up analyses be carried out since thecandidate ability estimates produced by the main analysis in the FACETSprogram do not take account of these interactions which are, therefore, apotential source of measurement error. Bias analysis was used in the study ofthe December 1992 trial to explore the interactions between rater and format.In the study of the June 1994 trial the interactions between first, rater andperson and second, rater and format were investigated.
Discourse analysis
Following the analysis of test scores in the December 1992 trial a selection ofthe audio recordings of 20 candidates on both the live and tape-based versionsof the oral interaction sub-test were transcribed and their discourse featurescompared using the framework adopted by Shohamy (1994) in her study ofthe Hebrew OPI and SOPI (see Chapter 1 for a discussion of her findings).These features included lexical density, rhetorical functions and structure,genre, speech moves, communicative properties, discourse strategies, contentand topic of discourse, prosodic/paralinguistic features and contextualisation,type of speech functions, discourse markers and register. With the exceptionof lexical density, all of these features were analysed qualitatively (see StudyA, Chapter 5). The analysis of lexical density is reported separately (see StudyB, Chapter 5) because it involved a more detailed, quantitative examination oftest taker language output and yielded different results in relation to theequivalence of the two versions than the other categories.
Qualitative data analysis
The analysis of the qualitative data gathered in the June 1994 trial followed aset of procedures described by Lynch (1996) in the context of languageprogram evaluation. The first step in this process involved establishing theinitial thematic framework following the data gathering process. Next, thedata for each stage was organised for analysis and coded using abbreviatedlabels for the themes and patterns which were beginning to emerge. Thecoding was provisional until all of the data had been carefully scrutinised.Coding marked the beginning of the process of classification and reduction ofthe data so that the most significant themes were isolated. Tentativeinterpretations and conclusions were then drawn from the classified andreduced data. Even at this stage, however, the researcher worked back andforth between the ‘raw’ data, the classification of the data and whateverpreliminary interpretations were formed before reaching any finalconclusions. This stage also included the search for alternative explanations tothose that were initially established in the process. The main focus throughoutthis process was the issue of the equivalence between the two versions of theoral interaction sub-test and this is reflected in the reporting of the results inChapter 6.
59
3 Methodology

Each of these three methods of data analysis provided a distinctly differentperspective on the issue of comparability between the direct and semi-directversions of the access: oral interaction sub-test. Using a range of perspectiveseventually yielded richer, more complex insights into this issue than wouldhave been the case if only a single method had been employed.
The role of the researcher
The researcher in the positivist tradition is often construed as a disinterested,external and ‘objective’ analyst of the phenomena under investigation. Fromthe naturalistic perspective, however, the researcher not only makes‘subjective’ judgements throughout the duration of any given study (includingwhat to investigate and how it should be done as well as whatever conclusionsare drawn), but may also actively influence the outcomes of the study. It istherefore important, especially where naturalistic methods such asobservation and interviewing are used (see Chapter 6), to identify the stakeheld by researchers in order to evaluate the results of their work critically.
The author of this study co-ordinated the initial stages of the developmentof the access: oral interaction sub-test from September 1992 to March 1993.He was involved in all aspects of this process including the creation of testspecifications and setting up the first trial in December 1992 as well as thefirst overseas administration in March 1993. He was not, however, consultedin the original decision to adopt the two different formats for the test. Asexplained in Chapter 1 this represented a practical solution to the problems ofadministering a speaking test in overseas centres and was initiated by seniormanagers of the access: test development project team before the researcherwas appointed to work on the test.
In April 1993 when the author began work on this study he was no longerformally working on the test. Naturally, however, particularly given the natureof this research project, he maintained a strong interest in its development andcontinued to be consulted by members of the project team until December1994 when the access: test was transferred to the Language Testing andCurriculum Centre (LTCC) at Griffith University.
It is perhaps unsurprising that, in the initial stages of this project at least,the author was cautiously optimistic that the direct and semi-direct versionsof the oral interaction sub-test would emerge as essentially interchangeable,given that he had played a major role in attempting to design the two versionsaccordingly. It was only as he began to compare the two versions from therange of perspectives outlined above that he began to critically re-evaluatethis belief. The findings in this study, particularly in the investigation into testprocesses in Chapter 6, should be interpreted in the light of the author’sevolving stance on the interchangeability question.
60
3 Methodology

SummaryTo re-cap, a case study approach was adopted to investigate the researchquestion because of first, its holistic focus on the case or ‘bounded system’;secondly, its exploratory, iterative orientation; and thirdly, its capacity toaccommodate different philosophical perspectives and research methods(both quantitative and qualitative). The research was conceived as aninstrumental case study because, in examining the comparability of the liveand tape-based versions of the access: oral interaction sub-test in the contextof the test trials, it aimed to shed light on the potential equivalence of this andother pairs of direct and semi-direct oral proficiency tests.
In philosophical terms an accommodationist stance was used to address theresearch question. This stance enabled the equivalence issue to be addressedfrom within both the positivistic and naturalistic research paradigms. Becauseof its dual emphasis on both product and process and its reliance on bothquantitative and qualitative research methods, this strategy eventuallyallowed for more solidly grounded, valid conclusions than would have beenthe case if only one paradigm had been used.
This chapter has outlined the general approach and research methods usedin this study to investigate the comparability of the direct and semi-directversions of the access: oral interaction sub-test in the context of the test trials.The next four chapters describe each phase of the study in detail and reportthe relevant findings.
61
3 Methodology

Trial 1: The analysis of testscores
OverviewThis chapter examines the equivalence of the direct and semi-direct versionsof the access: oral interaction sub-test in relation to the test scores obtainedfrom the first trial administration held in Melbourne in December 1992. First,the tasks, scoring criteria and rating procedures used in this trial are described.Secondly, the results of a preliminary study undertaken by Wigglesworth andO’Loughlin (1993) based on the test score data are critically examined.Thirdly, the findings from subsequent analyses of the same test score data arereported. In both cases the equivalence issue was addressed using multi-faceted Rasch analyses.
The December 1992 trialTable 4.1 details the full range of tasks and scoring criteria used in theDecember 1992 trial of Form A of the access: oral interaction sub-test. Thisfirst form of the test aimed to reliably identify candidates at the Vocationallevel only (at this initial stage seen as corresponding to Level 3 on the ASLPRscale. Level 3 in speaking on the ASLPR scale is defined as ‘able to speak thelanguage with sufficient accuracy and vocabulary to participate effectively inmost formal and informal conversations on practical, social and vocationaltopics’ (Ingram and Wylie 1984)).
Each of the scoring criteria was assessed on a six-point scale withdescriptors. (These were identical for the two versions of the test.) Thedescriptors were derived empirically by the test development team followingthe first trial administration using audio recordings of a sample of candidateperformances from both the direct and semi-direct versions. A full list of thedescriptors adopted for each level of the individual scoring criteria is providedin Appendix 4.1.
In this trial 94 volunteer NESB candidates recruited from several localEnglish language centres and tertiary institutions in Melbourne attemptedboth versions of the test. Each test taker was paid AUD$20 upon completionof the trial oral interaction sub-test and a post-test questionnaire.
62
4

Table 4.1
Test tasks and scoring criteria Form A (trial), December 1992
LIVE TAPE
1. Warm up (unassessed) 1. Warm up (unassessed)
2. A) Description 2. A) Description– fluency – fluency– grammar – grammar– vocabulary – vocabulary
B) Narration B) Narration– fluency – fluency– grammar – grammar– vocabulary – vocabulary– coherence and cohesion – coherence and cohesion
C) Exposition (1) C) Exposition (1)– fluency – fluency– grammar – grammar
D) Summary– fluency– grammar
3. Role play (1) 3. Role play (1)– fluency – fluency– grammar – grammar– appropriacy – appropriacy
Role play (2) Role play (2)– fluency – fluency– grammar – grammar– appropriacy – appropriacy
4. Exposition (2) 4. Exposition (2)– fluency – fluency– grammar – grammar
5. Discussion 5. Discussion– fluency – fluency– grammar – grammar– vocabulary – vocabularyGlobal criteria Global criteria– intelligibility – intelligibility– communicative effectiveness – communicative– comprehension effectiveness
4 Trial 1: The analysis of test scores
63

For the purpose of providing an overview of the composition of this trialtest cohort, candidates can be divided into two broad groups on the basis ofhow closely they resembled the target overseas test population using dataobtained from questionnaires completed by them on the day of the trialadministration. The more ‘non-target-like’ group (i.e. NESB students,generally under twenty-five years of age and living in Australia on atemporary basis while completing their tertiary studies) comprised 32% of thegroup. The remaining 68% belonged to the more ‘target-like’ group whichwas composed of NESB professionals who were generally over 25 years ofage and qualified in a wide range of fields including engineering, medicine,teaching, administration, computing, librarianship and architecture. However,given that they had mostly already obtained permanent residence, had been inAustralia for more than 18 months and were undertaking the test here, itshould be acknowledged that even this group did not entirely fit the profile ofthe target test taker population. Given these differences between the trial andoperational test populations the findings reported here cannot be directlyapplied to the operational context. Nevertheless, as suggested previously, theydo have potential implications for any group of people undertaking the testand indeed for the interchangeability of other direct and semi-direct speakingtests.
Of these 94 trial candidates in the December 1992 trial, approximately halfwere administered the live version first, and half were administered the tapeversion first. Their performances on both versions were all audio taped so thatthey could be rated retrospectively. Ten tape-based recordings wereunsuccessful due to technical faults in the recording equipment in thelanguage laboratory, and these candidates were therefore excluded. Oneadditional candidate was excluded because the live version recording becameunintelligible after only one rating. Thus, the analysis was based on the scoresfrom a total of 83 candidates on both the direct and semi-direct versions of thetest.
Thirteen teachers were recruited for the purpose of rating the tapes. Theywere all trained TESOL teachers and had at least five years’ experienceteaching a range of levels. Prior to rating the tapes, each rater participated ina comprehensive whole-day training session. The rating process wasconducted in two phases. Initially each tape was rated by two raters. Thus, forthe first stage, eight raters each scored 37 tapes and one rater scored 36 tapesat home over a period of one week. The rating design was such that no raterassessed any particular candidate on either version more than once. Thismeant that each candidate was assessed by four different raters.
In the second stage of the rating, the other four raters rated every audiorecording (83 x 2 =166). Two of this group of raters rated the tape versionfirst, and two rated the live version first. The purpose of these multiple ratings
4 Trial 1: The analysis of test scores
64

was to reduce to the greatest possible extent the degree of measurement errorso that the ability estimates obtained for each of the candidates were asreliable as possible.
A preliminary studyIn a study of the test score data obtained from this trial administration,Wigglesworth and O’Loughlin (1993) undertook a preliminary investigationinto the issue of comparability between the two versions of the test using themulti-faceted Rasch program, FACETS (Linacre 1989–95), which wasintroduced in Chapter 3. Three FACETS analyses were conducted: one for thelive data, one for the tape-based data and one for the combined data. For thelive and tape data taken separately four facets of the test situation wereincluded in the analysis: (1) candidate, (2) rater, (3) item and (4) order (i.e. theorder in which each version was undertaken by candidates). In the analysisusing the combined data another facet was added: (5) version, i.e. live or tape.All of the test items were equally weighted in the three analyses. The outputfor each of the facets from these analyses is given in Appendix 4.2. Thesefacets are related to each other as increasing or reducing. Figure 4.1 belowshows a graphical summary of the results from the analysis using thecombined data only in this study. This kind of summary is routinely producedby the FACETS program as part of the output of the analysis.
4 Trial 1: The analysis of test scores
65

Figure 4.1
All facet summary, oral interaction sub-test, FACETS analysis (1)December 1992 trial.
4 Trial 1: The analysis of test scores
66
Measr + Candidate - Rater - Version - Order - Item
5 + + + + + +24 4094
904 + + + + + +
28 3746 5377193
3 + 78 + + + + +62 68 89911 20 2760 61 8682
2 + 4 56 6 + + + + +731 3270 83 217 29 3919 4512 50 55 Exp1G |67 72 85
1 + 22 30 48 + + + + +7115 74 79 11 RP1G NarG8034 36 63 1 10 |DisG RP2G NarV64 92 TExp1G TNarG Exp2G49 5 69 7 DesG TNarV75 81
CommEff RP1A TSumGTExp2G
13 52 8 Tape First Exp1F DesV DisVTAns2G TDesG TDesVTDisG
0 * * * * * Int RP1F RP2A *NarC TAns1G TDisV
10 26 33 6 Live Second TAns2A TComm TExp1F54 84 TStoC58 87 3 8 9 RP2F NarF Exp1F
42 DesF DisF TInt
TStoF16 13 TAns2F TSumF TExp2F|
12 Comp TDesF TDisF-1 + 51 + + + + TAns1F +
TAns1A5725 5
-2 + 38 47 + + + + +3543 8818
-3 + + + + + +

In Figure 4.1, the facets are positioned horizontally. The ‘+’ or ‘-’ beforethe facet name (e.g. ‘-Item’) indicates whether the facet measures arepositively or negatively oriented. The first column represents the logit scalewhich is the same for all facets. The remaining five columns show anoverview of the results for each of the five facets used in the analysis. In thisoutput candidates are ordered with the most able people at the top and theleast able at the bottom. The other facets are ordered so that the most difficultelement of each facet is towards the top and the least difficult towards thebottom. The most severe rater therefore was rater 2. The tape version is shownhere to have been slightly more difficult than the live version overall.Furthermore, the version candidates undertook first emerged as slightly moredifficult than the one they did second. Finally, the most difficult item provedto be exposition 1 – Grammar (live version) and the easiest item role play 1– Appropriacy (tape version).
Table 4.2 below provides summary statistics for candidates in each of thethree analyses.
Table 4.2
Summary statistics, oral interaction sub-test, FACETS analysis (1),December 1992 trial (N = 83)
LIVE TAPE COMBINED
Number of items 23 24 47Candidates:Mean logit score 0.90 1.09 1.19SD (logits) 2.00 1.92 1.70Mean standarderror (logits) 0.13 0.14 0.09Person separationreliability(like K-R 20) 1.00 0.99 1.00
The candidates’ scores obtained from the FACETS analysis areprobablistic estimates (expressed as logits) of their ability which take intoaccount the difficulty of each of the test items, the relative severity of theraters who scored their peformances and other facets which included here thedifficulty associated with the order in which the two versions were undertakenand, for the combined data, the relative difficulty of each version.
Wigglesworth and O’Loughlin (1993) found that the ability estimates ofcandidates obtained from the analyses of the live and tape data takenseparately were strongly correlated at r = 0.92, a result very similar to those
4 Trial 1: The analysis of test scores
67

reported in the OPI/SOPI studies surveyed in Chapter 1. The concurrentvalidity of both versions of the test was also investigated in relation to ASLPRratings assigned to test takers by their interlocutors and an observer (alltrained and experienced users of this procedure) on the basis of theirperformance in the live version of the access: test. Reasonably strongSpearman correlations of rho = 0.89 for the live version and rho = 0.87 forthe tape version were obtained, although the validity of these ASLPR ratingsmay have been jeopardised, given that they were not obtained using theinterview method designated for this assessment procedure.
Finally, the comparability of the test scores was investigated in relation tocut-off scores. The cut-off scores for Vocational level were calculated byentering the ASLPR scores into the FACETS program as separate items foreach candidate on the two versions of the test. This provided a logit valueequivalent to ASLPR 3 (i.e., the Vocational level) for each version. The cut-off levels differed slightly for the two versions and were a function of theoverall item difficulty in each case. Thus, the cut-off scores were 0.10 for thelive version and -0.10 for the tape version. 53 candidates achieved Vocationallevel on both versions while 20 failed to reach this level. There were sevencandidates who reached this level on the live version but not the tape versioncompared to three candidates who achieved Vocational level on the tapeversion but not on the live version.
Thus, despite the strength of the correlation between the candidate abilityestimates (r = 0.92), 12% of candidates were found to have achievedVocational level on one version but not on the other. Wigglesworth andO’Loughlin (1993) attributed this result to the effect of order as an interveningvariable insofar as in all ten of these cases the candidate failed the version ofthe test they had completed first. Thus, there appeared to be a positive practiceeffect operating on their second performance.
However, following the publication of the study by Wigglesworth andO’Loughlin (1993), it was discovered that the above inference was erroneoussince it ignored the fact that ‘order’ was one of the facets of the test situationincluded in each of the FACETS analyses. This meant that, in producing thecandidate ability estimates for each version, the FACETS analysis hadcompensated for any significant effect arising from the order in whichcandidates undertook the two versions. Thus, the source of band leveldifferences obtained for a significant minority of candidates on the twoversions remains obscure from this study. What the examination of bandlevels in this study does confirm, however, even from a purely psychometricperspective, is that high correlations between test scores provide insufficientevidence for test equivalence.
There are two final criticisms to be made of the initial study of theDecember 1992 trial by Wigglesworth and O’Loughlin (1993). First,including five facets of the test situation in the analyses may have been
4 Trial 1: The analysis of test scores
68

excessive given the relatively small number of candidates and items.McNamara (1996a:140) points out that designs incorporating a greaternumber of facets require larger data sets than used here to ensure stability ofestimate of facets. In retrospect, therefore, it would probably have been moreprudent to limit the number to a maximum of three facets in each analysis.While the facets included in the initial analyses would need to have beencandidate, rater and item, the effect of the order in which the two versionswere undertaken could have been compensated for by carrying out subsequentanalyses with the live and tape data taken separately, this time incorporatingcandidate, rater and order as facets. It should be noted, however, that theoverall effect of order was not great. The output for this facet from theanalysis of the combined data (see Appendix 4.2) indicates that the versionundertaken first was only 0.2 of a logit or 4% more difficult than the versioncompleted second. This difference is sufficiently small to suggest, in practicalterms, that the effect of order on candidate performance was minimal, at leastin this trial, and that, therefore, it did not need to be included as a facet in thetest score analyses.
Secondly, the use of multi-faceted Rasch analysis in Wigglesworth andO’Loughlin’s (1993) study could have led to other, more appropriate andrigorous measures of test equivalence than were employed in this study. Theremainder of this chapter will be devoted to reporting the results of theapplication of such techniques. Similar procedures will also be used toexamine the equivalence of test scores from another later trial in Chapter 7.
The current studyFollowing the preliminary study by Wigglesworth and O’Loughlin (1993)the same data set from the December 1992 trial was re-examinedto investigate the comparability of the direct and semi-direct versionsof the access: oral interaction sub-test from two alternative perspectivesmore appropriate to Rasch measurement: first, the psychometricunidimensionality (based on the degree of correspondence between candidateability estimates) and, secondly, the relative difficulty of the two versions ofthe test.
Psychometric unidimensionality of the oral interactionsub-test
The key issue here involved addressing the following question: is it possibleto construct a single measurement dimension of speaking ability for thecombined data from the two versions of the test? In other words, can the oralinteraction sub-test, when the data from the two versions are combined, beconsidered psychometrically ‘unidimensional’? It should be emphasised that
4 Trial 1: The analysis of test scores
69
what is being examined here is not whether the two tests are measuring thesame underlying psychological construct or ability but rather whether there isa single underlying pattern of scores in the data matrix. In other words, asMcNamara (1996a: 273) suggests, psychometric unidimensionality does notnecessarily imply psychological unidimensionality.
The issue of psychometric unidimensionality was addressed using a seriesof procedures adapted from McNamara’s (1991) study of the application ofRasch Item Response Theory to the validation of the listening sub-test of theOccupational English Test. The first step in addressing this issue was toidentify any misfitting candidates from the original FACETS analyses of thelive and tape versions taken separately. Misfitting candidates are those testtakers whose pattern of scoring is inconsistent with the general pattern ofscoring for the test cohort overall. Where this is the case, it suggests that theindividual’s abilities are not being measured appropriately by the testinstrument (McNamara 1996a: 178). Similarly, an item is said to be misfittingwhere performance on the item is inconsistent with the pattern of performanceon the test overall. Misfitting items may be interpreted as items which wereeither interpreted inconsistently by raters, or else did not form part of a set ofitems which together define a single measurement trait. Finally, raters are saidto be misfitting if their overall scoring lacks self-consistency. Throughout thisstudy ‘misfit’ will be defined in terms of candidates, raters or items whoseinfit mean-square value given in the FACETS output is more than 2 standarddeviations above the average figure for the relevant set of candidates, ratersand items.
Table 4.3 below provides a summary of misfitting items and persons in theoriginal FACETS analysis using the live, tape and combined data sets. Theoutput for each of these analyses is given in Appendix 4.2. The misfittingitems in this initial set of analyses were Appropriacy on both role plays for thelive data taken separately, Appropriacy on the second role play for the tapedata taken separately and finally, Appropriacy on both the first live role playand second tape role play and Comprehension on the live version for thecombined data.
There are two points to be made on the basis of the findings here. Firstly,it is hardly surprising that Comprehension emerges in the combined analysisas misfitting, given that it is a measure of listening and not speaking ability.Its inclusion as an item on the live version only may therefore haveundermined full test score equivalence between the two versions.
4 Trial 1: The analysis of test scores
70

Table 4.3
Misfitting items and persons, FACETS analysis (1),December 1992 trial (N = 83)
LIVE TAPE COMBINED
Mean SD Mean SD Mean SDItem infit 1.0 0.3 1.0 0.2 1.0 0.2Person infit 1.0 0.2 1.0 0.3 1.0 0.2
Misfitting items and personsItems 2 1 3
(#12,15) (#38) (#12, 23, 38)Persons 5 2 4
(#17,20,38,84,87) (#49,75) (#58,60,68,98)
Secondly, on the basis of these results, it appears that Appropriacy mayhave been interpreted inconsistently by raters. Because of its strong tendencyto misfit this category was subsequently excluded from the scoring criteriaemployed in this test. However, given that Appropriacy was the only measureof sociolinguistic competence included, its omission represented a narrowingof the range of speaking skills being assessed. A preferable solution wouldhave been for the level descriptors to have been revised and for raters to havebeen more carefully trained and monitored in scoring this category. IfAppropriacy still proved to be consistently misfitting following this process,then its relation to the other categories used in the test might have needed tobe re-examined i.e. it may have been assessing a different ability from the onemeasured by the other categories. Even if this was the case, the subsequentdecision to exclude Appropriacy as a rating category does not appear to havebeen soundly based. A better solution would have been to retain the categoryand to report Appropriacy scores separately from the other scores.
For the next stage of the analysis, the seven misfitting candidates fromthe live and tape versions taken separately (see Table 4.3 above) were thenremoved from the data files. Given that their pattern of scoring wasinconsistent with the general pattern of scoring for the test cohort overall, itwas decided to exclude these candidates from the analysis in the interests ofobtaining a clearer picture of the overall equivalence of test scores from thetwo versions. The edited data were then re-entered into the FACETS programnow using only three facets i.e. (1) candidate, (2) rater and (3) item. Threedifferent analyses were then undertaken: one for the live data, one for the tapedata and one for the combined data. The output for each of the facets fromthese analyses is given in Appendix 4.3. Table 4.4 provides summary statisticsfor candidates in each of the three analyses.
4 Trial 1: The analysis of test scores
71

Table 4.4
Summary statistics, oral interaction sub-test, FACETS analysis (2),December 1992 trial (N = 76)
LIVE TAPE COMBINED
Number of items 23 24 47Candidates:Mean logit score 0.86 1.11 1.25SD (logits) 2.16 1.98 1.77Mean standarderror (logits) 0.14 0.14 0.09Person separationreliability(like K-R 20) 1.00 1.00 1.00
Table 4.5 below provides information on misfitting items and personsobtained from the FACETS analyses using the edited live, tape and combineddata sets. These results suggested (initially, at least) that when the edited liveand tape test data were treated as a single test all items except three combinedto define a single measurement dimension, and the overwhelming majority ofcandidates (with only one exception) had been measured meaningfully andreliably in terms of the dimension of ability so constructed. The threemisfitting items were the same ones as those in the initial combined analysisi.e. Comprehension in the live version, and Appropriacy for both the first roleplay on the live version and second role play on the tape version.
Table 4.5
Misfitting items and persons, FACETS analysis (2),December 1992 trial (N = 76)
LIVE TAPE COMBINED
Mean SD Mean SD Mean SDItem infit 1.0 0.3 1.0 0.2 1.0 0.2Person infit 1.0 0.1 1.0 0.2 1.0 0.2
Misfitting items and personsItems 1(#12) 1 (#38) 3(#12,23,38)Persons 1(#6 ) 3(#40,43,85) 1(#47)
4 Trial 1: The analysis of test scores
72

However, if the two versions of the oral interaction sub-test taken togethersatisfy the psychometric unidimensionality assumption, then the personability estimates derived from each version taken separately should beindependent of the particular condition under which they were obtained. Twostatistical tests were used to address this issue.
The first test to be used was a Pearson correlation between the abilityestimates obtained from the two versions of the test. The correlation betweenthe two sets of ability estimates uncorrected for attenuation was r = 0.92 (thesame as when all 83 candidates were included in Wigglesworth andO’Loughlin’s (1993) study). The result, when corrected for attenuation(i.e. taking into account the observed reliability of the two versions), using aprocedure outlined in Henning (1987: 85– 6) was r = 0.94. This resultsuggested a strong relationship between the ability estimates of candidates onthe two versions. Figure 4.2 below graphically illustrates this relationship.
Figure 4.2
Scattergram of candidate ability estimates (logits) on the live andtape versions of the oral interaction sub-test, FACETS analysis (2)
December 1992 trial (N = 76)
As previously noted, however, the correlation test is only a measure of thelinearity of this relationship. McNamara (1991: 153–54) suggests employingan additional, more rigorous test of the equality of ability estimates, a chi-squared (χ2) test, in order to overcome the limitations of the correlation test.For each candidate a z-score is calculated. The z-score is based on thedifference between the candidate’s ability estimates (i.e. logit scores) fromboth the live and tape versions taking into account first, the relative difficultyof each version of the test and secondly, the standard error of these estimates.
4 Trial 1: The analysis of test scores
73
-5 -4 -3 -2 -1 0 1 2 3 4 5 6
6
5
4
3
2
1
0
-1
-2
-3
-4
-5
o
o
o
o
o
oo o
o o
o
ooooo
ooo o oooo
ooo oooooo
oooooo
oooo
oo oo o
ooooo
ooo
o
oooo o
oo
oooooo oo o
LIVE
TAP
E
The z-score is then squared to get a value of (χ2) for each candidate and thentotalled to yield a statistic which provides a measure of the equivalencebetween the two sets of scores. This procedure was followed and the resultingvalue of (χ2) = 1347.71, df = 75, p< 0.001 suggested that the null hypothesisof equality between the two sets of ability estimates can be rejected, a findingwhich conflicts with the results of the other tests reported above.
Thus, the results of this statistical procedure (which is more rigorous thanstandard correlation techniques) indicate that the assumption ofunidimensionality has not been met i.e. it is not possible to construct asingle measurement dimension of ‘speaking ability’ from the data obtainedfrom the two versions of the oral interaction sub-test. In other words, this finalprocedure indicated an overall lack of equivalence between the test scoresfrom the two versions. Possible reasons for this difference will be explored insubsequent chapters.
Test difficulty
The next stage of the investigation concerned the question of comparativedifficulty on the two versions of the test. The first step in this process was tomap the ‘item’ difficulty estimates obtained from the FACETS analysis usingthe combined (live and tape) edited data. (See Appendix 4.3 for a full reportof these results.) The term item refers to individual scoring criteria on anygiven task. Thus, ‘Description: Grammar’ constitutes one item. In this mapitems are abbreviated according to task and criterion. Thus, for example,‘DisV’ stands for ‘Discussion: Vocabulary’ and ‘NarF’ for ‘Narration:Fluency’. Figure 4.3 below suggests that, in general, the two versions closelymirrored each other in terms of the difficulty of individual matching items.The one notable exception was that the item ‘Role play 1: Appropriacy’ on thetape version was markedly easier than either of its counterparts on the liveversion. However, the fact that ‘Role play 2: Appropriacy’ on the tape versionwas of a similar level of difficulty to the matching items on the live versionsuggests that this could have been a function of the particular task rather thanthe format to which it belonged. On the other hand, as argued in Chapter 1, itmay not be possible to make any direct comparisons about the relativedifficulty of items from the live and tape role plays since these tasks were onlysuperficially matched anyway. As outlined in Chapter 1, the live taskconsisted of a two-way exchange between interlocutor and candidate based onan information gap, and the tape task required candidates to leave a telephoneanswering machine message.
4 Trial 1: The analysis of test scores
74

Figure 4.3
Item difficulty map, FACETS analysis (2) of the oral interactionsub-test using the combined live and tape data sets,
December 1992 trial (N = 76)
Itemdifficulty(logits) LIVE TAPE
1.21.1 Exp1G1.00.9 NarG, Exp1G0.8 RP1G NarV0.7 NarG0.6 RP2G, DisG, Exp2G, NarV Exp2G0.5 SumG0.4 DisG0.3 DesG DesG, RP2G0.2 RP1A DesV, RP1G0.1 DesV, ComEff DisV0.0 Exp1F Exp2F
-0.1 RP1F, DisV ComEff,RP1F,RP2A-0.2 NarC, RP2A NarC-0.3 Int NarF-0.4 Int-0.5 RP2F, Exp2F Exp1F-0.6 NarF RP2F, SumF-0.7 DesF, DisF DesF, DisF-0.8-0.9-1.0 RP1A-1.1 Comp
An additional FACETS analysis including the three facets candidate, raterand format was later carried out using the combined data set to determine theoverall relative difficulty of the two formats. Table 4.6 below shows that thelive version was marginally (0.06 of a logit or 2%) more difficult than the tapeversion overall. While this result contradicts the finding in the output fromWigglesworth and O’Loughlin’s (1993) study (see Figure 4.1 above) it shouldbe remembered that the result here is likely to be the more accurate first,because all misfitting candidates had been removed from the original data setbut, secondly and more important, because the number of facets used toinvestigate the question of relative test difficulty was reduced from five facets
4 Trial 1: The analysis of test scores
75

in the original analysis to three facets here. As previously suggested, designsincorporating more than three facets require larger data sets than used in thisstudy to ensure stability of estimate of facets.
Table 4.6
Relative difficulty of the live and tape versions of the oral interactionsub-test, FACETS analysis (2), December 1992 (N = 76)
Obs Obs Obs Fair Measure Model Infitscore count avrge avrge (logits) SEMean sq
47624 11702 4.1 3.5 0.03 0.01 1.0 Live44683 10894 4.1 3.5 -0.03 0.01 1.0 Tape
In practical terms, this analysis, together with the earlier one comparing theindividual items on the two formats, suggested that the live and tape versionswere highly comparable in terms of difficulty, at least in this trial. However,these findings on their own do not offer support for the psychometricunidimensionality of the two versions. As suggested previously, the moreappropriate measure of test score equivalence was the chi-squared (χ2) test
which compared the candidate ability estimates obtained from the scoreson the live and tape versions of the test, taking into account the relativedifficulty of the two formats. This procedure indicated that the two sets ofability estimates were not equivalent and thus pointed to the existence of a testmethod effect.
On the basis of the results illustrated in Figure 4.3 above, it appears thatGrammar was the most harshly scored criterion, followed by Vocabulary,Communicative Effectiveness, Appropriacy, Intelligibility, Fluency andfinally, Comprehension (live version only). This order of harshness is verysimilar to that obtained in McNamara’s (1990a) study of the speakingcomponent of the Occupational English Test (with the exception ofVocabulary, which was not included on that test). Furthermore, given thatComprehension was the most leniently scored item, its use on the live test, butnot the tape test, may have contributed to reducing the gap in overall difficultybetween the two versions (see Table 4.6 above), i.e. it is likely that excludingthis criterion may have resulted in a sharper overall difference in difficulty infavour of the live version.
Bias analysis
In examining the equivalence of test scores from the two versions of the oralinteraction sub-test, a further important issue is the effect of format on thescoring of raters. In the analysis of test difficulty reported earlier in this
4 Trial 1: The analysis of test scores
76

chapter, the effect of format over all raters, candidates and items was foundnot to be large, i.e. the live version was marginally (0.06 of a logit or 2%)more difficult than the tape version overall. However, it is still possible thatindividual raters judged performances on one format significantly moreharshly or leniently than the other. This hypothesis was investigated using anadditional facility within the FACETS program known as bias analysis.
Bias analysis in multi-faceted Rasch measurement identifies unexpectedbut consistent patterns of behaviour which may occur from an interaction ofa particular rater with respect to some component of the rating situation suchas, in this test, a particular candidate, format or item. The candidate abilityestimates produced by the main analysis in the FACETS program do not takeaccount of these interactions which are, therefore, a potential source ofmeasurement error. Bias analysis has been previously employed byMcNamara et al. (1993) and Wigglesworth (1993) to investigate such threatsto reliability in the access: oral interaction sub-test.
The focus here is on the interaction between rater and format. Table 4.7below shows the results from the bias analysis using the edited combined dataset for all 13 raters who scored the test. Recall that raters 1–9 markedapproximately 20 live and 20 tape-based performances and raters 10–13 all166 (83 live and 83 tape) performances.
In Table 4.7 column 3 provides the total observed score of each rater forthe live and tape versions of the test. Column 4 provides an estimate of eachrater’s total expected score for the two versions. These predictions are basedon the results of the main analysis (using the edited data set) summarisedpreviously in this chapter (see Appendix 4.3 for full details). Column 5 thenprovides the average difference between the expected and observed score. Abias logit, based on this difference, is then calculated together with itsstandard error (columns 6 and 7). The bias score is then converted into astandardised Z-score by dividing it by its standard error (column 8). Wherethe Z-score values fall between -2.0 and +2.0, the rater may be considered tobe scoring that version without significant bias. Where the value falls below-2.0 the rater is marking the specified format significantly more leniently inrelation to the other format. On the other hand, where the value is greater than+2.0 the rater is scoring the format significantly more harshly compared tothe way that rater treats the other one. Furthermore, in this analysis the infitmean square value (column 9) indicates how similar the rater’s scoring is forthe format overall. Where the value is less than 0.7 the rater’s scoring on thatversion lacks variation, i.e. it is too predictable. Conversely, where this valueis greater than 1.3 the rater’s scoring lacks consistency.
These figures indicate that raters 1 and 11 were significantly more severeon the live version while raters 2, 3, 4, 5, 6, 8 and 10 were significantly moreharsh on the tape version. Rater 5 (live version only) and rater 8 (tape versiononly) also showed a significant tendency to be inconsistent with an infit mean
4 Trial 1: The analysis of test scores
77

square value of 1.4 in both cases. In practical terms, however, the overalleffects of rater bias in relation to the average difference it made to the rawscores allocated by all of these raters were not substantial, with the exceptionof raters 1 and 11 who were, on average, half a score point (on a six-pointscale) more severe on the live version than the tape version. This suggeststhat, for the majority of raters, the overall lack of equivalence between thecandidate ability estimates obtained from the two versions (see χ2 test resultsabove) cannot be ascribed to the interaction between format and rater in thescoring process. The scoring of raters 1 and 11, however, does appear to becontributing to this difference. Further details about the interaction betweenall 13 raters and the individual items from each version in this trial arereported in two studies by Wigglesworth (1993; 1994).
Table 4.7
Bias calibration report, December 1992 trial,rater – format interactions
Rater Format Obs Exp Obs-Exp Bias Error Z-score Infitscore score average (logit) mn sq
1 live 1489 1666 -0.39 0.83 0.07 12.2 1.12 live 1423 1379 0.10 -0.21 0.07 -3.1 1.13 live 2009 1952 0.12 -0.26 0.07 -3.8 0.94 live 2006 1947 0.12 -0.27 0.07 -4.0 0.95 live 2209 2165 0.10 -0.24 0.07 -3.2 1.46 live 2077 2036 0.08 -0.18 0.07 -2.7 0.97 live 1828 1849 -0.04 0.10 0.07 1.4 0.88 live 1955 1921 0.07 -0.17 0.07 -2.4 1.29 live 2026 2036 -0.02 0.05 0.07 0.7 0.8
10 live 8385 8102 0.13 -0.29 0.03 -9.0 1.011 live 7506 7853 -0.16 0.35 0.03 11.0 1.112 live 9921 9896 0.01 -0.03 0.03 -0.9 1.113 live 9148 9180 -0.02 0.03 0.03 1.1 0.8
1 tape 1616 1439 0.44 -0.94 0.07 -12.8 0.92 tape 1524 1569 -0.09 0.19 0.07 2.9 0.83 tape 1938 1995 -0.12 0.26 0.07 3.9 0.94 tape 1953 2012 -0.12 0.27 0.07 4.0 1.05 tape 2101 2145 -0.10 0.24 0.07 3.3 1.16 tape 1754 1795 -0.09 0.21 0.07 2.9 0.97 tape 1688 1667 0.05 -0.10 0.07 -1.5 0.98 tape 1438 1472 -0.10 0.21 0.08 2.7 1.49 tape 1920 1908 0.02 -0.05 0.07 -0.7 0.8
10 tape 7350 7634 -0.14 0.31 0.03 9.3 1.011 tape 7634 7288 0.18 -0.38 0.03 -11.5 0.912 tape 9246 9271 -0.01 0.03 0.03 0.9 0.913 tape 8680 8647 0.02 -0.04 0.03 -1.1 0.8
4 Trial 1: The analysis of test scores
78
ConclusionThe standard analyses of the FACETS output from the December 1992 trial(including the study of misfitting persons and items and also the strength ofcorrelation between the candidate ability estimates) appeared to providesupport for the assumption of psychometric unidimensionality in relation tothe two versions of the test. However, a more rigorous measure of therelationship between the ability estimates from the FACETS output (the chi-squared procedure) failed to confirm that a single measurement dimension ofspeaking ability could be constructed for the combined data obtained from thelive and tape versions. In other words, contrary to the more standard measuresof unidimensionality, this procedure indicated that the candidate abilityestimates obtained from the two versions were not equivalent. Finally, biasanalyses indicated that, for most raters, this apparent lack of equivalencecould not be ascribed to the interaction between format and rater in thescoring process.
While the lack of equivalence between test scores obtained from the morerigorous test of unidimensionality was compelling, this finding appearedsomewhat puzzling at this point, given the discrepancy between the differentmeasures used to address this question. Furthermore, even if this conclusionwas accurate, it was unclear from the statistical analyses alone why this mightbe so.
The next stage in the study was to examine the comparability of the twoversions in the December 1992 trial from a very different perspective, that ofcandidate language output.
4 Trial 1: The analysis of test scores
79

80
Trial 1: The analysis ofcandidate language output
OverviewThe previous chapter examined the equivalence issue from the perspective oftest scores obtained from the December 1992 trial. This chapter focuses on thecomparability of the direct and semi-direct versions of the access: oralinteraction test from the perspective of candidate language output.Specifically, it compares the discourse features of language samples collectedin the December 1992 trial using a framework developed by Shohamy (1994).Because the data consisted of audio recordings of candidate performance onlyvocal output was examined. The results are analysed in relation to theequivalence of the two versions of the test.
RationaleThe motivation for this phase of the study comes from Shohamy (1994), whoargues that concurrent validation studies examining the relationship betweentest scores (such as the one reported in Chapter 4) provide necessary butinsufficient evidence about whether two tests measure the same languageabilities. She argues convincingly that further evidence about the equivalenceof the language produced in both tests is required in order to address this issuemore comprehensively. Recall from Chapter 1 that, despite high correlationsbetween the Hebrew OPI and SOPI (r = 0.89 – 0.92), Shohamy (1994) foundimportant differences between the discourse features of language samplesobtained from the two tests. These results, together with differences foundbetween the nature of the elicitation tasks and the communicative strategiesused by test takers, suggested that different speaking abilities were beingtapped by the two tests.
In the present study, while the two versions of the oral interaction sub-testwere closely matched in terms of design, the most rigorous (and thus morereliable) measure of psychometric unidimensionality used in Chapter 4 (thechi-squared procedure) suggested a lack of equivalence between test scoresobtained from the December 1992 trial. However, following Shohamy (1994),an examination of the language produced under the two test conditions wasneeded to confirm whether the direct and semi-direct versions of the oral
5

interaction sub-test were therefore measuring different language abilities. Thenext step in this study, therefore, was to examine the equivalence of test takeroutput from the two versions.
MethodologyFollowing the analysis of test scores in the December 1992 trial, a selectionof the audio recordings obtained from both the live and tape-based versionsof the oral interaction sub-test was transcribed and their discourse featurescompared using the framework adopted by Shohamy (1994) in her study ofthe Hebrew OPI and SOPI (see Chapter 1 for a discussion of her findings).These features included lexical density, rhetorical structure and functions,genre, speech moves, communicative properties, discourse strategies, contentand topic of discourse, prosodic/paralinguistic features and contextualisation,type of speech functions, discourse markers and register. The analysis oflanguage output was carried out in two separate studies. In the first study(Discourse Study A), qualitative discourse analyses of the data wereundertaken focusing on all of the above features with the exception of lexicaldensity. In the second study (Discourse Study B), a quantitative examinationof test taker language output was carried out focusing solely on lexicaldensity. The analysis of lexical density is reported separately because of itsquantitative nature but, more importantly, because it also yielded differentresults in relation to the equivalence of the two versions than the othercategories. Using Shohamy’s (1994) categories enabled a direct comparisonto be drawn between her findings and the results of this study.
In order to ensure appropriate sample selection, a stratified random sampleof 20 test takers from the December 1992 trial was obtained. This processinvolved selecting ten candidates who had completed the live version first andten who had completed the tape-mediated version first by drawing candidatenumbers at random from each of these two groups. This group of 20candidates formed an approximately normally distributed range of abilitylevels using the ability estimates derived from the FACETS program and, assuch, was a reasonably representative sample of the whole cohort of 83candidates.
Four alternate tasks were chosen from the complete list of test tasks (seeTables 2.2 and 2.3, Chapter 2) as the focus of analysis – the description,narration, discussion and role play tasks. The key features of these tasks areshown in Tables 5.1 and 5.2 below.
The first three tasks were closely matched in terms of design across the liveand tape versions. Like all of the test tasks (except the live role play) theywere intended to be ‘monologic’ in character on both versions i.e. during theresponse only the test taker was required to speak in order to successfullyfulfil the requirements of the tasks successfully. (See Chapter 2 for further
5 Trial 1: The analysis of candidate language output
81

information about these tasks.) The live and tape role play tasks were the mostdifferent in terms of their requirements for candidates: the live role playconsisted of a two-way exchange based on an information gap while the taperole play required test takers to leave a telephone answering machinemessage.
Table 5.1
Key features of selected tasks, live version, December 1992 trial
Task Description Narration Discussion Role play
Topic educational car work lunchsettings breakdown engagement
Type unplanned planned unplanned plannedopen closed open openmonologic monologic monologic dialogic
convergent
No. of questions 3 1 4 1
Languagefunctions describing, narrating describing, apologising,expected explaining, narrating, explaining explaining,
making giving speculatingexcuses opinions
Preparation time nil 1’ 1’ 1’
Response time determined by/negotiated with interlocutor
5 Trial 1: The analysis of candidate language output
82

Table 5.2Key features of selected tasks, tape version, December 1992 trial
Task Description Narration Discussion Role play
Topic work car work partysetting accident invitation
Type unplanned planned planned unplannedopen closed open openmonologic monologic monologic monologic
No. of questions 3 1 4 1
Language describing, narrating, describing, apologising,functions giving explaining narrating, explaining,expected opinions explaining, making
giving excusesopinions,speculating
Preparation time 1’ 1’ 1’ 1’
Response time 2’ 2’ 4’ 45’’
A detailed transcription of these tasks using the live and tape audio recordingsof the 20 subjects selected was then carried out. This provided a total of 160language samples for this discourse analytic study. In the excerpts reproducedfor the analyses below the following transcription notation is used:
1 Unfilled pauses and gaps: periods of silence, timed in tenths of a secondby counting ‘beats’ of elapsed time in accordance with the rhythm of thepreceding speech. Micropauses, those of less than 0.2 seconds aresymbolised (.) within parentheses; longer pauses appear as time withinparentheses: e.g. (0.8) = 0.8 seconds. Where ‘real’ time is indicated (e.g.in between the end of task instructions and the beginning of thecandidate’s response, brackets ({ }) are used.
2 Repair phenomena: reformulations are indicated by a hyphen (-).3 Intonation: a period (.) indicates a falling intonation, a question mark (?)
marks a rising intonation and a comma (,) is used for continuingintonation.
4 Overlapping talk: brackets ([ ]) are used to indicate overlaps, i.e. whereutterances start and/or end simultaneously.
5 Transcription doubt or uncertainty: these are marked by a question markwithin parentheses (?).
6 Quiet talk: per cent signs (% %) are used to mark the boundaries of quiettalk.
5 Trial 1: The analysis of candidate language output
83

7 Latched utterances i.e. where there is no interval between utterances:equals signs (=) are used at the end of the first utterance and at thebeginning of the second utterance.
8 Lengthened sounds or syllables: a colon (:) is used; more colons prolongthe stretch.
9 Speakers: the interlocutor on the live version is indicated by (I), therecorded instructor’s voice on the tape version by (V) and the candidate onboth versions by (C).
10 Focus of analysis: an asterisk (*) is used.
Discourse Study A: The qualitative analysisEach of the discourse features used by Shohamy (1994), with the exception oflexical density (see Study B), was used to compare the audio recordingsobtained from the live and tape versions of the access: oral interaction sub-test. For each feature the results are compared with those reported byShohamy for the Hebrew OPI and SOPI.
Rhetorical functions and structure
In Shohamy’s (1994) study rhetorical functions refer to the nature of theprompts used to elicit test taker speech while rhetorical structure (or scheme)refers to the underlying discourse organisation or macro-structure of thewhole speech event. Shohamy found that the OPI mainly consisted of directquestions such as ‘Where do you live?’ and ‘What is your profession?’ whilethe SOPI mostly consisted of task prompts in the form of instructions such as‘Discuss the season you like best’ and ‘Give a speech’. The rhetoricalstructure of the OPI was therefore question – answer – question – answerwhile in the SOPI the rhetorical structure was task – performance – new task– new performance.
In this study, the rhetorical functions of the live and tape versions of theaccess: oral interaction sub-test were very similar. Both versions used taskprompts in the form of instructions to elicit test taker speech. In the fourmatching tasks selected for this study task prompts included, for example,‘Describe the building in which you studied’, ‘Use the pictures to tell thestory’, ‘Make excuses for not being able to go to lunch’ and ‘Describe acolleague you have admired’ on the live version and ‘Describe the building inwhich you work’, ‘Use the pictures to tell the story’, ‘Apologise and explainwhy you can’t go your sister’s party’ and ‘Describe some of the ways work ischanging in your profession’ on the tape version. The overall rhetoricalstructure of both the live and tape versions therefore was task – performance– new task – new performance. The following excerpts from candidate 27performances on the description and role play tasks across the two versions
5 Trial 1: The analysis of candidate language output
84

illustrate the similarity in rhetorical functions and structure. Each interviewerprompt has been highlighted with an asterisk (*).
[Candidate 27: Live description]* I: I would like you to describe to me either the university you
attended or the last school you attended. (0.5) Which one would youlike to describe?
C: Maybe the institution I mean the (?) polytechnical institutewhere I used to study (.) seven years ago (0.5).
* I: OK I'll just get you to describe to me the external appearanceand the location of the buildings.
C: Mm uh it was a beautiful place (.) w-with a lot of trees er (0.4)m-maybe twenty or twenty-five large buildings or differentdepartments, uh pretty location not far from the centre of town.
I: Mm mm all right (0.8) secondly, describe the internal layout of thebuilding or buildings, for example the number of floors, the numberof classrooms, offices, etcetera.
C: A big variety of different buildings from two storey buildings to(0.3) say twenty-four storey buildings so they were very different,some of them were built one hundred fifty years ago because it’s avery old institution and some of them were almost new, one years old.
I: Mm mm.C: Very different.
* I: All right, finally, please describe one of the classrooms you werefamiliar with.
C: The cl-classrooms are very different too because some of them were(1.0) designed for (0.5) two hundred two hundred fifty students andsome of them just for a small group of ten twenty people.
I: Mm mm all right.
[Candidate 27: Tape description]* V: ... Imagine that somebody is coming to visit you at work and they
have never been there before. You must (0.5) one, describe to themthe external appearance and the location of the building in which youwork. Two, describe the internal layout of the building for example,the number of floors, the location of your office or work area.Three, describe the room in which you work. (0.8) You now have oneminute to think about what you will say. You should respond to allthree questions. Begin speaking after the beep. You will have twominutes to respond. {1 minute} beep
C: {1.2} Well I’m working in the building of the English language centreof RMIT. It’s located on 560 Elizabeth street. You should go alongthe Elizabeth street and you’ll see the sign, blue sign saying er(0.5) English learning centre RMIT. Er this building is three storeyand I’m working on the second floor. You (0.9) you going upstairs tothe second floor and er going along the corridor and then turn (0.8)on the right and you’ll see my room in the front of you with thenumber 206. Uh (0.9) the building (0.4) where I work (0.4) erdoesn’t have the ve – very interesting features, it’s just look likeother buildings in – on the street, er you can recognise it easier bythe (side?) that I told you before, hmm, there are (0.3) three (0.5)- it is three storey building, there are three floors, and er (2.2)er (0.8) well (0.7) what could I (2.40 %location% (0.8) er (0.7) myoffice located in the middle of the floor, it’s in the middle of thecorridor, it’s very suitable location, there are - there is airconditioner in my room so you always feel comfortable in my premises(cut off by recorded voice)
5 Trial 1: The analysis of candidate language output
85
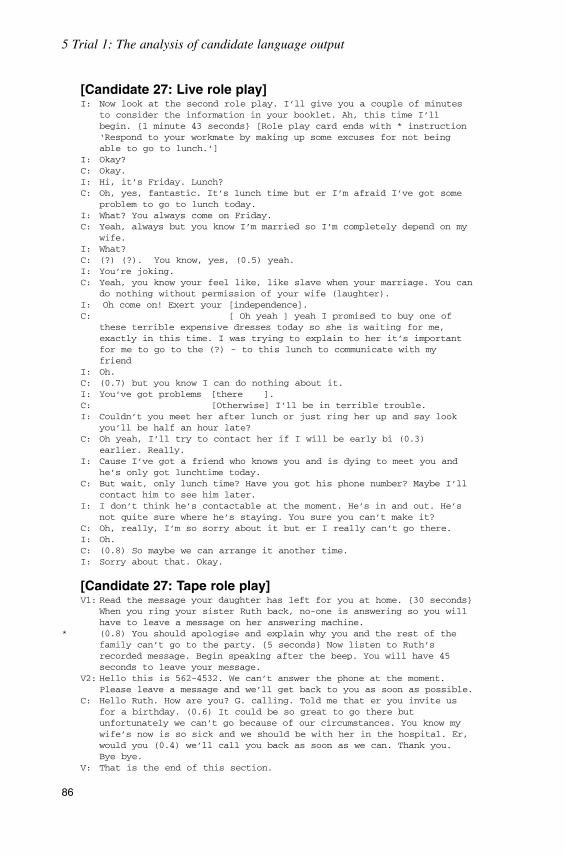
[Candidate 27: Live role play]I: Now look at the second role play. I’ll give you a couple of minutes
to consider the information in your booklet. Ah, this time I’llbegin. {1 minute 43 seconds} [Role play card ends with * instruction‘Respond to your workmate by making up some excuses for not beingable to go to lunch.’]
I: Okay?C: Okay.I: Hi, it’s Friday. Lunch?C: Oh, yes, fantastic. It’s lunch time but er I’m afraid I’ve got some
problem to go to lunch today.I: What? You always come on Friday.C: Yeah, always but you know I’m married so I’m completely depend on my
wife.I: What?C: (?) (?). You know, yes, (0.5) yeah.I: You’re joking.C: Yeah, you know your feel like, like slave when your marriage. You can
do nothing without permission of your wife (laughter).I: Oh come on! Exert your [independence].C: [ Oh yeah ] yeah I promised to buy one of
these terrible expensive dresses today so she is waiting for me,exactly in this time. I was trying to explain to her it’s importantfor me to go to the (?) - to this lunch to communicate with myfriend
I: Oh.C: (0.7) but you know I can do nothing about it.I: You’ve got problems [there ].C: [Otherwise] I’ll be in terrible trouble.I: Couldn’t you meet her after lunch or just ring her up and say look
you’ll be half an hour late?C: Oh yeah, I’ll try to contact her if I will be early bi (0.3)
earlier. Really.I: Cause I’ve got a friend who knows you and is dying to meet you and
he’s only got lunchtime today.C: But wait, only lunch time? Have you got his phone number? Maybe I’ll
contact him to see him later.I: I don’t think he’s contactable at the moment. He’s in and out. He’s
not quite sure where he’s staying. You sure you can’t make it?C: Oh, really, I’m so sorry about it but er I really can’t go there.I: Oh.C: (0.8) So maybe we can arrange it another time.I: Sorry about that. Okay.
[Candidate 27: Tape role play]V1: Read the message your daughter has left for you at home. {30 seconds}
When you ring your sister Ruth back, no-one is answering so you willhave to leave a message on her answering machine.
* (0.8) You should apologise and explain why you and the rest of thefamily can’t go to the party. {5 seconds} Now listen to Ruth’srecorded message. Begin speaking after the beep. You will have 45seconds to leave your message.
V2: Hello this is 562-4532. We can’t answer the phone at the moment.Please leave a message and we’ll get back to you as soon as possible.
C: Hello Ruth. How are you? G. calling. Told me that er you invite usfor a birthday. (0.6) It could be so great to go there butunfortunately we can’t go because of our circumstances. You know mywife’s now is so sick and we should be with her in the hospital. Er,would you (0.4) we’ll call you back as soon as we can. Thank you.Bye bye.
V: That is the end of this section.
5 Trial 1: The analysis of candidate language output
86

Genre
In discourse analysis the term genre refers to a particular class of speechevents which share distinctive characteristics such as prayers, sermons,conversations and speeches. In Shohamy’s (1994) study the genre of the OPIwas found to be a ‘conversational interview’ while the genre of the SOPI wasa ‘reporting monologue’.
The genre of the description, narration and discussion tasks in bothversions of the access: oral interaction sub-test was essentially a reporting ornarrative ‘monologue’. Candidates responded to a series of scripted promptswith either minimal verbal feedback (the live version) or none at all (the tapeversion). The excerpts from candidate 27’s performance on the live and tapedescription task (quoted above) illustrate the similarity between the twoversions in this respect. While the tape role play was also a monologue, thelive role play took the form of a conversation. Again, candidate 27’sperformances on these two tasks (quoted above) illustrate this difference.
Speech moves
Speech moves refer to units of spoken discourse which may be smaller thanan utterance. In Shohamy’s (1994) study the analysis of speech movesfocused particularly on the presence or absence of expansions andelaborations in test taker responses beyond the immediate requirements of thetest questions or tasks. She found a much higher incidence of expansion andelaboration beyond the specific questions (such as negotiations for meaningand creating new directions in the discourse) on the OPI than on the SOPI,where test takers mostly restricted their responses to reporting and describingwhat was directly relevant to the task at hand with little if any additionalinformation.
In the ‘monologic’ tasks (i.e. the description, narration and discussiontasks) on both versions of the access: oral interaction sub-test, candidateresponses rarely included expansions and elaborations beyond therequirements of the assigned tasks. In the case of the live version this mayseem surprising given its interactive potential. However, it needs to beremembered that interlocutors were under instruction to limit theircontribution to the script assigned to them and not to encourage furtherdiscussion in all tasks except the live role play. In addition, the rhetoricalstructure of this live test (i.e., task – performance – new task – newperformance) may not have been as conducive to the kinds of expansions andelaborations reported by Shohamy (1994) on the Hebrew OPI whereparticipants engage in a more fluid, interactive conversational interview. Thefollowing examples illustrate the parity between responses to the matched‘monologic’ tasks on the live and tape versions. The beginning of the
5 Trial 1: The analysis of candidate language output
87

candidate’s response in each instance is asterisked. Firstly, the more ‘closed’narration task for candidate 2:
[Candidate 2: Live narration]I: ...I’m now going to give you a minute to look at the pictures and
think about your story. When you’ve had time I’ll ask you to start.{30 seconds}
C: So I can use some of the pictures.I: MmmC: and can start.I: So A. what happened? Why are you so late arriving tonight?
* C: Umm. (O.7) When I was riding a car and my car umm was um get intothe problem. Is there something wrong which I don’t know. I didn’tknow what were happening so I get out of the car and tried to –tried to fix it up which I couldn’t do it so (0.6)
I: MmmC: um behind me there’s a house but it’s um- it’s very dark inside but
I tried to um um I approaching and tried to knock the door andhopefully is there so – is somebody there. (0.7) Umm when I knockedthe doors there was no answer. Umm I was try my best but it’s umnothing happen – it’s nothing happen so I um – I come back to my carumm and try – I was trying to fix it again but it also doesn’t work.(0.5) Um I was standing next to my car and er mm far away anothercar approaching to my car and because ah my cars is um doesn’t havelight show another car would hit by another car. Mm (1.4) mm (0.8) soum [I went - ]
I: [That’s OK]C: I was get into trouble so ah I was arrive very late -late.I: Good good thanks A.
[Candidate 2: Tape narration]V: ... You now have one minute to look at the pictures and think about
the story. Begin after you hear the beep. You have two minutes totell your story. (1 minute) beep
* C: I was walk – I was walking on the road. (0.7) I didn’t see a car sothe, the driver, um, (right?) (again?) and hit in the, er, in theback of me. I was falling down. I was sitting on the crow and thecar hit me again. Mm the car was um absolutely um damage. Sure thelady come to ask me what was happened. (0.6) I told her I was hit bythe car and see – she, she went to the telephone box nears that andshe called the ambulant. (0.5) Minute later the ambulant arrive butthe ambulant um, um, the staff who sitting inside er ambulant saw meand says um I’m worse than, – I was, – I didn’t hurt sho and umanother truck come and pick up the damaged car. (0.4) Um, I was stillsitting on the road and the truck um pick up the car and (run?)away. I was sitting there and think um who was ... um, I don’t - Iwas ... um the car, the damage car was repair. I still sitting onthe road and didn’t know (whas?) (wa?) happening.
Secondly, the more ‘open’ discussion task for candidate 13, again comparingthe live and tape versions:
5 Trial 1: The analysis of candidate language output
88

[Candidate 13: Live discussion]I: ... Question one. What qualifications and/or experience are necessary
to enter your profession?* C: Uh, to enter my profession there - you need to have at least ah
- you have to - you should finish ah post graduates level ahI: MmC: means ah master degree and especially Bachelor of Commerce in my
field of study [(?) (?)]I: [ Okay ]C: Yes.I: Can you describe some wa (0.7) some of the ways work is changing in
your profession?* C: Mm. In the past ah most of the work wor - most of the task is
emphasi - was empha - emphasi on er teachingI: Mm hmm.C: but ah about - from about last ten year on until, until now ah the
concept of the work is change. Ah, now we, we not only emphasi on mmteaching but also in research
I: Mm hmmC: so that there - there - three (1.0) there - so that we, we can get
ah more knowledge and more experience and can ah transfer this otherknowledge and experience to the student.
I: Okay. Very good.C: Yes.I: What experience do you have of working independently and as part of a
team?* C: Yes, I have mos er (0.7), I have both experience ah working
independently and working as a group. I prefer working ahindependently. Ha.
I: Mm.C: Ha.I: Quite.C: because I think mm, we, we no need to depend on other person in our
group sometime if we work in a group, in, they ah, they might (0.8)it’s quite difficult to, to, to, separate the task - how much you,you are, you are learn, how much I have to do
I: Mm hmm.C: and sometime I get (?) you have to do [it ].I: [yes]C: have to?I: Ha ha.C: so I, I feel its, its, my - for me it’s, I prefer to work er,
independently.I: Okay. The last question. We have all worked with people we admire.
Please describe to me a colleague whom you have respected andadmired.
* C: Yes. I have mm one of my er lecturer and now is my colleague. Ah,he, him er I respect and er ad - admire him. Ah, he is very kind andnormally work is the high (pollity(?)) and he alway ah suggest
I: [cough cough]C: he’s in the suggest means very useful, ah useful (?) for things.I: Mm hmm.C: but I (?) (?) (?) (?) (?) (?). Yes.I: Okay.C: Yeah.
5 Trial 1: The analysis of candidate language output
89

[Candidate 13: Tape discussion]V: ...You will have one minute to complete your answer for each
question, and then you will hear the next question. (1.0) Questionone. What qualifications and or experience are necessary to enteryour profession. beep
* C: To enter my profession you should have er (0.5) the second degree. Imean you should have ah (0.6) you should finish mm post graduatestudy level ah especially in Agricultural Economics. And for theexperience er is not necessary if you ah finish ahthe – er you second degree.
V: Question two. Describe some of the ways work is changing in yourprofession. beep
* C: The changing of the work in my profession is er the – is mainly aboutthe ah the emphasise on ah teaching. Now it (0.8) before – in theprevious ah we emphasise on teaching but er now-a-day er it’s change.We have to get more experience in the research work so that we cangain more knowledge and experience to teach the student and that’swhy now we are keep equally important or on teaching and research.
V: Question three. What experience do you have of working independentlyand as part of a team? beep
* C: Er, I have both – I have experience both in the case of mm workingindependently and working in a group. Mm, in a teaching some subjectI, I (0.5) t – ah teach er (solely?) er nobody help. But sometime,some subject, I have to ah teach and share with the other teacher –other lecturer. In my experience I think er it’s (0.9) there’s somemm benefit and er disadvantage in working in group or working inindependently. Ah, if you’re working independently at some time weare f – we, we are more freely, we work ah more convenience by –
V: Question four. Describe a colleague you have admired. beep* C: Ah, I have admired one of my colleagues. Ah, he is ah my former
lecturer but now he’s the senior staff in m, my university. He alwayworks ah in the (?) (?) ah (?) and his is very kind and he alwaysuggest – recommend to me about what I should do and what I shouldnot do which is very er useful for me in the working.
V: That is the end of this section.
Thus, in both the more ‘closed’ narration task and the more ‘open’discussion task it is apparent that there was little expansion and/or elaborationbeyond the specified requirements. However, it is worth noting that the‘monologic’ tape tasks generally elicited as much discourse as their livecounterparts possibly due to the access: test developers’, careful attempts tobalance the demands of matching tasks across the two versions. This contrastswith Shohamy’s (1994) study where responses on the SOPI seem to have beenoften much shorter than on the OPI.
In contrast to the ‘monologic’ tasks, the role play segment produced muchgreater expansion and hence more discourse than its counterpart in the tapeversion because of its dialogic nature and the fact that interlocutors were lessconstrained on this task. The transcripts of the live and tape role plays forCandidate 5 reproduced below clearly illustrate this difference. The excerptfrom the live version here also demonstrates that much greater expansion andelaboration including negotiation of meaning were involved on the role playtask than on any of the other live tasks. All of the candidate’s contributionsfrom the two excerpts are asterisked.
5 Trial 1: The analysis of candidate language output
90

[Candidate 5: Live role play]I: ... Okay, now look at the um second role play and I’ll give you a
couple of minutes to consider the information.{1 min 6 secs}
I: Okay?C: Yeah.I: All right, this, this time C. I will begin.
Hi C., are you all right for lunch today?* C: Er, mm yes but you know I have a, a problem today.
I: Mm.* C: I mean I must go and carry out my children to the doctor. I have an
appointment. It is very important to them soI: Mm. But, I’ve, I’ve got someone coming from your home town specially
just to see you. It’s a surprise for you, and you’ve just got tocome. Can’t you make the, the appointment later?
* C: Mm. Hm. I don’t know because er (0.8), because you know, we can’t er,put off
I: Mm* C: this appointment. We have to enter my a er my wife is, is sick just
now.I: She’s sick?
* C: Yes [yes]I: [oh]
* C: she’s sick. She can’t carry out my children so she ring me. Veryupset.
I: Mm. You er, you can’t find another way around itC: (?)I: because we really would love to have lunch [with you].
* C: [Yes I ] appreciate(area?), yes I appreciate this, this time. I would be, I would, Iwould be very happy to lunch with you but (?), (0.6) health of mychildren is very important to us.
I: Oh, all right I understand that and we’ll have to see you anothertime. I hope they are okay soon.
[Candidate 5: Tape role play]V1: ...Now listen to Ruth’s recorded message. (0.4) Begin speaking after
the beep. (1.0) You will have 45 seconds to leave your message.V2: Hello (0.2) this is 562-4532. (0.4) We can’t answer the phone at the
moment. (0.5) Please leave a message and we’ll get back to you assoon as possible.
* C: Er, sorry we can’t mm er, we are very sorry but we can’t attend youmm you er birthday er (1.0) because my wife is very sick and we haveto stay at home. I wish you very er, I wish you nice birthday (0.9)and all very - all the best to Paul. Thank you very much.
V: That is the end of this section.
5 Trial 1: The analysis of candidate language output
91
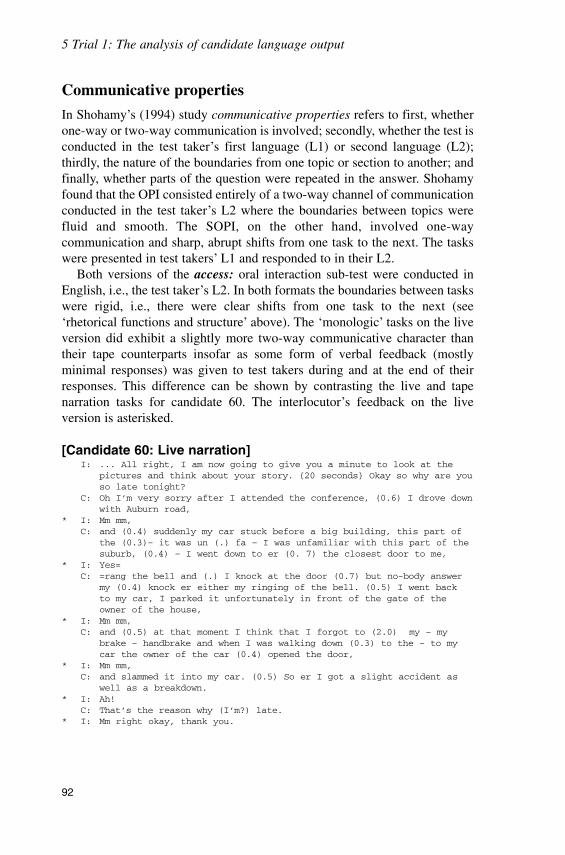
Communicative properties
In Shohamy’s (1994) study communicative properties refers to first, whetherone-way or two-way communication is involved; secondly, whether the test isconducted in the test taker’s first language (L1) or second language (L2);thirdly, the nature of the boundaries from one topic or section to another; andfinally, whether parts of the question were repeated in the answer. Shohamyfound that the OPI consisted entirely of a two-way channel of communicationconducted in the test taker’s L2 where the boundaries between topics werefluid and smooth. The SOPI, on the other hand, involved one-waycommunication and sharp, abrupt shifts from one task to the next. The taskswere presented in test takers’ L1 and responded to in their L2.
Both versions of the access: oral interaction sub-test were conducted inEnglish, i.e., the test taker’s L2. In both formats the boundaries between taskswere rigid, i.e., there were clear shifts from one task to the next (see‘rhetorical functions and structure’ above). The ‘monologic’ tasks on the liveversion did exhibit a slightly more two-way communicative character thantheir tape counterparts insofar as some form of verbal feedback (mostlyminimal responses) was given to test takers during and at the end of theirresponses. This difference can be shown by contrasting the live and tapenarration tasks for candidate 60. The interlocutor’s feedback on the liveversion is asterisked.
[Candidate 60: Live narration]I: ... All right, I am now going to give you a minute to look at the
pictures and think about your story. {20 seconds} Okay so why are youso late tonight?
C: Oh I’m very sorry after I attended the conference, (0.6) I drove downwith Auburn road,
* I: Mm mm,C: and (0.4) suddenly my car stuck before a big building, this part of
the (0.3)– it was un (.) fa – I was unfamiliar with this part of thesuburb, (0.4) – I went down to er (0. 7) the closest door to me,
* I: Yes=C: =rang the bell and (.) I knock at the door (0.7) but no-body answer
my (0.4) knock er either my ringing of the bell. (0.5) I went backto my car, I parked it unfortunately in front of the gate of theowner of the house,
* I: Mm mm,C: and (0.5) at that moment I think that I forgot to (2.0) my – my
brake – handbrake and when I was walking down (0.3) to the – to mycar the owner of the car (0.4) opened the door,
* I: Mm mm,C: and slammed it into my car. (0.5) So er I got a slight accident as
well as a breakdown.* I: Ah!
C: That’s the reason why (I’m?) late.* I: Mm right okay, thank you.
5 Trial 1: The analysis of candidate language output
92

[Candidate 60: Tape narration]V: ... You now have one minute to look at the pictures and think about
the story. Begin after you hear the beep. You have two minutes totell your story. (1 minute) beep
C: {2 seconds} I was er just turning to the left when I was er (0.5)going forwards (0.5) (the car?) was suddenly (0.3) came into my way(0.4) (?) (0.5) and I was so shocked but fortunately (0.5) I ran tothe telephone and: (0.4) phoned the ambulance (0.6) to pick him up.The thing is that er I was so fortunate I didn’t er (.) bumped him(0.5) dead. (0.8) And I phoned the ambulance and ambulance was erthere in minutes and also the breakdown to pick my car up. (1.2) Iwas so (0.7) happy to see that he was (0.5) not unconscious, he wasjust (.) hit down. So er I think that er he will cover – recoverwhen I take him to the hospital. (0.4) The ambulance came after the(0.8) – I phoned the ambulance but by the time the garage was there– the man from the garage, (0.5) the ambulance was not there. (0.3)So er (0.6) the problem is that er the ambulance was late to takehim to the hospital. (0.6) I don’t know exactly (1.2) what is theproblem with the ambulance (0.3) that it er (0.5) didn’t turn up. Iwas waiting for (0.2) him (0.7) er at the spot where uh had theaccident. (1.8) So by the time when the (1.2) breakdown was therethe ambulance didn’t turn out so er I wait there (0.2) at the spotwhere the accident happened. {9 seconds}
Finally, as illustrated in the contrast between candidate 5’s live and taperesponses in terms of speech moves (see previous sub-section), the role playtasks differed in that the live task was essentially dialogic, allowing for‘authentic’ interaction between candidate and interlocutor, while its tapeequivalent remained entirely monologic.
Discourse strategies
In Shohamy’s (1994) study discourse strategies refers to the proceduresadopted by test takers to cope with the communicative demands of the testingsituation. Shohamy reported that test takers used a greater range of discoursestrategies on the OPI than on the SOPI. On the OPI these strategies includeddeliberation, avoiding direct answers, hesitation, self-correction, disagreeing,qualifying, switching to L1 for communicative purposes and demands forclarification. On the SOPI these strategies were restricted to paraphrasing,repetition of phrases in the eliciting questions, switching to L1, self-correctionand silence when no answer was available.
In the access: oral interaction sub-test the discourse strategies employed bytest takers appeared to be very similar in the two versions for both the‘monologic’ and role play tasks. These strategies were mostly deliberation,hesitation and self-correction. In some instances, however, there wererequests for clarification on the live version and longer periods of hesitationon the tape version. Both of these features can be illustrated by comparingmatching excerpts from candidate 50’s responses on the live and tapediscussion tasks:
5 Trial 1: The analysis of candidate language output
93

[Candidate 50: Live discussion (part)]I: And ah we have all worked with people we admire. Please describe to
me a colleague whom you have respected and admired.* C: Just a colleague?
I: Mm. Oh anyone that* C: Ah!
I: [you’ve] ah* C: [(?) of] my friends in (?) ah just one year older than me but he got
much more experience than me. He is Chinese, English and Chinese; heis at the – his studies good. (0.6) He graduated from Calin –Californian University, yeah. And as the – not like many officesgraduate ah he’s ah work, he’s ah well provide.
I Mm.
[Candidate 50: Tape discussion (part)]V: Question four. Describe a colleague you have admired. beep
* C: I have a colleague from – graduated from University of California inthe US (1.0) A and (1.5) he always encouraged me to do better andbetter and don't worry about my qualification. (1.8) Even though hegraduated from California he persuade me to do better as well as h-him because in his opinion we are the same different only (0.9) theuniversity we come from er don’t worry about the (1.4) (?) because weare the same you are the same with me as well so don’t worry aboutyour (1.2) domestic cred – university. And (0.9) he is one year olderthan me but he has ah good skill in the finance and management aswell. I admire him.
V: That is the end of this section.
Content and topics of discourse
In Shohamy’s (1994) study the range of topics covered in the OPI dependedon the test taker’s level of proficiency. The topics covered with lowproficiency test takers were mostly personal, even trivial, while those coveredwith high proficiency test takers included work, politics and educationalsubjects. On the SOPI the same topics covering a broad range of personal,social, work and educational issues were included for all test takers.
In the access: oral interaction sub-test (as in the SOPI) the content andtopics of the tasks were the same within each of the two versions for all testtakers irrespective of their proficiency level on all four matching tasks. Thetopics in the four tasks selected for this study included educational, social andoccupational issues on both versions. Other parts of the two versions includedtopics on recreation, housing and the environment. The range of topics testtakers were required to address was therefore both broad and uniform withineach version. However, only in one of the four matching tasks – thediscussion – was the topic identical across the two versions. For the otherthree tasks the topics were similar (see Tables 5.1 and 5.2 above).
5 Trial 1: The analysis of candidate language output
94
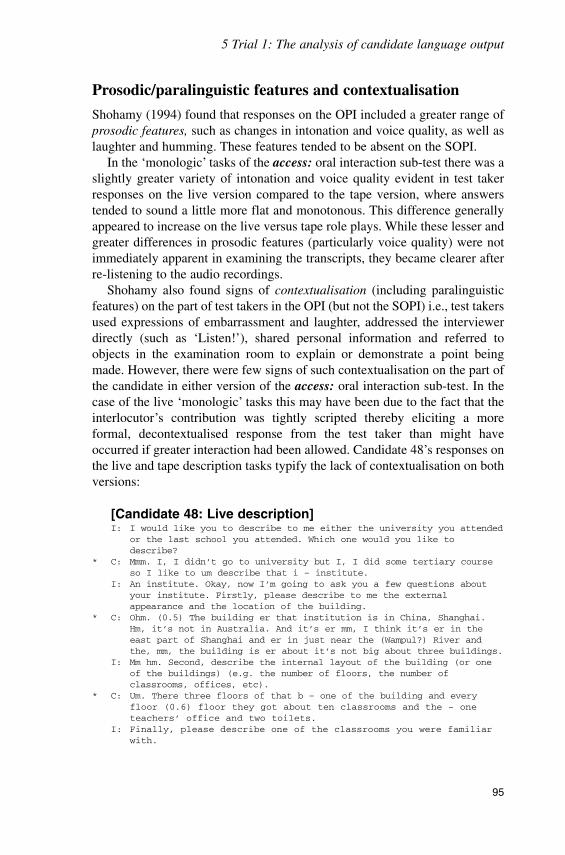
Prosodic/paralinguistic features and contextualisation
Shohamy (1994) found that responses on the OPI included a greater range ofprosodic features, such as changes in intonation and voice quality, as well aslaughter and humming. These features tended to be absent on the SOPI.
In the ‘monologic’ tasks of the access: oral interaction sub-test there was aslightly greater variety of intonation and voice quality evident in test takerresponses on the live version compared to the tape version, where answerstended to sound a little more flat and monotonous. This difference generallyappeared to increase on the live versus tape role plays. While these lesser andgreater differences in prosodic features (particularly voice quality) were notimmediately apparent in examining the transcripts, they became clearer afterre-listening to the audio recordings.
Shohamy also found signs of contextualisation (including paralinguisticfeatures) on the part of test takers in the OPI (but not the SOPI) i.e., test takersused expressions of embarrassment and laughter, addressed the interviewerdirectly (such as ‘Listen!’), shared personal information and referred toobjects in the examination room to explain or demonstrate a point beingmade. However, there were few signs of such contextualisation on the part ofthe candidate in either version of the access: oral interaction sub-test. In thecase of the live ‘monologic’ tasks this may have been due to the fact that theinterlocutor’s contribution was tightly scripted thereby eliciting a moreformal, decontextualised response from the test taker than might haveoccurred if greater interaction had been allowed. Candidate 48’s responses onthe live and tape description tasks typify the lack of contextualisation on bothversions:
[Candidate 48: Live description]I: I would like you to describe to me either the university you attended
or the last school you attended. Which one would you like todescribe?
* C: Mmm. I, I didn’t go to university but I, I did some tertiary courseso I like to um describe that i – institute.
I: An institute. Okay, now I’m going to ask you a few questions aboutyour institute. Firstly, please describe to me the externalappearance and the location of the building.
* C: Ohm. (0.5) The building er that institution is in China, Shanghai.Hm, it’s not in Australia. And it’s er mm, I think it’s er in theeast part of Shanghai and er in just near the (Wampul?) River andthe, mm, the building is er about it’s not big about three buildings.
I: Mm hm. Second, describe the internal layout of the building (or oneof the buildings) (e.g. the number of floors, the number ofclassrooms, offices, etc).
* C: Um. There three floors of that b – one of the building and everyfloor (0.6) floor they got about ten classrooms and the – oneteachers’ office and two toilets.
I: Finally, please describe one of the classrooms you were familiarwith.
5 Trial 1: The analysis of candidate language output
95

* C: Mm. The classroom is about er fifty, fifty square metres and er infront of the classroom there is blackboard and er about er fortyseats and twenty desks and er two students sit together and share onedesk and er there are six windows both side of the classroom.
I: Thank you.
[Candidate 48: Tape description]V: ... Begin speaking after the beep. You will have two minutes to
respond. {1 minute} beep* C: This is the food processing industry. It’s ah located on the Mainpole
street oh at Bayswater. (0.9) Where you go into the company the f –on the right your side of the building is the men and the ladieschanging room a – and (0.8) when you go into the main building infront of you this is a packing area and past packing area there is ?fitting room and I work in that area. There’s only one floor (2.4)and and er sometimes they are ten people in the in – working on theline but er sometimes only three people. This depend on products.When you go into the working area you have to change your uniform andwear ca- hat and a boots because this is the food industry.
The tape role play displayed the same lack of contextualisation as the othertape tasks. In the case of the live role play there appeared to be only a slightincrease in the level of contextualisation (e.g. laughter, embarrassment)perhaps because both participants were acting out prescribed roles and theirlevel of personal involvement was therefore fairly low. The live and tape roleplay performances of candidates 5 and 27 quoted above are illustrative of thegeneral lack of contextualisation on these tasks.
Types of speech functions
The term speech function refers to the purpose(s) for which an utterance isused. Functions are often described as categories of behaviour such asrequesting, apologising, complaining and congratulating. Shohamy (1994)found that test takers used a much wider range of speech functions, includingrequesting clarification, agreeing and disagreeing, sharing personalinformation and negotiating on the OPI. The functions on the SOPI weremainly restricted to reporting, describing and narrating.
The speech functions identified in test taker responses on the live and tape‘monologic’ tasks of the access: oral interaction sub-test were very similarand included describing, narrating, negotiating, explaining, making excuses,making suggestions, persuading, giving opinions and speculating. However,on the live version, there were also occasional requests for clarification (see,for example, the excerpt from candidate 50 under Discourse strategies above)as well as negotiation about the focus of the response, particularly in thedescription task where test takers were given a choice of topic. The followingexcerpt from the beginning of candidate 53’s answer on this task illustratesthe kind of negotiation which took place at this point:
5 Trial 1: The analysis of candidate language output
96

[Candidate 53: Live description (part)]I: I would like you to describe to me either the university you attended
or the last school you attended.C: Yes, right.I: Which one would you like to describe?
* C: I can describe about er any university here? I had been to Monash ona couple of days.
* I: Okay, now I’m going to ask you a few questions about your university,about Monash.
* C: I’m not doing any course there.* I: No, but you, you went there.* C: Yes.* I: Attended.* C: Just, just like that with somebody else who is doing a course. I went
with him two or three times.* I: Okay. Er, well that’s going to be difficult. What about in, in your
country in India? Did you go to university there (?) (?) (?) (?).* C: I did (1.4) I did training from India.* I: Right.* C: about thirteen years back.* I: Right. Can you remember the, the institution you attended.* C: Yeah, yeah I can remember.
In respect to the live and tape role plays the range of speech functionsdiffered insofar as the live role play also included disagreeing, negotiating asolution and reaching a compromise. Again the performances of candidates 5and 27 (quoted above) illustrate this difference.
Discourse markers
Discourse markers refer to words or phrases which help to provide coherenceand cohesion in a text. On the OPI Shohamy (1994) found test takers used avariety of these markers which included, but were not limited to, ‘and’, ‘but’,‘although’, ‘however’, and ‘it depends’. On the SOPI the use of markers wasmainly restricted to ‘and’, ‘but’, ‘although’ and ‘however’.
In the access: ‘monologic’ tasks an equally broad range of discoursemarkers was used by test takers on the two versions, including connectorssuch as ‘but’, ‘and’, ‘however’, ‘although’, ‘well’, ‘maybe’, ‘so’, ‘first’,‘then’, ‘finally’, ‘now’, ‘then’ and ‘anyway’. However, there appears to havebeen a slight tendency on the tape version to use them less frequently (seeprevious examples). The live and tape role play tasks were also similar in thisrespect except that in the live role play other more conversational markerssuch as ‘I mean’, ‘y’know’ and ‘anyway’ were also used.
Register
The term register is used by Shohamy (1994) to refer to differences in speechformality. She found that there were no significant register shifts during thecourse of either the OPI or the SOPI, although there was a slight change tomore formal speech in one part of the SOPI.
5 Trial 1: The analysis of candidate language output
97

In the access: live and tape ‘monologic’ tasks there were very few registershifts. On the whole the register of test taker responses on these tasks seemedto be very similar, i.e. quite formal. The excerpts included under the previouscategories illustrate this parity. However, on the live role play there was oftena shift to a more informal register on the part of both the candidate andinterlocutor which was appropriate, given the nature of the task. Test takerresponses on the tape role play, however, remained quite formal even thoughthe answering machine message was supposed to be left for a member of theimmediate family. Candidate 40’s performance on the live and tape role playtasks clearly illustrates this difference:
[Candidate 40: Live role play]I: Now look at the second role play. I will give you a couple of
minutes to consider the information. {53 seconds} This time I willbegin.
I: Oh hello E. Er, coming to lunch today?* C: Oh I'm really sorry. I’m unable to make it because I’ve got some
urgent shopping to do. I’ve got to catch up with the weekly shopping.I: Oh, that’s no good E. Um, you know we always get together on Fridays.
You’ve got to come this week.* C: Yeah, it is true I normally come (0.7) but this Friday I am really
sorry I’m unable to make it because this evening I’ve got – I’minvited over to a friend’s place for a birthday
I: can’t* C: and he can’t do the weekly shopping.
I: Can’t you do it tomorrow on Saturday morning?* C: No, my (0.8) I’ve got only one car. My wife takes the car, she’s
working on Saturdays.I: I’ve er got a particular friend coming er to join us for the lunch
today and um he’s going to be very disappointed about it because heactually comes from your town.
* C: (?) I would like to meet him really but er unfortunately I am unableto make it today.
I: Mm, you can’t change the time?C: Mm.I: You know that can wait.
* C: It’s, it’s ju – it’s really difficult to change it and almostimpossible unless I wouldn’t make a fuss over it. You know how Ialways join the parties every week.
I: I, I know you do. That’s why I relied on your being there today andinvited the friend along.
* C: Yes, but it’s, it’s really something I wouldn’t ah, manage thisFriday. I hope to catch up with you next Friday.
I: Well I hope that he’s still around next Friday.* C: Yes, let’s hope so.
I: Okay E.* C: Yeah, thank you.
[Candidate 40: Tape role play]V1: ... Now listen to Ruth’s recorded message. (0.4) Begin speaking after
the beep. (1.0) You will have 45 seconds to leave your message.V2: Hello (0.2) this is 562-4532. (0.4) We can’t answer the phone at the
moment. (0.5) Please leave a message and we’ll get back to you assoon as possible.
5 Trial 1: The analysis of candidate language output
98

* C: Ruth, this is E. speaking. (0.7) Thank you very much for inviting usover to Paul’s birthday party on Saturday the twentieth.Unfortunately (0.6) we are unable to come since we have alreadyanother engagement on the same day. A very close friend of mine hasinvited us over and (0.6) we have already accepted his invitation.(0.4) So thank you very much for calling us over but sorry we won’tbe able to attend.
V: That is the end of this section.
Summary of findings
Table 5.3 below summarises the findings of the study to this point andcompares them with those obtained by Shohamy’s (1994) study of theHebrew OPI and SOPI. For the sake of clarity the results have been reducedto three categories: same, similar and different.
The comparison of discourse features analysed to this point appeared toindicate that there was much greater parity between test taker responses on thelive and tape ‘monologic’ tasks in the access: oral interaction sub-test than inShohamy’s OPI/SOPI study. Thus, the careful efforts of access: testdevelopers to match these tasks (particularly by controlling and limiting theinterlocutor’s contribution on the live version through the use of a script)seemed to have been rewarded in terms of the parity of language obtainedfrom the two versions. However, the findings also suggest that the cost of thisachievement was a certain ‘unnaturalness’ (i.e. stiffness and formality) in testtaker output on the live version. The less controlled live role play, on the otherhand, appears to have elicited language which more closely approximated toconversation than the other live tasks. Yet, the price to be paid for its greater‘authenticity’ seems to have been a sharp lack of comparability with its tapecounterpart. The final stage in the examination of the test taker languageoutput was to conduct a more detailed, quantitative comparison of the twoversions from the perspective of lexical density. This study is reported in thenext section.
5 Trial 1: The analysis of candidate language output
99

Table 5.3
Summary of findings (Discourse Study A):O’Loughlin (2001) and Shohamy (1994)
Category access: live and tape versions Hebrew OPI/SOPI
‘monologic’ tasks role play tasks
Rhetoricalstructure &functions same same differentGenre same different differentSpeechmoves same different differentCommunicativeproperties similar different differentDiscoursestrategies similar similar differentContent/topics similar similar similar
(description &narration)same(discussion)
Prosodicfeatures similar different differentContextualisation same similar differentSpeech functions similar different differentDiscoursemarkers similar similar differentRegister similar different similar
Discourse Study B: Lexical density
Introduction
This study focuses on the remaining category used by Shohamy (1994) incomparing the language produced in the Hebrew OPI and SOPI. Thiscategory is lexical density, which provides a quantitative measure of therelationship between lexical and grammatical items in spoken or writtendiscourse. It is usually expressed simply as the percentage of lexicon in agiven text. Recall from Chapter 2 that Shohamy reported an average lexicaldensity figure of 40% in the OPI compared to 60% on the SOPI. Shohamysuggests that this result indicated that the SOPI elicited a more ‘literate’ type
5 Trial 1: The analysis of candidate language output
100

of language output than the OPI, another important difference between thelanguage samples obtained on the two tests. This study looks at whether thedegree of lexical density differed across the two versions of the access: oralinteraction sub-test.
The structure of this section is as follows: first, the history of lexicaldensity is traced; secondly, the purpose and methodology used in the studyare outlined; and thirdly, the results of the investigation are reported anddiscussed. In the conclusion to the chapter, the implications of the findingsfrom both Study A and Study B for the equivalence of the direct and semi-direct versions of the access: oral interaction test are explored.
Background
The term lexical density was originally coined by Ure (1971) toprovide a measure of the relationship between ‘lexical’ as opposed to‘grammatical’words as a percentage of the total number of words in a text. Onthe basis of her analysis of a wide range of written and spoken texts (N = 64)she found, in general, that the spoken texts had a lexical density of less than40% (ranging from 24% to 43%) and the written texts a density of greater than40% (ranging from 36% to 57%).
Of more direct relevance to the study reported in this chapter was Ure’sfocus on the presence or absence of verbal and non-verbal feedback to themain speaker in the spoken texts. Ure’s (1971: 448) findings indicated that‘feedback was an even more powerful factor in determining lexical densitythan the spoken/written choice’. With only one exception, spoken textswithout feedback (i.e. monologues) all had a lexical density of more than 37%and all of those with feedback (i.e. dialogues) under 36%. Finally, thisresearch also indicated that plannedness may be another importantdeterminant of lexical density, with prepared spoken texts all having a lexicaldensity of 37% or higher.
Ure’s findings are important for the current study as they suggest thatdegree of lexical density is highly responsive to the presence or absenceof feedback in spoken discourse. However, her study is deficient inthat it does not clearly articulate the distinction between ‘lexical’ and‘grammatical’ words and therefore the results should be regarded with somecaution. In addition, it should be noted that different subjects produced thespoken and written data in this study. As Zora and Johns-Lewis (1989)suggest, this is likely to be another source of variation influencing the degreeof lexical density.
Halliday (1985) used lexical density to compare written and spoken textsin English. Like Ure, he demonstrates that written texts typically contain ahigher degree of lexical words than spoken texts. He concludes that thecomplexity of written language is lexical and that of spoken language is
5 Trial 1: The analysis of candidate language output
101

grammatical. He does not, however, examine how the degree of lexicaldensity in a text may also be influenced by other factors such as thoseidentified by Ure.
Halliday provides a useful (albeit fairly limited) framework fordistinguishing between lexical and grammatical items in a text. Grammaticalitems are function words and operate in closed, finite systems in the language.Conversely, lexical items are content words and enter into open sets which areinfinitely extendable. Thus, in English, he suggests, determiners, pronouns,most prepositions, conjunctions and some classes of adverbs are grammaticalitems. Rather oddly, also included in his initial list are finite verbs butelsewhere, in the examples he uses, these are treated as lexical items. In theseexamples the verb forms which are consistently classified as grammaticalitems appear, appropriately enough, to be modals and auxiliaries as well as allforms of the verbs ‘to be’ and ‘to have’. In addition, all pro-forms (not simplypronouns) and interrogative and negative adverbs are consistently labelled asgrammatical. All other adverbs used in the example are treated as lexicalitems.
Halliday (1985: 63) is not prescriptive about this method of classification,acknowledging that there is, in fact, a continuum from lexis into grammar. Heargues that it does not matter so much where the line is drawn provided it isdone consistently. Still, it appears that a detailed taxonomy needs to bedevised in order for this analysis to proceed in a principled fashion. Oneapparent weakness in Halliday’s framework is that the division of items underthe headings lexical and grammatical is made essentially at the sentence levelonly. Important discourse phenomena which occur naturally in speech such asdiscourse markers (words and expressions used to structure discourseincluding linking and sequencing devices), interjections, (e.g. gosh, wow),reactive tokens (yes, no, OK, etc.) as well as lexical and non-lexical filledpauses appear to be largely neglected within this system of classification.
Halliday (1985: 64–5) does, however, make an important modification tothe calculation of lexical density by distinguishing between high and lowfrequency lexical items. High frequency lexical items are those which occureither commonly in the language in general (e.g. in English people, thing,way, do, make, get, be, have and good) or else more than once in an individualtext since repetition reduces the effect of density. In calculating the finallexical density figure the high frequency items are given half the value of thelow frequency ones. This would seem to provide a truer, more fine-grainedestimate of the overall lexical density.
More recent research on lexical density (for example, Stubbs 1986; Hasan1988; Zora and Johns-Lewis 1989) has focused on sources of variation inspoken discourse, particularly discourse form. In Stubbs’ (1986) study, thelexical density figures were lowest for telephone conversations (e.g. 44% forbusiness calls and 45% for calls between friends) and highest for radio
5 Trial 1: The analysis of candidate language output
102

commentaries (e.g. 54% for a commentary on cricket and 56% for one on astate funeral). Zora and Johns-Lewis (1989) report interviews to have a lexicaldensity of 48.03% compared with 46.96% for informal conversations. In bothstudies the subjects were educated native speakers of English.
In a study focusing on discourse variability in native–non-native speakerspoken interaction in and out of the EFL classroom, Hasan (1988) found thatthe mean lexical density per T-unit of the non-native group was substantiallylower when they participated as interviewees in formal interviews (33.67%)compared to formal and informal classroom interactions (38.96% and 40.64%respectively), informal classroom discussions (43.69%) and informalconversations with native speakers outside the classroom (41.60%). Thefigures for the native speaker group, on the other hand, were substantiallyhigher in the formal interviews where they acted as interviewers (47.02%).The formal and informal classroom interactions as well as the informalclassroom discussions in which the native speakers were EFL teachers yieldedfairly similar results (38.25%, 41.15% and 37.97% respectively). Finally, thefigure for informal conversations with non-teacher native speakers outside theclassroom (42.48%) was almost identical to that obtained for the non-nativespeakers. In general, these findings suggest that the context or setting, the typeof interaction and the role of the speakers all influence the degree of lexicaldensity.
It is important to note that Stubbs and Zora and Johns-Lewis reportconsiderably higher lexical density figures than does Ure for her spoken data.Zora and Johns-Lewis list eight possible sources of variation to account forthe different percentages reported in the studies cited here: 1) the basis forcalculating lexical density, i.e. differences in allocating items to lexical asopposed to grammatical classes; 2) expected interruption and length ofspeaking turn i.e. texts of a more monologic nature may predispose speakersto a higher degree of lexical density; 3) the function of component units oftext; 4) self-consciousness/self-monitoring; 5) personal attributes; 6) groupattributes; 7) planning time; and 8) topic.
As noted earlier, Shohamy’s (1994) comparative study of the OPI andSOPI indicated that the SOPI elicited language which was of a significantlyhigher lexical density than the OPI. This would appear to reflect the fact thatthe OPI was a much more interactive language event in which verbal and non-verbal feedback played an important role. However, her analysis is perhapssomewhat limited insofar as it takes no account of other important variablesapart from test format (i.e. direct or semi-direct) which may affect lexicaldensity such as task type and plannedness. Furthermore, in relation to thevariables of personal and group attributes suggested by Zora and Johns-Lewis(1989), it is unclear whether the samples analysed by Shohamy wereproduced by the same subjects. In addition, there is a lack of explicitnessabout her method of calculating lexical density, i.e. how precisely lexical and
5 Trial 1: The analysis of candidate language output
103

grammatical items were differentiated and whether high and low frequencylexical items were weighted differently for the analysis.
Research hypotheses
The present study focuses mainly on the effects of two key variablespotentially having an input on candidate output in the access: oral interactionsub-test – first, test format (i.e. live or tape-mediated) and secondly, task type.It addresses this question by examining the degree of lexical density whichcharacterised selected language samples from the two versions of this sub-testin the December 1992 trial. In order to explore these issues the followingexperimental hypotheses were formulated:
HA1: There is an effect on lexical density for test format.
HA2: There is an effect on lexical density for task type.
HA3: There is an interaction effect on lexical density for test formatand task type.
The closely matched format of the two versions permitted a perhaps moredirect, tighter comparison of the language samples than in Shohamy’s (1994)study of the Hebrew OPI and SOPI (described in detail in Chapter 2), at leastat the micro-analytic level. In the case of the access: oral interaction sub-testthere was a broad range of matching tasks which attempted to elicit a similarrange of language functions in each case. The structure of both versions wasessentially the same, i.e. task – performance – new task – new performance.While this is also the case in the SOPI test, the structure of the OPI is basicallyquestion – answer – question – answer.
Method
This study used the same data as in Discourse Study A, i.e. the transcriptsobtained from a stratified sample of 20 candidates on the four matching tasks(description, narration, discussion and role play) under the two test conditions(live and tape).
In the studies cited previously in this chapter it is the word (usedsynonymously with the term item) that has been adopted as the basic unit oflexical density. However, while this may be a satisfactory method for anapproximate comparison of the relative weight of lexis and grammar in a text,it is proposed that a more refined approach to this analysis would be to focuson the notion of a linguistic item as the more appropriate unit of measurementand to differentiate it from the concept of the word.
There is, in fact, no one-to-one correspondence between linguistic itemsand words in English. An item may consist of more than one word e.g. multi-word verbs such as catch up on, phrasal verbs such as drop in – and idioms
5 Trial 1: The analysis of candidate language output
104

such as kick the bucket. Conversely, a word may consist of more than one iteme.g. contractions such as they’re and isn’t. In addition, different items may berealised by the same word, e.g. lap: lap1 (noun or verb as in a race), lap2(verb as in ‘the cat laps the milk’) and lap3 (noun as in ‘sit on my lap’). Onthe other hand, different words may be realised by the one lexical item (e.g.different and difference are alternate word forms of differ). Finally, the term‘item’ (unlike the term ‘word’) does not so readily exclude what aresometimes called ‘particles’ such as oh and mm, which can play importantfunctions (apart from simply expressing hesitation) in spoken discourse. Inthis study, therefore, it is linguistic items which were counted to measurelexical density in the language samples collected.
A preliminary taxonomy of lexical and grammatical items was drawn upbased on a framework devised by Halliday (1985). There were threecategories: grammatical items, high frequency lexical items and lowfrequency lexical items. In order to distinguish high and low frequency lexicalitems the 700 most frequently used words in English (excluding those deemedto be grammatical items), as identified in the COBUILD Dictionary project(see Willis and Willis 1988), were classified as high frequency lexical itemsand all others as low frequency items.
The framework was then refined after attempting the analysis on a limitednumber of the language samples. In order to confirm the viability androbustness of the revised classification system, two independent counts oflexical and grammatical items for three of the candidates on both versions ofthe test were carried out by the author and a research assistant. The frameworkwas further refined following this stage, and then the final version (see Table5.4 below) was used to analyse the live and tape-based audio recordings of all20 candidates. All stages of this process were carried out manually rather thanautomatically using a computer program. As Zora and Johns-Lewis (1989)suggest, the manual approach appears to be more accurate since each item isanalysed by the researcher in its real context.
In carrying out the analysis all phrasal and multi-word verbs were countedas low frequency lexical items since the COBUILD list of high frequencyitems only included single words. In addition, only fully audible items werecounted. In context, partially or completely inaudible items appear in mostcases to have been mispronounced lexical items so that the final lexicaldensity estimates for most of the samples may have been a little lower becauseof the exclusion of these items. Furthermore, since non-lexical filled pauses(e.g. er, um) were so frequently used by all candidates, they were excludedfrom the analysis; it was ultimately considered that their inclusion asgrammatical items might have significantly obscured the relationship betweenlexical and grammatical items in the samples collected for this study. Finally,where candidates used self-repair only the final version of an item or utterancefigured in the analysis.
5 Trial 1: The analysis of candidate language output
105

The numbers of low and high frequency lexical items and grammaticalitems in the candidates’ output for each of the tasks on both versions werethen tallied as frequency counts. The lexical density calculations weresubsequently undertaken in two ways following Halliday (1985: 64–5). First,no distinction was made between high and low frequency lexical items incalculating the overall lexical density figures – the number of all lexical itemswas simply expressed as a percentage of the total number of items in eachcase. Secondly, the high frequency lexical items were given half the weight ofthe low frequency lexical items and the weighted number of lexical items thenexpressed as a percentage of the total number of items in a given task.Halliday suggests that this second method represents a more refined approachto determining lexical density. Carrying out the calculations in both waysprovided a test of whether it was really necessary to distinguish between highand low frequency lexical items using the weighting system outlined abovefor this kind of comparative analysis.
For both of these methods the resulting data sets consisted of the totalpercentage of lexical items (as opposed to grammatical items) in thecandidate’s output as a measure of the dependent variable lexical density foreach of the eight tasks: live description, live narration, live discussion, liverole play, tape description, tape narration, tape discussion and tape role play.Percentages are most safely treated as ordinal data, and the most appropriatemeasures of central tendency and variability therefore are the median andrange respectively. These were calculated for each of the eight tasks.
5 Trial 1: The analysis of candidate language output
106

Table 5.4
Lexical density: Classification of items
A Verbs ‘to be’ and ‘to have’. All modals and auxiliaries.Grammatical All determiners including articles, demonstrative and possessiveitems adjectives, quantifiers (e.g. some, any) and numerals (cardinal and
ordinal).All pro-forms including pronouns (e.g. she, they, it, someone,something), pro-verbs (e.g. A: Are you coming with us? B: Yes Iam), pro-clauses (e.g. this, that when used to replace wholeclauses).Interrogative adverbs (e.g. what, when, how) and negativeadverbs (e.g. not, never).All contractions. These were counted as two items (e.g. they’re =they are) since not all NESB speakers regularly or consistently usecontractions.All prepositions and conjunctions.All discourse markers including conjunctions (e.g. and, but, so),sequencers (e.g. next, finally), lexicalised clauses (e.g. y’know,I mean), meta-talk (e.g. what I mean, the point is), temporal deictics(e.g. now, then), spatial deictics (e.g. here, there) and quantifierphrases (e.g. anyway, anyhow, whatever).All lexical filled pauses (e.g. well, I mean, so).All interjections (e.g. gosh, really, oh).All reactive tokens (e.g. yes, no, OK, right, mm).
B Very common lexical items as per the list of the 700 mostHigh frequently used words in English (accounting for 70% of Englishfrequency text) identified in the COBUILD Dictionary project (1987). Thislexical items list is included in the Collins COBUILD English Course, Level 1
Student’s book pp 111–12 (Willis and Willis 1988). It includes nouns(e.g. thing, people), adjectives (e.g. good, right), verbs (e.g. do,make, get), adverbs of time, manner and place (e.g. soon, late,very, so, maybe, also, too, here, there). No items consisting ofmore than one word are included in this category as the COBUILDlist consists of words not items.Repetition of low frequency lexical items (see below) includingalternate word forms of the same item (e.g. student/study).
C Lexical items not featuring in the list of 700 most frequently usedLow frequency English words cited above, including less commonly used nouns,lexical items adjectives, verbs including participle and infinitive forms (all multi-
word and phrasal verbs count as one item), adverbs of time, placeand manner and all idioms (also counted as one item).
5 Trial 1: The analysis of candidate language output
107

In the study design there were two independent variables: first, test format(with two conditions) and task type (with four conditions); the samples weredependent and the data was on an ordinal scale. The experimental hypothesesfocused on whether there were significant differences in the degree of lexicaldensity for text format and task type. The most appropriate inferential statistictherefore was a 4 x 2 non-parametric factorial procedure with repeatedmeasures using non-specific hypotheses. The procedure used here is takenfrom Meddis (1984: 325–9).
Results
Descriptive statistics
Appendices 5.1 and 5.2 tabulate the lexical density figures by task for allindividual subjects using both methods of calculation. Tables 5.5 and 5.6below show the median percentage scores, the range of scores, the sum of theranks and the mean sum of the ranks for each of the eight tasks using bothmethods of calculating lexical density. In these tables, the tasks areabbreviated as follows: “Des” = description, “Nar” = narration, “Dis” =discussion and “RP” = role play.
Table 5.5
Method A: Unweighted lexical items(high frequency lexical items assigned the same weight
as low frequency lexical items)
Test LIVE TAPEformat
Task Des Nar Dis RP Des Nar Dis RP
– median (%) 40.0 38.0 40.0 35.0 42.0 41.0 43.0 41.5
– range (%) 31–49 32–44 36–47 31–40 33–50 35–45 37–47 35–49
– sum of ranks 93.0 66.0 92.5 36.0 111.0 92.5 121.5 107.5
– mean sum of
ranks (N=20) 4.7 3.3 4.6 1.8 5.6 4.6 6.1 5.4
5 Trial 1: The analysis of candidate language output
108

Table 5.6
Method B: Weighted lexical items(high frequency lexical items assigned half the weight
of low frequency lexical items)
Test LIVE TAPEformat
Task Des Nar Dis RP Des Nar Dis RP
– median (%) 33.5 31.0 32.5 29.0 36.0 34.5 34.5 36.5
– range (%) 26–43 26–36 28–39 23–32 29–44 27–40 30–45 27–44
– sum of ranks 87.5 65.5 80.5 31.0 121.0 96.0 119.0 119.5
– mean sum of
ranks (N=20) 4.4 3.3 4.0 1.6 6.1 4.8 6.0 6.0
For the first method, where high and low frequency lexical items were notdistinguished, the median scores across the tasks fall between 35.0 and 43.0per cent. For the second method, where high frequency items were assignedhalf the weight of the low frequency ones, the median scores for the eighttasks, not surprisingly, are now lower falling between 29.0 and 36.5 per cent.Graphical representations of these results are useful here in providing anoverview of the median scores for each of the two methods (see Figures 5.1and 5.2).
Figure 5.1
Median scores (%) for lexical density analysiswith underweighted lexical items (N = 20)
5 Trial 1: The analysis of candidate language output
109
43
42
41
40
39
38
37
36
35
34
Description Narration Discussion Role play
Med
ian
Sco
res
(%)
TapeLive
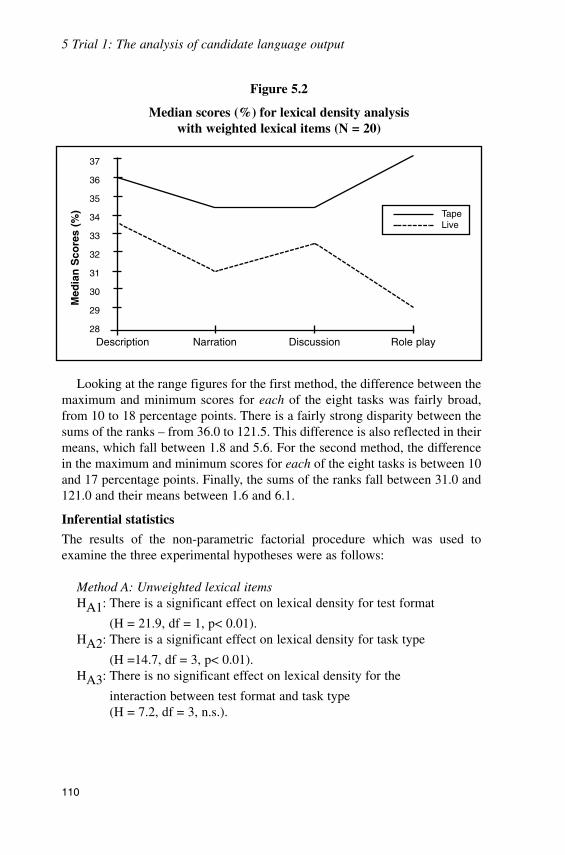
Figure 5.2
Median scores (%) for lexical density analysiswith weighted lexical items (N = 20)
Looking at the range figures for the first method, the difference between themaximum and minimum scores for each of the eight tasks was fairly broad,from 10 to 18 percentage points. There is a fairly strong disparity between thesums of the ranks – from 36.0 to 121.5. This difference is also reflected in theirmeans, which fall between 1.8 and 5.6. For the second method, the differencein the maximum and minimum scores for each of the eight tasks is between 10and 17 percentage points. Finally, the sums of the ranks fall between 31.0 and121.0 and their means between 1.6 and 6.1.
Inferential statistics
The results of the non-parametric factorial procedure which was used toexamine the three experimental hypotheses were as follows:
Method A: Unweighted lexical itemsHA1: There is a significant effect on lexical density for test format
(H = 21.9, df = 1, p< 0.01).HA2: There is a significant effect on lexical density for task type
(H =14.7, df = 3, p< 0.01).HA3: There is no significant effect on lexical density for the
interaction between test format and task type(H = 7.2, df = 3, n.s.).
5 Trial 1: The analysis of candidate language output
110
37
36
35
34
33
32
31
30
29
28Description Narration Discussion Role play
Med
ian
Sco
res
(%) Tape
Live

Method B: Weighted lexical itemsHA1: There is a significant effect on lexical density for test format
(H = 38.0, df = 1, p< 0.01).HA2: There is a significant effect on lexical density for task type
(H = 10.0, df = 3, p< 0.05).HA3: There is a significant effect on lexical density for the interaction
between test format and task type (H = 9.4, df = 3, p<0.05).
For the two methods of calculating lexical density the results are similar butnot identical. In both cases the effect for test format is significant at the 0.01level, while the effect for task type is significant at the 0.01 level and at the0.05 level respectively. In statistical terms, the most important differenceoccurs in the results for the interaction effect between text format and tasktype. The result is not significant using the first method but significant at the0.05 level when the second method was employed. The findings using themore finely tuned second method of determining lexical density (where highfrequency lexical items were assigned half the weight of low frequency items)are probably the more accurate here. The discrepancy in the results based onthe two methods suggests that this more refined analysis is probablywarranted in formal investigations of lexical density, especially whereinferential statistical procedures are to be employed.
In any event, all of the findings reported above require furtherinterpretation as they provide no real indication about the nature or size of theparticular effect, even where it is significant. In the absence of a suitable posthoc procedure, a visual representation of the mean sums of the ranks for thetwo methods of determining lexical density makes it possible to clarify thestatistical results more fully (see Figures 5.3 and 5.4).
5 Trial 1: The analysis of candidate language output
111

Figure 5.3
Sample rank means for lexical density analysiswith unweighted lexical items (N = 20)
Figure 5.4
Sample rank means for lexical density analysiswith weighted lexical items (N = 20)
Clearly, in both graphs the lexical density in candidate output on the tape-based version is higher for all four tasks than on the live version. This findingis consistent with those of Ure (1971) and Stubbs (1986), indicating thatmonologic texts are characterised by higher levels of lexical density. Inaddition, it appears that the degree of lexical density was lower for the
5 Trial 1: The analysis of candidate language output
112
7
6
5
4
3
2
1
0Description Narration Discussion Role play
Sam
ple
Ran
km
ean
s
TapeLive
7
6
5
4
3
2
1
0Description Narration Discussion Role play
Sam
ple
Ran
km
ean
s
TapeLive

narration task than for the description and discussion tasks for both versions. Inthe case of the role play, the degree of lexical density was similar to thedescription and discussion tasks in the tape version but clearly lower on the liveversion than all of the other three tasks.
In relation to the third hypothesis, the fact that in both graphs the two linesrun almost perfectly parallel for the first three tasks and then diverge on the roleplay task suggests that any real interaction effect overall between test formatand task type stems from the larger difference in lexical density on this last taskcompared to the other three tasks. The fact that the interaction effect was notstatistically significant when the high and low frequency lexical items wereunweighted in calculating the lexical density but significant when weightedappears to be simply a function of the size of the difference between the sumsof the ranks for the live and tape role play tasks in each case. This differencewas slightly greater using the weighted method and the result obtained for theinteraction effect hence reaches the 0.05 significance level.
Discussion
The most important of the findings for the question of test equivalence reportedabove are those which relate first, to the effect of test format and secondly, tothe interaction effect between test format and task type. In terms of the effectof test format, the results indicate that there was a significantly higher level oflexical density in candidate output on the tape tasks compared to the live tasksoverall using both methods of analysis (i.e. weighted and unweighted lexicalitems). In relation to the interaction effect between test format and task type, itis evident from both the graphical representations of the median percentagescores (Figures 5.1 and 5.2) and the sample rank means (Figures 5.3 and 5.4)that the lowest level of lexical density occurred in candidates’ responses on thelive role play task. A possible explanation for these findings relates to thedegree of interactivity for each of the eight tasks examined in this study.
As previously noted, the description, narration and discussion tasks on boththe live and tape versions were designed to be ‘monologic’ language events. Inthe live format interlocutors were instructed not to intervene actively oncecandidates began their responses on these tasks. However, it appears thatinteraction could not be prevented on the live version, even in these tasks. Thisis evidenced by the fact, as noted in Study A, that interlocutors consistentlyused verbal feedback in the form of reactive tokens such as mm, yes and rightwhile candidates responded on all three tasks. A distinguishing feature of thetape version, on the other hand, was the total absence of feedback tothe candidate. The fact that the median percentage scores for the three tasks onthe tape version were significantly higher than on the live version thereforesupports Ure’s (1971) finding that the use of verbal feedback results in asignificantly lower level of lexical density.
5 Trial 1: The analysis of candidate language output
113

The other important result in this study was the finding that the lowest levelof lexical density occurred in candidates’ responses on the live role play. Thiscan be explained by the fact that the live role play was designed to incorporatea much higher degree of interaction than the other three live tasks examinedhere while the tape role play (like the other tape tasks) remained essentiallynon-interactive. In the live role play interlocutors were required to makea substantial contribution to the interaction, their input throughout theconversation playing a crucial role in shaping the content of the candidate’soutput. The fact that the level of lexical density is clearly lower in the live roleplay than in the other three live tasks and lower still than in all four tape taskssuggested that the level of interactivity in any given task strongly influencesthe degree of lexical density, i.e. the higher the level of interaction the lowerthe degree of lexical density in candidate output. This conclusion supports thesuggestion by Zora and Johns-Lewis (1989) that as the expected degree ofinterruption diminishes and the length of speaking turn increases, the level oflexical density becomes higher.
The differences in lexical density between the direct and semi-directversions found in this study, although statistically significant, were not aslarge as those reported in Shohamy (1994), i.e. an average of 40% on the OPIand 60% on the SOPI. It is difficult to determine why this may have been thecase. The results from these two studies may point to a greater difference ininteractivity between the OPI and SOPI than between the live and tapeversions of the access: oral interaction sub-test overall. Another possibleexplanation is that the presence of feedback has a greater impact on lexicaldensity in candidate output in Hebrew than in English.
On the basis of the results for the effect of task type, it appears that taskstructure may also have an impact on candidate output in tests of oralproficiency, i.e. ‘open’ tasks seem to elicit language with a higher degree oflexical density than ‘closed’ tasks (except for the live role play for reasonsoutlined above). In either case the candidate’s response will only be aslexically dense as the task allows for. In each of the more ‘closed’ narrationtasks the stories to be told (using the sequence of pictures) were fairly simplewith little room for interpretation, potentially limiting the use of thecandidate’s lexical resources. Perhaps the more challenging requirement ofthese tasks is relating the pictures appropriately to each other using discoursemarkers, pro-forms and other cohesive devices – all grammatical items. Thismay account for the relatively lower levels of lexical density in both narrationtasks. By contrast, in the more open tasks – notably, the description andinterview – candidates are not constrained by any stimulus material and maytherefore be able to display a greater range of their lexical resources. Hencethe higher degree of lexical density in these cases. However, again, as thedifferences in the median scores between tasks are not great, such aninterpretation is only offered tentatively.
5 Trial 1: The analysis of candidate language output
114

Although not addressed in the experimental hypotheses, there are otherfactors which may influence the degree of lexical density in the samplescollected. One of those suggested in Zora and Johns-Lewis (1989) is whetheror not candidates planned their responses, i.e. planned answers are likely to bemore lexically dense than unplanned ones. If this was the case, then thereshould be a greater difference between the two description tasks – the live onewhich did not include planning time and the tape-based one which did – thaneither of the other tasks which had provision for preparation on both versionsof the test. But examination of the median scores and the sum of the ranks forboth methods of calculating lexical density does not yield a clear answer tothis question. This is a problematic variable to investigate, however, since,even where planning time is provided, there is no guarantee it will beeffectively used by the candidate on either version.
Another relevant variable given in Zora and Johns-Lewis is topic. The onlytask with the same topic on the two versions used for this study was thediscussion task. It is interesting to note, however, that the difference betweenthe median scores on the live and tape versions for the discussion tasks (usingboth methods of calculating lexical density) is very similar to the descriptionand narration tasks where the topics were very different on the two formats.This suggests that topic was not a significant source of variation in this study.
In sum, there are probably a number of factors, including task structure aswell as preparation and response time, which influence candidate output inoral proficiency tests, not simply whether the candidate is talking to anotherperson face-to-face or to a microphone per se. Nevertheless, format (i.e. liveor tape-based) emerges as probably the single most important determinant ofcandidate output in this study.
ConclusionThe broad qualitative study of a range of discourse features (the same as thoseused in Shohamy’s (1994) study of the Hebrew OPI and SOPI) in DiscourseStudy A suggested that the language produced in the direct and semi-directversions of the access: oral interaction sub-test on the three ‘monologic’ tasks(i.e. description, narration and discussion) was strongly similar, but that thelive and tape role plays produced a different kind of discoursal output. On thebasis of these initial results it appeared that the careful efforts of the access:test designers to match all tasks except the live and tape role plays seemed tohave been rewarded in terms of the parity of language elicited under the twotest conditions. These findings contrasted with those of Shohamy, wheredifferences between the OPI and SOPI were found on nearly all of thediscourse features examined.
5 Trial 1: The analysis of candidate language output
115

In Discourse Study B, however, the live version elicited language of asignificantly lower lexical density than the tape version in all four matchingtasks. It was argued that this result can be mainly attributed to theinextinguishable presence of interaction throughout the live version despitethe careful attempt by the test designers to minimise it in all tasks except therole play. Furthermore, the results also indicated that the higher the degree ofinteraction the lower the level of lexical density in candidate output. This wasclearly demonstrated in the figures from the live role play task where thecommunication between candidate and interlocutor was the least constrainedof all the tasks on that version. The degree of lexical density was found to becorrespondingly significantly lower on this task than any of the other livetasks. It seems that lexical density may have been the more sensitive measureof difference in language output in this study, at least from the perspective ofinteractivity.
A possible explanation for the differences found in candidate output on thelive and tape versions, especially in terms of lexical density, then, is that thetwo versions were drawing on different language skills overall, i.e. interactiveversus monologic speaking ability, despite the careful attempt to minimiseinteraction in nearly all the live tasks. This, in turn, may have accounted forthe apparent lack of equivalence between the test scores on the two formats inthe December 1992 trial reported in Chapter 4, since it is likely that at leastsome candidates would not perform equally well in tests which tap suchdifferent oral skills. This is not to say that the test scores obtained from thelive and tape versions in this trial could be usefully correlated with the lexicaldensity figures to confirm this conclusion since lexical density was not usedas a scoring category. Nor would it have been valid to do so: while lexicaldensity provides valuable clues about the speaking abilities being tapped inthe two versions of the test, it does not actually measure any meaningfulcomponent of language proficiency.
At this point, therefore, the findings were still only tentative and partial. Itwas therefore decided to examine a later trial from a naturalistic perspectivein order to pursue the equivalence question. Specifically, the next stage in theresearch involved examining first, the processes of test design, test taking andrating candidate performance and, secondly, the test scores from the June1994 trial. The results of the study of test processes are reported in Chapter 6and the analyses of test scores in Chapter 7.
5 Trial 1: The analysis of candidate language output
116

Trial 2: The study of testprocesses
IntroductionThe analyses of test scores and test taker language output in the December1992 trial yielded important but nevertheless incomplete answers to theequivalence issue. It was therefore decided to adopt a very differentperspective on a new trial held in Melbourne in June 1994. In theoreticalterms, this involved comparing the direct and semi-direct versions of theaccess: oral interaction sub-test from a naturalistic perspective. Specifically,this stage of the research involved examining the processes of test design, testtaking and rating in this trial using a range of data based on observation,interviews and questionnaires. This new perspective provided the basis for avery different comparison between the two versions than had been undertakenup to this point. After providing relevant information about the trial on whichthis study was based, the methods used to collect the various forms of datacollected are described. The key findings are then reported and discussed.
The June 1994 trialAs outlined in Chapter 1, important revisions to the original test specificationsfor the oral interaction sub-test, including the tasks and the scoring criteria,had been completed by May 1994. Preparation for the trialling of new live andtape versions of the test then began. Table 6.1 summarises the main stages inthe work done leading up to, during and after the trial conducted in Melbourneon 4 June 1994. This process was completed between May and July 1994.This trial was the focus of the study reported in this chapter.
Table 6.2 below lists the test tasks and scoring criteria (as per the revisedtest specifications) used in the June 1994 trial. The test now aimed to identifycandidates reliably at both the Functional and Vocational levels. (Previously,only the Vocational level had been targeted by the test.)
The scoring criteria were now assessed on a seven-point scale withappropriately modified descriptors. The complete revised set of descriptorsfor each of the scoring criteria is given in Appendix 6.1. Further details aboutchanges to the oral interaction sub-test at this time are provided in Chapter 1.
117
6

In this trial 120 volunteer NESB students, who were recruited from severallocal tertiary institutions, completed all four sub-tests of a new form of the testi.e. reading, writing, listening and speaking (both direct and semi-directversions). Each test taker was paid AUD$70 upon completion of the trial test.
Table 6.1
Stages in developing new live and tape versions (Form D)of the oral interaction sub-test, May–July 1994
Stage 1 Project team designed new tasks for both live and tapeformats in accordance with test specifications. Thesewere assembled in combination with previously usedtasks as anchors to ensure comparability with earlierversions in relation to standard setting (= draft 1).
Stage 2 Item Editorial Committee vetted new tasks in draft 1.Stage 3 Test developers revised draft 1 (= draft 2).Stage 4 Item Editorial Committee members provided written
feedback on draft 2.Stage 5 Project team revised draft 2 to create trial versions
which included interlocutor and candidate booklets forthe live format and a candidate booklet, tapescript andultimately a sound recording for the tape format.Questionnaires for candidates, interlocutors and raterswere then prepared.
Stage 6 Training session for the trial interviewers wasconducted.
Stage 7 Live and tape formats were administered to trialpopulation. Audio recordings were made of candidateperformances in both instances.
Stage 8 Each audiotape from both live and tape formats wasindependently assessed by two trained raters.
Stage 9 Multi-faceted Rasch analyses were carried out on trialtest scores using the FACETS program.
Stage 10 Test revised in the light of the analyses of test scores aswell as written feedback from candidates, interviewersand raters in preparation for an overseas administrationin September 1994.
The trial cohort represented diverse cultural and linguistic backgrounds aswell as a wide range of age groups. As in the December 1992 trial, candidatescan be divided into two broad groups on the basis of how closely theyresembled the target overseas test population using data obtained fromquestionnaires completed by them on the day of the trial administration. Themore ‘non-target-like’ group (i.e. NESB students, generally under twenty-five
118
6 Trial 2: The study of test processes

and living in Australia on a temporary basis while completing their tertiarystudies) comprised 58% of the test cohort. The remaining 42% belonged tothe ‘target-like’ group which was composed of NESB professionals qualifiedin a wide range of fields including engineering, medicine, teaching,administration, computing, librarianship and architecture. However, insofaras they had mostly already obtained permanent residence, had been inAustralia for more than 18 months and were undertaking the test here, eventhis group did not closely represent the target test taker population either.
Given these differences between the trial and operational test populations(as in the December 1992 trial), the findings reported here cannot be directlyapplied to the operational context. Nevertheless, they do have potentialimplications for any group of people undertaking the test and indeed for theinterchangeability of other direct and semi-direct speaking tests.
Of the 120 trial candidates in the June 1994 trial, approximately half wereadministered the live version first, and half were administered the tape versionfirst. As in the December 1992 trial, their performances on both versions wereall audio taped so that they could be rated retrospectively. Sixteen tape-basedrecordings and ten live recordings were unsuccessful due to technical faults inthe recording equipment, and these candidates were therefore excluded.Thus, the analysis was based on the scores from a total of 94 candidates onboth the direct and semi-direct versions of the test.
119
6 Trial 2: The study of test processes

Table 6.2
Test tasks and scoring criteria Form D (trial), June 1994
LIVE TAPE
1. Warm up (unassessed) 1. Warm up (unassessed)2. A) Description 2. A) Description (1)
– fluency – fluency– grammar – grammar– vocabulary – vocabulary
B) Narration B) Narration– grammar – grammar– vocabulary – vocabulary– coherence and cohesion – coherence and cohesion
C) Summary– fluency– grammar– vocabulary
3. Role play 3. Role play– fluency – fluency– grammar – grammar– intelligibility – intelligibility
4. A) Exposition (1) A) Exposition– fluency – fluency– vocabulary – vocabulary– coherence and cohesion – coherence and cohesion
B) Exposition (2) B) Instructions– fluency – fluency– vocabulary – vocabulary– coherence and cohesion – coherence and cohesion
5. Discussion 5. Discussion– fluency – fluency– grammar – grammar– intelligibility – intelligibility
6. Description (2)– fluency– grammar– vocabulary
Global criteria Global criteria– communicative effectiveness – communicative– comprehension effectiveness
120
6 Trial 2: The study of test processes

MethodThe investigation into the comparability of the direct and semi-direct versionsof the oral interaction sub-test reported in this chapter was undertaken from anaturalistic (constructivist) viewpoint. From a naturalistic perspective, humanbehaviour, in this instance test performance, cannot be fully understoodwithout incorporating into the research the perceptions and insights of thoseinvolved in the study, not simply the researcher. Typically (although notexclusively), it employs observation, interviews and other sources ofqualitative data as methods of data collection.
There were three related phases in the investigation: first, the study of testdesign processes prior to the trial; secondly, the study of test taking processesduring the trial; and, finally, the study of rating processes following the trialadministration of the test. The procedures used to collect data in each of thesephases will now be outlined.
The study of test design processes
In this first phase of the study the researcher obtained permission from theoral interaction sub-test development co-ordinator to attend the forthcomingItem Editorial Committee (IEC) meeting for the June 1994 trial as a non-participant observer. As outlined in Chapter 2, the role of the IEC was toevaluate new tasks in preparation for trialling in terms of their suitability,difficulty and the clarity of their requirements. Its membership included thechair of the access: Test Development Committee (TDC), four members ofthe oral interaction sub-test development team and several external languagetesting experts. Due to the last minute absence of the chair of the TDC, theresearcher was asked to participate actively in the IEC meeting. Despitetaking on this unexpected role, he was able to observe the meeting entirely asa newcomer since he had not attended one previously.
The day before the meeting an initial draft of the test tasks was distributedto members of the IEC in preparation for the meeting. This first draft was thenedited on the basis of feedback in the meeting. The revised draft test was latersent to individual IEC members for further comment. The trial versions of thetest were then finalised by the test development team.
In the IEC meeting the researcher made brief written notes. Since theopportunities for notetaking during the course of the meeting were highlyrestricted, he concentrated his efforts on recording any points directly relatedto the comparability of the live and tape versions. Following the IEC meetingthe researcher interviewed all six members of the oral interaction sub-testdevelopment team. The three team members who designed the tasks for thistrial were interviewed together first of all, followed by the two team membersresponsible for organising the rating of the trial and finally the co-ordinator.
121
6 Trial 2: The study of test processes

The informal conversational interview was deemed by the researcher to be themost appropriate format for eliciting the views of all members of the testdevelopment team. In adopting this approach, the interviewer ‘attempts toengage the interviewee in a natural conversation in which questions arisemore-or-less spontaneously’ (Lynch 1996: 126).
The informal conversational interview is often employed in contexts wherethe interviewer has already established some sort of relationship with theinterviewee – hence its appropriateness in this instance for interviewing peerswith whom the researcher had already developed a professional and, in somecases, a personal relationship. A more formal, structured type of interviewwould have been highly ‘artificial’ in the circumstances and therefore likelyto have stifled the interaction.
Following completion of these interviews a member check session wasconducted with the test development team as a whole. The aim of this sessionwas to check that the researcher’s interpretations of their comments in theinterviews were correct and to draw the group’s attention to the divergentviews of individual members about key issues with the hope of stimulatingfurther discussion.
The study of test taking processes
This part of the study involved close observation of two candidates’performances under both the live and tape-mediated formats. The criteria forselecting these candidates and relevant bio-data about each of them are givenbelow. Subsequent interviews with each of them and with their respectiveinterlocutors (in the live version) were also included as methods of datacollection. This triangulation provided a series of ‘snapshots’ of the twocandidates taken from different perspectives. Responses to questionnairesprovided by 77 of the 94 test takers who participated in the trial formedadditional data about test taker reactions to the two tests. These questionnaireswere completed after candidates had undertaken both versions of the oralinteraction sub-test.
In order to find two suitable people for the study, six test takers wereapproached by the researcher before they undertook both versions of the oralinteraction test on the day of the trial administration. Given the impossibilityof representativeness in studying only two test takers out of a large test cohort,the only criteria for selection were that one of these people would have donethe live test first and the other the tape test and that one would be male andthe other female. The six trial candidates were informed about the purpose ofthe study and the nature of their participation i.e. they would be observedwhile completing the two versions and then interviewed afterwards. Theywere also made aware that their test performances would be video taped andtheir interviews audio taped but that confidentiality with respect to theiridentities would be maintained at all stages of the project.
122
6 Trial 2: The study of test processes

Two very different people, henceforth referred to by the pseudonyms‘Abdul’ and ‘Wing Li’ ultimately agreed to take part in the project. Abdul wasan Egyptian male, 52 years of age who had worked as a TV director in Egyptbefore arriving in Australia and taking up permanent residence in 1992. Hewas unemployed at the time of the trial and studying general English full-time. Wing Li was a Chinese female, 25 years of age, who arrived in Australiaas a temporary resident in 1993. She was a student of tourism and hospitalityat the time of the trial. Both candidates reported having studied English for tenyears before coming to Australia. Abdul completed the live then tape versionof the speaking sub-test in the morning before undertaking the rest of the test.By contrast, Wing Li did the tape then live version of the speaking sub-test inthe early afternoon after undertaking the reading and writing modules butprior to completing the listening sub-test. Abdul’s interlocutor in the liveversion was a male ESL teacher while Wing Li’s interlocutor was a femaleprimary, non-ESL trained teacher. The findings, using a wide variety ofevidence, are outlined in the following section.
At the time the two test takers undertook each version the researcher madedetailed observation notes of their performances. In undertaking this stage ofthe study the researcher used non-participant observation i.e. he did not havea role to play other than observer. In the live test, once the video camera wasset up, he sat at the side of the room taking written notes without speaking. Inthe tape version he did much the same except that he also wore headphonesin order to hear the candidate he was observing more clearly. A week later,another set of notes were taken from the video recordings without consultingthe earlier ones in order to check the reliability and validity of the original setof observations. On both occasions the researcher made unstructured,descriptive field notes as described in Lynch (1996: 116). Field notes aretypically used where there are no a priori decisions about what is to befocused upon in the observation. The two sets of observation notes areincluded in Appendix 6.2 as they constitute the basis of the judgements andinterpretations about the performances of each of the test takers (under boththe live and tape conditions) which are summarised in the next section of thischapter.
Even though the researcher attempted to make himself and the camera asunobtrusive as possible, it is important to consider the possibility that theseobserved and video recorded test performances may have been changed in thevery act of studying them. This follows from Labov’s (1972) ‘observer’sparadox’ that data about how people behave naturally (i.e. when not beingobserved) can only be obtained through observation. In order to take thiseffect into account in interpreting the findings both candidates andinterlocutors (in the live version) were questioned about what impact thepresence of these two ‘observers’ had on them during their interviews with theresearcher.
123
6 Trial 2: The study of test processes

In carrying out the subsequent interviews with the candidates and theirinterlocutors on the live version the interview guide approach (as describedby Lynch (1996: 128) was chosen. This procedure, which is neithercompletely structured nor unstructured in design, allows the interviewer tospecify a range of questions to be covered in advance without needing toformulate either the wording of the questions or the order for posing themuntil the interview is in progress. It also allows for the inclusion of follow-upquestions as deemed appropriate by the interviewer. This method aims to givethe interviewee some degree of control over the shape and direction of theinterview as well as to enhance its interactiveness and reduce the level offormality. A major advantage of this approach is that it allows the interviewerto be efficient, systematic and yet flexible across interviews. The interviewguide approach was considered by the researcher to be most appropriate forboth the candidates and their interlocutors particularly given the very limitedtime available for the interviews to be conducted on the day of the trialadministration. The questions planned for the candidates and theirinterlocutors are included in Appendices 6.3 and 6.5.
A post-test questionnaire adminstered to all test takers was also used in thestudy. It was based on an earlier version which was used to examine test takerreactions to the two formats in the December 1992 trial (Hill 1997) and isincluded as Appendix 6.4. The questionnaire was designed to be completed asquickly and efficiently as possible at the conclusion of the trialling.Candidates were required to provide relevant bio-data before answeringquestions about the two versions considered separately and then together.Nearly all of the questions about the test could be completed by circling oneof two or three alternative answers. The only exception was the final questionasking for any additional comments about the test.
The study of rating processes
Twenty-two raters were engaged to mark the live and tape audio recordingsfrom this trial. As in the December 1992 trial, the rating design was such thatno rater assessed any particular candidate on either version more than once.This meant that each candidate was assessed by four different raters, i.e. twoon the live version and two on the tape version. By this time the rating processhad become more intensive than in the December 1992 trial where raterscompleted their scoring at home over a period of one week. From September1993 raters were required to complete their assessments instead over aweekend in the language laboratory of a local English language centre forreasons of increased security and administrative efficiency. They assessedapproximately ten live and ten tape versions over the two days. Prior tocarrying out their work, raters attended a short two-hour calibration sessionduring which they compared their scoring of sample audio recordings fromboth the live and tape versions.
124
6 Trial 2: The study of test processes

The researcher conducted interviews with each of the raters who hadmarked a live or tape performance by either Adbul or Wing Li immediatelyafter the assessment was completed. The raters were asked to explain theirscoring of the candidate and to give their views on the equivalence of the twoversions in general. Once again, the interview guide approach was used. Thequestions designed for the rater interviews are included in Appendix 6.7. Atthe conclusion of the rating process all 22 raters completed a writtenquestionnaire designed to provide additional, broader feedback about thecomparability of the two versions from their perspective. The questionnaire(see Appendix 6.8) consisted of four questions allowing for fairly detailedwritten responses.
The test scores of the two candidates focused upon in the study (seeAppendix 6.6) were then examined in relation to the rest of the test cohort(see Chapter 7). Further data collection and analyses were later undertaken tocheck the reliability of the original ratings of the two candidates and to gaindeeper insight into some of the factors affecting their test scores in eachversion. This process included further assessments of the two candidatesunder both test conditions and detailed comments made by an additional rater.
Peer debriefing session
After all of the data from each of these three stages had been gathered, codedand analysed for the first time, the researcher arranged a two hour debriefingsession with a group of ‘disinterested’ colleagues (PhD students and academicstaff) in the department of Applied Linguistics and Language Studies atMelbourne University. After introducing the two versions of the oralinteraction sub-test using the test specifications, he presented the preliminaryfindings from this study (including the analysis of test scores reported inChapter 7). This provided valuable feedback on the strengths and weaknessesof his initial interpretations of the data collected for this study.
FindingsThe findings from this study are reported chronologically in order to evokethe test experience and/or views of participants at the particular stage of thetest process they were investigated. Thus, this ‘narrative’ aims tocontextualise their behaviour and ideas about the comparability of the live andtape versions of the oral interaction sub-test more fully than would be possibleif, for example, the results were grouped thematically instead. In this way, itis hoped that the coherence and unity of their experiences are preserved in theanalysis.
125
6 Trial 2: The study of test processes

Test design processes
This section reports the findings from first, observation of the Item EditorialCommittee (IEC) meeting and secondly, the interviews with the testdevelopment team held prior to the trial administration. Only the findingsmost directly relevant to the question of the comparability between the liveand tape versions of the oral interaction sub-test in terms of their design arediscussed.
Observation of the IEC meeting
The meeting consisted of detailed discussion of the test tasks. The first, moststriking fact was that all the draft test tasks were presented to the IEC in thelive format ready for inclusion in the interlocutor’s booklet. It was thereforedifficult, if not impossible, to envisage how the tasks proposed for the tapeversion would appear in the appropriate candidate’s booklet.
The second notable feature of this meeting was that the proposed test taskswere evaluated without reference to the test specifications which set out thetask types (including task structure and format), the expected languagefunctions and the scoring criteria for each task. Thus, the guidelines formatching live and tape tasks in the test blueprint appeared to be ignored atthis crucial point in the test process. Furthermore, even without the testspecifications, no serious attempt was made in the discussion to compareindividual matching tasks on the two versions in any respect. A clear exampleof this was the examination of the proposed live and tape exposition taskswhere the two sets of questions appeared to elicit very different responses interms of language functions.
The evaluation of the draft test therefore looked at each proposed taskentirely in isolation, assessing each task in terms of what IEC membersconsidered to be its potential interest, difficulty and clarity for candidates.There were, in fact, only a couple of moments where the comparability issueemerged at all. The first of these points was when the researcher asked howthe decision to allocate supposedly matching tasks to either the live or tapeversion was reached. A test development team member indicated that ‘the taskwhich appeared easier to us would go on the tape version’. This commentsuggests that the tape tasks needed to be easier than their live counterparts tocompensate for the fact that the tape format was intrinsically more difficult.The second concerned the equivalence of the live and tape role plays. As oneof the IEC members who was also a rater remarked, responses to the tape roleplay (the telephone answering machine) tended to be brief and oftensimplistic. As such it was no real match in terms of its communicativedemands for its live counterpart where candidates were normally required tonegotiate solutions to often fairly complex problems with the interlocutor.This comment supports the observation made in relation to the equivalence ofthese two tasks in Chapter 1.
126
6 Trial 2: The study of test processes

In general, close scrutiny of the IEC meeting suggested that securing theequivalence of the two versions in terms of their design was not an importantconcern for either the test development team or the rest of the IEC members.This conclusion is further supported by an examination of the subsequentwritten exchanges between the test developers and the other IEC membersabout the next draft of these new versions of the oral interaction sub-test.Again, there was minimal attention given to the comparability issue. At amore general level, the lack of reference to the test specifications whenevaluating the proposed test tasks in the IEC meeting was rather surprising.Both of these issues were pursued in the interviews which followed.
Interviews with the test development team
As outlined previously, three separate interviews were conducted with the testdevelopment team. The three team members who designed the tasks for thistrial were interviewed together first of all, followed by the two team membersresponsible for organising the rating of the trial and finally the co-ordinator.Again, the primary focus of the reporting here is the comparability issue fromthe perspective of test design. However, given that much of the discussion inthese interviews compared the design and ‘execution’ (i.e. test in action)stages of the two versions, the team members’ comments on both these stagesare included since they help to illuminate each other.
i The team members responsible for designing the tasks for the trial
The most important points raised in this interview centred on thecomparability issues which emerged in the IEC meeting discussed above.
The researcher initially queried why all of the tasks in the draft distributedto the IEC members were presented as if for incorporation into theinterlocutor’s booklet of the live version. The team members indicated thatthis had become standard practice in designing new tasks as they found iteasier to write for the live format. Translating a new task into the tape formatwas then a relatively straightforward process. They did agree, however, thatthis strategy was less than ideal and should be remedied in future by designingtasks in the format for which they were intended. Where it was unclear towhich format a given task would ultimately be assigned it was agreed that thetask should be written up in both live and tape formats for the IEC to examine.
Another important point raised in this interview related to the researcher’sobservation that reference to the test specifications was entirely absent in theIEC meeting. One of the team members suggested that this was not reallynecessary as they had consulted the specifications in designing the new tasksprior to the IEC meeting and, in this way, adherence to the guidelines for eachtask was assured. Another team member, however, argued that the testspecifications should have been used in the meeting to ensure that the issue ofmaintaining the equivalence of the two versions was not forgotten while
127
6 Trial 2: The study of test processes

attempts were made by the committee to improve individual tasks. Accordingto this team member ‘ ... the other committee members [those who are not partof the test development team] tend to judge each task on its clarity and levelof difficulty instead of whether it follows the guidelines in the specs’. Thisobservation is an important one given the important role of the IEC in theproduction of the final trial live and tape versions of the oral interaction sub-test. It is possible that a lack of explicit reference to the test blueprint in thesemeetings could have undermined the attempt in that document to secure theequivalence of the two versions.
The researcher also sought clarification of the explanation given in the IECmeeting with regard to the basis on which alternate tasks were allocated toeither the live or tape version. According to these team members, allocationof the easier of two alternate tasks to the tape version meant that the tape taskwas less likely to be ambiguous or to require clarification from theinterlocutor. This seemed to suggest that the tape tasks needed to be especiallyclear and straightforward with lower syntactic and lexical complexity in boththe stimulus materials and instructions than their live counterparts.
These three team members agreed that securing the equivalence of the twoversions in terms of test design was important, given that they were treated asbeing the same test in the analysis of test results. However, two of themconsidered that the two test ‘events’ were so different that absoluteequivalence was an unrealistic goal, the live version being dialogic in natureand the tape version essentially monologic. Thus, as one team membersuggested:
The direct version involves substantial negotiation of meaning ... theonly sense of interaction in the other [semi-direct] version is whetherthe candidate appears to understand what is on the tape.
The third team member felt that the live version was only slightly moreinteractive than the tape version, given its highly scripted nature and that thetwo versions were therefore fairly evenly matched.
One of the team members who felt that the two test conditions were not thesame pointed out that in the live version candidates were able to use bothverbal language and non-verbal language (e.g. gestures, eye contact and otherfacial expressions) to communicate meaning, whereas on the tape versionthey were restricted to verbal language. Since candidates were rated fromaudio recordings under both conditions their non-verbal languageperformance on the live version was ignored. This was unfair since non-verbal communication may have played an extremely important role in theproduction of meaning.
This team member also stressed that interlocutors were equally able toemploy both verbal and non-verbal feedback in communicating with
128
6 Trial 2: The study of test processes

candidates on the live version. Even where interlocutors followed theirinstructions by adhering strictly to their script and ‘behaved as much like atape as possible’ there was still substantial opportunity to use both kinds offeedback. Whether this feedback enhanced or inhibited candidates’performances would depend on how effectively it was communicated to them.
The other team member who considered the two formats to be differentpointed out that the live and tape role plays, in particular, were not wellmatched and also that the summary task on the tape version had nocounterpart on the live version. In any case, she felt that this task wasprimarily a test of listening comprehension and therefore inappropriate in atest of oral proficiency.
In general, therefore, the comments of two of these team memberssuggested that a high degree of interactivity was integral to the live versiondespite the attempt to minimise it at the design stage, particularly through theuse of an interlocutor script. The tape version, on the other hand, wascharacterised by a complete absence of two-way interaction. The otherinterviewee played down this difference although she did concede that thequality of the candidate’s performance could be partly determined by the skillof the interlocutor.
ii The team members responsible for organising the rating of the trial
The team members interviewed in this case considered that the scoringcriteria, as set out in the test specifications, were applicable to both versions.However, one of them did suggest that different descriptors might be neededfor some of the scoring categories across the two versions. For example, thevarious levels of Fluency or Cohesion might need to be defined differentlyin monologic compared to dialogic communication. This interviewee alsoqueried why Comprehension was not included as a category on the tapeversion. One of them also suggested that Communicative effectiveness in thelive version may have been used by raters to assess the candidate’s ability tointeract with the interlocutor, especially since there were no level descriptorsaccompanying this scoring category.
Both team members also remarked that trial candidates did not alwaysperform equally well on the two versions. One of them suggested that howwell individual candidates performed on either format might depend on theirpersonalities and their test ‘know-how’. Talking to an interlocutor in a face-to-face setting on the live version and responding within fixed times to arecorded voice in a language laboratory surrounded by other candidates calleddifferent test taking strategies into play. Some candidates, these intervieweesclaimed, clearly had a wider range of these strategies and were therefore notdisadvantaged by either format. Others seemed to fall foul of one version orthe other because they were unable to adjust to the communicative demandsof the setting.
129
6 Trial 2: The study of test processes

In addition, these interviewees argued that interlocutors rarely had a neutralimpact on candidate performance. In some instances their behaviourpositively influenced the candidate, particularly when they providedsupportive verbal and non-verbal feedback without straying too far from theirscript. Where the interlocutor failed to provide such support and/or didn’tfollow the script very closely these members of the project team felt thecandidate’s performance was likely to be adversely affected.
Finally, these team members claimed raters were encouraged to mark thelive and tape versions similarly, although some of them showed a tendency tobe harsher on one version than the other. They also pointed out that ratersoften compensated candidates for being matched with a poor interlocutor intheir assessments. One of them who had also rated the test in the pastsuggested that ‘if I thought a candidate was getting a raw deal from theinterlocutor I’d be more lenient in my marking’. This view is consistent withthe findings of McNamara and Lumley (1993) in relation to the OccupationalEnglish Test (OET) described in Chapter 2.
iii The test co-ordinator
The co-ordinator of the test development team initially emphasised thesimilarity of the two versions of the oral interaction sub-test in her interview.She argued that the live version closely resembled the tape version, first,because of its extremely low level of interactivity, i.e. it was a ‘highly scriptedtest’ with interlocutors being given ‘strict instructions about the role theyshould play and what they should say in terms of the questions they asked inthe test’. The sole exception was the live role play where the contribution ofinterlocutors was less restricted although their overall role was still highlycircumscribed. The second reason why the two versions were highly similarwas because, in both instances, the scoring criteria did not focus on thecandidate’s ability to interact, but rather on ‘more concrete language criteriasuch as fluency, grammar, vocabulary and intelligibility’.
However, later in the interview when questioned about which of the twoversions was fairer to test takers the test co-ordinator pointed to someimportant differences between them. In this instance she argued that ‘everycandidate gets the same quality of input’ on the tape version, whereas on thelive version this cannot be guaranteed because of variability in interlocutorperformance. Examples of such variability included how closely interlocutorsconformed to the script of the task prompts and whether they gaveencouraging feedback during and at the end of candidate responses. Sheconsidered that ‘the interlocutor variable is always going to have a largeimpact on candidates’ scores and you can’t ever get rid of it’.
These comments on the relative fairness of the two versions raise twoissues central to the interchangeability question. First, the co-ordinator’s
130
6 Trial 2: The study of test processes

suggestion that a candidate’s result is, in fact, significantly affected (eitherpositively or negatively) by the interlocutor’s performance points to a higherlevel of interactivity on the live version in practice than was anticipated at thedesign stage. The implication is that the candidate’s performance on the liveversion (but not the tape version) is jointly achieved or co-constructed despitethe attempt to minimise interaction in this format at the design stage. If, inturn, interactive and monologic speaking skills constitute different languageabilities, it is highly likely that at least some candidates will perform better onone version than the other. The fact that the scoring criteria do not focusexplicitly on interaction may not prevent these candidates from achieving ahigher overall result on one version, since they are likely to demonstratestronger competence in some or all of the rating categories currently used inthe test anyway. It is also conceivable that the candidate’s interactive abilitymay be indirectly assessed on some or all of the task specific scoring criteriaon the live version despite the fact that they do not explicitly focus on thisskill. Even if that is not generally the case, it is highly probable that judgementof the candidate’s interactive competence would be considered in scoring thegeneral category Communicative effectiveness on the live version (assuggested earlier by one of the other team members), especially given thatthere are no level descriptors accompanying this criterion which might directraters away from this ability. In addition, it is likely that any judgement of thecandidate’s skill in this respect would be linked to raters’ perceptions of theoverall success of the interaction, so that their assessment of the interlocutor’sperformance could also (albeit indirectly) inform their scoring.
Secondly, the fact that the quality of input remains the same for allcandidates on the tape format may not make it automatically fairer to allcandidates. Other factors peculiar to the tape format, such as the candidate’slevel of comfort with the language laboratory as a test environment, are likelyto either have a positive or negative impact on the candidate’s performance inthe tape version.
Notwithstanding these counterarguments, the test co-ordinator’s commentsin this interview illustrate her sensitivity to the problems associated withattempting to minimise interactivity on the live version.
Test development team member check
All six members of the test development team later attended a group sessionwhere the researcher checked his interpretations of their individual commentsin the interviews above. The session also provided them with the opportunityto compare their views on the equivalence of the two versions of the oralinteraction sub-test.
After the group had had the opportunity to listen to and discuss theresearcher’s report of the earlier interviews, conflicting views about the
131
6 Trial 2: The study of test processes

equivalence of the two versions still persisted. On the one hand, two membersof the group strongly defended their interchangeability based on the view, asone of them suggested, ‘that the live version – apart from the role play – isn’tinteractive because it’s so tightly scripted and the scoring criteria don’t assessinteraction anyway’. The other four team members, on the other hand,remained more sceptical about the equivalence of the two versions mainly onthe grounds, as one of them suggested, that ‘interaction can’t be got rid of inthe live version however hard we try to wipe it out in the tasks and in themarking’.
In conclusion, the relative interactivity of the live and tape versions of theoral interaction sub-test emerged from this first phase of the study of testprocesses as a central and highly contentious issue in determining theirinterchangeability. This provided a major focus for the next two phases of thestudy – the investigation of the processes of test taking and rating.
Test taking processes
The findings from the second phase of the study which focused on theperformances of two trial candidates as well as feedback from candidates andraters on the comparability issue are reported below.
Observation of candidates
The conclusions drawn about the two trial candidates, ‘Abdul’ and ‘Wing Li’in this sub-section are based on the observation notes made, first, at the timethe live and tape versions of the oral interaction sub-test were administeredto them and, secondly, a week later using video recordings of theseperformances. These two sets of observation notes are included inAppendix 6.2.
Abdul appeared to perform better in the live than the tape version at leastpartly because of the role played by his interlocutor in the interaction. Thisinvolved ample patience (allowing the candidate plenty of time to respond),reassurance and positive feedback of both a verbal and non-verbal nature. Theinterlocutor’s verbal feedback consisted mainly of reactive tokens (such asmm, yep and that’s fine) and was often used most effectively to encourageAbdul to keep talking when he was silent or hesitating. His non-verbalcommunication, on the other hand, mainly took the form of sustained eyecontact, nodding and smiling, again, it appears, designed to reassure andencourage further response from the candidate. Like his interlocutor, Abdulmade extensive use of non-verbal as well as verbal language throughout theinteraction. His confidence appeared to grow as the test progressed, asevidenced by a gradual increase in his recourse to nodding, smiling, laughter,as well as a range of hand gestures and a matching decrease in the amount ofhesitation in his responses.
132
6 Trial 2: The study of test processes

On the other hand, Wing Li seemed to perform less well on the live versionfor two main reasons. Firstly, she was paired with an interlocutor who tendedto rush her through the test. In particular, this interlocutor appeared to useverbal and non-verbal feedback – whether consciously or unconsciously – insuch a way as to finish the test as quickly as possible. Both types of feedback,consisting mainly of reactive verbal tokens (such as mm or yep), nodding andhalf-smiles, tended to be given in a curt, almost abrupt manner often while thecandidate was still speaking or else the moment after the end of an utterance.This behaviour seemed to have the effect of closing down Wing Li’sresponses even when she may have been able to extend them further. Thisinterlocutor, therefore, displayed little of the patience, reassurance andencouragement that was so evident in the case of Abdul’s interlocutor.Secondly, Wing Li’s body language, which included a consistently stiffposture, sometimes with her arms tightly folded and at other times with herhands firmly clasped, seemed to indicate that she was ill at ease under the livecondition. She only sporadically used non-verbal communication such as eyecontact and hand gestures, mainly, it seemed, in response to the interlocutor’sreluctance herself to interact more than was absolutely necessary to completethe test.
Despite the test developers’ careful attempt to eliminate, or at leastminimise, interaction in all tasks apart from the role play in order to match theconditions of the tape version, observation of Abdul and Wing Li undertakingthe live version suggested that the effectiveness of the interaction betweencandidate and interlocutor played a major role in determining the quality ofthe candidate’s overall performance in this format. In other words, it seemsthat, in practice, the test assessed the interactive competence of bothparticipants.
In the tape version Wing Li appeared to be more proficient in ‘remote’,one-way communication than Abdul. She seemed to be better able to prepareand respond at length to each task without the support of a live interlocutorcompared to Abdul. She also appeared to adapt much better to the moreconstrained conditions of the tape test than Abdul, who often appeared unableto process the requirements of the tasks and then produce a response in thetime allowed for on nearly all of the tasks. Both were frequently cut off by thenext question but Wing Li usually seemed closer to completing her answer.Abdul, on the other hand, often seemed to be still gathering his thoughts whenthe signal to begin talking was given and at the mid-point of his responsewhen stopped short by the recorded voice.
Furthermore, Wing Li appeared more relaxed than Abdul throughout thetape test. This difference was underlined by their body language: Wing Li saterect and alert without any obvious signs of tension throughout this version.Nor did she appear to be unduly distracted by the voices of those around her.(In fact, as a ‘positive’ test taking strategy, Wing Li noted in her post-test
133
6 Trial 2: The study of test processes

interview that it was actually possible to remain silent and listen toneighbouring candidates for ideas before starting to respond!) Abdul, on theother hand, seemed to grow progressively more tense in the course of the tapeversion. He gradually leant more and more over the desk holding his sideswhile answering a question. He also showed signs of being distracted by thevoices of those around him when he was speaking, such as turning his headtowards them and frowning during the response time. His brow also becameincreasingly furrowed and sweaty during the preparation times. In contrast tothe live version, where he showed signs of amusement and even enjoyment,he looked increasingly anxious and frustrated as the tape test progressed. Itshould be noted in relation to these comments that Wing Li may have beenslightly better prepared for the tape version of the oral interaction sub-testthan Abdul by virtue of the fact that, unlike this other candidate, she hadalready completed the listening sub-test conducted in the language laboratoryearlier in the day.
In conclusion, despite the best intentions of the test developers to match thetwo versions, observation of Abdul and Wing Li under the live and tape testconditions appeared to indicate that the live version was fundamentallyinteractive in practice while the tape version was essentially monologic. Thisconclusion lends support to the majority view of the team membersinterviewed prior to the trial administration that the speaking skills beingtapped by the two formats are not the same whatever attempts are made toequate them. It also appears that candidates may not necessarily possess thesedifferent abilities in equal measure.
Candidate interviews
Interviews with both candidates were conducted by the researcher on the dayof the trial administration after they had completed the two versions of theoral interaction sub-test. As outlined above, a set of questions were preparedin advance (see Appendix 6.3). However, some flexibility in the precisewording and order in which they were asked was employed in conducting theinterviews.
Abdul reported feeling more nervous on the tape version and found it moredifficult than the live version. He was critical of the lack of interaction in thetape format: he felt it was easier to talk to another person than to a microphonebecause ‘you can ask questions when you don’t understand what to do’ (whichhe did on several occasions) and ‘take your time to answer’. He was verysatisfied with his interlocutor, who built his confidence by giving him ‘plentyof time to think about and answer the questions’. On the tape version hereported needing more time to prepare for some questions, feeling frustratedat being unable to ask clarification questions and also pressured to finish hisanswers before being cut off by the instructions for the next task. In general,
134
6 Trial 2: The study of test processes

therefore, he felt the live version was a better test of his ability to speakEnglish. He claimed not to be disconcerted by my presence as the observer orthe video camera in either test.
Wing Li preferred the live version overall. She felt more confident on thetape version but liked the fact there is a interlocutor who responds in the liveversion. She also felt that the live version gave her more opportunity to talk.On the other hand, she found the live tasks slightly harder. She was highlypositive about the fact that all of the instructions on the tape version werewritten as well as spoken. This provision meant that ‘if you didn’t understandthe voice you could read the instructions as well’. Wing Li also reportedfeeling more nervous in the live version as she was anxious about whether shewould understand the interlocutor and, more particularly, whether theinterlocutor would comprehend her. In other words, she perceived the liveversion (unlike the tape version) to be essentially a test of her ability tointeract with another person. In general, she felt the live version was a muchbetter test of her proficiency because she was more aware of the need tocommunicate and therefore tailor her language appropriately. Surprisingly,she expressed no dissatisfaction with her interlocutor’s performance in thelive version, a view which was at odds with my own observation (see above).This discrepancy will be explored later in this chapter. Finally, like Abdul, sheclaimed not to be distracted by my presence or the video camera.
In retrospect, another important piece of information that should have beenobtained from each of the candidates in these interviews related to theirprevious experience with language laboratories in general and tape-mediatedtests in particular. This may have provided another important perspective onwhy their performances on the two versions appeared to differ so markedly.However, because of the very limited time frame in which these interviewscould be conducted on the day of the trial administration, the focus wasentirely restricted to the candidates’ experiences of the live and tape events inthis test.
Candidate questionnaires
Seventy-seven of the 94 candidates who undertook both versions completedthe questionnaire about their reactions to the two test formats at the end of thetrial administration (included as Appendix 6.4). As previously noted thisquestionnaire was a revised form of the one used earlier in the December 1992trial. Table 6.3 provides a summary of test taker reactions to the mainquestions together with the matching figures, where applicable, from anearlier study undertaken by Hill (1997) of the December 1992 trial. Theresults indicate a clear preference for the live test in both trials. However,despite the fact that the overwhelming majority of candidates thought the liveversion a better test, it is worth noting that more than half of them (58%) inthe 1994 trial still felt the tape version was a good test of their spoken English.
135
6 Trial 2: The study of test processes

Table 6.3
Candidate reactions: June ’94 and December ’92 trialsof the oral interaction sub-test
Which test made you feel more nervous?
June ’94: Tape 68% Live 27% Same 5%(Dec ’92: Tape 60% Live 40% Same – )
Which test was more difficult for you?
June ’94: Tape 95% Live 5%(Dec ’92: Tape 85% Live 15%)
Which test gave you more opportunity to speak English?
June ’94: Live 95% Tape 5%
Do you think the tape version was a good test of your spoken English?
June ’94: Yes 58% No 26% Not sure 16%
Do you think the live version was a good test of your spoken English?
June ’94: Yes 94% No – Not sure 6%
Which one was a better test of your spoken English?
June ’94 Live 94% Tape 5% Same 1%(Dec ’92: Live 90% Tape 10% Same – )
Both Abdul and Wing Li completed the questionnaire and their responsesprovide an additional source of information about their reactions to the twoversions of the test. Generally these responses were consistent with thosegiven earlier on the same day in their interviews and my own observations.
Both candidates felt the live version gave them more opportunities to speakEnglish and that it was a better test of their spoken English. Abdul felt morenervous on the tape test and also found it more difficult. Wing Li, on the otherhand, felt more nervous in the live version and found it more difficult than thetape version.
In their responses to other more detailed questions dealing with the tapeversion separately, both candidates reported that the tape was always audible,the instructions were clear, that the test was pitched at the appropriate level ofdifficulty overall but that there was sometimes insufficient time given to
136
6 Trial 2: The study of test processes
complete their answers. Abdul did not always have enough time to bothprepare and answer the questions and was not sure whether it was a good testof his spoken English. Wing Li, on the other hand, felt there was alwaysadequate preparation time but sometimes insufficient time to respond on thetape. She also thought that the tape test was not a good test of her spokenEnglish.
The responses of the two candidates to the parallel questions on the liveversion were identical. They both always felt they understood the instructionsand had enough time to prepare and answer the questions. They thought theinterlocutor was consistently helpful, the test pitched at the appropriate levelof difficulty overall and this version to be a good test of their spoken English.
Interlocutor interviews
The interlocutor interviews were conducted immediately after the twocandidates had completed the live version. The questions initially devised forthese interviews are included in Appendix 6.5.
Interlocutor 1 thought that Abdul did well and improved as the testprogressed. He also felt that he performed well as an interlocutor, that he hadnot been too intrusive and allowed the candidate sufficient time to completehis responses. In this instance his self-assessment was consistent with my ownobservations about his performance. Furthermore, he claimed not to bedistracted by the presence of an observer and the video camera.
This interlocutor also believed that the live version would be superior tothe tape version because ‘we normally use language with other people’. Thus‘the interactive (sic) version was more natural’ and provided ‘the sort of propsyou normally get from other people in a communicative situation’. He felt thetape version would be much more ‘artificial’ and ‘impersonal’ for thecandidates.
Interlocutor 2 thought that Wing Li performed fairly well but that sheseemed more comfortable with the last two sections of the test, the expositionand discussion tasks. She also felt that her own performance as an interlocutorwas creditable, that she had been encouraging and had allowed the candidatethe opportunity to respond fully on each of the tasks. This self-assessment rancontrary to my own evaluation of her performance. In addition, although atthe time of the interview she suggested that the video camera had notdistracted her unduly, she later volunteered that it had made her uneasy andthat this may have negatively affected her interaction with the candidate.
This interlocutor also considered that the live version offered a bettercontext for assessing oral proficiency because of the participation of‘hopefully sympathetic interlocutors who could put the candidates at ease byencouraging and reassuring them’.
137
6 Trial 2: The study of test processes

Rating processes
Before completing their assessments all raters (and the researcher as a non-participant observer) attended a calibration session conducted by a member ofthe test development team. This provided raters with the opportunity tocompare their scoring of a small sample of live and tape performances fromthe trial. These sessions represented an important component of raters’ on-going training whose major goal, as outlined in Chapter 3, is to achieve highlevels of self-consistency (as opposed to absolute agreement) amongst raters.It was interesting to note in observing this particular calibration session thatthe comparability of the two versions was not specifically addressed. Thissuggested that the test equivalence issue was not an important concern in theassessment process for either those conducting the training sessions (membersof the test development team) or the raters themselves.
The particular raters assigned to Abdul and Wing Li were as follows:
ABDUL: LIVE RATERS 7 & 89ABDUL: TAPE RATERS 3 & 46WING LI: LIVE RATERS 3 & 72WING LI: TAPE RATERS 7 & 39
The raw scores assigned by these raters (and rater 12 – see below) to Abduland Wing Li are tabulated in Appendix 6.6.
Rater interviews
Each of these six raters was subsequently interviewed about the performanceof their assigned candidate. The questions prepared for these interviews areincluded in Appendix 6.7. Since raters 3 and 7 had carried out more than oneof these assessments they were interviewed on two different occasions. Whilethe whole group of 22 raters was informed beforehand that they might beinterviewed over the course of the two-day rating period, these six raters werenot aware that they would be questioned about either Abdul or Wing Li untilthey had completed their assessment of them.
The two raters who assessed Abdul’s live performance felt he hadperformed fairly but had improved as the test progressed. Rater 7 remarkedthat he had shown himself to fullest advantage in the final discussion taskwhere he was ‘given most room to develop his answer’. Rater 89 suggestedthat the interaction between candidate and interlocutor had been successfulboth because the interlocutor had been ‘very effective in supporting Abdul’and because Abdul himself had displayed ‘strong interactive skills’.
Those raters who assessed Abdul’s tape performance both indicated that heseemed ill at ease under this test condition (‘a bit phased’ in the words of rater3) and would probably have performed better on a live test where, as rater 46
138
6 Trial 2: The study of test processes

suggested, ‘he could have been prompted to speak more’. Both ratersremarked on how slow he often was to begin responding. This wouldnormally result, as rater 3 pointed out, in him having insufficient time tocomplete his answers.
The raters who scored Wing Li’s live test agreed that she had performedinconsistently across the various tasks. However, they had very differentviews on the performance of her interlocutor and of how interlocutors shouldbehave in general. Rater 3 applauded the fact that the interlocutor had adheredvery strictly to her designated script. This was consistent with her belief that‘interlocutors must be rigidly consistent, otherwise they’re giving someone anadvantage over someone else by helping them too much’. Rater 72, on theother hand, felt that the interlocutor ‘stuck too much to the script’ and that sheshould have been ‘more flexible’ in order to encourage the candidate to speakat greater length. This suggests that raters may have conflicting views aboutthe behaviour of ‘good interlocutors’ in the live version of this test. This isconfirmed by Morton and Wigglesworth (1994) in a study where raters wererequired to classify interlocutor behaviour on the live version of the access:test as poor, average or good. They found it was quite common for two ratersto disagree on their classifications of an interlocutor’s performance with anyparticular candidate. Using multifaceted Rasch analysis, McNamara andLumley (1993) also report a lack of consensus in rater perceptions ofinterlocutor competence in the speaking sub-test of the Occupational EnglishTest (OET) introduced in Chapter 2.
Raters 3 and 72 also disagreed about whether Wing Li had providedsufficient output in order to be reliably assessed on the live version. Unlikerater 3, rater 72 considered that Wing Li had often failed in this respect. Shefelt that this was a function of the candidate’s ‘poor interactive skills’ as wellas the interlocutor’s inability or reluctance to ‘draw her out more’. Thus, rater72’s judgements about the interactive competence of both the interlocutor andcandidate appear to have been informing her ratings even though the scoringcriteria did not specifically address this ability. This point will be pursued inChapter 7.
Finally, the raters who assessed Wing Li’s tape test both felt the candidatehad performed very well overall. Rater 89 also remarked that Wing Li had‘given an extremely consistent performance’. Rater 39 commented that thecandidate had seemed ‘pretty relaxed and confident in tackling the test’.However, this rater also reported experiencing difficulty deciding between theupper levels for most of the relevant rating criteria, especially levels 5 and 6,in scoring this candidate. He felt the descriptors did not distinguish clearlyenough between the different levels of performance ‘for more ablecandidates’. This sentiment was not shared by rater 89 overall. However, shedid comment that the descriptors used to distinguish higher levels ofperformance for the category Fluency could have been clearer.
139
6 Trial 2: The study of test processes

The feedback obtained from these raters will be further examined inrelation to their scoring of the two candidates in Chapter 7.
Rater questionnaires
All 22 raters who participated in this trial were given a written questionnaireconsisting of four questions requiring them to express their opinions about thecomparability of the two versions (see Appendix 6.8). The first threequestions focused upon, first, whether the live and tape-based versions servedequally well as tests of oral proficiency; secondly, whether the scoring criteriaand accompanying level descriptors were appropriate for both versions; and,thirdly, whether one version was more difficult to rate than the other. In thefinal question, raters were invited to raise any other issue related to thecomparability question.
Overall, raters were fairly even-handed in their responses to the firstquestion. On the one hand, the live version was deemed to be a more ‘natural’and ‘authentic’ communicative event but on the other hand, the performanceof the candidate was felt to be strongly influenced by the interlocutor’sperformance. On the positive side, the tape version was generally consideredto be more impartial because the quality of the input is the same for allcandidates. On the negative side, it was felt to be a more ‘artificial’ contextfor oral communication (‘like talking into a black hole’ in the words of onerater) and also that candidates’ familiarity with the language laboratory mayhave significantly affected their performance. In general, despite these formatspecific differences, raters felt that the two versions served equally well astests of oral proficiency.
In their responses to the second question, the overwhelming majority ofraters felt that the scoring criteria and accompanying level descriptors wereappropriate for rating both versions. However, several questioned whyComprehension was not included as a category on the tape version.
Answers to the third question suggested that both versions were at timesdifficult to rate for quite different reasons. The tape version was consideredproblematic to rate where candidate responses were very brief or else totallyirrelevant in relation to the task requirements (even though relevance was nottargeted by any of the scoring criteria). At times it was felt that candidates hadinsufficient time to answer appropriately, especially those who used part ofthe response time to continue preparing or spoke slowly. In these cases ratersfelt there was often an inadequate sample of language to make a reliableassessment. Several raters complained of variable sound quality on the tapeversion, although this appears to have been a more widespread problem on thelive version. Audibility is a serious concern in speaking tests where candidatesare rated from audio recordings. In their study of the OET using multifacetedRasch analysis, McNamara and Lumley (1993) found that imperfectly audible
140
6 Trial 2: The study of test processes

tapes were rated significantly more harshly than perfectly audible tapes.Where raters found the live version difficult to assess it was usually
because of what was perceived to be poor interlocutor behaviour, making italmost impossible for them to focus solely on the candidate’s performance.The quality of the interlocutor’s input and feedback was therefore seen tohave a strong bearing on the candidate’s performance. This was particularlythe case on the role play where poor interviewers tended to dominate theexchange resulting in limited, sometimes insufficient candidate output. Someraters claimed to take the interlocutor variable into account in theirassessments, i.e. they tended to compensate in their ratings where theinterlocutor’s performance was less than satisfactory. The study byMcNamara and Lumley also lends strong support to this finding. Again usingmultifaceted Rasch analysis, they found a significant overall trend for ratersto favour candidates paired with interlocutors they perceived to be lesscompetent. As suggested above, audibility in the live version was anothermajor problem consistently raised by raters, even though interlocutors wereinstructed to check the quality of the recording after the first part of the test(the warm up phase). Quite a few raters also claimed that the live version wasless efficient to rate than the tape-based version, where the counter could beused to fast forward to the next response because of the standardisation ofinput, preparation and response times.
Overall, neither version clearly emerged as more difficult to assess fromthe rater questionnaires. The factor that appeared to most strongly influenceraters’ perceptions of comparative ease of marking was the performance ofinterlocutors on the live version. One rater probably summed up the feelingof the group as a whole by suggesting the following overall order of difficultyin assessing candidate performance on the two versions: a live test with a‘good’ interviewer was the easiest to rate followed by the tape test and thenthe live test with a ‘poor’ interviewer.
Finally, no significantly new points about the comparability issue emergedin the more open-ended final question. In general, this question was used byraters to elaborate their responses to the earlier questions, particularly theirviews on the relative difficulty of assessing the two versions.
The additional rater
Since, as noted previously, the rating design for the trial was such that no raterassessed any individual test taker twice, i.e. under both live and tapeconditions, it was decided that a more direct comparison of each candidate’sperformances under the two test conditions from the perspective of a singlerater should also be obtained. One of the most experienced and reliable raters(rater 12), who had not originally been assigned to either Abdul or Wing Li inthe scoring of this trial administration, was therefore engaged to assess both
141
6 Trial 2: The study of test processes

their live and tape performances several weeks after the other ratings had beencompleted. Rater 12 carried out these assessments using the video recordingsof the performances of Abdul and Wing Li. (See Appendix 6.6 for a completelist of the raw scores rater 12 allocated to Abdul and Wing Li.)
In a follow-up interview with the researcher rater 12 was questioned abouthis own judgements of the test performances of the two candidates. He wasalso invited to comment on both the researcher’s observations about how wellAbdul and Wing Li performed under the two test conditions and on the post-test feedback given by each of them as well as by their respective interlocutorsand raters. This provided a test of the reliability of the conclusions drawn bythe researcher based on these various sources of evidence.
Rater 12’s scoring of the two candidates is discussed in Chapter 7 wherethe comparability of test scores from the June 1994 trial is examined. Thefocus of attention at this stage is the follow-up interview where he providedvaluable insight into the performances of Wing Li, in particular. He agreedthat Wing Li performed less well on the live version and that this may beexplained by both her discomfort in undertaking a test involving interactionand not being well supported by her interlocutor. Because Wing Li wasnervous herself, he suggested, she may not have been aware of ‘how much theinterlocutor was feeding into her anxiety’ by rushing through the test andproviding minimal support in the interaction. In any case, the interlocutor’smore formal, less supportive demeanour, rater 12 suggested, may have beenin accordance with the candidate’s expectations about the behaviour ofexaminers in oral language tests. These reasons might then explain why sheexpressed no dissatisfaction with her interlocutor afterwards. On the tapeversion, however, rater 12 felt that Wing Li seemed more confident andrelaxed, and therefore more able to demonstrate her oral proficiency. Sheappeared to be ‘quite familiar with the language laboratory environment’ and‘to use both the preparation and response times very efficiently’ under theseconditions. This rater also observed that Wing Li was always ready to beginspeaking when the cue to do so was given and considered that she had alwaysprovided sufficient language output for an accurate assessment to be madeeven though her response was sometimes cut off by the next question. Finally,while rater 12 considered that Wing Li’s performance on the tape version wasgenerally superior to the live version, he stressed that the difference wasprobably not great.
Rater 12 felt that Adbul performed better on the live version than the tapeversion. He agreed that Abdul’s interlocutor was more successful than WingLi’s in drawing him out with ‘encouragement, patience and positive verbal aswell as non-verbal feedback’. Adbul seemed less comfortable (‘a bit wooden’)on the tape version: he appeared to have more difficulty planning effectivelyand then providing a coherent response in the time allowed. However, hisoverall level of performance did not appear to be significantly lower than on
142
6 Trial 2: The study of test processes

the live version.Finally, rater 12 considered Wing Li had outperformed Abdul on both the
live and tape versions of the test. In his view, Wing Li consistentlydemonstrated a higher level of oral proficiency (as defined by the scoringcategories used to rate the test) under both test conditions.
ConclusionThe examination of the processes reported in this chapter appear to supportthe conclusion drawn from the analysis of candidate output in Chapter 5 thatthe two versions of the access: oral interaction sub-test tapped distinctlydifferent components of the oral proficiency construct, i.e. interactive versusmonologic speaking ability. Despite the test developers’ careful attempt tominimise interaction in all tasks except the role play on the live version inorder to equate the two versions, it appears that the live format, in practice,called into play the candidate’s interactive competence in a sense that isabsent from the tape version. This was clearly evidenced in the liveperformances of the two trial candidates studied in the June 1994 trial, whereboth the interlocutor and the candidate in each case relied on a broad range of‘unscripted’ verbal and non-verbal feedback to communicate with each otherthroughout all stages of the test.
Thus, notwithstanding its highly scripted nature, the live version turned outto be a sustained, two-way face-to-face exchange between the interlocutor andcandidate which involves substantial negotiation of meaning. The tapeversion, on the other hand, consisted entirely of a series of one-way ‘remote’exchanges in which the candidate prepares and responds within rigid timelimits to an audio recorded voice. Given that the two versions draw on suchdifferent oral skills, it is perhaps unsurprising that some test takers performdistinctly better in either one of these communicative settings. Both Abduland Wing Li, the two candidates tracked in the June 1994 trial, fell into thiscategory.
However, the study of these two individuals also suggested that any givencandidate’s final result on either version may be significantly affected byfactors other than their oral language proficiency (under either the live ortape-based conditions). The most salient of these factors was the quality of theinteraction between candidate and interlocutor on the live version. However,the adequacy of preparation and response times on the tape version and thecandidate’s level of comfort under the two conditions as test environmentsalso appeared to influence the quality of the performance. Such factors posethreats to the reliability of measurement across the two versions.
143
6 Trial 2: The study of test processes

It seems, therefore, that the two formats tap different speaking skills andmay also fail to yield a satisfactory level of consistency in the measurementprocess. Both factors could well explain the apparent lack of test scoreequivalence found in the December 1992 trial (Chapter 4). The question oftest score equivalence for both the entire test cohort and the two candidatestracked in the June 1994 trial will be examined in Chapter 7.
144
6 Trial 2: The study of test processes

145
Trial 2: The analysis of testscores
IntroductionThe previous chapter provided a naturalistic perspective on the equivalenceissue focusing on the test design, test taking and rating processes. A range ofqualitative and quantitative data was gathered using observation, interviewsand questionnaires collected before, during and after the June 1994 trial of theaccess: oral interaction sub-test. This chapter reverts to a more positivisticorientation focusing on the analysis of scores from the same trial, although italso uses some of the qualitative data obtained from the rater interviews tointerpret these scores. As in the December 1992 trial the scores were analysedusing the multi-faceted Rasch measurement computer program, FACETS(Linacre 1989–95).
As outlined in Chapter 6, the audio recordings of a total of 94 candidatesobtained from both versions of the test were independently scored by tworaters. For this trial the analysis of candidate performance was based on twodifferent methods of generating ability estimates from the FACETS program:first, the difficulty estimates from a number of previously trialled items were‘anchored’, i.e. preset in the analysis and secondly, the analysis was carriedout without this modification (as per the analysis of the December 1992 trialin Chapter 4). The chapter also reports on the use of an additional rater toclarify the scores originally assigned to the two candidates tracked in the trial(see Chapter 6). Finally, the findings from the application of bias analysis toinvestigate the interaction between individual raters and both candidates andformat are discussed.
Analysis with anchored item difficulty estimatesFollowing the first trial in December 1992 it became standard practice, whentrialling new forms of the live and tape versions of the oral interaction sub-test, to include several previously trialled tasks. The difficulty estimates of theitems from these tasks were then ‘anchored’ in the control file prior to runningthe FACETS program, i.e. the difficulty estimates for these items were presetinto the analysis in advance using the figures from the earlier trials. This
7

146
7 Trial 2: The analysis of test scores
process enabled results from one form of the test to be meaningfullycompared with earlier forms of the test. It also allowed cut-off points for thedifferent proficiency levels of the oral interaction sub-test (see Table 2.4 inChapter 2) to be carried forward from one administration to the next. In thistrial the ‘anchors’ were the description and exposition tasks on the live versionand the summary task on the tape version. In addition, only three facets werenow included in the analysis to ensure stability of estimate of facets: (1)candidate, (2) rater and (3) item.
Initially, in accordance with the established procedure for analysing testscores from both trial and overseas administrations, the live and tape datawere treated as coming from the same test and combined to obtain abilityestimates for each of the 94 candidates. The FACETS analysis in this caseincluded the anchored difficulty estimates previously obtained for the itemslisted above. In addition, for the purpose of this study, separate analyses of theentire live and tape data sets, this time anchoring all of the item abilityestimates obtained from the combined analysis, were then carried out. Thiswas done so that the established cut-off scores would apply to the results fromthe two formats taken separately. The results for the three facets candidate,rater and item from the analyses using the combined, live and tape data setsare given in Appendix 7.1. Table 7.1 below provides summary statistics forthese analyses.
Table 7.1
Summary statistics, oral interaction sub-test, FACETS analysis (1),June 1994 trial (N = 94)
LIVE TAPE COMBINED
Number of items 20 25 45Candidates:Mean logit score -0.31 0.31 0.14SD (logits) 2.19 2.22 1.75Mean standarderror (logits) 0.27 0.24 0.20Person separationreliability(like K-R 20) 0.98 0.99 0.99
The candidate ability estimates obtained for the live and tape versionscorrelated only moderately well at r = 0.80. Figure 7.1 (below) illustratesgraphically the performance of all candidates on the two versions.
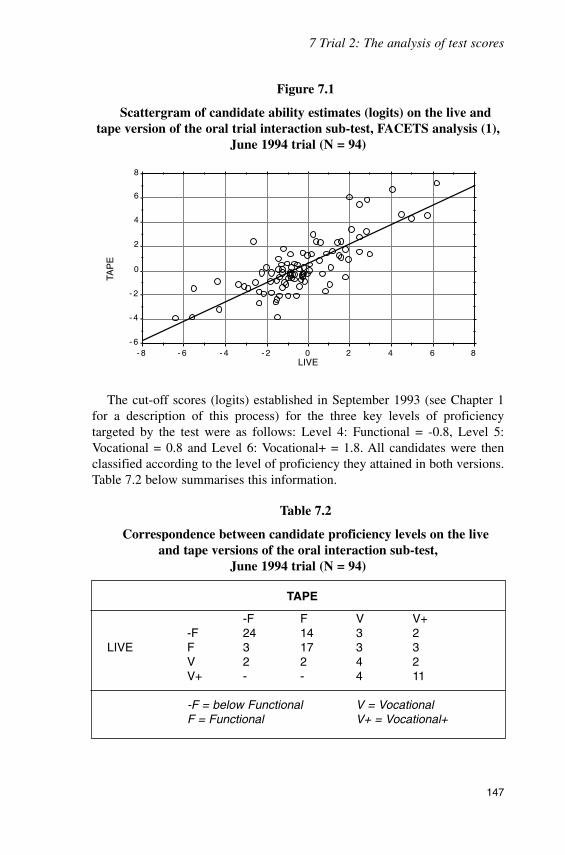
147
7 Trial 2: The analysis of test scores
Figure 7.1
Scattergram of candidate ability estimates (logits) on the live andtape version of the oral trial interaction sub-test, FACETS analysis (1),
June 1994 trial (N = 94)
The cut-off scores (logits) established in September 1993 (see Chapter 1for a description of this process) for the three key levels of proficiencytargeted by the test were as follows: Level 4: Functional = -0.8, Level 5:Vocational = 0.8 and Level 6: Vocational+ = 1.8. All candidates were thenclassified according to the level of proficiency they attained in both versions.Table 7.2 below summarises this information.
Table 7.2
Correspondence between candidate proficiency levels on the liveand tape versions of the oral interaction sub-test,
June 1994 trial (N = 94)
TAPE
-F F V V+-F 24 14 3 2
LIVE F 3 17 3 3V 2 2 4 2V+ - - 4 11
-F = below Functional V = VocationalF = Functional V+ = Vocational+
- 6
- 4
- 2
0
2
4
6
8
- 8 - 6 - 4 - 2 0 2 4 6 8LIVE
TAP
E
LIVE

148
7 Trial 2: The analysis of test scores
Overall these results indicated that 40% of all candidates were assigned adifferent level of proficiency on the two versions of the test. 28% did betteron the tape test and 12% on the live test. In some cases (11% of all candidates)there was a discrepancy of more than one level. These findings suggestrelatively poor consistency of measurement across the two formats of the oralinteraction sub-test.
While these figures certainly indicate a significant difference in terms ofoverall performance on the two versions, they should still be interpreted withsome degree of caution. The fact that a significant percentage of candidateswere classified differently by the two versions of the oral interaction sub-testin both the December 1992 trial (12%) and even more so in this trial may havebeen partially a function of the way in which the cut-off scores wereestablished. This is a highly problematic issue in criterion-referenced tests andis a major ongoing source of concern amongst measurement specialists (see,for example, Cizek 1993). It appears from the research in this area thatdifferent standard-setting methods lead to different classifications. It could be,for instance, that the degree of correspondence between results on the twoversions of the test might have been higher using a different method ofstandard setting other than the ASLPR.
In the cases of two candidates tracked in the trial, candidates 39 (Abdul)and 88 (Wing Li), there was a sharp discrepancy between their live and tapeability estimates as shown in Table 7.3 below. In Abdul’s case, however, thisdid not affect the overall proficiency level to which he was allocated in thefinal analysis, making him one of the 60% of candidates who achievedthe same level on the two versions. Wing Li, on the other hand, achieved thehighest possible proficiency level on the tape version and the lowest possiblelevel on the live version. She thus formed part of the 40% of candidates whowere allocated different proficiency levels on the two tests and, moreparticularly, of the 11% for whom there was a discrepancy of more than oneproficiency level.
Table 7.3
Proficiency levels achieved by Abdul and Wing Li on the liveand tape versions of the oral interaction sub-test,
June 1994 trial (N = 94)
CANDIDATE LOGIT PROFICIENCY LEVEL
Wing Li: tape 1.84 Vocational +Wing Li: live -1.22 below FunctionalAbdul: live -1.56 below FunctionalAbdul: tape -2.64 below Functional

149
7 Trial 2: The analysis of test scores
The discrepancy between Wing Li’s logit scores on the two formats isclearly the more disconcerting set of results as the access: oral interactionsub-test aimed to identify candidates reliably at the Functional, Vocationaland Vocational+ levels. It was not designed to distinguish accurately betweencandidates below Functional level. While the difference in Wing Li’s resultsturned out to be highly significant, both of Abdul’s results can simply be readas him not achieving Functional level on either version. A possibleexplanation for the strength of the discrepancy between Wing Li’s final resultswill be pursued later in this chapter.
The data from the test taker questionnaires collected in this trial (seeChapter 6) also enabled analysis of these ability estimates from the twoversions in relation to characteristics of test takers and of the test process. Ofthe 77 respondents, there were 39 males and 38 females. 57% of males and45% of females gained higher scores on the live format, suggesting men wereadvantaged slightly more by the live version and women by the tape version.However, the reasons for these findings are unclear since gender differencesin performance may stem from the rating process (i.e. the way in which ratersresponded to a particular gender) as much as features of the two test eventssuch as the interaction between interlocutor and candidate on the live versionor the degree of comfort with the laboratory as a test environment in the tapeversion. (See Sunderland (1995) for a discussion of these issues in speakingtests.)
A further issue in comparing test taker performance on the two versions inthe trial situation relates to the possible extraneous influence of a ‘practiceeffect’ on test scores, given that candidates undertook both formats on thesame day. It is worth remembering at this point that candidates in overseasadministration only complete one version. 33 of the 77 candidates in this trialwho completed the questionnaire undertook the live version first and 44 thetape version. 44% scored higher on the version they did first, a result whichsuggests that there was not a significant practice effect overall (in either apositive or negative sense) on candidate performance across the two versions.
The next section examines the output from the FACETS analysis of theJune 1994 trial, where the difficulty estimates of previously trialled itemswere not ‘anchored’ in order to provide a more direct comparison with theresults obtained from the analyses of the December 1992 trial, in which thiswas also the case. In both instances the lack of anchoring in the analysis canbe understood to have yielded a more independent set of candidate abilityestimates, i.e. they were uninfluenced by the results (specifically, the itemdifficulty estimates) obtained from earlier administrations of the test.

150
7 Trial 2: The analysis of test scores
Analysis with unanchored item difficultyestimates
The set of procedures adopted in the second phase of the analysis wasidentical to those used to examine the comparability of the test scores fromthe December 1992 trial in Chapter 4. That is, the comparability of the directand semi-direct versions of the oral interaction sub-test was examined fromthe perspectives of the psychometric unidimensionality and the relativedifficulty of the two versions. Subsequent bias analyses were also carried out,in this case to investigate both the interaction between raters and candidatesand the interaction between raters and the two test formats, i.e. live and tape-based.
Psychometric unidimensionality
Recall from Chapter 4 that the issue addressed here is whether it is possibleto construct a single measurement dimension of speaking ability for thecombined data from the two versions of the test. If so, this would providecompelling evidence in favour of the equivalence of test scores. In order toinvestigate this question three initial multi-faceted analyses using theFACETS program were undertaken: one for the combined data, one for thelive data and one for the tape data. Only the following three facets wereincluded in the analyses. Here these were: (1) candidate, (2) rater and (3) item.Appendix 7.2 shows the results for each of these facets in the analyses usingthe live, tape and combined data. Table 7.4 below provides summary statisticsfor candidates in each of the three analyses.
Table 7.4
Summary statistics, oral interaction sub-test, FACETS analysis (2),June 1994 trial (N = 94)
LIVE TAPE COMBINED
Number of items 20 25 45Candidates:Mean logit score - 0.13 0.06 0.18SD (logits) 2.27 2.23 1.75Mean standarderror (logits) 0.28 0.24 0.16Person separationreliability(like K-R 20) 0.98 0.99 0.99

151
7 Trial 2: The analysis of test scores
Table 7.5 below provides information on misfitting items and persons inthe original FACETS analysis using the live, tape and combined data sets. Asin the study of the December 1992 trial ‘misfit’ is defined operationally interms of candidates, raters or items whose infit mean square value given in theFACETS output is more than 2 standard deviations above the average figurefor the relevant set of candidates, raters and items. Using this baseline, therewere no misfitting items in this initial set of analyses. However, the criterionIntelligibility almost fell into this category on the role play and discussiontasks for the live data taken separately, on the role play and discussion tasksfor the tape data taken separately, and on all of these items in the output fromthe analysis of the combined data set. This suggests that Intelligibility, likeAppropriacy as used in the December 1992 trial, may have been interpretedinconsistently by raters overall even though this criterion technically passesthe ‘fit’ test. A possible way of offsetting this problem would have been forthe level descriptors to be revised and for raters to have been more carefullytrained and monitored in scoring this category. If Intelligibility still showed aconsistent trend towards misfit following this process, then its relation to theother categories used in the test may have needed to be re-examined, i.e. itmay have been assessing a different ability from the one measured by theother categories. Finally, Comprehension also fell just short of beingmisfitting here, thus confirming the conclusion from the earlier trial that itsinclusion as an item in the live version only undermines the equivalence of thetwo tests.
Table 7.5
Misfitting items and persons, FACETS analysis (2),June 1994 trial (N = 94)
LIVE TAPE COMBINED
Mean SD Mean SD Mean SDItem infit 1.0 0.3 1.0 0.3 1.0 0.3Person infit 1.0 0.3 1.0 0.3 1.0 0.4
Misfitting items and personsItems – – –Persons 2 3 4
(#76,84) (#58,60,98) (#58,60,68,98)
The five misfitting candidates from the live and tape versions takenseparately were then removed from the data files. Given that their pattern ofscoring was inconsistent with the general pattern of scoring for the test cohortoverall it was decided, as in the analysis of the December 1992 trial score

152
7 Trial 2: The analysis of test scores
data, to exclude these candidates from the analysis in the interests of obtaininga clearer picture of the overall equivalence of test scores from the twoversions. The edited data were then re-entered into the FACETS programusing the same three facets, i.e. candidate, rater and item. Again there werethree data files: one for the live data, one for the tape data and one for thecombined data. Appendix 7.3 shows the results for each of the three facetsusing the live, tape and combined data sets. Table 7.6 below providessummary statistics for candidates in each of the three analyses.
Table 7.6
Summary statistics, oral interaction sub-test, FACETS analysis (3),June 1994 trial (N = 89)
LIVE TAPE COMBINED
Number of items 20 25 45Candidates:Mean logit score - 0.10 0.06 0.17SD (logits) 2.38 1.14 1.88Mean standarderror (logits) 0.28 0.24 0.17Person separationreliability(like K-R 20) 0.99 0.99 0.99
Table 7.7 below provides information on misfitting items and personsobtained from the FACETS analyses using the edited live, tape and combineddata sets. These results suggested (initially, at least) that when the edited liveand tape test data were treated as a single test all items combined to define asingle measurement dimension, and the overwhelming majority of candidates(with only one exception) had been measured meaningfully and reliably interms of the dimension of ability so constructed. There was only onemisfitting item across all three analyses – Intelligibility on the discussiontasks for the live data set. However, as in the initial analyses using theunedited data, the same criterion was almost misfitting on the role play taskfor the live data considered separately, on the role play and discussion tasksfor the tape data taken separately, and on all of these items in the output fromthe analysis of the combined data set. Again, the item comprehension almostmisfitted on the analysis using the combined data set.

153
7 Trial 2: The analysis of test scores
Table 7.7
Misfitting items and persons, FACETS analysis (3),June 1994 trial (N = 89)
LIVE TAPE COMBINED
Mean SD Mean SD Mean SDItem infit 1.0 1.3 1.0 0.3 1.0 0.3Person infit 1.0 0.3 1.0 0.2 1.0 0.2
Misfitting items and personsItems 1(#18) – –Persons – 1(#12) 2(#68,100)
Recall from Chapter 4 that if the two versions of the oral interaction sub-test taken together satisfy the psychometric unidimensionality assumption,then the person ability estimates derived from each version consideredseparately should be independent of the part of the test on which they weremade. This would then suggest that the scores on the two versions wereequivalent and that the two versions were therefore interchangeable, at leastfrom this perspective. The same two statistical tests employed to examine thetest scores from the December 1992 trial in Chapter 4 were used to addressthis issue.
The first test to be used was a Pearson correlation between the abilityestimates obtained from the two versions of the test. The correlation betweenthe two sets of ability estimates uncorrected for attenuation was r = 0.80 (thesame result as in the previous section where anchored item difficultyestimates were used in the analyses). The result, when corrected forattenuation, was r = 0.81. This result suggested a weaker relationship betweenthe ability estimates of candidates on the two versions than was the case in theDecember 1992 trial where r = 0.94. Figure 7.2 below graphically illustratesthe relationship between scores on the live and tape versions in this trial.

154
7 Trial 2: The analysis of test scores
Figure 7.2
Scattergram of candidate ability estimates (logits) on the live andtape version of the oral trial interaction sub-test, FACETS analysis (3),
June 1994 trial (N = 89)
As suggested in relation to the analysis of the test score data from theDecember 1992 trial in Chapter 4, the correlation test only provides a measureof the linearity between two sets of scores. An additional, more rigorous testof the equality of ability estimates, a chi-squared (χ2) procedure (as employedby McNamara (1991) and explained earlier in Chapter 4 in relation to theDecember 1992 trial results) was therefore used in order to determine thestrength of relationship between the ability estimates obtained from the twoversions of the oral interaction sub-test in the June 1994 trial. The resultingvalue of χ2 = 1389.15, df = 88, p< 0.001 suggests, as in the December 1992trial, that the null hypothesis of equality between the two sets of abilityestimates can be rejected. On the basis of results of this statistical procedure,therefore, it appears (as in the analysis of the test score data from theDecember 1992 trial in Chapter 4) that the assumption of psychometricunidimensionality has not been met. This finding therefore lends furthersupport to the existence of a test method effect, the components of which aresummarised later in this chapter.
Test difficulty
The next stage of the investigation concerned the question of comparativedifficulty on the two versions of the test. The first step in this process was tomap the ‘item’ difficulty estimates obtained from the FACETS analysis usingthe combined (live and tape) edited data. (See Table 6.2 in Chapter 6 for acomplete list of items in this trial.) Figure 7.3 below suggests that the two
- 6
- 4
- 2
0
2
4
6
8
- 8 - 6 - 4 - 2 0 2 4 6 8LIVE
TAP
E
LIVE

155
7 Trial 2: The analysis of test scores
versions matched each other fairly well in terms of overall difficulty (althoughperhaps not quite as closely as in the December 1992 trial – see Figure 4.3,Chapter 4) and that individual corresponding items tended to be ofcomparable difficulty in this trial. In this map items are again abbreviatedaccording to task and criterion, in an identical manner to Figure 4.3. Thus, forexample, ‘DisV’ stands for ‘Discussion: Vocabulary’ and ‘NarF’ for‘Narrative: Fluency’.
Figure 7.3
Item difficulty map, FACETS analysis (3) of the oral interactionsub-test using the combined live and tape data sets,
June 1994 trial (N = 89)
Itemdifficulty(logits) LIVE TAPE
1.0 SumG; SumV0.90.8 RPG0.7 NarG NarG0.6 DesV0.5 DesG; RPG0.4 NarV Des1G; ExpV0.3 NarC Des1V;NarV;InsC;
DisG; Des2G0.2 ExpC; InsV; ComEff0.1 NarC; SumF; Des2V0.0 Exp1V RPF; ExpF
-0.1 DesF; DisG Des 1F; DisF-0.2 Exp2V; ComEff Des2F-0.3 Exp1F; Exp1C InsF-0.4 RPF; Exp2C-0.5-0.6 RPI-0.7 Exp2F; DisI-0.8 RPI; DisF-0.9 DisI-1.0
-2.0-2.1-2.2-2.3 Comp-2.4

156
7 Trial 2: The analysis of test scores
As in the analysis of test difficulty for the December 1992 trial inChapter 4, an additional FACETS analysis including the three facets,candidate, rater and format was later carried out using the combined data setto determine the overall relative difficulty of the two formats. Table 7.8 belowshows that in this trial the tape version was 0.36 of a logit (or about 8%) moredifficult than the live version overall. Although slightly larger than thedifference in overall difficulty in the December 1992 trial (where the liveversion was 0.06 of a logit or 2% harder than the tape version), thisdiscrepancy is still small enough to suggest that, in practical terms, the liveand tape versions are of comparable difficulty.
As argued in Chapter 4 in relation to the December 1992 trial, the findingthat the live and tape versions were highly comparable in difficulty does not,however, imply that the two versions of the oral interaction sub-test arepsychometrically unidimensional. The more appropriate measure of test scoreequivalence was the chi-squared (χ2) test (see above) which compared thecandidate ability estimates obtained from the scores on the live and tapeversions of the test taking into account the relative difficulty of the twoformats. This procedure (as in the earlier trial) indicated that the two sets ofability estimates were not equivalent and thus confirmed the existence of asignificant test method effect.
Table 7.8
Relative difficulty of the live and tape versions of the oral interactionsub-test, FACETS analysis (3), June 1994 trial (N = 89)
Obs Obs Obs Fair Measure Model Infitscore count avrge avrge (logits) SE Mean
sq
16582 3533 4.7 4.6 - 0.18 0.02 1.0 Live19878 4401 4.5 4.4 0.18 0.02 0.9 Tape
On the basis of the results illustrated in Figure 7.3 above it appears thatGrammar was the most harshly scored criterion followed by Vocabulary,Communicative effectiveness, Fluency, Intelligibility and finally,Comprehension (live version only). This order of harshness is very similar tothat obtained in the December 1992 trial except that the order forIntelligibility and Fluency was reversed in this trial and Appropriacy did notfeature as a scoring criterion. Once again, Comprehension was the mostleniently scored criterion, in this case by a considerable margin. The fact thatthe tape version was a little harder overall than the live version appears to bein large part the result of including comprehension on the live test only. It is

157
7 Trial 2: The analysis of test scores
worth underscoring the fact that, as in the December 1992 trial, its inclusionon one version but not the other may, in fact, have jeopardised test scoreequivalence with the tape version since the construct of oral proficiencyacross the two versions is not the same as a result.
Bias analysis
Introduction
We return now to the two candidates tracked in the trial, in particular Wing Li.Recall that while the difference between Abdul’s logit scores from theFACETS analysis using the anchored item difficulty estimates did not affectthe general proficiency level to which he was allocated on the two versions ofthe test, Wing Li was assigned to the lowest possible level (below Functional)distinguished by the test on the live version and the highest possible level(Vocational+) on the tape version. Some of the reasons for the differencebetween Wing Li’s final results on the two versions were suggested inChapter 6. (Particularly salient factors for her were a higher level of anxietyand a fairly unsupportive interlocutor in the live version, and an apparentlygood degree of familiarity with the language laboratory environment.) WhileWing Li did appear to perform better on the tape version for these reasons, themagnitude of the difference between her final results was still somewhatperplexing. In order to explore this discrepancy, the scoring of the additionalrater (introduced in Chapter 6) who assessed both candidates under the liveand tape conditions was examined.
The additional rater (rater 12) ranked the four performances in the sameorder as the ability estimates derived from the FACETS analysis indicated(see Table 7.3 above). However, his total raw scores did not indicate as widea discrepancy between the live and tape performances of Wing Li assuggested by her final proficiency level allocations on the two versions. Thissuggested the possibility that one or more of Wing Li’s original raters mayhave been uncharacteristically harsh or lenient in their scoring. Thishypothesis was investigated using bias analysis, previously introduced inChapter 4.
Rater– candidate interaction
The initial focus of the bias analysis here was on the interaction between raterand candidate. The analysis was based on the edited combined data set(N = 89) to which was added rater 12’s raw scores for Abdul (candidate 39)and Wing Li (candidate 88) on both the live and tape versions. The results forthese two candidates are shown in Tables 7.9 and 7.10.

158
7 Trial 2: The analysis of test scores
Where the Z-score values fall between -2.0 and +2.0, the rater may beconsidered to be scoring that candidate without significant bias. Where thevalue falls below -2.0 the rater is marking the candidate significantly moreleniently in relation to the way that rater does other candidates. On the otherhand, where the value is greater than +2.0 the rater is scoring the candidatesignificantly more harshly compared to the way that rater treats othercandidates. In this analysis the infit mean square value indicates how similarthe rater’s scoring is for the candidate over all of the items. Where the valueis less than 0.7 the rater’s scoring of the candidate lacks variation. Conversely,where it is greater than 1.3 the scores are too independent.
Table 7.9
Bias calibration report, June 1994 trial, rater–candidate interactions for Abdul (candidate 39)
Rater Obs Exp Obs-Exp Bias Error Z-score Infitscore score average (logit) mn sq
3 81 84.4 -0.13 0.27 0.28 1.0 0.57 86 80.8 0.26 -0.60 0.34 -1.8 0.512 198 196.3 0.04 -0.08 0.22 -0.4 0.546 94 91.3 0.11 -0.24 0.34 0.7 0.889 80 83.5 -0.18 0.41 0.34 1.2 0.6
Table 7.10
Bias calibration report, June 1994 trial, rater–candidate interactions for Wing Li (candidate 88)
Rater Obs Exp Obs-Exp Bias Error Z-score Infitscore score average (logit) mn sq
3 85 85.7 -0.04 0.08 0.34 0.3 0.37 119 115.0 0.16 -0.33 0.29 -1.2 0.512 228 231.9 -0.09 0.17 0.21 0.8 0.939 134 115.1 0.76 -1.53 0.28 -5.4 0.472 76 94.2 -0.91 2.03 0.33 6.0 1.1
The Z-scores in Table 7.10 indicate that two of Wing Li’s sets of ratingswere significantly biased and thus unreliable. Rater 39 assessed Wing Li’stape performance significantly more leniently compared to other candidateswhile rater 72 scored the same candidate’s live performance significantlymore harshly than other candidates. These findings would seem to explain, atleast in part, the strength of the discrepancy between the live and tape logit

159
7 Trial 2: The analysis of test scores
scores for this candidate as the ability estimates calculated by the FACETSprogram do not take this kind of interaction into account. None of the raterswho assessed Abdul appeared to be significantly biased in their ratings.Finally, Tables 7.9 and 7.10 indicate that seven of the ten sets of ratingsshowed a tendency for raters to score the test items for these two candidatestoo similarly. The other three sets of ratings were within the accepted range offit.
Possible reasons for the erratic behaviour of two of Wing Li’s raters weresuggested in the rater interviews discussed in Chapter 6. Rater 39 reporteddifficulty in distinguishing between levels 5 and 6 for this candidate.Inspection of Wing Li’s raw scores indicates that this rater gave her the benefitof the doubt on about 50% of the items, all of which were in the second halfof the test. This may explain why his set of ratings for this candidate emergedas significantly more lenient than usual. In rater 72’s case her unexpectedharshness appears to relate to two factors: she seems to have penalised thecandidate heavily for insufficient output linked to what she perceived to beher poor interactive competence, as well as the interlocutor’s reluctance orinability to draw her out. This seems to confirm, as suggested in Chapter 6,that judgements about the interactive competence of both the interlocutor andcandidate were informing rater 72’s ratings even though the scoring criteriadid not specifically address this ability. Rater 3, who also assessed Wing Li’slive performance, expressed no such criticisms of either the candidate orinterlocutor.
On the basis of the results of the bias analysis for Wing Li, it appears thatthere may be a significant interaction effect between some raters andcandidates which is contributing to measurement error on both versions of theoral interaction sub-test and, therefore, to the discrepancy between individualcandidates’ final performance levels under the two conditions. This questionwas further investigated by examining the relevant figures from the biasanalysis for the rest of the trial test cohort. In about 60% of cases there wasevidence of rater bias, i.e. at least one of the four raters allocated to each trialcandidate (two for the live version and two for the tape version) showed atendency to mark the candidate either significantly more harshly or moreleniently than s/he did other candidates. There was also a clearly discernibletrend for the strength of this interaction effect to increase in the case ofcandidates who were subsequently assigned different proficiency levels onthe two versions (i.e. 40% of candidates). This was particularly marked in thecase of candidates where there was a difference of two or more proficiencylevels (i.e. 11% of the test cohort). Given that the interaction effect betweenrater and candidate appears to be contributing strongly, in general, towardsmeasurement error on the ability estimates obtained from both versions of thetest, it would seem highly advisable to employ a third rater where one of thetwo original raters showed evidence of strong bias in relation to a particularcandidate.

160
7 Trial 2: The analysis of test scores
Rater–format interaction.
Another potential source of measurement error in the ability estimatesproduced by the FACETS program is the interaction between raters andformat (i.e. live or tape-based). This issue was investigated in relation to theDecember 1992 trial in Chapter 4.
In the analysis of test difficulty reported previously in this chapter theeffect of test format over all raters, candidates and items was found not to belarge, i.e. the tape version was 0.36 of a logit (or about 8%) more difficult thanthe live version overall. However, as in the December 1992 trial, it was stillconceivable that individual raters judged performances on one formatsignificantly more harshly or leniently than the other. Table 7.11 below showsthe results from the bias analysis, again using the edited combined data set,for raters in this category (five from the total number of 22 raters used in thistrial).
Table 7.11
Bias calibration report, June 1994 trial,rater – format interactions (part)
Rater Format Obs Exp Obs-Exp Bias Error Z-score Infitscore score average (logit) mn sq
39 live 935 880 -0.30 -0.65 0.11 -5.9 1.445 live 702 734 -0.18 0.37 0.11 3.5 0.546 live 398 413 -0.15 0.31 0.14 2.2 0.750 live 1062 1021 0.21 -0.48 0.11 -4.4 0.856 live 885 860 0.13 -0.26 0.10 -2.6 0.939 tape 1102 1156 -0.22 0.47 0.09 5.1 1.445 tape 1056 1024 0.13 -0.27 0.09 -2.9 0.646 tape 349 334 0.18 -0.40 0.16 -2.5 1.050 tape 816 857 -0.21 0.44 0.10 4.3 0.856 tape 926 951 -0.11 0.23 0.10 2.4 0.5
These figures indicate that raters 45 and 46 were significantly more severeon the live version while raters 39, 50 and 56 were significantly more harshon the tape version. Rater 39 also showed a significant tendency to beinconsistent with an infit mean square value of 1.4 on both versions. Inpractical terms, however, the effects of rater bias in relation to the averagedifference it makes to the raw scores allocated by these raters are notsubstantial. In all five cases the raters were, on average, less than half a scorepoint (on a seven-point scale) more or less severe on the live version than thetape version.

161
7 Trial 2: The analysis of test scores
The results of the two bias analyses undertaken here, therefore, suggest thatthe more significant interaction in terms of its overall impact on candidates’final results was between rater and candidate rather than rater and format.Wigglesworth (1993; 1994) also used bias analysis to examine the interactionbetween rater and item on the oral interaction sub-test and then used theresults as feedback to raters as part of their ongoing training. While her initialfindings seemed to indicate that rater performance would improve as aresult of this process, the results of the second study were less clear in theirsupport of this claim. Given the lack of conclusive findings in relation to theeffects of training on rater consistency, a more important concession tocandidates (as noted above) may be to routinely carry out a bias analysisfocusing on the rater – candidate interaction (as undertaken above) and to thenuse a third rater where either or both of the two original raters show evidenceof significant bias in relation to a particular candidate.
ConclusionThis analysis of test scores and band levels obtained by candidates (N = 94)in the June 1994 trial confirmed the apparent lack of equivalence between testscores reported in the December 1992 trial. Again, contrary to the morestandard measures of unidimensionality, the more rigorous measure of therelationship between candidate ability estimates (the chi-squared procedure)indicated that a single measurement dimension of speaking ability could notbe constructed for the combined data obtained from the live and tape versions.
However, the lack of equivalence between test scores was most clearlyrevealed earlier in this chapter when band levels obtained by the trialcandidates on the live and tape versions were compared. This analysisrevealed that 40% of all candidates were assigned a different level ofproficiency on the two versions with 28% doing better on the tape test and12% on the live test. In the case of the two individual candidates tracked inthe trial, Abdul’s results were consistent insofar as he failed to achieveFunctional level on both versions whereas Wing Li achieved the highestpossible band level on the tape version and the lowest possible level on thelive version. She thus formed part of the 11% of candidates for whom therewas a discrepancy of more than one level.
In addition, further bias analyses of the June 1994 test score data indicatedan additional important source of measurement error on both versions, i.e.rater bias with respect to individual candidates. These analyses indicated thatin about 60% of cases there was evidence of rater bias, i.e. at least one of thefour raters allocated to each trial candidate (two for the live version and twofor the tape version) showed a tendency to mark the candidate eithersignificantly more harshly or more leniently than s/he did other candidates.

162
7 Trial 2: The analysis of test scores
There was also a clearly discernible trend for the strength of this interactioneffect to increase in the case of candidates who were subsequently assigneddifferent proficiency levels on the two versions (i.e. 40% of candidates). Thiswas particularly marked in the case of candidates where there was a differenceof two or more proficiency levels (i.e. 11% of the test cohort).
Finally, taking account of the findings in Chapters 5, 6 and 7, it appears thatthe scores obtained from the two versions may not be equivalent, first,because different language abilities are being tapped on the two versions, i.e.interactive and monologic speaking skills and, secondly, because themeasurement process was not sufficiently constrained so as to yield asatisfactory level of reliability across the two formats in both trials. It appearsthat there are a variety of factors in the testing process currently contributingtowards a lack of consistency in the measurement process on the two formats.These include the factors identified in Chapter 6 (i.e. the quality of theinteraction between the candidate and interlocutor on the live version, theadequacy of the preparation and response times on the tape version, andthe candidate’s level of stress under each of the two conditions as testenvironments) as well as the existence of rater bias, particularly with respectto individual candidates on both versions, which has emerged in Chapter 7 asa significant source of measurement error. While there may be other potentialthreats to reliability, the insights gained from this investigation reveal some ofthe complexity of the factors other than the language ability in question whichaffect test scores and how they interact.
Chapter 8 summarises the findings reported in the last four chapters andexplores their implications.

Summary and conclusions
OverviewThis chapter begins by providing a summary of the findings from the variousstudies reported in the previous four chapters. The summary illustrates howeach of the methods used in the study provided important but neverthelesspartial insight into the equivalence of the two versions of the oral interactionsub-test. However, it also reveals that the use of multiple methods ultimatelyyielded a clearer, more comprehensive picture than would have been the caseif only a single method had been adopted.
The chapter then explores the potential implications of these findings, first,for the access: oral interaction sub-test; secondly, for the equivalence of directand semi-direct tests of oral proficiency more generally; thirdly, forcomparability studies in language testing; fourthly, for combining positivisticand naturalistic approaches to research in language testing; and finally, for theinterpretation of test scores in performance tests.
Summary of findingsA preliminary examination of the test specifications (see Chapter 2) indicatedthat the live version of the oral interaction sub-test had been designed tomatch the tape-mediated version as closely as possible partly in response toconcerns expressed in the literature about the potential non-equivalence of thetwo formats. To this end a careful attempt was made by the test developers tominimise interaction between candidate and interlocutor on the live version(with the exception of the role play task) by carefully scripting theinterlocutor’s contribution. It was suggested that this attempt to equate thetwo versions at the design stage gave the study its unique character sinceprevious research has investigated the comparability of direct and semi-directtests (see Chapter 1) where this has not been the case.
The first major part of the study involved several different quantitativeanalyses of numerical score patterns in the December 1992 trial (N = 83) fromthe perspective of psychometric unidimensionality using the multi-facetedRasch program, FACETS (Linacre, 1989–95) (see Chapter 4).
163
8

Standard analyses of the FACETS output (including a study of misfittingpersons and items and also the strength of correlation between the candidateability estimates) appeared to provide support for the assumption ofpsychometric unidimensionality in relation to the two versions of the test.However, a more rigorous measure of the relationship between the abilityestimates, the chi-squared (χ2) procedure, failed to confirm that a singlemeasurement dimension of speaking ability could be constructed for thecombined data obtained from the live and tape versions. In other words,contrary to the more standard measures of unidimensionality, this procedureindicated that the candidate ability estimates obtained from the two versionswere not equivalent.
While the lack of equivalence between test scores obtained from the morerigorous test of unidimensionality was compelling, this finding appearedsomewhat puzzling at this point, given the discrepancy between the differentmeasures used to address this question. Furthermore, even if this conclusionwas accurate, it was unclear from the statistical analyses alone about why thismight be so.
Further analyses of a very different kind were then initiated. A selection ofthe audio taped performances of candidates who had completed both versionsin the December 1992 trial (N = 20) were transcribed and their discoursefeatures compared both qualitatively and quantitatively using a frameworkdeveloped by Shohamy (1994) in her study of the Hebrew OPI and SOPI (seeChapter 5). Four alternate tasks were chosen as the focus of analysis – thedescription, narration, discussion and role play tasks. The first three taskswere ‘monologic’ in character on both versions, i.e. during the response onlythe test taker was required to speak in order to successfully fulfil the demandsof the task. The live and tape role play tasks, however, differed in terms oftheir requirements for candidates. The live role play consisted of a two-wayexchange based on an information gap while the tape role play remainedmonologic.
This analysis of language output was carried out in two separate stages.In the first stage (Discourse Study A), a range of discourse features, includingrhetorical structure and functions, genre, speech moves, communicativeproperties, discourse strategies, content and topic of discourse,prosodic/paralinguistic features and contextualisation, type of speechfunctions, discourse markers and register, were examined. These featuresinvited broad qualitative discourse analyses of the language samples obtainedfrom the trial. In the second stage (Discourse Study B) a detailed quantitativeexamination of test taker language output was carried out focusing solely onlexical density. Using Shohamy’s (1994) categories enabled a directcomparison to be drawn between her findings and the results of this study.
The broad qualitative study of a range of discourse features in DiscourseStudy A suggested that the language produced in the direct and semi-direct
164
8 Summary and conclusions

versions of the oral interaction sub-test on the three ‘monologic’ tasks (i.e.description, narration and discussion) was strongly similar but that the liveand tape role plays produced a different kind of discoursal output. On thebasis of these initial results it appeared that the careful efforts of the testdesigners to match the test tasks (except the live and tape role plays) had beenrewarded in terms of the parity of test taker language elicited in the twoversions. However, the findings also suggested that the cost of thisachievement was a certain ‘unnaturalness’ (i.e. stiffness and formality) incandidate output on the live version, brought about by controlling and limitingthe interlocutor’s contribution through the use of a script. The less controlledlive role play, on the other hand, appeared to have elicited language whichmore closely approximated to conversation than the other live tasks. Yet, theprice to be paid for its greater ‘authenticity’ seems to have been a sharp lackof comparability with its tape counterpart.
The findings in Discourse Study A contrasted with those of Shohamy(1994) where consistent differences between the OPI and SOPI were found onnearly all of the discourse features examined (see Chapter 5, in particularTable 5.3).
In Discourse Study B, however, the live version elicited language of asignificantly lower lexical density than the tape version in all four matchingtasks. (See Chapter 5, Tables 5.5 and 5.6 as well as Figures 5.1, 5.2, 5.3 and5.4.) It was argued that this result could be mainly attributed to theinextinguishable presence of interaction throughout the live version despitethe attempt by the test designers to eliminate, or at least minimise, it in alltasks except the role play. Furthermore, the results also indicated that thehigher the degree of interaction the lower the level of lexical density incandidate output. This was clearly demonstrated in the figures from the liverole play task where the communication between candidate and interlocutorwas the least constrained of all the tasks on that version. The degree of lexicaldensity was found to be correspondingly significantly lower on this task thanany of the other live tasks. Lexical density therefore proved to be the moresensitive measure of difference in language output in this study, at least fromthe perspective of interactivity (see Chapter 5).
On the basis of these findings, particularly those related to lexical density,it appeared possible that the two versions were drawing on different languageskills overall, i.e. interactive versus monologic speaking ability, despite theefforts made by the test development team to minimise interaction on nearlyall the live tasks in the interests of test equivalence. It was suggested that this,in turn, may have accounted for the apparent lack of equivalence between thetest scores on the two formats in the December 1992 trial, since it is likely thatat least some candidates would not perform equally well in tests which tapsuch different oral skills.
165
8 Summary and conclusions

While the analyses of test scores and test taker language output providedsome important initial answers to the equivalence question, they were stilltentative and even partially contradictory. This led to the adoption of a third,very different perspective from which to address the research question in asubsequent trial. In the June 1994 trial the equivalence issue was addressedfrom a naturalistic perspective and the investigation focused on test processes,including the processes of test design, test taking and rating.
The findings from this part of the study confirmed that, despite the effortsof the test designers to equate the two versions, the live format, in practice,called into play the candidate’s interactive competence in a sense that isabsent from the tape version. This difference was most clearly andunambiguously revealed in the two individual case studies (‘Abdul’and ‘Wing Li’) reported in Chapter 6. In the live version both trial candidatesand their interlocutors relied on a broad range of ‘unscripted’ verbal and non-verbal feedback to communicate with each other throughout all stages of thetest. The tape version was wholly lacking in two-way communication.Interactivity on the live version was also a recurrent theme in the interviewswith test developers, candidates, interlocutors and raters, with most of theseinterviewees directly or indirectly agreeing that it was an integral feature ofthe live version.
Thus, notwithstanding its highly scripted nature, the live version turned outto be a sustained, two-way face-to-face exchange between the interlocutor andcandidate which involved substantial negotiation of meaning through verbaland non-verbal communication. The tape version, on the other hand, consistedentirely of a series of one-way ‘remote’ exchanges in which the candidateprepares and responds within rigid time limits to an audio recorded voice.
The findings in Chapter 6 supported the conclusion drawn from DiscourseStudy B that the two versions of the access: oral interaction sub-test tappeddistinctly different components of the oral proficiency construct, i.e.interactive versus monologic speaking ability, despite the best intentions ofthe test developers. Given that the two versions draw on such different oralskills it is perhaps unsurprising that some test takers perform distinctly betterin either one of these communicative settings.
However, the findings in Chapter 6 also suggested that any givencandidate’s final result on either version may be significantly affected byfactors other than their oral language proficiency (under either the live ortape-based conditions). The most salient of these factors was the quality ofthe interaction between candidate and interlocutor on the live version.However, the adequacy of preparation and response times on the tape versionand the candidate’s level of comfort under the two conditions as testenvironments also appeared to influence the quality of the performance. Suchfactors pose threats to the reliability of measurement across the two versions.
166
8 Summary and conclusions

It seemed, therefore, that the two formats tapped different speaking skillsand also failed to yield a satisfactory level of consistency in the measurementprocess. Both factors could well explain the apparent lack of test scoreequivalence found in the December 1992 trial (refer to Chapter 4). The issueof test score equivalence for both the entire test cohort and the two candidatestracked in the June 1994 trial was then examined in order to compare theresults with those obtained from the December 1992 trial (see Chapter 7).
This analysis of test scores and band levels obtained by candidates (N = 94)in the June 1994 trial confirmed the apparent lack of equivalence between testscores reported in the December 1992 trial. Again, contrary to the morestandard measures of unidimensionality, the more rigorous measure of therelationship between candidate ability estimates (the chi-squared (χ2)procedure) indicated that a single measurement dimension of speaking abilitycould not be constructed for the combined data obtained from the live andtape versions. This lack of equivalence between test scores was most clearlyrevealed when band levels obtained by the trial candidates on the live and tapeversions were compared. This analysis revealed that 40% of all candidateswere assigned a different level of proficiency on the two versions with 28%doing better on the tape test and 12% on the live test. While Abdul’s resultswere consistent insofar as he failed to achieve Functional level on bothversions, Wing Li achieved the highest possible band level on the tape versionand the lowest possible level on the live version. She thus formed part of the11% of candidates for whom there was a discrepancy of more than one level.
Finally, further bias analyses of the June 1994 test score data indicated anadditional important source of measurement error on both versions, i.e. raterbias with respect to individual candidates. These analyses indicated that inabout 60% of cases there was evidence of rater bias, i.e. at least one of the fourraters allocated to each trial candidate (two for the live version and two for thetape version) showed a tendency to mark the candidate either significantlymore harshly or more leniently than s/he did other candidates. There was alsoa clearly discernible trend for the strength of this interaction effect to increasein the case of candidates who were subsequently assigned differentproficiency levels on the two versions (i.e. 40% of candidates). This wasparticularly marked in the case of candidates where there was a difference oftwo or more proficiency levels (i.e. 11% of the test cohort).
On the basis of all the findings summarised in this section it is difficult todetermine which was more responsible for the observed lack of equivalencebetween test scores on the two versions – the difference in what is beingassessed in each format or the lack of consistency in the measurementprocess. It would seem, in any event, that both were playing a substantial rolein this outcome.
167
8 Summary and conclusions

The results of the various stages of the study in relation to the equivalenceof the two versions of the oral interaction sub-test are shown in Table 8.1below. This table shows that each stage provided important but sometimesconflicting insights into the equivalence of the two versions of the oralinteraction sub-test. Thus, the use of multiple methods ultimately yielded aclearer, more comprehensive answer to the research question than would havebeen the case if only a single method had been adopted.
Table 8.1
Findings on the equivalence of the live and tape versions
Stage Data Method Character Finding
1 test scores standard quantitative equivalent12/92 Rasch analyses
2 test scores Rasch-based quantitative not equivalent12/92 χ2 test
3 language output analysis qualitative ‘monologic’12/92 of various tasks
discourse equivalent butfeatures role play tasks
not equivalent
4 language output analysis quantitative both12/92 of lexical density ‘monologic’
and role playtasksnot equivalent
5 test processes naturalistic qualitative not equivalent6/94 data analysis
6 test scores standard quantitative equivalent6/94 Rasch analyses
7 test scores Rasch-based quantitative not equivalent6/94 χ2 test
8 band levels6/94 frequency quantitative not equivalent
counts andpercentages
168
8 Summary and conclusions

Implications of findingsThis section explores the potential implications of the findings in this study,first, for the equivalence of direct and semi-direct tests of oral proficiency;secondly, for comparability studies in language testing; thirdly, for combiningpositivistic and naturalistic approaches to research in language testing; andfinally, for the interpretation of test scores in performance tests.
The equivalence of direct and semi-direct tests of oralproficiency
The findings from this study appear to support Shohamy’s (1994) conclusionthat direct and semi-direct tests are not interchangeable as testsof oral proficiency. In particular, the analysis of candidate output from theperspective of lexical density in Chapter 5 and the studies of two trialcandidates, Abdul and Wing Li, undertaking the two versions in Chapter 6,together with the lack of test score equivalence found in both the December1992 and June 1994 trials, suggest that these two kinds of tests may tapfundamentally different language abilities whatever efforts are made to equatethem.
In addition, as Lazaraton (1996) and McNamara (1997) both underscore,performance in any direct test of speaking is jointly achieved by theparticipants (typically, a single candidate and interlocutor) in the interaction,or co-constructed. In semi-direct tests the candidate’s performance is alsojointly achieved but in this instance with an ‘unresponsive’ interactionalpartner. This fundamental difference between the two formats was mostclearly evident in the two individual case studies reported in Chapter 6. Oneof the most important challenges for direct testing, therefore, is to determinehow to take account of interlocutor performance, which appears to be highlyvariable, in the assessment of an individual candidate’s communicative ability.
If the ability to interact is to be seen as integral to the construct of oralproficiency and not simply an optional component, then direct testingappears, under normal circumstances, to remain the most valid method ofassessing speaking notwithstanding the problems associated with variabilityin interlocutor performance. The semi-direct format, on the other hand, mightbe employed, as van Lier (1989) suggests, in more specialised testing contextswhere the assessment of monologic speaking ability is required.
Comparability studies in language testing
To date, as previously argued, much previous comparability research inlanguage testing has relied primarily on concurrent validation, which focuseson the equivalence between test scores. Many of the empirical studiesreviewed in the first chapter of this study attempt to establish the equivalence
169
8 Summary and conclusions

of direct and semi-direct speaking tests in this way using statisticalcorrelations. However, it has been argued in this book that investigating therelationship between test scores provides necessary but insufficient evidenceas to whether the same language constructs are being tapped in different tests.This position provided the rationale for moving beyond concurrent validationin order to investigate the equivalence of the direct and semi-direct versionsof the access: oral interaction sub-test. In so doing, the study hasdemonstrated the need to examine language tests from multiple perspectivesin order to obtain deeper insights into what they appear to measure and thusprovide richer, more comprehensive evidence for construct validity, of whichconcurrent validity is only one (albeit important) component. In turn, it isargued, this approach provides a more solid and therefore more valid basisfrom which to draw conclusions about test comparability.
Combining positivistic and naturalistic approaches toresearch in language testing
This study has also illustrated the potential of combining both positivistic andnaturalistic inquiry in language testing research. Because of its bias towardsoutcomes and the expert knowledge of the researcher the positivistic modelappears particularly appropriate to the analysis of test products suchas test scores (see Chapters 4 and 7) and candidate language output (seeChapter 5). On the other hand, because of its emphasis on process and theimportance of incorporating the views of all interested parties, not simply theresearcher, in attempting to understand human behaviour, the naturalisticmodel seems particularly well suited to ‘inside’ examinations of how tests aredesigned and how test scores are produced, taking into account theexperiences of such players as test developers, test takers and raters (seeChapter 6).
Furthermore, while the naturalistic approach to research in languagetesting tends to yield greater depth of coverage by shedding light on theexperiences and perceptions of various individual ‘actors’ representing thesedifferent players in the testing process, the positivistic approach typicallyallows greater breadth of coverage by providing an overview of groupperformance. Given their very different orientations, the two perspectivesmight be usefully employed to balance each other. In this way, for example,the full significance of findings based on in-depth studies of individual testtakers could become clearer by examining where their scores stand in relationto the rest of the test cohort. Conversely, group differences in test scoreequivalence revealed through quantitative analyses may be illuminatedthrough investigations of individual case studies. In an important sense, theevidence provided by the two approaches can therefore be seen ascomplementary.
170
8 Summary and conclusions

Most importantly, as demonstrated in this study, the adoption of such amixed strategy has the potential to eventually yield more solidly grounded,valid conclusions than is the case where only one paradigm has been used,because of its dual emphasis on both product and process and its reliance onboth quantitative and qualitative research methods.
To date language testing research has operated mostly within thepositivistic paradigm (Hamp-Lyons and Lynch 1995). As suggested inChapter 3, this is probably unsurprising given the centrality of measurementin this enterprise. However, more recently there have been calls forresearchers in educational testing to consider more naturalistic perspectivesfrom which to undertake test validation (see for example Messick 1989;Moss 1994, 1996; Shephard 1993). This does not necessarily mean that thepositivistic paradigm should simply be jettisoned in favour of the naturalisticparadigm. Moss (1996: 22), for example, suggests that
the issue for me is not whether we should adopt [one approach or theother] to the social sciences in general, or to assessment in particular;the issue is how we can use the contrast to highlight the taken-for-granted practices and perspectives of each approach and how, takentogether, they can provide a more textured and productive view of thesocial phenomena we seek to understand.
Such a perspective appears to offer a fruitful direction for future researchin language testing. In particular, the richness of performance testing needs tobe matched by a similar richness in the methods used to explore importantissues of validity and reliability.
The interpretation of test scores in performance tests
Finally, the results of this study overall suggest that test scores shouldbe interpreted cautiously, particularly when important decisions aboutindividuals are to be based on them, such as in the access: test. Whilelanguage testing continues to strive for a kind of objective purity orpsychometric ‘pristineness’, even in the communicative era, it appears thattest scores on performance tests are produced from a series of highly complexinteractions between the candidate, the test format, the interlocutor (whereapplicable), the type of tasks, the rater(s), and the rating scale. Such ameasurement process can hardly claim to be foolproof in terms of itsreliability. Even more importantly, the issue of what language ability is beingtapped in performance tests is not always easily resolved but remainsnevertheless crucial to the interpretation of test scores. As Bernard Spolsky(1995: 358) suggests;
171
8 Summary and conclusions

If the aim [of a language test] is to make some serious decisionaffecting the future of the persons being tested, language testers mustaccept full responsibility for the inevitable uncertainty of a powerfulbut flawed technology, and make sure not just of reliability but also offocused and relevant validity, and intelligent and scepticalinterpretation of the multiple methods of measurement and assessmentused.
All ‘high stakes’ language tests, such as the access: test, require suchrigorous on-going scrutiny in relation to both their reliability and validity. Itis to be hoped that this study demonstrates the importance and complexity ofthat enterprise.
172
8 Summary and conclusions

References
Alderson, J. C. 1980. Native and non-native speaker performance on clozetests. Language Learning 30, 1: 59–76.
Alderson, J. C., C. Clapham and D. Wall. 1995. Language Test Constructionand Evaluation. Cambridge: Cambridge University Press.
Alderson, J. C., K. J. Krahnke and C. W. Stansfield (eds.). 1987. Reviews ofEnglish Language Proficiency Tests. Washington, DC: Teachers ofEnglish to Speakers of Other Languages.
Anivan, S. (ed.). 1991. Current Developments in Language Testing.Singapore: RELC.
ARELS Examinations Trust 1989. The Oxford-ARELS Examinations inEnglish as a Foreign Language: Rationales, Regulations and Syllabuses.Oxford: ARELS Examination Trust.
Bachman, L. F. 1988. Problems in examining the validity of the ACTFL oralproficiency interview. Studies in Second Language Acquisition 10, 2:149–64.
Bachman, L. F. 1990. Fundamental Considerations in Language Testing.Oxford: Oxford University Press.
Bachman, L. F. 1991. What does language testing have to offer? TESOLQuarterly 25: 4, 671–704.
Bachman, L. F. and S. J. Sauvignon. 1986. The evaluation of communicativelanguage proficiency: A critique of the ACTFL oral interview. The ModernLanguage Journal 70: 4, 380–90.
Benson, M. J. 1989. The academic listening task: A case study. TESOLQuarterly 23: 3, 421– 45.
Brindley, G. and G. Wigglesworth (eds.). 1997. access: Issues in LanguageTest Design and Delivery. Sydney: National Centre for English LanguageTeaching and Research.
Brown, A. 1993. The role of test-taker feedback in the development process:test takers’ reactions to a tape-mediated test of proficiency in spokenJapanese. Language Testing 10: 3, 277–304.
Cherryholmes, C. H. 1992. Notes on pragmatism and scientific realism.Educational Researcher 21: 6, 13–17.
Cizek, G. J. 1993. Reconsidering standards and criteria. Journal ofEducational Measurement 30: 2, 93–106.
Clark, J. L. D. 1979. Direct versus semi-direct tests of speaking proficiency.In Briere and Hinofotis (eds.).
173

Clark, J. L. D. 1986. Handbook for the Development of Tape-mediatedACTFL/ILR Scale-based Tests of Speaking Proficiency in the LessCommonly Taught Languages. Washington, DC: Center for AppliedLinguistics (ERIC document 278 265).
Clark, J. L. D. 1988. Validation of a tape-mediated ACTFL/ILR scale-basedtest of Chinese speaking proficiency. Language Testing 5: 187–98.
Clark, J. L. D. and R. T. Clifford. 1988. The FSI/ILR/ACTFL proficiencyscale and testing techniques. Studies in Second Language Acquisition,10: 129–47.
Clark, J. L. D. and Y. Li. 1986. Development, Validation and Disseminationof a Proficiency-Based Test of Speaking Ability in Chinese and anAssociated Model for Other Less Commonly Taught Languages.Washington, DC: Center for Applied Linguistics. (ERIC Document No.ED 278 264).
Clark, J. L. D. and S. Swinton. 1979. An Exploration of Speaking ProficiencyMeasures in the TOEFL Context. TOEFL Research Report 4. Princeton,NJ: Educational Testing Service.
Clark, J. L. D. and S. Swinton. 1980. The Test of Spoken English as a Measureof Communicative Ability in English-medium Instructional Settings.TOEFL Research Report 7. Princeton, NJ: Educational Testing Service.
Coulthard, M. (ed.). 1986. Talking about Text. Birmingham: University ofBirmingham, English Language Research.
Davies, A. 1991. The Native Speaker in Applied Linguistics. Edinburgh:Edinburgh University Press.
Denzin, N. K. and Y. S. Lincoln (eds.). 1994. Handbook of QualitativeResearch. London: Sage.
Filipi, A. 1995. Interaction in an Italian oral test: The role of some expansionsequences. Australian Review of Applied Linguistics Series S, No.11: 119–36.
Frith, J. R. (ed.). 1980. Measuring Spoken Language Proficiency.Washington, DC: Georgetown University Press.
Gardner, R. 1992. Task Classification, Methodology and Task Selection.Unpublished manuscript, Department of Linguistics and AppliedLinguistics, University of Melbourne.
Gass, S. and C. Madden (eds.). 1985. Input in Second Language Acquisition.Rowley, MA: Newbury House.
Guba, E. G. (ed.). 1990a. The Paradigm Dialog. Newbury House, CA: Sage.Guba, E. G. 1990b. The alternative paradigm dialog. In Guba (ed.).Guba, E. G. and Y. S. Lincoln. 1989. Fourth Generation Evaluation.
Newbury House, CA: Sage.Halliday, M. A. K. 1985. Spoken and Written Language. Melbourne: Deakin
University Press.
174
References

Hamilton, J., M. Lopes, T. F. McNamara and E. Sheridan. 1993. Rating scalesand native speaker performance on a communicatively oriented EAP test.Melbourne Papers in Language Testing, 2, 1: 1–24.
Hamp-Lyons, L. and B. K. Lynch. 1995. Perspectives on validity: Anhistorical analysis of the LTRC. Paper presented at the 17th annualLanguage Testing Research Colloquium, Longbeach, California.
Hasan, A.S. 1988. Variation in Spoken Discourse In and Beyond the EFLClassroom. Unpublished PhD thesis, University of Aston.
Hawthorne, L. The political dimension of English language testing inAustralia. Language Testing 14, 3: 248–60.
Henning, G. 1987. A Guide to Language Testing: Development, Evaluation,Research. Cambridge, MA: Newbury House.
Hill, K. 1997. The role of questionnaire feedback in the validation of the oralinteraction module. In Brindley and Wigglesworth (eds.).
Hoejke, B. and K. Linnell. 1994. ‘Authenticity’ in language testing:Evaluating spoken language tests for international teaching assistants.TESOL Quarterly 28: 1, 103–25.
Howe, K. R. 1988. Against the quantitative-qualitative incompatability thesis:Or dogmas die hard. Educational Researcher 17, 1: 10–16.
Hughes, A. (ed.). 1988. Testing English for University Study. ELT documents127. Oxford: Modern English Publications and the British Council.
Hughes, A. 1989. Testing for Language Teachers. Cambridge: CambridgeUniversity Press.
Ingram, D. E. and E. Wylie. 1984. Australian Second Language ProficiencyRatings. Department of Immigration and Ethnic Affairs, AGPS, Canberra.
Jaeger, R. M. (ed.). 1988. Complementary Methods for Research inEducation. Washington, DC: American Educational Research Association.
James, G. 1988. Development of an oral proficiency component in a test ofEnglish for academic purposes. In Hughes (ed.).
Johnson, D. 1992. Approaches to Research in Second Language Learning.New York: Longman.
Labov, W. 1972. Sociolinguistic Patterns. Philadelphia, PA: University ofPennsylvania Press.
Lado, R. 1961. Language Testing: The Construction and Use of ForeignLanguage Tests. London: Longman.
Lazaraton, A. L. 1991. A Conversation Analysis of Structure and Interactionin the Language Interview. Unpublished PhD thesis, University ofCalifornia, Los Angeles.
Lazaraton, A. L. 1996. Interlocutor support in oral proficiency interviews:The case of the CASE. Language Testing 13: 2, 151–72.
Lazaraton, A. and N. Saville. 1994. Process and outcomes in oral assessment.Paper presented at the 16th annual Language Testing ResearchColloquium, Washington, DC.
175
References

LeCompte, M. and J. Goetz. 1982. Problems of reliability and validity inethnographic research. Review of Educational Research 52: 1, 31–60.
Linacre, J. M. 1989–95. FACETS: A Computer Program for Multi FacetedRasch Measurement. Chicago, IL: Mesa Press.
Linn, R.L. (ed.). 1989. Educational Measurement (3rd edition). New York:American Council on Education/McMillan.
Lowe, P., Jr. 1987. Interagency Language Roundtable Oral ProficiencyInterview. In Alderson, Krahnke and Stansfield (eds.).
Lowe, P., Jr. 1988. The unassimilated history. In Lowe, Jr. and Stansfield(eds.).
Lowe, P., Jr. and R. T. Clifford. 1980. Developing an indirect measure ofoverall oral proficiency. In Frith (ed.).
Lowe, P., Jr. and C. W. Stansfield (eds.). 1988. Second Language ProficiencyAssessment: Current Issues. Englewood Cliffs, NJ: Prentice Hall.
Luoma, S. 1997. Comparability of a Tape-mediated and a Face-to-face Testof Speaking: A Triangulation Study. Unpublished Licentiate thesis. Centrefor Applied Language Studies, University of Jyvaskyla, Jyvaskyla.
Lynch, B. K. 1996. Language Program Evaluation: Theory and Practice.Cambridge: Cambridge University Press.
McNamara, T. F. 1987. Assessing the Language Proficiency of HealthProfessionals. Recommendations for the Reform of the OccupationalEnglish Test. A Report submitted to the Council of Overseas ProfessionalQualifications. Department of Russian and Language Studies, Universityof Melbourne, Melbourne.
McNamara, T. F. 1988. The Development of an English as a Second LanguageSpeaking Test for Health Professionals. Part One of a Report to theCouncil of Overseas Professional Qualifications on a Consultancy toDevelop the Occupational English Test. Department of Russian andLanguage Studies, University of Melbourne, Melbourne.
McNamara, T. F. 1990a. Item Response Theory and the validation of an ESPtest for health professionals. Language Testing 7: 52–75.
McNamara, T. F. 1990b. Assessing the second language proficiency of healthprofessionals. Unpublished PhD thesis, University of Melbourne.
McNamara, T. F. 1991. Test dimensionality: IRT analysis of an ESP listeningtest. Language Testing 8: 2, 139–59.
McNamara, T. F. 1996a. Measuring second language performance: A new erain language testing. London and New York: Longman.
McNamara, T. F. 1997. ‘Interaction’ in second language performanceassessment: Whose performance? Applied Linguistics 18, 4: 446–66.
176
References

McNamara, T. F. and T. Lumley. 1993. The effects of interlocutor andassessment mode variables in offshore assessment of speaking skills inoccupational settings. Paper presented at the 15th annual LanguageTesting Research Colloquium, Cambridge, England, August (ERICDocument Reproduction Service ED 364 066).
Meddis, R. 1984. Statistics Using Ranks. New York, NY: Basil Blackwell Inc.Merriam, S. B. 1988. Case Study Research in Education: A Qualitative
Approach. San Francisco: Jossey-Bass.Messick, S. 1989. Validity. In Linn (ed.).Miller, D. (ed.). 1983. A Pocket Popper. London: Fontana.Morton, J. and G. Wigglesworth. 1994. Evaluating interviewer input in oral
interaction tests. Paper presented at the Second Language ResearchForum, Montreal.
Morton, J., G. Wigglesworth and D. Williams. 1997. Approaches to theevaluation of interviewer behaviour in oral tests. In Wigglesworth andBrindley (eds.).
Moss, P. A. 1994. Can there be validity without reliability? EducationalResearcher 23: 2, 4–12.
Moss, P. A. 1996. Enlarging the dialogue in educational measurement: Voicesfrom interpretive research traditions. Educational Researcher 25: 1, 20–8.
Neeson, S. 1985. An Exploratory Study of the Discourse Structure of theAustralian Second Language Proficiency Ratings Test of Oral Proficiency.Unpublished M.A. thesis, University of Birmingham.
Nunan, D. 1992. Research Methods in Education. Cambridge: CambridgeUniversity Press.
Perren, G. E. and J. L. M. Trim (eds.). 1971. Applications of Linguistics.Cambridge: Cambridge University Press.
Perrett, G. 1987. The language testing interview: A reappraisal. Paper given atthe 8th World Congress of Applied Linguistics (AILA), Sydney.
Phillips, D. C. 1990. Postpositivistic science: Myths and realities. In Guba(ed.).
Pollitt, A. and N. L. Murray. 1993. What raters really pay attention to. Paperpresented at the 15th annual Language Testing Research Colloquium,Cambridge and Arnhem.
Raffaldani, T. 1988. The use of situation tests as measures of communicativeability. Studies in Second Language Acquisition 10: 197–216.
Ross, S. and Berwick, R. 1993. The discourse of accommodation inoral proficiency interviews. Studies in Second Language Acquisition14: 159–76.
Sato, C. J. 1985. Task variation in interlanguage phonology. In Gass andMadden (eds.).
177
References

Shephard, L. A. 1993. Evaluating test validity. Review of Research inEducation 19: 405–50.
Shohamy, E. 1982. Affective considerations in language testing. The ModernLanguage Journal 66: 13–17.
Shohamy, E. 1983. The stability of the oral proficiency trait on the oralinterview speaking test. Language Learning 33: 527–40.
Shohamy, E. 1994. The validity of direct versus semi-direct oral tests.Language Testing 11: 2, 99–23.
Shohamy, E., S. Donitsa-Schmidt and R. Waizer. 1993. The effect of theelicitation mode on the language samples obtained in oral tests. Paperpresented at the 15th Language Testing Research Colloquium, Cambridge,England.
Shohamy, E., C. Gordon, D. M. Kenyon and C. W. Stansfield. 1989. Thedevelopment and validation of a semi-direct test for assessing oralproficiency in Hebrew. Bulletin of Hebrew Higher Education 4: 1, 4–9.
Southard, B. and R. Sheorey. 1992. Measures of oral proficiency in English:A comparison of the rated interview and the test of spoken English.College ESL 2: 2, 52–67.
Spolsky, B. 1985. The limits of authenticity in language testing. LanguageTesting 2: 1, 31–40.
Spolsky, B. 1995. Measured Words: The Development of Objective LanguageTesting. Oxford: Oxford University Press.
Stake, R. E. 1988. Case study methods in educational research: Seeking sweetwater. In Jaeger (ed.).
Stake, R. E. 1994. Case studies. In Denzin and Lincoln (eds.).Stansfield, C. W. (ed.). 1985. Technology and Language Testing. Princeton,
NJ: Education Testing Service.Stansfield, C. W. 1991. A comparative analysis of simulated and direct oral
proficiency interviews. In Anivan (ed.).Stansfield, C. and D. Kenyon. 1988. Development of the Portuguese Speaking
Test. Washington, DC: Center for Applied Linguistics.Stansfield, C. and D. Kenyon. 1989. Development of the Hausa, Hebrew and
Indonesian Speaking Tests. Washington, DC: Center for AppliedLinguistics.
Stansfield, C. and D. Kenyon. 1992a. The development and validation of asimulated oral proficiency interview. The Modern Language Journal72: 2, 129–41.
Stansfield, C. and D. Kenyon. 1992b. Research on the comparability of theoral proficiency interview and the simulated oral proficiency interview.System 20: 3, 347–64.
Stansfield, C., D. Kenyon, R. Paiva, F. Doyle, I. Ulsh and M. Cowles. 1990.The development and validation of the Portuguese speaking test. Hispania73: 641–51.
178
References
Stevenson, D. 1985. Authenticity, validity, and a tea party. Language Testing2: 1, 41–47.
Stubbs, M. 1986. Lexical density: A computational technique and somefindings. In Coulthard (ed.).
Sunderland, J. 1995. Gender and language testing. Language Testing Update17: 24 –35.
UCLES 1999. The IELTS Handbook 2000. Cambridge: UCLES.Underhill, N. 1987. Testing Spoken Language: A Handbook of Oral Testing
Techniques. Cambridge: Cambridge University Press.Ure, J. 1971. Lexical density and register differentiation. In G. E. Perren and
J. L. M. Trim (eds.).van Lier, L. 1989. Reeling, writhing, drawling, stretching, and fainting in
coils: Oral proficiency interviews as conversations. TESOL Quarterly23: 489–508.
Wigglesworth, G. 1993. Exploring bias analysis as a tool for improvingrater consistency in assessing oral interaction. Language Testing 10: 3,303–35.
Wigglesworth, G. 1994. The Investigation of Rater and Task Variability usingMulti-faceted Measurement. Report for the National Centre for EnglishLanguage Teaching and Research, Macquarie University, Sydney.
Wigglesworth, G. and K. O’Loughlin. 1993. An investigation into thecomparability of direct and semi-direct versions of an oral interaction testin English. Melbourne Papers in Language Testing 2: 1, 56–67.
Willis, J. and D. Willis. 1988. Collins COBUILD English Course, Level 1,Student’s Book. London: Collins.
Yin, R. 1989. Case Study Research. (second edition) Beverly Hills, CA: SagePublications.
Zora, S. and C. Johns-Lewis. 1989. Lexical density in interview andconversation. York Papers in Linguistics 14: 89–100.
179
References

Appendices
1.1 Test specifications, access: oral interaction sub-test, May 19944.1 Scoring criteria and descriptors, oral interaction sub-test,
December 19924.2 FACETS analyses (1) oral interaction sub-test, December 1992
trial (N = 83)4.3 FACETS analyses (2) oral interaction sub-test, December 1992
trial (N = 76)5.1 Lexical density figures (%) with unweighted lexical items,
December 1992 trial (N = 20)5.2 Lexical density figures (%) with weighted lexical items,
December 1992 trial (N = 20)6.1 Scoring criteria and descriptors, oral interaction sub-test,
June 19946.2 Observation notes: Abdul and Wing Li, June 1994 trial6.3 Questions for candidate interviews, June 1994 trial6.4 Candidate questionnaire, June 1994 trial6.5 Questions for interlocutor interviews, June 1994 trial6.6 Raw scores allocated to Abdul and Wing Li, June 1994 trial6.7 Questions for rater interviews, June 1994 trial6.8 Rater questionnaire, June 1994 trial7.1 FACETS analyses (1) with anchored item difficulty estimates,
oral interaction sub-test, June 1994 trial (N = 94)7.2 FACETS analyses (2) with unanchored item difficulty
estimates, oral interaction sub-test, June 1994 trial (N = 94)7.3 FACETS analyses (3) with unanchored item difficulty
estimates, oral interaction sub-test, June 1994 trial (N = 89)
180

Appendices
Appendix 1.1Test specifications, access: oral interactionsub-test, May 1994
access:australian assessment of communicative english skills
ORAL INTERACTION TEST SPECIFICATIONS
1 NATURE OF THE TEST
The Australian Assessment of Communicative English Skills Test (access:) isdesigned to assess the English language proficiency of certain categories ofintending immigrants to Australia. Results of the assessment will be used toassist immigration personnel in making decisions concerning eligibility forimmigration points and to provide information to educational authorities on-shore for educational placement purposes.
The Oral Interaction Test
The Oral Interaction Test is designed to measure candidates’ oral interactiveskills. Candidates undertake one of two formats: a live (direct) formatconsisting of face-to-face interactions conducted by a trained interlocutor, ora taped-based (semi-direct) format administered in a language laboratory. Inselecting tasks for the test, cultural appropriacy and non-discriminatorylanguage are considered. The assessment of the oral module complementsthose of the listening, reading and writing modules.
2 CONTENT
The contents of the direct and semi-direct format of the oral test are related toa variety of ‘authentic’ contexts. The contexts reflect those encountered byadults in Australia in the course of their everyday life, work or study. Thesetasks involve both transactional and interactional uses of language.
Possible topics:advertisingcelebrations and festivalsclothes and fashionconsumer issues education (e.g. systems and practices, providers,
methods of teaching, study techniques)employment (e.g. workplace practices – personnel, pay, regulations,
holidays, health and safety, promotion, on-the-job training)
181
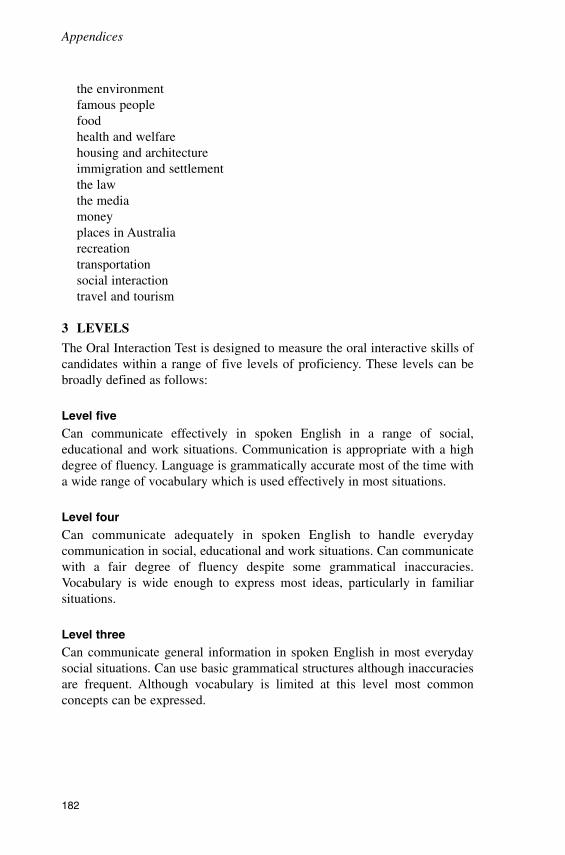
Appendices
the environmentfamous peoplefoodhealth and welfarehousing and architectureimmigration and settlementthe lawthe mediamoneyplaces in Australiarecreationtransportationsocial interactiontravel and tourism
3 LEVELS
The Oral Interaction Test is designed to measure the oral interactive skills ofcandidates within a range of five levels of proficiency. These levels can bebroadly defined as follows:
Level five
Can communicate effectively in spoken English in a range of social,educational and work situations. Communication is appropriate with a highdegree of fluency. Language is grammatically accurate most of the time witha wide range of vocabulary which is used effectively in most situations.
Level four
Can communicate adequately in spoken English to handle everydaycommunication in social, educational and work situations. Can communicatewith a fair degree of fluency despite some grammatical inaccuracies.Vocabulary is wide enough to express most ideas, particularly in familiarsituations.
Level three
Can communicate general information in spoken English in most everydaysocial situations. Can use basic grammatical structures although inaccuraciesare frequent. Although vocabulary is limited at this level most commonconcepts can be expressed.
182

Appendices
Level two
Can communicate in spoken English well enough to hold a very simpleconversation. Limited control of basic grammatical structures. Vocabulary islimited to common words and phrases.
Level one
No practical speaking ability in English.
4 TEST STRUCTURE
Test length
Direct format
This format commences with an unassessed warm-up phase of 2–3 minutes,followed by the actual test of approximately 20 minutes’ duration.
Semi-direct format
This format is tape mediated and administered in a language laboratory. Anunassessed warm-up phase of 2–3 minutes’ is followed by the actual test ofapproximately 30 minutes’ duration.
Internal organisation
Both formats of the test have five sections, the first of which is anintroductory warm up as outlined above. The number of items within eachsection will vary across versions, but the total length (approximately 20minutes for the live format and 30 minutes for the tape-based format) willremain constant.
Tasks in the direct and semi-direct formats of the test are developed intandem in an attempt to ensure the comparability of the two formats. Beforeadministration of a test, a trialling procedure is carried out in whichcandidates undertake direct and semi-direct formats of the test. Subsequentstatistical analyses of the trial results allow for concurrent validation of thetwo types of test.
183

Appendices
5 ITEM TYPE/DISCOURSE FORM
For the purposes of comparability both formats of the test consist mainly ofone-way exchanges (monologic) where the candidate is required tocommunicate information in response to prompts from the ‘interlocutor’.However, on the direct format of the test, the role play allows for a more‘authentic’ information gap activity in which meaning is negotiated betweencandidate and interviewer (dialogic).
Direct Format Semi-direct Formatdescription descriptionnarration narrationrole play role play
summarisingexposition expositiondiscussion discussion
6 LANGUAGE FUNCTIONS
Tasks on both formats of the test require candidates to use a range of languagefunctions and sub-skills.
Sub-skills/functions
describingcomparinginterpretingnarratingexplainingapologisinganalysingspeculatinggiving opinionssummarisingdiscussing
184

Appendices
7 TASK FORMAT
Task stimuli
A variety of stimuli are used and some examples follow:
Direct Format Semi-direct Format
cartoon pictures cartoon picturesphotos photosset questions set questionsrole play cards telephone messages
recorded dialoguemaps, tables, charts, graphs maps, tables, charts, graphsbrochures brochuresmemos memosadvertisements advertisementsnotices noticescirculars circulars
Task structure
A Unplanned vs planned
• planned and unplanned activities are included• planned tasks allow planning time and are designed to elicit
more complex language• unplanned tasks are designed to elicit spontaneous language
B Open vs closed
• both open tasks (those which are open ended with a range ofpossible solutions) and closed tasks (those which have arestricted set of responses) are included
C Divergent vs convergent
• divergent tasks are those which have no specific goal, andwhich involve decision making, using opinion and argument
• convergent tasks are problem-solving tasks in which the aimis to arrive at a common goal (see live role play)
185

Appendices
8 SCORING PROCEDURE
For both formats of the test each candidate’s tape is marked by two trainedassessors in Australia. Individual tasks are assessed using appropriate scoringcriteria such as fluency, grammar, intelligibility, vocabulary and cohesion.Each of these criteria is accompanied by a set of seven descriptors. All scoringis carried out on a Likert scale of 1 to 7. In both formats an overall or globalassessment of the candidate’s performance is made using the criterion ofoverall communicative effectiveness. This criterion does not have descriptors.In the live format, comprehension is also included as a global category. Thisis a measure of the candidate’s ability to understand the interviewer, and isaccompanied by a set of descriptors. A scoresheet and descriptors for allcriteria are attached.
186
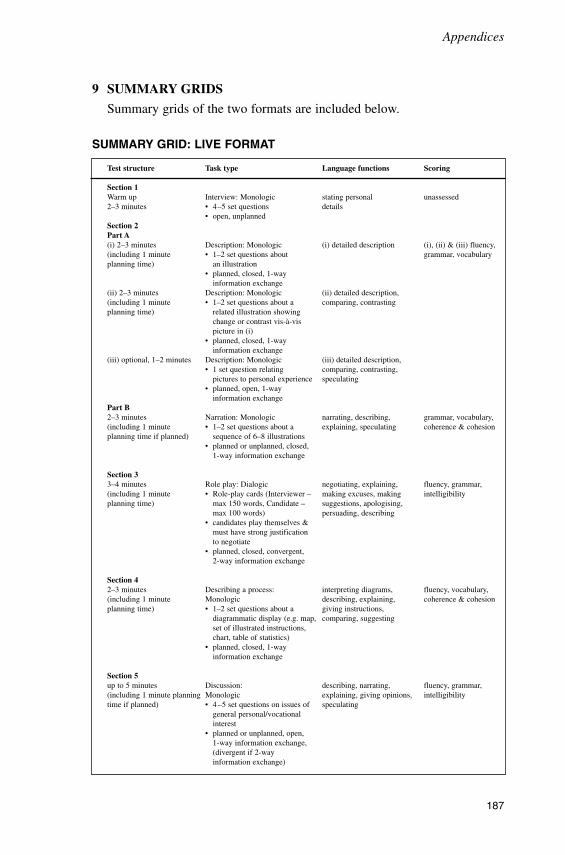
Appendices
9 SUMMARY GRIDS
Summary grids of the two formats are included below.
SUMMARY GRID: LIVE FORMAT
Test structure Task type Language functions Scoring
Section 1Warm up Interview: Monologic stating personal unassessed2–3 minutes • 4–5 set questions details
• open, unplannedSection 2Part A(i) 2–3 minutes Description: Monologic (i) detailed description (i), (ii) & (iii) fluency,(including 1 minute • 1–2 set questions about grammar, vocabularyplanning time) an illustration
• planned, closed, 1-wayinformation exchange
(ii) 2–3 minutes Description: Monologic (ii) detailed description,(including 1 minute • 1–2 set questions about a comparing, contrastingplanning time) related illustration showing
change or contrast vis-à-vispicture in (i)
• planned, closed, 1-wayinformation exchange
(iii) optional, 1–2 minutes Description: Monologic (iii) detailed description,• 1 set question relating comparing, contrasting,
pictures to personal experience speculating• planned, open, 1-way
information exchangePart B2–3 minutes Narration: Monologic narrating, describing, grammar, vocabulary,(including 1 minute • 1–2 set questions about a explaining, speculating coherence & cohesionplanning time if planned) sequence of 6–8 illustrations
• planned or unplanned, closed,1-way information exchange
Section 33–4 minutes Role play: Dialogic negotiating, explaining, fluency, grammar,(including 1 minute • Role-play cards (Interviewer – making excuses, making intelligibilityplanning time) max 150 words, Candidate – suggestions, apologising,
max 100 words) persuading, describing• candidates play themselves &
must have strong justificationto negotiate
• planned, closed, convergent,2-way information exchange
Section 42–3 minutes Describing a process: interpreting diagrams, fluency, vocabulary,(including 1 minute Monologic describing, explaining, coherence & cohesionplanning time) • 1–2 set questions about a giving instructions,
diagrammatic display (e.g. map, comparing, suggestingset of illustrated instructions,chart, table of statistics)
• planned, closed, 1-wayinformation exchange
Section 5up to 5 minutes Discussion: describing, narrating, fluency, grammar,(including 1 minute planning Monologic explaining, giving opinions, intelligibilitytime if planned) • 4 –5 set questions on issues of speculating
general personal/vocationalinterest
• planned or unplanned, open,1-way information exchange,(divergent if 2-wayinformation exchange)
187

Appendices
SUMMARY GRID: TAPE-BASED FORMAT
Test structure Task type Language functions Scoring
Section 1Warm up Interview Monologic stating personal unassessed10–20 seconds per question • 4–5 set questions details
• open, unplannedSection 2Part A(i) 2–3 minutes Description: Monologic (i) detailed description (i) & (ii) & (iii) fluency,(including 1 minute planning • 1–2 set questions about an grammar, vocabularytime) illustration
• planned, closed, 1-wayinformation exchange
(ii) 2–3 minutes Description: Monologic (ii) detailed description,(including 1 minute planning • 1–2 set questions about a comparing, contrastingtime) related illustration showing
change or contrast vis-à-vispicture in (i)
• planned, closed, 1-wayinformation exchange
(iii) optional, 1–2 minutes Description: Monologic (iii) detailed description,• 1 set question relating comparing, contrasting,
pictures to personal experience speculating• planned, open, 1-way
information exchangePart B2–3 minutes Narration: Monologic narrating, describing, grammar, vocabulary,(including 1 minute planning • 1–2 set questions about a explaining, speculating coherence & cohesiontime if planned) sequence of 6–8 illustrations
• planned or unplanned, closed,1-way information exchange
Part C3–4 minutes Summary: Monologic listening for main ideas, fluency, grammar,(including 1 minute planning • 1–2 set questions summarising vocabularytime) • recorded dialogue
or monologue (approx 300words) on a general topic
• planned, closed, 1-wayinformation exchange
Section 3up to 2 minutes Role play : Monologic explaining, apologising, fluency, grammar,(including 1 minute planning • 3–4 sentence written telephone making suggestions intelligibilitytime) message and standard telephone
answering machine recording• planned, closed, 1-way
information exchange
Section 42–3 minutes Describing a process: interpreting diagrams, fluency, vocabulary,(including 1 minute planning Monologic describing, explaining, coherence & cohesiontime) • 1–2 set questions about a giving instructions,
diagrammatic display (e.g. map, comparing, suggestingset of illustrated instructions,chart, table of statistics)
• planned, closed, 1-wayinformation exchange
Section 5up to 5 minutes Discussion: Monologic explaining, giving opinions, fluency, grammar(including 1 minute planning • 4 –5 set questions on issues of describing, narrating,time if planned) general personal/vocational intelligibility
interest speculating• planned or unplanned, open,
1-way information exchange
188
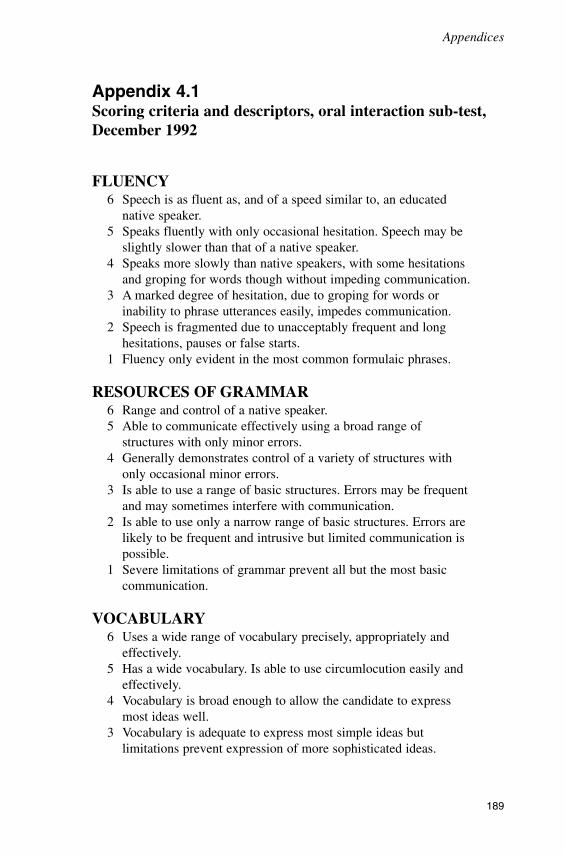
Appendices
Appendix 4.1Scoring criteria and descriptors, oral interaction sub-test,December 1992
FLUENCY6 Speech is as fluent as, and of a speed similar to, an educated
native speaker.5 Speaks fluently with only occasional hesitation. Speech may be
slightly slower than that of a native speaker.4 Speaks more slowly than native speakers, with some hesitations
and groping for words though without impeding communication.3 A marked degree of hesitation, due to groping for words or
inability to phrase utterances easily, impedes communication.2 Speech is fragmented due to unacceptably frequent and long
hesitations, pauses or false starts.1 Fluency only evident in the most common formulaic phrases.
RESOURCES OF GRAMMAR6 Range and control of a native speaker.5 Able to communicate effectively using a broad range of
structures with only minor errors.4 Generally demonstrates control of a variety of structures with
only occasional minor errors.3 Is able to use a range of basic structures. Errors may be frequent
and may sometimes interfere with communication.2 Is able to use only a narrow range of basic structures. Errors are
likely to be frequent and intrusive but limited communication ispossible.
1 Severe limitations of grammar prevent all but the most basiccommunication.
VOCABULARY6 Uses a wide range of vocabulary precisely, appropriately and
effectively.5 Has a wide vocabulary. Is able to use circumlocution easily and
effectively.4 Vocabulary is broad enough to allow the candidate to express
most ideas well.3 Vocabulary is adequate to express most simple ideas but
limitations prevent expression of more sophisticated ideas.
189
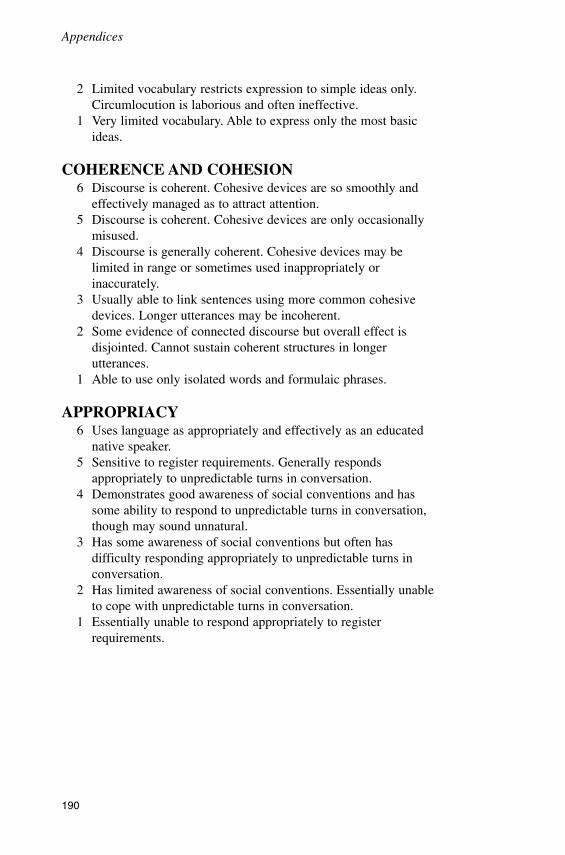
Appendices
2 Limited vocabulary restricts expression to simple ideas only.Circumlocution is laborious and often ineffective.
1 Very limited vocabulary. Able to express only the most basicideas.
COHERENCE AND COHESION6 Discourse is coherent. Cohesive devices are so smoothly and
effectively managed as to attract attention.5 Discourse is coherent. Cohesive devices are only occasionally
misused.4 Discourse is generally coherent. Cohesive devices may be
limited in range or sometimes used inappropriately orinaccurately.
3 Usually able to link sentences using more common cohesivedevices. Longer utterances may be incoherent.
2 Some evidence of connected discourse but overall effect isdisjointed. Cannot sustain coherent structures in longerutterances.
1 Able to use only isolated words and formulaic phrases.
APPROPRIACY6 Uses language as appropriately and effectively as an educated
native speaker.5 Sensitive to register requirements. Generally responds
appropriately to unpredictable turns in conversation.4 Demonstrates good awareness of social conventions and has
some ability to respond to unpredictable turns in conversation,though may sound unnatural.
3 Has some awareness of social conventions but often hasdifficulty responding appropriately to unpredictable turns inconversation.
2 Has limited awareness of social conventions. Essentially unableto cope with unpredictable turns in conversation.
1 Essentially unable to respond appropriately to registerrequirements.
190

Appendices
INTELLIGIBILITY6 Speech can be followed effortlessly by the interlocutor.5 Speech causes the interlocutor only occasional strain and can
generally be followed effortlessly.4 Speech requires some concentration and may require occasional
clarification by the interlocutor.3 Speech requires concentration and/or clarification by/on the part
of the interlocutor.2 Speech can only be understood with constant effort. Repeated
clarification may be needed.1 Speech often unintelligible even with considerable effort on the
part of the interlocutor.
COMPREHENSION (live version only)6 Rarely misunderstands, except occasionally when speech is very
rapid or ambiguous.5 Appears to have only occasional problems in understanding.4 Appears to be able to understand most speech but may require
repetition of details.3 Generally able to get gist of most speech but may require
repetition. More comfortable with slower rates of speech.2 Often has difficulty understanding utterances. May require
frequent repetition or reformulation.1 Demonstrates only intermittent comprehension even of
simplified speech.
OVERALL COMMUNICATIVE EFFECTIVENESSScale of 1 to 6 (6 = near native flexibility and range; 1 = limited).
191

Appendices
Appendix 4.2FACETS analyses (1) oral interaction sub-test,December 1992 trial (N = 83)
A Live data(i) Candidates
Obsvd Obsvd Obsvd Fair Calib Model Infit OutfitScore Count Average Avrge Logit Error MnSq Std MnSq Std Cand
715 138 5.2 5.4 3.94 0.13 1.2 2 1.2 1 1466 138 3.4 3.4 -0.37 0.13 0.8 -1 0.8 -1 2482 138 3.5 3.5 -0.09 0.13 0.7 -2 0.7 -2 3587 138 4.3 4.4 1.82 0.13 0.8 -1 0.8 -1 4496 138 3.6 3.7 0.24 0.13 1.0 0 1.0 0 5578 138 4.2 4.3 1.67 0.13 1.4 3 1.5 3 6593 138 4.3 4.4 1.84 0.13 0.8 -2 0.8 -1 7495 138 3.6 3.7 0.22 0.13 0.7 -3 0.7 -3 8672 138 4.9 5.1 3.24 0.13 1.1 0 1.2 1 9436 138 3.2 3.2 -0.80 0.13 1.0 0 0.9 0 10616 138 4.5 4.3 1.82 0.13 1.1 0 1.1 0 11562 138 4.1 4.0 0.94 0.13 0.9 0 0.9 0 12506 138 3.7 3.6 0.08 0.12 1.1 1 1.1 0 13560 138 4.1 4.0 1.00 0.13 0.8 -1 0.8 -1 15417 138 3.0 2.9 -1.30 0.12 0.8 -1 0.8 -1 16582 138 4.2 4.1 1.35 0.13 1.8 5 1.8 5 17255 135 1.9 1.7 -3.81 0.14 1.1 1 1.0 0 18536 138 3.9 3.8 0.63 0.12 1.1 0 1.1 0 19629 138 4.6 4.4 2.03 0.13 1.6 4 1.5 3 20541 138 3.9 3.9 0.46 0.13 0.8 -1 0.8 -1 22780 138 5.7 5.7 5.19 0.18 1.0 0 1.1 0 24377 138 2.7 2.6 -2.30 0.13 1.1 1 1.1 0 25484 138 3.5 3.4 -0.60 0.13 0.7 -2 0.7 -2 26674 138 4.9 4.9 2.81 0.14 0.9 0 0.9 0 27734 138 5.3 5.4 4.04 0.15 0.8 -1 0.8 -1 28591 138 4.3 4.3 1.33 0.13 0.7 -2 0.8 -1 29569 138 4.1 4.1 0.86 0.13 1.0 0 1.0 0 30620 138 4.5 4.5 2.18 0.13 1.1 1 1.1 1 31601 138 4.4 4.3 1.85 0.13 0.9 0 0.9 0 32494 137 3.6 3.5 -0.02 0.13 1.1 0 1.1 1 33523 138 3.8 3.7 0.44 0.13 1.1 0 1.1 1 34283 136 2.1 2.0 -3.76 0.14 1.3 2 1.3 2 35555 138 4.0 4.0 1.02 0.13 1.1 0 1.1 0 36702 138 5.1 5.2 3.67 0.13 0.9 0 1.0 0 37336 131 2.6 2.4 -2.54 0.13 1.5 3 1.4 3 38560 138 4.1 4.0 1.20 0.13 0.7 -2 0.7 -2 39758 138 5.5 5.5 4.64 0.15 1.2 1 1.2 1 40292 135 2.2 2.0 -3.36 0.13 1.2 1 1.0 0 43577 137 4.2 4.1 1.02 0.13 0.9 -1 0.9 -1 45713 138 5.2 5.1 3.30 0.14 0.7 -2 0.7 -2 46268 138 1.9 1.8 -3.90 0.14 0.9 0 1.0 0 47569 134 4.2 4.1 0.99 0.13 1.1 0 1.1 0 48
192

Appendices
Live data – candidates (continued)
Obsvd Obsvd Obsvd Fair Calib Model Infit OutfitScore Count Average Avrge Logit Error MnSq Std MnSq Std Cand
557 138 4.0 3.9 0.56 0.12 0.9 0 0.9 0 49556 137 4.1 3.9 0.70 0.12 0.9 -1 0.9 0 50389 138 2.8 2.6 -2.10 0.13 1.2 1 1.2 1 51499 138 3.6 3.4 -0.31 0.13 1.0 0 0.9 0 52727 138 5.3 5.2 3.65 0.14 0.7 -3 0.7 -3 53507 138 3.7 3.6 -0.08 0.13 0.8 -1 0.8 -2 54538 138 3.9 3.7 0.34 0.13 1.0 0 1.0 0 55646 138 4.7 4.5 2.14 0.13 0.9 0 0.9 0 56351 138 2.5 2.3 -2.64 0.13 0.9 0 1.0 0 57480 136 3.5 3.4 | -0.49 0.13 1.0 0 1.0 0 58694 137 5.1 5.0 3.08 0.14 0.9 -1 0.9 -1 60676 138 4.9 4.8 2.67 0.13 1.1 0 1.1 1 61648 138 4.7 4.7 2.51 0.14 0.9 0 0.9 0 62530 138 3.8 3.8 0.36 0.13 1.0 0 0.9 0 63538 138 3.9 3.9 0.50 0.13 0.7 -2 0.7 -2 64500 138 3.6 3.6 -0.27 0.13 0.7 -2 0.7 -2 66549 138 4.0 4.0 0.70 0.13 1.0 0 1.0 0 67617 135 4.6 4.5 2.09 0.14 0.9 0 0.9 0 68529 138 3.8 3.8 0.25 0.13 0.6 -4 0.6 -4 69559 136 4.1 4.1 0.95 0.14 0.8 -1 0.8 -1 70510 136 3.8 3.7 0.06 0.13 1.0 0 1.0 0 71502 138 3.6 3.6 -0.16 0.13 1.2 1 1.2 1 72538 135 4.0 3.7 0.21 0.13 1.3 2 1.3 2 74548 138 4.0 3.7 0.21 0.13 1.1 0 1.1 0 75738 138 5.3 5.2 3.69 0.15 1.1 0 1.2 1 77697 138 5.1 4.8 2.79 0.14 1.1 0 1.0 0 78583 138 4.2 3.9 0.67 0.13 0.9 -1 0.8 -1 79559 138 4.1 3.8 0.38 0.13 1.4 2 1.3 2 80575 138 4.2 3.8 0.55 0.13 1.0 0 1.0 0 81674 138 4.9 4.6 2.24 0.14 0.7 -3 0.6 -3 82634 138 4.6 4.3 1.52 0.13 0.7 -2 0.7 -2 83489 138 3.5 3.4 -0.49 0.13 1.6 4 1.6 4 84565 138 4.1 3.9 0.75 0.14 0.9 0 0.9 -1 85670 138 4.9 4.7 2.75 0.14 1.0 0 1.0 0 86502 138 3.6 3.5 -0.36 0.13 1.9 5 1.9 5 87329 138 2.4 2.2 -3.02 0.13 0.9 0 1.0 0 88650 138 4.7 4.6 2.36 0.14 1.0 0 1.0 0 89761 138 5.5 5.5 4.76 0.16 0.9 0 0.9 0 90515 138 3.7 3.6 -0.05 0.13 0.9 -1 0.9 -1 92682 138 4.9 4.9 3.08 0.14 1.1 0 1.1 0 93773 138 5.6 5.6 5.09 0.17 0.8 -1 0.7 -1 94
Obsvd Obsvd Obsvd Fair Calib Model Infit OutfitScore Count Average Avrge Logit Error MnSq Std MnSq Std Cand
558.7 137.6 4.1 4.0 0.90 0.13 1.0 -0.1 1.0 -0.2 Mean117.4 1.1 0.8 0.9 2.00 0.01 0.2 1.9 0.2 1.9 S.D.
RMSE 0.13 Adj S.D. 2.00 Separation 14.87 Reliability 1.00Fixed (all same) chi-square: 17033.94 d.f.: 82 significance: .00Random (normal) chi-square: 81.96 d.f.: 81 significance: .45
193

Appendices
(ii) Raters
Obsvd Obsvd Obsvd Fair Measure Model Infit OutfitScore Count Average Avrge Logit Error MnSq Std MnSq Std Rater
1489 457 3.3 2.7 1.14 0.07 0.9 -1 1.0 0 11120 363 3.1 2.9 1.00 0.07 0.9 -1 0.9 -1 21738 414 4.2 3.6 0.41 0.08 0.7 -4 0.7 -3 31910 459 4.2 3.9 0.07 0.08 1.1 1 1.1 1 41806 368 4.9 4.6 -1.36 0.08 1.2 2 1.1 1 51922 460 4.2 3.8 -0.78 0.07 0.9 -1 0.9 -1 61729 457 3.8 3.4 1.28 0.07 0.9 -1 0.9 -1 71737 414 4.2 3.8 -0.92 0.07 1.2 2 1.2 2 81765 414 4.3 3.9 0.84 0.09 1.0 0 0.9 0 97423 1900 3.9 3.5 0.04 0.04 1.0 0 1.0 0 106666 1902 3.5 3.1 0.91 0.04 1.2 5 1.2 5 118870 1909 4.6 4.4 -1.38 0.04 1.1 2 1.0 1 128193 1902 4.3 4.0 -1.25 0.04 0.8 -5 0.8 -5 13
3566.8 878.4 4.0 3.6 0.00 0.06 1.0 -0.2 1.0 -0.3 Mean2857.8 683.9 0.5 0.5 0.98 0.02 0.1 2.8 0.1 2.7 S.D.
RMSE 0.07 Adj S.D. 0.97 Separation 14.66 Reliability 1.00Fixed (all same) chi-square: 4532.47 d.f.: 12 significance: .00Random (normal) chi-square: 12.00 d.f.: 11 significance: .36
(iii) Items
Obsvd Obsvd Obsvd Fair Measure Model Infit OutfitScore Count Average Avrge Logit Error MnSq Std MnSq Std Nu Item
2181 498 4.4 3.9 -0.79 0.07 1.0 0 1.0 0 1 DesF1961 498 3.9 3.5 0.29 0.07 0.8 -3 0.8 -3 2 DesG2010 497 4.0 3.6 0.04 0.07 1.0 0 1.0 0 3 DesV2147 497 4.3 3.9 -0.64 0.07 0.8 -3 0.8 -3 4 NarF1878 498 3.8 3.3 0.69 0.07 0.7 -4 0.7 -4 5 NarG1905 498 3.8 3.4 0.56 0.07 0.8 -3 0.8 -3 6 NarV2075 498 4.2 3.7 -0.26 0.07 1.0 0 1.0 0 7 NarC2036 498 4.1 3.6 -0.07 0.07 1.0 0 1.0 0 8 Exp1F1797 498 3.6 3.1 1.08 0.07 0.9 -2 0.9 -2 9 Exp1G2050 497 4.1 3.7 -0.14 0.07 1.0 0 1.1 0 10 RP1F1872 497 3.8 3.3 0.72 0.07 1.0 0 1.0 0 11 RP1G1991 497 4.0 3.5 0.14 0.07 2.0 9 2.0 9 12 RP1A2109 494 4.3 3.8 -0.48 0.07 0.9 -1 0.9 -1 13 RP2F1893 492 3.8 3.4 0.55 0.07 0.9 0 0.9 0 14 RP2G2047 494 4.1 3.7 -0.17 0.07 1.5 6 1.5 6 15 RP2A2135 498 4.3 3.8 -0.56 0.07 0.8 -3 0.8 -3 16 Exp2F1913 498 3.8 3.4 0.53 0.07 0.8 -4 0.8 -3 17 Exp2G2169 497 4.4 3.9 -0.75 0.07 0.9 -2 0.8 -2 18 DisF1910 496 3.9 3.4 0.51 0.07 0.8 -2 0.8 -2 19 DisG2022 494 4.1 3.6 -0.07 0.07 0.9 -1 0.9 -1 20 DisV2076 497 4.2 3.7 -0.28 0.07 1.3 4 1.3 4 21 Int1975 494 4.0 3.5 0.15 0.07 0.9 -1 0.9 -1 22 ComEf2216 494 4.5 4.1 -1.06 0.07 1.4 5 1.3 4 23 Comp
194

Appendices
Live data – items (continued)
Obsvd Obsvd Obsvd Fair Measure Model Infit OutfitScore Count Average Avrge Logit Error MnSq Std MnSq Std Nu Item
2016.0 496.5 4.1 3.6 0.00 0.07 1.0 -0.4 1.0 -0.5 Mean110.9 1.8 0.2 0.2 0.55 0.00 0.3 3.5 0.3 3.4| S.D.
RMSE 0.07 Adj S.D. 0.55 Separation 7.77 Reliability 0.98Fixed (all same) chi-square: 1400.51 d.f.: 22 significance: .00Random (normal) chi-square: 22.00 d.f.: 21 significance: .40
(iv) Order
Obsvd Obsvd Obsvd Fair Measure Model Infit OutfitScore Count Average Avrge Logit Error MnSq Std MnSq Std N Order
20887 5384 3.9 3.6 0.05 0.02 1.0 2 1.0 11 First25481 6035 4.2 3.6 -0.05 0.02 1.0 -1 1.0 -22 Second
23184.0 5709.5 4.1 3.6 0.00 0.02 1.0 0.3 1.0 -0.1 Mean2297.0 325.5 0.2 0.0 0.05 0.00 0.0 1.9 0.0 2.0| S.D.
RMSE 0.02 Adj S.D. 0.04 Separation 2.03 Reliability 0.80Fixed (all same) chi-square: 10.21 d.f.: 1 significance: .00Random (normal) chi-square: 1.00 d.f.: 0 significance: 1.00
195
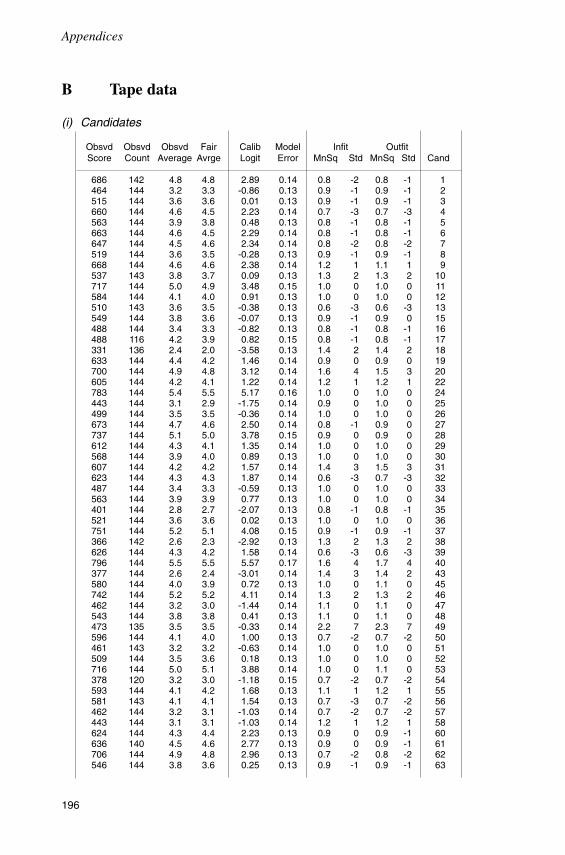
Appendices
B Tape data
(i) Candidates
Obsvd Obsvd Obsvd Fair Calib Model Infit OutfitScore Count Average Avrge Logit Error MnSq Std MnSq Std Cand
686 142 4.8 4.8 2.89 0.14 0.8 -2 0.8 -1 1464 144 3.2 3.3 -0.86 0.13 0.9 -1 0.9 -1 2515 144 3.6 3.6 0.01 0.13 0.9 -1 0.9 -1 3660 144 4.6 4.5 2.23 0.14 0.7 -3 0.7 -3 4563 144 3.9 3.8 0.48 0.13 0.8 -1 0.8 -1 5663 144 4.6 4.5 2.29 0.14 0.8 -1 0.8 -1 6647 144 4.5 4.6 2.34 0.14 0.8 -2 0.8 -2 7519 144 3.6 3.5 -0.28 0.13 0.9 -1 0.9 -1 8668 144 4.6 4.6 2.38 0.14 1.2 1 1.1 1 9537 143 3.8 3.7 0.09 0.13 1.3 2 1.3 2 10717 144 5.0 4.9 3.48 0.15 1.0 0 1.0 0 11584 144 4.1 4.0 0.91 0.13 1.0 0 1.0 0 12510 143 3.6 3.5 -0.38 0.13 0.6 -3 0.6 -3 13549 144 3.8 3.6 -0.07 0.13 0.9 -1 0.9 0 15488 144 3.4 3.3 -0.82 0.13 0.8 -1 0.8 -1 16488 116 4.2 3.9 0.82 0.15 0.8 -1 0.8 -1 17331 136 2.4 2.0 -3.58 0.13 1.4 2 1.4 2 18633 144 4.4 4.2 1.46 0.14 0.9 0 0.9 0 19700 144 4.9 4.8 3.12 0.14 1.6 4 1.5 3 20605 144 4.2 4.1 1.22 0.14 1.2 1 1.2 1 22783 144 5.4 5.5 5.17 0.16 1.0 0 1.0 0 24443 144 3.1 2.9 -1.75 0.14 0.9 0 1.0 0 25499 144 3.5 3.5 -0.36 0.14 1.0 0 1.0 0 26673 144 4.7 4.6 2.50 0.14 0.8 -1 0.9 0 27737 144 5.1 5.0 3.78 0.15 0.9 0 0.9 0 28612 144 4.3 4.1 1.35 0.14 1.0 0 1.0 0 29568 144 3.9 4.0 0.89 0.13 1.0 0 1.0 0 30607 144 4.2 4.2 1.57 0.14 1.4 3 1.5 3 31623 144 4.3 4.3 1.87 0.14 0.6 -3 0.7 -3 32487 144 3.4 3.3 -0.59 0.13 1.0 0 1.0 0 33563 144 3.9 3.9 0.77 0.13 1.0 0 1.0 0 34401 144 2.8 2.7 -2.07 0.13 0.8 -1 0.8 -1 35521 144 3.6 3.6 0.02 0.13 1.0 0 1.0 0 36751 144 5.2 5.1 4.08 0.15 0.9 -1 0.9 -1 37366 142 2.6 2.3 -2.92 0.13 1.3 2 1.3 2 38626 144 4.3 4.2 1.58 0.14 0.6 -3 0.6 -3 39796 144 5.5 5.5 5.57 0.17 1.6 4 1.7 4 40377 144 2.6 2.4 -3.01 0.14 1.4 3 1.4 2 43580 144 4.0 3.9 0.72 0.13 1.0 0 1.1 0 45742 144 5.2 5.2 4.11 0.14 1.3 2 1.3 2 46462 144 3.2 3.0 -1.44 0.14 1.1 0 1.1 0 47543 144 3.8 3.8 0.41 0.13 1.1 0 1.1 0 48473 135 3.5 3.5 -0.33 0.14 2.2 7 2.3 7 49596 144 4.1 4.0 1.00 0.13 0.7 -2 0.7 -2 50461 143 3.2 3.2 -0.63 0.14 1.0 0 1.0 0 51509 144 3.5 3.6 0.18 0.13 1.0 0 1.0 0 52716 144 5.0 5.1 3.88 0.14 1.0 0 1.1 0 53378 120 3.2 3.0 -1.18 0.15 0.7 -2 0.7 -2 54593 144 4.1 4.2 1.68 0.13 1.1 1 1.2 1 55581 143 4.1 4.1 1.54 0.13 0.7 -3 0.7 -2 56462 144 3.2 3.1 -1.03 0.14 0.7 -2 0.7 -2 57443 144 3.1 3.1 -1.03 0.14 1.2 1 1.2 1 58624 144 4.3 4.4 2.23 0.13 0.9 0 0.9 -1 60636 140 4.5 4.6 2.77 0.13 0.9 0 0.9 -1 61706 144 4.9 4.8 2.96 0.13 0.7 -2 0.8 -2 62546 144 3.8 3.6 0.25 0.13 0.9 -1 0.9 -1 63
196

Appendices
Tape data – candidates (continued)
Obsvd Obsvd Obsvd Fair Calib Model Infit OutfitScore Count Average Avrge Logit Error MnSq Std MnSq Std Cand
533 144 3.7 3.6 0.02 0.13 0.9 0 0.9 -1 64487 141 3.5 3.4 -0.28 0.14 0.8 -1 0.8 -1 66579 143 4.0 3.9 0.89 0.13 0.8 -2 0.8 -1 67713 143 5.0 5.0 3.53 0.14 0.6 -3 0.6 -3 68527 143 3.7 3.7 0.33 0.13 0.8 -1 0.8 -1 69638 144 4.4 4.4 2.15 0.13 0.8 -2 0.8 -1 70590 144 4.1 4.1 1.35 0.13 1.0 0 1.0 0 71630 144 4.4 4.2 1.67 0.13 0.8 -1 0.8 -2 72569 144 4.0 3.9 0.95 0.13 1.3 2 1.3 2 74500 138 3.6 3.6 0.22 0.13 1.7 4 1.7 4 75691 144 4.8 4.8 3.09 0.13 0.7 -2 0.7 -2 77683 144 4.7 4.7 2.95 0.13 0.9 0 1.0 0 78530 144 3.7 3.8 0.63 0.13 1.0 0 1.1 0 79561 143 3.9 3.9 0.87 0.13 0.8 -1 0.8 -1 80482 143 3.4 3.4 -0.14 0.13 0.8 -1 0.9 -1 81635 144 4.4 4.5 2.45 0.13 1.0 0 0.9 0 82583 144 4.0 4.2 1.54 0.13 0.8 -1 0.8 -1 83477 134 3.6 3.3 -0.62 0.14 1.4 2 1.5 3 84612 144 4.3 4.1 1.50 0.13 1.5 3 1.5 3 85683 144 4.7 4.6 2.73 0.13 0.9 0 0.9 0 86469 144 3.3 3.1 -1.14 0.14 1.3 2 1.4 2 87379 143 2.7 2.2 -3.11 0.13 1.1 0 1.1 0 88719 144 5.0 4.9 3.37 0.14 1.0 0 0.9 0 89771 144 5.4 5.3 4.41 0.15 1.1 1 1.2 1 90587 144 4.1 3.8 0.72 0.13 0.7 -2 0.7 -2 92734 144 5.1 4.8 3.30 0.14 1.1 0 1.1 0 93776 143 5.4 5.3 4.61 0.16 1.0 0 1.0 0 94
Obsvd Obsvd Obsvd Fair Calib Model Infit OutfitScore Count Average Avrge Logit Error MnSq Std MnSq Std Cand
580.1 142.7 4.1 4.0 1.09 0.14 1.0 -0.2 1.0 -0.2 Mean107.4 4.3 0.7 0.8 1.92 0.01 0.3 2.1 0.3 2.1 S.D.
RMSE 0.14 Adj S.D. 1.92 Separation 14.05 Reliability 0.99Fixed (all same) chi-square: 15752.04 d.f.: 82 significance: .00Random (normal) chi-square: 81.97 d.f.: 81 significance: .45
197

Appendices
(ii) Raters
Obsvd Obsvd Obsvd Fair Measure Model Infit OutfitScore Count Average Avrge Logit Error MnSq Std MnSq Std Rater
1616 405 4.0 3.6 0.79 0.08 1.0 0 1.0 0 11425 455 3.1 2.6 1.59 0.07 0.8 -2 0.8 -2 21938 480 4.0 3.3 -0.30 0.07 0.8 -2 0.9 -2 31842 456 4.0 3.5 0.23 0.07 1.0 0 1.0 0 42101 455 4.6 4.3 -1.56 0.08 1.2 3 1.2 3 51754 432 4.1 3.5 1.35 0.08 1.0 0 1.0 0 61688 452 3.7 3.5 0.49 0.08 1.1 0 1.1 1 71438 360 4.0 3.6 -0.25 0.09 1.5 5 1.5 5 81920 480 4.0 3.7 -0.42 0.08 0.9 0 1.0 0 97233 1976 3.7 3.1 0.63 0.03 1.0 0 1.0 0 107522 1943 3.9 3.5 -0.12 0.04 1.1 2 1.1 2 119114 1973 4.6 4.2 -1.50 0.04 0.9 -2 0.9 -2 128558 1978 4.3 4.0 -0.93 0.04 0.9 -2 0.9 -1 13
3703.8 911.2 4.0 3.6 -0.00 0.06 1.0 -0.0 1.0 0.2 Mean2971.1 704.9 0.4 0.4 0.94 0.02 0.2 2.4 0.2 2.3 S.D.
RMSE 0.07 Adj S.D. 0.94 Separation 14.00 Reliability 0.99Fixed (all same) chi-square: 3764.40 d.f.: 12 significance: .00Random (normal) chi-square: 12.00 d.f.: 11 significance: .36
(iii) Items
Obsvd Obsvd Obsvd Fair Measure Model Infit OutfitScore Count Average Avrge Logit Error MnSq Std MnSq Std Nu Item
2141 494 4.3 3.9 -0.72 0.07 1.2 2 1.2 3 24 TDesF1930 494 3.9 3.4 0.41 0.07 0.8 -2 0.9 -1 25 TDesG1946 493 3.9 3.4 0.31 0.07 1.0 0 1.1 0 26 TDesV2078 497 4.2 3.7 -0.31 0.07 0.9 -1 0.9 0 27 TNarF1839 497 3.7 3.2 0.95 0.07 0.7 -5 0.7 -5 28 TNarG1850 496 3.7 3.2 0.87 0.07 0.8 -3 0.8 -2 29 TNarV2028 496 4.1 3.6 -0.07 0.07 1.0 0 1.0 0 30 TNarC1978 488 4.1 3.5 0.07 0.07 1.1 1 1.1 1 31 TExp1F1818 487 3.7 3.2 0.91 0.07 0.9 -2 0.8 -2 32 TExp2G2183 497 4.4 3.9 -0.88 0.07 1.1 1 1.1 1 33 TRP1F1973 497 4.0 3.5 0.25 0.07 0.8 -2 0.8 -2 34 TRP1G2211 496 4.5 4.0 -1.05 0.07 1.3 3 1.3 3 35 TRP11A2109 489 4.3 3.8 -0.65 0.07 1.1 1 1.1 1 36 TRP2F1909 489 3.9 3.4 0.43 0.07 0.9 -1 0.9 -1 37 TRP2G1991 489 4.1 3.6 -0.01 0.07 1.8 9 1.9 9 38 TRP2A2114 494 4.3 3.8 -0.56 0.07 0.9 -1 0.9 -1 39 TExp2F1880 493 3.8 3.3 0.66 0.07 0.8 -2 0.8 -2 40 TExp2G2136 494 4.3 3.8 -0.68 0.07 0.9 0 1.0 0 41 TDisF1923 494 3.9 3.4 0.46 0.07 0.8 -2 0.8 -2 42 TDisG1956 488 4.0 3.5 0.16 0.07 0.9 -1 0.9 -1 43 TDisV2097 496 4.2 3.7 -0.43 0.07 1.3 4 1.3 3 44 TInt2011 494 4.1 3.6 -0.03 0.07 0.9 -1 0.9 -2 45 TComEf2137 497 4.3 3.8 -0.63 0.07 0.9 -1 0.9 -1 46 TSumF1911 496 3.9 3.3 0.55 0.07 0.8 -3 0.8 -3 47 TSumG
198

Appendices
Tape data – items (continued)
Obsvd Obsvd Obsvd Fair Measure Model Infit OutfitScore Count Average Avrge Logit Error MnSq Std MnSq Std Nu Item
2006.2 493.5 4.1 3.6 -0.00 0.07 1.0 -0.5 1.0 -0.3 Mean112.7 3.3 0.2 0.2 0.59 0.00 0.2 3.0 0.2 3.0 S.D.
RMSE 0.07 Adj S.D. 0.58 Separation 7.95 Reliability 0.98Fixed (all same) chi-square: 1535.03 d.f.: 23 significance: .00Random (normal) chi-square: 23.00 d.f.: 22 significance: .40
(iv) Order
Obsvd Obsvd Obsvd Fair Measure Model Infit OutfitScore Count Average Avrge Logit Error MnSq Std MnSq Std N Order
25946 6314 4.1 3.5 0.17 0.02 1.0 0 1.0 1 First22203 5531 4.0 3.6 -0.17 0.02 1.0 -1 1.0 -1 Second
24074.5 5922.5 4.1 3.6 0.00 0.02 1.0 -0.7 1.0 -0.1 Mean1871.5 391.5 0.0 0.1 0.17 0.00 0.0 1.3 0.0 1.6 S.D.
RMSE 0.02 Adj S.D. 0.17 Separation 8.06 Reliability 0.98Fixed (all same) chi-square: 131.86 d.f.: 1 significance: .00Random (normal) chi-square: 1.00 d.f.: 0 significance: 1.00
199

Appendices
C Combined data
(i) Candidates
Obsvd Obsvd Obsvd Fair Calib Model Infit OutfitScore Count Average Avrge Logit Error MnSq Std MnSq Std Cand
1401 280 5.0 5.1 3.40 0.09 1.1 1 1.1 1 1930 282 3.3 3.3 -0.48 0.09 0.8 -2 0.8 -2 2997 282 3.5 3.6 0.03 0.09 0.8 -3 0.8 -2 3
1247 282 4.4 4.5 2.01 0.09 0.7 -4 0.7 -3 41059 282 3.8 3.8 0.51 0.09 0.9 0 0.9 -1 51241 282 4.4 4.4 1.96 0.09 1.1 0 1.1 0 61240 282 4.4 4.4 1.95 0.09 0.8 -2 0.8 -2 71014 282 3.6 3.6 0.16 0.09 0.8 -2 0.8 -2 81340 282 4.8 4.8 2.79 0.09 1.3 3 1.3 3 9973 281 3.5 3.5 -0.13 0.09 1.1 0 1.1 1 10
1333 282 4.7 4.8 2.64 0.09 1.2 2 1.2 1 111146 282 4.1 4.1 1.12 0.09 0.9 -1 0.9 -1 121016 281 3.6 3.6 0.14 0.09 0.9 -1 0.9 -1 131109 282 3.9 4.0 0.83 0.09 1.0 0 1.0 0 15905 282 3.2 3.2 -0.71 0.09 0.8 -3 0.8 -2 16
1070 254 4.2 4.2 1.44 0.09 1.4 4 1.4 3 17586 271 2.2 2.1 -2.86 0.09 1.2 2 1.1 1 18
1169 282 4.1 4.2 1.30 0.09 1.0 0 1.0 0 191329 282 4.7 4.8 2.60 0.09 1.5 4 1.4 4 201146 282 4.1 4.0 1.08 0.09 0.8 -2 0.8 -2 221563 282 5.5 5.6 4.82 0.11 0.9 0 0.9 0 24820 282 2.9 2.8 -1.45 0.09 0.9 0 0.9 0 25983 282 3.5 3.4 -0.19 0.09 0.8 -2 0.8 -2 26
1347 282 4.8 4.8 2.70 0.09 0.8 -2 0.8 -2 271471 282 5.2 5.2 3.81 0.10 0.9 -1 0.9 -1 281203 282 4.3 4.2 1.54 0.09 0.8 -2 0.8 -2 291137 282 4.0 4.0 1.01 0.09 0.9 0 0.9 0 301227 282 4.4 4.4 1.85 0.09 1.3 3 1.4 3 311224 282 4.3 4.4 1.82 0.09 0.9 -1 0.9 -1 32981 281 3.5 3.5 -0.09 0.09 1.0 0 1.1 0 33
1086 282 3.9 3.9 0.71 0.09 1.0 0 1.0 0 34684 280 2.4 2.4 -2.23 0.08 1.2 2 1.2 2 35
1076 282 3.8 3.9 0.63 0.09 1.2 1 1.2 1 361453 282 5.2 5.2 3.80 0.10 1.0 0 1.0 0 37702 273 2.6 2.5 -2.02 0.08 1.2 1 1.2 1 38
1186 282 4.2 4.2 1.52 0.09 0.6 -5 0.6 -5 391554 282 5.5 5.6 4.86 0.11 1.3 3 1.3 3 40669 279 2.4 2.4 -2.29 0.08 1.1 1 1.1 1 43
1157 281 4.1 4.2 1.27 0.09 0.9 -1 0.9 -1 451455 282 5.2 5.3 3.71 0.10 1.0 0 1.0 0 46730 282 2.6 2.6 -1.92 0.08 1.5 5 1.6 5 47
1112 278 4.0 4.0 1.03 0.09 1.1 1 1.1 1 481030 273 3.8 3.8 0.51 0.09 1.7 7 1.7 7 491152 281 4.1 4.1 1.24 0.09 0.9 -1 0.9 -1 50850 281 3.0 3.1 -0.96 0.09 1.1 1 1.1 1 51
1008 282 3.6 3.6 0.18 0.09 0.9 -1 0.9 -1 521443 282 5.1 5.2 3.71 0.10 0.8 -2 0.8 -2 53885 258 3.4 3.5 -0.18 0.09 0.9 -1 0.9 -1 54
1131 282 4.0 4.1 1.13 0.09 1.1 0 1.1 1 551227 281 4.4 4.4 1.92 0.09 0.9 -1 0.9 -1 56
200

Appendices
Combined data – candidates (continued)
Obsvd Obsvd Obsvd Fair Calib Model Infit OutfitScore Count Average Avrge Logit Error MnSq Std MnSq Std Cand
813 282 2.9 2.9 -1.28 0.09 1.0 0 1.0 0 57923 280 3.3 3.3 -0.40 0.09 1.0 0 1.1 1 58
1318 281 4.7 4.8 2.66 0.09 1.0 0 0.9 0 601312 278 4.7 4.8 2.72 0.09 1.0 0 1.0 0 611354 282 4.8 4.8 2.84 0.09 0.8 -2 0.8 -2 621076 282 3.8 3.8 0.68 0.09 0.8 -2 0.8 -2 631071 282 3.8 3.8 0.64 0.09 0.7 -3 0.7 -3 64987 279 3.5 3.6 0.08 0.09 0.7 -4 0.7 -4 66
1128 281 4.0 4.0 1.11 0.09 0.8 -3 0.8 -2 671330 278 4.8 4.8 2.82 0.09 0.8 -2 0.8 -2 681056 281 3.8 3.8 0.56 0.09 0.6 -4 0.6 -5 691197 280 4.3 4.3 1.70 0.09 0.9 -1 0.9 -1 701100 280 3.9 4.0 0.95 0.09 1.1 0 1.1 0 711132 282 4.0 4.0 1.09 0.09 1.3 2 1.3 3 721107 279 4.0 4.0 0.86 0.09 1.3 3 1.3 3 741048 276 3.8 3.8 0.53 0.09 1.4 3 1.5 4 751429 282 5.1 5.1 3.47 0.10 0.9 -1 0.9 0 771380 282 4.9 4.9 3.02 0.09 1.0 0 1.0 0 781113 282 3.9 3.9 0.83 0.09 1.0 0 1.0 0 791120 281 4.0 4.0 0.91 0.09 1.2 2 1.2 2 801057 281 3.8 3.8 0.42 0.09 1.0 0 1.0 0 811309 282 4.6 4.7 2.42 0.09 0.8 -2 0.8 -2 821217 282 4.3 4.3 1.65 0.09 0.8 -3 0.8 -3 83966 272 3.6 3.5 -0.17 0.09 1.3 3 1.3 3 84
1177 282 4.2 4.1 1.20 0.09 1.0 0 1.0 0 851353 282 4.8 4.7 2.62 0.09 1.0 0 0.9 -1 86971 282 3.4 3.4 -0.40 0.09 1.5 4 1.5 4 87708 281 2.5 2.4 -2.29 0.08 0.9 -1 0.9 -1 88
1369 282 4.9 4.8 2.76 0.09 1.0 0 1.0 0 891532 282 5.4 5.4 4.33 0.11 1.0 0 1.1 1 901102 282 3.9 3.8 0.60 0.09 0.8 -3 0.8 -2 921416 282 5.0 5.0 3.16 0.10 1.1 0 1.1 1 931549 281 5.5 5.5 4.60 0.11 0.9 0 1.1 0 94
Obsvd Obsvd Obsvd Fair Calib Model Infit OutfitScore Count Average Avrge Logit Error MnSq Std MnSq Std Cand
1138.8 280.3 4.1 4.1 1.19 0.09 1.0 -0.2 1.0 -0.2 Mean217.8 4.5 0.8 0.8 1.70 0.01 0.2 2.5 0.2 2.5 S.D.
RMSE 0.09 Adj S.D. 1.70 Separation 18.79 Reliability 1.00Fixed (all same) chi-square: 28284.18 d.f.: 82 significance: .00Random (normal) chi-square: 81.98 d.f.: 81 significance: .45
201
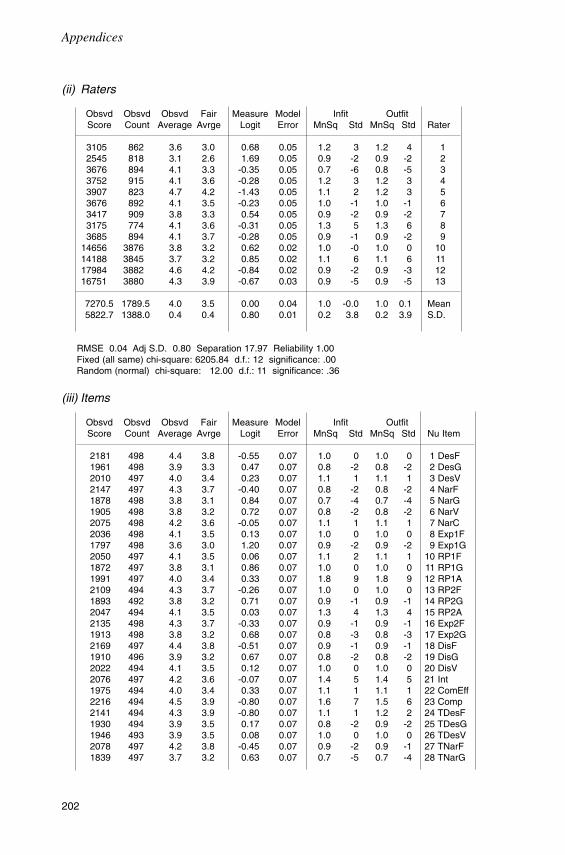
Appendices
(ii) Raters
Obsvd Obsvd Obsvd Fair Measure Model Infit OutfitScore Count Average Avrge Logit Error MnSq Std MnSq Std Rater
3105 862 3.6 3.0 0.68 0.05 1.2 3 1.2 4 12545 818 3.1 2.6 1.69 0.05 0.9 -2 0.9 -2 23676 894 4.1 3.3 -0.35 0.05 0.7 -6 0.8 -5 33752 915 4.1 3.6 -0.28 0.05 1.2 3 1.2 3 43907 823 4.7 4.2 -1.43 0.05 1.1 2 1.2 3 53676 892 4.1 3.5 -0.23 0.05 1.0 -1 1.0 -1 63417 909 3.8 3.3 0.54 0.05 0.9 -2 0.9 -2 73175 774 4.1 3.6 -0.31 0.05 1.3 5 1.3 6 83685 894 4.1 3.7 -0.28 0.05 0.9 -1 0.9 -2 9
14656 3876 3.8 3.2 0.62 0.02 1.0 -0 1.0 0 1014188 3845 3.7 3.2 0.85 0.02 1.1 6 1.1 6 1117984 3882 4.6 4.2 -0.84 0.02 0.9 -2 0.9 -3 1216751 3880 4.3 3.9 -0.67 0.03 0.9 -5 0.9 -5 13
7270.5 1789.5 4.0 3.5 0.00 0.04 1.0 -0.0 1.0 0.1 Mean5822.7 1388.0 0.4 0.4 0.80 0.01 0.2 3.8 0.2 3.9 S.D.
RMSE 0.04 Adj S.D. 0.80 Separation 17.97 Reliability 1.00Fixed (all same) chi-square: 6205.84 d.f.: 12 significance: .00Random (normal) chi-square: 12.00 d.f.: 11 significance: .36
(iii) Items
Obsvd Obsvd Obsvd Fair Measure Model Infit OutfitScore Count Average Avrge Logit Error MnSq Std MnSq Std Nu Item
2181 498 4.4 3.8 -0.55 0.07 1.0 0 1.0 0 1 DesF1961 498 3.9 3.3 0.47 0.07 0.8 -2 0.8 -2 2 DesG2010 497 4.0 3.4 0.23 0.07 1.1 1 1.1 1 3 DesV2147 497 4.3 3.7 -0.40 0.07 0.8 -2 0.8 -2 4 NarF1878 498 3.8 3.1 0.84 0.07 0.7 -4 0.7 -4 5 NarG1905 498 3.8 3.2 0.72 0.07 0.8 -2 0.8 -2 6 NarV2075 498 4.2 3.6 -0.05 0.07 1.1 1 1.1 1 7 NarC2036 498 4.1 3.5 0.13 0.07 1.0 0 1.0 0 8 Exp1F1797 498 3.6 3.0 1.20 0.07 0.9 -2 0.9 -2 9 Exp1G2050 497 4.1 3.5 0.06 0.07 1.1 2 1.1 1 10 RP1F1872 497 3.8 3.1 0.86 0.07 1.0 0 1.0 0 11 RP1G1991 497 4.0 3.4 0.33 0.07 1.8 9 1.8 9 12 RP1A2109 494 4.3 3.7 -0.26 0.07 1.0 0 1.0 0 13 RP2F1893 492 3.8 3.2 0.71 0.07 0.9 -1 0.9 -1 14 RP2G2047 494 4.1 3.5 0.03 0.07 1.3 4 1.3 4 15 RP2A2135 498 4.3 3.7 -0.33 0.07 0.9 -1 0.9 -1 16 Exp2F1913 498 3.8 3.2 0.68 0.07 0.8 -3 0.8 -3 17 Exp2G2169 497 4.4 3.8 -0.51 0.07 0.9 -1 0.9 -1 18 DisF1910 496 3.9 3.2 0.67 0.07 0.8 -2 0.8 -2 19 DisG2022 494 4.1 3.5 0.12 0.07 1.0 0 1.0 0 20 DisV2076 497 4.2 3.6 -0.07 0.07 1.4 5 1.4 5 21 Int1975 494 4.0 3.4 0.33 0.07 1.1 1 1.1 1 22 ComEff2216 494 4.5 3.9 -0.80 0.07 1.6 7 1.5 6 23 Comp2141 494 4.3 3.9 -0.80 0.07 1.1 1 1.2 2 24 TDesF1930 494 3.9 3.5 0.17 0.07 0.8 -2 0.9 -2 25 TDesG1946 493 3.9 3.5 0.08 0.07 1.0 0 1.0 0 26 TDesV2078 497 4.2 3.8 -0.45 0.07 0.9 -2 0.9 -1 27 TNarF1839 497 3.7 3.2 0.63 0.07 0.7 -5 0.7 -4 28 TNarG
202
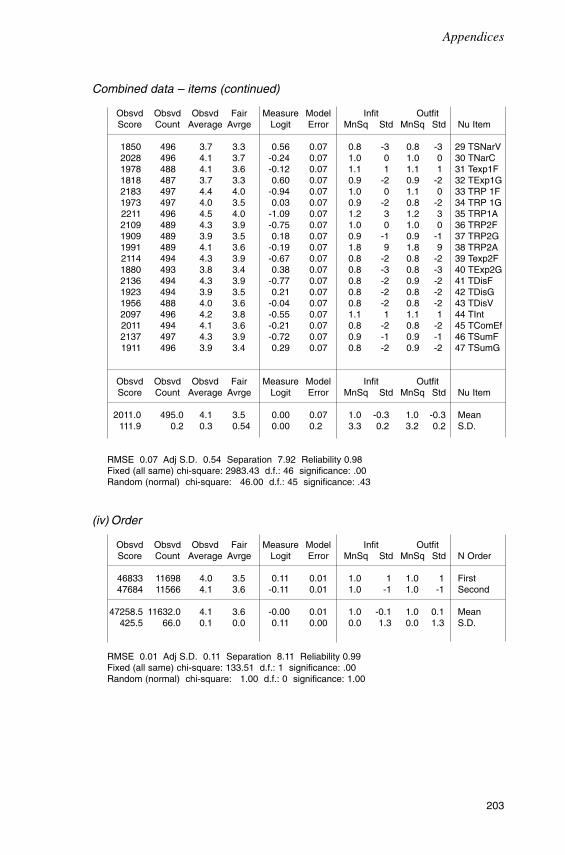
Appendices
Combined data – items (continued)
Obsvd Obsvd Obsvd Fair Measure Model Infit OutfitScore Count Average Avrge Logit Error MnSq Std MnSq Std Nu Item
1850 496 3.7 3.3 0.56 0.07 0.8 -3 0.8 -3 29 TSNarV2028 496 4.1 3.7 -0.24 0.07 1.0 0 1.0 0 30 TNarC1978 488 4.1 3.6 -0.12 0.07 1.1 1 1.1 1 31 Texp1F1818 487 3.7 3.3 0.60 0.07 0.9 -2 0.9 -2 32 TExp1G2183 497 4.4 4.0 -0.94 0.07 1.0 0 1.1 0 33 TRP 1F1973 497 4.0 3.5 0.03 0.07 0.9 -2 0.8 -2 34 TRP 1G2211 496 4.5 4.0 -1.09 0.07 1.2 3 1.2 3 35 TRP1A2109 489 4.3 3.9 -0.75 0.07 1.0 0 1.0 0 36 TRP2F1909 489 3.9 3.5 0.18 0.07 0.9 -1 0.9 -1 37 TRP2G1991 489 4.1 3.6 -0.19 0.07 1.8 9 1.8 9 38 TRP2A2114 494 4.3 3.9 -0.67 0.07 0.8 -2 0.8 -2 39 Texp2F1880 493 3.8 3.4 0.38 0.07 0.8 -3 0.8 -3 40 TExp2G2136 494 4.3 3.9 -0.77 0.07 0.8 -2 0.9 -2 41 TDisF1923 494 3.9 3.5 0.21 0.07 0.8 -2 0.8 -2 42 TDisG1956 488 4.0 3.6 -0.04 0.07 0.8 -2 0.8 -2 43 TDisV2097 496 4.2 3.8 -0.55 0.07 1.1 1 1.1 1 44 TInt2011 494 4.1 3.6 -0.21 0.07 0.8 -2 0.8 -2 45 TComEf2137 497 4.3 3.9 -0.72 0.07 0.9 -1 0.9 -1 46 TSumF1911 496 3.9 3.4 0.29 0.07 0.8 -2 0.9 -2 47 TSumG
Obsvd Obsvd Obsvd Fair Measure Model Infit OutfitScore Count Average Avrge Logit Error MnSq Std MnSq Std Nu Item
2011.0 495.0 4.1 3.5 0.00 0.07 1.0 -0.3 1.0 -0.3 Mean111.9 0.2 0.3 0.54 0.00 0.2 3.3 0.2 3.2 0.2 S.D.
RMSE 0.07 Adj S.D. 0.54 Separation 7.92 Reliability 0.98Fixed (all same) chi-square: 2983.43 d.f.: 46 significance: .00Random (normal) chi-square: 46.00 d.f.: 45 significance: .43
(iv) Order
Obsvd Obsvd Obsvd Fair Measure Model Infit OutfitScore Count Average Avrge Logit Error MnSq Std MnSq Std N Order
46833 11698 4.0 3.5 0.11 0.01 1.0 1 1.0 1 First47684 11566 4.1 3.6 -0.11 0.01 1.0 -1 1.0 -1 Second
47258.5 11632.0 4.1 3.6 -0.00 0.01 1.0 -0.1 1.0 0.1 Mean425.5 66.0 0.1 0.0 0.11 0.00 0.0 1.3 0.0 1.3 S.D.
RMSE 0.01 Adj S.D. 0.11 Separation 8.11 Reliability 0.99Fixed (all same) chi-square: 133.51 d.f.: 1 significance: .00Random (normal) chi-square: 1.00 d.f.: 0 significance: 1.00
203

Appendices
(v) Version
Obsvd Obsvd Obsvd Fair Measure Model Infit OutfitScore Count Average Avrge Logit Error MnSq Std MnSq Std Live/Tape
46368 11419 4.1 3.6 -0.18 0.01 1.1 3 1.0 2 1 Live48149 11845 4.1 3.5 0.18 0.01 1.0 -3 1.0 -2 2 Tape
47258.5 11632.0 4.1 3.5 0.00 0.01 1.0 -0.1 1.0 0.1 Mean890.5 213.0 0.0 0.1 0.18 0.00 0.0 3.8 0.0 2.7| S.D.
RMSE 0.01 Adj S.D. 0.18 Separation 12.84 Reliability 0.99Fixed (all same) chi-square: 331.54 d.f.: 1 significance: .00Random (normal) chi-square: 1.00 d.f.: 0 significance: 1.00
204

Appendices
Appendix 4.3FACETS analyses (2) oral interaction sub-test, December1992 trial (N = 76)A Live data
(i) Candidates
Obsvd Obsvd Obsvd Fair Calib Model Infit OutfitScore Count Average Avrge Logit Error MnSq Std MnSq Std Cand
715 138 5.2 5.4 3.93 0.13 1.3 2 1.2 1 1466 138 3.4 3.5 -0.42 0.13 0.8 -1 0.8 -1 2482 138 3.5 3.6 -0.13 0.13 0.7 -2 0.7 -2 3587 138 4.3 4.4 1.75 0.13 0.8 -1 0.8 -1 4496 138 3.6 3.7 0.12 0.13 1.1 0 1.1 0 5578 138 4.2 4.3 1.59 0.13 1.5 3 1.5 3 6593 138 4.3 4.4 1.85 0.13 0.8 -1 0.8 -1 7495 138 3.6 3.7 0.10 0.13 0.7 -2 0.7 -2 8672 138 4.9 5.1 3.20 0.13 1.1 1 1.2 1 9436 138 3.2 3.2 -0.97 0.14 1.0 0 1.0 0 10616 138 4.5 4.4 1.83 0.13 1.1 1 1.1 1 11562 138 4.1 4.0 0.91 0.13 0.9 0 0.9 0 12506 138 3.7 3.6 0.00 0.13 1.2 1 1.2 1 13560 138 4.1 4.0 0.88 0.13 0.9 0 0.9 0 15417 138 3.0 2.9 -1.45 0.13 0.8 -1 0.8 -1 16255 135 1.9 1.8 -4.23 0.14 1.2 1 1.1 0 18536 138 3.9 3.8 0.49 0.13 1.2 1 1.2 1 19541 138 3.9 3.9 0.36 0.13 0.8 -1 0.8 -1 22780 138 5.7 5.7 5.30 0.18 1.0 0 1.1 0 24377 138 2.7 2.7 -2.58 0.13 1.2 1 1.2 1 25484 138 3.5 3.5 -0.67 0.13 0.8 -2 0.8 -2 26674 138 4.9 4.9 2.77 0.14 1.0 0 0.9 0 27734 138 5.3 5.4 4.04 0.15 0.9 -1 0.8 -1 28591 138 4.3 4.3 1.25 0.13 0.8 -2 0.8 -1 29569 138 4.1 4.1 0.86 0.13 1.0 0 1.0 0 30620 138 4.5 4.5 2.21 0.13 1.2 1 1.2 1 31601 138 4.4 4.4 1.87 0.14 0.9 0 0.9 0 32494 137 3.6 3.6 -0.05 0.14 1.2 1 1.2 1 33523 138 3.8 3.8 0.42 0.14 1.2 1 1.2 1 34283 136 2.1 2.0 -4.05 0.14 1.4 3 1.4 3 35555 138 4.0 4.0 1.02 0.14 1.1 0 1.1 0 36702 138 5.1 5.2 3.65 0.13 0.9 0 1.0 0 37560 138 4.1 4.1 1.11 0.14 0.7 -2 0.7 -2 39758 138 5.5 5.6 4.74 0.15 1.2 1 1.2 1 40292 135 2.2 2.0 -3.74 0.14 1.3 2 1.1 0 43577 137 4.2 4.1 0.95 0.13 0.9 0 0.9 0 45713 138 5.2 5.2 3.45 0.15 0.8 -1 0.7 -1 46268 138 1.9 1.8 -4.31 0.14 1.0 0 1.1 0 47569 134 4.2 4.2 1.00 0.13 1.1 0 1.1 0 48556 137 4.1 4.0 0.61 0.13 0.9 0 0.9 0 50389 138 2.8 2.6 -2.28 0.13 1.3 2 1.2 1 51499 138 3.6 3.5 -0.36 0.13 1.0 0 1.0 0 52727 138 5.3 5.2 3.72 0.15 0.7 -3 0.7 -2 53507 138 3.7 3.6 -0.22 0.13 0.8 -1 0.8 -1 54538 138 3.9 3.8 0.31 0.13 1.0 0 1.0 0 55646 138 4.7 4.6 2.16 0.13 1.0 0 0.9 0 56351 138 2.5 2.4 -2.94 0.13 1.0 0 1.1 0 57480 136 3.5 3.4 -0.55 0.13 1.1 0 1.1 0 58694 137 5.1 5.0 3.13 0.14 0.9 0 0.9 0 60
205

Appendices
Live data – candidates (continued)
Obsvd Obsvd Obsvd Fair Calib Model Infit OutfitScore Count Average Avrge Logit Error MnSq Std MnSq Std Cand
676 138 4.9 4.8 2.71 0.14 1.2 1 1.2 1 61648 138 4.7 4.7 2.45 0.14 0.9 0 0.9 0 62530 138 3.8 3.9 0.24 0.14 1.0 0 1.0 0 63538 138 3.9 3.9 0.39 0.14 0.8 -2 0.8 -2 64500 138 3.6 3.7 -0.31 0.14 0.8 -2 0.8 -2 66549 138 4.0 4.0 0.59 0.14 1.0 0 1.0 0 67617 135 4.6 4.6 2.11 0.14 1.0 0 0.9 0 68529 138 3.8 3.9 0.22 0.14 0.6 -4 0.6 -4 69559 136 4.1 4.1 0.95 0.14 0.9 -1 0.8 -1 70510 136 3.8 3.8 0.03 0.14 1.0 0 1.0 0 71502 138 3.6 3.7 -0.28 0.14 1.2 1 1.3 1 72538 135 4.0 3.7 0.07 0.13 1.3 2 1.3 2 74738 138 5.3 5.2 3.63 0.16 1.1 0 1.2 1 77697 138 5.1 4.8 2.71 0.14 1.1 0 1.0 0 78583 138 4.2 4.0 0.64 0.13 0.9 -1 0.9 -1 79559 138 4.1 3.8 0.25 0.13 1.4 3 1.4 3 80575 138 4.2 3.9 0.51 0.13 1.1 0 1.1 0 81674 138 4.9 4.6 2.25 0.14 0.7 -3 0.7 -3 82634 138 4.6 4.3 1.51 0.13 0.7 -2 0.7 -3 83565 138 4.1 4.0 0.74 0.14 0.9 0 0.9 0 85670 138 4.9 4.8 2.81 0.14 1.0 0 1.0 0 86329 138 2.4 2.3 3.35 0.13 1.0 0 1.0 0 88650 138 4.7 4.6 2.40 0.14 1.0 0 1.0 0 89761 138 5.5 5.5 4.86 0.16 0.9 0 0.9 0 90515 138 3.7 3.7 -0.19 0.13 0.9 0 0.9 0 92682 138 4.9 4.9 3.05 0.14 1.1 1 1.1 0 93773 138 5.6 5.6 5.20 0.17 0.8 -1 0.8 -1 94
Obsvd Obsvd Obsvd Fair Calib Model Infit OutfitScore Count Average Avrge Logit Error MnSq Std MnSq Std Nu
559.2 137.5 4.1 4.0 0.86 0.14 1.0 -0.1 1.0 -0.1 Mean121.2 1.2 0.9 0.9 2.16 0.01 0.2 1.7 0.2 1.6 S.D.
RMSE 0.14 Adj S.D. 2.16 Separation 15.70 Reliability 1.00Fixed (all same) chi-square: 17592.96 d.f.: 76 significance: .00Random (normal) chi-square: 75.96 d.f.: 75 significance: .45
(ii) Raters
Obsvd Obsvd Obsvd Fair Measure Model Infit OutfitScore Count Average Avrge Logit Error MnSq Std MnSq Std Rater
1489 457 3.3 2.7 1.07 0.07 0.9 0 1.0 0 1858 294 2.9 2.9 1.09 0.09 0.9 -1 0.8 -1 2
1738 414 4.2 3.6 0.32 0.08 0.7 -3 0.8 -3 31910 459 4.2 3.9 -0.03 0.08 1.1 1 1.1 1 41576 322 4.9 4.6 -1.52 0.09 1.2 2 1.1 1 51758 414 4.2 3.8 -0.91 0.08 0.9 -1 0.9 -1 61729 457 3.8 3.4 1.23 0.07 0.9 -1 0.9 -1 71463 345 4.2 3.9 -1.25 0.08 1.1 0 1.1 0 81591 368 4.3 3.9 0.76 0.09 0.9 0 0.9 0 96898 1762 3.9 3.6 -0.08 0.04 1.0 0 1.0 0 10
206

Appendices
Live data – raters (continued)
Obsvd Obsvd Obsvd Fair Measure Model Infit OutfitScore Count Average Avrge Logit Error MnSq Std MnSq Std Rater
6200 1764 3.5 3.2 0.81 0.04 1.2 4 1.2 4 118239 1771 4.7 4.4 -1.57 0.04 1.1 2 1.0 1 127612 1764 4.3 4.0 0.07 0.04 0.8 -5 0.8 -5 13
Obsvd Obsvd Obsvd Fair Measure Model Infit OutfitScore Count Average Avrge Logit Error MnSq Std MnSq Std Rater
3312.4 814.7 4.0 3.7 -0.00 0.07 1.0 -0.3 1.0 -0.3 Mean2661.2 635.6 0.5 0.5 0.98 0.02 0.1 2.6 0.1 2.4 S.D.
RMSE 0.07 Adj S.D. 0.97 Separation 13.70 Reliability 0.99Fixed (all same) chi-square: 3569.62 d.f.: 12 significance: .00Random (normal) chi-square: 12.00 d.f.: 11 significance: .36
(iii) Items
Obsvd Obsvd Obsvd Fair Measure Model Infit OutfitScore Count Average Avrge Logit Error MnSq Std MnSq Std Nu Item
2026 462 4.4 4.0 -0.83 0.08 1.0 0 1.0 0 1 DesF1818 462 3.9 3.6 0.33 0.07 0.8 -3 0.8 -2 2 DesG1870 461 4.1 3.7 0.02 0.07 1.1 0 1.0 0 3 DesV1996 461 4.3 4.0 -0.68 0.08 0.8 -2 0.8 -2 4 NarF1739 462 3.8 3.4 0.76 0.07 0.7 -4 0.7 -4 5 NarG1769 462 3.8 3.5 0.59 0.07 0.8 -2 0.8 -2 6 NarV1930 462 4.2 3.8 -0.29 0.07 1.0 0 1.1 0 7 NarC1888 462 4.1 3.7 -0.06 0.07 1.0 0 1.0 0 8 Exp1F1659 462 3.6 3.2 1.20 0.07 0.9 -2 0.9 -2 9 Exp1G1909 461 4.1 3.8 -0.18 0.07 0.9 0 1.0 0 10 RP1F1733 461 3.8 3.4 0.78 0.07 0.9 -1 0.9 -1 11 RP1G1857 461 4.0 3.7 0.11 0.07 1.9 9 1.9 9 12 RP1A1965 458 4.3 3.9 -0.54 0.08 0.9 -1 0.9 -2 13 RP2F1752 456 3.8 3.4 0.61 0.07 1.0 0 1.0 0 14 RP2G1908 458 4.2 3.8 -0.22 0.07 1.5 6 1.5 6 15 RP2A1983 462 4.3 3.9 -0.58 0.07 0.8 -3 0.8 -3 16 Exp2F1773 462 3.8 3.5 0.57 0.07 0.8 -3 0.8 -3 17 Exp2G2015 461 4.4 4.0 -0.79 0.08 0.9 -2 0.8 -2 18 DisF1764 460 3.8 3.5 0.59 0.07 0.8 -2 0.8 -2 19 DisG1879 458 4.1 3.7 -0.09 0.07 1.0 0 0.9 -1 20 DisV1933 461 4.2 3.8 -0.32 0.07 1.3 3 1.3 3 21 Int1841 458 4.0 3.7 0.12 0.07 0.9 0 0.9 -1 22 ComEf2054 458 4.5 4.1 -1.09 0.08 1.4 5 1.3 3 23 Comp
Obsvd Obsvd Obsvd Fair Measure Model Infit OutfitScore Count Average Avrge Logit Error MnSq Std MnSq Std Nu Item
1872.2 460.5 4.1 3.7 0.00 0.07 1.0 -0.3 1.0 -0.5 Mean105.6 1.8 0.2 0.2 0.59 0.00 0.3 3.4 0.3 3.2 S.D.
RMSE 0.07 Adj S.D. 0.59 Separation 7.86 Reliability 0.98Fixed (all same) chi-square: 1432.84 d.f.: 22 significance: .00Random (normal) chi-square: 22.00 d.f.: 21 significance: .40
207

Appendices
B Tape data
(i) Candidates
Obsvd Obsvd Obsvd Fair Calib Model Infit OutfitScore Count Average Avrge Logit Error MnSq Std MnSq Std Cand
686 142 4.8 4.8 3.05 0.14 0.8 -1 0.8 -1 1464 144 3.2 3.2 -1.28 0.14 0.9 0 0.9 0 2515 144 3.6 3.6 -0.34 0.14 0.9 0 0.9 0 3660 144 4.6 4.6 2.37 0.14 0.7 -3 0.7 -2 4563 144 3.9 3.9 0.54 0.14 0.9 -1 0.9 -1 5663 144 4.6 4.6 2.43 0.14 0.9 -1 0.8 -1 6647 144 4.5 4.5 2.12 0.14 0.8 -2 0.8 -2 7519 144 3.6 3.6 -0.26 0.13 0.9 -1 0.9 -1 8668 144 4.6 4.6 2.52 0.14 1.2 1 1.2 1 9537 143 3.8 3.7 0.13 0.14 1.3 2 1.3 2 10717 144 5.0 4.8 3.31 0.15 1.0 0 1.0 0 11584 144 4.1 3.8 0.65 0.14 1.0 0 1.0 0 12510 143 3.6 3.3 -0.72 0.14 0.7 -3 0.7 -2 13549 144 3.8 3.6 -0.01 0.14 0.9 0 1.0 0 15488 144 3.4 3.2 -1.21 0.14 0.9 0 0.9 -1 16331 136 2.4 2.0 -3.87 0.13 1.4 2 1.4 3 18633 144 4.4 4.2 1.58 0.14 1.0 0 1.0 0 19605 144 4.2 4.2 1.34 0.14 1.2 1 1.2 1 22783 144 5.4 5.4 5.05 0.16 1.1 0 1.1 0 24443 144 3.1 3.0 -1.77 0.14 1.0 0 1.1 0 25499 144 3.5 3.4 -0.66 0.14 1.1 0 1.1 0 26673 144 4.7 4.7 2.66 0.14 0.9 -1 1.0 0 27737 144 5.1 5.1 3.99 0.15 1.0 0 0.9 0 28612 144 4.3 4.2 1.47 0.14 1.0 0 1.0 0 29568 144 3.9 3.9 0.64 0.14 1.0 0 1.1 0 30607 144 4.2 4.1 1.33 0.14 1.5 3 1.6 4 31623 144 4.3 4.2 1.63 0.14 0.7 -3 0.7 -3 32487 144 3.4 3.2 -0.91 0.14 1.0 0 1.1 0 33563 144 3.9 3.7 0.50 0.14 1.0 0 1.0 0 34401 144 2.8 2.6 -2.52 0.14 0.9 0 0.9 0 35521 144 3.6 3.4 -0.28 0.14 1.1 0 1.1 0 36751 144 5.2 5.1 4.30 0.15 0.9 0 0.9 0 37626 144 4.3 4.2 1.69 0.14 0.6 -3 0.6 -3 39796 144 5.5 5.4 5.49 0.17 1.7 4 1.8 4 40377 144 2.6 2.5 -3.25 0.15 1.5 3 1.6 4 43580 144 4.0 4.0 0.85 0.14 1.1 0 1.1 1 45742 144 5.2 5.1 3.97 0.15 1.4 2 1.3 2 46462 144 3.2 3.1 -1.42 0.14 1.2 1 1.2 1 47543 144 3.8 3.7 0.17 0.14 1.1 0 1.1 1 48596 144 4.1 4.1 1.15 0.14 0.7 -2 0.7 -2 50461 143 3.2 3.1 -0.92 0.14 1.0 0 1.0 0 51509 144 3.5 3.5 -0.09 0.14 1.0 0 1.0 0 52716 144 5.0 4.9 3.73 0.14 1.1 0 1.1 1 53378 120 3.2 3.0 -1.12 0.15 0.7 -2 0.7 -2 54593 144 4.1 4.1 1.45 0.14 1.2 1 1.3 1 55581 143 4.1 4.0 1.31 0.14 0.7 -2 0.7 -2 56462 144 3.2 3.1 -0.98 0.14 0.7 -2 0.7 -2 57443 144 3.1 3.0 -1.35 0.14 1.3 2 1.3 1 58624 144 4.3 4.3 2.02 0.14 0.9 0 0.9 0 60636 140 4.5 4.5 2.58 0.14 1.0 0 0.9 0 61706 144 4.9 4.8 3.16 0.13 0.7 -2 0.8 -1 62546 144 3.8 3.7 0.37 0.13 0.9 0 0.9 0 63533 144 3.7 3.6 0.13 0.14 0.9 0 0.9 0 64487 141 3.5 3.3 -0.55 0.14 0.8 -1 0.9 -1 66
208

Appendices
Tape data – candidates (continued)
Obsvd Obsvd Obsvd Fair Calib Model Infit OutfitScore Count Average Avrge Logit Error MnSq Std MnSq Std Cand
579 143 4.0 3.9 1.03 0.13 0.8 -2 0.8 -1 67713 143 5.0 4.9 3.38 0.14 0.6 -3 0.6 -3 68527 143 3.7 3.6 0.09 0.14 0.9 -1 0.9 -1 69638 144 4.4 4.3 1.97 0.13 0.8 -2 0.8 -2 70590 144 4.1 4.0 1.15 0.13 1.0 0 1.0 0 71630 144 4.4 4.2 1.83 0.13 0.8 -1 0.8 -1 72569 144 4.0 4.0 1.04 0.13 1.4 2 1.4 3 74691 144 4.8 4.9 3.26 0.14 0.7 -2 0.7 -2 77683 144 4.7 4.8 3.12 0.14 0.9 0 1.0 0 78530 144 3.7 3.7 0.34 0.13 1.1 0 1.1 1 79561 143 3.9 4.0 0.96 0.13 0.9 -1 0.9 -1 80482 143 3.4 3.4 -0.48 0.14 1.0 0 1.0 0 81635 144 4.4 4.5 2.24 0.13 1.0 0 1.0 0 82583 144 4.0 4.1 1.30 0.13 0.9 -1 0.9 -1 83612 144 4.3 4.0 1.29 0.13 1.6 4 1.5 4 85683 144 4.7 4.5 2.56 0.13 0.9 0 0.9 0 86379 143 2.7 2.2 -3.33 0.14 1.2 1 1.2 1 88719 144 5.0 4.7 3.22 0.14 1.0 0 0.9 0 89771 144 5.4 5.1 4.28 0.15 1.2 1 1.2 1 90587 144 4.1 3.8 0.83 0.14 0.8 -2 0.7 -2 92734 144 5.1 4.8 3.50 0.14 1.2 1 1.1 0 93776 143 5.4 5.2 4.53 0.16 1.0 0 0.9 0 94
Obsvd Obsvd Obsvd Fair Calib Model Infit OutfitScore Count Average Avrge Logit Error MnSq Std MnSq Std Cand
587.8 143.3 4.1 4.0 1.11 0.14 1.0 -0.2 1.0 -0.2 Mean105.3 2.9 0.7 0.7 1.98 0.01 0.2 1.8 0.2 1.8 S.D.
RMSE 0.14 Adj S.D. 1.97 Separation 14.16 Reliability 1.00Fixed (all same) chi-square: 14472.33 d.f.: 75 significance: .00Random (normal) chi-square: 74.97 d.f.: 74 significance: .45
(ii) Raters
Obsvd Obsvd Obsvd Fair Measure Model Infit OutfitScore Count Average Avrge Logit Error MnSq Std MnSq Std Rater
1528 384 4.0 3.6 0.78 0.08 0.9 -1 0.9 -1 11353 431 3.1 2.6 1.56 0.07 0.8 -2 0.8 -2 21791 432 4.1 3.3 -0.44 0.07 0.8 -2 0.8 -3 31777 432 4.1 3.6 0.94 0.08 0.9 -1 0.9 -1 41677 359 4.7 4.3 -1.90 0.09 1.2 2 1.2 2 51754 432 4.1 3.6 1.26 0.08 1.0 0 1.0 0 61447 382 3.8 3.6 0.23 0.09 1.1 1 1.1 1 71358 336 4.0 3.6 0.62 0.10 1.5 5 1.5 5 81853 456 4.1 3.7 -0.49 0.08 0.9 -1 0.9 0 96740 1821 3.7 3.2 0.59 0.04 1.0 0 1.0 0 106999 1789 3.9 3.5 -0.25 0.04 1.1 2 1.1 2 118485 1821 4.7 4.3 -1.78 0.04 0.9 -2 0.9 -1 127914 1817 4.4 4.0 -1.10 0.04 0.9 -2 0.9 -1 13
209

Appendices
Tape data – raters (continued)
Obsvd Obsvd Obsvd Fair Measure Model Infit OutfitScore Count Average Avrge Logit Error MnSq Std MnSq Std Rater
3436.6 837.8 4.0 3.6 0.00 0.07 1.0 -0.2 1.0 -0.0 Mean2763.7 650.3 0.4 0.4 1.07 0.02 0.2 2.5 0.2 2.5 S.D.
RMSE 0.07 Adj S.D. 1.06 Separation 14.77 Reliability 1.00Fixed (all same) chi-square: 4255.02 d.f.: 12 significance: .00Random (normal) chi-square: 12.00 d.f.: 11 significance: .36
(iii) Items
Obsvd Obsvd Obsvd Fair Measure Model Infit OutfitScore Count Average Avrge Logit Error MnSq Std MnSq Std Nu Item
1990 455 4.4 3.9 -0.75 0.08 1.2 2 1.3 3 24 TDesF1786 455 3.9 3.4 0.48 0.08 0.8 -2 0.9 -2 25 TDesG1803 454 4.0 3.4 0.36 0.08 1.0 0 1.1 0 26 TDesV1920 455 4.2 3.7 -0.33 0.08 0.9 -1 1.0 0 27 TNarF1692 455 3.7 3.2 1.04 0.08 0.6 -6 0.6 -5 28 TNarG1704 454 3.8 3.2 0.95 0.08 0.8 -3 0.8 -2 29 TNarV1873 454 4.1 3.6 -0.07 0.08 1.0 0 1.0 0 30 TNarC1853 451 4.1 3.6 0.03 0.08 1.1 0 1.1 1 31 TExp1F1693 450 3.8 3.2 0.98 0.08 0.9 -1 0.9 -1 32 TExp1G2016 455 4.4 3.9 -0.91 0.08 1.1 1 1.1 1 33 TRP1F1815 455 4.0 3.5 0.31 0.08 0.9 -2 0.8 -2 34 TRP1G2040 454 4.5 4.0 -1.09 0.08 1.3 4 1.3 4 35 TRPs1A1985 455 4.4 3.9 -0.72 0.08 1.0 0 1.0 0 36 TRP2F1795 455 3.9 3.4 0.43 0.08 0.9 -2 0.9 -1 37 TRP2G1887 455 4.1 3.6 -0.13 0.08 1.7 9 1.7 9 38 TRP2A1965 455 4.3 3.8 -0.60 0.08 0.9 -1 0.9 -1 39 TExp2F1741 454 3.8 3.3 0.72 0.08 0.8 -2 0.8 -3 40 TExp2G1987 454 4.4 3.9 -0.76 0.08 0.9 -1 0.9 -1 41 TDisF1782 454 3.9 3.4 0.49 0.08 0.9 -2 0.9 -2 42 TDisG1812 448 4.0 3.5 0.16 0.08 1.0 0 1.0 0 43 TDisV1937 454 4.3 3.8 -0.46 0.08 1.3 3 1.3 3 44 TInt1863 452 4.1 3.6 -0.07 0.08 0.9 -1 0.9 -1 45 TComEff1978 455 4.3 3.8 -0.68 0.08 1.0 0 1.0 0 46 TSumF1759 454 3.9 3.3 0.61 0.08 0.8 -2 0.8 -2 47 TSumG
Obsvd Obsvd Obsvd Fair Measure Model Infit OutfitScore Count Average Avrge Logit Error MnSq Std MnSq Std Nu Item
1861.5 453.8 4.1 3.6 -0.00 0.08 1.0 -0.4 1.0 -0.3 Mean (Coun105.9 1.8 0.2 0.2 0.63 0.00 0.2 3.0 0.2 3.0 S.D.
RMSE 0.08 Adj S.D. 0.63 Separation 8.05 Reliability 0.98Fixed (all same) chi-square: 1571.11 d.f.: 23 significance: .00Random (normal) chi-square: 23.00 d.f.: 22 significance: .40
210

Appendices
C Combined data
(i) Candidates
Obsvd Obsvd Obsvd Fair Calib Model Infit OutfitScore Count Average Avrge Logit Error MnSq Std MnSq Std Cand
1401 280 5.0 5.1 3.43 0.10 1.1 0 1.1 0 1930 282 3.3 3.3 -0.55 0.09 0.8 -1 0.8 -1 2997 282 3.5 3.6 -0.02 0.09 0.8 -2 0.8 -2 3
1247 282 4.4 4.5 2.01 0.09 0.7 -3 0.7 -3 41059 282 3.8 3.8 0.47 0.09 1.0 0 1.0 0 51241 282 4.4 4.4 1.96 0.09 1.1 1 1.1 1 61240 282 4.4 4.4 1.96 0.09 0.8 -2 0.8 -2 71014 282 3.6 3.6 0.11 0.09 0.8 -2 0.8 -2 81340 282 4.8 4.8 2.81 0.09 1.3 3 1.3 3 9973 281 3.5 3.5 -0.19 0.09 1.2 1 1.2 2 10
1333 282 4.7 4.7 2.67 0.09 1.2 1 1.2 1 111146 282 4.1 4.0 1.11 0.09 0.9 -1 0.9 0 121016 281 3.6 3.6 0.09 0.09 1.0 0 1.0 0 131109 282 3.9 3.9 0.81 0.09 1.0 0 1.0 0 15905 282 3.2 3.2 -0.82 0.09 0.8 -2 0.8 -2 16586 271 2.2 2.0 -3.10 0.09 1.3 3 1.3 2 18
1169 282 4.1 4.1 1.29 0.09 1.0 0 1.0 0 191146 282 4.1 4.0 1.06 0.09 0.9 -1 0.9 -1 221563 282 5.5 5.5 4.87 0.11 1.0 0 1.0 0 24820 282 2.9 2.8 -1.55 0.09 1.0 0 1.0 0 25983 282 3.5 3.4 -0.26 0.09 0.8 -1 0.8 -1 26
1347 282 4.8 4.7 2.72 0.09 0.8 -2 0.8 -2 271471 282 5.2 5.2 3.84 0.10 0.9 -1 0.9 -1 281203 282 4.3 4.2 1.52 0.09 0.8 -1 0.9 -1 291137 282 4.0 3.9 0.99 0.09 1.0 0 1.0 0 301227 282 4.4 4.4 1.86 0.09 1.4 3 1.4 4 311224 282 4.3 4.4 1.84 0.09 0.9 -1 0.9 -1 32981 281 3.5 3.5 -0.14 0.09 1.1 1 1.1 1 33
1086 282 3.9 3.9 0.69 0.09 1.0 0 1.0 0 34684 280 2.4 2.4 -2.44 0.09 1.2 2 1.2 1 35
1076 282 3.8 3.8 0.61 0.09 1.3 2 1.3 2 361453 282 5.2 5.2 3.86 0.10 1.0 0 1.0 0 371186 282 4.2 4.2 1.52 0.09 0.7 -4 0.6 -4 391554 282 5.5 5.6 4.93 0.11 1.3 3 1.3 3 40669 279 2.4 2.3 -2.50 0.09 1.2 2 1.2 1 43
1157 281 4.1 4.1 1.27 0.09 0.9 0 0.9 0 451455 282 5.2 5.2 3.77 0.10 1.1 1 1.1 0 46730 282 2.6 2.5 -2.09 0.09 1.7 7 1.8 7 47
1112 278 4.0 4.0 1.00 0.09 1.2 2 1.2 2 481152 281 4.1 4.1 1.24 0.09 1.0 0 1.0 0 50850 281 3.0 3.0 -1.06 0.09 1.1 1 1.1 1 51
1008 282 3.6 3.6 0.15 0.09 0.9 -1 0.9 -1 521443 282 5.1 5.2 3.77 0.10 0.9 -1 0.8 -2 53885 258 3.4 3.4 -0.22 0.09 0.8 -1 0.8 -1 54
1131 282 4.0 4.0 1.13 0.09 1.1 0 1.1 1 551227 281 4.4 4.4 1.94 0.09 1.0 0 0.9 0 56813 282 2.9 2.9 -1.37 0.09 1.1 1 1.1 1 57923 280 3.3 3.3 -0.46 0.09 1.1 1 1.2 1 58
1318 281 4.7 4.7 2.69 0.09 1.0 0 1.0 0 601312 278 4.7 4.7 2.76 0.09 1.0 0 1.0 0 611354 282 4.8 4.9 2.88 0.09 0.8 -2 0.8 -2 621076 282 3.8 3.8 0.65 0.09 0.8 -1 0.8 -1 631071 282 3.8 3.8 0.61 0.09 0.7 -3 0.7 -3 64
211

Combined data – candidates (continued)
Obsvd Obsvd Obsvd Fair Calib Model Infit OutfitScore Count Average Avrge Logit Error MnSq Std MnSq Std Cand
987 279 3.5 3.6 0.02 0.09 0.7 -3 0.7 -3 661128 281 4.0 4.0 1.10 0.09 0.8 -2 0.8 -2 671330 278 4.8 4.8 2.83 0.09 0.8 -2 0.8 -2 681056 281 3.8 3.8 0.52 0.09 0.7 -4 0.7 -4 691197 280 4.3 4.3 1.69 0.09 0.8 -2 0.8 -1 701100 280 3.9 3.9 0.92 0.09 1.0 0 1.0 0 711132 282 4.0 4.0 1.10 0.09 1.4 4 1.4 4 721107 279 4.0 4.0 0.84 0.09 1.4 3 1.4 4 741429 282 5.1 5.1 3.53 0.10 0.9 -1 0.9 -1 771380 282 4.9 4.9 3.07 0.10 1.0 0 1.0 0 781113 282 3.9 3.9 0.80 0.09 1.0 0 1.0 0 791120 281 4.0 4.0 0.88 0.09 1.3 3 1.3 3 801057 281 3.8 3.8 0.37 0.09 1.1 0 1.1 1 811309 282 4.6 4.7 2.43 0.09 0.9 -1 0.9 -1 821217 282 4.3 4.3 1.65 0.09 0.8 -2 0.8 -2 831177 282 4.2 4.0 1.18 0.09 1.0 0 1.0 0 851353 282 4.8 4.7 2.63 0.09 1.0 0 1.0 0 86708 281 2.5 2.3 -2.45 0.09 0.9 0 1.0 0 88
1369 282 4.9 4.7 2.77 0.09 1.0 0 1.0 0 891532 282 5.4 5.4 4.40 0.11 1.1 0 1.2 2 901102 282 3.9 3.8 0.58 0.09 0.8 -2 0.8 -2 921416 282 5.0 4.9 3.20 0.10 1.1 1 1.1 1 931549 281 5.5 5.5 4.67 0.11 1.0 0 1.1 0 94
Obsvd Obsvd Obsvd Fair Calib Model Infit OutfitScore Count Average Avrge Logit Error MnSq Std MnSq Std Cand
1150.0 280.9 4.1 4.1 1.25 0.09 1.0 -0.2 1.0 -0.1 Mean218.2 3.1 0.8 0.8 1.77 0.01 0.2 2.2 0.2 2.3 S.D
RMSE 0.09 Adj S.D. 1.77 Separation 19.21 Reliability 1.00Fixed (all same) chi-square: 26940.28 d.f.: 75 significance: .00Random (normal) chi-square: 74.99 d.f.: 74 significance: .45
(ii) Raters
Obsvd Obsvd Obsvd Fair Measure Model Infit OutfitScore Count Average Avrge Logit Error MnSq Std MnSq Std Rater
2974 821 3.6 3.0 0.65 0.05 1.2 3 1.2 4 12211 725 3.0 2.6 1.83 0.05 0.9 -2 0.9 -2 23529 846 4.2 3.3 -0.42 0.05 0.8 -5 0.8 -4 33616 868 4.2 3.7 0.92 0.06 1.1 2 1.1 2 43253 681 4.8 4.3 -1.59 0.06 1.1 2 1.2 3 53512 846 4.2 3.5 -0.28 0.05 0.9 -1 0.9 -1 63176 839 3.8 3.3 0.35 0.05 0.9 -1 0.9 -1 72821 681 4.1 3.7 -0.62 0.06 1.3 5 1.3 5 83444 824 4.2 3.6 -0.39 0.06 0.9 -2 0.9 -2 9
13595 3563 3.8 3.2 0.61 0.02 1.0 0 1.0 0 1013152 3531 3.7 3.2 0.81 0.03 1.2 6 1.2 6 1116663 3569 4.7 4.2 -0.96 0.03 0.9 -2 0.9 -3 1215455 3558 4.3 3.9 -0.93 0.03 0.9 -5 0.9 -4 13
Appendices
212

Appendices
Combined data – raters (continued)
Obsvd Obsvd Obsvd Fair Measure Model Infit OutfitScore Count Average Avrge Logit Error MnSq Std MnSq Std Rater
6723.2 1642.5 4.0 3.5 -0.00 0.05 1.0 -0.1 1.0 0.1 Mean5397.9 1276.6 0.4 0.5 0.91 0.01 0.1 3.5 0.2 3.7 S.D
RMSE 0.05 Adj S.D. 0.91 Separation 19.13 Reliability 1.00Fixed (all same) chi-square: 6706.57 d.f.: 12 significance: .00Random (normal) chi-square: 12.00 d.f.: 11 significance: .36
(iii) Items
Obsvd Obsvd Obsvd Fair Measure Model Infit OutfitScore Count Average Avrge Logit Error MnSq Std MnSq Std Nu Item
2008 456 4.4 3.9 -0.74 0.07 1.1 1 1.1 1 1 DesF1804 456 4.0 3.4 0.32 0.07 0.8 -2 0.9 -2 2 DesG1855 455 4.1 3.5 0.04 0.07 1.2 2 1.1 2 3 DesV1979 455 4.3 3.8 -0.60 0.07 0.9 -1 0.9 -1 4 NarF1724 456 3.8 3.2 0.73 0.07 0.7 -4 0.7 -4 5 NarG1755 456 3.8 3.3 0.57 0.07 0.9 -1 0.9 -1 6 NarV1914 456 4.2 3.7 -0.24 0.07 1.1 1 1.1 1 7 NarC1871 456 4.1 3.6 -0.02 0.07 1.0 0 1.0 0 8 Exp1F1645 456 3.6 3.0 1.13 0.07 0.8 -2 0.8 -2 9 Exp1G1890 455 4.2 3.6 -0.13 0.07 1.1 0 1.1 0 10 RP1F1715 455 3.8 3.2 0.77 0.07 0.9 -1 0.9 -1 11 RP1G1834 455 4.0 3.5 0.16 0.07 1.7 8 1.7 8 12 RP1A1954 454 4.3 3.8 -0.49 0.07 1.0 0 0.9 0 13 RP2F1744 453 3.8 3.3 0.59 0.07 0.9 -1 0.9 -1 14 RP2G1898 454 4.2 3.6 -0.19 0.07 1.4 4 1.4 4 15 RP2A1965 456 4.3 3.8 -0.51 0.07 0.9 -1 0.9 -1 16 Exp2F1760 456 3.9 3.3 0.55 0.07 0.8 -3 0.8 -3 17 Exp2G2003 455 4.4 3.9 -0.74 0.07 0.9 -1 0.9 -1 18 DisF1754 454 3.9 3.3 0.55 0.07 0.8 -3 0.8 -3 19 DisG1869 452 4.1 3.6 -0.09 0.07 1.0 0 1.0 0 20 DisV1915 455 4.2 3.7 -0.27 0.07 1.4 4 1.3 4 21 Int1828 452 4.0 3.5 0.12 0.07 1.1 2 1.1 1 22 CommEff2041 452 4.5 4.0 -1.02 0.07 1.6 7 1.5 6 23 Comp1990 455 4.4 3.8 -0.67 0.07 1.1 1 1.2 3 24 TDesF1786 455 3.9 3.4 0.39 0.07 0.9 -2 0.9 -1 25 TDesG1803 454 4.0 3.4 0.29 0.07 1.0 0 1.0 0 26 TDesV1920 455 4.2 3.7 -0.30 0.07 0.9 -2 0.9 -1 27 TNarF1692 455 3.7 3.1 0.87 0.07 0.7 -4 0.7 -4 28 TNarG1704 454 3.8 3.2 0.78 0.07 0.8 -3 0.8 -3 29 TNarV1873 454 4.1 3.6 -0.08 0.07 1.0 0 1.0 0 30 TNarC1853 451 4.1 3.5 0.01 0.07 1.1 0 1.1 1 31 TExp1F1693 450 3.8 3.2 0.81 0.07 0.9 -1 0.9 -1 32 TExp2G2016 455 4.4 3.9 -0.81 0.07 1.1 0 1.1 1 33 TRP1F1815 455 4.0 3.4 0.24 0.07 0.9 -1 0.9 -1 34 TRP1G2040 454 4.5 4.0 -0.96 0.07 1.3 3 1.3 3 35 TRP1A1985 455 4.4 3.8 -0.64 0.07 0.9 -1 0.9 0 36 TRP2F1795 455 3.9 3.4 0.35 0.07 0.9 -1 0.9 -1 37 TRP2G1887 455 4.1 3.6 -0.13 0.07 1.6 8 1.7 9 38 TRP2A1965 455 4.3 3.8 -0.53 0.07 0.8 -2 0.8 -2 39 TExp2F1741 454 3.8 3.3 0.60 0.07 0.8 -3 0.8 -3 40 TExp2G1987 454 4.4 3.8 -0.67 0.07 0.8 -3 0.8 -2 41 TDisF1782 454 3.9 3.4 0.40 0.07 0.8 -2 0.9 -2 42 TDisG
213

Appendices
Combined data – items (continued)
Obsvd Obsvd Obsvd Fair Measure Model Infit OutfitScore Count Average Avrge Logit Error MnSq Std MnSq Std Nu Item
1812 448 4.0 3.5 0.12 0.07 0.9 -2 0.9 -2 43 TDisV1937 454 4.3 3.7 -0.41 0.07 1.1 1 1.1 1 44 TInt1863 452 4.1 3.6 -0.08 0.07 0.9 -1 0.9 -2 45 TCommEff1978 455 4.3 3.8 -0.60 0.07 0.9 -1 1.0 0 46 TSumF1759 454 3.9 3.3 0.50 0.07 0.9 -1 0.9 -1 47 TSumG
Obsvd Obsvd Obsvd Fair Measure Model Infit OutfitScore Count Average Avrge Logit Error MnSq Std MnSq Std Nu Item
1859.6 454.3 4.1 3.5 -0.00 0.07 1.0 -0.2 1.0 -0.2 Mean105.5 1.6 0.2 0.2 0.55 0.00 0.2 3.1 0.2 3.0 S.D.
RMSE 0.07 Adj S.D. 0.54 Separation 7.51 Reliability 0.98Fixed (all same) chi-square: 2683.28 d.f.: 46 significance: .00Random (normal) chi-square: 46.00 d.f.: 45 significance: .43
214

Appendices
Appendix 5.1Lexical density figures (%) with unweighted lexical items,December 1992 trial (N = 20)
Description Narration Interview Role playID Live Tape Live Tape Live Tape Live Tape
2 38 41 36 45 37 37 37 415 49 47 32 41 46 45 33 469 34 36 37 35 38 44 34 4010 43 42 39 44 41 43 39 4013 31 44 38 35 42 39 32 4316 38 41 32 37 38 40 32 4722 41 41 38 39 40 43 37 4227 43 38 32 43 44 41 37 4129 49 49 41 41 47 52 34 4831 38 33 37 41 39 38 31 4440 42 50 44 43 40 46 40 4943 36 42 38 41 41 46 39 4145 39 41 41 38 43 44 35 3546 41 42 33 37 40 45 35 4648 36 42 39 36 42 47 32 3750 43 42 40 45 37 40 33 3951 44 35 41 42 39 40 39 4253 42 36 39 44 36 39 33 3560 38 43 41 36 37 41 38 3578 35 42 38 38 44 44 35 48
215

Appendices
Appendix 5.2Lexical density figures (%) with weighted lexical items,December 1992 trial (N = 20)
Description Narration Interview Role playID Live Tape Live Tape Live Tape Live Tape
2 32 35 28 36 27 30 30 365 41 42 27 37 37 38 28 409 27 33 30 30 31 36 23 3310 34 36 32 35 32 34 31 3513 26 37 32 28 34 33 25 3816 34 33 26 31 31 34 25 4022 32 32 31 30 32 35 27 3827 35 31 27 37 38 35 30 3429 43 43 34 36 39 45 29 4431 30 31 31 35 33 31 25 3840 35 44 36 40 34 41 32 4143 29 38 30 34 31 36 30 3645 33 36 35 34 35 37 30 2946 34 37 30 31 32 39 26 3748 31 36 32 32 34 39 25 2750 35 37 32 38 29 33 24 3451 40 29 32 39 31 34 30 3853 35 32 34 37 31 32 27 3360 30 36 31 27 28 33 29 2978 27 36 31 32 34 34 27 39
216

Appendices
Appendix 6.1Scoring criteria and descriptors, oral interaction sub-test,June 1994
FLUENCY7 Speech is marked by a very high degree of fluency.6 Speech is marked by a high degree of fluency with occasional
hesitation.5 Speech is fluent but with some hesitation or deliberation.4 Noticeable hesitation and some groping for words is present, but
does not impede communication.3 A marked degree of hesitation, grasping for words or inability to
phrase utterances easily impedes communication.2 Speech is fragmented because of hesitations, pauses or false
starts.1 Fluency is evident only in the most formulaic phrases.
GRAMMAR7 Range and control of grammatical structures are precise and
sophisticated.6 Candidate uses a broad range of structures with only occasional
minor errors.5 Communication is generally grammatically accurate with a
range of structures; minor errors may be noticeable.4 Satisfactory communication is achieved despite a limited range
of structures and/or obvious grammatical inaccuracies.3 Communication is less than satisfactory because of a limited
range of structures and/or the presence of frequent errors.2 Limited communication is possible but errors are likely to be
frequent and intrusive.1 Severe limitations of grammar prevent all but the most basic
communication.
217

Appendices
VOCABULARY7 Candidate uses a wide range of vocabulary precisely,
appropriately and effectively.6 Candidate uses a wide range of vocabulary effectively though
occasionally may be imprecise.5 Vocabulary is broad enough to allow the candidate to express
ideas well. Circumlocution is smooth and effective, if required.4 Vocabulary is broad enough to allow the candidate to express
most ideas. Can usually circumlocute to cover gaps invocabulary, if required.
3 Vocabulary is broad enough to allow the candidate to expresssimple ideas. Circumlocution is sometimes ineffective.
2 Limited vocabulary restricts expression to common words andphrases. Circumlocution is laborious and often ineffective.
1 Vocabulary is very limited.
INTELLIGIBILITY7 Speech is clear and can be followed effortlessly.6 Speech is generally clear and can be followed with little effort.5 Speech can be followed though at times requires some
concentration by the listener.4 Speech can generally be followed though sometimes causes
strain.3 Speech can generally be followed though frequently causes
strain.2 Speech requires constant concentration to be understood.1 Speech can only be followed intermittently and then only with
considerable effort.
COHESION7 Cohesive devices are smoothly and effectively managed.6 A good range of cohesive devices is used but occasionally these
may be inappropriate.5 A range of cohesive devices is used but these may be
inappropriate.4 Cohesive devices are limited in range and may be used
inappropriately or inaccurately.3 Very simple cohesive devices are used to link sentences but
errors are frequent.2 There is some evidence of connected discourse but the overall
effect is disjointed.1 Candidate is able to use only isolated words and formulaic
phrases.
218

Appendices
COMPREHENSION (live version only)7 Candidate rarely misunderstands, except occasionally when
speech is very rapid or ambiguous.6 Candidate appears to have only occasional problems in
understanding.5 Candidate appears to be able to understand most speech but may
require repetition of some details.4 Candidate is generally able to get the gist of most speech
although s/he may require repetition, and is more comfortablewith slower rates of speech.
3 Candidate often has difficulty understanding utterances, and mayrequire frequent repetition or reformulation.
2 Candidate is only able to understand simplified speech.1 Candidate demonstrates only intermittent comprehension.
OVERALL COMMUNICATIVE EFFECTIVENESS
Scale of 1 to 7 without descriptors (7 = near native flexibility and range;1 = limited).
219

Appendices
Appendix 6.2Observation notes: Abdul and Wing Li, June 1994 trial
1 Notes recorded at the time the test was conducted
A Abdul
(i) Live versionA = AbdulI = InterlocutorSettingSmall classroom. Quiet with natural lighting.
Section 1 (warm up)I asks questions in a relaxed, informal manner, smiling with sustained eyecontact. A a little tentative: clasping hands, feet crossed. Responses areOK: speaks with careful phrasing and emphasis. At the end I checkscassette recorder is working. He smiles and they both laugh.
Section 2aQ1: During preparation time A studies picture carefully. When respondinglooks at I for confirmation. I keeps smiling and nodding. He also providessome verbal feedback e.g. ‘Mm’ or ‘Yep’. Q2: A again studies picturescarefully. Asks what ‘accommodation’ means. I reads question verynaturally, clearly. A answers still looking closely at pictures, not lookingmuch at I. A speaks quite fluently but softly. Again, I provides occasionalverbal feedback (‘mm’, ‘yea’). Q3: A speaks with more animation (widervoice range), uses hand gestures and establishes better eye contact with I.A still looking at pictures (for ideas?), silent at such times. I allowssilences for thinking time and doesn’t comment. At the end of A’s answerI says ‘Yep, that’s fine’.
Section 2bA studies pictures very carefully in preparation time. A talks while stilllooking closely at pictures, occasionally glancing at I. I nods, smiles andprovides occasional verbal feedback (‘mm’, ‘yea’). A seems unsure aboutlast two pictures: hesitates before continuing the story at these two points.I says ‘OK, that’s fine’ at the end.
Section 3I reads instructions for role play and smiles reassuringly. Duringpreparation time A appears a little anxious: body slightly tense, shiftingfeet back and forward. I starts role play off. A is rather tentative at first. Ispeaks quite a lot, especially at the outset. A appears to gradually relax and
220

Appendices
enter into his role more enthusiastically. Problem posed by the situation inthe role play is satisfactorily resolved at the end. I says ‘good’ and bothlaugh.
Section 4aA asks what the terms ‘attitudes’ and ‘patterns’ mean. I explains first wordbut says ‘I’m not sure how much I can tell you’ in response to query aboutsecond word. Q1: A looks at graph while talking and I says very little. Q2:A uses more eye contact and hand gestures, speaks more confidently.Sometimes not intelligible when speaking softly. Q3: A is quite relaxed,even joking and smiling at times. Eye contact is maintained throughout. Ismiles slightly, raises eyebrows and nods at times and occasionally says‘Yep’.
Section 4bA appears to prepare carefully, studying graph and questions in detail. Aanswers all four questions quite confidently. I is more strict with theamount of time he allows A to answer in.
Section 5A responds fluently and confidently although he pauses for a while some-times. I does not fill these pauses and allows A the time to think. A is moreexpansive in this section and speaks more loudly, using a lot of handgestures as well.
(ii) Tape versionA = AbdulSettingLanguage lab with 20 candidates. Room is hot and stuffy with no naturallight. Supervisor adopts a formal manner (e.g. ‘Don’t open your testbooklets until I tell you to.’)
Section 1 (warm up)A appears relaxed and answers questions calmly and confidently.
Section 2aQ1: A looks very closely at first picture during prep time. Still looking atpicture while speaking. He uses very careful phrasing. Appears to behaving trouble monitoring himself with noise of other people speakingaround him. Even listening to him with headphones is difficult because ofthe other people talking. A is cut off by next segment. Q2: A is again cutoff by next question. Q3: A is speaking more slowly than in live test but isnot cut off in this case.
Section 2bA appears more tense: furrowed brow, body seems a bit rigid. Usespictures to create a descriptive commentary rather than a story (‘In picture1, in picture 2’). Response completed with plenty of time to spare here.
221

Appendices
Section 2cA takes notes as suggested while dialogue is playing. Continues writingduring preparation time. When prompted to speak A seems to bestruggling to find what he wants to say in his notes and doesn’t end upsaying very much. He’s looking very tense at this point with pursed lipsand a very furrowed brow.
Section 3A still looks anxious as he reads and prepares his response. He mouths thewords on the page as he reads them. He seems to struggle again to find theright words when he speaks. His response becomes a little more fluenttowards the end but it is still marred by a lot of pauses and hesitations.
Section 4aQ1: A still speaking very slowly and deliberately but a bit moreconfidently now. Still looking tense and pressured – perhaps concernedabout being cut off? Q2: A repeats question in answer, seems to completeresponse in time on this occasion. Q3: Response seems clear enoughalthough there is a long pause in the middle.
Section 4bA provides a full, fairly fluent response but cut off at the end by nextsection.
Section 5Q1: A talking a bit more quickly and confidently here, finishes on time.Q2: A hesitates a fair bit but the answer is quite coherent. Cut off onceagain. Q3: A gives fairly full answer, in fact seems to be adding furtherdetail just to fill up the time at the end. Q4: A speaks more slowly againbut not so hesitatingly.
Section 6Q1: A studies pictures very carefully before and while speaking. Q2: Avery engaged by this task. Doesn’t hesitate or pause much and gives whatappears to be a complete answer. Q3: Some pausing and hesitation here aswell as slower speech.
B Wing Li
(i) Tape versionW = Wing LiSettingLanguage lab: 13 other candidates, rather stuffy with no natural light.Supervisor seems more relaxed than in the morning sessions.
Section 1 (warm up)W sitting in a fairly relaxed manner. Answers questions in a relaxed, fairlyconfident manner: appears quite at home with language lab environment.
222

Appendices
Section 2aQ1: W answers quite fluently even though she is still studying the picturesthroughout her response. When almost finished she is cut off by the nextquestion. Q2 and Q3: Very clear answers and in both instances she finisheson time.
Section 2bW delivers a very clear narrative. She speaks very fluently apart from afew pauses and hesitations.
Section 2cW has hand on forehead while recorded dialogue is playing. She doesn’ttake many notes. She starts talking immediately after the beep andprovides a very clear answer which is cut off at the end.
Section 3W again concentrates very hard in question time. Begins talkingimmediately after she is prompted to do so. However, in this case herspeech is a little more disjointed than in the previous sections. She is cutoff at the end but again she appears to have almost completed her answer.
Section 4aQ1: W responds quite fully with some hesitation. She is cut off at the end.Q2: Again she doesn’t finish her response but it is very clear. Q3: Speaksvery confidently and fluently. She seems to be merely filling up theremaining silence at the end however, without having much left to say.
Section 4bHandles this task very competently. Her response is fluent and clear.
Section 5Q1: W hesitates somewhat. She seems to be responding to Q2 in part. Q2:Unusually, she pauses before beginning speaking. She also repeats someof her answer to Q1. She is cut off at the end although her answer appearedto be complete. Q3 and Q4: Fluent, clear answers. She is cut off in bothquestions but appears to be merely filling in time towards the end,especially in Q4.
Section 6Q1: Very full and interesting response. Q2: Cut off, this time withoutappearing to finish the main thrust of her answer. Q3: W shows somehesitation here. Her answer includes some self-repair and pausing. She isalso cut off again, but, as is usually the case, she appears to have presentedthe major part of her answer.
223

Appendices
(ii) Live versionW = Wing LiI = InterlocutorSettingLarge classroom. Quiet but without natural lighting.
Section 1 (warm up)The I seems to be rushing through these questions. She asks each onequickly and begins the next one as soon as W has provided even the mostminimal answer. W appears a little ill at ease: her body seems stiff and sheis clasping her hands. I also seems uncomfortable: she doesn’t smile muchand her gaze seems expectant but not very friendly.
Section 2aI reads instructions rapidly. In preparation time W looks rather anxiouswhile studying pictures. Her answer to Q1 is a bit tentative. She looks toI for reassurance but I gives little aural/visual feedback. W is still ratherhesitant in her answers to Q2 and Q3. I still seems rather ill at ease. Shedoesn’t use much verbal feedback although she does nod occasionally andestablish eye contact sporadically.
Section 2bIn preparation time W seems to want clarification. She asks whether theperson in the story has a sore back. I evades the question by telling her tothink about the story for a minute and then she can talk. W is a bit moreconfident in her response on this task. W still glances occasionally at theI for confirmation, without much success on the whole. W still claspingher hands while talking. Her response is quite comprehensive and clear.She laughs at the end although the reason for this is unclear – is sheembarrassed or beginning to relax? I gives a quick smile and nods severaltimes towards the end of W’s answer. She seems eager for W to finish.
Section 3In role play I speaks a lot and uses gestures in acting out her role. W seemsrather inhibited, even a little embarrassed. She doesn’t contribute muchalthough the I doesn’t really give her much room to talk anyway.
Section 4aW speaks quite freely and more confidently in this task. I gives very littlefeedback, either verbal or non-verbal. I seems more tense than W at thispoint.
Section 4bW is definitely more relaxed now, sometimes smiling at I while listeningand talking. I has slowed a bit in the speed of her delivery of theinstructions and questions but she still gives the impression of wanting thetest to be over as quickly as possible. W’s responses are generally clearalthough she hesitates in places.
224

Appendices
Section 5In preparation time W talks to herself quietly as if rehearsing her answer.I appears to relax a little in this final section. At the end of Q1 she says‘Sounds good’ and provides more consistent verbal feedback throughoutall four questions. However, I still appears keen to bring the test to an end:she moves quickly on to each successive question. W is reasonablyrelaxed, even laughs on occasions (although again this could be the resultof nervousness). Her answers are fairly clear although she appears to bespeaking quite deliberately, monitoring herself carefully.
2 Notes based on video recordings
A Abdul
(i) Live versionA = AbdulI = InterlocutorSetting: large, bright room. Some extraneous traffic noise.
Section 1 (Warm up)I reads questions, smiles. He folds his hands on the table, leaning forwardslightly in his chair. A sits upright, hands together underneath the table. Aspeaks fairly intelligibly though rather softly and carefully initially. Ismiles encouragingly and A begins to speak more freely and loudly.I checks cassette recorder is working. A smiles as he listens to himself ontape.
Section 2aA changes glasses to look at page 2. A studies pictures carefully in preptime, looks up once at I. I allows full amount of prep time for Q1. A studiespicture while talking. He uses an occasional hand gesture but doesn’t lookat I very much. I sits with hands folded, not saying much. He looksalternately at A and at the pictures. A looks up at I after finishing hisanswer to Q1 and smiles. I says ‘That’s good’, then moves on to nextquestion. Full preparation time for Q2 allowed. A begins talkingimmediately when prompted to do so. He still looks at the pictures whiletalking although he occasionally looks up at the I. Again I looksalternately at the booklet and at A. In Q3 A still looks at the picture eventhough the question doesn’t really require him to do so. He uses handgestures frequently now, both it seems to highlight meaning and tocompensate for problems in English. I eventually terminates A’s responsewhen it appears he has nothing important left to say.
225

Appendices
Section 2bI reads instructions. A studies pictures. Full prep time allowed. I foldsarms and asks questions which cue A’s response. A discusses content ofeach picture in present rather than past time. A looks up occasionally at Ifor confirmation. I nods in response. A appears a little unsure of what ishappening in several of the pictures. He hesitates at one point and says hecan’t really understand what’s happening. The I smiles sympatheticallybut doesn’t actively assist him. A perseveres and eventually finishes thetask. I says ‘That’s fine’.
Section 3I reads instructions for the role play. A studies the role play card in the preptime. Full prep time allowed. Both I and A appear to be comfortable withtheir respective roles. I talks a fair bit, probably more than A. Neither ofthem look at the booklets much at all in this task. Both laugh together atthe end.
Section 4aA studies graph and questions in prep time. He asks what ‘attitudes’means. I appears rather uncomfortable at this point and says, ‘I’m not surehow much I can tell you.’ They laugh together. I then explains themeaning. Full prep time allowed. A answers Q1 immediately whenprompted to begin. He talks while studying the graph and looks upoccasionally. I alternately looks at A and at his own booklet. In Q2 and Q3A is still looking at the graph while talking though not as much as in Q1.He uses hand gestures sometimes. He smiles fairly often and holds hishands together on the table most of the time. I is attentive, smiles and nodsoften. At the end of this section he says to A, ‘All right, that’s good.’
Section 4bFull prep time allowed. Once again A studies graph while talking most ofthe time. He answers Q1 briefly but confidently, Q2 and Q3 a bithesitantly but in some detail and Q4 quite briefly and then laughs at theend.
Section 5Full prep time allowed. A answers questions in detail and less hesitantlythan most other questions. He also maintains eye contact with I morecontinuously. He only occasionally glances at relevant page in booklet tocheck questions.
226

Appendices
(ii) Tape versionA = Abdul
Section 1 (warm up)In Q1 A starts to speak before instead of after the bell. He does the samein Q2 but this time starts again after the bell. He begins talking after thebell in Q3 and Q4 but is cut off by the next questions. He beginsappropriately in Q5 and finishes within the time allowed.
Section 2aA studies pictures intently in prep time. His neighbour looks to see whathe’s doing. A is leaning forward with his elbows on the desk. He appearsto be concentrating very intensely while he responds to Q1. At one pointhe says ‘Sorry’ and starts again. He is speaking fairly slowly anddeliberately, giving the impression he is closely monitoring his speech. Heis cut off at the end. In Q2 he speaks a little more quickly but is still cutoff. He completes Q3 in time.
Section 2bA studies pictures closely in prep time. When prompted to begin talkinghe describes the actions in each of the eight pictures in the present tense.He rushes a little in this section, as if worried he’ll be cut off again.
Section 2cAgain, A studies his booklet very carefully. He takes notes while helistens, as advised for this task. He shifts around in his chair a little. He isstill taking notes when the announcement finishes (his neighbour tries toread them). He begins talking immediately when given the cue but soonbegins to pause for long periods and ends up actually saying very little.His last phrase is cut off.
Section 3A studies booklet both during and after the prep time. He speaks morefluently in this task with only a couple of hesitations. He is cut off at theend.
Section 4aA studies booklet very carefully in prep time. He begins speakingimmediately after the bell. His answer to Q1 is fairly fluent with onlyminor hesitations. He speaks with even greater ease in Q2. He is morehesitant in Q3 and there are several long pauses. Not cut off in any of thesequestions.
Section 4bAgain, A studies questions very closely in prep time. He is breathingheavily now and looks tired and a little stressed. Nevertheless, he speaksquite fluently and confidently. He is cut off at the end.
227

Appendices
Section 5A prepares carefully. In Q1 he speaks quite confidently and easily. Hefinishes well within the time. In Q2, Q3 and Q4 he is a little more hesitantbut still quite fluent. He is cut off in Q4.
Section 6A prepares carefully as usual. In Q1 he hesitates a little. He looks intentlyat pictures while speaking. In Q2 he speaks quite quickly at first, thenslows down and pauses a little as his response continues. He is cut of bythe next question. In Q3 he hesitates a little but his answer is reasonablyclear.
B Wing Li
(i) Tape versionW = Wing Li
Section 1 (warm up)Not recorded
Section 2aQ1: W studies picture, blinking with hand under chin. She speaks fairlysoftly but confidently without hesitations. Q2 and Q3: W speaks quitefluently, again with little hesitation or pausing. She is cut off in Q2 but inboth questions she provides a comprehensive answer.
Section 2bW folds arms on top of desk to prepare. She studies the pictures closely.She seems a bit more hesitant in her response on this task. Her version ofthe story is quite coherent staying close to the pictures. There are some re-phrasings. She is cut off just before finishing.
Section 2cW yawns while instructions are read, listens intently while interview isplayed, hand over head then under her chin. She takes some notes duringand at the end of the interview. She speaks quite animatedly and fluently,providing a comprehensive summary. She is cut off just prior tocompletion.
Section 3W appears to be listening and reading her instructions very carefully withher hands under her chin. She is rather hesitant in her response but quitecoherent, leaning forward over the desk. She is cut off again.
Section 4aW prepares carefully, studying the questions and graph closely. Q1: Shebegins talking immediately. She gives a fluent answer but is cut off at theend. Q2: As for Q1. Her answer here includes a good range of vocabulary.Q3: Clear, coherent comparison between China and Australia.
228
Appendices
Section 4bAs usual, W appears to be concentrating intently on the task at hand in theprep time. She answers comprehensively but is cut off prior to completingher answer.
Section 5Initially, W appears to be answering all four questions simultaneouslyhere. She realises her mistake after Q2 is read aloud. She handles thisconfusion well and her next three responses are more specifically gearedto the individual questions. She is cut off in Q1 and Q3.
Section 6W appears to be studying the pictures and questions carefully in the preptime with her arms folded on the desk. Q1: She begins talking in aconfident manner and provides a clear answer with few hesitations. Q2:This answer is a bit hesitant but still coherent. She is cut off by the nextquestion. Q3: A fluent response but again cut off before finishing.However, W appears to have completed the major part of her answer andis simply filling in time by elaborating further. At the end of this sectionshe takes the headphones off and smiles.
(ii) Live versionW = Wing LiI = InterlocutorSetting: Small classroom, a bit stuffy without natural light.
I reads general instructions about the test quickly, pushing her hair back.W nods.
Section 1 (warm up)I asks each warm up question in fairly quick succession. W appears a bitawkward and embarrassed, laughing nervously especially in Q5 where shere-starts several times. I checks tape recorder is working. She also checkswith W: ‘That’s OK isn’t it?’ without smiling. W nods in agreement.
Section 2aI reads instructions fairly briskly and W studies the first picture. There isvery little eye contact between them. I allows the full prep time for Q1then asks question. W talks fairly hesitantly occasionally looking up at I.I nods or occasionally smiles with her head down. In Q2 and Q3 I appearsa little tense and restless. She folds and then unfolds her arms on the table.W still speaking fairly hesitantly looking up at I at times as if forencouragement. I nods in a rather perfunctory manner, and, even morerarely, gives her a half smile at these moments.
229

Appendices
Section 2bI reads instructions fairly quickly. W asks for clarification about whathappens to the woman in the story. I replies, ‘You just think about it for aminute and then I’ll ask that question.’ She therefore appears to miss thepoint of W’s question, whether deliberately or not. W is clearly confusedabout what is happening in the sequence of pictures and needs assistance.I has a sip of water and waits one minute before cuing W’s response. Wtells the story rather tentatively. I moves the tape recorder close to W whileshe’s talking. W looks up at several points and I nods curtly when she doesthis. W has her hands folded fairly tightly on the desk and sometimesswitches them to below the desk. I has her hands behind her head, thenover her forehead, then behind her head again and finally folded in frontof her while W speaks. W smiles at the end of her answer. I gives a quick,rather tight smile in response. Both of them seem quite anxious at thispoint.
Section 3I reads instructions a bit more slowly here. W asks for clarification abouttheir respective roles. W reads her role play card, hands clasped on table.I sits with arms folded tightly leaning on the table. I looks up after oneminute and begins the role play. I pretends to be looking for photos in adrawer. Both smile, looking at each other. W puts up some resistance inher role as directed in the instructions for this task and refuses to acceptthe replacement film. I quickly agrees to W’s demands as if she wants toend the role play as soon as possible. Throughout the role play W and Ioften smiled reassuringly at each other, as if to acknowledge that theconflict they were involved in was fake.
Section 4aI reads instructions quite rapidly again and W looks at the graph andquestions. At the end of the prep time I says ‘OK?’ W nods but there is stillno eye contact between them. W gives quite a lengthy answer to Q1 stillwithout looking at I. I nods occasionally while W talks. In Q2 W respondsmore confidently, occasionally looking up at I who nods. I goes straightinto Q3 when W pauses although it is unclear whether W has actuallyfinished her answer. In Q3 W answers quite fluently. She looks up once atI during her answer. I nods but doesn’t smile. W looks up at the endapparently to signal to I she has finished her answer.
230

Appendices
Section 4bI reads instructions quickly and W studies the questions and graphicalinformation carefully in prep time. W gives a short answer for Q1 andlonger answer for both Q2 and Q3. In both instances she looks up at I attimes. I nods in reply. W looks up again when she has finished heranswers. W is smiling more in this section. In Q4 W laughs in a fairlyrelaxed way when discussing the kind of technology she uses at home andI even manages a full smile in response.
Section 5I reads instructions a little less hurriedly than in section 4. In this case Ilooks at W while she answers the questions. W is also looking more at Ihere. This behaviour might indicate they are more relaxed with each othernow although the open nature of this task probably promotes moreinteraction. W answers all of the questions quite confidently. At the endboth give each other a relaxed smile.
231

Appendices
Appendix 6.3Questions for candidate interviews, June 1994 trial
1. Is it OK if I record this interview?
2. TAPE TEST
a. Were the voices on the tape clear?b. Were the instructions in the booklet and the tape clear?c. Which tasks were difficult/easy?d. Was there sufficient preparation time?e. Was there sufficient response time?f. Was it distracting having the other candidates talking at the same time?g. Was this a good test of your spoken English?h. Did you feel relaxed during this test?i. How did you feel about having me and the video camera in the room?
3. LIVE TEST
a. Did you feel relaxed during this test?b. Did you find the interviewer easy to understand? Why/why not?c. Was the interviewer helpful?d. Which tasks were difficult/easy?e. Were the instructions clear/unclear?f. Was there sufficient preparation time?g. Was there sufficient response time?h. Was this a good test of your spoken English?i. How did you feel about having another person and a video camera in
the room?
4. LIVE TEST versus TAPE TEST
a. Did you feel more nervous on one test than the other? Why?b. Was it easier talking to a microphone or another person?c. Was one of the tests more difficult for you? Why?d. Which one was a better test of your spoken English?
232

Appendices
Appendix 6.4Candidate questionnaire, June 1994 trial
QUESTIONNAIRE
You did two speaking tests today. One was in the language laboratory (TAPE)and the other with an interviewer (INTERVIEW). To help us improve thespeaking tests, we would like you to answer these questions.
NAME1 Which speaking test did you do first (please circle)? TAPE LIVE2 Indicate your gender (please circle). FEMALE MALE3 How old are you? years4 How long have you been in Australia?5 What is your occupation?6 What is your native language?
Please circle ONLY ONE answer for each question.
The TAPE speaking test
1 Could you hear the tape clearly?
Always / Sometimes / Never
2 Did you understand the instructions?
Always / Sometimes / Never
3 Did you have enough time to think about the questions before you
spoke?
Always / Sometimes / Never
4 Did you have enough time to answer the questions?
Always / Sometimes / Never
5 Did you feel the test was
Too difficult / OK / Too easy
6 Do you think the tape test was a good test of your spoken English?
Yes / Not sure / No
233

Appendices
Please circle ONLY ONE answer for each question.
The INTERVIEW speaking test
1 Did you understand the instructions?
Always / Sometimes / Never
2 Did you have enough time to think about the questions before you
spoke?
Always / Sometimes / Never
3 Did you have enough time to answer the questions?
Always / Sometimes / Never
4 Was the interviewer helpful?
Always / Sometimes / Never
5 Did you feel the test was
Too difficult / OK / Too easy
6 Do you think the interview was a good test of your spoken English?
Yes / Not sure / No
BOTH TESTS
1 Which test made you more nervous?
Tape Interview
2 Which test was more difficult for you?
Interview Tape
3 Which test gave you more opportunity to speak English?
Tape Interview
4 Which one was a better test of your spoken English?
Interview Tape
Any other comments?
Thank you for answering these questions. Please take the questionnaire toRegistration and you will receive your payment.
234

Appendices
Appendix 6.5Questions for interlocutor interviews, June 1994 trial
1. What is your occupation?2. Have you done interviewing in language tests before?
Which ones?3. Did you feel relaxed during the test?4. Did you find the instructions clear?5. How closely do you think you followed them? Did you normally
allow the prescribed amount of preparation time?6. Did you find you needed to add more instructions or clarifying
statements?7. Did you think the candidate was nervous?8. Did you think the test was pitched at the right level for the candidate?9. Did you think you helped the candidate to perform at his/her
best? How did you do this?10. Do you think you contributed the right amount in the role play?11. How well did you think the candidate performed in each of the
tasks/overall?12. Were you distracted by my presence or the video camera?13. Do you think this was a good test of the candidate’s spoken
English?14. What did you think of your own performance overall?15. Do you think this test is better than other tests of speaking in
which you have been an interviewer?16. How do you think a live test such as this one compares with a
tape-based one done in a language laboratory?
235

Appendices
Appendix 6.6Raw scores allocated to Abdul and Wing Li, June 1994 trial
A LIVE
ABDUL WING LI
RATERS 7 89 12 3 72 12
Description– fluency 5 4 4 4 3 5– grammar 4 4 4 4 3 5– vocabulary 5 4 5 4 3 5
Narration– grammar 4 4 4 4 4 4– vocabulary 4 4 4 4 4 5– cohesion 3 3 4 4 5 4
Role play– fluency 4 4 5 4 4 5– grammar 4 4 4 4 4 4– intelligibility 5 4 5 4 4 5
Exposition (1)– fluency 4 5 5 4 3 5– vocabulary 4 4 5 4 3 5– cohesion 5 4 4 4 3 5
Exposition (2)– fluency 4 4 5 4 4 5– vocabulary 4 4 5 4 4 5– cohesion 4 5 4 4 4 4
Discussion– fluency 5 4 5 5 5 5– grammar 4 4 4 4 4 4– intelligibility 5 3 4 5 3 4
Global criteria– comm effectiveness 4 3 4 5 3 5– comprehension 5 5 7 6 6 7
236

Appendices
B TAPE
ABDUL WING LI
RATERS 3 46 12 7 39 12
Description (1)– fluency 3 4 5 5 5 6– grammar 3 4 4 5 5 5– vocabulary 3 4 5 5 5 6
Narration– grammar 4 4 4 4 5 4– vocabulary 3 4 4 5 5 6– cohesion 3 4 4 5 5 5
Summary– fluency 3 3 4 5 5 6– grammar 3 3 4 5 5 5– vocabulary 3 3 4 5 5 6
Role play– fluency 4 4 5 5 6 6– grammar 4 4 4 5 5 4– intelligibility 3 4 5 5 6 6
Exposition– fluency 3 4 4 4 5 5– vocabulary 3 4 4 5 5 5– cohesion 2 3 4 5 6
Instructions– fluency 4 4 5 4 5 5– vocabulary 3 4 4 5 5 5– cohesion 3 4 4 5 6 5
Discussion– fluency 3 4 5 5 5 5– grammar 3 4 4 4 5 5– intelligibility 4 4 4 5 6 6
Description (2)– fluency 4 4 5 4 6 5– grammar 4 4 4 4 6 4– vocabulary 3 3 4 5 6 6
Global criteria– comm effectiveness 3 3 4 5 6 6
237

Appendices
Appendix 6.7Questions for rater interviews, June 1994 trial
1. What is your experience as a rater of the access: oral interaction test?2. How long is it since you marked last time?3. Did the calibration session prove useful?4. How many tapes have you rated so far? Live? Tape?
The rest of the questions relate to the specific performanceassessed by the rater immediately prior to the interview.
5. Is this a live or tape test performance?6. Do you think the format
a. was pitched at the right level for the candidate?b. provided clear instructions?c. provided adequate preparation and response time?
7. Were the scoring criteria appropriate overall for this version?8. Were the descriptors for the criteria clear?9. Was it difficult to rate the candidate?
10. Did the candidate seem nervous? confident?11. How well did the candidate perform overall?12. Did s/he perform consistently?13. Do you think this was a good test of their speaking proficiency?14. (live version only) How well did the interlocutor perform?15. (live version only) Do you think it would have been easier to
rate the live version with a videotaped recording?16. In general, do you think either version provides a better test of
proficiency in spoken English?
238

Appendices
Appendix 6.8Rater questionnaire, June 1994 trial
access: oral interaction test
RATER QUESTIONNAIRE
Name ....................................................... Rater no. ............................
Please answer the following questions which focus on the comparabilityof the live and tape-based versions of the test in general. If there isinsufficient space you can write on the back of the sheet.
1. Do you think the live and tape-based versions of the test serve equally wellas tests of proficiency in spoken English? Please explain your answer.
2. Do you think the scoring criteria (fluency, grammar etc.) and theiraccompanying level descriptors are appropriate for rating both versions?
3. Is one version more difficult to rate than the other? Again, please explainyour answer.
4. Is there anything else about the comparability of the two versions you’dlike to add?
239

Appendices
Appendix 7.1FACETS analyses (1) with anchored item difficultyestimates, oral interaction sub-test, June 1994 trial (N = 94)
A Live data(i) Candidates
Obsvd Obsvd Obsvd Fair Model Infit OutfitScore Count Average Avrge Measure S.E. MnSq Std MnSq Std Num
172 40 4.3 4.0 -0.79 0.29 0.6 -1 0.6 -1 1221 40 5.5 4.8 1.56 0.26 0.8 0 0.8 0 2241 40 6.0 5.9 2.46 0.26 1.2 0 1.1 0 3146 40 3.7 3.9 -2.02 0.25 0.9 0 0.8 0 4160 37 4.3 4.1 -0.25 0.31 1.3 1 1.4 1 5178 40 4.5 4.8 0.05 0.31 1.2 0 1.2 0 7203 40 5.1 5.0 1.48 0.27 1.5 2 1.7 2 9207 40 5.2 5.4 0.04 0.26 1.6 2 1.7 2 10153 40 3.8 3.9 -2.93 0.32 1.2 0 1.2 0 12199 40 5.0 4.9 0.60 0.23 0.8 0 0.8 0 13167 40 4.2 4.2 -1.83 0.26 1.1 0 1.1 0 14150 40 3.8 3.5 -3.38 0.28 1.0 0 1.0 0 15252 40 6.3 6.4 2.49 0.26 0.7 -1 0.8 0 16177 40 4.4 4.4 -0.29 0.28 0.6 1 0.6 2 17180 40 4.5 4.3 -1.10 0.25 0.9 0 0.9 0 18200 40 5.0 4.6 -0.68 0.21 1.1 0 1.1 0 20257 40 6.4 6.3 2.83 0.30 0.9 0 0.8 0 21184 40 4.6 3.8 -1.26 0.23 0.8 -1 0.8 -1 22199 40 5.0 4.4 -0.37 0.21 0.5 -2 0.5 2 23207 40 5.2 4.8 0.24 0.24 0.7 -1 0.7 -1 24168 40 4.2 3.9 -1.03 0.24 0.4 3 0.5 2 25258 40 6.5 6.5 5.01 0.34 1.2 0 1.3 0 26168 40 4.2 4.3 -0.77 0.27 0.5 -3 0.5 -2 27175 40 4.4 3.8 -1.00 0.30 0.6 -2 0.6 -2 28229 40 5.7 5.3 2.95 0.28 0.6 -1 0.6 -1 29172 40 4.3 4.4 0.06 0.32 1.2 0 1.1 0 30178 40 4.5 4.5 -0.43 0.29 0.9 0 1.0 0 32172 40 4.3 4.4 -1.41 0.27 0.6 -2 0.6 -2 33198 40 5.0 5.5 1.07 0.27 0.6 -2 0.6 -2 35169 40 4.2 4.5 -0.45 0.28 0.7 -1 0.9 0 36225 40 5.6 5.7 1.58 0.26 0.8 -1 1.0 0 37198 40 5.0 4.7 -0.53 0.29 1.1 0 1.2 0 38166 40 4.2 4.1 -1.56 0.26 0.7 -1 0.7 -1 39175 40 4.4 4.4 -1.29 0.26 1.2 0 1.1 0 40214 40 5.3. 5.3. 2.45 0.31 0.9 0 0.9 0 41189 40 4.7 4.6 -0.87 0.25 1.0 0 1.0 0 42179 40 4.5 4.4 -0.67 0.27 1.6 2 1.6 2 43183 40 4.6 4.1 -1.28 0.23 1.0 0 1.0 0 44204 40 5.1 4.6 -0.06 0.20 1.3 1 1.4 1 45250 40 6.3 5.7 1.99 0.21 1.2 0 1.2 0 47109 40 2.7 2.3 -5.51 0.31 0.9 0 0.9 0 48242 40 6.1 5.7 1.80 0.25 1.1 0 1.2 0 50257 40 6.4 6.7 6.19 0.34 1.0 0 1.2 0 51158 40 4.0 3.7 -0.85 0.30 1.3 1 1.3 1 53171 34 5.0 4.7 0.69 0.29 1.0 0 1.0 0 55233 40 5.8 5.8 2.80 0.26 0.8 -1 0.8 -1 56230 40 5.8 5.8 4.03 0.27 0.5 -3 0.5 -3 57
240
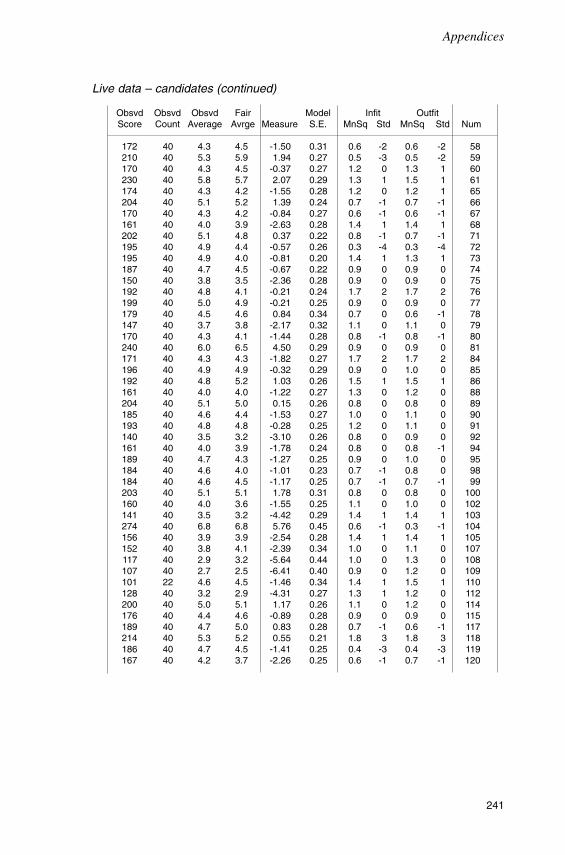
Appendices
Live data – candidates (continued)
Obsvd Obsvd Obsvd Fair Model Infit OutfitScore Count Average Avrge Measure S.E. MnSq Std MnSq Std Num
172 40 4.3 4.5 -1.50 0.31 0.6 -2 0.6 -2 58210 40 5.3 5.9 1.94 0.27 0.5 -3 0.5 -2 59170 40 4.3 4.5 -0.37 0.27 1.2 0 1.3 1 60230 40 5.8 5.7 2.07 0.29 1.3 1 1.5 1 61174 40 4.3 4.2 -1.55 0.28 1.2 0 1.2 1 65204 40 5.1 5.2 1.39 0.24 0.7 -1 0.7 -1 66170 40 4.3 4.2 -0.84 0.27 0.6 -1 0.6 -1 67161 40 4.0 3.9 -2.63 0.28 1.4 1 1.4 1 68202 40 5.1 4.8 0.37 0.22 0.8 -1 0.7 -1 71195 40 4.9 4.4 -0.57 0.26 0.3 -4 0.3 -4 72195 40 4.9 4.0 -0.81 0.20 1.4 1 1.3 1 73187 40 4.7 4.5 -0.67 0.22 0.9 0 0.9 0 74150 40 3.8 3.5 -2.36 0.28 0.9 0 0.9 0 75192 40 4.8 4.1 -0.21 0.24 1.7 2 1.7 2 76199 40 5.0 4.9 -0.21 0.25 0.9 0 0.9 0 77179 40 4.5 4.6 0.84 0.34 0.7 0 0.6 -1 78147 40 3.7 3.8 -2.17 0.32 1.1 0 1.1 0 79170 40 4.3 4.1 -1.44 0.28 0.8 -1 0.8 -1 80240 40 6.0 6.5 4.50 0.29 0.9 0 0.9 0 81171 40 4.3 4.3 -1.82 0.27 1.7 2 1.7 2 84196 40 4.9 4.9 -0.32 0.29 0.9 0 1.0 0 85192 40 4.8 5.2 1.03 0.26 1.5 1 1.5 1 86161 40 4.0 4.0 -1.22 0.27 1.3 0 1.2 0 88204 40 5.1 5.0 0.15 0.26 0.8 0 0.8 0 89185 40 4.6 4.4 -1.53 0.27 1.0 0 1.1 0 90193 40 4.8 4.8 -0.28 0.25 1.2 0 1.1 0 91140 40 3.5 3.2 -3.10 0.26 0.8 0 0.9 0 92161 40 4.0 3.9 -1.78 0.24 0.8 0 0.8 -1 94189 40 4.7 4.3 -1.27 0.25 0.9 0 1.0 0 95184 40 4.6 4.0 -1.01 0.23 0.7 -1 0.8 0 98184 40 4.6 4.5 -1.17 0.25 0.7 -1 0.7 -1 99203 40 5.1 5.1 1.78 0.31 0.8 0 0.8 0 100160 40 4.0 3.6 -1.55 0.25 1.1 0 1.0 0 102141 40 3.5 3.2 -4.42 0.29 1.4 1 1.4 1 103274 40 6.8 6.8 5.76 0.45 0.6 -1 0.3 -1 104156 40 3.9 3.9 -2.54 0.28 1.4 1 1.4 1 105152 40 3.8 4.1 -2.39 0.34 1.0 0 1.1 0 107117 40 2.9 3.2 -5.64 0.44 1.0 0 1.3 0 108107 40 2.7 2.5 -6.41 0.40 0.9 0 1.2 0 109101 22 4.6 4.5 -1.46 0.34 1.4 1 1.5 1 110128 40 3.2 2.9 -4.31 0.27 1.3 1 1.2 0 112200 40 5.0 5.1 1.17 0.26 1.1 0 1.2 0 114176 40 4.4 4.6 -0.89 0.28 0.9 0 0.9 0 115189 40 4.7 5.0 0.83 0.28 0.7 -1 0.6 -1 117214 40 5.3 5.2 0.55 0.21 1.8 3 1.8 3 118186 40 4.7 4.5 -1.41 0.25 0.4 -3 0.4 -3 119167 40 4.2 3.7 -2.26 0.25 0.6 -1 0.7 -1 120
241

Appendices
Live data – candidates (continued)
Obsvd Obsvd Obsvd Fair Model Infit OutfitScore Count Average Avrge Measure S.E. MnSq Std MnSq Std Num
186.6 39.7 4.7 4.6 -0.31 0.27 1.0 -0.4 1.0 -0.3 Mean33.5 1.9 0.8 0.9 2.19 0.04 0.3 1.5 0.3 1.5 S.D.
RMSE 0.28 Adj S.D. 2.17 Separation 7.85 Reliability 0.98Fixed (all same) chi-square: 4983.6 d.f.: 95 significance: .00Random (normal) chi-square: 94.4 d.f.: 94 significance: .47
(ii) Raters
Obsvd Obsvd Obsvd Fair Model Infit OutfitScore Count Average Avrge Measure S.E. MnSq Std MnSq Std Rater
728 180 4.0 4.2 0.52 0.14 0.9 0 0.9 0 3795 180 4.4 4.7 -0.26 0.12 0.7 -3 0.7 -3 7932 180 5.2 5.4 0.16 0.11 1.2 1 1.1 1 12366 80 4.6 4.7 -0.48 0.20 0.9 0 0.9 0 28786 160 4.9 5.0 -0.27 0.13 0.9 0 0.9 0 32855 180 4.8 5.2 -1.04 0.10 0.9 0 0.9 0 36816 160 5.1 4.8 -0.06 0.11 1.0 0 1.0 0 37818 180 4.5 5.0 -1.76 0.12 0.8 -2 0.8 -2 38935 180 5.2 5.3 -1.15 0.11 0.8 -2 0.7 -1 39940 180 5.2 5.0 0.04 0.12 1.0 0 1.1 0 43702 180 3.9 3.8 1.85 0.16 0.8 -1 0.8 -1 45398 100 4.0 3.9 0.73 0.20 1.1 0 1.1 0 46810 191 4.2 4.3 -1.95 0.13 1.0 0 1.0 0 48
1062 191 5.6 5.0 -0.08 0.13 0.9 0 1.0 0 50880 180 4.9 4.7 0.15 0.12 0.9 0 0.9 0 52885 200 4.4 4.3 0.57 0.15 1.3 2 1.3 2 56987 200 4.9 5.0 1.21 0.12 0.7 -3 0.7 -3 67838 200 4.2 4.1 2.89 0.15 1.0 0 1.1 0 70803 180 4.5 4.5 -0.24 0.11 0.9 0 0.9 0 72877 171 5.1 5.2 0.05 0.13 1.4 2 1.5 3 82798 180 4.4 4.9 -1.39 0.15 1.2 1 1.2 1 83906 180 5.0 4.7 0.51 0.11 1.0 0 0.9 0 89
Obsvd Obsvd Obsvd Fair Model Infit OutfitScore Count Average Avrge Measure S.E. MnSq Std MnSq Std Num
814.4 173.3 4.7 4.7 -0.00 0.13 1.0 -0.4 1.0 -0.3 Mean158.9 28.4 0.5 0.4 1.09 0.03 0.2 1.6 0.2 1.6 S.D.
RMSE 0.14 Adj S.D. 1.09 Separation 8.04 Reliability 0.98Fixed (all same) chi-square: 1433.2 d.f.: 21 significance: .00Random (normal) chi-square: 21.0 d.f.: 20 significance: .40
242

Appendices
(iii) Items
Obsvd Obsvd Obsvd Fair Model Infit OutfitScore Count Average Avrge Measure S.E. MnSq Std MnSq Std Nu Item
890 191 4.7 4.7 A 0.07 0.12 1.0 0 1.0 0 1 DesF841 191 4.4 4.5 A 0.47 0.12 0.7 -3 0.7 -3 2 DesG837 191 4.4 4.4 A 0.71 0.12 1.0 0 1.0 0 3 DesV835 192 4.3 4.4 A 0.65 0.12 0.6 -3 0.7 -3 4 NarG853 192 4.4 4.5 A 0.43 0.12 0.9 0 0.9 -1 5 NarV869 192 4.5 4.6 A 0.24 0.12 1.3 2 1.4 3 6 NarC898 189 4.8 4.8 -0.35 0.12 1.0 0 1.0 0 7 RPF833 189 4.4 4.4 0.61 0.12 0.7 -3 0.6 -3 8 RPG933 189 4.9 5.0 -0.86 0.12 1.5 3 1.6 3 9 RPI900 190 4.7 4.8 A -0.21 0.12 0.8 -1 0.9 -1 10 Exp1F874 190 4.6 4.7 A 0.07 0.12 0.9 -1 0.9 0 11 Exp1V896 190 4.7 5.1 A -0.93 0.12 1.2 1 1.3 2 12 Exp1C920 189 4.9 5.0 -0.68 0.12 0.7 -2 0.8 -1 13 Exp2F886 189 4.7 4.8 -0.18 0.12 0.7 -2 0.7 -2 14 Exp2V901 189 4.8 4.8 -0.40 0.12 1.0 0 1.0 0 15 Exp2C952 192 5.0 5.0 A -0.78 0.12 0.8 -1 0.8 -1 16 DisF893 192 4.7 4.7 A -0.06 0.12 0.7 -3 0.7 -3 17 DisG940 192 4.9 4.9 A -0.63 0.12 1.6 4 1.5 3 18 DisI897 192 4.7 4.7 A -0.11 0.12 0.5 -5 0.6 -4 19 CommEf
1069 192 5.6 5.6 A -2.27 0.12 1.4 3 1.3 1 20 Comp
Obsvd Obsvd Obsvd Fair Model Infit OutfitScore Count Average Avrge Measure S.E. MnSq Std MnSq Std Nu Item
895.9 190.6 4.7 4.8 -0.21 0.12 1.0 -0.7 1.0 -0.6 Mean52.2 1.3 0.3 0.3 0.69 0.00 0.3 2.7 0.3 2.5 S.D.
RMSE 0.12 Adj S.D. 0.68 Separation 5.60 Reliability 0.97Fixed (all same) chi-square: 634.5 d.f.: 19 significance: .00Random (normal) chi-square: 19.0 d.f.: 18 significance: .39
243

Appendices
B Tape data(i) Candidates
Obsvd Obsvd Obsvd Fair Model Infit OutfitScore Count Average Avrge Measure S.E. MnSq Std MnSq Std Cand
206 50 4.1 4.3 -0.63 0.23 0.8 0 1.2 0 1273 50 5.5 5.5 2.40 0.29 0.9 0 1.0 0 2261 50 5.2 5.4 1.58 0.20 1.4 1 1.6 2 3222 50 4.4 4.7 0.28 0.22 1.4 1 1.4 1 4205 50 4.1 4.2 -0.58 0.25 1.4 1 1.3 1 5218 50 4.4 4.6 -0.06 0.19 0.4 -3 0.5 -3 7258 50 5.2 5.5 1.26 0.22 0.8 0 0.9 0 9186 50 3.7 4.3 -0.28 0.20 0.7 -1 0.7 -1 10200 49 4.1 3.8 -1.46 0.26 1.5 1 1.5 1 12261 50 5.2 5.9 2.32 0.22 0.7 -1 0.7 -1 13208 50 4.2 4.0 -0.93 0.24 1.5 1 1.6 1 14185 50 3.7 3.8 -1.17 0.26 1.0 0 1.1 0 15301 50 6.0 6.4 5.70 0.24 1.5 2 1.3 1 16245 50 4.9 5.0 1.53 0.23 0.8 -1 0.7 -1 17197 50 3.9 3.9 -1.18 0.23 1.3 1 1.4 1 18241 50 4.8 4.6 0.60 0.24 0.8 -1 0.8 -1 20323 50 6.5 6.5 5.82 0.31 0.9 0 1.0 0 21227 50 4.5 4.5 -0.16 0.18 0.5 -2 0.5 -2 22227 50 4.5 3.9 -0.77 0.17 1.3 1 1.2 1 23293 50 5.9 6.4 3.05 0.22 0.8 0 0.8 0 24238 50 4.8 4.5 0.61 0.22 0.6 -2 0.6 -2 25267 50 5.3 5.8 4.35 0.24 1.2 0 1.2 0 26205 50 4.1 4.1 -0.32 0.26 0.6 -2 0.6 -2 27210 50 4.2 4.3 -0.66 0.23 1.0 0 1.0 0 28239 50 4.8 5.4 1.36 0.21 1.2 0 1.2 1 29221 50 4.4 4.3 0.53 0.25 0.9 0 0.9 0 30230 50 4.6 4.7 0.14 0.21 0.8 -1 0.7 -1 32208 50 4.2 4.2 -0.56 0.22 1.3 1 1.4 1 33244 50 4.9 5.1 0.26 0.18 0.7 -1 0.7 -1 35181 50 3.6 3.1 -1.35 0.18 0.9 0 0.9 0 36254 50 5.1 5.3 1.14 0.23 0.8 -1 0.8 -1 37220 50 4.4 4.6 0.51 0.23 1.3 1 1.3 1 38175 50 3.5 3.6 -2.64 0.27 0.8 -1 0.8 -1 39217 50 4.3 4.3 0.51 0.27 1.0 0 1.0 0 40286 50 5.7 5.8 2.82 0.23 1.0 0 1.1 0 41250 50 5.0 4.9 1.34 0.22 0.8 0 0.9 0 42200 50 4.0 4.2 -0.34 0.21 0.9 0 1.0 0 43205 50 4.1 4.1 -1.40 0.24 0.9 0 0.9 0 44248 50 5.0 5.2 1.24 0.23 1.4 1 1.5 1 45334 50 6.7 6.8 6.11 0.31 0.8 -1 0.8 -1 47203 50 4.1 2.9 -1.46 0.19 1.2 0 1.2 0 48249 50 5.0 5.7 1.75 0.22 0.8 -1 0.8 -1 50314 50 6.3 6.3 7.21 0.35 1.1 0 1.1 0 51194 50 3.9 4.2 -0.38 0.26 0.9 0 0.8 -1 53210 50 4.2 4.3 -0.23 0.22 1.3 1 1.4 1 55271 50 5.4 5.5 3.24 0.24 0.4 -4 0.4 -3 56321 50 6.4 6.7 6.71 0.28 1.1 0 1.1 0 57103 37 2.8 3.0 -3.84 0.19 1.7 3 2.2 3 58253 50 5.1 5.1 0.86 0.18 0.8 -1 0.8 -1 59218 50 4.4 3.5 -0.95 0.18 1.9 3 2.0 3 60
244

Appendices
Tape data – candidates (continued)
Obsvd Obsvd Obsvd Fair Model Infit OutfitScore Count Average Avrge Measure S.E. MnSq Std MnSq Std Cand
304 50 6.1 6.5 3.43 0.26 1.2 0 1.4 1 61200 50 4.0 3.9 -0.87 0.26 1.0 0 0.9 0 65247 50 4.9 5.2 2.36 0.24 0.9 0 0.9 0 66231 50 4.6 4.4 -0.18 0.26 1.0 0 1.0 0 68260 50 5.2 5.4 2.38 0.26 0.4 -3 0.4 -3 71168 50 3.4 3.7 -2.07 0.25 0.8 0 0.8 0 72218 50 4.4 4.2 0.24 0.25 0.9 0 0.9 0 73195 50 3.9 4.1 -0.76 0.22 1.5 2 1.3 1 74185 50 3.7 2.9 -1.76 0.19 0.8 0 0.8 0 7514 3 4.7 5.3 -0.28 1.01 0.9 0 0.8 0 76
223 50 4.5 4.5 0.25 0.21 0.9 0 0.9 0 77212 50 4.2 4.5 1.44 0.27 0.7 -1 0.8 -1 78195 50 3.9 3.8 -1.92 0.24 0.6 -1 0.5 -1 79224 50 4.5 4.4 0.05 0.26 0.8 0 0.9 0 80308 50 6.2 6.5 4.67 0.27 0.8 0 0.8 0 81234 50 4.7 5.1 0.10 0.20 1.4 1 1.2 1 84222 50 4.4 4.4 -0.40 0.21 1.2 0 1.2 0 85198 50 4.0 4.4 -1.18 0.21 0.8 -1 1.0 0 86253 50 5.1 5.3 1.84 0.22 0.5 -2 0.7 -1 88260 50 5.2 4.9 1.34 0.23 0.8 0 0.8 0 89201 50 4.0 4.1 -0.84 0.26 0.7 -1 0.7 -1 90102 23 4.4 4.4 -0.28 0.28 0.7 0 0.8 0 91191 50 3.8 3.9 -1.31 0.22 0.9 0 0.9 0 92154 44 3.5 4.0 -1.90 0.22 1.1 0 1.1 0 94204 50 4.1 4.7 0.07 0.18 0.4 -3 0.4 -4 95163 50 3.3 3.1 -2.08 0.21 1.7 2 1.6 2 98197 50 3.9 4.2 -1.03 0.27 1.0 0 0.9 0 99190 50 3.8 4.0 -0.60 0.28 1.4 1 1.4 1 100144 44 3.3 3.4 -2.44 0.24 1.4 1 1.4 1 102206 50 4.1 3.4 -0.97 0.19 1.2 1 1.2 1 103298 50 6.0 6.2 4.53 0.25 1.4 1 1.4 1 104211 50 4.2 4.2 -1.04 0.27 0.7 -1 0.7 -1 105163 50 3.3 3.5 -2.70 0.22 0.5 -2 0.5 -2 107135 50 2.7 2.6 -3.83 0.21 0.9 0 1.0 0 108143 50 2.9 2.2 -3.94 0.20 1.0 0 1.0 0 109241 50 4.8 5.7 0.95 0.23 0.7 -1 0.7 -1 110143 41 3.5 3.2 -3.26 0.23 1.2 0 1.3 0 112243 50 4.9 5.1 1.64 0.23 1.1 0 1.1 0 114222 50 4.4 4.4 -0.30 0.21 0.6 -2 0.6 -2 115201 50 4.0 4.2 -1.75 0.20 1.2 1 1.4 1 117236 50 4.7 4.9 0.80 0.19 0.4 -3 0.5 -3 118172 50 3.4 3.1 -2.09 0.19 0.6 -2 0.6 -2 119213 50 4.3 4.5 -0.16 0.20 0.7 -1 0.6 -2 120
Obsvd Obsvd Obsvd Fair Model Infit OutfitScore Count Average Avrge Measure S.E. MnSq Std MnSq Std Num
219.5 48.9 4.5 4.6 0.31 0.24 1.0 -0.3 1.0 -0.3 Mean49.4 5.7 0.8 1.0 2.22 0.09 0.3 1.6 0.3 1.6 S.D.
RMSE 0.25 Adj S.D. 2.21 Separation 8.72 Reliability 0.99Fixed (all same) chi-square: 7823.0 d.f.: 96 significance: .00Random (normal) chi-square: 95.9 d.f.: 95 significance: .45
245

Appendices
(ii) Raters
Obsvd Obsvd Obsvd Fair Model Infit OutfitScore Count Average Avrge Measure S.E. MnSq Std MnSq Std Rater
1033 250 4.1 4.0 1.12 0.12 1.2 2 1.2 1 31094 250 4.4 4.5 -0.77 0.11 0.8 -1 0.9 -1 71219 250 4.9 5.0 -0.82 0.10 1.3 3 1.3 3 12646 125 5.2 4.2 2.14 0.15 1.2 1 1.2 1 28
1091 231 4.7 4.8 -1.79 0.12 1.0 0 1.1 0 32994 213 4.7 4.6 -0.00 0.09 0.9 0 1.0 0 36
1104 250 4.4 4.9 -0.18 0.08 0.9 -1 0.9 0 371237 247 5.0 5.1 0.74 0.10 0.8 -2 0.9 -1 381102 250 4.4 4.1 0.96 0.08 0.6 -5 0.6 -5 391083 250 4.3 4.6 -1.27 0.10 1.2 1 1.2 1 431056 250 4.2 4.0 1.24 0.11 0.8 -2 0.8 -2 45349 85 4.1 4.6 -0.60 0.18 1.2 1 1.2 1 46824 200 4.1 4.0 0.10 0.13 1.0 0 1.0 0 48816 194 4.2 4.1 0.60 0.12 1.0 0 1.0 0 50895 200 4.5 4.3 0.39 0.10 0.8 -2 0.8 -2 52926 225 4.1 3.9 0.37 0.11 0.7 -3 0.7 -3 56
1019 224 4.5 4.7 0.06 0.14 0.9 0 0.9 0 67891 225 4.0 4.1 0.14 0.11 1.2 1 1.1 1 70933 197 4.7 4.7 -0.31 0.11 1.1 0 1.1 0 72832 200 4.2 5.3 -2.93 0.09 1.2 1 1.2 1 82
1135 203 5.6 4.9 1.56 0.11 0.9 -1 0.9 0 831016 222 4.6 4.6 -0.74 0.11 1.0 0 1.0 0 89
Obsvd Obsvd Obsvd Fair Model Infit OutfitScore Count Average Avrge Measure S.E. MnSq Std MnSq Std Num
968.0 215.5 4.5 4.5 0.00 0.11 1.0 -0.4 1.0 -0.3 Mean193.6 40.9 0.4 0.4 1.12 0.02 0.2 2.1 0.2 1.9 S.D.
RMSE 0.11 Adj S.D. 1.12 Separation 9.73 Reliability 0.99Fixed (all same) chi-square: 2556.4 d.f.: 21 significance: .00Random (normal) chi-square: 21.0 d.f.: 20 significance: .40
246

Appendices
(iii) Items
Obsvd Obsvd Obsvd Fair Model Infit OutfitScore Count Average Avrge Measure S.E. MnSq Std MnSq Std Nu Item
876 191 4.6 4.5 A 0.03 0.11 1.0 0 1.1 0 21 TDes1F840 191 4.4 4.3 A 0.47 0.11 0.8 -1 0.8 -1 22 TDes1G851 191 4.5 4.3 A 0.34 0.11 1.2 1 1.2 1 23 TDes1V807 190 4.2 4.1 A 0.79 0.11 0.8 -2 0.8 -1 24 TNarG836 190 4.4 4.3 A 0.44 0.11 0.8 -1 0.9 -1 25 TNarV855 190 4.5 4.4 A 0.22 0.11 1.2 1 1.2 1 26 TNarC849 188 4.5 4.3 A 0.41 0.11 1.0 0 1.0 0 27 TSumF781 188 4.2 4.1 A 0.96 0.12 0.7 -3 0.7 -3 28 TSumG780 188 4.1 4.0 A 1.24 0.12 0.9 0 0.9 -1 29 TSumV854 187 4.6 4.4 A 0.09 0.12 1.3 2 1.3 2 30 TRPF795 187 4.3 4.1 A 0.81 0.12 0.8 -2 0.8 -1 31 TRPG909 187 4.9 4.7 A -0.58 0.12 1.5 3 1.6 4 32 TRPI858 188 4.6 4.4 A 0.08 0.11 0.9 0 1.0 0 33 TExpF831 188 4.4 4.3 A 0.40 0.11 0.9 0 0.9 -1 34 TExpV845 188 4.5 4.4 A 0.24 0.11 1.4 3 1.4 3 35 TExp900 191 4.7 4.6 -0.29 0.11 1.1 0 1.1 0 36 TInsF854 191 4.5 4.3 0.30 0.11 1.0 0 1.0 0 37 TInsV854 191 4.5 4.3 0.30 0.11 1.2 1 1.3 2 38 TInsC881 191 4.6 4.5 A -0.06 0.11 0.9 0 0.9 0 39 TDisF846 191 4.4 4.3 A 0.35 0.11 0.5 -5 0.6 -4 40 TDisG941 191 4.9 4.8 A -0.78 0.11 1.3 2 1.3 2 41 TDisI888 191 4.6 4.5 -0.13 0.11 0.8 -2 0.8 -1 42 TDes2F841 190 4.4 4.3 0.42 0.11 0.6 -4 0.6 -4 43 TDes2G863 191 4.5 4.4 0.19 0.11 0.9 -1 0.9 0 44 TDes2V860 191 4.5 4.4 0.23 0.11 0.5 -5 0.6 -4 45 TComm
Obsvd Obsvd Obsvd Fair Model Infit OutfitScore Count Average Avrge Measure S.E. MnSq Std MnSq Std Nu Item|
851.8 189.6 4.5 4.4 0.26 0.11 1.0 -0.6 1.0 -0.4 Mean36.3 1.5 0.2 0.2 0.43 0.00 0.3 2.5 0.3 2.4 S.D.
RMSE 0.11 Adj S.D. 0.42 Separation 3.64 Reliability 0.93Fixed (all same) chi-square: 352.3 d.f.: 24 significance: .00Random (normal) chi-square: 24.0 d.f.: 23 significance: .41
247

Appendices
C Combined data(i) Candidates
Obsvd Obsvd Obsvd Fair Model Infit OutfitScore Count Average Avrge Measure S.E. MnSq Std MnSq Std Cand
271 64 4.2 4.3 -0.38 0.19 0.7 -1 0.8 -1 1352 64 5.5 5.5 2.07 0.20 0.6 -2 0.6 -2 2356 64 5.6 5.4 1.60 0.17 1.1 0 1.2 0 3262 64 4.1 4.3 -0.73 0.19 1.6 2 1.5 2 4266 64 4.2 4.2 -0.37 0.21 1.1 0 1.1 0 5286 64 4.5 4.8 0.11 0.18 0.7 -2 0.7 -1 7328 64 5.1 5.2 1.52 0.19 0.8 -1 0.9 0 9273 64 4.3 4.1 -0.48 0.16 1.0 0 1.0 0 10256 64 4.0 4.0 -1.72 0.21 1.2 0 1.3 1 12322 64 5.0 5.1 1.39 0.18 1.0 0 1.1 0 13264 64 4.1 3.9 -0.81 0.20 1.1 0 1.1 0 14237 64 3.7 3.8 -2.05 0.21 1.2 1 1.2 1 15388 64 6.1 6.0 3.81 0.20 1.2 1 1.1 0 16295 64 4.6 4.9 0.70 0.20 0.5 -3 0.5 -3 17264 64 4.1 4.1 -1.13 0.20 1.1 0 1.2 1 18307 64 4.8 4.6 0.01 0.18 0.7 -1 0.7 -1 20410 64 6.4 6.7 5.03 0.27 1.2 0 1.4 1 21291 64 4.5 4.6 -0.05 0.17 0.7 -1 0.7 -1 22298 64 4.7 4.5 -0.18 0.16 1.5 2 1.7 3 23356 64 5.6 5.5 1.55 0.17 1.2 0 1.4 1 24288 64 4.5 4.5 0.03 0.18 0.6 -2 0.7 -1 25370 64 5.8 6.0 3.65 0.20 1.0 0 1.0 0 26267 64 4.2 4.2 -0.50 0.20 0.5 -3 0.5 -3 27269 64 4.2 4.0 -0.90 0.19 0.7 -2 0.7 -2 28331 64 5.2 5.3 1.78 0.19 1.6 2 1.6 2 29277 64 4.3 4.5 -0.05 0.20 0.8 -1 0.8 -1 30289 64 4.5 4.5 0.06 0.18 0.7 -1 0.7 -1 32275 64 4.3 4.5 -0.41 0.20 1.0 0 1.0 0 33314 64 4.9 5.0 0.91 0.18 0.6 -2 0.6 -2 35251 64 3.9 3.9 -0.96 0.17 0.9 0 0.9 0 36335 64 5.2 4.9 0.99 0.19 0.7 -1 0.8 0 37292 64 4.6 4.4 -0.01 0.20 1.3 1 1.4 1 38241 64 3.8 3.8 -1.46 0.21 0.9 0 1.0 0 39279 64 4.4 4.3 -0.08 0.21 1.1 0 1.0 0 40360 64 5.6 5.5 2.64 0.20 0.8 -1 0.7 -1 41316 64 4.9 5.0 0.72 0.19 0.9 0 1.0 0 42272 64 4.3 4.4 -0.24 0.19 1.0 0 1.2 1 43275 64 4.3 4.3 -0.94 0.19 1.1 0 1.0 0 44320 64 5.0 5.3 0.93 0.18 1.6 2 1.7 3 45410 64 6.4 6.5 3.54 0.21 1.3 1 1.3 1 47222 64 3.5 3.1 -2.14 0.16 1.5 2 1.4 1 48345 64 5.4 5.5 1.79 0.18 1.0 0 1.0 0 50406 64 6.3 6.3 5.44 0.28 1.0 0 1.0 0 51251 64 3.9 3.9 -0.72 0.20 1.0 0 0.9 0 53280 61 4.6 4.7 0.32 0.19 1.2 1 1.4 1 55356 64 5.6 5.5 2.55 0.20 0.5 -3 0.5 -3 56388 64 6.1 6.2 4.07 0.21 0.7 -1 0.7 -1 57210 52 4.0 4.2 -1.26 0.24 0.8 0 0.8 -1 58322 64 5.0 5.2 1.19 0.17 0.9 0 0.9 0 59263 64 4.1 4.1 -1.02 0.19 1.7 3 1.7 3 60378 64 5.9 5.8 2.50 0.20 1.0 0 1.0 0 61264 64 4.1 4.0 -1.07 0.20 0.9 0 0.9 0 65310 64 4.8 5.0 1.65 0.20 0.6 -2 0.6 -2 66283 64 4.4 4.4 0.10 0.20 0.9 0 0.9 0 67
248
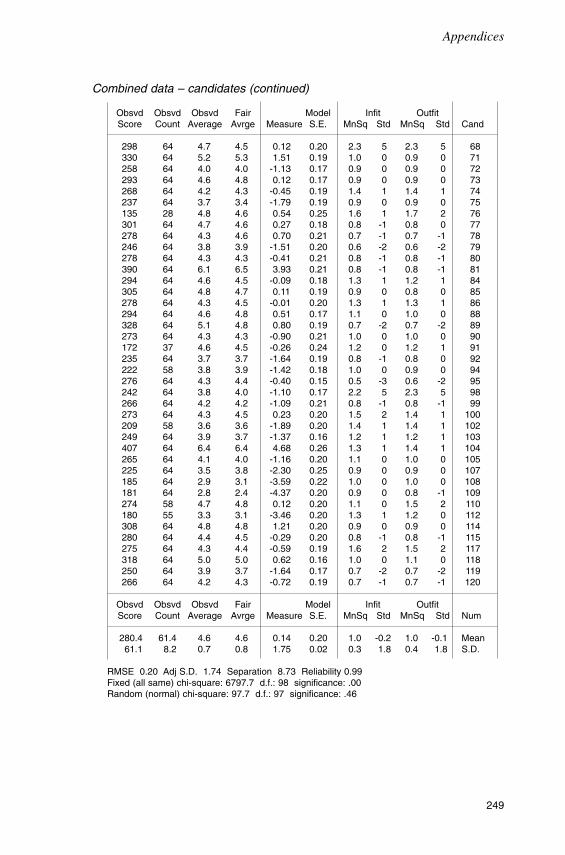
Appendices
Combined data – candidates (continued)
Obsvd Obsvd Obsvd Fair Model Infit OutfitScore Count Average Avrge Measure S.E. MnSq Std MnSq Std Cand
298 64 4.7 4.5 0.12 0.20 2.3 5 2.3 5 68330 64 5.2 5.3 1.51 0.19 1.0 0 0.9 0 71258 64 4.0 4.0 -1.13 0.17 0.9 0 0.9 0 72293 64 4.6 4.8 0.12 0.17 0.9 0 0.9 0 73268 64 4.2 4.3 -0.45 0.19 1.4 1 1.4 1 74237 64 3.7 3.4 -1.79 0.19 0.9 0 0.9 0 75135 28 4.8 4.6 0.54 0.25 1.6 1 1.7 2 76301 64 4.7 4.6 0.27 0.18 0.8 -1 0.8 0 77278 64 4.3 4.6 0.70 0.21 0.7 -1 0.7 -1 78246 64 3.8 3.9 -1.51 0.20 0.6 -2 0.6 -2 79278 64 4.3 4.3 -0.41 0.21 0.8 -1 0.8 -1 80390 64 6.1 6.5 3.93 0.21 0.8 -1 0.8 -1 81294 64 4.6 4.5 -0.09 0.18 1.3 1 1.2 1 84305 64 4.8 4.7 0.11 0.19 0.9 0 0.8 0 85278 64 4.3 4.5 -0.01 0.20 1.3 1 1.3 1 86294 64 4.6 4.8 0.51 0.17 1.1 0 1.0 0 88328 64 5.1 4.8 0.80 0.19 0.7 -2 0.7 -2 89273 64 4.3 4.3 -0.90 0.21 1.0 0 1.0 0 90172 37 4.6 4.5 -0.26 0.24 1.2 0 1.2 1 91235 64 3.7 3.7 -1.64 0.19 0.8 -1 0.8 0 92222 58 3.8 3.9 -1.42 0.18 1.0 0 0.9 0 94276 64 4.3 4.4 -0.40 0.15 0.5 -3 0.6 -2 95242 64 3.8 4.0 -1.10 0.17 2.2 5 2.3 5 98266 64 4.2 4.2 -1.09 0.21 0.8 -1 0.8 -1 99273 64 4.3 4.5 0.23 0.20 1.5 2 1.4 1 100209 58 3.6 3.6 -1.89 0.20 1.4 1 1.4 1 102249 64 3.9 3.7 -1.37 0.16 1.2 1 1.2 1 103407 64 6.4 6.4 4.68 0.26 1.3 1 1.4 1 104265 64 4.1 4.0 -1.16 0.20 1.1 0 1.0 0 105225 64 3.5 3.8 -2.30 0.25 0.9 0 0.9 0 107185 64 2.9 3.1 -3.59 0.22 1.0 0 1.0 0 108181 64 2.8 2.4 -4.37 0.20 0.9 0 0.8 -1 109274 58 4.7 4.8 0.12 0.20 1.1 0 1.5 2 110180 55 3.3 3.1 -3.46 0.20 1.3 1 1.2 0 112308 64 4.8 4.8 1.21 0.20 0.9 0 0.9 0 114280 64 4.4 4.5 -0.29 0.20 0.8 -1 0.8 -1 115275 64 4.3 4.4 -0.59 0.19 1.6 2 1.5 2 117318 64 5.0 5.0 0.62 0.16 1.0 0 1.1 0 118250 64 3.9 3.7 -1.64 0.17 0.7 -2 0.7 -2 119266 64 4.2 4.3 -0.72 0.19 0.7 -1 0.7 -1 120
Obsvd Obsvd Obsvd Fair Model Infit OutfitScore Count Average Avrge Measure S.E. MnSq Std MnSq Std Num
280.4 61.4 4.6 4.6 0.14 0.20 1.0 -0.2 1.0 -0.1 Mean61.1 8.2 0.7 0.8 1.75 0.02 0.3 1.8 0.4 1.8 S.D.
RMSE 0.20 Adj S.D. 1.74 Separation 8.73 Reliability 0.99Fixed (all same) chi-square: 6797.7 d.f.: 98 significance: .00Random (normal) chi-square: 97.7 d.f.: 97 significance: .46
249

Appendices
(ii) Raters
Obsvd Obsvd Obsvd Fair Model Infit OutfitScore Count Average Avrge Measure S.E. MnSq Std MnSq Std Rater
1243 306 4.1 4.0 0.65 0.10 1.0 0 1.0 0 31347 306 4.4 4.6 0.31 0.09 1.0 0 1.0 0 71521 306 5.0 4.9 -1.30 0.09 1.1 1 1.1 1 12720 146 4.9 4.4 1.27 0.13 1.4 2 1.4 2 28
1325 280 4.7 4.9 0.25 0.10 1.0 0 1.0 0 321280 276 4.6 4.7 -0.03 0.08 1.0 0 1.0 0 361363 292 4.7 4.7 0.35 0.09 1.2 2 1.2 1 371469 303 4.8 4.8 -0.36 0.08 0.9 0 0.9 0 381439 306 4.7 4.6 0.12 0.07 0.7 -4 0.7 -4 391429 306 4.7 4.8 -0.49 0.08 1.1 1 1.2 1 431244 306 4.1 3.9 1.00 0.10 0.9 -1 0.9 0 45513 127 4.0 4.2 0.10 0.14 1.1 0 1.1 0 46
1173 281 4.2 4.3 -1.10 0.11 1.1 1 1.1 0 481339 275 4.9 4.5 0.04 0.09 0.7 -3 0.7 -3 501258 270 4.7 4.5 0.43 0.09 0.7 -3 0.7 -3 521290 302 4.3 4.1 0.14 0.10 0.9 -1 0.9 -1 561430 302 4.7 4.8 -0.83 0.10 0.8 -2 0.8 -2 671225 296 4.1 4.1 2.35 0.11 1.0 0 1.0 0 701218 267 4.6 4.3 -0.06 0.09 1.2 2 1.2 2 721222 267 4.6 5.1 -1.61 0.09 1.6 5 1.7 6 821362 270 5.0 4.9 -0.18 0.10 1.1 0 1.2 1 831351 285 4.7 4.6 -1.03 0.09 1.1 0 1.1 0 89
Obsvd Obsvd Obsvd Fair Model Infit OutfitScore Count Average Avrge Measure S.E. MnSq Std MnSq Std Rater
1261.9 276.1 4.6 4.5 -0.00 0.10 1.0 0.1 1.0 0.2 Mean224.8 46.5 0.3 0.3 0.87 0.02 0.2 2.3 0.2 2.3 S.D.
RMSE 0.10 Adj S.D. 0.87 Separation 8.99 Reliability 0.99Fixed (all same) chi-square: 1683.1 d.f.: 21 significance: .00Random (normal) chi-square: 21.0 d.f.: 20 significance: .40
250

Appendices
(iii) Items
Obsvd Obsvd Obsvd Fair Model Infit OutfitScore Count Average Avrge Measure S.E. MnSq Std MnSq Std Nu Item
890 191 4.7 4.5 A 0.07 0.11 1.1 0 1.1 0 1 DesF841 191 4.4 4.3 A 0.47 0.11 0.7 -2 0.7 -2 2 DesG837 191 4.4 4.2 A 0.71 0.11 1.0 0 1.0 0 3 DesV835 192 4.3 4.2 0.65 0.11 0.6 -3 0.7 -3 4 NarG853 192 4.4 4.3 0.43 0.11 0.9 0 0.9 0 5 NarV869 192 4.5 4.4 0.24 0.11 1.2 2 1.3 2 6 NarC898 189 4.8 4.6 -0.27 0.11 1.0 0 1.1 0 7 RPF833 189 4.4 4.3 0.50 0.11 0.7 -2 0.7 -2 8 RPG933 189 4.9 4.8 -0.71 0.11 1.5 3 1.5 3 9 RPI900 190 4.7 4.6 A -0.21 0.11 1.0 0 1.0 0 10 Exp1F874 190 4.6 4.5 A 0.07 0.11 0.9 0 1.0 0 11 Exp1V896 190 4.7 4.9 A -0.93 0.11 1.3 2 1.4 2 12 Exp1C952 192 5.0 4.9 -0.78 0.11 1.0 0 1.0 0 16 DisF893 192 4.7 4.5 0.06 0.11 0.7 -3 0.7 -3 17 DisG940 192 4.9 4.8 -0.63 0.11 1.6 4 1.6 4 18 DisI897 192 4.7 4.6 -0.11 0.11 0.6 -4 0.7 -3 19 CommEff
1069 192 5.6 5.6 -2.27 0.12 1.5 4 1.5 3 20 Comp872 190 4.6 4.5 0.03 0.11 1.1 0 1.1 0 21 TDes1F835 190 4.4 4.3 0.47 0.11 0.8 -2 0.8 -2 22 TDes1G846 190 4.5 4.4 0.34 0.11 1.1 0 1.1 1 23 TDes1V807 190 4.2 4.2 0.79 0.11 0.8 -1 0.8 -1 25 TNarV855 190 4.5 4.4 0.22 0.11 1.1 0 1.1 1 26 TNarC849 188 4.5 4.3 A 0.41 0.11 1.1 0 1.1 0 27 TSumF781 188 4.2 4.1 A 0.96 0.11 0.7 -2 0.7 -3 28 TSumG780 188 4.1 4.0 A 1.24 0.11 1.0 0 1.0 0 29 TSumV854 187 4.6 4.5 0.09 0.11 1.3 2 1.3 2 30 TRPF795 187 4.3 4.2 0.81 0.11 0.8 -2 0.8 -1 31 TRPG909 187 4.9 4.8 -0.58 0.11 1.4 3 1.4 3 32 TRPI857 187 4.6 4.5 0.08 0.11 0.9 0 1.0 0 33 TExpF830 187 4.4 4.3 0.40 0.11 0.9 0 0.9 0 34 TExpV844 187 4.5 4.4 0.24 0.11 1.4 3 1.4 3 35 TExpC880 190 4.6 4.6 -0.06 0.11 1.0 0 1.1 1 39 TDisF845 190 4.4 4.4 0.35 0.11 0.6 -4 0.6 -3 40 TDisG940 190 4.9 4.9 -0.78 0.11 1.3 2 1.3 2 41 TDisI860 191 4.5 4.4 0.18 0.11 0.6 -4 0.6 -3 45 TComm
Obsvd Obsvd Obsvd Fair Model Infit OutfitScore Count Average Avrge Measure S.E. MnSq Std MnSq Std Nu Item
867.5 189.8 4.6 4.5 0.10 0.11 1.0 -0.1 1.0 0.0 Mean55.0 1.8 0.3 0.3 0.66 0.00 0.3 2.4 0.3 2.3 S.D.
RMSE 0.11 Adj S.D. 0.65 Separation 5.91 Reliability 0.97Fixed (all same) chi-square: 1100.2 d.f.: 31 significance: .00Random (normal) chi-square: 31.0 d.f.: 30 significance: .42
251
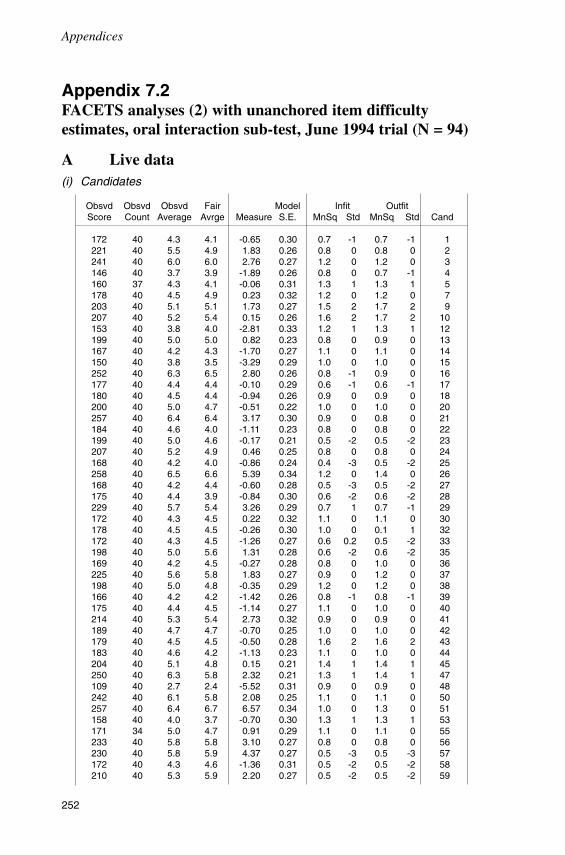
Appendices
Appendix 7.2FACETS analyses (2) with unanchored item difficultyestimates, oral interaction sub-test, June 1994 trial (N = 94)
A Live data(i) Candidates
Obsvd Obsvd Obsvd Fair Model Infit OutfitScore Count Average Avrge Measure S.E. MnSq Std MnSq Std Cand
172 40 4.3 4.1 -0.65 0.30 0.7 -1 0.7 -1 1221 40 5.5 4.9 1.83 0.26 0.8 0 0.8 0 2241 40 6.0 6.0 2.76 0.27 1.2 0 1.2 0 3146 40 3.7 3.9 -1.89 0.26 0.8 0 0.7 -1 4160 37 4.3 4.1 -0.06 0.31 1.3 1 1.3 1 5178 40 4.5 4.9 0.23 0.32 1.2 0 1.2 0 7203 40 5.1 5.1 1.73 0.27 1.5 2 1.7 2 9207 40 5.2 5.4 0.15 0.26 1.6 2 1.7 2 10153 40 3.8 4.0 -2.81 0.33 1.2 1 1.3 1 12199 40 5.0 5.0 0.82 0.23 0.8 0 0.9 0 13167 40 4.2 4.3 -1.70 0.27 1.1 0 1.1 0 14150 40 3.8 3.5 -3.29 0.29 1.0 0 1.0 0 15252 40 6.3 6.5 2.80 0.26 0.8 -1 0.9 0 16177 40 4.4 4.4 -0.10 0.29 0.6 -1 0.6 -1 17180 40 4.5 4.4 -0.94 0.26 0.9 0 0.9 0 18200 40 5.0 4.7 -0.51 0.22 1.0 0 1.0 0 20257 40 6.4 6.4 3.17 0.30 0.9 0 0.8 0 21184 40 4.6 4.0 -1.11 0.23 0.8 0 0.8 0 22199 40 5.0 4.6 -0.17 0.21 0.5 -2 0.5 -2 23207 40 5.2 4.9 0.46 0.25 0.8 0 0.8 0 24168 40 4.2 4.0 -0.86 0.24 0.4 -3 0.5 -2 25258 40 6.5 6.6 5.39 0.34 1.2 0 1.4 0 26168 40 4.2 4.4 -0.60 0.28 0.5 -3 0.5 -2 27175 40 4.4 3.9 -0.84 0.30 0.6 -2 0.6 -2 28229 40 5.7 5.4 3.26 0.29 0.7 1 0.7 -1 29172 40 4.3 4.5 0.22 0.32 1.1 0 1.1 0 30178 40 4.5 4.5 -0.26 0.30 1.0 0 0.1 1 32172 40 4.3 4.5 -1.26 0.27 0.6 0.2 0.5 -2 33198 40 5.0 5.6 1.31 0.28 0.6 -2 0.6 -2 35169 40 4.2 4.5 -0.27 0.28 0.8 0 1.0 0 36225 40 5.6 5.8 1.83 0.27 0.9 0 1.2 0 37198 40 5.0 4.8 -0.35 0.29 1.2 0 1.2 0 38166 40 4.2 4.2 -1.42 0.26 0.8 -1 0.8 -1 39175 40 4.4 4.5 -1.14 0.27 1.1 0 1.0 0 40214 40 5.3 5.4 2.73 0.32 0.9 0 0.9 0 41189 40 4.7 4.7 -0.70 0.25 1.0 0 1.0 0 42179 40 4.5 4.5 -0.50 0.28 1.6 2 1.6 2 43183 40 4.6 4.2 -1.13 0.23 1.1 0 1.0 0 44204 40 5.1 4.8 0.15 0.21 1.4 1 1.4 1 45250 40 6.3 5.8 2.32 0.21 1.3 1 1.4 1 47109 40 2.7 2.4 -5.52 0.31 0.9 0 0.9 0 48242 40 6.1 5.8 2.08 0.25 1.1 0 1.1 0 50257 40 6.4 6.7 6.57 0.34 1.0 0 1.3 0 51158 40 4.0 3.7 -0.70 0.30 1.3 1 1.3 1 53171 34 5.0 4.7 0.91 0.29 1.1 0 1.1 0 55233 40 5.8 5.8 3.10 0.27 0.8 0 0.8 0 56230 40 5.8 5.9 4.37 0.27 0.5 -3 0.5 -3 57172 40 4.3 4.6 -1.36 0.31 0.5 -2 0.5 -2 58210 40 5.3 5.9 2.20 0.27 0.5 -2 0.5 -2 59
252

Appendices
Live data – candidates (continued)
Obsvd Obsvd Obsvd Fair Model Infit OutfitScore Count Average Avrge Measure S.E. MnSq Std MnSq Std Cand
170 40 4.3 4.6 -0.19 0.28 1.3 0 1.4 1 60230 40 5.8 5.7 2.34 0.29 1.3 1 1.5 1 61174 40 4.3 4.3 -1.41 0.29 1.3 1 1.3 1 65204 40 5.1 5.3 1.65 0.25 0.7 -1 0.7 -1 66170 40 4.3 4.3 -0.68 0.27 0.6 -1 0.6 -1 67161 40 4.0 4.0 -2.53 0.28 1.3 1 1.3 1 68202 40 5.1 5.0 0.61 0.23 0.9 0 0.7 -1 71195 40 4.9 4.5 -0.40 0.27 0.4 -3 0.3 -3 72195 40 4.9 4.2 -0.64 0.21 1.3 1 1.3 1 73180 40 4.7 4.7 -0.50 0.23 0.8 0 0.8 0 74150 40 3.8 3.6 -2.24 0.28 0.9 0 0.9 0 75192 40 4.8 4.2 -0.01 0.24 1.8 2 1.8 2 76199 40 5.0 5.0 -0.02 0.25 0.9 0 1.0 0 77179 40 4.5 4.6 1.02 0.35 0.7 -1 0.6 -1 78147 40 3.7 3.8 -2.04 0.33 1.1 0 1.2 0 79170 40 4.3 4.2 -1.30 0.29 0.8 -1 0.7 -1 80240 40 6.0 6.6 4.87 0.29 0.9 0 0.9 0 81171 40 4.3 4.3 -1.68 0.28 1.7 2 1.7 2 84196 40 4.9 5.0 -0.14 0.30 0.9 0 0.9 0 85192 40 4.8 5.3 1.26 0.27 1.6 2 1.6 2 86161 40 4.0 4.0 -1.07 0.28 1.2 0 1.1 0 88204 40 5.1 5.1 0.36 0.26 0.8 0 0.8 0 89185 40 4.6 4.5 -1.39 0.28 1.0 0 1.0 0 90193 40 4.8 4.9 -0.09 0.25 1.2 0 1.2 0 91140 40 3.5 3.3 -3.00 0.26 0.8 -1 0.9 0 92161 40 4.0 3.9 -1.65 0.24 0.9 0 0.8 0 94189 40 4.7 4.4 -1.13 0.25 0.9 0 1.1 0 95184 40 4.6 4.1 -0.84 0.23 0.6 -2 0.7 -1 98184 40 4.6 4.6 -1.01 0.25 0.7 -1 0.7 -1 99203 40 5.1 5.2 2.03 0.32 0.8 0 0.8 0 100160 40 4.0 3.7 -1.42 0.25 1.1 0 1.0 0 102141 40 3.5 3.3 -4.38 0.29 1.5 2 1.4 1 103274 40 6.8 6.9 6.13 0.45 0.6 -1 0.3 0 104156 40 3.9 4.0 -2.42 0.29 1.5 2 1.4 1 105152 40 3.8 4.2 -2.27 0.34 1.1 0 1.2 0 107117 40 2.9 3.2 -5.61 0.44 1.1 0 1.7 1 108107 40 2.7 2.5 -6.39 0.40 0.9 0 1.2 0 109101 22 4.6 4.6 -1.35 0.35 1.5 1 1.8 2 110128 40 3.2 3.0 -4.25 0.28 1.3 1 1.1 0 112200 40 5.0 5.2 1.41 0.27 1.2 0 1.2 0 114176 40 4.4 4.7 -0.74 0.29 0.9 0 0.9 0 115189 40 4.7 5.1 1.06 0.28 0.7 -1 0.7 -1 117214 40 5.3 5.4 0.78 0.22 1.8 3 1.8 3 118186 40 4.7 4.6 -1.27 0.26 0.4 -3 0.4 -3 119167 40 4.2 3.7 -2.14 0.25 0.7 -1 0.7 -1 120
Obsvd Obsvd Obsvd Fair Model Infit OutfitScore Count Average Avrge Measure S.E. MnSq Std MnSq Std Num
186.6 39.7 4.7 4.7 -0.13 0.28 1.0 -0.3 1.0 -0.2 Mean33.5 1.9 0.8 0.9 2.27 0.04 0.3 1.5 0.4 1.5 S.D.
RMSE 0.28 Adj S.D. 2.25 Separation 7.99 Reliability 0.98Fixed (all same) chi-square: 5190.1 d.f.: 95 significance: .00Random (normal) chi-square: 94.5 d.f.: 94 significance: .47
253

Appendices
(ii) Raters
Obsvd Obsvd Obsvd Fair Model Infit OutfitScore Count Average Avrge Measure S.E. MnSq Std MnSq Std Rater
728 180 4.0 4.2 0.54 0.14 0.9 0 0.9 0 3795 180 4.4 4.7 -0.27 0.12 0.7 -3 0.7 -3 7932 180 5.2 5.4 0.16 0.11 1.1 1 1.1 0 12366 80 4.6 4.7 -0.48 0.20 0.9 0 0.9 0 28786 160 4.9 5.0 -0.27 0.13 0.9 0 0.9 0 32855 180 4.8 5.2 -1.08 0.10 1.0 0 1.0 0 36816 160 5.1 4.8 -0.05 0.11 1.1 0 1.0 0 37818 180 4.5 5.0 -1.80 0.12 0.8 -1 0.8 -1 38935 180 5.2 5.3 -1.19 0.11 0.8 -1 0.7 -1 39940 180 5.2 5.0 0.04 0.12 1.0 0 1.1 0 43702 180 3.9 3.8 1.91 0.16 0.8 -1 0.8 -1 45398 100 4.0 3.9 0.76 0.20 1.1 0 1.1 0 46810 191 4.2 4.3 -2.00 0.14 1.0 0 1.0 0 48
1062 191 5.6 5.0 -0.09 0.13 1.0 0 1.0 0 50880 180 4.9 4.7 0.13 0.13 0.9 0 0.9 -1 52885 200 4.4 4.3 0.57 0.15 1.3 2 1.3 2 56987 200 4.9 5.0 1.25 0.12 0.7 -4 0.7 -3 67838 200 4.2 4.1 3.00 0.15 1.1 1 1.3 1 70803 180 4.5 4.5 -0.25 0.12 1.0 0 0.9 0 72877 171 5.1 5.2 0.04 0.13 1.4 3 1.6 4 82798 180 4.4 4.9 -1.43 0.15 1.2 1 1.2 1 83906 180 5.0 4.7 0.52 0.12 1.0 0 1.0 0 89
Obsvd Obsvd Obsvd Fair Model Infit OutfitScore Count Average Avrge Measure S.E. MnSq Std MnSq Std Num
814.4 173.3 4.7 4.7 -0.00 0.13 1.0 -0.3 1.0 -0.1 Mean158.9 28.4 0.5 0.4 1.13 0.03 0.2 1.7 0.2 1.7 S.D.
RMSE 0.14 Adj S.D. 1.12 Separation 8.16 Reliability 0.99Fixed (all same) chi-square: 1472.3 d.f.: 21 significance: .00Random (normal) chi-square: 21.0 d.f.: 20 significance: .40
254

Appendices
(iii) Items
Obsvd Obsvd Obsvd Fair Model Infit OutfitScore Count Average Avrge Measure S.E. MnSq Std MnSq Std Nu Item
890 191 4.7 4.7 0.11 0.12 1.1 0 1.1 0 1 DesF841 191 4.4 4.4 0.85 0.12 0.7 -3 0.7 -2 2 DesG837 191 4.4 4.3 0.92 0.12 1.1 0 1.0 0 3 DesV835 192 4.3 4.3 1.01 0.12 0.7 -3 0.7 -2 4 NarG853 192 4.4 4.4 0.74 0.12 0.9 0 0.9 0 5 NarV869 192 4.5 4.5 0.50 0.12 1.3 2 1.5 3 6 NarC898 189 4.8 4.7 -0.14 0.12 1.0 0 1.0 0 7 RPF833 189 4.4 4.4 0.85 0.12 0.7 -3 0.7 -3 8 RPG933 189 4.9 5.0 -0.68 0.12 1.5 4 1.6 4 9 RPI900 190 4.7 4.7 -0.11 0.12 0.9 -1 0.9 0 1 Exp1874 190 4.6 4.6 0.29 0.12 0.9 0 0.9 0 Exp1V896 190 4.7 4.7 -0.05 0.12 1.1 0 1.2 1 12 Exp1920 189 4.9 4.9 -0.48 0.12 0.7 -2 0.8 -1 13 Exp2F886 189 4.7 4.7 0.04 0.12 0.8 -2 0.8 -2 14 Exp2V901 189 4.8 4.8 -0.19 0.12 1.0 0 1.0 0 15 Exp2952 192 5.0 5.0 -0.75 0.12 0.9 -1 0.9 -1 16 DisF893 192 4.7 4.6 0.14 0.12 0.7 -2 0.7 -2 17 DisG940 192 4.9 4.9 -0.57 0.12 1.6 4 1.6 4 18 DisI897 192 4.7 4.7 0.08 0.12 0.5 -5 0.6 -4 19 CommEf
1069 192 5.6 5.7 -2.57 0.13 1.4 3 1.3 1 20 Comp
Obsvd Obsvd Obsvd Fair Model Infit OutfitScore Count Average Avrge Measure S.E. MnSq Std MnSq Std Nu Item
895.9 190.6 4.7 4.7 -0.00 0.12 1.0 -0.5 1.0 -0.3 Mean52.2 1.3 0.3 0.3 0.79 0.00 0.3 2.7 0.3 2.5 S.D.
RMSE 0.12 Adj S.D. 0.78 Separation 6.32 Reliability 0.98Fixed (all same) chi-square: 784.0 d.f.: 19 significance: .00Random (normal) chi-square: 19.0 d.f.: 18 significance: .39
255
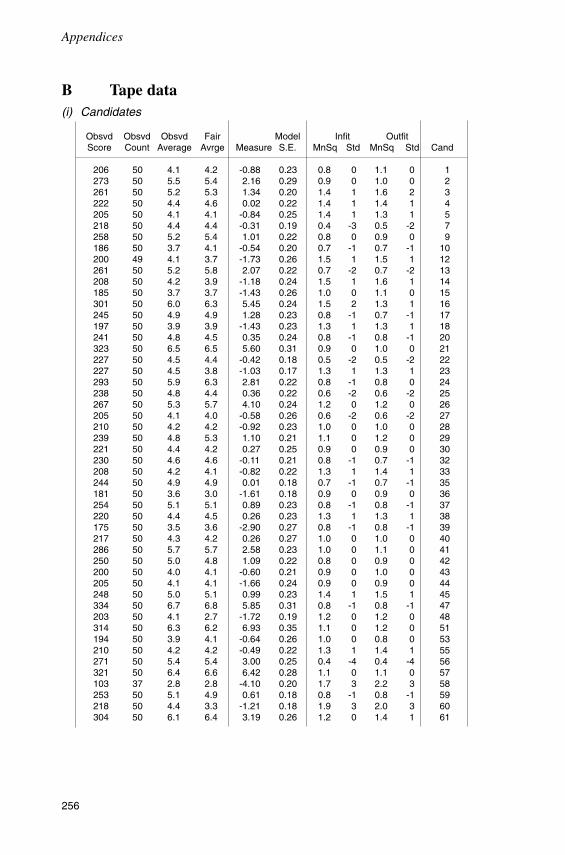
Appendices
B Tape data(i) Candidates
Obsvd Obsvd Obsvd Fair Model Infit OutfitScore Count Average Avrge Measure S.E. MnSq Std MnSq Std Cand
206 50 4.1 4.2 -0.88 0.23 0.8 0 1.1 0 1273 50 5.5 5.4 2.16 0.29 0.9 0 1.0 0 2261 50 5.2 5.3 1.34 0.20 1.4 1 1.6 2 3222 50 4.4 4.6 0.02 0.22 1.4 1 1.4 1 4205 50 4.1 4.1 -0.84 0.25 1.4 1 1.3 1 5218 50 4.4 4.4 -0.31 0.19 0.4 -3 0.5 -2 7258 50 5.2 5.4 1.01 0.22 0.8 0 0.9 0 9186 50 3.7 4.1 -0.54 0.20 0.7 -1 0.7 -1 10200 49 4.1 3.7 -1.73 0.26 1.5 1 1.5 1 12261 50 5.2 5.8 2.07 0.22 0.7 -2 0.7 -2 13208 50 4.2 3.9 -1.18 0.24 1.5 1 1.6 1 14185 50 3.7 3.7 -1.43 0.26 1.0 0 1.1 0 15301 50 6.0 6.3 5.45 0.24 1.5 2 1.3 1 16245 50 4.9 4.9 1.28 0.23 0.8 -1 0.7 -1 17197 50 3.9 3.9 -1.43 0.23 1.3 1 1.3 1 18241 50 4.8 4.5 0.35 0.24 0.8 -1 0.8 -1 20323 50 6.5 6.5 5.60 0.31 0.9 0 1.0 0 21227 50 4.5 4.4 -0.42 0.18 0.5 -2 0.5 -2 22227 50 4.5 3.8 -1.03 0.17 1.3 1 1.3 1 23293 50 5.9 6.3 2.81 0.22 0.8 -1 0.8 0 24238 50 4.8 4.4 0.36 0.22 0.6 -2 0.6 -2 25267 50 5.3 5.7 4.10 0.24 1.2 0 1.2 0 26205 50 4.1 4.0 -0.58 0.26 0.6 -2 0.6 -2 27210 50 4.2 4.2 -0.92 0.23 1.0 0 1.0 0 28239 50 4.8 5.3 1.10 0.21 1.1 0 1.2 0 29221 50 4.4 4.2 0.27 0.25 0.9 0 0.9 0 30230 50 4.6 4.6 -0.11 0.21 0.8 -1 0.7 -1 32208 50 4.2 4.1 -0.82 0.22 1.3 1 1.4 1 33244 50 4.9 4.9 0.01 0.18 0.7 -1 0.7 -1 35181 50 3.6 3.0 -1.61 0.18 0.9 0 0.9 0 36254 50 5.1 5.1 0.89 0.23 0.8 -1 0.8 -1 37220 50 4.4 4.5 0.26 0.23 1.3 1 1.3 1 38175 50 3.5 3.6 -2.90 0.27 0.8 -1 0.8 -1 39217 50 4.3 4.2 0.26 0.27 1.0 0 1.0 0 40286 50 5.7 5.7 2.58 0.23 1.0 0 1.1 0 41250 50 5.0 4.8 1.09 0.22 0.8 0 0.9 0 42200 50 4.0 4.1 -0.60 0.21 0.9 0 1.0 0 43205 50 4.1 4.1 -1.66 0.24 0.9 0 0.9 0 44248 50 5.0 5.1 0.99 0.23 1.4 1 1.5 1 45334 50 6.7 6.8 5.85 0.31 0.8 -1 0.8 -1 47203 50 4.1 2.7 -1.72 0.19 1.2 0 1.2 0 48314 50 6.3 6.2 6.93 0.35 1.1 0 1.2 0 51194 50 3.9 4.1 -0.64 0.26 1.0 0 0.8 0 53210 50 4.2 4.2 -0.49 0.22 1.3 1 1.4 1 55271 50 5.4 5.4 3.00 0.25 0.4 -4 0.4 -4 56321 50 6.4 6.6 6.42 0.28 1.1 0 1.1 0 57103 37 2.8 2.8 -4.10 0.20 1.7 3 2.2 3 58253 50 5.1 4.9 0.61 0.18 0.8 -1 0.8 -1 59218 50 4.4 3.3 -1.21 0.18 1.9 3 2.0 3 60304 50 6.1 6.4 3.19 0.26 1.2 0 1.4 1 61
256

Tape data – candidates (continued)
Obsvd Obsvd Obsvd Fair Model Infit OutfitScore Count Average Avrge Measure S.E. MnSq Std MnSq Std Cand
200 50 4.0 3.8 -1.13 0.26 1.0 0 0.9 0 65247 50 4.9 5.1 2.11 0.24 0.9 0 0.9 0 66231 50 4.6 4.4 -0.43 0.23 1.0 0 1.0 0 67254 50 5.1 4.8 2.16 0.26 1.0 0 1.0 0 68260 50 5.2 5.3 2.13 0.27 0.4 -3 0.4 -3 71168 50 3.4 3.6 -2.34 0.25 0.8 0 0.8 0 72218 50 4.4 4.1 -0.02 0.25 1.0 0 0.9 0 73195 50 3.9 4.0 -0.99 0.23 1.5 2 1.4 1 74185 50 3.7 2.8 -2.03 0.19 0.8 0 0.8 0 7514 3 4.7 5.2 -0.54 1.01 0.9 0 0.9 0 76
223 50 4.5 4.4 -0.01 0.21 0.9 0 0.9 0 77212 50 4.2 4.4 1.19 0.27 0.7 -1 0.8 -1 78195 50 3.9 3.7 -2.19 0.24 0.6 -1 0.5 -1 79224 50 4.5 4.4 -0.20 0.26 0.8 0 0.9 0 80230 50 4.6 3.4 -0.87 0.21 0.7 -1 0.7 -1 82234 50 4.7 5.0 -0.16 0.20 1.4 1 1.3 1 84222 50 4.4 4.3 -0.66 0.21 1.2 0 1.2 0 85198 50 4.0 4.3 -1.44 0.21 0.8 -1 1.0 0 86253 50 5.1 5.2 1.60 0.22 0.5 -2 0.7 -1 88260 50 5.2 4.8 1.09 0.23 0.8 -1 0.8 0 89201 50 4.0 4.1 -1.10 0.26 0.8 -1 0.8 -1 90102 23 4.4 4.2 -0.53 0.28 0.7 0 0.8 0 91191 50 3.8 3.8 -1.57 0.22 0.9 0 0.9 0 92154 44 3.5 3.9 -2.16 0.22 1.1 0 1.1 0 94204 50 4.1 4.5 -0.20 0.18 0.4 -3 0.4 -4 95163 50 3.3 2.9 -2.34 0.21 1.7 2 1.7 2 98197 50 3.9 4.1 -1.29 0.27 1.0 0 0.9 0 99190 50 3.8 3.9 -0.85 0.28 1.4 1 1.4 1 100144 44 3.3 3.3 -2.70 0.24 1.4 1 1.4 1 102206 50 4.1 3.2 -1.23 0.19 1.2 1 1.2 1 103298 50 6.0 6.2 4.29 0.25 1.4 1 1.4 2 104211 50 4.2 4.1 -1.30 0.27 0.7 -1 0.7 -1 105163 50 3.3 3.5 -2.96 0.22 0.5 -2 0.6 -2 107135 50 2.7 2.5 -4.11 0.21 0.9 0 1.0 0 108143 50 2.9 2.1 -4.21 0.20 1.0 0 1.0 0 109241 50 4.8 5.5 0.70 0.23 0.8 -1 0.8 -1 110143 41 3.5 3.0 -3.53 0.23 1.2 0 1.3 0 112243 50 4.9 5.0 1.39 0.23 1.1 0 1.1 0 114222 50 4.4 4.3 -0.55 0.21 0.6 -2 0.5 -2 115201 50 4.0 4.1 -2.01 0.20 1.3 1 1.4 1 117236 50 4.7 4.7 0.55 0.19 0.4 -3 0.5 -3 118172 50 3.4 2.9 -2.36 0.19 0.6 -2 0.6 -2 119213 50 4.3 4.4 -0.41 0.21 0.7 -1 0.6 -2 120
Obsvd Obsvd Obsvd Fair Model Infit OutfitScore Count Average Avrge Measure S.E. MnSq Std MnSq Std Cand
219.5 48.9 4.5 4.4 0.06 0.24 1.0 -0.3 1.0 -0.3 Mean49.4 5.7 0.8 1.0 2.23 0.09 0.3 1.6 0.3 1.6 S.D.
RMSE 0.25 Adj S.D. 2.21 Separation 8.72 Reliability 0.99Fixed (all same) chi-square: 7821.0 d.f.: 96 significance: .00Random (normal) chi-square: 95.9 d.f.: 95 significance: .45
Appendices
257

Appendices
(ii) Raters
Obsvd Obsvd Obsvd Fair Model Infit OutfitScore Count Average Avrge Measure S.E. MnSq Std MnSq Std Rater
1033 250 4.1 4.0 1.13 0.13 1.2 2 1.2 1 31094 250 4.4 4.5 -0.77 0.11 0.8 -1 0.9 -1 71219 250 4.9 5.0 -0.81 0.10 1.3 3 1.3 3 12646 125 5.2 4.2 2.11 0.15 1.1 1 1.2 1 28
1091 231 4.7 4.8 -1.79 0.12 1.0 0 1.1 0 32994 213 4.7 4.7 -0.00 0.09 1.0 0 1.0 0 36
1104 250 4.4 4.9 -0.17 0.08 0.9 -1 0.9 0 371237 247 5.0 5.1 0.75 0.10 0.8 -2 0.9 -1 381102 250 4.4 4.1 0.95 0.08 0.6 -5 0.6 -5 391083 250 4.3 4.6 -1.27 0.10 1.2 1 1.2 1 431056 250 4.2 4.0 1.25 0.11 0.8 -2 0.8 -2 45349 85 4.1 4.6 -0.58 0.18 1.2 1 1.2 1 46824 200 4.1 4.0 0.11 0.13 1.0 0 1.1 0 48816 194 4.2 4.1 0.61 0.12 1.0 0 1.0 0 50895 200 4.5 4.3 0.39 0.10 0.8 -2 0.8 -2 52926 225 4.1 3.9 0.38 0.11 0.7 -3 0.7 -3 56
1019 224 4.5 4.7 0.02 0.14 0.9 -1 0.9 -1 67891 225 4.0 4.1 0.15 0.11 1.2 1 1.1 1 70933 197 4.7 4.7 -0.35 0.11 1.1 0 1.1 0 72832 200 4.2 5.3 -2.94 0.09 1.2 1 1.2 1 82
1135 203 5.6 4.9 1.56 0.11 0.9 -1 0.9 0 831016 222 4.6 4.6 -0.73 0.11 1.0 0 1.1 0 89
Obsvd Obsvd Obsvd Fair Model Infit OutfitScore Count Average Avrge Measure S.E. MnSq Std MnSq Std Num
968.0 215.5 4.5 4.5 -0.00 0.11 1.0 -0.4 1.0 -0.2 Mean193.6 40.9 0.4 0.4 1.12 0.02 0.2 2.1 0.2 1.9 S.D.
RMSE 0.11 Adj S.D. 1.11 Separation 9.70 Reliability 0.99Fixed (all same) chi-square: 2544.7 d.f.: 21 significance: .00Random (normal) chi-square: 21.0 d.f.: 20 significance: .40
258

Appendices
(iii) Items
Obsvd Obsvd Obsvd Fair Model Infit OutfitScore Count Average Avrge Measure S.E. MnSq Std MnSq Std Nu Item
876 191 4.6 4.6 -0.24 0.11 1.0 0 1.1 0 21 TDes1F840 191 4.4 4.4 0.23 0.11 0.8 -1 0.8 -1 22 TDes1G851 191 4.5 4.4 0.08 0.11 1.2 1 1.2 2 23 TDes1V807 190 4.2 4.2 0.59 0.11 0.8 -2 0.8 -1 24 TNarG836 190 4.4 4.4 0.21 0.11 0.8 -1 0.9 -1 25 TNarV855 190 4.5 4.5 -0.04 0.11 1.2 1 1.2 1 26 TNarC849 188 4.5 4.5 -0.05 0.12 1.0 0 1.0 0 27 TSumF781 188 4.2 4.1 0.85 0.12 0.7 -3 0.7 -3 28 TSumG780 188 4.1 4.1 0.87 0.12 0.9 0 0.8 -1 29 TSumV854 187 4.6 4.5 -0.18 0.12 1.3 2 1.3 2 30 TRPF795 187 4.3 4.2 0.61 0.12 0.8 -2 0.8 -1 31 TRPG909 187 4.9 4.9 -0.91 0.12 1.5 3 1.6 4 32 TRP858 188 4.6 4.5 -0.16 0.11 0.9 0 1.0 0 33 TExpF831 188 4.4 4.4 0.20 0.11 0.9 0 0.9 -1 34 TExpV845 188 4.5 4.5 0.01 0.11 1.4 3 1.4 3 35 TExp900 191 4.7 4.7 -0.55 0.11 1.1 0 1.1 0 36 TInsF854 191 4.5 4.5 0.04 0.11 1.0 0 1.0 0 37 TInsV854 191 4.5 4.5 0.04 0.11 1.2 1 1.3 2 38 TInsC881 191 4.6 4.6 -0.30 0.11 0.9 0 0.9 0 39 TDisF846 191 4.4 4.4 0.15 0.11 0.5 -5 0.6 -4 40 TDisG941 191 4.9 4.9 -1.09 0.12 1.4 2 1.4 2 41 TDisI888 191 4.6 4.6 -0.39 0.11 0.8 -2 0.8 -1 42 TDes2F841 190 4.4 4.4 0.16 0.11 0.6 -4 0.6 -4 43 TDes2G863 191 4.5 4.5 -0.07 0.11 0.9 -1 0.9 0 44 TDes2V860 191 4.5 4.5 -0.03 0.11 0.5 -5 0.6 -4 45 TComm
Obsvd Obsvd Obsvd Fair Model Infit OutfitScore Count Average Avrge Measure S.E. MnSq Std MnSq Std Nu Item
851.8 189.6 4.5 4.5 -0.00 0.11 1.0 -0.5 1.0 -0.3 Mean36.3 1.5 0.2 0.2 0.45 0.00 0.3 2.5 0.3 2.5 S.D.
RMSE 0.11 Adj S.D. 0.44 Separation 3.81 Reliability 0.94Fixed (all same) chi-square: 381.8 d.f.: 24 significance: .00Random (normal) chi-square: 24.0 d.f.: 23 significance: .40
259

Appendices
C Combined data(i) Candidates
Obsvd Obsvd Obsvd Fair Model Infit OutfitScore Count Average Avrge Measure S.E. MnSq Std MnSq Std Cand
378 90 4.2 4.3 -0.41 0.16 0.8 -1 0.8 -1 1494 90 5.5 5.4 2.03 0.17 0.6 -2 0.6 -2 2502 90 5.6 5.4 1.54 0.14 1.0 0 1.1 0 3368 90 4.1 4.3 -0.72 0.17 1.3 1 1.3 1 4365 87 4.2 4.2 -0.29 0.18 1.0 0 1.0 0 5396 90 4.4 4.6 0.01 0.15 0.8 -1 0.8 -1 7461 90 5.1 5.2 1.52 0.16 0.9 0 1.0 0 9393 90 4.4 4.3 -0.31 0.14 0.9 0 1.0 0 10353 89 4.0 3.9 -1.83 0.18 1.1 0 1.2 0 12460 90 5.1 5.2 1.55 0.15 1.0 0 1.0 0 13375 90 4.2 4.0 -0.70 0.17 1.2 1 1.2 1 14335 90 3.7 3.7 -1.82 0.16 1.0 0 1.0 0 15553 90 6.1 6.1 3.89 0.17 1.3 1 1.2 1 16422 90 4.7 5.0 0.96 0.17 0.7 -2 0.7 -2 17377 90 4.2 4.2 -1.01 0.17 1.3 1 1.3 1 18441 90 4.9 4.7 0.13 0.15 0.8 -1 0.9 -1 20580 90 6.4 6.5 5.01 0.22 1.1 0 1.3 1 21411 90 4.6 4.6 -0.03 0.14 0.7 -2 0.7 -2 22426 90 4.7 4.6 -0.02 0.13 1.2 1 1.4 2 23500 90 5.6 5.5 1.55 0.15 1.0 0 1.1 0 24406 90 4.5 4.5 0.06 0.15 0.5 -3 0.7 -2 25525 90 5.8 6.1 3.85 0.17 1.1 0 1.1 0 26373 90 4.1 4.1 -0.50 0.17 0.4 -4 0.5 -4 27385 90 4.3 4.1 -0.65 0.16 0.7 -2 0.7 -2 28468 90 5.2 5.3 1.83 0.16 1.1 0 1.1 0 29393 90 4.4 4.5 0.01 0.17 0.7 -1 0.7 -1 30408 90 4.5 4.5 0.08 0.15 0.7 -2 0.7 -2 32380 90 4.2 4.3 -0.60 0.17 1.0 0 1.0 0 33442 90 4.9 4.9 0.92 0.15 0.7 -2 0.6 -2 35350 90 3.9 3.8 -0.98 0.14 0.9 0 0.9 0 36479 90 5.3 5.0 1.22 0.16 0.8 -1 0.9 0 37418 90 4.6 4.5 0.22 0.17 1.2 1 1.3 1 38341 90 3.8 3.9 -1.37 0.17 0.8 -1 0.8 -1 39392 90 4.4 4.2 -0.08 0.17 1.0 0 0.9 0 40500 90 5.6 5.5 2.34 0.17 0.8 -1 0.8 -1 41439 90 4.9 5.0 0.51 0.16 0.9 0 0.9 0 42379 90 4.2 4.3 -0.42 0.16 1.2 0 1.3 1 43388 90 4.3 4.3 -0.97 0.16 1.1 0 1.0 0 44452 90 5.0 5.1 0.97 0.15 1.6 3 1.6 3 45584 90 6.5 6.6 3.78 0.19 1.5 2 1.6 2 47312 90 3.5 3.1 -2.07 0.14 1.2 1 1.1 0 48491 90 5.5 5.6 1.92 0.15 0.9 0 0.9 0 50571 90 6.3 6.3 5.42 0.25 1.1 0 1.2 0 51352 90 3.9 3.9 -0.67 0.17 0.8 -1 0.8 -1 53381 84 4.5 4.6 0.24 0.16 1.1 0 1.2 1 55504 90 5.6 5.5 2.54 0.17 0.5 -3 0.5 -3 56551 90 6.1 6.2 4.28 0.17 0.7 -2 0.7 -2 57275 77 3.6 3.6 -2.36 0.17 2.5 5 2.2 3 58463 90 5.1 5.1 1.36 0.15 0.9 0 0.8 -1 59388 90 4.3 4.2 -0.54 0.16 2.0 4 1.9 4 60534 90 5.9 5.9 2.62 0.17 1.0 0 1.1 0 61
260

Appendices
Combined data – candidates (continued)
Obsvd Obsvd Obsvd Fair Model Infit OutfitScore Count Average Avrge Measure S.E. MnSq Std MnSq Std Cand
374 90 4.2 4.1 -1.01 0.18 0.9 0 0.8 -1 65451 90 5.0 5.2 2.05 0.16 0.7 -2 0.7 -2 66401 90 4.5 4.5 0.19 0.17 0.8 -1 0.8 -1 67415 90 4.6 4.4 -0.06 0.17 2.0 5 2.0 5 68462 90 5.1 5.3 1.51 0.16 1.0 0 0.9 -1 71363 90 4.0 4.0 -1.09 0.14 0.9 0 0.9 0 72413 90 4.6 4.6 0.11 0.14 0.9 0 0.9 0 73382 90 4.2 4.4 -0.30 0.16 1.3 1 1.3 1 74335 90 3.7 3.4 -1.64 0.16 0.9 0 0.9 0 75206 43 4.8 4.5 0.45 0.20 1.7 2 1.7 2 76422 90 4.7 4.6 0.25 0.15 0.8 -1 0.8 -1 77391 90 4.3 4.6 0.73 0.18 0.6 -2 0.6 -2 78342 90 3.8 3.9 -1.58 0.17 0.6 -2 0.6 -2 79394 90 4.4 4.1 -0.33 0.17 0.7 -1 0.8 -1 80548 90 6.1 6.3 3.77 0.17 0.6 -3 0.7 -2 81405 90 4.5 4.3 -0.30 0.15 1.4 2 1.4 2 84418 90 4.6 4.5 -0.18 0.16 1.0 0 1.0 0 85390 90 4.3 4.3 -0.01 0.16 1.3 1 1.3 1 86414 90 4.6 4.8 0.51 0.14 1.0 0 0.9 0 88464 90 5.2 4.9 0.86 0.16 0.7 -2 0.7 -2 89386 90 4.3 4.3 -0.86 0.18 0.8 -1 0.8 -1 90295 63 4.7 4.6 -0.06 0.18 1.1 0 1.2 1 91331 90 3.7 3.6 -1.65 0.16 0.8 -1 0.8 -1 92315 84 3.8 3.9 -1.45 0.15 0.9 0 0.9 0 94393 90 4.4 4.4 -0.31 0.13 0.5 -4 0.6 -3 95347 90 3.9 4.0 -1.02 0.15 2.0 4 2.1 5 98381 90 4.2 4.2 -0.89 0.18 0.7 -2 0.7 -1 99393 90 4.4 4.3 0.34 0.16 1.8 4 1.8 4 100304 84 3.6 3.6 -1.72 0.17 1.2 1 1.1 0 102347 90 3.9 3.7 -1.36 0.14 1.2 1 1.2 1 103572 90 6.4 6.4 4.69 0.22 1.3 1 1.3 1 104367 90 4.1 3.9 -1.37 0.18 1.1 0 1.0 0 105315 90 3.5 3.7 -2.12 0.18 0.6 -2 0.8 -1 107252 90 2.8 3.0 -3.14 0.14 0.8 -1 0.8 -1 108250 90 2.8 2.2 -4.06 0.15 0.7 -1 0.8 -1 109342 72 4.8 4.8 0.28 0.18 1.1 0 1.5 2 110271 81 3.3 3.2 -3.44 0.17 1.2 1 1.1 0 112443 90 4.9 4.9 1.45 0.16 0.9 0 0.9 0 114398 90 4.4 4.6 -0.15 0.16 0.7 -2 0.7 -1 115390 90 4.3 4.3 -0.46 0.15 1.5 3 1.4 2 117450 90 5.0 5.0 0.58 0.14 0.9 0 1.0 0 118358 90 4.0 3.7 -1.61 0.15 0.6 -2 0.6 -2 119380 90 4.2 4.4 -0.59 0.16 0.9 0 0.9 0 120
Obsvd Obsvd Obsvd Fair Model Infit OutfitScore Count Average Avrge Measure S.E. MnSq Std MnSq Std Num
396.1 86.4 4.6 4.6 0.18 0.16 1.0 -0.4 1.0 -0.3 Mean85.7 11.1 0.8 0.8 1.75 0.02 0.4 2.1 0.4 2.0 S.D.
RMSE 0.17 Adj S.D. 1.74 Separation 10.52 Reliability 0.99Fixed (all same) chi-square: 10071.8 d.f.: 98 significance: .00Random (normal) chi-square: 97.8 d.f.: 97 significance: .46
261

Appendices
(ii) Raters
Obsvd Obsvd Obsvd Fair Model Infit OutfitScore Count Average Avrge Measure S.E. MnSq Std MnSq Std Rater
1761 430 4.1 4.0 0.81 0.09 1.0 0 1.0 0 31889 430 4.4 4.5 0.58 0.07 0.9 -1 0.9 0 72151 430 5.0 4.9 -1.00 0.07 1.1 1 1.1 1 121012 205 4.9 4.4 1.29 0.11 1.1 0 1.1 1 281877 391 4.8 5.0 0.18 0.08 0.9 -1 1.0 0 321849 393 4.7 4.6 -0.05 0.06 1.0 0 1.0 0 361920 410 4.7 4.7 0.50 0.07 1.3 3 1.3 3 372055 427 4.8 4.7 -0.15 0.07 0.9 -1 0.9 -1 382037 430 4.7 4.5 0.25 0.05 0.6 -6 0.6 -6 392023 430 4.7 4.7 -0.44 0.07 1.1 0 1.1 1 431758 430 4.1 3.9 1.18 0.08 0.8 -2 0.9 -2 45747 185 4.0 4.2 0.48 0.12 1.0 0 1.0 0 46
1634 391 4.2 4.2 -1.54 0.09 1.2 2 1.2 2 481878 385 4.9 4.4 0.03 0.07 0.7 -4 0.7 -3 501775 380 4.7 4.4 0.49 0.08 0.7 -3 0.7 -3 521811 425 4.3 4.1 0.08 0.08 1.1 0 1.0 0 562006 424 4.7 4.8 -0.76 0.08 0.8 -3 0.8 -2 671729 425 4.1 4.1 0.40 0.07 1.1 1 1.1 1 701736 377 4.6 4.3 0.11 0.07 1.1 1 1.1 0 721709 371 4.6 5.0 -1.38 0.07 1.5 5 1.6 6 821933 383 5.0 4.8 -0.07 0.08 1.0 0 1.1 0 831922 402 4.8 4.6 -1.00 0.08 1.1 0 1.1 0 89
Obsvd Obsvd Obsvd Fair Model Infit OutfitScore Count Average Avrge Measure S.E. MnSq Std MnSq Std Num
1782.4 388.8 4.6 4.5 0.00 0.08 1.0 -0.3 1.0 -0.1 Mean314.6 64.7 0.3 0.3 0.74 0.01 0.2 2.7 0.2 2.6 S.D.
RMSE 0.08 Adj S.D. 0.74 Separation 9.21 Reliability 0.99Fixed (all same) chi-square: 1799.3 d.f.: 21 significance: .00Random (normal) chi-square: 21.0 d.f.: 20 significance: .40
262

Appendices
(iii) Items
Obsvd Obsvd Obsvd Fair Model Infit OutfitScore Count Average Avrge Measure S.E. MnSq Std MnSq Std Nu Item
890 191 4.7 4.5 -0.14 0.11 1.1 0 1.1 0 1 DesF841 191 4.4 4.3 0.44 0.11 0.7 -2 0.8 -2 2 DesG837 191 4.4 4.2 0.48 0.11 1.0 0 1.0 0 3 DesV835 192 4.3 4.2 0.55 0.11 0.7 -3 0.7 -3 4 NarG853 192 4.4 4.3 0.34 0.11 0.9 0 0.9 0 5 NarV869 192 4.5 4.4 0.16 0.11 1.2 1 1.2 2 6 NarC898 189 4.8 4.6 -0.36 0.11 1.0 0 1.1 0 7 RPF833 189 4.4 4.3 0.42 0.11 0.7 -2 0.7 -2 8 RPG933 189 4.9 4.8 -0.79 0.11 1.5 3 1.5 3 9 RPI900 190 4.7 4.6 -0.33 0.11 1.0 0 1.0 0 10 Exp1F874 190 4.6 4.5 -0.02 0.11 0.9 0 1.0 0 11 Exp1V896 190 4.7 4.6 -0.28 0.11 1.1 0 1.1 0 12 Exp1C920 189 4.9 4.8 -0.63 0.11 0.8 -2 0.9 -1 13 Exp2F886 189 4.7 4.6 -0.21 0.11 0.7 -3 0.8 -2 14 Exp2V901 189 4.8 4.7 -0.40 0.11 1.0 0 1.0 0 15 Exp2C952 192 5.0 4.9 -0.83 0.11 0.9 0 0.9 0 16 DisF893 192 4.7 4.5 -0.13 0.11 0.7 -3 0.7 -3 17 DisG940 192 4.9 4.8 -0.69 0.11 1.5 4 1.5 4 18 DisI897 192 4.7 4.5 -0.17 0.11 0.6 -4 0.6 -3 19 CommEf
1069 192 5.6 5.5 -2.32 0.12 1.6 4 1.6 3 20 Comp876 191 4.6 4.5 -0.02 0.11 1.1 0 1.1 0 21 TDes1F840 191 4.4 4.3 0.40 0.11 0.8 -2 0.8 -2 22 TDes1G851 191 4.5 4.4 0.27 0.11 1.1 0 1.1 1 23 TDes1V807 190 4.2 4.2 0.71 0.11 0.8 -2 0.8 -1 24 TNarG836 190 4.4 4.3 0.38 0.11 0.8 -1 0.9 -1 25 TNarV855 190 4.5 4.4 0.16 0.11 1.1 1 1.2 1 26 TNarC849 188 4.5 4.4 0.15 0.11 1.1 0 1.1 0 27 TSumF781 188 4.2 4.1 0.94 0.11 0.7 -2 0.7 -2 28 TSumG780 188 4.1 4.0 0.96 0.11 1.0 0 1.0 0 29 TSumV854 187 4.6 4.5 0.05 0.11 1.3 2 1.4 3 30 TRPF795 187 4.3 4.1 0.75 0.11 0.9 -1 0.9 0 31 TRPG909 187 4.9 4.8 -0.61 0.11 1.5 3 1.5 3 32 TRPI858 188 4.6 4.5 0.06 0.11 1.0 0 1.0 0 33 TExpF831 188 4.4 4.3 0.37 0.11 1.0 0 0.9 0 34 TExpV845 188 4.5 4.4 0.21 0.11 1.4 3 1.4 3 35 TExp900 191 4.7 4.6 -0.30 0.11 1.1 1 1.1 1 36 TInsF854 191 4.5 4.4 0.23 0.11 1.0 0 1.0 0 37 TInsV854 191 4.5 4.4 0.23 0.11 1.2 1 1.3 2 38 TInsC881 191 4.6 4.5 -0.08 0.11 1.0 0 1.1 0 39 TDisF846 191 4.4 4.3 0.33 0.11 0.6 -3 0.6 -3 40 TDisG941 191 4.9 4.9 -0.78 0.11 1.4 3 1.4 3 41 TDisI888 191 4.6 4.6 -0.16 0.11 0.8 -2 0.8 -1 42 TDes2F841 190 4.4 4.3 0.34 0.11 0.6 -4 0.6 -4 43 TDes2G863 191 4.5 4.4 0.13 0.11 0.9 -1 0.9 -1 44 TDes2V860 191 4.5 4.4 0.16 0.11 0.6 -4 0.6 -3 45 TComm
Obsvd Obsvd Obsvd Fair Model Infit OutfitScore Count Average Avrge Measure S.E. MnSq Std MnSq Std Nu Item
871.4 190.1 4.6 4.5 -0.00 0.11 1.0 -0.4 1.0 -0.2 Mean49.2 1.5 0.2 0.3 0.56 0.00 0.3 2.4 0.3 2.3 S.D.
RMSE 0.11 Adj S.D. 0.55 Separation 5.06 Reliability 0.96Fixed (all same) chi-square: 1136.9 d.f.: 44 significance: .00Random (normal) chi-square: 43.9 d.f.: 43 significance: .43
263

Appendices
Appendix 7.3FACETS analyses (3) with unanchored item difficultyestimates, oral interaction sub-test, June 1994 trial (N = 89)
A Live data(i) Candidates
Obsvd Obsvd Obsvd Fair Model Infit OutfitScore Count Average Avrge Measure S.E. MnSq Std MnSq Std Cand
172 40 4.3 4.1 -0.70 0.30 0.7 -1 0.8 0 1221 40 5.5 5.0 2.06 0.27 0.6 -2 0.7 -1 2241 40 6.0 6.0 2.82 0.27 1.3 1 1.3 1 3146 40 3.7 3.9 -1.88 0.26 0.8 0 0.7 -1 4160 37 4.3 4.1 -0.35 0.32 1.2 0 1.2 0 5178 40 4.5 4.8 0.14 0.32 1.3 1 1.3 1 7203 40 5.1 5.1 1.76 0.27 1.5 2 1.7 2 9207 40 5.2 5.4 0.06 0.27 1.6 2 1.7 2 10153 40 3.8 3.9 -3.10 0.33 1.2 1 1.3 1 12199 40 5.0 5.0 0.84 0.23 0.8 0 0.9 0 13167 40 4.2 4.3 -1.72 0.27 1.1 0 1.1 0 14150 40 3.8 3.5 -3.37 0.29 1.0 0 1.0 0 15252 40 6.3 6.5 2.78 0.26 0.8 -1 0.9 0 16177 40 4.4 4.5 -0.11 0.30 0.7 -1 0.7 -1 17180 40 4.5 4.4 -0.95 0.26 0.9 0 0.9 0 18200 40 5.0 4.8 -0.46 0.21 1.0 0 0.9 0 20257 40 6.4 6.4 3.27 0.30 0.9 0 0.9 0 21184 40 4.6 4.0 -1.03 0.24 0.8 0 0.8 0 22199 40 5.0 4.8 0.09 0.21 0.5 -2 0.5 -2 23207 40 5.2 4.9 0.54 0.26 0.8 0 0.8 0 24168 40 4.2 4.1 -0.50 0.24 0.5 -2 0.6 -2 25258 40 6.5 6.6 5.53 0.34 1.2 0 1.4 0 26168 40 4.2 4.4 -0.53 0.28 0.5 -3 0.5 -2 27175 40 4.4 3.8 -1.22 0.30 0.6 -1 0.6 -2 28229 40 5.7 5.4 3.20 0.29 0.8 -1 0.7 -1 29172 40 4.3 4.5 0.25 0.33 1.1 0 1.1 0 30178 40 4.5 4.6 -0.27 0.30 1.0 0 1.1 0 32172 40 4.3 4.4 -1.35 0.28 0.6 -1 0.6 -2 33198 40 5.0 5.5 1.17 0.28 0.6 -2 0.6 -2 35169 40 4.2 4.5 -0.31 0.29 0.8 0 1.0 0 36225 40 5.6 5.8 1.82 0.27 0.9 0 1.2 0 37198 40 5.0 4.8 -0.41 0.29 1.2 0 1.2 0 38166 40 4.2 4.2 -1.45 0.26 0.8 -1 0.8 -1 39175 40 4.4 4.5 -1.14 0.26 1.1 0 1.0 0 40214 40 5.3 5.4 2.72 0.32 0.9 0 0.9 0 41189 40 4.7 4.7 -0.72 0.25 0.9 0 1.0 0 42179 40 4.5 4.5 -0.49 0.28 1.6 2 1.6 2 43183 40 4.6 4.3 -1.06 0.24 1.1 0 1.1 0 44204 40 5.1 4.8 0.24 0.21 1.4 1 1.4 1 45250 40 6.3 5.8 2.43 0.21 1.3 1 1.4 1 47109 40 2.7 2.4 -5.39 0.32 0.9 0 0.9 0 48242 40 6.1 5.9 2.46 0.25 1.2 0 1.3 1 50257 40 6.4 6.7 6.63 0.34 1.0 0 1.3 0 51158 40 4.0 3.7 -1.10 0.30 1.4 1 1.4 1 53171 34 5.0 4.7 0.70 0.30 1.0 0 1.0 0 55233 40 5.8 5.8 3.10 0.27 0.8 0 0.8 0 56230 40 5.8 5.9 4.42 0.28 0.5 -3 0.5 -2 57210 40 5.3 5.9 2.09 0.27 0.5 -2 0.6 -2 59
264

Appendices
Live data – candidates (continued)
Obsvd Obsvd Obsvd Fair Model Infit OutfitScore Count Average Avrge Measure S.E. MnSq Std MnSq Std Cand
230 40 5.8 5.7 2.36 0.29 1.3 1 1.5 1 61174 40 4.3 4.2 -1.48 0.29 1.3 1 1.3 1 65204 40 5.1 5.3 1.64 0.25 0.7 -1 0.7 -1 66170 40 4.3 4.3 -0.70 0.27 0.6 -2 0.6 -1 67161 40 4.0 4.0 -2.54 0.28 1.3 1 1.4 1 68202 40 5.1 5.0 0.72 0.23 0.9 0 0.8 -1 71195 40 4.9 4.5 -0.37 0.27 0.4 -3 0.3 -3 72195 40 4.9 4.4 -0.34 0.21 1.2 0 1.1 0 73187 40 4.7 4.7 -0.44 0.23 0.9 0 0.9 0 74150 40 3.8 3.6 -2.19 0.29 0.9 0 0.9 0 75199 40 5.0 5.0 -0.00 0.25 1.0 0 1.0 0 77179 40 4.5 4.6 1.05 0.35 0.7 -1 0.6 -1 78147 40 3.7 3.8 -2.15 0.33 1.1 0 1.2 0 79170 40 4.3 4.1 -1.71 0.30 0.8 -1 0.8 -1 80240 40 6.0 6.5 4.83 0.29 0.9 0 0.9 0 81196 40 4.9 4.9 -0.30 0.30 0.9 0 0.9 0 85192 40 4.8 5.3 1.20 0.27 1.6 2 1.6 2 86161 40 4.0 4.0 -1.06 0.28 1.2 0 1.2 0 88204 40 5.1 5.1 0.34 0.26 0.9 0 0.8 0 89185 40 4.6 4.4 -1.43 0.27 1.0 0 1.0 0 90193 40 4.8 4.9 -0.09 0.25 1.2 0 1.2 0 91140 40 3.5 3.3 -2.97 0.26 0.8 -1 0.9 0 92161 40 4.0 4.0 -1.67 0.25 0.9 0 0.8 0 94189 40 4.7 4.4 -1.11 0.25 0.9 0 1.1 0 95184 40 4.6 4.6 -0.97 0.25 0.7 -1 0.7 -1 99203 40 5.1 5.3 2.19 0.32 0.9 0 0.8 0 100160 40 4.0 3.6 -1.65 0.26 1.4 1 1.3 1 102141 40 3.5 3.3 -4.35 0.29 1.5 1 1.4 1 103274 40 6.8 6.9 6.30 0.45 0.6 -1 0.4 -1 104156 40 3.9 4.0 -2.41 0.29 1.6 2 1.5 1 105152 40 3.8 4.2 -2.36 0.34 1.1 0 1.2 0 107117 40 2.9 3.2 -5.98 0.44 1.1 0 1.7 1 108107 40 2.7 2.5 -6.77 0.40 0.9 0 1.1 0 109101 22 4.6 4.6 -1.38 0.35 1.5 1 1.9 2 110128 40 3.2 3.0 -4.33 0.28 1.3 1 1.2 0 112200 40 5.0 5.2 1.40 0.27 1.2 0 1.2 0 114176 40 4.4 4.7 -0.86 0.29 0.9 0 0.9 0 115189 40 4.7 5.1 0.99 0.28 0.7 -1 0.7 -1 117214 40 5.3 5.3 0.78 0.22 1.9 3 1.9 3 118186 40 4.7 4.6 -1.27 0.26 0.4 -3 0.4 -3 119167 40 4.2 3.7 -2.12 0.26 0.7 -1 0.7 -1 120
Obsvd Obsvd Obsvd Fair Model Infit OutfitScore Count Average Avrge Measure S.E. MnSq Std MnSq Std Num
186.9 39.7 4.7 4.7 -0.10 0.28 1.0 -0.3 1.0 -0.2 Mean34.4 2.0 0.8 0.9 2.38 0.04 0.3 1.5 0.3 1.4 S.D.
RMSE 0.28 Adj S.D. 2.36 Separation 8.31 Reliability 0.99Fixed (all same) chi-square: 5248.24 d.f.: 89 significance: .00Random (normal) chi-square: 88.53 d.f.: 88 significance: .46
265

Appendices
(ii) Raters
Obsvd Obsvd Obsvd Fair Model Infit OutfitScore Count Average Avrge Measure S.E. MnSq Std MnSq Std Rater
728 180 4.0 4.2 0.54 0.14 0.9 0 0.9 0 3795 180 4.4 4.7 -0.30 0.12 0.7 -3 0.7 -3 7826 160 5.2 5.4 0.14 0.12 1.2 1 1.2 1 12278 160 4.6 4.7 -0.29 0.25 0.9 0 0.9 0 28786 160 4.9 5.0 -0.23 0.13 0.9 0 0.9 0 32752 160 4.7 5.2 -0.96 0.11 1.0 0 1.0 0 36816 160 5.1 4.8 0.00 0.11 1.1 0 1.1 0 37818 180 4.5 5.0 -1.73 0.12 0.8 -1 0.8 -1 38722 140 5.2 5.1 -0.73 0.13 0.7 -2 0.6 -2 39940 180 5.2 5.0 0.12 0.12 1.0 0 1.1 0 43702 180 3.9 3.8 1.96 0.16 0.8 -1 0.8 -1 45398 100 4.0 4.0 0.67 0.20 1.1 0 1.1 0 46735 171 4.3 4.5 -2.40 0.15 0.9 -1 0.9 0 48
1062 191 5.6 5.0 -0.12 0.13 1.0 0 1.1 0 50880 180 4.9 4.7 0.12 0.13 0.9 0 0.9 0 52723 160 4.5 4.4 0.58 0.16 1.3 2 1.3 2 56898 180 5.0 5.1 1.09 0.13 0.7 -3 0.7 -2 67760 180 4.2 4.1 2.84 0.16 1.1 0 1.3 1 70711 160 4.4 4.5 -0.31 0.13 1.0 0 1.0 0 72785 151 5.2 5.3 0.04 0.14 1.4 2 1.6 3 82798 180 4.4 4.9 -1.55 0.15 1.2 1 1.2 1 83906 180 5.0 4.7 0.50 0.12 1.0 0 1.0 0 89
Obsvd Obsvd Obsvd Fair Model Infit OutfitScore Count Average Avrge Measure S.E. MnSq Std MnSq Std Num
764.5 162.4 4.7 4.7 -0.00 0.14 1.0 -0.2 1.0 -0.1 Mean160.5 29.4 0.4 0.4 1.12 0.03 0.2 1.7 0.2 1.6 S.D.
RMSE 0.15 Adj S.D. 1.11 Separation 7.60 Reliability 0.98Fixed (all same) chi-square: 1276.67 d.f.: 21 significance: .00Random (normal) chi-square: 20.98 d.f.: 20 significance: .40
266

Appendices
(iii) Items
Obsvd Obsvd Obsvd Fair Model Infit OutfitScore Count Average Avrge Measure S.E. MnSq Std MnSq Std Nu Item
834 179 4.7 4.6 0.14 0.13 1.1 0 1.1 0 1 DesF790 179 4.4 4.4 0.87 0.13 0.7 -2 0.7 -2 2 DesG786 179 4.4 4.3 0.93 0.13 1.1 0 1.1 0 3 DesV782 180 4.3 4.3 1.07 0.13 0.7 -3 0.7 -2 4 NarG800 180 4.4 4.4 0.77 0.13 0.9 -1 0.9 -1 5 NarV813 180 4.5 4.5 0.56 0.13 1.3 2 1.5 3 6 NarC846 177 4.8 4.8 -0.20 0.13 1.0 0 1.0 0 7 RPF782 177 4.4 4.4 0.86 0.13 0.7 -3 0.7 -3 8 RPG876 177 4.9 5.0 -0.70 0.13 1.5 3 1.6 4 9 RPI843 178 4.7 4.7 -0.08 0.13 0.9 0 0.9 0 10 Exp1F820 178 4.6 4.6 0.30 0.13 0.9 0 0.9 0 11 Exp1V841 178 4.7 4.7 -0.05 0.13 1.1 1 1.2 1 12 Exp1C865 177 4.9 4.9 -0.52 0.13 0.7 -2 0.8 -1 13 Exp2F834 177 4.7 4.7 -0.01 0.13 0.7 -2 0.7 -2 14 Exp2V847 177 4.8 4.8 -0.22 0.13 1.0 0 1.0 0 15 Exp2C894 180 5.0 5.0 -0.76 0.13 0.8 -1 0.8 -1 16 DisF837 180 4.7 4.6 0.17 0.13 0.7 -2 0.7 -2 17 DisG884 180 4.9 4.9 -0.60 0.13 1.7 5 1.6 4 18 DisI843 180 4.7 4.7 0.07 0.13 0.5 -5 0.6 -4 19 CommEf
1002 180 5.6 5.7 -2.60 0.13 1.4 3 1.3 1 20 Comp
Obsvd Obsvd Obsvd Fair Model Infit OutfitScore Count Average Avrge Measure S.E. MnSq Std MnSq Std Nu Item
841.0 178.6 4.7 4.7 0.00 0.13 1.0 -0.5 1.0 -0.3 Mean (Cou49.0 1.3 0.3 0.3 0.81 0.00 0.3 2.7 0.3 2.5 S.D.
RMSE 0.13 Adj S.D. 0.80 Separation 6.21 Reliability 0.97Fixed (all same) chi-square: 757.68 d.f.: 19 significance: .00Random (normal) chi-square: 18.98 d.f.: 18 significance: .39
267

Appendices
B Tape data(i) Candidates
Obsvd Obsvd Obsvd Fair Model Infit OutfitScore Count Average Avrge Measure S.E. MnSq Std MnSq Std Cand
206 50 4.1 4.2 -0.82 0.25 0.9 0 1.3 1 1273 50 5.5 5.4 1.94 0.29 0.9 0 1.0 0 2261 50 5.2 5.3 1.06 0.21 1.3 1 1.5 2 3222 50 4.4 4.7 -0.08 0.22 1.4 1 1.4 1 4205 50 4.1 4.1 -0.88 0.25 1.3 1 1.3 1 5218 50 4.4 4.4 -0.29 0.20 0.6 -2 0.6 -2 7258 50 5.2 5.3 0.82 0.22 0.9 0 0.9 0 9186 50 3.7 4.3 -0.75 0.19 0.7 -1 0.8 -1 10200 49 4.1 4.0 -1.82 0.28 1.8 2 1.8 2 12261 50 5.2 5.7 1.89 0.22 0.7 -2 0.7 -2 13208 50 4.2 3.9 -1.16 0.24 1.5 1 1.6 2 14185 50 3.7 3.7 -1.68 0.27 1.1 0 1.1 0 15301 50 6.0 6.3 5.40 0.24 1.5 2 1.4 1 16245 50 4.9 4.8 1.07 0.24 0.8 -1 0.7 -1 17197 50 3.9 4.0 -1.74 0.25 1.6 2 1.5 2 18241 50 4.8 4.6 0.31 0.24 0.7 -1 0.7 -1 20323 50 6.5 6.5 5.50 0.31 0.9 0 1.0 0 21227 50 4.5 4.4 -0.32 0.19 0.6 -2 0.6 -2 22227 50 4.5 3.6 -1.40 0.18 1.4 1 1.4 1 23293 50 5.9 6.2 2.57 0.23 0.8 0 0.9 0 24238 50 4.8 4.5 0.34 0.22 0.5 -2 0.5 -3 25267 50 5.3 5.7 4.03 0.24 1.2 0 1.2 0 26205 50 4.1 3.9 -0.79 0.26 0.5 -2 0.6 -2 27210 50 4.2 4.0 -1.18 0.24 1.1 0 1.1 0 28239 50 4.8 5.2 0.93 0.22 1.1 0 1.2 1 29221 50 4.4 4.4 0.18 0.25 0.8 0 0.8 0 30230 50 4.6 4.7 0.08 0.21 0.8 -1 0.7 -1 32208 50 4.2 4.2 -0.79 0.23 1.4 1 1.5 1 33244 50 4.9 4.9 -0.08 0.19 0.8 -1 0.7 -1 35181 50 3.6 2.8 -1.92 0.18 0.8 0 0.8 0 36254 50 5.1 5.2 0.73 0.23 0.8 -1 0.7 -1 37220 50 4.4 4.5 0.23 0.23 1.2 0 1.2 0 38175 50 3.5 3.5 -3.09 0.27 0.9 0 0.9 0 39217 50 4.3 4.2 0.02 0.27 1.0 0 1.0 0 40286 50 5.7 5.6 2.44 0.24 1.0 0 1.1 0 41250 50 5.0 4.8 0.93 0.22 0.8 0 0.8 0 42200 50 4.0 4.3 -0.48 0.21 1.1 0 1.2 0 43205 50 4.1 4.1 -1.60 0.25 0.9 0 0.9 0 44248 50 5.0 5.1 0.81 0.24 1.5 1 1.5 2 45334 50 6.7 6.7 5.76 0.31 0.8 -1 0.8 -1 47203 50 4.1 2.9 -2.08 0.20 1.3 1 1.4 1 48249 50 5.0 5.5 1.30 0.22 0.9 0 0.9 0 50314 50 6.3 6.2 6.76 0.35 1.1 0 1.2 0 51194 50 3.9 4.0 -0.88 0.28 1.0 0 0.8 0 53210 50 4.2 4.1 -0.72 0.22 1.3 1 1.3 1 55271 50 5.4 5.6 2.86 0.25 0.4 -4 0.4 -3 56321 50 6.4 6.6 6.44 0.28 1.1 0 1.1 0 57253 50 5.1 5.0 0.77 0.18 0.8 -1 0.8 -1 59304 50 6.1 6.4 2.98 0.26 1.2 0 1.4 1 61200 50 4.0 4.0 -1.24 0.28 1.1 0 1.0 0 65
268

Appendices
Tape data – candidates (continued)
Obsvd Obsvd Obsvd Fair Model Infit OutfitScore Count Average Avrge Measure S.E. MnSq Std MnSq Std Cand
247 50 4.9 5.1 1.95 0.24 0.9 0 0.9 0 66231 50 4.6 4.3 -0.55 0.23 1.1 0 1.0 0 67254 50 5.1 4.8 1.98 0.26 1.0 0 1.0 0 68260 50 5.2 5.5 1.99 0.27 0.4 -3 0.4 -3 71168 50 3.4 3.5 -2.43 0.25 0.8 0 0.9 0 72218 50 4.4 4.3 -0.11 0.25 1.0 0 0.9 0 73195 50 3.9 4.0 -1.03 0.23 1.6 2 1.4 1 74185 50 3.7 2.7 -2.40 0.19 0.8 0 0.8 0 75223 50 4.5 4.4 -0.12 0.21 0.9 0 0.9 0 77212 50 4.2 4.6 1.11 0.28 0.7 -1 0.8 0 78195 50 3.9 3.6 -2.26 0.24 0.6 -1 0.5 -1 79224 50 4.5 4.3 -0.41 0.26 0.8 0 0.9 0 80308 50 6.2 6.4 4.34 0.27 0.8 0 0.8 0 81222 50 4.4 4.3 -0.54 0.21 1.2 0 1.2 0 85198 50 4.0 4.2 -1.72 0.22 0.8 -1 1.0 0 86253 50 5.1 5.1 1.29 0.22 0.6 -2 0.7 -1 88260 50 5.2 4.9 0.98 0.23 0.8 -1 0.8 -1 89201 50 4.0 4.0 -1.14 0.26 0.7 -1 0.7 -1 90102 23 4.4 4.3 -0.38 0.29 0.7 -1 0.7 -1 91191 50 3.8 3.8 -1.61 0.23 0.9 0 0.9 0 92154 44 3.5 3.7 -2.56 0.24 1.3 1 1.3 1 94204 50 4.1 4.4 -0.45 0.18 0.4 -3 0.4 -3 95197 50 3.9 4.1 -1.30 0.27 1.0 0 1.0 0 99190 50 3.8 3.9 -1.09 0.28 1.5 1 1.5 1 100144 44 3.3 3.2 -3.11 0.26 1.5 1 1.5 1 102206 50 4.1 3.0 -1.61 0.19 1.2 0 1.2 0 103298 50 6.0 6.3 4.13 0.25 1.4 2 1.5 2 104211 50 4.2 4.1 -1.24 0.26 0.7 -1 0.7 -1 105163 50 3.3 3.4 -3.57 0.29 0.7 -1 0.7 -1 107135 50 2.7 2.4 -4.27 0.22 0.9 0 1.0 0 108143 50 2.9 2.0 -4.53 0.20 0.9 0 1.0 0 109241 50 4.8 5.4 0.46 0.23 0.8 -1 0.8 -1 110143 41 3.5 3.1 -3.30 0.22 1.2 0 1.1 0 112243 50 4.9 5.0 1.56 0.23 1.0 0 1.0 0 114222 50 4.4 4.3 -0.38 0.21 0.6 -2 0.5 -2 115201 50 4.0 3.9 -2.31 0.20 1.3 1 1.4 1 117236 50 4.7 4.7 0.30 0.19 0.3 -4 0.4 -4 118172 50 3.4 3.4 -2.39 0.21 0.6 -2 0.6 -2 119213 50 4.3 4.5 -0.31 0.21 0.7 -1 0.7 -1 120
Obsvd Obsvd Obsvd Fair Model Infit OutfitScore Count Average Avrge Measure S.E. MnSq Std MnSq Std Num
224.2 49.4 4.5 4.5 0.06 0.24 1.0 -0.3 1.0 -0.3 Mean44.4 3.1 0.8 1.0 2.28 0.03 0.3 1.6 0.3 1.6 S.D.
RMSE 0.24 Adj S.D. 2.27 Separation 9.48 Reliability 0.99Fixed (all same) chi-square: 7155.40 d.f.: 87 significance: .00Random (normal) chi-square: 86.78 d.f.: 86 significance: .46
269

Appendices
(ii) Raters
Obsvd Obsvd Obsvd Fair Model Infit OutfitScore Count Average Avrge Measure S.E. MnSq Std MnSq Std Rater
1033 250 4.1 4.0 0.97 0.13 1.3 2 1.2 2 3987 225 4.4 4.6 -0.94 0.12 0.9 -1 0.9 -1 7
1219 250 4.9 5.0 -1.05 0.11 1.3 3 1.3 3 12646 125 5.2 4.3 2.00 0.15 1.2 1 1.2 1 28930 194 4.8 4.8 -1.53 0.13 0.9 0 0.9 0 32780 163 4.8 4.5 0.17 0.11 0.9 -1 0.9 0 36874 200 4.4 4.8 0.06 0.10 0.8 -1 0.8 -1 37
1237 247 5.0 5.2 0.50 0.10 0.8 -1 0.9 0 381009 225 4.5 4.3 0.74 0.09 0.6 -5 0.6 -4 39995 225 4.4 4.6 -0.51 0.11 1.1 1 1.1 1 43
1056 250 4.2 4.0 1.16 0.11 0.8 -2 0.8 -2 45349 85 4.1 4.6 -0.63 0.18 1.2 1 1.2 1 46824 200 4.1 4.1 -0.12 0.14 1.0 0 1.1 0 48736 169 4.4 4.2 0.17 0.13 1.0 0 1.0 0 50895 200 4.5 4.4 0.18 0.10 0.8 -2 0.8 -2 52851 200 4.3 3.9 1.61 0.13 0.7 -3 0.7 -3 56
1019 224 4.5 4.6 0.02 0.14 0.9 -1 0.9 -1 67839 200 4.2 4.1 0.38 0.14 1.1 1 1.1 0 70933 197 4.7 4.7 -0.43 0.11 1.1 0 1.1 0 72609 150 4.1 5.5 -3.34 0.10 1.2 1 1.2 1 82
1005 175 5.7 5.0 1.27 0.12 0.9 0 1.0 0 83903 197 4.6 4.6 -0.67 0.11 1.0 0 1.0 0 89
Obsvd Obsvd Obsvd Fair Model Infit OutfitScore Count Average Avrge Measure S.E. MnSq Std MnSq Std Num
896.8 197.8 4.5 4.5 -0.00 0.12 1.0 -0.4 1.0 -0.2 Mean193.0 40.7 0.4 0.4 1.14 0.02 0.2 2.0 0.2 1.9 S.D.
RMSE 0.12 Adj S.D. 1.13 Separation 9.28 Reliability 0.99Fixed (all same) chi-square: 2253.25 d.f.: 21 significance: .00Random (normal) chi-square: 21.02 d.f.: 20 significance: .40
270

Appendices
(iii) Items
Obsvd Obsvd Obsvd Fair Model Infit OutfitScore Count Average Avrge Measure S.E. MnSq Std MnSq Std Nu Item
804 174 4.6 4.6 -0.24 0.12 1.0 0 1.0 0 21 TDes1F772 174 4.4 4.4 0.25 0.12 0.8 -1 0.8 -1 22 TDes1G781 174 4.5 4.5 0.11 0.12 1.2 1 1.3 2 23 TDes1V748 174 4.3 4.3 0.61 0.12 0.8 -2 0.8 -1 24 TNarG779 174 4.5 4.5 0.14 0.12 0.8 -1 0.9 0 25 TNarV794 174 4.6 4.6 -0.09 0.12 1.1 1 1.2 1 26 TNarC787 172 4.6 4.6 -0.08 0.12 1.0 0 0.9 0 27 TSumF722 172 4.2 4.2 0.92 0.13 0.7 -3 0.7 -3 28 TSumG722 172 4.2 4.2 0.92 0.13 0.9 0 0.8 -1 29 TSumV789 171 4.6 4.6 -0.20 0.12 1.2 1 1.3 2 30 TRPF733 171 4.3 4.2 0.67 0.12 0.7 -2 0.8 -1 31 TRPG835 171 4.9 4.9 -0.90 0.12 1.5 3 1.6 4 32 TRPI800 173 4.6 4.6 -0.22 0.12 0.9 0 1.0 0 33 TExpF773 173 4.5 4.4 0.19 0.12 0.9 0 0.9 0 34 TExpV784 173 4.5 4.5 0.02 0.12 1.4 2 1.4 2 35 TExp833 176 4.7 4.7 -0.53 0.12 1.0 0 1.1 0 36 TInsF794 176 4.5 4.5 0.04 0.12 1.0 0 1.0 0 37 TInsV791 176 4.5 4.5 0.09 0.12 1.2 1 1.3 2 38 TInsC819 176 4.7 4.7 -0.33 0.12 1.0 0 1.0 0 39 TDisF787 176 4.5 4.5 0.15 0.12 0.5 -4 0.6 -4 40 TDisG877 176 5.0 5.0 -1.19 0.12 1.4 2 1.3 2 41 TDisI824 176 4.7 4.7 -0.40 0.12 0.8 -2 0.8 -1 42 TDes2F782 175 4.5 4.4 0.16 0.12 0.6 -4 0.6 -4 43 TDes2G801 176 4.6 4.5 -0.06 0.12 0.9 -1 0.9 0 44 TDes2V798 176 4.5 4.5 -0.02 0.12 0.6 -4 0.6 -4 45 TComm
Obsvd Obsvd Obsvd Fair Model Infit OutfitScore Count Average Avrge Measure S.E. MnSq Std MnSq Std Nu Item
789.2 174.0 4.5 4.5 -0.00 0.12 1.0 -0.6 1.0 -0.3 Mean34.1 1.8 0.2 0.2 0.47 0.00 0.3 2.3 0.3 2.3 S.D.
RMSE 0.12 Adj S.D. 0.46 Separation 3.73 Reliability 0.93Fixed (all same) chi-square: 367.96 d.f.: 24 significance: .00Random (normal) chi-square: 23.98 d.f.: 23 significance: .40
271

Appendices
C Combined data(i) Candidates
Obsvd Obsvd Obsvd Fair Model Infit OutfitScore Count Average Avrge Measure S.E. MnSq Std MnSq Std Cand
378 90 4.2 4.3 -0.49 0.16 0.8 -1 0.9 0 1494 90 5.5 5.4 2.02 0.17 0.6 -3 0.6 -2 2502 90 5.6 5.5 1.53 0.14 1.1 0 1.2 1 3368 90 4.1 4.4 -0.77 0.17 1.3 2 1.3 1 4365 87 4.2 4.3 -0.43 0.18 1.0 0 1.0 0 5396 90 4.4 4.5 -0.06 0.15 0.9 0 0.9 0 7461 90 5.1 5.2 1.52 0.16 0.9 0 1.0 0 9393 90 4.4 4.4 -0.30 0.14 0.9 0 1.0 0 10353 89 4.0 4.0 -2.14 0.20 1.4 2 1.4 1 12460 90 5.1 5.1 1.52 0.15 0.9 0 0.9 0 13375 90 4.2 3.9 -0.85 0.17 1.3 1 1.3 1 14335 90 3.7 3.6 -2.18 0.18 1.1 0 1.1 0 15553 90 6.1 6.0 3.84 0.17 1.3 1 1.2 1 16422 90 4.7 4.9 0.92 0.17 0.7 -2 0.7 -2 17377 90 4.2 4.2 -1.16 0.17 1.4 2 1.4 2 18441 90 4.9 4.7 0.09 0.15 0.8 -1 0.8 -1 20580 90 6.4 6.5 5.07 0.22 1.1 0 1.3 1 21411 90 4.6 4.6 -0.02 0.14 0.7 -2 0.7 -2 22426 90 4.7 4.6 -0.04 0.13 1.4 2 1.6 3 23500 90 5.6 5.6 1.56 0.15 1.0 0 1.1 0 24406 90 4.5 4.6 0.07 0.15 0.5 -3 0.7 -2 25525 90 5.8 6.1 3.82 0.17 1.1 0 1.1 0 26373 90 4.1 4.1 -0.67 0.17 0.5 -4 0.5 -4 27385 90 4.3 4.0 -0.81 0.16 0.7 -1 0.7 -1 28468 90 5.2 5.2 1.77 0.16 1.1 0 1.1 0 29393 90 4.4 4.6 -0.06 0.17 0.8 -1 0.7 -1 30408 90 4.5 4.6 0.06 0.15 0.7 -2 0.7 -2 32380 90 4.2 4.2 -0.69 0.17 1.0 0 1.1 0 33442 90 4.9 4.8 0.89 0.15 0.7 -2 0.6 -2 35350 90 3.9 3.8 -1.03 0.14 0.9 0 0.9 0 36479 90 5.3 5.1 1.14 0.16 0.8 -1 0.9 0 37418 90 4.6 4.5 0.12 0.17 1.3 1 1.3 1 38341 90 3.8 3.8 -1.54 0.18 0.8 -1 0.9 -1 39392 90 4.4 4.2 -0.25 0.17 1.0 0 1.0 0 40500 90 5.6 5.5 2.26 0.17 0.8 -1 0.8 -1 41439 90 4.9 4.9 0.46 0.16 0.8 -1 0.9 -1 42379 90 4.2 4.4 -0.46 0.16 1.2 1 1.4 2 43388 90 4.3 4.3 -1.00 0.16 1.2 1 1.1 0 44452 90 5.0 5.1 0.99 0.15 1.6 3 1.7 3 45584 90 6.5 6.6 3.89 0.19 1.4 2 1.5 2 47312 90 3.5 3.2 -2.28 0.15 1.3 1 1.2 1 48491 90 5.5 5.7 1.92 0.15 1.0 0 1.0 0 50571 90 6.3 6.2 5.38 0.25 1.1 0 1.2 0 51352 90 3.9 3.8 -0.85 0.17 0.9 0 0.8 -1 53381 84 4.5 4.5 0.13 0.16 1.1 0 1.2 1 55504 90 5.6 5.6 2.48 0.17 0.5 -3 0.5 -3 56551 90 6.1 6.3 4.33 0.18 0.8 -2 0.7 -2 57463 90 5.1 5.1 1.35 0.15 0.9 -1 0.8 -1 59534 90 5.9 5.8 2.62 0.17 1.0 0 1.2 0 61
272

Appendices
Combined data – candidates data (continued)
Obsvd Obsvd Obsvd Fair Model Infit OutfitScore Count Average Avrge Measure S.E. MnSq Std MnSq Std Cand
374 90 4.2 4.1 -1.14 0.18 0.9 0 0.9 0 65451 90 5.0 5.2 2.00 0.16 0.7 -2 0.7 -2 66401 90 4.5 4.4 0.08 0.17 0.8 -1 0.8 -1 67415 90 4.6 4.4 -0.22 0.17 1.9 5 1.9 5 68462 90 5.1 5.4 1.57 0.16 0.9 0 0.8 -1 71363 90 4.0 4.1 -1.07 0.14 0.8 -1 0.8 -1 72413 90 4.6 4.7 0.13 0.14 0.8 -1 0.9 -1 73382 90 4.2 4.4 -0.34 0.17 1.4 2 1.4 2 74335 90 3.7 3.3 -1.86 0.16 0.9 0 0.9 0 75422 90 4.7 4.6 0.19 0.15 0.8 -1 0.8 -1 77391 90 4.3 4.6 0.68 0.18 0.6 -2 0.6 -2 78342 90 3.8 3.9 -1.80 0.18 0.7 -2 0.7 -2 79394 90 4.4 4.1 -0.50 0.18 0.8 -1 0.8 -1 80548 90 6.1 6.3 3.80 0.17 0.6 -3 0.7 -2 81418 90 4.6 4.5 -0.24 0.16 1.0 0 1.0 0 85390 90 4.3 4.3 -0.10 0.17 1.3 1 1.4 2 86414 90 4.6 4.8 0.53 0.14 1.0 0 0.9 0 88464 90 5.2 4.9 0.76 0.16 0.7 -2 0.7 -1 89386 90 4.3 4.3 -0.97 0.18 0.9 -1 0.9 -1 90295 63 4.7 4.5 -0.10 0.18 1.1 0 1.2 0 91331 90 3.7 3.6 -1.75 0.17 0.8 -1 0.8 -1 92315 84 3.8 3.8 -1.63 0.16 1.0 0 1.0 0 94393 90 4.4 4.4 -0.30 0.13 0.5 -4 0.5 -3 95381 90 4.2 4.3 -0.98 0.18 0.7 -1 0.8 -1 99393 90 4.4 4.3 0.24 0.17 2.0 5 2.0 4 100304 84 3.6 3.5 -1.96 0.18 1.3 2 1.3 1 102347 90 3.9 3.6 -1.54 0.14 1.2 1 1.2 1 103572 90 6.4 6.5 4.73 0.22 1.3 1 1.4 1 104367 90 4.1 4.0 -1.48 0.19 1.2 0 1.0 0 105315 90 3.5 3.6 -2.56 0.22 1.0 0 1.0 0 107252 90 2.8 2.9 -3.97 0.18 1.0 0 1.0 0 108250 90 2.8 2.1 -4.38 0.15 0.8 -1 0.8 -1 109342 72 4.8 4.8 0.22 0.18 1.1 0 1.6 2 110271 81 3.3 3.1 -3.54 0.17 1.3 1 1.2 0 112443 90 4.9 5.0 1.42 0.16 0.9 0 0.9 0 114398 90 4.4 4.5 -0.23 0.17 0.7 -2 0.8 -1 115390 90 4.3 4.2 -0.58 0.16 1.6 3 1.5 2 117450 90 5.0 5.0 0.60 0.14 0.9 0 1.1 0 118358 90 4.0 3.8 -1.76 0.15 0.6 -2 0.6 -3 119380 90 4.2 4.4 -0.62 0.16 0.9 0 0.9 0 120
Obsvd Obsvd Obsvd Fair Model Infit OutfitScore Count Average Avrge Measure S.E. MnSq Std MnSq Std Num
410.8 89.1 4.6 4.6 0.17 0.17 1.0 -0.3 1.0 -0.2 Mea72.8 3.7 0.8 0.8 1.88 0.02 0.3 1.9 0.3 1.9 S.D.
RMSE 0.17 Adj S.D. 1.87 Separation 11.20 Reliability 0.99Fixed (all same) chi-square: 9880.85 d.f.: 88 significance: .00Random (normal) chi-square: 87.83 d.f.: 87 significance: .45
273

Appendices
(ii) Raters
Obsvd Obsvd Obsvd Fair Model Infit OutfitScore Count Average Avrge Measure S.E. MnSq Std MnSq Std Rater
1761 430 4.1 4.0 0.71 0.09 1.0 0 1.0 0 31889 430 4.4 4.6 0.37 0.08 1.0 0 1.0 0 72045 410 5.0 4.9 -1.15 0.07 1.1 1 1.1 1 12924 185 5.0 4.4 1.39 0.12 1.1 0 1.1 0 28
1716 354 4.8 5.0 0.17 0.09 0.9 0 1.0 0 321532 323 4.7 4.6 -0.01 0.07 1.0 0 1.0 0 361805 385 4.7 4.7 0.54 0.08 1.3 3 1.3 3 372055 427 4.8 4.7 -0.22 0.07 0.9 0 0.9 0 381731 365 4.7 4.4 0.39 0.06 0.5 -7 0.5 -7 391935 405 4.8 4.8 0.24 0.08 1.0 0 1.1 0 431758 430 4.1 3.9 1.08 0.08 0.8 -2 0.9 -1 45747 185 4.0 4.2 0.25 0.12 1.1 0 1.1 0 46
1559 371 4.2 4.3 -1.84 0.09 1.1 1 1.1 1 481693 340 5.0 4.5 -0.30 0.08 0.7 -3 0.8 -3 501775 380 4.7 4.4 0.43 0.08 0.8 -3 0.8 -3 521574 360 4.4 4.1 1.30 0.10 0.9 0 0.9 0 561815 384 4.7 4.8 -0.83 0.09 0.7 -3 0.8 -2 671599 380 4.2 4.2 0.33 0.10 1.0 0 1.1 0 701644 357 4.6 4.3 0.00 0.08 1.1 1 1.1 1 721394 301 4.6 5.1 -1.61 0.08 1.5 5 1.7 6 821803 355 5.1 4.9 -0.15 0.09 1.0 0 1.1 1 831809 377 4.8 4.6 -1.07 0.08 1.1 0 1.1 0 89
Obsvd Obsvd Obsvd Fair Model Infit OutfitScore Count Average Avrge Measure S.E. MnSq Std MnSq Std Num
1662.0 360.6 4.6 4.5 -0.00 0.08 1.0 -0.3 1.0 -0.0 Mean305.0 64.9 0.3 0.3 0.84 0.01 0.2 2.7 0.2 2.7 S.D.
RMSE 0.09 Adj S.D. 0.84 Separation 9.82 Reliability 0.99Fixed (all same) chi-square: 2047.81 d.f.: 21 significance: .00Random (normal) chi-square: 20.98 d.f.: 20 significance: .40
274

Appendices
(iii) Items
Obsvd Obsvd Obsvd Fair Model Infit OutfitScore Count Average Avrge Measure S.E. MnSq Std MnSq Std Nu Item
824 177 4.7 4.5 -0.09 0.12 1.1 0 1.1 0 1 DesF780 177 4.4 4.3 0.50 0.12 0.8 -2 0.8 -1 2 DesG777 177 4.4 4.3 0.55 0.12 1.1 0 1.1 0 3 DesV773 178 4.3 4.2 0.66 0.12 0.7 -3 0.7 -2 4 NarG790 178 4.4 4.3 0.43 0.12 0.9 0 0.9 0 5 NarV802 178 4.5 4.4 0.26 0.12 1.2 1 1.3 2 6 NarC836 175 4.8 4.7 -0.39 0.12 1.0 0 1.0 0 7 RPF772 175 4.4 4.3 0.49 0.12 0.7 -2 0.7 -2 8 RPG864 175 4.9 4.9 -0.78 0.12 1.4 3 1.5 3 9 RPI833 176 4.7 4.6 -0.29 0.12 0.9 0 1.0 0 10 Exp1F810 176 4.6 4.5 0.03 0.12 1.0 0 1.0 0 11 Exp1V830 176 4.7 4.6 -0.25 0.12 1.1 1 1.2 1 12 Exp1C855 175 4.9 4.8 -0.65 0.12 0.8 -2 0.9 -1 13 Exp2F824 175 4.7 4.6 -0.23 0.12 0.7 -2 0.8 -2 14 Exp2V836 175 4.8 4.7 -0.39 0.12 1.0 0 0.9 0 15 Exp2C884 178 5.0 4.9 -0.84 0.12 0.8 -1 0.8 -1 16 DisF827 178 4.6 4.5 -0.07 0.12 0.7 -2 0.7 -2 17 DisG873 178 4.9 4.8 -0.69 0.12 1.6 4 1.6 4 18 DisI833 178 4.7 4.6 -0.15 0.12 0.6 -4 0.6 -3 19 CommEf989 178 5.6 5.6 -2.33 0.12 1.5 4 1.6 3 20 Comp814 176 4.6 4.5 -0.06 0.12 1.0 0 1.1 0 21 TDes1F781 176 4.4 4.3 0.38 0.12 0.8 -1 0.8 -1 22 TDes1G789 176 4.5 4.4 0.28 0.12 1.1 1 1.2 1 23 TDes1V756 176 4.3 4.2 0.72 0.12 0.8 -2 0.8 -1 24 TNarG787 176 4.5 4.4 0.30 0.12 0.8 -2 0.8 -1 25 TNarV804 176 4.6 4.5 0.08 0.12 1.1 0 1.1 1 26 TNarC797 174 4.6 4.5 0.08 0.12 1.1 0 1.1 0 27 TSumF730 174 4.2 4.1 0.99 0.12 0.8 -2 0.7 -2 28 TSumG730 174 4.2 4.1 0.99 0.12 1.0 0 1.0 0 29 TSumV799 173 4.6 4.5 -0.01 0.12 1.3 2 1.4 2 30 TRPF741 173 4.3 4.2 0.78 0.12 0.9 -1 1.0 0 31 TRPG844 173 4.9 4.8 -0.61 0.12 1.5 4 1.5 4 32 TRPI809 175 4.6 4.5 -0.02 0.12 0.9 0 1.0 0 33 TExpF781 175 4.5 4.4 0.35 0.12 0.9 0 1.0 0 34 TExpV794 175 4.5 4.4 0.18 0.12 1.3 2 1.4 2 35 TExp843 178 4.7 4.7 -0.32 0.11 1.1 0 1.1 0 36 TInsF802 178 4.5 4.4 0.22 0.11 1.0 0 1.0 0 37 TInsV799 178 4.5 4.4 0.26 0.11 1.2 1 1.2 1 38 TInsC827 178 4.6 4.6 -0.11 0.11 1.0 0 1.1 1 39 TDisF795 178 4.5 4.4 0.31 0.11 0.6 -3 0.7 -3 40 TDisG886 178 5.0 4.9 -0.89 0.12 1.3 2 1.3 2 41 TDisI834 178 4.7 4.6 -0.20 0.11 0.7 -2 0.8 -1 42 TDes2F791 177 4.5 4.4 0.31 0.11 0.6 -4 0.6 -4 43 TDes2G811 178 4.6 4.5 0.10 0.11 0.8 -1 0.8 -1 44 TDes2V807 178 4.5 4.4 0.15 0.11 0.6 -4 0.7 -3 45 TComm
Obsvd Obsvd Obsvd Fair Model Infit OutfitScore Count Average Avrge Measure S.E. MnSq Std MnSq Std Nu Item
812.5 176.3 4.6 4.5 0.00 0.12 1.0 -0.4 1.0 -0.2 Mean44.3 1.6 0.2 0.3 0.57 0.00 0.3 2.3 0.3 2.2 S.D.
RMSE 0.12 Adj S.D. 0.56 Separation 4.84 Reliability 0.96Fixed (all same) chi-square: 1054.98 d.f.: 44 significance: .00Random (normal) chi-square: 43.92 d.f.: 43 significance: .43
275
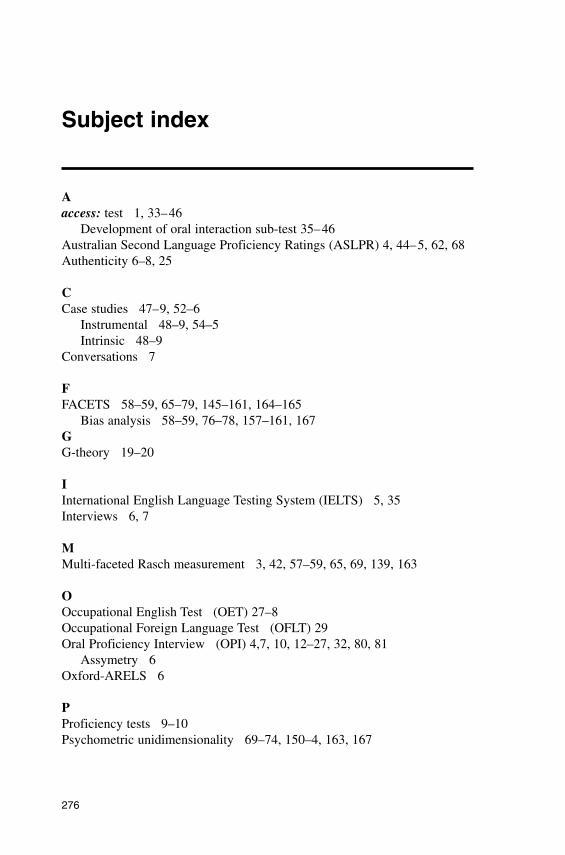
Subject index
Aaccess: test 1, 33–46
Development of oral interaction sub-test 35–46Australian Second Language Proficiency Ratings (ASLPR) 4, 44–5, 62, 68Authenticity 6–8, 25
CCase studies 47–9, 52–6
Instrumental 48–9, 54–5Intrinsic 48–9
Conversations 7
FFACETS 58–59, 65–79, 145–161, 164–165
Bias analysis 58–59, 76–78, 157–161, 167GG-theory 19–20
IInternational English Language Testing System (IELTS) 5, 35Interviews 6, 7
MMulti-faceted Rasch measurement 3, 42, 57–59, 65, 69, 139, 163
OOccupational English Test (OET) 27–8Occupational Foreign Language Test (OFLT) 29Oral Proficiency Interview (OPI) 4,7, 10, 12–27, 32, 80, 81
Assymetry 6Oxford-ARELS 6
PProficiency tests 9–10Psychometric unidimensionality 69–74, 150–4, 163, 167
276

Subject index
RRecorded Oral Proficiency Examination (ROPE) 5, 16Research
Different approaches 49–52, 170–171Reliability and validity 52–5
SSimulated Oral Proficiency Interview (SOPI) 6, 16–24, 26-32, 80–81Speaking tests 4–6
Direct 4–14Indirect 4, 6Semi-direct 5–11, 15–32
SPEAK test 24–25
TTest equivalence 16, 29, 68, 76, 79, 80–81, 100–101, 117–18, 130, 145–46,
154, 161–69Test in English for Educational Purposes (TEEP) 6, 28Test practicality 11–12Test processes 3, 56, 59–60, 117–144, 166
Rating 3, 126–27, 138–143Test design 3, 123–24, 126–32Test taking 3, 25-29, 122–24, 132–37
Test productsTest scores 3, 15–22, 56, 58–59Test taker language output 3, 22–23, 30, 56, 59, 80–116, 164–65
Test of Spoken English (TSE) 5, 15–16, 24Test reliability 10–11Test specifications 22, 35–46Test validity 6–11
Concurrent 2, 9, 12–22, 30, 36, 68, 169–170Construct 22, 24, 31, 170Content 25Face 25–29
UUniversity of Cambridge Local Examinations Syndicate (UCLES) 5
277

Author index
AAlderson 9, 26, 43
BBachman 12, 18, 21, 24, 25, 43Benson 49Berwick 31Brindley 36Brown 29
CCherryholmes 2, 51Cizek 148Clark 4, 5, 6, 7, 8, 9, 12, 13, 15, 16, 17, 26, 27Clifford 5, 13, 16
DDavies 43
FFilipi 31
GGardner 37, 38Goetz 52, 53Guba 50, 51, 54, 55
HHalliday 103, 102, 105, 106Hamilton 43Hamp-Lyons 29, 171Hasan 102, 103Hawthorne 33Hill 124, 135Hoejke 9, 24, 25Howe 51Hughes 6, 7, 10
278

Author index
IIngram 4, 12, 44
JJames 6, 11, 28, 29Johns-Lewis 101, 102, 103, 114, 115Johnson 2, 48, 49
KKenyon 17, 19, 21
LLabov 123Lazaraton 10, 11, 31, 169LeCompte 52, 53Li 17Linacre 42, 58, 65, 145Lincoln 51, 54, 55Linnell 9, 24, 25Lowe 5, 12, 13, 16Lumley 141Luoma 29, 30, 31Lynch 2, 29, 50, 51, 52, 59, 122, 123, 171
MMcNamara 27, 28, 58, 69, 70, 76, 77, 139, 154, 169Meddis 18Merriam 2, 47, 49, 50, 54Messick 171Morton 31, 139Moss 171Murray 31
NNeeson 31Nunan 2, 48, 49, 50, 52, 53
OO’Loughlin 62, 65, 68, 69, 75
PPerrett 17Phillips 50Pollitt 31
279

Authors index
RRaffaldani 17Ross 31
SSato 49Saville 31Savignon 43Sheorey 15, 16Shephard 177Shohamy 2, 3, 5, 17, 21, 22, 23, 24, 26, 29, 32, 36, 37, 56, 59, 80, 81–100,
103, 104, 114, 115, 165, 169Southard 15,16Spolsky 25, 171–173Stake 2, 48, 49, 53, 54Stansfield 6, 16, 17, 18, 19, 20, 27Stevenson 25, 27Stubbs 102, 103, 112Sunderland 149Swinton 15
UUnderhill 8, 10, 11Ure 101, 102, 103, 112, 113
Vvan Lier 6, 7, 9, 10, 17, 169
WWigglesworth 31, 42, 62, 65, 68, 69, 75, 77, 78, 139Williams 31Willis 105Wylie 4, 12, 44
YYin 2, 47, 48, 49
ZZora 101, 102, 103, 114, 115
280