the erlang c method for calculating the required number … · the erlang c method for calculating...
TRANSCRIPT

The Erlang C method for calculating the requirednumber of desk employees for outpatient clinics
Daphne Broedersz
September 22, 2014
Master thesis
Supervision VUmc: Gabriella Balke-Budai Ph.D. (PICA), Eveline Goldhoorn MScSupervision VU: Prof. Ger KooleSupervision UvA: Prof. Michel Mandjes
Korteweg-de Vries Institute for Mathematics
Faculty of Science
University of Amsterdam

AbstractIn this paper, the calculation of the required number of desk employees foroutpatient clinics with use of the Erlang C model is described. The paperstarts with a little introduction about the hospital and the case. Thereafter,the current process for the patient is analyzed and compared with the futureprocess. These two processes are different because of the changes the hos-pital is implementing. These changes will be made clear in the introductionchapter. After the analysis of the patient process, this paper continues withthe mathematical theory behind the Erlang C model. This theory belongsto the fields of Markov chains and queuing theory. In particular, the M |M |squeue is considered. After the description of the mathematical theory, thistheory is applied to the case at hand.
ParticularsTitle: The Erlang C method for calculating the required number of desk employees foroutpatient clinicsAuthor: Daphne Broedersz, [email protected], 6073077Supervisors VUmc: Gabriella Balke-Budai Ph.D. (PICA), Eveline Goldhoorn MScSupervisor VU: Prof. Ger KooleSupervisor UvA: Prof. Michel MandjesFinish date: September 22, 2014
Korteweg-de Vries Institute for MathematicsUniversity of AmsterdamScience Park 904, 1098 XH Amsterdamhttp://www.science.uva.nl/math
Contents
1 Introduction 31.1 VU university medical center . . . . . . . . . . . . . . . . . . . . . . . . . 31.2 The case . . . . . . . . . . . . . . . . . . . . . . . . . . . . . . . . . . . . 4
1.2.1 Optimal number of employees . . . . . . . . . . . . . . . . . . . . 41.2.2 Optimal number of consultations . . . . . . . . . . . . . . . . . . 5
1.3 Objective . . . . . . . . . . . . . . . . . . . . . . . . . . . . . . . . . . . 51.4 Research questions . . . . . . . . . . . . . . . . . . . . . . . . . . . . . . 5
1.4.1 Optimal number of employees . . . . . . . . . . . . . . . . . . . . 51.4.2 Optimal number of consultations . . . . . . . . . . . . . . . . . . 5
1.5 Approach of this paper . . . . . . . . . . . . . . . . . . . . . . . . . . . . 6
2 Process analysis 72.1 Current situation . . . . . . . . . . . . . . . . . . . . . . . . . . . . . . . 7
2.1.1 Process . . . . . . . . . . . . . . . . . . . . . . . . . . . . . . . . 72.1.2 Tasks . . . . . . . . . . . . . . . . . . . . . . . . . . . . . . . . . . 8
2.2 Future situation . . . . . . . . . . . . . . . . . . . . . . . . . . . . . . . . 92.2.1 Process . . . . . . . . . . . . . . . . . . . . . . . . . . . . . . . . 92.2.2 Tasks . . . . . . . . . . . . . . . . . . . . . . . . . . . . . . . . . . 10
3 Calculation methods 113.1 2004 model . . . . . . . . . . . . . . . . . . . . . . . . . . . . . . . . . . 113.2 Erlang C model . . . . . . . . . . . . . . . . . . . . . . . . . . . . . . . . 12
3.2.1 Markov chains . . . . . . . . . . . . . . . . . . . . . . . . . . . . . 123.2.2 Queuing theory . . . . . . . . . . . . . . . . . . . . . . . . . . . . 133.2.3 Application for this research . . . . . . . . . . . . . . . . . . . . . 19
4 Data analysis 214.1 Description of the Erlang C model . . . . . . . . . . . . . . . . . . . . . . 214.2 Data analysis . . . . . . . . . . . . . . . . . . . . . . . . . . . . . . . . . 234.3 Model analysis . . . . . . . . . . . . . . . . . . . . . . . . . . . . . . . . 25
5 Results and conclusions 305.1 Registration desk H . . . . . . . . . . . . . . . . . . . . . . . . . . . . . . 31
5.1.1 Obstetrics & Gynecology desk . . . . . . . . . . . . . . . . . . . . 315.1.2 Reproductive Endocrinology and Infertility desk . . . . . . . . . . 325.1.3 Combining the desks . . . . . . . . . . . . . . . . . . . . . . . . . 34
5.2 IVF appointment desk . . . . . . . . . . . . . . . . . . . . . . . . . . . . 36
6 Optimal number of consultations 39
1

A Standard model 42
B Combined results model 48
C One desk model 53
D Example: Internal Medicine 56
2

Chapter 1
Introduction
1.1 VU university medical center
VU university medical center (VUmc)1, located in Amsterdam, is one of eight academicmedical centers in the Netherlands, meaning that research, education, and health caremeet at VUmc. It was founded in 1964 and officially opened as the VU hospital in 1966.The merger of the medical faculty and the hospital in 2001 caused the name to changeto VUmc. The academic profile of VUmc is reflected in the tertiary clinical care andtertiary referral-center care offered by VUmc. This consists of care offered to patientssuffering from rare diseases and to those who require intensive and complex care. VUmchas a capacity of 733 beds, and houses 6,810 employees. The outpatient clinics of VUmcserve 335,037 patients on an annual basis, of which 119,319 are new patients [4].
Patient flow Improvement Center Amsterdam (PICA) is the result of the coop-eration of VUmc and the VU University (VU)2. In particular, it is a cooperation betweenVUmc and the research group Optimization of Business processes (OBP)3, started byProf. Ger Koole.
Together with the Academic Medical Center (AMC)4, also located in Amsterdam,VUmc is working on the acquisition, adjustment, implementation, and the managementof a new electronic health record (EHR). This collaboration resulted in the program EHRVUmc AMC (EVA). EVA’s primary goal is to implement the EHR, and to combine thiswith multiple health care process improvements.
Simultaneous to this project runs the project ‘central registration’. This projectfocuses on the establishment of a central desk for registration. At the moment, a patientregisters as a new patient at every outpatient clinic he/she attends. The introduction ofa central desk for registration will put an end to this, since then, the patient only hasto register once at the central desk, and can then attend every outpatient clinic. Theintention is to employ the central desk for registration the moment VUmc starts withEVA.
Among other things, the implementation of the EHR and the central desk forregistration will cause changes in the tasks of the medical administration employees(MMA’s)5. An example of a task that is going to disappear is the creating of paper
1VUmc stands for ‘VU medisch centrum’2VU stands for ‘Vrije Universiteit’3OBP stands for ‘Optimalisatie van Bedrijfsprocessen’4AMC stands for ‘Academisch Medisch Centrum’5MMA stands for ‘medewerkers medische administratie’
3
medical records. Supporting a doctor administratively could be a new task.
1.2 The case
In October 2015, VUmc will start using an EHR. Simultaneously, the registration atthe outpatient clinics will shift from a decentralized method to a centralized one. Thetasks of the MMA’s at the outpatient clinics will change due to the implementation ofthe EHR and the central desk for registration. Tasks that are going to disappear arethe preparation of the consultations (paper work, readying medical records, etc.), theafter-care of the consultations, the entering of medical performance files in the computerand the registering of new patients. The latter does not truly disappear, but it will shiftto the central desk in the entrance hall of the outpatient clinics building. However, thecentral desk for registration is not part of this research, so the registration of new patientswill be considered out of scope.
This research consists of two parts. The first part focuses on the number ofMMA’s needed at the desk in the future situation, given the number of patients on anaverage day. The second part reverses this, focusing on the number of consultations thatneed to be held per MMA at the desk to achieve an efficiency that is as high as possible.Both parts will prioritize the interest of the patients, maintaining an acceptable servicelevel and a minimal average waiting time. In the subsections below, the two parts willbe described more accurately.
1.2.1 Optimal number of employees
In 2004, a straightforward model to calculate the required amount of full-time equivalentshas been constructed. For every outpatient clinic, data of that year has been put in anoverview table, as input for this model. This data contains, among other things, thenumber of first consultations, the number of repeat consultations, and the number oftelephonic consultations. A table with the time span per task has been added to thisoverview, and the data and this table have been used to calculate the amount of full-timeequivalents needed per task per outpatient clinic. Then, the results were compared to thereality. During this research, at first the same method was being used for the period 2010-2013. In 2013, the project manager implementation and the P&O department advisor ofEVA conducted a new time measurement at the outpatient clinics General Surgery (GS),Ophthalmology (OPT), Obstetrics & Gynecology (O&G), and Oral and MaxillofacialSurgery (OMS). Therefore, this research started with applying the method to these fouroutpatient clinics, and, should the results be desirable, would continue with the otherones. After applying the method for the current situation, the table with the time spanper task would then be adapted to the future situation (with the tasks that are goingto disappear removed). This new table would be used to make an estimation of thereduction of full-time equivalents when VUmc starts with EVA.
Obviously, the method described above is a strongly simplified representationof the reality. With the use of queuing theory and extensive data analysis, a bettermethod can be constructed. The method used in this research is the Erlang C model,with a Poisson arrival rate and exponential service times. This model can be used tocalculate the waiting times of patients and the utilization factor of the MMA’s at thedesk, depending on the desk occupation. This way, the most efficient desk occupationcan be determined.
4

1.2.2 Optimal number of consultations
As said in the beginning of this section, the second part of this research reverses thefirst part somewhat. The first part focuses on the required number of desk employees,given the number of patients, while the second part focuses on the required number ofsimultaneously held visiting hours, given the number of desk employees. Again withthe use of the Erlang C model, a method for calculating the number of visiting hoursneeded to achieve the highest possible efficiency of a given number of desk employees isdeveloped. This method can then be used to see what the consequences for the (possible)productivity are when the number of desk employees changes.
1.3 Objective
The objective of this research is to increase the efficiency of the MMA’s at the desk asmuch as possible, while maintaining an acceptable service level, for the future situation,so after the implementation of EVA. With the help of data analysis and the Erlang Cmodel, the required number of MMA’s can be determined, given the number of patientsthat come to the outpatient clinics. Reversibly, it can be calculated how many patientsare needed per MMA to ensure a high efficiency for this employee. This can be used todetermine how many consultations there should be held to achieve this efficiency.
1.4 Research questions
1.4.1 Optimal number of employees
Based on the case and objective described above, the main question for the first part isas follows, formulated per outpatient clinic:
In the future situation, how many MMA’s are needed at the desk to achieve the highestpossible efficiency, while maintaining an acceptable service level, given that the numberof consultations remains the same?
To answer the main question, the following sub-questions are needed:
1. What are the current tasks of the MMA’s and what will change with the start ofEVA? (Ch. 2)
2. How many patients attend the outpatient clinic on an average day? (Ch. 4 andch. 5)
3. What number of these patients will make a new appointment after their consulta-tion? (Ch. 4 and ch. 5)
1.4.2 Optimal number of consultations
Based on the case and objective described above, the research question for the secondpart is as follows, formulated per outpatient clinic:
5

How many consultations should there be held per MMA at the desk in the future situ-ation to achieve the highest possible efficiency, keeping the following criteria in mind:
- The service level.
- The number of patients attending the outpatient clinic.
1.5 Approach of this paper
In this section, the approach of this paper is briefly described.This paper starts off at Chapter 2 with a description of the process for a patient
visiting the outpatient clinic. In this chapter, both the current and the future situationare discussed. For both situations, the tasks of the MMA’s are also listed.
In Chapter 3, the calculation methods are discussed. It begins with a moredetailed description of the model developed in 2004, and it then continues with theErlang C model. Firstly, the required mathematical theory in the field of Markov chainsis explained. Secondly, the mathematical theory behind the Erlang C model is depicted.This theory belongs to the field of queuing theory. Lastly, it will be clarified how themathematics can be used for this research in particular.
After the description of the Erlang C model and its application, this paper con-tinues with the data analysis done for this research in Chapter 4. In this chapter, theErlang C model is described in more detail, and with help of the model developed inExcel, it is analyzed which data to use as input.
In Chapter 5, part of the results and conclusions for the first part of this researchis depicted with use of an example, the outpatient clinic Obstetrics & Gynecology. Thischapter also contains a description of the other models made in Excel.
After the conclusion of the first part of this research in Chapter 5, Chapter 6contains the second part. In this chapter, the model developed for the second part of thisresearch is shown with use of an example.
In appendices A, B and C, the models used in Chapters 4 and 5 are describedin detail, with images of the Excel sheets. Appendix D, finally, contains the results andconclusions of another example outpatient clinic for the first part of this research.
6

Chapter 2
Process analysis
In this chapter, a sketch of the current situation and the future situation of the processfor the patient is given. Section 2.1 is about the current situation and section 2.2 depictsthe changes that accompany the start of EVA.
2.1 Current situation
2.1.1 Process
When a patient attends an outpatient clinic for the first time, he/she has to be registeredat that clinic. This has to be done at every outpatient clinic the patient attends forthe first time. Some outpatient clinics have a desk solely for registration and at theothers, the registration takes place at a desk with multiple functionalities. At the deskwhere the patient is being registered, the particulars of that patient are being verifiedand, if necessary, completed. After that, the medical record for that patient is created.Currently, this record is a paper file. If there is a registration desk, the patient takesthis file to another desk; the desk belonging to the corresponding specialism. There,the patient reports that he/she is present, and the MMA at the desk records this in thecomputer. After that, the file is prepared and put on a shelf for the doctor to pick upwhen needed. The patient is then told to wait until the doctor calls him/her. If theregistration takes place at a desk with multiple functionalities, the patient does not haveto go to another desk. Instead, he/she is directed to the waiting area straight away, andthe file is put on the right shelf. Patients that have attended the outpatient clinic before,go straight to the desk belonging to the corresponding specialism to report their presence.They do not have to verify their particulars at the registration desk, and their medicalrecords are already prepared; these only have to be put on the right shelf as soon as thepatient checks in.
When the consultation is finished and a new appointment has to be made, the pa-tient returns to the desk belonging to the specialism. At that desk, the new appointmentis made and directly registered in the computer. If the consultation was the patient’s finalconsultation, the patient does not have to return to the desk. When the MMA regainsthe medical record, the papers are sorted out, and, if necessary, additional information isregistered in the computer. It is also possible to send papers internally to other outpa-tient clinics when needed, and often, an informative letter is filled out for the referrer ofthe patient (for example, the patient’s general practitioner).
7

Figure 2.1: Flowchart of the process in the current situation.
2.1.2 Tasks
As described in the description of the process of attending an outpatient clinic above, thetasks of the MMA’s are as follows:
• Registering new patients.
• Recording the check-in of patients.
• Making new appointments.
• Preparing the consultations.
• Sorting out medical records after the consultations.
• Registering additional information in the computer and sending papers to the cor-responding outpatient clinics, if necessary.
• If needed, filling out an informative letter for the patient’s referrer.
The first three tasks are front office tasks, the others are back office tasks.
8

2.2 Future situation
2.2.1 Process
With the implementation of an EHR and central desk for registration, the process ofattending an outpatient clinic changes. When a patient that has never attended any ofthe outpatient clinics before attends an outpatient clinic for the first time, he/she has tobe registered at the central desk located in the entrance hall of the building. There, theparticulars of the patient are being verified and, if necessary, completed. After that, themedical record for that patient is created. This record will then no longer be a paper file,but an electronic one. The patient is recorded present in the computer and the MMAdirects him/her to the waiting area belonging to the correct specialism. Patients that haveattended one of the outpatient clinics before (it does not have to be the same outpatientclinic), go to one of the registration columns in the entrance hall to check themselves in.The column then tells the patient how long the approximate waiting time is and whereto wait. The medical records are stored in the computer, so the corresponding doctorhas access to the records he/she needs on every device.
The doctor registers every information needed in the computer during or imme-diately after the consultation. Also, if necessary, the informative letter is filled out bythe doctor directly after the consultation. When the consultation is finished and a newappointment has to be made, the patient goes to the desk belonging to the correspondingspecialism. At that desk, the new appointment is made and directly registered in thecomputer. After this, the patient goes home and everything regarding the consultation isdone. If the consultation was the patient’s final consultation, the patient obviously doesnot have to go to the desk to make a new appointment. Instead, the patient can go homeimmediately.
Figure 2.2: Flowchart of the process in the future situation.
9

2.2.2 Tasks
A lot of the tasks of the MMA’s will disappear, as can be seen in the description of thefuture situation above. The registration of new patients will shift to the central desk inthe entrance hall, so this task also disappears from the desks belonging to the specialisms.The only remaining front office task of the MMA’s is making new appointments. Therewill also be some changes in the back office tasks, but these tasks are out of scope forthis research.
10
Chapter 3
Calculation methods
In this chapter, the two calculation methods of this research are clarified. The first sectionexplains the 2004 model in more detail, and the second section shows the mathematicaltheory and calculations behind the Erlang C model.
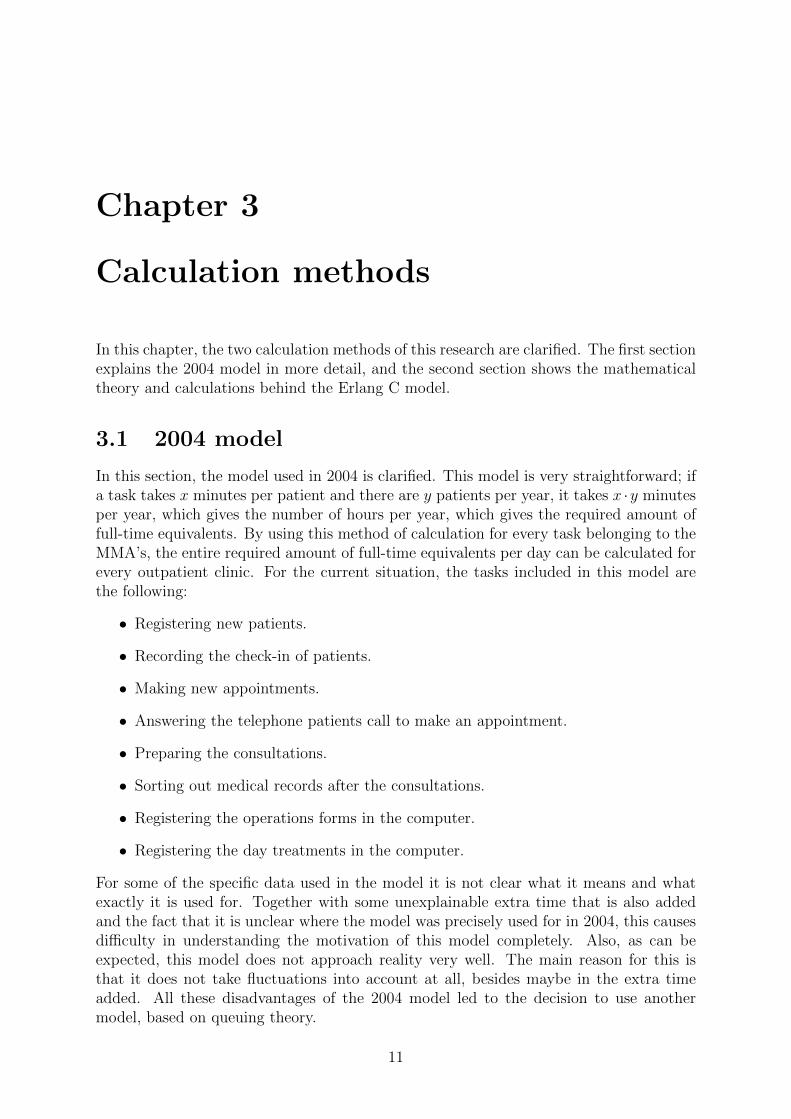
3.1 2004 model
In this section, the model used in 2004 is clarified. This model is very straightforward; ifa task takes x minutes per patient and there are y patients per year, it takes x ·y minutesper year, which gives the number of hours per year, which gives the required amount offull-time equivalents. By using this method of calculation for every task belonging to theMMA’s, the entire required amount of full-time equivalents per day can be calculated forevery outpatient clinic. For the current situation, the tasks included in this model arethe following:
• Registering new patients.
• Recording the check-in of patients.
• Making new appointments.
• Answering the telephone patients call to make an appointment.
• Preparing the consultations.
• Sorting out medical records after the consultations.
• Registering the operations forms in the computer.
• Registering the day treatments in the computer.
For some of the specific data used in the model it is not clear what it means and whatexactly it is used for. Together with some unexplainable extra time that is also addedand the fact that it is unclear where the model was precisely used for in 2004, this causesdifficulty in understanding the motivation of this model completely. Also, as can beexpected, this model does not approach reality very well. The main reason for this isthat it does not take fluctuations into account at all, besides maybe in the extra timeadded. All these disadvantages of the 2004 model led to the decision to use anothermodel, based on queuing theory.
11

3.2 Erlang C model
In this section, the theory behind the Erlang C model is explained. For this purpose,some queuing theory and a little Markov chain theory is necessary. The section startswith the basics of Markov chains, together with a few results that are needed later on.Then, the M |M |s queue is defined, along with some notation. Combined with Little’slaw, these tools provide the results needed to derive an Erlang C calculator. The resultsand proofs mainly come from [1] and [3].
3.2.1 Markov chains
Before heading on to queuing theory, some notation and results in the area of Markovchains are needed.
Definition 3.1. Let Xt, t ∈ T , be a stochastic process with finite or countable statespace X . Xt is a Markov chain if only the current state of the process can influence thenext one. It is a discrete-time Markov chain if T = Z+, and a continuous-time Markovchain if T = R+.
Let Xt be a (continuous-time) Markov chain and write πt(x) = P(Xt = x) for all t ∈ R+,x ∈ X . Furthermore, define π∞(x) = limt→∞(πt(x)) = limt→∞(P(Xt = x)) for all x ∈ X .For continuous-time Markov chains, the time that the stochastic process stays in a stateis exponentially distributed. The parameter belonging to state x is Λ(x) for all x ∈ X .For every x, y ∈ X , define p(x, y) to be the probability that the process makes a transitionfrom x to y when this time expires, and let λ(x, y) = p(x, y)Λ(x) be the transition ratefrom x to y.
Definition 3.2. Take x, y ∈ X . y can be reached from x if there exist x1, . . . , xn ∈ Xfor some n ∈ N such that λ(x, x1), λ(x1, x2), . . . , λ(xn−1, xn), λ(xn, y) > 0.
Now follow the two results needed.
Theorem 3.3. If every state can be reached by every other state, the following equationholds for all Y ⊆ X :
∑x∈Y
(π∞(x)
∑y∈Yc
λ(x, y)
)=∑x∈Yc
(π∞(x)
∑y∈Y
λ(x, y)
).
Also,∑
x∈X π∞(x) = 1.
Proof. For all x, y ∈ X , t ∈ R+, the expected number of times up to t that the Markovchain goes from x to y is equal to πt(x)λ(x, y). Now take Y ⊆ X . If t → ∞, the flowgoing into Y has to equal the flow going out of Y , so it has to hold that∑
x∈Yc
∑y∈Y
π∞(x)λ(x, y) =∑x∈Y
∑y∈Yc
π∞(x)λ(x, y).
Obviously, by definition, it also has to hold that∑
x∈X π∞(x) = 1.
Theorem 3.4. If |X | <∞, the equations in Theorem 3.3 have a unique solution. Other-wise, there are two possibilities: either the equations have a unique solution, or π∞(x) = 0for all x ∈ X is the unique solution of the first equality, with |
∑x∈X π∞(x)| <∞.
12
3.2.2 Queuing theory
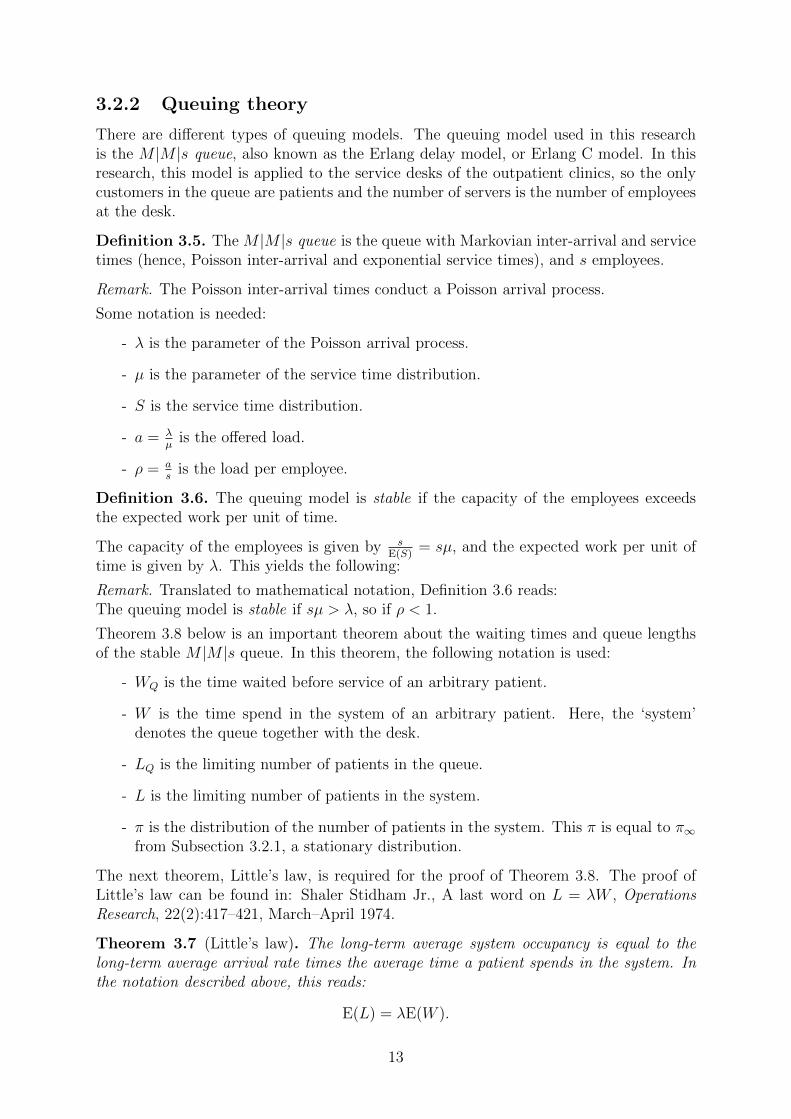
There are different types of queuing models. The queuing model used in this researchis the M |M |s queue, also known as the Erlang delay model, or Erlang C model. In thisresearch, this model is applied to the service desks of the outpatient clinics, so the onlycustomers in the queue are patients and the number of servers is the number of employeesat the desk.
Definition 3.5. The M |M |s queue is the queue with Markovian inter-arrival and servicetimes (hence, Poisson inter-arrival and exponential service times), and s employees.
Remark. The Poisson inter-arrival times conduct a Poisson arrival process.
Some notation is needed:
- λ is the parameter of the Poisson arrival process.
- µ is the parameter of the service time distribution.
- S is the service time distribution.
- a = λµ
is the offered load.
- ρ = as
is the load per employee.
Definition 3.6. The queuing model is stable if the capacity of the employees exceedsthe expected work per unit of time.
The capacity of the employees is given by sE(S)
= sµ, and the expected work per unit oftime is given by λ. This yields the following:
Remark. Translated to mathematical notation, Definition 3.6 reads:The queuing model is stable if sµ > λ, so if ρ < 1.
Theorem 3.8 below is an important theorem about the waiting times and queue lengthsof the stable M |M |s queue. In this theorem, the following notation is used:
- WQ is the time waited before service of an arbitrary patient.
- W is the time spend in the system of an arbitrary patient. Here, the ‘system’denotes the queue together with the desk.
- LQ is the limiting number of patients in the queue.
- L is the limiting number of patients in the system.
- π is the distribution of the number of patients in the system. This π is equal to π∞from Subsection 3.2.1, a stationary distribution.
The next theorem, Little’s law, is required for the proof of Theorem 3.8. The proof ofLittle’s law can be found in: Shaler Stidham Jr., A last word on L = λW , OperationsResearch, 22(2):417–421, March–April 1974.
Theorem 3.7 (Little’s law). The long-term average system occupancy is equal to thelong-term average arrival rate times the average time a patient spends in the system. Inthe notation described above, this reads:
E(L) = λE(W ).
13

Little’s law also holds for the queue instead of the system:
E(LQ) = λE(WQ).
Theorem 3.8. The following expressions hold for the stable M |M |s queue, for all i ∈ N,t ≥ 0:
π(i) =
ai
i!π(0) if i < s,
ai
s!si−sπ(0) otherwise,
E(WQ) =C(s, a)
sµ− λ, E(LQ) =
ρC(s, a)
1− ρ,
P(WQ > t) = C(s, a)e−(sµ−λ)t, E(W ) = E(WQ) +1
µ, E(L) = E(LQ) + a.
Here,
(π(0))−1 =s−1∑i=0
ai
i!+
as
(s− 1)!(s− a),
and C(s, a) = P(WQ > 0) is the probability of delay:
C(s, a) =∞∑i=s
π(i) = π(0)∞∑i=s
ai
s!si−s=
(s−1∑i=0
ai
i!+
as
(s− 1)!(s− a)
)−1
as
(s− 1)!(s− a).
Before heading on to the proof of this theorem, another lemma is needed.
Lemma 3.9. Let A,B,Ci be events of some probability space (Ω,F ,P), for all i ∈ N,such that Ci ∩ Cj = ∅ for all i, j ∈ N with i 6= j, and (A ∩B) ⊆
⋃∞i=1Ci. Then
P(A|B) =∞∑i=1
P(A|B,Ci)P(Ci|B).
Proof. According to the definition of conditional probability, it holds that P(A|B) = P(A,B)P(B)
.Hence,
P(A|B) =P(A,B)
P(B)
=
∑∞i=1 P(A,B,Ci)
P(B)
=∞∑i=1
P(A,B,Ci)
P(B)
P(B,Ci)
P(B,Ci)
=∞∑i=1
P(A,B,Ci)
P(B,Ci)
P(B,Ci)
P(B)
=∞∑i=1
P(A|B,Ci)P(Ci|B).
14

Proof of Theorem 3.8. The M |M |s queue can be modeled as a birth-death process, a classof continuous-time Markov chains.
Definition 3.10. A birth-death process is a continuous-time Markov chain with X = 0, . . . , nfor some n ∈ N ∪ ∞, where only neighboring states can be reached in one step.
In this case, X = Z+, where the state represents the number of patients in the system.Define λi = λ(i, i + 1) = λ for all i ∈ X , and µi = λ(i, i − 1) = mins, iµ for alli ∈ X \ 0 = N. Take also µ0 = 0 = mins, 0µ, so µi = mins, iµ for all i ∈ X .Applying Theorem 3.3 with Y = 0 yields
∑x∈Y
(π(x)
∑y∈Yc
λ(x, y)
)= π(0)
∑y∈N
λ(0, y) = π(0)λ(0, 1) = π(0)λ0 = λπ(0),
and ∑x∈Yc
(π(x)
∑y∈Y
λ(x, y)
)=∑x∈N
π(x)λ(x, 0) = π(1)λ(1, 0) = π(1)µ1 = µπ(1),
so λπ(0) = µπ(1).Now take i ∈ N. Applying Theorem 3.3 with Y = i yields
∑x∈Y
(π(x)
∑y∈Yc
λ(x, y)
)= π(i)
∑y∈Z+\i
λ(i, y)
= π(i)(λ(i, i− 1) + λ(i, i+ 1)) = π(i)(µi + λi)
= (mins, iµ+ λ)π(i),
and ∑x∈Yc
(π(x)
∑y∈Y
λ(x, y)
)=∑
x∈Z+\i
π(x)λ(x, i)
= π(i− 1)λ(i− 1, i) + π(i+ 1)λ(i+ 1, i)
= π(i− 1)λi−1 + π(i+ 1)µi+1
= λπ(i− 1) + mins, i+ 1µπ(i+ 1),
so (mins, iµ+ λ)π(i) = λπ(i− 1) + mins, i+ 1µπ(i+ 1).Take j ∈ N. Summing the 0-case of the above equalities with the cases i = 1, . . . , j gives
λπ(0) +
j∑i=1
(mins, iµ+ λ)π(i) = µπ(1) +
j∑i=1
(λπ(i− 1) + mins, i+ 1µπ(i+ 1)),
j∑i=1
mins, iµπ(i) +
j∑k=0
λπ(k) =
j+1∑i=1
mins, iµπ(i) +
j−1∑k=0
λπ(k),
λπ(j) = mins, j + 1µπ(j + 1).
This holds for all j ∈ N and also for j = 0 (because λπ(0) = µπ(1)), so for all j ∈ N itholds that
π(j) =λ
mins, jµπ(j − 1) = · · · = λj
µj∏j
i=1 mins, iπ(0)
15

=
λj
µjj!π(0) =
λj
µj
j!π(0) =
aj
j!π(0) if j < s,
λj
µjs!sj−sπ(0) =
λj
µj
s!sj−sπ(0) =
aj
s!sj−sπ(0) otherwise.
The second equation of Theorem 3.3 now implies that
π(0) = 1−∞∑i=1
π(i)
= 1−s−1∑i=1
π(i)−∞∑j=s
π(j)
= 1−s−1∑i=1
ai
i!π(0)−
∞∑j=s
aj
s!sj−sπ(0)
= 1− π(0)
(s−1∑i=1
ai
i!+∞∑j=s
aj
s!sj−s
),
so
(π(0))−1 = 1 +s−1∑i=1
ai
i!+∞∑j=s
aj
s!sj−s
= 1 +s−1∑i=0
ai
i!− a0
0!+as
s!
∞∑j=s
aj−s
sj−s
=s−1∑i=0
ai
i!+as
s!
∞∑j=0
(as
)j=
s−1∑i=0
ai
i!+as
s!
1
1− as
(since the model is stable, hence
a
s= ρ < 1
)=
s−1∑i=0
ai
i!+
as
(s− 1)!(s− a).
(In this deduction, the convention is made that 0! = 1.)Next, E(WQ) is calculated. According to the definition of conditional probability,
it holds for all t ≥ 0 that
P(WQ > t) = P(WQ > t,WQ > 0) = P(WQ > t|WQ > 0)P(WQ > 0).
As defined in the theorem, P(WQ > 0) = C(s, a). Because of PASTA, WQ can be seen asthe time until at least one of the employees at the desk is done with helping the patientsthat were already present. The starting time is 0, with stationary system occupancydistribution L. WQ then is the moment that at the desk someone is ready to help thepatient arriving at 0, so
P(WQ > t|L = i+ s) = P(#departures in t time units < i+ 1) for all i ∈ Z+.
16

The departures are also Poisson distributed, with parameter sµ. Hence,
P(#departures in t time units = k) = e−sµt(sµt)k
k!for all k < i+ 1,
so
P(WQ > t|L = i+s) =i∑
k=0
P(#departures in t time units = k) =i∑
k=0
e−sµt(sµt)k
k!for all i ∈ Z+.
It holds for all i ∈ Z+ that P(L = i + s|WQ > 0) = P(L = i + s|L ≥ s), since WQ > 0 ifand only if L ≥ s. The latter is geometric distributed with parameter ρ, so
P(L = i+ s|WQ > 0) = P(L = i+ s|L ≥ s) = (1− ρ)ρi for all i ∈ Z+.
Combining the above with Lemma 3.9 yields the following:
P(WQ > t) = P(WQ > t|WQ > 0)P(WQ > 0)
= C(s, a)∞∑i=0
P(WQ > t|WQ > 0, L = i+ s)P(L = i+ s|WQ > 0)
= C(s, a)∞∑i=0
P(WQ > t|L = i+ s)P(L = i+ s|WQ > 0)
(since L = i+ s =⇒ WQ > 0 for all i ∈ Z+)
= C(s, a)∞∑i=0
i∑k=0
e−sµt(sµt)k
k!(1− ρ)ρi
= C(s, a)e−sµt(1− ρ)∞∑k=0
(sµt)k
k!
∞∑i=k
ρi
= C(s, a)e−sµt(1− ρ)∞∑k=0
(sµt)k
k!
(∞∑i=0
ρi −k−1∑i=0
ρi
)
= C(s, a)e−sµt(1− ρ)∞∑k=0
(sµt)k
k!
(1
1− ρ−
k−1∑i=0
ρi
)(since ρ < 1)
= C(s, a)e−sµt(1− ρ)∞∑k=0
(sµt)k
k!
1−∑k−1
i=0 (ρi − ρi+1)
1− ρ
= C(s, a)e−sµt∞∑k=0
(sµt)k
k!(1− ρ0 + ρk)
= C(s, a)e−sµt∞∑k=0
(ρsµt)k
k!
= C(s, a)e−sµteρsµt
(since
∞∑i=0
xn
n!= ex for all x ∈ R
)
= C(s, a)e(λ−sµ)t
(since ρ =
λ
µs
).
17

It follows that
E(WQ) =
∫ ∞0
td
dt(P(WQ ≤ t)) dt
=
∫ ∞0
td
dt(1− P(WQ > t)) dt
= −∫ ∞
0
td
dt(P(WQ > t)) dt
= −∫ ∞
0
td
dt
(C(s, a)e−(sµ−λ)t
)dt
Take u = t and dv = ddt
(C(s, a)e−(sµ−λ)t
)dt, then du = dt and v = C(s, a)e−(sµ−λ)t, so
by partial integration:
= −[C(s, a)te−(sµ−λ)t
]∞0
+
∫ ∞0
C(s, a)e−(sµ−λ)t dt
= −(0− 0) +
[−C(s, a)
1
sµ− λe−(sµ−λ)t
]∞0
=C(s, a)
sµ− λ.
Little’s law now implies that
E(LQ) = λE(WQ) =λC(s, a)
sµ− λ=
λsµ
C(s, a)
1− λsµ
=ρC(s, a)
1− ρ.
The system denotes the queue together with the desk, so it holds that E(W ) = E(WQ+S).Hence,
E(W ) = E(WQ) + E(S) = E(WQ) +1
µ,
since S is exponentially distributed with parameter µ. Again by Little’s law, it followsthat
E(L) = λE(W ) = λE(WQ) +λ
µ= E(LQ) + a.
With the help of Theorem 3.8, an Erlang C calculator can be derived. Obtaining a simplerexpression for C(s, a) for this end is useful.
Definition 3.11. The blocking probability B(s, a) is equal to
B(s, a) =as
s!∑si=0
ai
i!
.
With this blocking probability, C(s, a) can be rewritten:
sB(s, a)
s− a(1− B(s, a))=
sas
s!∑si=0
ai
i!
s− a(
1−as
s!∑si=0
ai
i!
)18
=sa
s
s!
s∑s
i=0ai
i!− a
(∑si=0
ai
i!− as
s!
)=
as
(s−1)!
s(∑s−1
i=0ai
i!+ as
s!
)− a
∑s−1i=0
ai
i!
=
as
(s−1)!
(s− a)∑s−1
i=0ai
i!+ sa
s
s!
=
as
(s−1)!(s−a)∑s−1i=0
ai
i!+ as
(s−1)!(s−a)
= C(s, a).
Now let N be Poisson distributed with parameter a, so N ∼ Poisson(a).
Then P(N = k) = ak
k!e−a for all k ∈ Z+, so
P(N = s)
P(N ≤ s)=
as
s!e−a∑s
i=0ai
i!e−a
=as
s!∑si=0
ai
i!
= B(s, a).
This implies that
C(s, a) =sP(N=s)
P(N≤s)
s− a(
1− P(N=s)P(N≤s)
)=
sP(N = s)
sP(N ≤ s)− a(P(N ≤ s)− P(N = s))
=sP(N = s)
s(P(N ≤ s− 1) + P(N = s))− aP(N ≤ s− 1)
=sP(N = s)
(s− a)P(N ≤ s− 1) + sP(N = s).
With this formula, C(s, a) can easily be calculated using Excel, since Excel provides thePoisson functions Poisson(s, a, false) = P(N = s) and Poisson(s, a, true) = P(N ≤ s).Having calculated C(s, a), the expected waiting time and the service level can be com-puted easily. Here, the service level indicates the fraction of patients that have a wait-ing time less than some t ∈ R≥0, so the service level corresponding to t is equal toP(WQ ≤ t) = 1− P(WQ > t), whose expression is given in Theorem 3.8.
3.2.3 Application for this research
The main question for this part of the research was: In the future situation, how manyMMA’s are needed at the desk to achieve the highest possible efficiency, while maintainingan acceptable service level, given that the number of consultations remains the same?With the expressions above, the method to answer this question can be deduced. Theobvious model for the outpatient clinics is the M |G|s queue. This is similar to the M |M |squeue, with the exception that the M |G|s queue has general service times instead ofexponential ones. The problem is, however, that there is no closed form expression forthe waiting time in the M |G|s queue. On top of that, it was also not possible duringthis research to check whether exponential service times approach reality good enough,
19

because there was no data of the actual service times available. The reason for this issimply that VUmc does not record the actual service times. Luckily, experience overmany decades in the field of call centers has shown that using the Erlang C model cangive helpful insights into the operation of the servers (in the case of call centers, theservers are agents). A description of this use of the model can be found in [1], Chapter17. For this reason, it is assumed that the service times are exponential, so the M |M |squeue can be used to model the outpatient clinics. The following parameters form theinput of the Erlang C model:
• λ, which equals the number of patients per minute.
• µ, which equals one over the service time per patient in minutes.
• The desired service level with corresponding ‘maximum’ waiting time t; hence, thedesired percentage of patients that is helped within t minutes.
The model then generates the following output:
• The required number of MMA’s at the desk to ensure the desired service level.This is calculated iteratively on the number of employees s, so by calculating C(s, a)and P(WQ ≤ t) (which depends on C(s, a)) for s = 1, s = 2, and so on, untilP(WQ ≤ t) is bigger than or equal to the desired service level. The correspondingn ∈ N is the minimal number of MMA’s required at the desk.
• The utilization factor of the MMA’s at the desk.
This factor is given by number of patiens per minute×service time per patient in minutesnumber of employees
=λ 1µ
s, so
using the n calculated above, this factor equals λµn
.
• The expected waiting time for a patient in minutes.As proved in Theorem 3.8, the expected waiting time equals C(n,a)
nµ−λ , with n againthe minimal number of MMA’s required at the desk.
• The actual service level.The desired service level was used to calculate n. With this n, the actual servicelevel P(WQ ≤ t) can now be computed, taking s = n as input for C(s, a).
20
Chapter 4
Data analysis
In this chapter, a more detailed description of the Erlang C is given. Also, the standardmodel used for the calculations with the model is explained, and the decision of whichday to use for the model is justified.
4.1 Description of the Erlang C model
The tasks considered in the Erlang C model for the current situation are the following:
• Registering new patients.
• Recording the check-in of patients.
• Making new appointments.
It is assumed that the patients that make a new appointment, do so at the specialismdesk, right after their consultation. The fact that the desk employees have to performthree types of tasks with different service times makes the input needed for the Erlang Cmodel a little more extensive than stated in Subsection 3.2.2. The parameters needed asinput for analyzing the current situation are as follows:
• The number of new patients per minute.
• The number of patients coming for a repeat consultation per minute.
• The number of patients making a new appointment per minute.
• The service time of registering a new patient in minutes.
• The service time of recording the check-in of a patient in minutes.
• The service time of making a new appointment in minutes.
• The desired service level with corresponding ‘maximum’ waiting time; hence, thedesired percentage of patients that is helped within a certain timespan.
The number of patients making a new appointment is assumed to be equal to the numberof patient contacts of the outpatient clinic multiplied by the percentage of patient contactsthat are not first-time contacts, where this percentage is based on a year.
21
Example 4.1. Assume there is an outpatient clinic which has had 1,000 first consul-tations, 2,000 repeat consultations, and 1,500 operation or nurse consultations over thepast year. Also, assume there were 4 first consultations, 9 repeat consultations, and 5operation or nurse consultations on a particular day. Then the number of patients makinga new appointment that day is assumed to be equal to (4 + 9 + 5)× 2,000+1,500
1,000+2,000+1,500= 14.
Sometimes, patients have an appointment for an operation or nurse consultation, andalso see a doctor, a repeat consultation (this never happens with first consultations).Unfortunately, these patients are often booked for both types of consultations, resulting ina patient appearing in the data as two patients. This can influence the number of patientsmaking a new appointment, and therefore the outcome of the Erlang C calculations,remarkably, as can be seen in the next example.
Example 4.2. Take a look at the outpatient clinic of Example 4.1 and assume that75% of the patients with an appointment for an operation or nurse consultation, havea combined appointment (so also a repeat consultation directly before or after). Thenthe number of patients making a new appointment on the same day as in Example 4.1 isassumed to be equal to (4 + 9 + 0.25 · 5)× 2,000+0.25·1,500
1,000+2,000+0.25·1,500= 10.03. The difference is
28%, which can result in a lower number of desk employees needed.
In the future situation, the only task left of the three tasks listed above is the making ofnew appointments. The number of patients making a new appointment will be calculatedthe same way as for the current situation, because in that calculation, the removal ofsome of the tasks of the MMA’s is of no influence. Of course, the appointments for firstconsultations also have to be made. This is mostly done by phone. In the future situation,this phone will also be a part of the specialism desks. Since it is hard to predict when theseappointments are made, it is assumed that this happens equally distributed over the hoursof operation of the desks, so the number of appointments for first consultations per hour isequal to number of first consultations in a year
number of days the outpatient clinic is open per year×number of hours the outpatient clinic is open per day.
The outpatient clinics are normally open for 275 days a year, and 9 hours a day. Thismeans that the number of appointments for first consultations per hour is equal to thenumber of first consultations in a year divided by (275 · 9). This assumption can bemade without loss of generality, since the influence of the making of appointments forfirst consultations is not big enough to affect the required number of desk employees.
It is also interesting to compare the outcome of the Erlang C model with theactual situation. For this purpose, the number of desks and the number of MMA’soccupying the desks in the current situation is also a required piece of information. Togather all information needed, the outpatient clinics have been visited. During thesevisits, the questions important to this research that were asked are the following:
• How many desks does the outpatient clinic have?
• What are the specific roles of the desks? (For example, there could be a specialdesk or queue for registering new patients.)
• How many MMA’s occupy the desks per day?
• What (estimated) percentage of the operation or nurse consultations is combinedwith a repeat consultation?
22

For a few outpatient clinics, some information is missing, in which case assumptions aremade. If so, it will be clearly stated in the description of the results of these clinics.
To collect all the input needed for the model, a day has to be picked. To see ifthere are any big differences in the outcomes of the model for different days, this has beentested for some outpatient clinics. One of them, the one that will be described below, isthe outpatient clinic Obstetrics & Gynecology. This particular outpatient clinic has beenchosen because it is one of the larger outpatient clinics, so if the difference is negligiblefor Obstetrics & Gynecology, it will also be negligible for smaller outpatient clinics. Themethod used for this research is based on [2].
4.2 Data analysis
The specialisms belonging to Obstetrics & Gynecology, abbreviated as O&G, are Obstet-rics, Gynecology, Reproductive Endocrinology and Infertility, and In Vitro Fertilization.All images of the analysis below are based on the data of all of these specialisms together.At first, two days were taken to compare, one from a busy month and one from a calmmonth.
Figure 4.1: The mean number of patients per month of the O&G clinic from 2010 to2013. FC stands for first consultation and RC stands for repeat consultation.
As can be seen, March was one of the busy months, and August one of the calm ones.From both months, one of the busier days was picked.
23
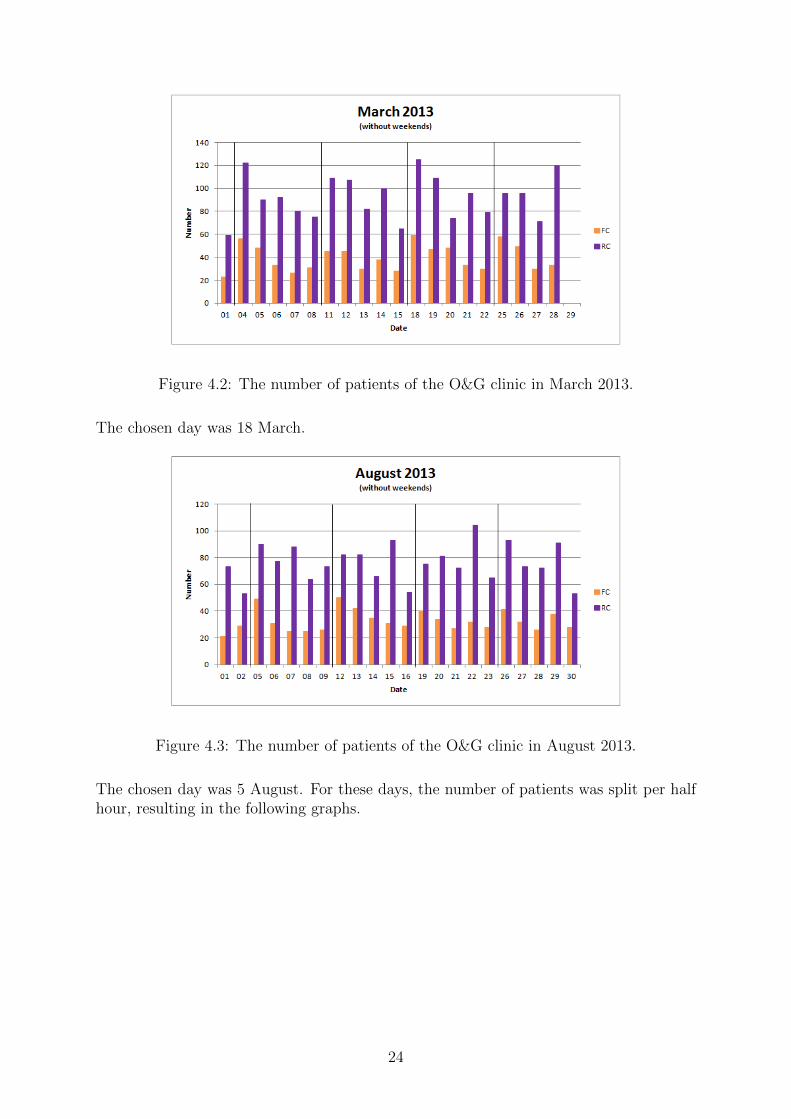
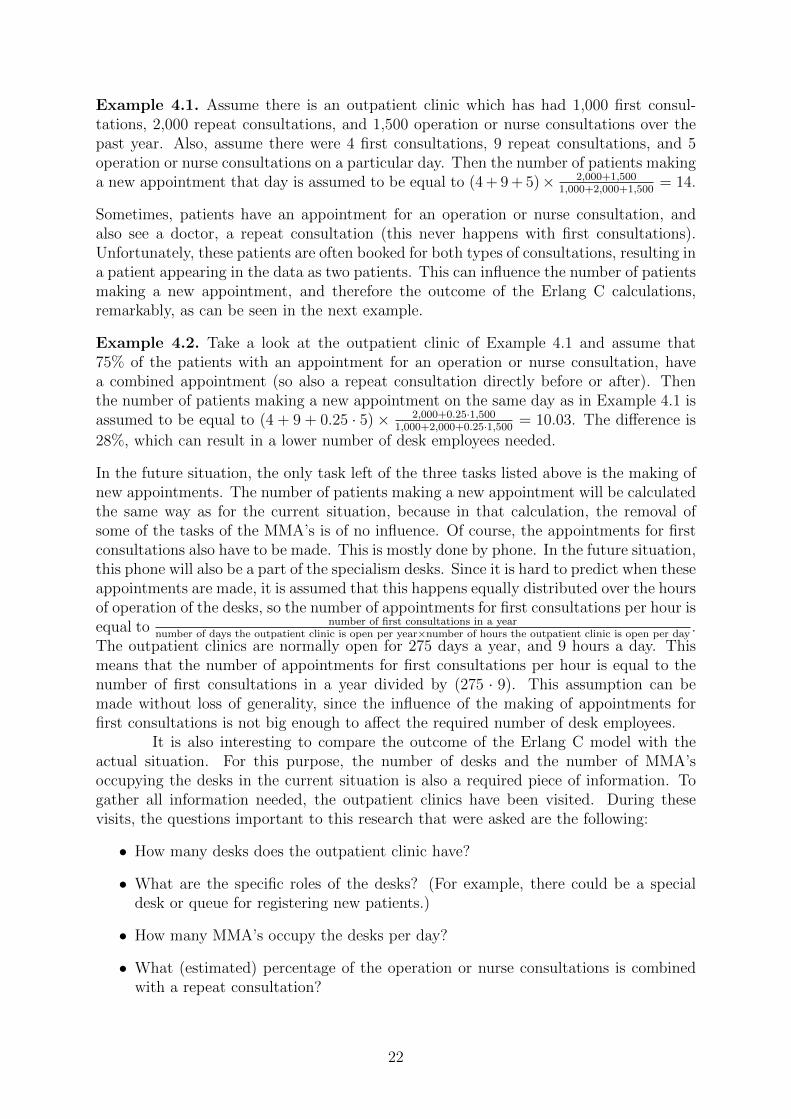
Figure 4.2: The number of patients of the O&G clinic in March 2013.
The chosen day was 18 March.
Figure 4.3: The number of patients of the O&G clinic in August 2013.
The chosen day was 5 August. For these days, the number of patients was split per halfhour, resulting in the following graphs.
24

Figure 4.4: The number of patients of the O&G clinic on 18 March 2013, per half hour.
Figure 4.5: The number of patients of the O&G clinic on 5 August 2013, per half hour.
For these days, calculations with the model were performed.
4.3 Model analysis
The O&G clinic consists of multiple desks. One of these desks belongs to the specialismsObstetrics and Gynecology. At this desk, there is one queue, and there are two MMA’soccupying the desk. This implies that both MMA’s perform all three tasks. That meansthat the standard model, which is described in Appendix A, can be used to model thisdesk. The general input for this model (input not depending on the specific day) is asfollows.
25

Obstetrics Gynecology Total
Number of first consultations in 2013 4,128 2,804 6,932
Number of repeat consultations in 2013 11,443 4,176 15,619
Number of operation or nurse consultations in 2013 8,965 1,135 10,100
Table 4.1: The general input for the standard model.
The service times for making an appointment, recording a check-in, and registering apatient are the same as in the 2004 model (see Appendix A), so:
Service time for making an appointment 2.38
Service time for recording a check-in 0.5
Service time for registering a patient 4.2
Table 4.2: The service times of the Obstetrics and Gynecology desk.
The percentage of operation or nurse consultations combined with a repeat consultationis equal to 50%, and the desired service level is set to 80% within 2 minutes. Now followsthe specific input for both 18 March 2013 and 5 August 2013. In this table, OC standsfor operation consultation, and NC stands for nurse consultation.
Time18 March 2013 5 August 2013
(Number of) FC (Number of) RC (Number of) OC or NC FC RC OC or NC
07:30 0 0 0 0 0 0
08:00 0 0 0 0 0 0
08:30 3 4 5 3 1 2
09:00 2 9 3 4 5 3
09:30 2 7 5 4 8 2
10:00 1 7 2 4 3 1
10:30 4 9 2 3 7 1
11:00 5 6 3 4 7 1
11:30 1 6 3 2 3 2
12:00 0 0 0 0 0 0
12:30 0 0 0 0 2 1
13:00 5 3 1 5 1 0
13:30 5 10 5 4 6 4
14:00 3 12 5 3 3 3
14:30 4 11 5 2 2 1
15:00 5 11 3 4 5 4
15:30 5 6 5 1 4 2
16:00 0 1 0 0 1 0
16:30 0 0 0 1 0 0
17:00 0 0 0 0 0 0
Table 4.3: The specific input for the standard model for 18 March 2013 and 5 August2013.
Putting this information in the standard model for 18 March 2013, yields the followinggraphs. In these images, the ‘to test’ graph is fitted so that the service level and average
26
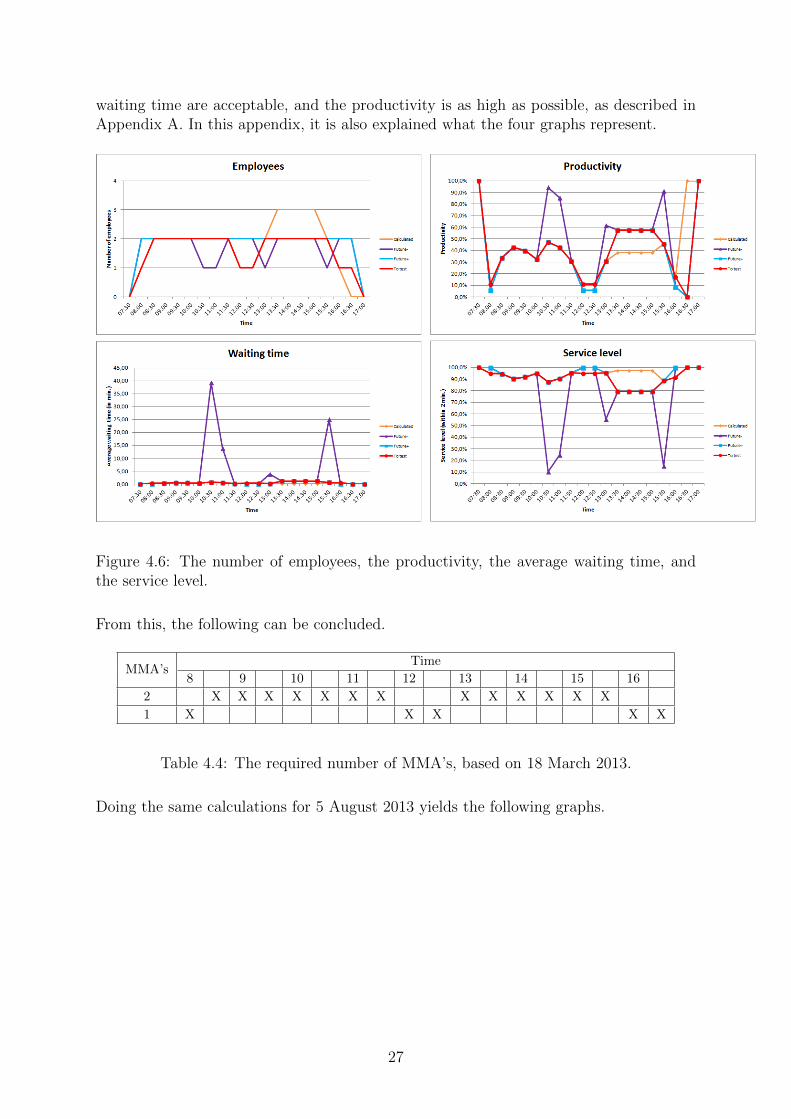
waiting time are acceptable, and the productivity is as high as possible, as described inAppendix A. In this appendix, it is also explained what the four graphs represent.
Figure 4.6: The number of employees, the productivity, the average waiting time, andthe service level.
From this, the following can be concluded.
MMA’sTime
8 9 10 11 12 13 14 15 16
2 X X X X X X X X X X X X X
1 X X X X X
Table 4.4: The required number of MMA’s, based on 18 March 2013.
Doing the same calculations for 5 August 2013 yields the following graphs.
27
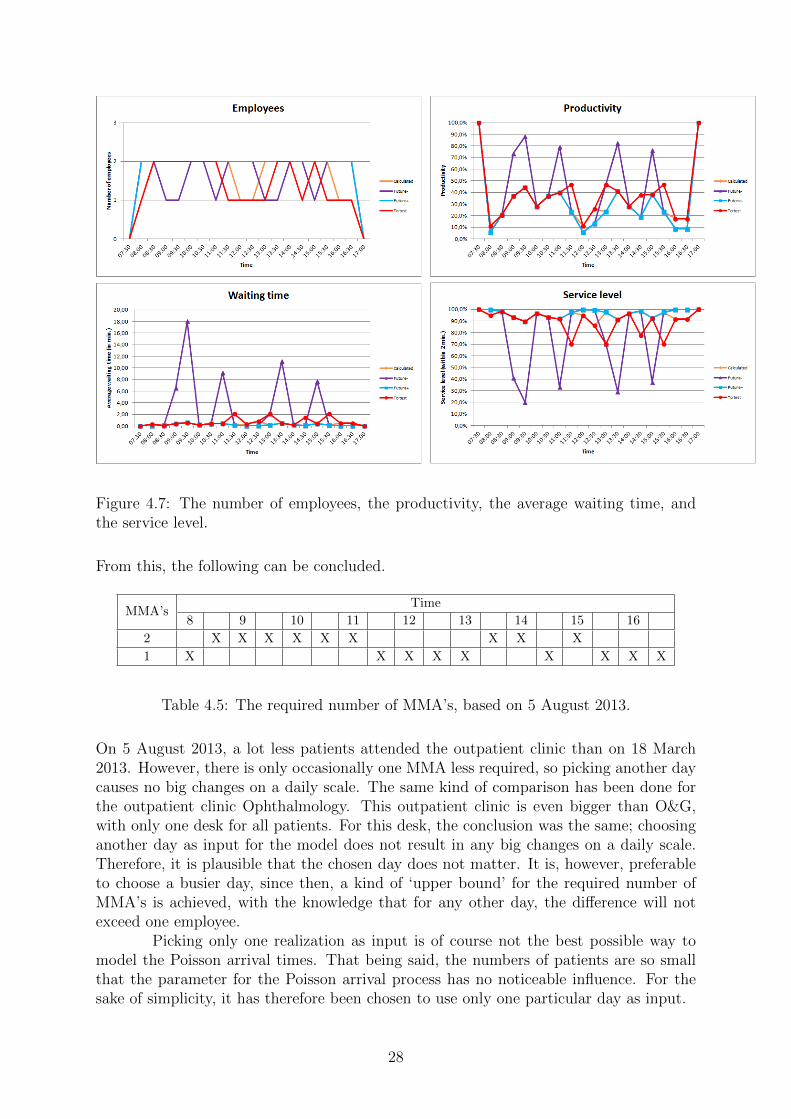
Figure 4.7: The number of employees, the productivity, the average waiting time, andthe service level.
From this, the following can be concluded.
MMA’sTime
8 9 10 11 12 13 14 15 16
2 X X X X X X X X X
1 X X X X X X X X X
Table 4.5: The required number of MMA’s, based on 5 August 2013.
On 5 August 2013, a lot less patients attended the outpatient clinic than on 18 March2013. However, there is only occasionally one MMA less required, so picking another daycauses no big changes on a daily scale. The same kind of comparison has been done forthe outpatient clinic Ophthalmology. This outpatient clinic is even bigger than O&G,with only one desk for all patients. For this desk, the conclusion was the same; choosinganother day as input for the model does not result in any big changes on a daily scale.Therefore, it is plausible that the chosen day does not matter. It is, however, preferableto choose a busier day, since then, a kind of ‘upper bound’ for the required number ofMMA’s is achieved, with the knowledge that for any other day, the difference will notexceed one employee.
Picking only one realization as input is of course not the best possible way tomodel the Poisson arrival times. That being said, the numbers of patients are so smallthat the parameter for the Poisson arrival process has no noticeable influence. For thesake of simplicity, it has therefore been chosen to use only one particular day as input.
28

In the next chapter, the outpatient clinic Obstetrics & Gynecology is analyzedmore thoroughly, using the reasoning above.
29
Chapter 5
Results and conclusions
In this chapter, the results of the Erlang C calculations and the corresponding conclusionsare described in detail for the outpatient clinic Obstetrics & Gynecology. The results andconclusions of one other outpatient clinic are briefly shown as example in Appendix D.In this research, the same method has been used for all other outpatient clinics as well.For every outpatient clinic, the chosen day is either Monday 28 October 2013 or Tuesday29 October 2013, because October was a busy month for all outpatient clinics together,and every outpatient clinic had an average busy day on 28 and/or 29 October. Thesedays were chosen for all outpatient clinics for the sake of simplicity and unambiguity, soalso for the Obstetrics & Gynecology clinic. Furthermore, using yet another day resultsin more material to compare, so it also forms an extra confirmation of the indifference ofthe chosen day.
As stated in Section 4.2, Obstetrics & Gynecology will be abbreviated by O&G.The day picked for this outpatient clinic is 28 October 2013.Below is the table with the overview of the desks belonging to O&G. Recall that the spe-cialisms of O&G are Obstetrics, Gynecology, Reproductive Endocrinology and Infertility,and In Vitro Fertilization (IVF). The ‘Registration desk’-column contains the locationof the outpatient clinic, inside the building of the outpatient clinics. In some cases, theoutpatient clinic is located in the hospital itself. If so, the entry of this column will be‘Hospital’. The ‘Desk’-column specifies the role of the desk, for example a registrationdesk, or a specialism desk. In the column ‘Separate registration?’ is specified if there isa separate queue for registration at the corresponding desk.
Registrationdesk
DeskHours ofoperation
Separateregistration?
Number ofemployees now
Desk H
Obstetrics &Gynecology
8.00-17.00 No2 MMA’s, withpossibility for athird.
ReproductiveEndocrinology and
Infertility8.00-17.00 No
0–1 MMA’s, notalways occupied.
Nurse desk 8.00-17.00 n/a2–3 nurses, noadministration atthis desk.
30

Registrationdesk
DeskHours ofoperation
Separateregistration?
Number ofemployees now
Hospital
IVF laboratory8.00-12.00 (also in
weekends)n/a
1 MMA, noadministration atthis desk.
IVF appointmentdesk
8.00-17.00 (also inweekends)
n/a 1 MMA.
Table 5.1: The desks belonging to O&G.
At the IVF appointment desk, patients report themselves as present and they make newappointments there. There are no first consultations at the IVF center (patients arealways directed from the O&G clinic), so there is no registration of new patients at thedesks belonging to IVF.
As already stated in Section 4.3, the percentage of operation or nurse consulta-tions that are combined with a repeat consultation is estimated to be 50%. The desksof interest for this research are the desks of Obstetrics & Gynecology, and ReproductiveEndocrinology and Infertility, and the IVF appointment desk. The other two desks havenon of the three administrative tasks regarding the patient, so those desks will be out ofscope.
5.1 Registration desk H
5.1.1 Obstetrics & Gynecology desk
The model used for this desk is already explained in Section 4.2. The same holds for thegeneral input for this model. The specific input for 28 October 2013 is as follows.
Time Number of FC Number of RC Number of OC or NC
07:30 0 0 0
08:00 0 0 0
08:30 1 4 3
09:00 1 7 2
09:30 3 5 1
10:00 1 2 2
10:30 4 5 2
11:00 3 4 2
11:30 2 3 3
12:00 0 0 0
12:30 0 1 1
13:00 3 4 2
13:30 4 6 7
14:00 4 8 5
14:30 4 6 2
15:00 1 4 4
15:30 4 3 1
16:00 0 0 0
31
16:30 0 0 0
17:00 0 0 0
Table 5.2: The specific input for the standard model for 28 October 2013.
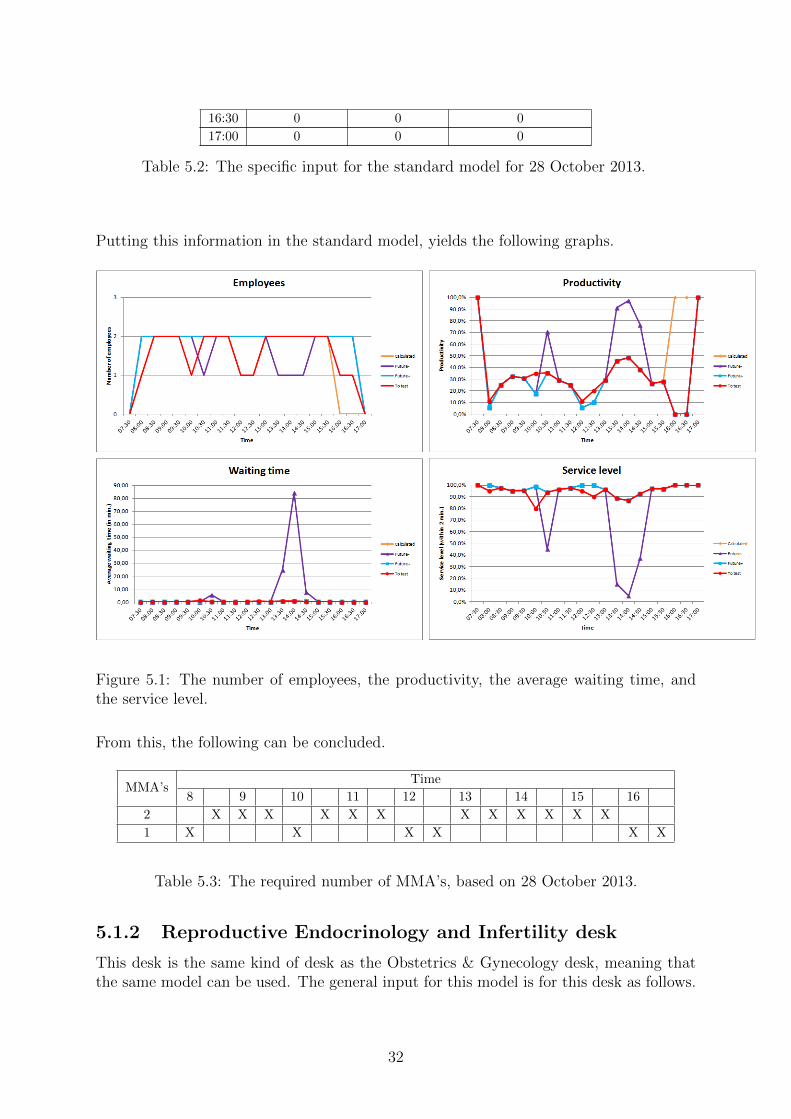
Putting this information in the standard model, yields the following graphs.
Figure 5.1: The number of employees, the productivity, the average waiting time, andthe service level.
From this, the following can be concluded.
MMA’sTime
8 9 10 11 12 13 14 15 16
2 X X X X X X X X X X X X
1 X X X X X X
Table 5.3: The required number of MMA’s, based on 28 October 2013.
5.1.2 Reproductive Endocrinology and Infertility desk
This desk is the same kind of desk as the Obstetrics & Gynecology desk, meaning thatthe same model can be used. The general input for this model is for this desk as follows.
32

Reproductive Endocrinology and Infertility
Number of first consultations in 2013 1,964
Number of repeat consultations in 2013 5,741
Number of operation or nurse consultations in 2013 1,446
Table 5.4: The general input for the standard model.
The service times for the three tasks are a little different than at the Obstetrics & Gy-necology desk, because at this desk, new patients are always couples, so registering takestwice as long:
Service time for making an appointment 2.38
Service time for recording a check-in 0.5
Service time for registering a patient 8
Table 5.5: The service times of the Reproductive Endocrinology and Infertility desk.
Again, the percentage of operation or nurse consultations combined with a repeat con-sultation is equal to 50%, and the desired service level is set to 80% within 2 minutes.Now follows the specific input for 28 October 2013.
Time Number of FC Number of RC Number of OC or NC
07:30 0 0 0
08:00 0 0 0
08:30 3 2 0
09:00 1 0 0
09:30 1 2 0
10:00 1 4 0
10:30 1 5 0
11:00 0 7 0
11:30 1 5 0
12:00 0 1 0
12:30 0 0 0
13:00 0 0 0
13:30 1 1 6
14:00 0 1 6
14:30 0 1 6
15:00 1 0 4
15:30 1 1 0
16:00 0 0 0
16:30 0 0 0
17:00 0 0 0
Table 5.6: The specific input for the standard model for 28 October 2013.
Putting this information in the standard model, yields the following graphs.
33

Figure 5.2: The number of employees, the productivity, the average waiting time, andthe service level.
From this, the following can be concluded.
MMA’sTime
8 9 10 11 12 13 14 15 16
2
1 X X X X X X X X X X X X X X X X X X
Table 5.7: The required number of MMA’s, based on 28 October 2013.
5.1.3 Combining the desks
Combining the two desks into one desk might give an optimization on the number ofrequired employees and their productivity. In order to check this, the results of the twoseparate desks have to be compared with the consequences of combining the desks. Themodel used to combine the results of the separate desks is described in Appendix B.Combining the results of the Obstetrics & Gynecology desk and the Reproductive En-docrinology and Infertility desk, yields the following graphs.
34

Figure 5.3: The total number of employees, the average productivity, the average waitingtime, and the average service level.
In Appendix C, the model for combining multiple desks into one desk is described. Takingthe total of registration desk H as input in this model and taking 5 minutes as servicetime for registering a patient (the weighed average of the 4.2 minutes at the Obstetrics& Gynecology desk and the 8 minutes at the Reproductive Endocrinology and Infertilitydesk), yields the following graphs.
35

Figure 5.4: The number of employees, the productivity, the average waiting time, andthe service level.
From this, the following can be concluded.
MMA’sTime
8 9 10 11 12 13 14 15 16
2 X X X X X X X X X X X X X
1 X X X X X
Table 5.8: The required number of MMA’s, based on 28 October 2013.
From Figure 5.3 and Table 5.8, it can be concluded that combining the two desks ofregistration desk H into one desk, results in one MMA less needed over the whole day.The conclusion of this research for the part of the O&G clinic in the building of theoutpatient clinics is therefore that it is advisable to combine the two desks of registrationdesk H into one desk.
5.2 IVF appointment desk
The IVF center consists solely of operation or nurse consultations. The standard modelcan be used to model this desk. The general input for this model is as follows.
36

IVF center
Number of first consultations in 2013 0
Number of repeat consultations in 2013 0
Number of operation or nurse consultations in 2013 15,457
Table 5.9: The general input for the standard model.
The service times for making an appointment and recording a check-in are the same asfor the other specialisms of the O&G clinic, so:
Service time for making an appointment 2.38
Service time for recording a check-in 0.5
Table 5.10: The service times of the IVF appointment desk.
There are no repeat consultations, so the percentage of operation or nurse consultationscombined with a repeat consultation does not matter. The desired service level is set to80% within 2 minutes. Now follows the specific input for 28 October 2013.
Time Number of FC Number of RC Number of OC or NC
07:30 0 0 0
08:00 0 0 9
08:30 0 0 12
09:00 0 0 12
09:30 0 0 12
10:00 0 0 1
10:30 0 0 8
11:00 0 0 8
11:30 0 0 4
12:00 0 0 0
12:30 0 0 0
13:00 0 0 0
13:30 0 0 0
14:00 0 0 0
14:30 0 0 0
15:00 0 0 1
15:30 0 0 3
16:00 0 0 0
16:30 0 0 0
17:00 0 0 0
Table 5.11: The specific input for the standard model for 28 October 2013.
Putting this information in the standard model, yields the following graphs.
37
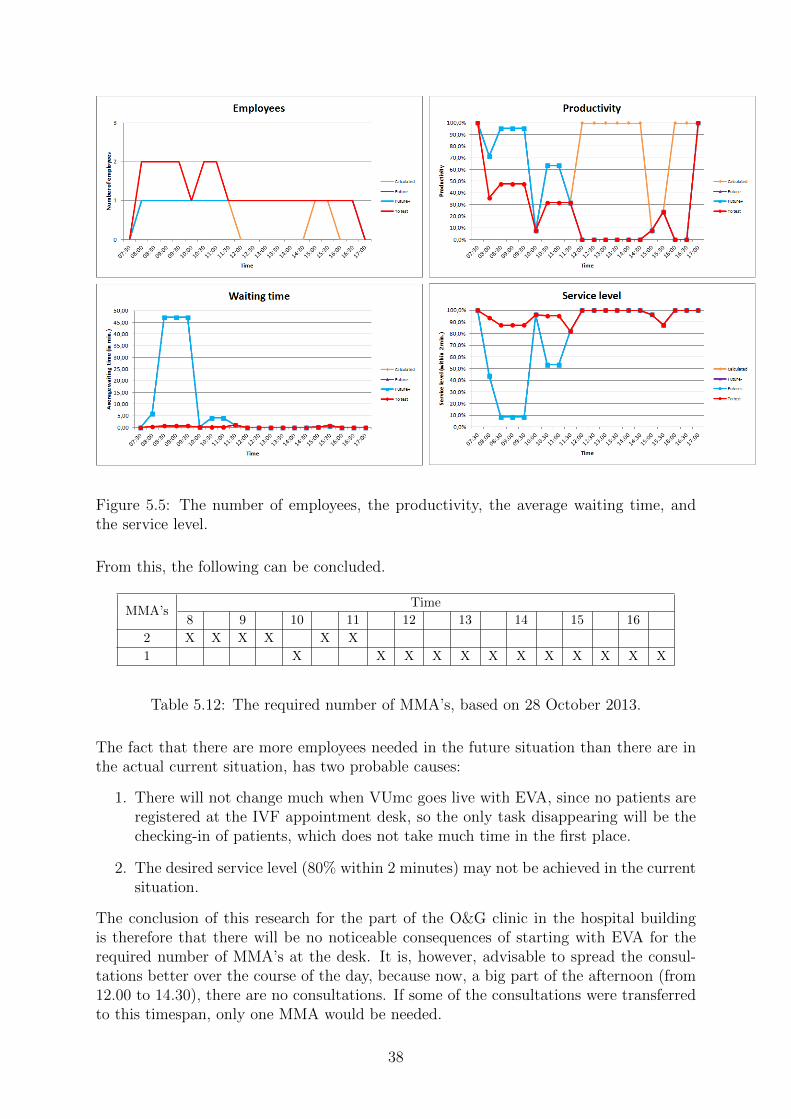
Figure 5.5: The number of employees, the productivity, the average waiting time, andthe service level.
From this, the following can be concluded.
MMA’sTime
8 9 10 11 12 13 14 15 16
2 X X X X X X
1 X X X X X X X X X X X X
Table 5.12: The required number of MMA’s, based on 28 October 2013.
The fact that there are more employees needed in the future situation than there are inthe actual current situation, has two probable causes:
1. There will not change much when VUmc goes live with EVA, since no patients areregistered at the IVF appointment desk, so the only task disappearing will be thechecking-in of patients, which does not take much time in the first place.
2. The desired service level (80% within 2 minutes) may not be achieved in the currentsituation.
The conclusion of this research for the part of the O&G clinic in the hospital buildingis therefore that there will be no noticeable consequences of starting with EVA for therequired number of MMA’s at the desk. It is, however, advisable to spread the consul-tations better over the course of the day, because now, a big part of the afternoon (from12.00 to 14.30), there are no consultations. If some of the consultations were transferredto this timespan, only one MMA would be needed.
38
Chapter 6
Optimal number of consultations
In this chapter, the model made for the second part of this research is explained. Thismodel calculates how many consultations there should be to ensure a high efficiency of theemployees, while maintaining a desired service level for the patients. These calculationsare done with help of the Erlang C formulas. The required input is quite similar to theinput of the models of Chapters 4 and 5, with the exception that there is no specific dayneeded. The parameters needed as input are as follows:
• The (estimated) percentage of the operation or nurse consultations that are com-bined with a repeat consultation.
• The number of consultations per visiting hour.
• The desired service level with corresponding ‘maximum’ waiting time; hence, thedesired percentage of patients that is helped within a certain timespan.
• The service time of making a new appointment in minutes.
The model then examines what the consequences of changing the number of visiting hoursare. It generates the following output:
• The required number of MMA’s at the desk to ensure the desired service level.
• The utilization factor of the MMA’s at the desk.
This output is displayed in clarifying graphs, with on the horizontal axis the numberof visiting hours held simultaneously, so it can be easily seen at what point an extraemployee is needed and what that means for the other quantities. One of the things thatcan be clearly seen this way is the economies of scale. As an example, the data of all theoutpatient clinics of VUmc has been used as input. This data is as follows.
VUmc
Number of first consultations in 2013 91,075
Number of repeat consultations in 2013 236,495
Number of operation or nurse consultations in 2013 194,766
Table 6.1: The input for the model.
The desired service level is set to 80% within 2 minutes, and the service time of makinga new appointment is taken to be 2.38 minutes, as in the 2004 model. The (estimated)
39

percentage of the operation or nurse consultations that are combined with a repeat consul-tation is chosen to be 50%. This is pure choice, there is no estimation made. The numberof consultations per visiting hours is equal to 4 in this example. For the calculations,it does not matter if these consultations are first consultations, repeat consultations, oroperation or nurse consultations, since there is only one task, making new appointments,which is the same for all types of consultations. Putting this information in the modelmade for the second part, yields the following graphs and corresponding table.
Figure 6.1: The number of employees and the productivity, with on the horizontal axisthe number of visiting hours held simultaneously.
Number of visiting hours Number of employees Productivity
19 5 76.6%
20
6
65.9%
21 68.0%
22 70.0%
23 72.1%
24 74.2%
25 76.3%
26 78.3%
27 80.4%
28 7 70.7%
Table 6.2: Part of the table corresponding to the graphs in Figure 6.1.
The research question for this part of the research was as follows: How many consultationsshould there be held per MMA at the desk in the future situation to achieve the highestpossible efficiency, keeping the following criteria in mind:
- The service level.
- The number of patients attending the outpatient clinic.
In the table below, it can be seen how these quantities are related.
40

Number of MMA’s Number of visiting hours Productivity Number of patients per hour
3 1 – 4 52.8% – 65.2% 4 – 16
4 5 – 11 52.1% – 70.8% 20 – 44
5 12 – 19 59.1% – 76.6% 48 – 76
6 20 – 27 65.9% – 80.4% 80 – 108
7 28 – 34 70.7% – 81.4% 112 – 136
8 35 – 42 72.8% – 83.7% 140 – 168
9 43 – 50 75.8% – 85.5% 172 – 200
Table 6.3: The relation between the number of desk employees, the productivity of thedesk employees, and the number of patients.
This table starts with 3 MMA’s, because that is the minimal number of employees neededper hour to answer the telephone calls of patients that want to make an appointment fora first consultation.
From these graphs and tables, it can be concluded, for example, that in order toachieve a productivity of 80% while maintaining a service level of at least 80% within 2minutes, 27 visiting hours have to be held simultaneously. For a day with these visitinghours, 6 employees are needed per hour. From this, the economies of scale comes forward,because it is necessary to hold at least 27 visiting hours simultaneously to achieve an 80%productivity, which means that, in this example, there are at least 108 consultations perhour. Obviously, this is only possible if there are many patients that need consultation.For one outpatient clinic itself, an 80% productivity can never be achieved if the desiredservice level is maintained.
41

Appendix A
Standard model
Below are images of the sheets of the standard model made in Excel. Here, OC standsfor operation consultation, and NC stands for nurse consultation. Now follow the expla-nations corresponding to each of these sheets. In these explanations, references to inputcells of the specific sheet are in italic, and references to output cells are in bold.
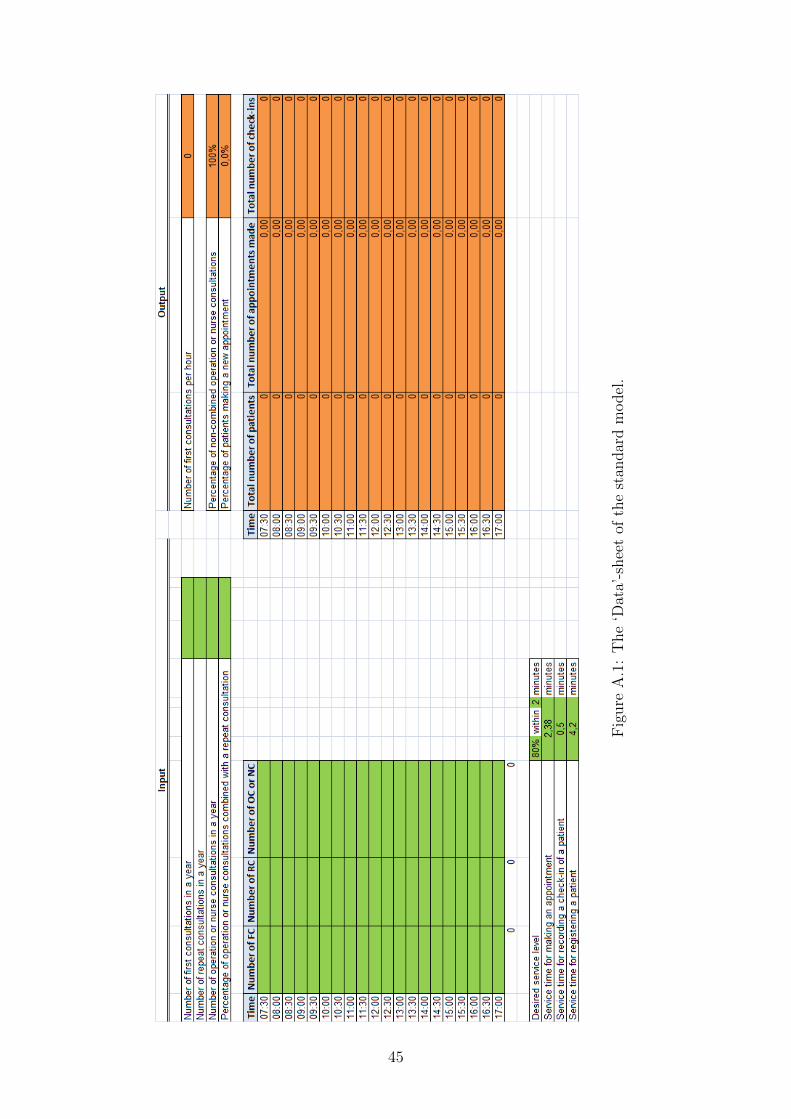
‘Data’-sheet
In the ‘Data’-sheet, the required data input has to be filled in. As can be seen in Fig-ure A.1 below, this input consists of the number of consultations in a year, the (estimated)percentage of operation or nurse consultations that are combined with a repeat consulta-tion, the number of consultations per half hour on a specific day, the desired service level,and the service times. The cells of the service times are already filled in in Figure A.1.The values in these cells are the same values used in the 2004 model. These values havebeen checked again in 2013 with the four outpatient clinics mentioned in Subsection 1.2.1,and for the outpatient clinics for which this particular input is unknown, the values asdepicted in the image are used. The calculations behind the output cells are as follows:
• Number of first consultations per hourAs explained in Chapter 4, this equals the number of FC in a year divided by 275·9.
• Percentage of non-combined operation or nurse consultationsThis is equal to 100% minus the percentage of OC or NC combined with an RC.
• Percentage of patients making a new appointmentThis has also been explained in Chapter 4. The calculation behind this cell is(number of RC in a year + percentage of non-combined OC or NC × numberof OC or NC in a year) / (number of FC in a year + number of RC in a year +percentage of non-combined OC or NC × number of OC or NC in a year).
• Total number of patientsThis is calculated per half hour and it is equal to the number of FC, plus the numberof RC, plus the percentage of non-combined OC or NC times the number ofOC or NC.
• Total number of appointments madeThis is also calculated per half hour. It equals the total number of patientstimes the percentage of patients making a new appointment.
42
• Total number of check-insJust like the two outputs above, this is calculated per half hour. It is equal to thenumber of RC, plus the percentage of non-combined OC or NC times thenumber of OC or NC, since the patients coming for a first consultation do not needto check-in after their registration in the case that all patients go to the same desk.
‘Comparison’-sheet
There are two sheets that calculate the required number of employees for the currentsituation and the future situation. These calculations are done as described at the end ofChapter 3. In the ‘Comparison’-sheet, the outcome of the two sheets mentioned above,the calculated current and calculated future situation, are compared to each other andto the actual current situation. Also, it contains a table with the possibility of testingwhat happens if the number of employees is altered. This sheet is depicted in Figure A.2.The columns labeled ‘Productivity’, ‘Average waiting time (in min.)’, and ‘Service level’speak for themselves. These quantities are also described in Chapter 3.
• Input:
– Calculated currentThis is the outcome of the calculations of the required number of employeesfor the current situation.
– Calculated futureThis is the outcome of the calculations of the required number of employeesfor the future situation.
– Actual currentThis is the number of employees that currently occupy the desk.
• Output:
– % differenceThis is the difference in terms of percentage between calculated current andcalculated future.
– Expected futureThis is the number of employees expected to be required in the future situation,based on actual current and the % difference. It is equal to actual current,minus the % difference times actual current.
– DifferenceThis is the difference between actual current and expected future.
– Future−This is expected future rounded down.
– Future+This is expected future rounded up.
43

• To test:
– Number of employeesHere, any number of employees can be filled in to see what happens with theproductivity, average waiting time, and service level. It is automatically setto equal future− minus 1, with a minimum of one employee, but it is meantto be altered as desired.
‘Graphs’-sheet
At the top of the ‘Graphs’-sheet, the image of which is shown in Figure A.3, it can be seenhow many first consultations, repeat consultations, and operation or nurse consultationscontributed to the outcomes of the calculations. This is just to get an impression of thecorrelation between the number of consultations and the required number of employees.In the graphs, it can be seen how many employees there are, what their productivity is,what the average waiting time for the patients is (in minutes), and what the service levelis (percentage of patients helped within 2 minutes, in this case), all per half hour. Thegraphs are drawn for ‘calculated future’, ‘future−’, ‘future+’, and ‘to test’. The ‘to test’-graph can be altered, as explained in the section above, to fit the number of employeesconcluded to be acceptable. For example, assume that there are two employees neededfrom 10:00 to 10:30 to acquire a service level of minimum 80%. With the ‘to test’-graph,it can be tested what the consequences are if there is one employee from 10:00 to 10:30. Ifthis results in a service level of, say, 72% with an average waiting time of 1.8 minutes, thatcould also be found acceptable. In that case, the conclusion would be that one employeeis required, though the calculations as described in Chapter 3 have two employees asoutcome.
Remark. The graphs in Figure A.3 are based on a fictitious input, for which the ‘totest’-graph is fitted.
44
Fig
ure
A.1
:T
he
‘Dat
a’-s
hee
tof
the
stan
dar
dm
odel
.
45

Fig
ure
A.2
:T
he
‘Com
par
ison
’-sh
eet
ofth
est
andar
dm
odel
.
46

Fig
ure
A.3
:T
he
‘Gra
phs’
-shee
tof
the
stan
dar
dm
odel
.
47

Appendix B
Combined results model
Below are images of the sheets of the combined results model made in Excel. Now followthe explanations corresponding to each of these sheets.
‘Data’-sheet
In the ‘Data’-sheet, the required data input has to be filled in. As can be seen in Figure B.1below, this input consists solely of the number of consultations per half hour on a specificday. In this case, the data should be of all considered desks together.
‘Results separate desks’-sheet
The input of the ‘Results separate desks’-sheet is formed by the results of the separatedesks. This sheet is depicted in Figure B.2. All of the required information can be copy-pasted from the standard models, where the columns number of employees through servicelevel should be the fitted ‘to test’ columns of the ‘Comparison’-sheet, see Appendix A.Of course, more desks can be added to the calculations, or only two of the three can befilled in. The output is formed by the combined results in the input cells.
• Total number of employeesThis is the sum of the number of employees of the separate desks.
• Average productivityThis is the average of the productivity of the employees. (So this is not the averageof the productivity per desk, but per employee.)
• Average waiting time (in min.)This is the weighed average of the average waiting times of the desks. (It is weighedaccording to the number of patients at the desks.)
• Average service levelThis is the weighed average of the service levels of the desks. (Again, weighed bythe number of patients.)
48

‘Graphs’-sheet
At the top of the ‘Graphs’-sheet, the image of which is shown in Figure B.3, it can be seenhow many first consultations, repeat consultations, and operation or nurse consultationscontributed to the outcomes of the calculations. Again, this is just to get an impressionof the correlation between the number of consultations and the required number of em-ployees. In the graphs, it can be seen how many employees there are in total, what theiraverage productivity is, what the average waiting time for the patients is (in minutes),and what the average service level is (percentage of patients helped within 2 minutes, inthis case), all per half hour.
Remark. The graphs in Figure B.3 are based on a fictitious input.
49

Fig
ure
B.1
:T
he
‘Dat
a’-s
hee
tof
the
com
bin
edre
sult
sm
odel
.
50

Fig
ure
B.2
:T
he
‘Res
ult
sse
par
ate
des
ks’
-shee
tof
the
com
bin
edre
sult
sm
odel
.
51

Fig
ure
B.3
:T
he
‘Gra
phs’
-shee
tof
the
com
bin
edre
sult
sm
odel
.
52
Appendix C
One desk model
Below are images of the sheets of the one desk model made in Excel. Now follow theexplanations corresponding to each of these sheets. In these explanations, references toinput cells of the specific sheet are in italic, and references to output cells are in bold.
‘Data’-sheet
In the ‘Data’-sheet, the required data input has to be filled in. As can be seen in Fig-ure C.1 below, this sheet is exactly the same as the ‘Data’-sheet of the standard model.In this case, the data should be of all specialisms included in the desk together.
‘Graphs’-sheet
The ‘Graphs’-sheet is depicted in Figure C.2. This sheet is almost the same as the‘Graphs’-sheet of the standard model, with the exception that there are no graphs for‘future−’ and ‘future+’. The reason for this is that there is no actual current situation tocompare it with, since in the current situation, the desks are not combined. For the samereason, there is no ‘Comparison’-sheet in the one desk model, and the ‘to test’ columnsare on the same sheet as the calculations of the future situation, where its automaticsetting is the calculated future situation minus 1, with a minimum of one employee.
Remark. The graphs in Figure C.2 are based on a fictitious input, for which the ‘totest’-graph is fitted.
53
Fig
ure
C.1
:T
he
‘Dat
a’-s
hee
tof
the
one
des
km
odel
.
54

Fig
ure
C.2
:T
he
‘Gra
phs’
-shee
tof
the
one
des
km
odel
.
55

Appendix D
Example: Internal Medicine
In this appendix, the results and conclusions of one other outpatient clinic are shown asexample. The example clinic is Internal Medicine, which will be abbreviated by IM.
Below is the table with the overview of the desks belonging to IM. The specialismsof IM are Dermatology, Allergology, Light Therapy, General Internal Medicine, ClinicalGeriatrics, Rheumatology, and Gender Dysphoria.
Registrationdesk
DeskHours ofoperation
Separateregistration?
Number ofemployees now
Desk N
Allergology 8.00-17.30Yes, at
Dermatology desk.1 MMA.
Light Therapy 8.00-17.00 n/a1 nurse, noadministration atthis desk.
Dermatology 8.00-17.30 Yes
1 MMA onregistration.2 MMA’s oncheck-in andappointments.
Desk W4
Day treatment 8.00-13.00 n/a 1 MMA.
General InternalMedicine
7.30-17.00 No
1 MMA from7.30-8.00.2 MMA’s from8.00-17.00.
Desk MClinical Geriatrics& Rheumatology
7.30-17.00 No
1 MMA from7.30-8.00.2 MMA’s from8.00-17.00.
Desk K Gender Dysphoria 7.30-17.00Yes, in a separate
room.
2 MMA’s at phonedesk.1 MMA to deskwhen patientcomes.1 MMA from backoffice toregistration roomwhen new patientcomes.
Table D.1: The desks belonging to IM.
56

The desks of interest for this research are the desks of Allergology, Dermatology, GeneralInternal Medicine, and Clinical Geriatrics & Rheumatology. The Light Therapy desk andDay treatment desk have a different kind of administration, and Gender Dysphoria is toosmall to do calculations with, so those desks will be out of scope. At all desks, the servicetime for registering a patient is equal to 6 minutes. The other service times are the sameas in the 2004 model.
Registration desk N
The data of Allergology is contained in the data of Dermatology and there was no timeto filter this during this research, so the only thing to analyze for this registration deskis combining the two desks into one desk. The day picked for this desk is 29 October2013. The percentage of operation or nurse consultations that are combined with a repeatconsultation is estimated to be 100%. The following can be concluded.
MMA’sTime
8 9 10 11 12 13 14 15 16 17
2 X X X X X X X
1 X X X X X X X X X X X X
Table D.2: The required number of MMA’s, based on 29 October 2013.
In the current situation, 4 MMA’s are needed per day to occupy both desks. Combiningthe desks has as result that only 2 MMA’s are needed in the future situation.
General Internal Medicine desk
This desk can be analyzed with the standard model. The day picked for this desk is28 October 2013. The percentage of operation or nurse consultations that are combinedwith a repeat consultation is estimated to be 40%. The following can be concluded.
MMA’sTime
8 9 10 11 12 13 14 15 16
2 X X X X X X X X X X
1 X X X X X X X X X
Table D.3: The required number of MMA’s, based on 28 October 2013.
Clinical Geriatrics & Rheumatology desk
This desk can be analyzed with the standard model. The day picked for this desk is28 October 2013. The percentage of operation or nurse consultations that are combinedwith a repeat consultation is estimated to be 25%. The following can be concluded.
57

MMA’sTime
8 9 10 11 12 13 14 15 16
2
1 X X X X X X X X X X X X X X X X X X X
Table D.4: The required number of MMA’s, based on 28 October 2013.
In the future situation, one less MMA is needed at the desk.
58
Bibliography
[1] Ger Koole. Optimization of business processes. Version of February 19, 2014.
[2] Ger Koole and Rene Bekker. Methoden en Modellen voor Zorglogistiek. MG books,2013.
[3] J.R. Norris. Markov Chains. Cambridge University Press, fifteenth edition, 2009.
[4] Stichting VU-VUmc. Jaarverslag 2012. Annual report, VUmc, 2013.
59