the european union emissions trading scheme (eu-ets) insights and
TRANSCRIPT

THE EUROPEAN UNION EMISSIONS TRADING SCHEME (EU-ETS) INSIGHTS AND OPPORTUNITIES Synopsis The European Union Emissions Trading System (EU-ETS) is a landmark environmental policy, representing the world’s first large-scale greenhouse gas (GHG) trading program, covering around 12,000 installations in 25 countries and 6 major industrial sectors. The EU-ETS offers an opportunity for critical insights into the design and implementation of a market-based environmental program of such size and complexity. In addition, key lessons based on actual experiences of emissions trading will include the cost of emissions reductions, the implications on competitiveness of sectors and firms, and the development of new technologies and efficiency opportunities. This analysis discusses the background to the EU-ETS in the context of ongoing emission abatement efforts and policy initiatives to meet EU-25 member state targets under the Kyoto Protocol. The key elements of the EU-ETS are detailed, focusing on its timetable, sectoral coverage, methodology for distributing emission allowances, provisions for banking, opt-outs, opt-ins and pooling mechanisms, the procedures for monitoring and verification, and the compliance mechanisms. The paper then turns to the current status of the EU-ETS, focusing on the ongoing national allocation plans, and discussing key remaining uncertainties, namely the readiness of all parties to trade, linkages to other trading programs, availability and use of project-based allowances, the impact of Russian emission credits, strategies of new Central and Eastern European member states, the compliance role of governments, progress in emissions reductions from sectors outside the EU-ETS, and finally the importance of expectations of future targets and prices. This paper concludes with early conclusions from this first large-scale GHG emissions trading program. The EU-ETS is up and running with significant trading volumes; it looks set to deliver real (vs. BAU) but modest reductions; these reductions are focused on the power sector; and ongoing concerns remain regarding detrimental impacts on industry competitiveness and the impact of higher electricity prices. Key remaining challenges include the remaining implementation issues of this novel trading system, and to retain political support for the EU-ETS in the years ahead. Key insights from the EU-ETS will include the price, traded volume and cost-savings from GHG trading, the longer term implications of the EU-ETS for technology development and the progression of global climate change policies, and direct lessons for U.S. policy makers as they debate domestic GHG trading proposals. 1. Introduction A. Background On January 1, 2005 the world’s first large-scale greenhouse gas emissions trading program opened for business – the European Union’s Emissions Trading Scheme (EU-ETS) – covering installations across all 25 EU member states. This article explains the background and
1
framework of the EU-ETS, and explores the uncertainties and potential lessons from this landmark climate policy. Emissions trading has emerged over the last two decades as the preferred environmental policy tool. The key advantage of emissions trading is that firms can flexibly choose to meet their targets, rather than use predetermined technologies or standards – i.e., command-and-control policies. Emissions sources with low-cost reduction opportunities can over comply and sell their additional allowances1 to sources where reductions would be more difficult and costly. This leads to the lowest overall cost, or most economically efficient solution. Emissions trading is particularly relevant to climate change mitigation as carbon dioxide (CO2) and other greenhouse gases (GHGs) have the same effect wherever they are emitted and compliance costs differ dramatically across sources. Hence there is considerable scope for trading, and opportunity for considerable gains from these trades. Experience in the United States and other countries has shown that well-designed emissions trading programs can reduce environmental policy costs by as much as 50%. In order to achieve its environmental goals cost-effectively, a range of implementation issues in the EU-ETS needed to be addressed. In particular, as a continent-wide trading scheme across a range of industries, the EU-ETS required the construction of a novel regulatory system. This process continues to generate intense debate over near- and long-term economic and political consequences. This paper discusses the history and motivations behind the EU-ETS, the progress towards implementation, the principal uncertainties, and the key insights for both European and U.S. policy-makers. B. History of the EU-ETS The origins of the EU-ETS date back to 1992 when 180 countries signed the United Nations Framework Convention on Climate Change (UNFCCC) which had the stated goal to “stabilize atmospheric GHG concentrations at ‘safe’ levels”). Following negotiations under this agreement, the Kyoto Protocol was signed in 1997, committing the industrialized nations to an averaged 5.2% reduction from 1990 levels by the first commitment period in 2008-2012. With ratification by the European nations, Canada, Japan, New Zealand and now Russia, the Kyoto Protocol went into effect on Feb 16, 2005. Under the Kyoto treaty the existing EU-15 nations agreed to meet their commitment of an 8% GHG emissions reduction collectively (under the EU-15 “Bubble”). Despite considerable reductions in the UK (due to a structural switch from coal to natural gas) and Germany (due to modernization of ex-communist East Germany), by 2000 many EU countries had difficulty slowing and reducing their GHG emissions (Table 2). As a result the EU-ETS was enacted as one of the policy measures to enable the EU to meet its Kyoto targets. With the accession of 10 new EU members in May 2004 from Central and Eastern Europe (whose GHG emissions had generally declined due to economic restructuring, see Table 3), the future EU-ETS was expanded to 25 countries (Figure 1).
1 In the EU-ETS terminology, allowances are the transferable emissions quantity.
2

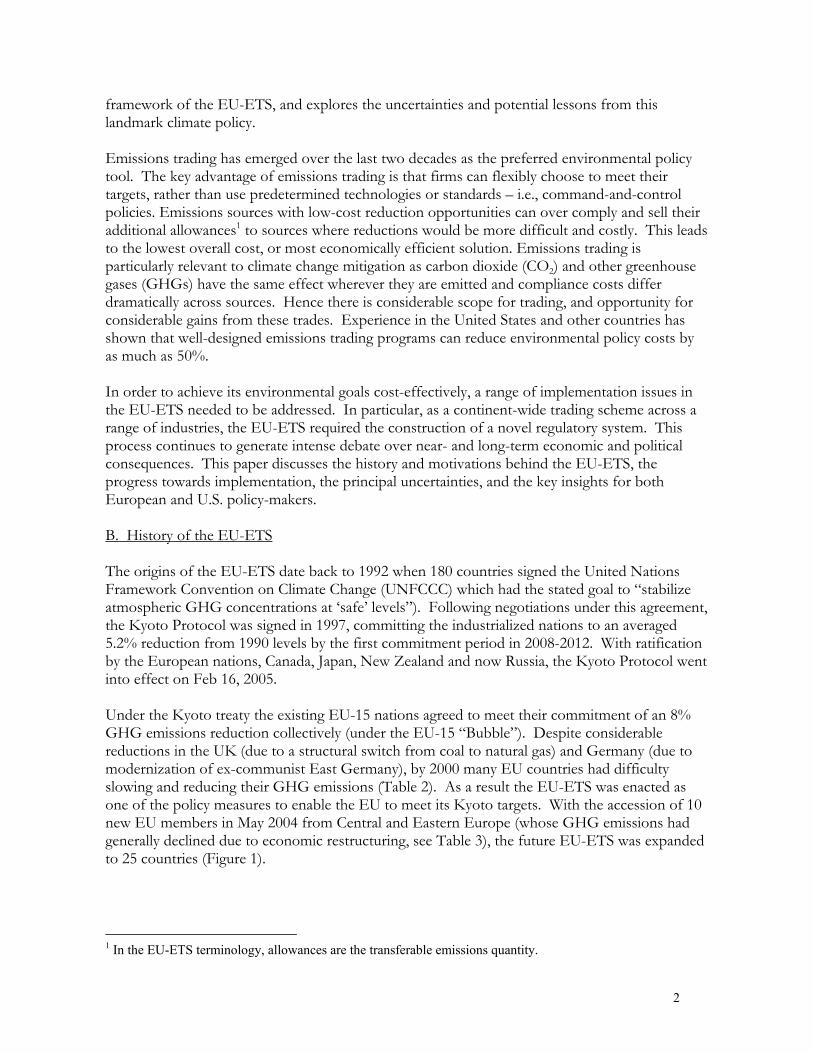
Figure 1: European member states under the EU-ETS
(Source: Kruger and Pizer, 2004) Given the need to enact policies in light of the Kyoto targets, the development of the EU-ETS proceeded swiftly and was politically agreed in principle by the EU Council of Environment Ministers on December 9, 2002 following a first reading of the Draft Directive on CO2 emission trading in the European Parliament. After a second reading in Parliament and Council, the EU-ETS Directive was formally adopted and entered into force on October 13, 2003. A supplement to this Directive regarding linkages to other trading systems and projects was accepted in May 2004. It should be emphasized that the EU-ETS is only one of a range of policy measures in the EU designed to reduce GHG emissions levels to meet Kyoto targets. Specifically only the electricity and several major industrial sectors are covered under the EU-ETS. C. Comparison to other Environmental Trading Programs Simply stated, the EU-ETS dwarfs all existing early GHG trading systems2 as well as the U.S programs designed to control sulfur dioxide (SO2) under the Clean Air Act Amendments and
2 The EU-ETS is comparable in scope to the proposed Lieberman-McCain Climate Stewardship Act, although administratively more multifaceted.
3
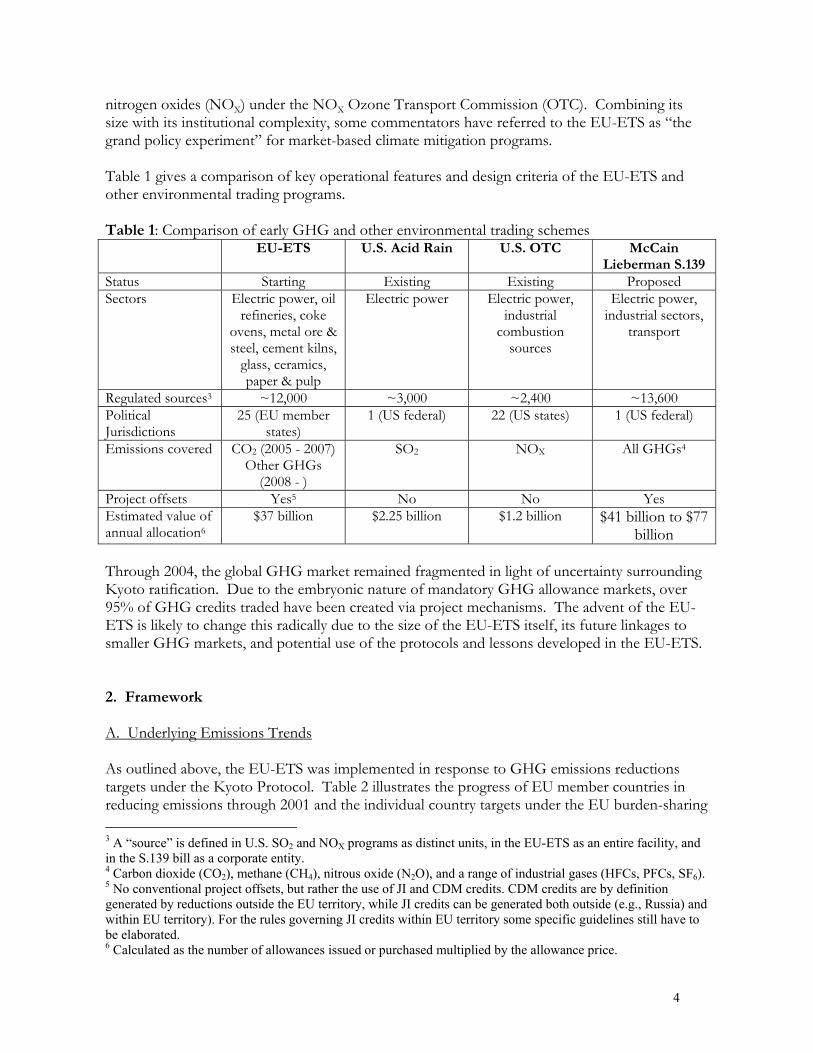
nitrogen oxides (NOX) under the NOX Ozone Transport Commission (OTC). Combining its size with its institutional complexity, some commentators have referred to the EU-ETS as “the grand policy experiment” for market-based climate mitigation programs. Table 1 gives a comparison of key operational features and design criteria of the EU-ETS and other environmental trading programs. Table 1: Comparison of early GHG and other environmental trading schemes EU-ETS U.S. Acid Rain U.S. OTC McCain
Lieberman S.139 Status Starting Existing Existing Proposed Sectors Electric power, oil
refineries, coke ovens, metal ore & steel, cement kilns,
glass, ceramics, paper & pulp
Electric power Electric power, industrial
combustion sources
Electric power, industrial sectors,
transport
Regulated sources3 ~12,000 ~3,000 ~2,400 ~13,600 Political Jurisdictions
25 (EU member states)
1 (US federal) 22 (US states) 1 (US federal)
Emissions covered CO2 (2005 - 2007) Other GHGs
(2008 - )
SO2 NOX All GHGs4
Project offsets Yes5 No No Yes Estimated value of annual allocation6
$37 billion $2.25 billion $1.2 billion $41 billion to $77 billion
Through 2004, the global GHG market remained fragmented in light of uncertainty surrounding Kyoto ratification. Due to the embryonic nature of mandatory GHG allowance markets, over 95% of GHG credits traded have been created via project mechanisms. The advent of the EU-ETS is likely to change this radically due to the size of the EU-ETS itself, its future linkages to smaller GHG markets, and potential use of the protocols and lessons developed in the EU-ETS. 2. Framework A. Underlying Emissions Trends As outlined above, the EU-ETS was implemented in response to GHG emissions reductions targets under the Kyoto Protocol. Table 2 illustrates the progress of EU member countries in reducing emissions through 2001 and the individual country targets under the EU burden-sharing 3 A “source” is defined in U.S. SO2 and NOX programs as distinct units, in the EU-ETS as an entire facility, and in the S.139 bill as a corporate entity. 4 Carbon dioxide (CO2), methane (CH4), nitrous oxide (N2O), and a range of industrial gases (HFCs, PFCs, SF6). 5 No conventional project offsets, but rather the use of JI and CDM credits. CDM credits are by definition generated by reductions outside the EU territory, while JI credits can be generated both outside (e.g., Russia) and within EU territory). For the rules governing JI credits within EU territory some specific guidelines still have to be elaborated. 6 Calculated as the number of allowances issued or purchased multiplied by the allowance price.
4

agreement. Although overall considerable progress appears to have been made in reducing GHG emissions, this overall result is skewed by the fortuitous reductions by Germany and the UK. Emission levels in other EU nations, especially the southern European countries, have increased considerably. Overall, an upward pressure on GHG emissions levels will remain as the EU economy continues to expand, and this realization was a major impetus in the implementation of the EU-ETS as a cost-effective policy lever to reduce GHG emissions. Table 2: EU-15 country GHG emissions: 1990-20017 GHG emissions (MTCO2e) 1990 2001
% change (1990-2001)
Kyoto target (under EU burden sharing)
Luxembourg 10.9 6.1 -44.0% -28.0% Germany 1,216.2 993.5 -18.3% -21.0% United Kingdom 747.2 657.2 -12.0% -12.5% Sweden 72.9 70.5 -3.3% +4.0% Denmark 69.5 69.4 -0.1% -21.0% France 558.4 560.8 +0.4% 0% Netherlands 211.1 219.7 +4.1% -6.0% Finland 77.2 80.9 +4.8% 0% Belgium 141.2 150.2 +6.4% -7.5% Italy 509.3 545.4 +7.1% -6.5% Austria 78.3 85.9 +9.7% -13.0% Greece 107.0 132.2 +23.6% +25.0% Ireland 53.4 70.0 +31.1% +13.0% Spain 289.9 382.8 +32.0% +15.0% Portugal 61.4 83.8 +36.5% +27.0% EU-15 4,203.9 4,108.3 -2.3% -8.0% (Source: EEA, 2004) Achievement of the overall reduction goal has been helped by the accession of 10 new countries from Eastern Europe whose aggregated emissions are considerably less than their own Kyoto targets following their economic restructuring over the last decade (Table 3). The inclusion of these new countries in the EU-ETS also strengthens the importance of emissions trading as it increases the diversity of emission reduction options and hence the gains to trade.8 It should be noted however that as the accession countries’ own economies grow, their available emission allowances for sale will be reduced (e.g., Hungary and Slovenia). Table 3: New accession (AC-10) country GHG emissions: 1990-2001 GHG emissions (MTCO2e) 1990 2001
% change (1990-2001) Kyoto target
Lithuania 51.5 20.2 -60.8% -8.0% Latvia 29.0 11.4 -60.7% -8.0%
Estonia 43.5 19.4 -55.4% -8.0%
7 Updated totals for 2002 are available at http://europa.eu.int/comm/environment/climat/pdf/report.pdf and http://europa.eu.int/comm/environment/climat/progress_report.htm. 8 Note that some new EU member states have different base years than 1990 for purposes of meeting overall Kyoto targets.
5

Slovakia 72.2 50.1 -30.6% -8.0% Czech Republic 192.0 148.0 -22.9% -8.0%
Poland 458.9 382.8 -16.6% -6.0% Hungary 86.6 84.3 -2.7% -8.0% Slovenia 18.3 20.2 10.4% -8.0% AC-10 952.0 736.4 -22.6% -7.1%
Note: Cyprus and Malta not listed (Source: EEA, 2004) In estimating the total size and structure of the EU-ETS, one must first project the expected growth of economy-wide GHG emissions in the EU member states. Figure 2 depicts one projection from the European Environment Agency that includes policy measures already announced by member states. These emission reduction policies focus on the energy use sector (renewable energy, combined heat and power [CHP], buildings standards and energy efficiency standards for appliances), transportation (voluntary automobile emissions standards), and waste activities (reductions in methane emissions through the EU Landfill Directive). However, even with these measures, GHG emissions over the next 10 years are expected to grow to over 300 MTCO2 above the Kyoto target. The available allowances from the new Central and Eastern European members are projected to be only 6% to 20% of their Kyoto targets (or 60 to 190 MTCO2), still leaving a considerable shortfall to make up. These remaining emission reductions opportunities can either come through project-based mechanisms with other developed or developing countries, through carbon sequestration in forests and agriculture, or through cost-effective domestic action such as the EU-ETS is designed to achieve. Figure 2: Projected EU-15 GHG emissions levels
(Source: EEA, 2004) It should be noted that the fastest growing major source of GHG emissions in Europe continues to be transportation (both ground and aviation), which has risen by 34% since 1990, and remains
6

politically challenging to address. The EU-ETS focuses only on large point sources of energy-related emissions, which recorded a much more modest increase of 2% relative to 1990. This report now turns to the scope and implementation of the EU-ETS. B. Key Elements of the EU-ETS Although the principal components of the EU-ETS have been finalized, a number of key implementation decisions—notably the national allocation plans or NAPs (see section 3)—have been the subject of intense debate. Timetable. The EU-ETS officially began on January 1, 2005 and consists of a “warm-up” phase from 2005-2007 and then successive 5-year periods, with the second phase from 2008-2012 set to coincide with the Kyoto compliance period. The first phase is focused only on CO2 (the principal greenhouse gas) and on a range of large installations in key industrial sectors. The overall cap (and hence the stringency of the program and the resulting cost of emissions reductions) in the emissions trading scheme is made up of individual country caps set by each nation’s national allocation plan (NAP). The second phase on the EU-ETS will run for 5 years from January 1, 2008, will involve tighter overall caps (in line with the economy-wide emissions target under the Kyoto Protocol) and may be expanded to other GHGs (depending on available verification) and additional sources and sectors (e.g., aluminum and aviation). Sectoral Coverage. Six key industrial sectors are covered, notably electricity and heat production plants greater than 20MW capacity9. Other included sectors (with specific facility size thresholds) are oil refineries, coke ovens, metal ore and steel installations, cement kilns, glass manufacturing, ceramics manufacturing, and paper, pulp and board mills. These sectors are likely to account for around 12,000 installations (depending on the final details of the specification process), and represent close to half of the total CO2 emissions from the EU-25 countries. Transportation and building energy use are the largest sectors not included in the EU-ETS. Distribution of Allowances. The EU-ETS is a cap-and-trade program where a fixed amount of emissions allowances are allocated (via the individual country NAPs). From 2005-2007 most permits are likely to be given away free (either grandfathered to a base year or on an updating basis). Five percent can be auctioned in the first phase10; from 2008 onwards, ten percent auctioning is allowed. An allowance has to be surrendered on an annual basis for each ton of CO2 emitted. Firms under the EU-ETS can choose the installations at which they reduce emissions to meet their overall quota, over-comply and sell allowances to firms whose operations have higher-cost mitigation opportunities, or under-comply and purchase allowances to make up the difference. Thus both parties benefit from the trade and the overall environmental target is met at lowest cost. Banking of Allowances. Banking of excess reductions (i.e., allowances) for future years is allowed within the first compliance period (phase of the EU-ETS). Regarding the use of banking between phases, this is at the discretion of member states between the 2005-2007 to 2008-2012
9 To put a 20MW plant in context: 20MW coal steam turbine operating 8,000 hrs/annum = 158,000 tons of CO2 or 43,200 tons of carbon 20MW natural gas CCGT operating 5,000 hrs/annum = 45,000 tons of CO2 or 12,300 tons of carbon. 10 Hungary, Denmark and Lithuania have decided to auction some allowances.
7

periods, and is mandatory for future periods. Such intertemporal flexibility further reduces costs of compliance. Opt-outs, Opt-ins and Pooling. During the negotiation of the EU-ETS a key concession won by some member states was the provision of “opt-outs” if a firm was judged to be undertaking equivalent efforts to reduce CO2 emissions. One example of equivalent effort would be a firm that has undertaken targets in a preceding emissions trading scheme such as the UK-ETS. Such opt-outs cannot apply to entire sectors, just individual installations, and only apply for the first phase of the EU-ETS (i.e., through 2007). Similarly, countries can use “opt-ins” of additional sectors and sources into the EU-ETS assuming that the required inventories and monitoring are in place. A final option is aggregation or “pooling” of installations within sectors, if firms want to co-operate to meet an entire industry’s emissions target collectively. Monitoring and Verification. Monitoring and reporting of an installation’s emissions are carried out based on binding EU-wide guidelines11 mainly through fuel purchases and use of emissions factors, although continuous monitoring and third party verification are allowed. All self-reported emissions must be verified by an independent third party (similar to an auditor reviewing a firm’s financial accounts). Methodologies are under development to allow inclusion of additional sources, greenhouse gases and emissions factors. On the side of allowance trading, a registry (hub-and-spoke system) has been put in place with a European hub and 25 national spokes. Hence trades are verified through up to three electronic data systems, one each in the countries of the seller and the buyer and a central register operated by the European Commission. Compliance. Hefty fines exists for non-compliance (40 Euro/TCO2 from 2005-2007, then 100Euro/TCO2 from 2008 onwards12), levels that are considerably higher than most predictions of allowance prices. Firms also need to make up the missed emissions reductions in the next year of the scheme. In addition, only in the first “warm-up” period, a special “force majeure” provision applies that allows, following approval by the European Commission, the issuance of additional, non-transferable allowances to individual installations experiencing unusually high emissions due to a “force majeure” (e.g., act of God) circumstance. Linkages and Project Mechanisms. The Directive lays out the scope for linkages to other emissions trading schemes and, following an amendment, to the project mechanisms of the Kyoto Protocol. Linkages to other trading schemes would be based on bilateral agreements and would promote liquidity in the EU-ETS and hence spur trading. No single bilateral linkage agreement has been concluded yet and there is no linking policy at this stage. Only Norway has requested a link between its scheme and the EU ETS. In terms of project mechanisms, or credits generated from specific reduction efforts, credits from developing countries via the clean development mechanism (CDM) and from other nations via the joint implementation (JI) mechanism, are allowed from the first (2005-07) and second (2008- 11 http://europa.eu.int/comm/environment/climat/pdf/c2004_130_en.pdf. 12 Note, as of January 2005; 1 Euro ~ $1.30; 10Euro/TCO2 = $13/TCO2 = 37Euro/TC = $48/TC.
8

12) phases of the EU-ETS respectively. While no limit applies to the amount of CDM credits companies can use in the first phase, each Member State has to decide ex-ante in the allocation plan for the second phase how many JI and CDM credits it will allow its companies collectively to use for compliance during the period. Biomass sequestration and nuclear power projects will not be allowed as potential projects, and the use of hydro-electric power will be restricted to schemes meeting World Bank guidelines for environmentally sensitive implementation. 3. Implementation of the EU-ETS A. Overview of Current Status Considerable progress in the implementation of the EU-ETS has been made to allow the January 1, 2005 start date. However, some significant issues remain to be finalized, resulting in uncertainty over the overall stringency (and hence allowance price) in this new market, as well as practical details in its implementation. The development of the EU-ETS proceeded swiftly following the initial approval by the European Council of Ministers on December 9, 2002.13 Following a second parliamentary reading and debate the EU-ETS Directive was formally adopted on October 13, 2003, with the supplement to the Directive regarding linkages to other trading systems and projects approved in May 2004. Since the passing of the Directive the EU member countries and the new accession countries have struggled to complete their national allocation plans (NAPs). These NAPs are significantly more complex and far-reaching than the term ‘allocation’ has generally implied in U.S. trading programs. The NAPs set the overall level of emissions reduction effort in the EU-ETS relative to efforts in other sectors of the economy (and in line with targets under the Kyoto Protocol), allocate allowances to the various sectors and installations under the trading program, and establish the provisions for monitoring and compliance. Originally the NAPs of the EU-15 were to be completed by March 31, 2004, with the NAPs of the 10 accession countries due by May 1, 2004. These draft NAPs were to be reviewed by the European Commission in light of a set of 11 criteria in Annex III of the original Directive (2003/87/EC). These focused on the overall level of effort and assessment of progress towards Kyoto targets, the competitive impacts between sectors and countries, consistency with other EU legislation, transparency, and the possibilities for technological improvement. This timetable was viewed as representing a considerable challenge. Some nations (e.g., Denmark) met the original timetable, some (e.g., the UK) submitted early draft NAPs that encountered political opposition, while others (e.g., Greece) have been considerably delayed in submitting their NAP, raising the possibility of legal actions by the European Commission. Table 4 details the implementation timetables of the NAP process, which is discussed in more detail in the next section.
13 In EU decision-making the European Commission proposes new legislation (right of initiative). The European Council, where member countries are represented by their respective ministers (environment ministers in the case of the EU-ETS), and the European Parliament are co-legislators and decide the content of Directives (i.e., pass laws). Then the EU Commission ensures that all legislation is implemented properly.
9

Table 4: Status (January 2005) of implementation of the National Allocation Plans Date Status of
approval Outstanding issues CO2 allowances
MTCO2 (2005-2007)
No. of facilities
Austria 07-Jul-04 Conditional 98.2 205 Denmark 07-Jul-04 Yes 100.5 362 Germany 07-Jul-04 Conditional Allowances: ex-post
adjustments 1497.0 2419
Ireland 07-Jul-04 Yes 67.0 143 Netherlands 07-Jul-04 Yes 285.9 333 Slovenia 07-Jul-04 Yes 26.3 98 Sweden 07-Jul-04 Yes 68.7 499 United Kingdom
07-Jul-04 Conditional Incomplete installation list Provisions for new entrants
736.0 1078
Belgium 20-Oct-04 Yes 188.8 363 Estonia 20-Oct-04 Yes 56.8 43 Finland 20-Oct-04 Conditional Incomplete installation list 136.5 535 France 20-Oct-04 Conditional Incomplete installation list
Allowances: over-allocation 371.1 64214
Latvia 20-Oct-04 Yes 13.7 95 Luxembourg 20-Oct-04 Yes 10.1 19 Portugal 20-Oct-04 Yes 114.5 239 Slovak Republic 20-Oct-04 Yes 91.5 209 Cyprus 28-Dec-04 Yes 17.0 13 Hungary 28-Dec-04 Yes 93.8 261 Lithuania 28-Dec-04 Yes 36.8 93 Malta 28-Dec-04 Yes 8.8 2 Spain 28-Dec-04 Conditional Incomplete installation list 523.7 927 Czech Republic Awaiting Italy Awaiting Greece Awaiting Poland Awaiting Current Total 4,543
( 1,514 annually) 8,57815
While the EU-ETS did not begin until January 2005, the first trade under a forward market of the EU-ETS was made on February 27, 2003 by Shell Trading and NUON (a large Dutch utility). Through September 2004, the forward market was thin, averaging only 50,000 tons CO2 a month with prices edging down from 12 to 9 Euros/TCO2 as uncertainty over Russian ratification of Kyoto and the delays under the NAP process went on. However, since September with the ratification of Kyoto and the imminent start of the EU-ETS (as the NAP process started to conclude), the market volume jumped to around 1 million tons CO2 per month as firms experimented with trading and begin to map out their compliance strategies for the first phase of
14 France has to add another 750 installations in its NAP. 15 Current total of assessed sources is 9,328 when including the 750 additional French installations.
10

the EU-ETS. Following the official beginning of the EU-ETS on January 1, 2005, trading volumes rapidly increased, reaching around 5 million tons CO2 in January. At the same time the market price softened to around 7 Euros/TCO2 as the EU-ETS reflected underlying market fundamentals (in this instance a mild weather spell and associated lower than average CO2 production). Figure 3 lists trading prices for 2005 vintage allowances in the EU-ETS from June 2003 through January 2005. Figure 3: Trading prices in Euros/TCO2 for 2005 allowances vintages in the EU-ETS
(Source: Point Carbon, 2004-05) In terms of physical trading platforms a number of cities and exchanges are gearing up for the launch of the EU-ETS. Many trades have been facilitated by master agreements developed by both the International Emission Trading Association (IETA) and the European Federation of Energy Traders (EFET). London is particularly well placed due to the experience gained from the early voluntary UK-ETS trading program, and through the link-up announced on September 7, 2004 between London's International Petroleum Exchange and the Chicago Climate Exchange (CCX) which has developed a full range of carbon financial instruments within its own voluntary exchange. B. National Allocation Plans A fundamental component of the implementation of the EU-ETS has been the national allocation plans (NAPs) for the first phase of the trading program (2005-2007). Despite their title, the NAPs do far more than allocate emissions allowances. Member states need to consider a number of criteria simultaneously. First, the overall level of effort must be set under the EU-ETS, in line with that country’s overall Kyoto target. The NAP will determine what proportion of the reduction will come from the sectors under the EU-ETS vs. other sectors (especially transport, buildings and agriculture), and vs. other mitigation opportunities including the non-CO2 GHGs, sequestration and Kyoto project allowances. Then the NAP has to allocate emissions allowances among its covered sectors and facilities under the EU-ETS, with at least 95% of the allowances allocated for free (or grandfathered) to existing installations, but with
11
reasonable provisions to allow for new entrants. (In most cases these set-asides for new entrants will be freely given, with only a few countries auctioning.) In addition, for both existing and new market participants, the allocation process in practice relies on projections of future energy use and economic activity. A key consideration is compatibility with existing EU legislation as well as the restrictions on state aid – that is if one country provides a relatively generous allocation to one sector, this will provide a competitive advantage to that sector relative to the other member states. This is particularly key for industrial sectors that can easily trade their products, and as a result more reductions may be placed on the power sector as electricity trade across borders is much less substantial. Additionally, the NAP must be transparent for public scrutiny, detail the verification procedures, fully list the installations to be covered, and give consideration to the various technological opportunities for emissions reductions. Based on these main criteria the European Commission is required to assess the NAPs and then accept, conditionally accept or reject a NAP. Generally the Commission has pushed back hardest on member states being overly generous in their allocation process, and barred adjustments to allocation ex-post once the trading system has begun. In addition, the Commission has had to threaten legal action against some member states to speed their allocation decisions. Perhaps unsurprisingly, the NAP process throughout the EU-25 member states has been an extremely high-profile and contentious process. A first general theme has been the higher than anticipated allocation of allowances (for example, in the accession countries) and hence the expected system stringency and emissions trading price has been lowered (Figure 3). For the majority of countries, the NAP envisions efforts under the EU-ETS that are less than projected business-as-usual (BAU) emissions but not as deep as the proportional effort required to meet Kyoto. In particular the (draft) Italian NAP has drawn intense criticism for its overly-generous allocation. The importance of the NAP decision process was illustrated in Germany where only a personal intervention by Chancellor Schroeder pushed through their NAP following a disagreement over what reductions were the results of actions by German firms vs. economic restructuring that would have already occurred. A second theme has been the definition of coverage of installations, with France being asked to add another 750 installations to its NAP before final approval. A final theme has been attention to individual country characteristics in the projection of emissions, for example the technological options to replace Sweden’s nuclear capacity (which is being phased out). With this initial allocation process widely viewed as complex and difficult, the EU-25 member countries need to reengage in 2006 for the second phase NAP process. Lessons from this last year of planning and the first two years of market operation should prove invaluable. It is instructive to examine one NAP in greater detail. The UK’s NAP is a particularly interesting case as the UK is one of the largest contributors to EU CO2 emissions, it acted early in order to be an environmental leader and influence the entire EU-ETS, and as the UK’s allocation procedure has been intensely debated and is still not fully finalized. The UK was the first country to signal its allocation methodology through the publication of its draft NAP on January 19, 2004. The scope of the NAP was set by the UK government target of a 20% reduction in CO2 emissions by 2010 in light of a long-term target of 60% below 1990
12

levels by 2050. In addition, an existing domestic climate change program, the early domestic emissions trading system (UK-ETS) and the structural changes in UK energy use had already set the UK onto a path of declining CO2 emissions (vs. the 1990 base year). As a result, an allocation (over three years) to the EU-ETS was drafted at 714.5 MTCO2, a 5.5 MTCO2 reduction from the baseline for the covered sectors and contributing to a 16.3% reduction from 1990 levels by 2007. Such a stringent target (well beyond the UK’s Kyoto requirement of a 12.5% reduction) was hoped to cement the UK position of environmental leadership and to pressure other EU member states (notably Germany) also to undertake rigorous CO2 emissions reductions. The UK decided to place the bulk of reductions under the EU-ETS onto the electric power sector, as this sector faced limited international competition (electricity imports in 2002 amounted to only around 2% of total electricity supplied16, and this trade is primarily in the EU market) and as it was believed that a relatively large scope for low-cost abatement opportunities existed. The great majority of emission allowances (94.3%) would be grandfathered to existing installations with a 5.7% set-aside for new entrants and for sectors that exceed their growth expectations. The UK DTI’s emissions projections for the covered sectors which were in a process of reevaluation were key decision criteria. This draft NAP generated intense debate – UK industry claimed the NAP would place it at a significant competitive disadvantage, while proponents of the EU-ETS welcomed the UK’s early market signal. Extensive public consultation delayed the UK’s complete NAP submission to the European Commission, only published on May 6, 2004. In this document, the total allocation was raised to 736 MTCO2 to reflect updated emission growth projections under the relevant sectors, with this increased allocation focused on the non-power industrial sectors. The UK also updated its coverage of installations, set aside a portion of permits for combined heat and power installations and successfully lobbied to opt-out a small number of facilities that had taken on targets under the UK’s Climate Change Agreement. The European Commission partially accepted the UK’s NAP in July 2004; outstanding issues include the detailed allocation methodology for new entrants and incomplete coverage of installations (primarily those located in Gibraltar). To illustrate the conflicting pressures between appeasing domestic industry and spurring action by fellow member states, the UK published two analyses17, the first by the Carbon Trust indicating only modest competitiveness impacts, and the second by Ecofys criticizing the relatively lax allocation procedures of a number of other EU countries. In a final twist, a revised energy and emission projection released on October 27, 2004 showed an additional 56 MTCO2 from the UK covered sectors. Therefore in another compromise, an additional 20 MTCO2 was added to the UK’s NAP, ascribed to the non-power industrial sectors. With the acceptance by the Commission on October 28, 2004 of temporary opt-outs of 63 installations covered under the earlier UK-ETS program, and with consultation on the final adjustments on the provisions for new entrants, the participation of the UK in the EU-ETS continues to be delayed. The UK government published its finalized allocation methodology on February 14, 2005 reflecting the 756 MTCO2 allocation, and hopes to allocate allowances to firms in March 2005 if the Commission accepts the final (higher) allowance allocation. The UK needs 16 The UK’s percentage exports of electricity are even lower. 17 See references under further reading.
13

to seek new approval from the European Commission and cannot move forward before Commission accepts increased allocation. A court challenge may result. C. Remaining Uncertainties The preceding discussion of member states’ NAPs illustrates the current uncertainty over the overall stringency of the EU-ETS and the distributional effects of the allocation process. However key outcomes are emerging: the EU-ETS is delivering real (vs. BAU) but modest reductions, these reductions are focused on the power sector, and ongoing concerns remain regarding detrimental impacts on industry competitiveness and the impact of higher electricity prices. However, a number of pivotal uncertainties remain, including: Readiness for EU-ETS start date. Although the January 1, 2005 start-date for the EU-ETS was generally viewed as ambitious, the acceptance (final and conditional) of 21 out of 25 NAPs, the preparedness of exchanges to facilitate trades and the rise in trading volume suggests that to a large extent the EU-ETS is already fully operational. Some concerns remain over the readiness of some sectors and firms, as well as the capacity of monitoring and verification system in all states. Furthermore the implications of individual countries not joining the EU-ETS on its start date are unclear. Certainly their omission would add uncertainty to early trading. Linkages to other trading programs. The entrance into force of the Kyoto Protocol is expected to galvanize the global GHG trading market, with the EU-ETS expected to become the major trading platform. Linkages to small non-EU countries, notably Norway and Switzerland would be expected to have only a minor impact considering the overall size of the EU-ETS. A potentially larger uncertainty would be linking the EU-ETS to the larger Kyoto nations, including Canada and Japan. However, this process depends on both these countries moving beyond voluntary covenants with industry and pilot trading schemes to set up mandatory trading programs with a comparable framework and stringency to the EU-ETS. For example the Canadian trading system as currently envisioned would have a $15/TCO2 cost cap (or “safety valve”) with a corresponding release of additional permits when this price threshold is breached. It is unclear how such a relatively lax system could be directly linked to the EU-ETS. Availability of project credits. A more pressing uncertainty concerns the availability of international CDM projects from developing nations. In a review of the world market for carbon credits, the World Bank estimated that in 2003, 78 MTCO2 of credits were traded, primarily via project mechanisms. However this review raised concerns as to whether the three-fold increase in demand for project-based credits from the EU-ETS could be met. First, there is a significant lead time in developing, financing and enacting projects of about 3-5 years and the current uncertainty in allowance markets has stunted early project development. Secondly, existing CDM projects have each averaged around 250,000 TCO2 in size and so to meet projected EU-ETS demand would require around 800 projects (around 1,700 projects if additional demand from other Kyoto nations is considered). The current pace of evaluation and acceptance of projects by the CDM board raises considerable doubts that enough projects could be certified in time. Russian emission allowances. The Russian ratification of the Kyoto Protocol and its subsequent entry into force have major implications for the EU-ETS. There are three routes for Russia’s mitigation opportunities to affect the EU-ETS. The first is through the purchase of Russian Assigned Amounts Units (AAUs) which under the 1990 base year of the Kyoto Protocol
14

left the Russian Federation with allowances to sell due to economic restructuring following the demise of the Soviet Union. The AAUs themselves cannot be used in the EU-ETS but are very relevant as EU countries can purchase AAUs to meet their Kyoto targets and hence undertake fewer reductions via the EU-ETS. The AAU allowances are often referred to as “hot air credits” as they do not represent any direct mitigation actions by the Russian Government and it is unclear whether EU governments will sanction significant purchases of these allowances. In addition, if the Russian economy continues to rebound through 2010, the total number of available AAUs will shrink. Another route could be Russia’s establishment of its own emission trading system linked to the EU-ETS, although the relatively weak environmental and legal institutions in Russia suggest that this could only be feasible by 2008 at the earliest. Last, Russia could sell allowances to the EU-ETS via the JI mechanism but again this would only apply from 2008. Strategies of new EU members. A last issue related to sufficient market liquidity (i.e., enough sellers) is the impact of the 10 new EU member states (the accession countries. Of the 10 new entrants, Poland, the Czech Republic and Hungary are the major players. However there is considerable uncertainty over how many additional allowances will be for sale despite the new members’ generous NAP provisions to domestic industry, as these countries’ economies continue to grow strongly (for example, Hungary’s GHG emissions are now less than 3% from their 1990 peak). Furthermore, the Commission assessment of the plans for Poland and the Czech Republic is still pending and market observers expect that the Commission will not approve the plans with the generous caps proposed. Role of governments. A final uncertainty in the operation of the EU-ETS is the role of governments. Currently governments (e.g., through the Dutch ERUPT and CERUPT programs) and international institutions (e.g., the World Bank’s Prototype Carbon Fund) have been the largest purchasers in the world GHG markets. Looking forward, governments can be expected to continue to be major purchasers of international credits , since Member States have committed in their allocation plans to use public money to purchase 500 to 600 million credits for compliance with Kyoto commitments (of which the EU-ETS targets are a component). Under political pressure to meet these overall targets will the government effectively become a compliance mechanism of the last resort, and hence undermine the EU-ETS? Historical examples of government involvement in multi-lateral markets include the positive experience of large-scale purchasing of foreign oil for domestic reserves at times of low prices, contrasting the negative experience in currency markets of governments being the default defender of individual currencies under concerted market pressure. Progress in constraining emissions from the transport sector. Under the overall framework of Kyoto targets, an underlying assumption behind expectations of the EU-ETS is the progress in reducing emissions from other sectors. However, transportation remains the “Achilles heel” of EU nations, a sector whose emissions continue to grow strongly, despite continuing policy measures (notably voluntary automobile emissions standards, with European,18 Japanese and Korean manufacturers to reduce from the current level of 168g/km to 140g/km by 2008). Figure 4 illustrates the EU Commission’s growth projections for the transport sector with a 34% increase by 2010 in direct contrast to trends implied by the Kyoto targets. In addition, political opposition to economic constraints on transport (e.g., consumption charges on gasoline 18 American automobile manufacturers are represented here by their European subsidiaries.
15

consumption) remain the norm, as evidenced by the UK fuel price protests in Fall 2000. Successful transportation pricing and conservation programs such as the City of London’s road congestion charge continue to be the exception. Figure 4: EU projections for transport sector CO2 emissions in 2010 (1990 = 100)
(Source: EEA, 2004) Note: “With measures” includes the impact of domestic transport legislation; “With additional measures” includes impacts of proposed domestic transport initiatives. Future expectations. Finally, looking forward to 2006, the European Commission is set to carry out a review of the EU-ETS and the EU-25 members are required to submit new national allocation plans for the second phase (2008-2012). While the first phase of the EU-ETS was originally intended as a test period for European emissions trading, the years 2008 to 2012 were to be the real thing. Fines for non-compliance are higher, other greenhouse gases than CO2 are quite likely to be included, as might additional sectors, such as aviation and aluminum. Looking further forward, discussions are already underway regarding the successor to the Kyoto Protocol and the scope of mitigation efforts in the post-2012 era. As expectations over the scale and conditions of the future global GHG market will impact strategies and decisions made now, EU-ETS participants are looking to obtain additional clarity.
16

4. Insights and Opportunities A. Early conclusions from the first large-scale GHG emissions trading program The EU-ETS is a landmark environmental policy, representing the first large-scale greenhouse gas (GHG) trading program, covering around 12,000 installations in 25 countries and 6 major industrial sectors. The EU-ETS represents a practical experiment to verify and calibrate the results of economic modeling and market forecasts of GHG emissions trading. The first key challenge will be to overcome the considerable implementation issues of a trading system of such size and complexity. This is particularly challenging as the EU-ETS has been developed under a tight timetable in light of its role in achieving the upcoming Kyoto targets, and given the range of institutions that have had to be either created or harmonized. To answer the question “Will it work well?” some general lessons can be gleaned from the considerable literature on emission trading for an effective trading system to achieve its environmental goals at the lowest cost: 1. Consistent and long term targets and rules – The EU-ETS is currently only entering its first
“learning” phase. With discussions due to begin in 2006 on the EU-ETS second phase (which coincides with the Kyoto compliance period in 2008-2012), the emission goals as well as the continued evolution of both the overall and sectoral caps must be made clear. Any continued uncertainty over the level of mitigative effort or any post-adjustment of required reductions may hamper the performance of trading strategies.
2. Minimal transaction costs to trade – The relatively low transaction costs to trade due to the large size of each point source, and the early investments by competing exchanges give assurance on this aspect of the EU-ETS.
3. Transparent monitoring and verification – Independent auditing and use of standard emission accounting for large point sources give assurance on this aspect of the EU-ETS.
4. High volume and high activity (i.e., a liquid market) – Efforts to promote a liquid market may depend on the overall stringency of the scheme, the availability of project credits from developing countries and the strategies employed by potential emission credit sellers, notably the new EU member states.
5. Risk hedging – The risk hedging components (e.g., forward markets, derivative markets and banking) appear to be developing well, with significant volumes already being traded in forward markets, exchanges and brokers competing to offer emissions allowance portfolios and options markets, and the use of banking (mandatory from 2008-2012) to exploit inter-temporal flexibility in reduction strategies.
6. Consideration of distributional effects amongst participants and consumers – Finally and crucially, the uneven impact on competitiveness may be the most contentious component of the EU-ETS, as evidenced by its importance in the drafting of the first round of the national allocation plans.
A second key challenge will be in the durability of political support, especially if the EU-ETS results in higher than expected energy price increases and/or relative impacts on sectoral competitiveness in different member states. The EU-ETS is a centerpiece of the EU’s desire to be a global leader in climate change policy, and is viewed to some extent as industrial energy
17

policy to develop new technologies. Arrayed against this are the economic pressures of a slowly growing economy and some considerable apathy in a number of member states for European-wide legislation. Alternatively, to what extent will the EU-ETS be judged on its environmental results vs. its success as a demonstration of the feasibility of trading? For example, if the price and mitigation quantity in the EU-ETS is minimal, but the institutions and protocols for GHG trading are successfully developed, will this be viewed as a success? The price, traded volume and cost-savings from GHG trading constitute the third key set of issues regarding the EU-ETS. Existing economic modeling of the EU-ETS is only approximate until the overall targets and implementation details have been finalized. However initial estimates from the PRIMES model show allowance prices of 14 Euro/TCO2, and total annual costs of 2.4 billion Euro in 2010. Numerous factors including the overall cap, availability of project credits and sellers’ strategic behavior will affect these estimates. These modeling assumptions can easily entail uncertainty of a factor of two or more. Alternatively, Table 5 details the range of estimates from brokers and market analysts with the range of prices seen in the early forward market. These results suggest a lower median price than the economic modeling results in the emerging market, with considerable uncertainty attached to these predictions. Such caution in market forecasts is reflective of the huge uncertainties firms face, including final allocation decisions, linkages with non-EU systems and project mechanisms, and future expectations of emission targets. Table 5: Low, median and high prices market forecasts for the EU-ETS
(all prices in Euro/TCO2) 19
Expected price in Dec. 2003
Expected price in Apr. 2005
Expected price in Apr. 2008
Forward Market (June 2003 - Jan 2005)
Low 2.50 1.50 2.00 6.80 Median 5.50 5.00 7.00 9.00 High 10.00 40.00 45.00 13.00
(Source: Point Carbon, 2004-05) Additional economic issues include the possibility of allowance price spikes similar to the RECLAIM and OTC markets in the U.S., although a well-designed and large EU-ETS market should retain enough flexibility to avoid this occurrence. Additionally, insights will be gleaned regarding the biggest winners from trade (although all market participants will gain from trading), including sellers (e.g., Germany or the new member states), and buyers (e.g., the economies with the fastest economic and energy growth and hence the greatest capacity for installation of new capital, including Ireland and Spain). A fourth and final key set of questions is the longer-term implications of the EU-ETS. Will the global leadership efforts by the EU spur future (post-Kyoto) mitigation efforts in other developed countries and kick-start comprehensive mitigation actions in the United States and major developing countries? Will the protocols and lessons developed from the EU-ETS enable an interlinked global market of GHG emissions? And will the experiences of the EU-ETS shape long-term GHG reduction targets?20
19 Note: As of January 2005, 1 Euro ~ $1.30; 10Euro/TCO2 = $13/TCO2 = 37Euro/TC = $48/TC. 20 For example, the UK target of a 60% reduction by the year 2050.
18

B. Insights for U.S. Trading Schemes Directly relevant to U.S. policy makers is the application of insights from the EU-ETS to U.S. domestic GHG trading proposals, notably the Climate Stewardship Act, introduced by Senators McCain and Lieberman and voted on by the U.S. Senate (SA.2028) in October 2003 and reintroduced on February 10, 2005. In terms of overall size, the two programs are roughly equivalent—given the reporting threshold that would be established under SA.2028 (10,000 metric tons CO2 equivalent), publicly available data suggests that approximately 10,000 manufacturing facilities, 2,200 landfills, and 1,600 power plants would be included under this GHG trading program. Direct cost comparisons between the Climate Stewardship Act and the EU-ETS are problematic due to the range of gases and sectors included (notably transport), the differing projected baselines, and the structural differences between the U.S. and European economies. For the EU-ETS, the PRIMES modeling for 2010 gives a total required reduction of 224 MTCO2, with an allowance price of $17.5/TCO2 and an overall annual cost of $3 billion. Cost estimates21 for SA.2028 find required reductions of up to 1150 MTCO2 (but less with lower baseline projections and limits on the banking of allowances), a trading price of between $8-15/TCO2, and overall annual cost estimates ranging from $1.6 billion to $18 billion. This latter wide range reflects uncertainty in the baseline assumptions as well as the cost of non-CO2 reduction, the availability of emissions offsets, the scope for cost savings through energy efficiency and the wider reaction of the economy to higher energy prices. However, despite the difficulties of making a direct comparison, the actual costs of reductions from the EU-ETS will still be a valuable guide in any prior estimates of the cost of U.S. reductions. The examination of implementation issues in the EU-ETS will complement the considerable experience of designing environmental trading systems in the United States. Specifically, the operation of trading platforms, performance of monitoring and verification procedures and analysis of firms’ trading strategies can aid in designing a future U.S. GHG market of such considerable size and complexity. In addition the vocal debate over allocation suggests the need to gain industry consensus and buy-in to a well-designed market structure. Firms can “learn by doing” and provide insights into true costs and efficiencies obtained through a cap and trade program. Emerging trading programs within the U.S. such as the Regional Greenhouse Gas Initiative (RGGI) in the northeast states and the Chicago Climate Exchange can also help to provide important insights and potentially serve as a foundation for a future comprehensive national program. Finally, the EU-ETS has the potential to shed light on mitigation opportunities and to drive the development and diffusion of new technologies to reduce GHG emissions. As a major trading bloc, this represents an opportunity for EU countries to be the first mover in the potentially enormous markets for new energy technologies and efficient provision of energy services, and a risk to the United States that its firms will lag behind.
21 Paltsev S., J. Reilly, et al. (2003) Emissions Trading to Reduce Greenhouse Gas Emissions in the United States: The McCain-Lieberman Proposal, Report No. 97, MIT Joint Program on the Science and Policy of Global Change, Cambridge, MA.; Energy Information Administration (2003) Analysis of S.139, the Climate Stewardship Act of 2003, SR/OIAF/2003-02, Washington, D.C.
19

Further Reading 1. Capros P. and Mantzos L. (2000), The Economic Effects of Industry-Level Emission Trading to Reduce
Greenhouse Gases, Results from the PRIMES Model, Report to DG Environment, Technical University of Athens.
2. Carbon Trust (2004), The European Emissions Trading Scheme: Implications for Industrial Competitiveness, London.
3. DEFRA (2004), EU Emissions Trading Scheme: UK National Allocation Plan, 2005-2007, Department of Environment, Food and Rural Affairs, London.
4. Edmonds J., M. Scott, J. Roop and C. McCracken (1999), International Emissions Trading and Global Climate Change: Impacts on the Costs of Greenhouse Gas Mitigation, Pew Center on Global Climate Change, Arlington, VA.
5. EEA (2004), Analysis of Greenhouse Gas Emission Trends and Projections in Europe 2003, Technical Report No.4/2004, European Environment Agency, Luxembourg.
6. Ellerman D., P. Joskow and D. Harrison (2003), Emissions Trading in the U.S.: Experience. Lessons and Considerations for Greenhouse Gases, Pew Center on Global Climate Change, Arlington, VA.
7. EPRI (2004), The EU Emissions Trading Scheme, Electric Power Research Institute, Palo Alto CA.
8. European Commission (2004), EU-ETS Press Releases, available at: http://europa.eu.int/comm/environment/climat/emission/press_en.htm
9. European Parliament (2003), Directive 2003/87/EC Establishing a Scheme for GHG Emission Allowance Trading within the EU, Official Journal of the European Union, October 13, 2003.
10. European Parliament (2004), The Kyoto Protocol’s Project Mechanisms, Amendment of Directive 2003/87/EC, Official Journal of the European Union.
11. Evolution Markets LLC (2004), Monthly Greenhouse Gas Market Updates, January 2004 – January 2005.
12. Gilbert A., J-W. Bode and D. Phylipsen (2004), Analysis of the National Allocation Plans for the EU Emissions Trading Scheme, Report YUES4003 for the UK Department of Trade and Industry and Department of Environment, Food and Rural Affairs, Ecofys, London.
13. Hasselkippe H. (2003), Systems for Carbon Trading: An Overview, Climate Policy, 3S2, S43-S57. 14. Kruger J. and W. Pizer (2004), The EU Emissions Trading Directive: Opportunities and Pitfalls,
Discussion Paper 04-24, Resources for the Future, Washington DC. 15. Lecocq F. (2004), State and Trends of the Carbon Market 2004, Development Economics
Research Group, World Bank, Washington DC. 16. Natsource (2003), Governments as Participants in International Markets for Greenhouse Gas
Commodities, Third Annual Workshop on Greenhouse Gas Emission Trading, IEA, Paris. 17. Point Carbon (2004-05), Carbon Market Europe, April 2003 – January 2005.
20