the evaluation of attitudes towards individuals with
TRANSCRIPT

Southern Illinois University CarbondaleOpenSIUC
Dissertations Theses and Dissertations
12-1-2018
The Evaluation of Attitudes towards Individualswith Mental Illness among Counselors in TrainingRandall BoenSouthern Illinois University Carbondale, [email protected]
Follow this and additional works at: https://opensiuc.lib.siu.edu/dissertations
This Open Access Dissertation is brought to you for free and open access by the Theses and Dissertations at OpenSIUC. It has been accepted forinclusion in Dissertations by an authorized administrator of OpenSIUC. For more information, please contact [email protected].
Recommended CitationBoen, Randall, "The Evaluation of Attitudes towards Individuals with Mental Illness among Counselors in Training" (2018).Dissertations. 1643.https://opensiuc.lib.siu.edu/dissertations/1643
THE EVALUATION OF ATTITUDES TOWARDS INDIVIDUALS WITH MENTAL
ILLNESS AMONG COUNSELORS IN TRAINING
by
Randall D. Boen
B.S., Austin Peay State University, 2010
M.S., Southern Illinois University Carbondale, 2014
A Dissertation
Submitted in Partial Fulfillment of the Requirements for the
Doctor of Philosophy Degree
Rehabilitation Institute
in the Graduate School
Southern Illinois University Carbondale
December, 2018

Copyright by Randall Boen, 2018
All Rights Reserved
DISSERTATION APPROVAL
THE EVALUATION OF ATTITUDES TOWARDS INDIVIDUALS WITH MENTAL
ILLNESS AMONG COUNSELORS IN TRAINING
By
Randall D Boen
A Dissertation Submitted in Partial
Fulfillment of the Requirements
for the Degree of
Doctor of Philosophy
in the field of Rehabilitation Counseling
Approved by:
Dr. Thomas Upton, Chair
Dr. Valerie Boyer
Dr. Stacia Robertson
Dr. Salim Al-Ani
Dr. Rhonda Kowalchuk
Graduate School
Southern Illinois University Carbondale
October 12, 2018
i
AN ABSTRACT OF THE DISSERTATION OF
RANDALL D. BOEN, for the Doctor of Philosophy degree in REHABILITATION, presented
on October 12, 2018 at Southern Illinois University Carbondale.
TITLE: THE EVALUATION OF ATTITUDES TOWARDS INDIVIDUALS WITH MENTAL
ILLNESS AMONG COUNSELORS IN TRAINING
MAJOR PROFESSOR: Dr. Thomas Upton
Negative attitudes and stigma associated with mental illness have a profound impact on
individuals who experience them. Researchers have defined stigma as the attribution of a deviant
characteristic to members of a particular group. Persons with severe and persistent mental illness
(SPMI) face many difficulties that impact their full participation in social life. Although
attitudinal reactions to individuals with SPMI have improved considerably over the last few
decades, there are still areas for improvement. Limited research has been conducted to evaluate
attitudes and stigma associated with individuals with SPMI among human service professionals-
in-training (HSPs). For this study, HSPs were defined as individuals preparing to enter social
service, mental health, and substance abuse professions. Further, there have only been a few
published studies in attitude research that utilized randomized vignettes portraying individuals
with two different mental health diagnoses.
Data collection occurred in counselor education and similar HSP programs at 27
universities in the contiguous United States. A total of 79 participants (20 males and 58 females)
took part in this study. Participants were asked to respond to self-report surveys and to one of
two written vignettes to quantify their attitudes toward the individuals depicted in them. The two
vignettes described an individual with a mental illness and differed in the diagnosis attributed to
the individual: schizophrenia spectrum disorder in one vignette and generalized anxiety disorder
in the other vignette. Results indicated that although there were slight mean differences between
ii
the two groups of participants, the differences were not statistically significant, t (77) = 0.63, p
=53. The Attribution Questionnaire-27 (AQ-27; Corrigan, 2012) gathered data on overall
attitudes towards mental illness. The Mental Health Provider Stigma Inventory (MHPSI;
Kennedy, Abell, & Mennicke, 2014) collected data on attitudes, behaviors, and social pressure
impacting stigma towards individuals who have SPMI. Data collected with these two scales
yielded evidence to indicate that participants held stigmatizing attitudes towards individuals with
SPMI.
The data suggested that graduate students in rehabilitation counselor education programs
reported fewer stigmatizing attitudes than students from other programs. This result was seen
across both measures. Data were collected on frequency of contact with persons with mental
illness to evaluate the association between contact frequency and knowledge of mental illness
and negative attitudes. Demographic data included gender, age, professional training, and
number of years of work experience in a counseling-related role. A hierarchical multiple
regression was used to determine if a pre-determined order of predictors was statistically
significant to the outcome measure. Prior literature suggested that prior contact and familiarity
scores played a more important role in predicting the outcome variable (AQ-27) than
demographic information. The first model was statistically significant, F(6,72) =3.64, p= .003,
and explained 23% of the variance in the dependent variable (AQ-27 total scores). After the
input of these demographic factors, the second step included LOF and SADP- PCF-R scores.
After entry of the second step, the overall variance was 28%. The second model was statistically
significant, F(8,70) = 3.39 p = 002, and explained an additional 4% variance in the model. In the
final adjusted model, four out of the seven predictor variables were statistically significant.

iii
A small pilot study consisting of rehabilitation counseling professionals was used to
develop the methodologies for this study. The primary limitation of the primary study was the
sample size. Further details of the methodology used and limitations of this particular study are
provided. Implications of this study and suggested future research are proposed.
Keywords: severe and persistent mental illness, stigma of mental illness, rehabilitation
counselors in training, Attribution Questionnaire-27 (AQ-27), Mental Health Provider Stigma
Inventory (MHPSI), mental health service providers
iv
ACKNOWLEDGEMENTS
There are many who need to be acknowledged for their support. First, Dr. Thomas
Upton, thank you for always supporting me through the ups and downs of my educational career
at SIU. Thank you for having faith, offering me new opportunities, and always being there for
me. The faculty and staff at SIU who have always been so supportive: Dr. Carl Flowers, Dr.
William Crimando, Dr. Shane Koch, and Dr. Jane Nickels. My good friends, Meagan and Nick.
From Austin Peay State University: Dr. Stuart Bonnington and Dr. Kevin Harris, who gave me
the confidence to accomplish my goals. Dr. Nicole Knickmeyer, who has always been so
supportive of all my efforts, and who saw my potential and helped me reach it. My dissertation
committee members: Dr. Valerie Boyer (SIU), Dr. Stacia Robertson (California State University
- San Bernardino), Dr. Salim Al-Ani (California State University - Long Beach), and Dr. Rhonda
Kowalchuk (SIU). Your diligence and commitment helped me produce the best work possible. I
thank my editor, Agnes DeRaad, for her diligence in making this dissertation the best it can be. I
thank the review committees at the National Commission on Rehabilitation Education, the
National Association of Social Workers, the American Counseling Association, Southern Illinois
University Carbondale, and Troy University. I was able to distribute my survey materials for my
dissertation because of these organizations.
v
DEDICATION
For all those who supported me along my journey, I dedicate this work to you. My Father
David, whose unwavering and unrelenting support has made me the person I am. My late Mother
Debbie, whose love and kindness will remain with me wherever I go. To my sister Gwen Ayers
and to all my family and friends. To Lauren, thank you for your love and support. None of this
would have been possible without you.
vi
TABLE OF CONTENTS
CHAPTER PAGE
ABSTRACT ..................................................................................................................................... i
ACKNOWLEDGMENTS ............................................................................................................. iv
DEDICATION .................................................................................................................................v
LIST OF TABLES ...........................................................................................................................x
LIST OF FIGURES ....................................................................................................................... xi
CHAPTERS
CHAPTER 1 – INTRODUCTION ......................................................................................1
Definition of Stigma ................................................................................................1
Theoretical framework .............................................................................................7
Significance of the Problem .....................................................................................8
Purpose of the Study ................................................................................................9
Summary ................................................................................................................10
Definition of Terms................................................................................................11
CHAPTER 2 – LITERATURE REVIEW .........................................................................13
Introduction ............................................................................................................13
Prevalence and Definitions of Severe Mental Illness ............................................13
The Stigma of Mental Illness .................................................................................14
Age .............................................................................................................15
Gender ........................................................................................................15
Personal Contact .......................................................................................16
Social distance ..........................................................................................16
vii
Human Service Professionals ................................................................................17
Academic disciplines .................................................................................17
The Stigmatized Individual ...................................................................................19
Attrition Theory .....................................................................................................20
Measuring Attitudes ..............................................................................................22
Anticipated Findings .............................................................................................24
Summary of Key Findings ....................................................................................26
CHAPTER 3 – METHODOLOGY ...................................................................................27
Research Questions ...............................................................................................27
Instrumentation ......................................................................................................28
Scale of Attitudes toward Disabled Persons Prior Contact Form
R (SADP-LCF-R) .....................................................................................28
Level of Familiarity Scale (LOF) ..............................................................29
Attitude Measurements .........................................................................................30
The Attribution Questionnaire-27 (AQ-27) ...............................................31
The Mental Health Provider Stigma Inventory (MHPSI) ..........................32
Research Design.....................................................................................................33
Methods..................................................................................................................34
Population and Sample ..............................................................................34
Vignettes ....................................................................................................37
Pilot Study ..................................................................................................38
Statistical Analysis .................................................................................................39
Statistical Assumptions ..............................................................................43
viii
Power Analysis ..........................................................................................45
CHAPTER 4 – RESULTS ................................................................................................47
Pilot Study ..............................................................................................................47
Sample Characteristics ..........................................................................................48
Research Question 1 Results ..................................................................................51
Research Question 2 Results ..................................................................................55
Research Question 3 Results ..................................................................................58
CHAPTER 5 – DISCUSSION ...........................................................................................62
Summary of Findings ............................................................................................63
Limitations .............................................................................................................67
Implications for Rehabilitation Counselors ...........................................................69
Conclusions ............................................................................................................71
REFERENCES ..............................................................................................................................72
APPENDICES
Appendix A – Demographic Form ....................................................................................89
Appendix B – Prior Contact Form R ................................................................................90
Appendix C – Level of Familiarity Scale ..........................................................................91
Appendix D – Attribution Questionnaire-27 .....................................................................92
Appendix E – The Mental Health Provider Stigma Inventory ..........................................95
Appendix F – E-mail Requests Sent to Students ...............................................................97
Appendix G – Flyer for Participants ................................................................................101
Appendix H – Institutional Review Board Approval Letter: Southern Illinois University
Carbondale ......................................................................................................................102
ix
Appendix I – Institutional Review Board Approval Letter: Troy University ..................103
Appendix J – Follow-up Questions Given to Participants of Pilot Study........................105
Appendix K – Permission from Dr. Patrick Corrigan to Use the AQ-27 and LOF
Scales ...............................................................................................................................106
Appendix L – Permission from Dr. Stephanie Kennedy to Use the MSPSI Scale .........107
VITA ..........................................................................................................................................108

x
LIST OF TABLES
TABLE PAGE
Table 1 - List of Instruments Used ................................................................................................28
Table 2 - Summary Table of the Completed Data Analysis ..........................................................40
Table 3 - Defining all Subscales Including Range Values of the AQ-27 and MHPSI ..................42
Table 4. – A Priori Evaluation of Expected Sample Size Given Procedure, Effect Size, and
Power Calculations ............................................................................................................46
Table 5. – Demographic Data Summary Table .............................................................................49
Table 6. – Descriptive Statistics for Program of Study on AQ-27 and MHPSI Total Scores .......51
Table 7. – One-Way Analysis Of Variance for the Effects of Program of Study on AQ-27
and MHPSI........................................................................................................................52
Table 8. – Multiple Comparison Procedures for Program of Study by AQ-27 and MHPSI ........53
Table 9. – Descriptive Data from Both Vignettes by AQ-27 Scores .............................................55
Table 10. – All Pearson Correlation Coefficients of the Vignette Type by AQ-27 Subscores .....58
Table 11. – All Intercorrelations For Demographic, Level of Contact, and Frequency of Contact
Data on AQ-27 Total Scores ..............................................................................................60
Table 12. – Hierarchical Regression Analysis, Predicting Attitudes with Demographic,
Level of Contact, and Frequency of Contact Data .............................................................61

xi
LIST OF FIGURES
FIGURE PAGE
Figure 1 - Number of participants obtained per month .................................................................36
Figure 2. – Line graph of vignette type by AQ-27 scale, pilot study ............................................48
Figure 3. – Boxplot of program of study by AQ-27 total scores ...................................................54
Figure 4. – Boxplot of program of study by MHPSI total scores ..................................................54
Figure 5. – Line graph of the vignette type by AQ-27 score .........................................................56
Figure 6. – Boxplot of the effect of each vignette on the AQ-27 total score .................................57
Figure 7. – Line graph of gender by AQ-27 scores .......................................................................66
Figure 8. – Line graph of gender/vignette by AQ-27 scores .........................................................67

1
CHAPTER 1
INTRODUCTION
Severe and persistent mental illness (SPMI) affects approximately 4.0% of the entire
adult population (18 years and older) in the United States. This is equivalent to approximately 10
million individuals according to data collected in 2015 by the National Institute of Mental Health
[NIMH] (2017). Individuals with SPMI face many obstacles in their daily lives (Corrigan &
Watson, 2002). Possible difficulties include locating and maintaining employment, fulfilling
social roles, securing housing, and fulfilling educational goals (Ackerman & McReynolds, 2005;
American Psychiatric Association [APA], 2013; Pratt, Gill, Barrett, & Roberts, 2007). SPMI is
defined in this study as representing a range of psychological disorders as defined by the
Diagnostic and Statistical Manual of Mental Disorders, 5th edition (DSM-5) that substantially
impact the major life roles. Walton-Moss, Gerson, and Rose (2005) found that mental illness
could have a significant impact on both individuals and their family systems (see also Falvo,
2014). Data collected in 2015 by the Bureau of Labor Statistics (BLS, 2016) suggested that
unemployment rates for persons with disabilities were nearly twice the rates for the general
population. Furthermore, persons with disabilities were more likely to work part time or to be
self-employed (BLS, 2016; Cook, 2006).
Definition of Stigma
Throughout much of history, to stigmatize an individual involved a practice of physically
branding individuals with a mark to identify them as a criminal or as being a social outcast (Fink
& Tasman, 1992). Further, this mark indicated someone to be mistrusted or avoided (Pratt et al.,
2007). The study of stigma as a human phenomenon can be traced back to the work of Erving
Goffman (1963) who laid the foundation of our modern conceptions of stigma (Ainlay, Becker,
2
& Coleman, 1986; Link, Yang, Phelan, & Collins, 2004). For example, Goffman (1963) was one
of the first to identify stigma as representing a social rather than an individualistic phenomenon.
Stigma, as defined by Goffman, is directly related to an observed attribute (Link et al., 2004).
Stigma can be understood as it impacts affects, beliefs, and behaviors (Jussim, Palumbo,
Chatman, Madon, & Smith, 2000). For example, individuals may feel uneasy or unsafe around a
person with mental illness (affect) and they may believe that people with mental illness are often
violent and unpredictable (belief); therefore they avoid interacting with people with mental
illness (behaviors). Many authors have investigated the effects of stigma in society and how it
affects social interactions (Bar-Tal, Graumann, Kruglanski, & Stroebe, 1989; Corrigan, 2005,
2014; Heatherton, Kleck, Helb, & Hull, 2000; Hinshaw, 2007; Jones et al., 1984).
Stigma has been defined as an attribute resulting from a negative evaluation made by an
individual towards an observable characteristic that deviates from societal norms (Hinshaw,
2007; Wright, 1980). Further, this deviation from social norms extends beyond the normal
individual differences that are expected (Coleman, 1986; Goffman, 1983). For example, hand
washing is accepted as an appropriate personal hygiene practice. Washing one’s hands frequently
is generally seen as appropriate given contextual factors (e.g., medical professionals who wash
their hands after every patient interaction). However, individuals who compulsively wash their
hands 50 or 60 times a day may be seen as deviant from a societal norm.
Distinctions have been made between social stigma, structural stigma, and self-stigma
(Livingston & Boyd, 2010). Social or public stigmas have been defined as the attitudes and
beliefs attributed to a particular group of people that are widely shared within a society. These
attitudes are transmitted through a society via media and word of mouth (Corrigan, Powell, &
Michaels, 2013). One example of social stigma might be that all individuals with mental illness
3
are either potentially dangerous or hopeless (Corrigan & Watson, 2007). These widely held
belief structures could influence structural and self-stigma (Corrigan, 2005). How individuals
with mental illness are viewed socially has been heavily influenced by mass media (Corrigan, et
al., 2013). How mental illness is portrayed by mass media (television, newspapers, and social
media) has been reviewed at length (Corrigan et al., 2013; Coverdale, Nairn, & Claasen, 2001;
Stout, Villegas, & Jennings 2004).
Some researchers have suggested that the attribution of public stigma may contribute to
devaluation of an individual’s self-concept and perceived standing in society (Lin, Chang, Wu, &
Wang, 2016). However, this reaction to stigma may not be universal. Corrigan (2005) suggested
that many individuals with mental illness recognize and work against the negative attitudes
around them. Personal knowledge or understanding of mental illness has been correlated with
fewer stigmatizing reactions from others (Upton, Harper, & Wadsworth, 2005).
Self-stigma refers to the stigma that is internalized by the stigmatized group (Fink &
Tasman, 1992). Self-stigma may contribute to feelings of shame about having a disability
(Corrigan & Watson, 2007; Olney & Kim, 2001; Watson, Corrigan, Larson, & Sells, 2007).
Feelings of shame may hinder individuals from self-identifying as having an illness or disability.
This process was further discussed by Goffman (1963):
How does the stigmatized person respond to his situation? In some cases it will be
possible for him to make a direct attempt to correct what he sees as the objective basis of
his failing … a transformation of self from someone with a particular blemish into
someone with a record of having corrected a particular blemish. (p. 9)
Within his work, Goffman (1963) suggested that individuals with mental illness would
make attempts to distance themselves from the stigmatizing effects of the mental illness. This is
4
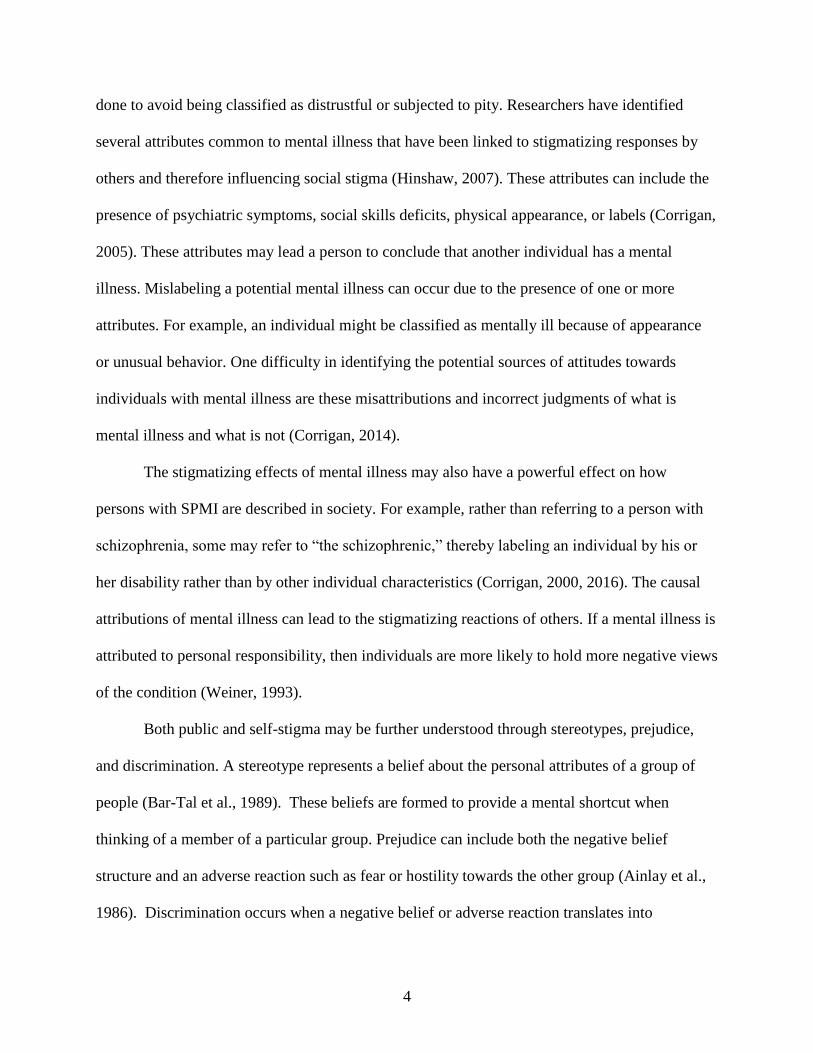
done to avoid being classified as distrustful or subjected to pity. Researchers have identified
several attributes common to mental illness that have been linked to stigmatizing responses by
others and therefore influencing social stigma (Hinshaw, 2007). These attributes can include the
presence of psychiatric symptoms, social skills deficits, physical appearance, or labels (Corrigan,
2005). These attributes may lead a person to conclude that another individual has a mental
illness. Mislabeling a potential mental illness can occur due to the presence of one or more
attributes. For example, an individual might be classified as mentally ill because of appearance
or unusual behavior. One difficulty in identifying the potential sources of attitudes towards
individuals with mental illness are these misattributions and incorrect judgments of what is
mental illness and what is not (Corrigan, 2014).
The stigmatizing effects of mental illness may also have a powerful effect on how
persons with SPMI are described in society. For example, rather than referring to a person with
schizophrenia, some may refer to “the schizophrenic,” thereby labeling an individual by his or
her disability rather than by other individual characteristics (Corrigan, 2000, 2016). The causal
attributions of mental illness can lead to the stigmatizing reactions of others. If a mental illness is
attributed to personal responsibility, then individuals are more likely to hold more negative views
of the condition (Weiner, 1993).
Both public and self-stigma may be further understood through stereotypes, prejudice,
and discrimination. A stereotype represents a belief about the personal attributes of a group of
people (Bar-Tal et al., 1989). These beliefs are formed to provide a mental shortcut when
thinking of a member of a particular group. Prejudice can include both the negative belief
structure and an adverse reaction such as fear or hostility towards the other group (Ainlay et al.,
1986). Discrimination occurs when a negative belief or adverse reaction translates into

5
behavioral responses (Corrigan & Watson, 2002). Researchers have correlated stereotypes,
prejudice, and discrimination to negative independent living and vocational outcomes for persons
with SPMI (Russinova, Griffin, Bloch, Wewiorski, & Rosoklija, 2011).
Attitudes are enduring patterns of evaluation of a person or of an issue (Hinshaw, 2007).
Historically the term has denoted a pattern of affective, cognitive, or behavioral responses to a
psychological construct (Colman, 2006). Sources of attitudes towards individuals with
disabilities have included viewing them as victims of their condition (Lynch & Thomas, 1994).
From this standpoint, some may refer to individuals as suffering with mental illness, view them
as being highly dependent on others, and regard them as seeking pity or charity (Wright, 1980).
Further, viewing individuals as victims of their condition may lead to the devaluation of
individual capabilities and strengths. The purpose of the current study is to evaluate attitudes and
stigma associated with SPMI.
Past researchers have suggested that changing individual stigma associated with
individuals with SPMI is possible (Corrigan, Markowitz, Watson, Rowan, & Kubiak, 2003;
Corrigan, Morris, Michaels, Rafacz, & Rusch, 2012; Hackler, Cornish, & Vogel, 2016; Hinshaw,
2007; Reinke, Corrigan, Leonhard, Lundin, & Kubiak, 2004). Positive personal interactions with
individuals with SPMI have been shown to decrease individual stigma (Corrigan et al., 2003).
With personal interactions, individuals may start to understand how an SPMI impacts the daily
lives of those who experience it. Further, personal interactions tend to lead to more favorable
views of persons with SPMI than other approaches. For example, an educational approach in
which information is provided about SPMI can impact the learner’s understanding of mental
illness; however, this may not impact his or her perceptions of the disorders. If past personal

6
interactions with individuals with SPMI are negative, stigma reactions can persist or worsen
(Corrigan et al., 2012).
Other studies have shown that after being presented with a video vignette depicting an
individual with a mental illness, participants’ reactions towards mental illness were altered
(Hackler et al., 2016). Factors such as age, gender, and personal contact with persons with
disabilities are associated with differing attitudes towards those persons (Yuker, 1988; Yuker,
Block, & Younng, 1966). Other factors that may have a moderating effect on disability attitudes
in postsecondary settings include the academic status (i.e., freshman, sophomore, junior, or
senior) and major area of study of the participant (Boen, Upton, Knickmeyer, & Anuar, 2016). In
the current study, the contribution of factors including age, gender, academic standing, and prior
contact were evaluated.
Corrigan et al. (2012) identified several areas that need further study regarding
interventions that reduce stigma. The first gap identified was the effect of interventions that
target specific mental health conditions (e.g., major depression or schizophrenia). The authors
discussed how both contact and education have a positive impact on reducing stigma. However,
moderating factors such as the level of contact or degree of exposure should also be evaluated.
Hackler et al. (2016) emphasized that more research was needed to evaluate if the age of the
contact group (persons with SPMI) has an effect on stigma. For example, if the participant age
group were similar to that of the contact group, would this similarity result in lower levels of
stigma? Finally, Corrigan et al. (2012) suggested that many of the reviewed studies relied on
self-reported measures and not on behavioral observations (see also Hinshaw, 2007). There is a
need to investigate the degree to which behavioral reactions towards persons with SPMI are
influenced by negative attitudes and stigma (Reinke et al., 2004). Some authors have called for

7
collecting evidence to further understand how stigma associated with SPMI may influence hiring
decisions made by employers (Corrigan et al., 2012). Other research may examine landlords
choosing to lease a property to an individual with SPMI (Russinova et al., 2011).
Theoretical Framework
The underlying theory of the study was attribution theory (AT; Heider, 1958; Weiner,
1993). AT seeks to conceptualize the social motivation factors that affect acting positively
towards some groups while acting negatively towards others. This cognitive process includes
making an attribution of the cause and controllability of a condition that can lead to judgment of
responsibility for that condition (Corrigan et al., 2003). For the purposes of this study, AT was
defined in terms of the degree to which a condition (e.g., mental illness or other disability) that is
viewed as being influenced by the individual will impact how others view the condition. In
general, this theory holds that the more a condition is viewed as being caused by the individual
(ruling out uncontrollable factors), the more negative reactions will result.
Mental health conditions can be misattributed to personal causes or life choices (Kvaale,
Haslam, & Gottdiener 2013). For example, if an individual with a substance dependence
disorder develops a mental illness, the cause or controllability of the mental illness may be called
into question (Corrigan et al., 2003). Individuals with mental illness may be viewed more
negatively than those with illnesses attributed to natural or environmental causes (Martin,
Pescosolido, & Tuch, 2000). These reactions can also influence how others are viewed and
therefore contribute to negative attitudes and stigma. Forming an attitude towards someone may
be seen as the process by which we make sense of the complex information we are faced with.
Attitudes may also serve as the enduring evaluation of others (Colman, 2006; Macrae &
Bodenhausen, 2001). Within this context, attitudes are seen as mental shortcuts used in the

8
evaluation of others. In one study, patients with lung cancer who were also lifelong cigarette
smokers were viewed as having more personal responsibility for their condition than those who
did not smoke (Hamann, Howell, & McDonald, 2013).
Significance of the Problem
Stigma associated with individuals with SPMI can pose a significant barrier to full social
participation of those individuals (Corrigan, 2016). Negative attitudes and stigma may impact
persons with SPMI in their efforts to access employment, housing, and other activities of daily
living (Falvo, 2014; Russinova et al., 2011). Persons with mental illness tend to be discriminated
against by employers when compared with individuals with physical disabilities (Brodwin,
Parker, & DeLaGarza, 2010). Rates of unemployment for individuals with bipolar disorder are
considerably higher than for the general population (Falvo, 2014; Hergenrather, Gitlin, &
Rhodes, 2011). Nevertheless, individuals with mental illness generally wish to be gainfully
employed. Employment for persons with SPMI contributes many social, economic, and
psychological benefits (Turner et al., 2015). For example, individuals with schizophrenia may
benefit from the structure, social interactions, and boost in self-confidence that work can provide
(Arns & Linney, 1993; Falvo, 2014; Twamley et al., 2005). Public stigma has been shown to
have a negative impact on treatment outcomes for individuals with SPMI, including vocational
rehabilitation (Perlick, 2001). This effect may be a factor of service availability or the attitudes
held by the service providers.
Smith and Cashwell (2010) suggested that stigma attributed to individuals with mental
illness permeates society. The authors suggest that those who work in the mental health field are
not immune from these attitudes. The authors investigated the attribution of stigma among
individuals in the mental health field (e.g., social workers, psychologists) compared with those
9
who were from a different field (business administration). Their results suggested that training
and exposure to information regarding mental illness increased positive attitudes. Although
Smith and Cashwell’s (2010) study relied on a relatively small sample size, their examination of
attitudes among mental health professionals yielded important data for the current study (Crowe
& Averett, 2015).
Researchers have examined subtle differences in language associated with attitudinal
reactions. For example, Granello and Gibbs (2016) randomly assigned participants to one of two
groups that differed in how individuals with mental illness were referred to. One group was
exposed to content that included the term “the mentally ill” while the other group was exposed to
the person-first language of “persons with mental illness.” The authors found that the difference
in terms had an impact on participants’ attitudinal responses (Taylor & Dear, 1981). Further, this
effect held true for the three different samples drawn from populations of undergraduate
students, adults in the general population, and human service professionals/counselors in training
(Granello & Gibbs, 2016).
Purpose of Study
The primary purpose of this study was to examine three primary factors. First, this study
collected data to determine the degree to which human service professionals (HSPs) in training
reported stigmatizing attitudes towards persons with SPMI. Second, the study investigated the
effects of different mental health labels (i.e., schizophrenia spectrum disorder or generalized
anxiety disorder) on attitudes and stigma associated with individuals with SPMI. Finally, this
study collected data to evaluate if prior contact, work experience, and other demographic factors
influenced these attitudes.

10
Summary
Prior research has evaluated the impact of mental health stigma on social relationships,
social participation, and social mores. Researchers have investigated the role of interventions in
decreasing negative attitudes and mental health stigma. This study examined disability attitudes
among HSPs. Further, through the use of vignettes, this study explored differences among
participants in responses to two mental health diagnoses. To manipulate the independent
variable, two vignettes were used. These vignettes were designed to be identical except for the
name of the individual and his mental health diagnosis. In the first vignette, the individual
(Harry) was described as having a diagnosis of schizophrenia spectrum disorder. In the second
vignette, the individual (Gary) was described as having a diagnosis of generalized anxiety
disorder. The underlying theory of the current study was attribution theory. Attribution theory
considers the assumption of cause (as defined in Jones et al., 1984) when individuals form
attributions about a particular group.
This chapter identified and described mental health stigma and the prior research that has
explored this phenomenon. This chapter also made the case for the significance of the problems
that currently exist in the literature and how this study was designed to address these issues.
Attribution theory, the current theoretical framework, was initially defined in this chapter. The
next chapter will include a more detailed review of previous literature on mental health stigma.
Furthermore, Chapter 2 will provide more details on the topics introduced in the first chapter.
Chapter 3 (Methodology) will offer detailed descriptions of the sample, procedures, and other
methodology used in the analysis. Further, the Methodology section will detail how each of the
research questions was addressed through statistical analysis. Chapter 4 (Results) details the
11
analysis conducted to address each question. Chapter 5 concludes with a general summary of the
results and a review of implications and limitations of this study.
Definition of Terms
Attribution theory – This term is defined as the degree to which a condition (e.g., severe
and persistent mental illness) is influenced, or caused, by the individual him or herself
and the degree to which other environmental or genetic factors are ruled out as potentially
causing the condition. This theory holds that the more a condition is viewed as being
caused by the individual (ruling out uncontrollable factors), the more negative reactions
will result.
Generalized Anxiety Disorder (GAD) – GAD is a mental disorder defined in the 5th
edition of the Diagnostic and Statistical Manual of Mental Disorders [DSM-5]
(American Psychiatric Association, 2013). As defined in the DSM- 5, GAD contributes
to excessive worry over many activities, events, or topics. This persistent worry must last
longer than 6 months and impact three or more physical or mental areas (DSM-5, 2013).
GAD typically affects an individual’s sleep quality or mental processing, therefore
impacting daily activities and quality of life (Falvo, 2014). Co-occurring mental or
physical disorders must be ruled out.
Human Service Professional (HSP) – An HSP or human service worker is a term used to
describe an individual who works with others to enhance their quality of life through the
services he or she provides (Moffat, 2011). They work with homeless populations,
veterans, immigrants, individuals with substance use, individual with mental illness,
individuals with disabilities, children, and the elderly (Moffat, 2011).
12
Person with a disability – An individual who has a physical or mental impairment that
substantially impacts one or more major life activities such as caring for oneself, walking,
seeing, breathing, or learning (Riggar & Maki, 2004)
Schizophrenia Spectrum Disorder – A mental disorder whose symptoms may include
delusions, hallucinations, disorganized speech, disorganized or catatonic behavior, or
other negative symptomology. At least two of the aforementioned symptoms must be
present for 1 month and substantially impact an individual’s daily life or social
functioning. These symptoms must not be better explained by any other co-occurring
disorder (American Psychiatric Association, 2013).
Severe and Persistent Mental Illness (SPMI) – SPMI is defined as (a) any mental,
behavioral, or emotional disorder that meets the diagnostic criteria outlined in the DSM-
5, currently or within the last year; (b) a condition that results in functional impairment
that substantially interferes with one or more major life activities (e.g., housing,
education, vocational, or activities of daily living; Center for Behavioral Health Statistics
and Quality, 2016).
Stigma – For the purposes of the current study, stigma is defined as the negative
evaluation made by an individual towards an observable characteristic that deviates from
societal norms (Hinshaw, 2007; Wright, 1980). Further, this deviation from social norms
extends beyond the normal individual differences that are expected (Coleman, 1986;
Goffman, 1963).
13
CHAPTER 2
LITERATURE REVIEW
Introduction
The purpose of this study was to examine the attitudes towards individuals with severe
mental illness held by human service professionals in training using two vignettes that depicted
an individual with a severe and persistent mental illness. Data were collected to examine
attitudinal differences toward two different diagnosable conditions, schizophrenia spectrum
disorder and generalized anxiety disorder, as depicted in the vignettes. Surveys were used to
collect participants’ perceptions of the individual depicted in the vignette as well as their overall
attitudes towards mental illness. Participants were randomly assigned to one of two groups,
which differed according to the vignette presented. Participants were recruited from counselor
education and related academic programs throughout the United States.
Prevalence and Definitions of Severe Mental Illness
As mentioned previously, in 2015 approximately 9.8 million individuals, 18 years and
older, had severe and persistent mental illness in the United States (NIMH, 2015). According to
national data, 3.1% of the U.S. population had a diagnosis of generalized anxiety disorder (APA,
2013). Individuals diagnosed with a mental illness may face many difficulties in their daily lives
(Corrigan et al., 2015). These areas of disruption may include vocational pursuits (Auerbach &
Richardson, 2005; Brohan & Thornicroft, 2010; Cook, 2006), education (Hunt & Eisenberg,
2010), social interaction (Schulze & Angermeyer, 2003), and general quality of life (Walton-
Moss et al., 2005). These issues may contribute to considerable distress and personal interference
in the individual’s life (Falvo, 2014).
14
In some circumstances, individuals with mental health issues may conceal their illness
from others and choose to disclose their illness to a limited few. Given this fact, mental illness
can be considered a hidden disability, meaning that these disabilities may exist without being
recognized by others. Hidden disabilities, as illustrated by Olney and Kim (2001), may pose
certain disadvantages as well as advantages to those impacted by them. One disadvantage is that
an individual’s mental disability may be viewed as less legitimate than an individual’s physical
disability. On the other hand, individuals with mental illness may have more liberty to self-
disclose their disability to others but not to all those with whom they come in contact (versus an
individual with a physical limitation; Olney & Kim, 2001).
For the purposes of this study, SPMI was defined as (a) any mental, behavioral, or
emotional disorder that meets the diagnostic criteria outlined in the DSM-5 currently or within
the last year, and (b) a condition that results in functional impairment, which substantially
interferes with one or more major life activities (Center for Behavioral Health Statistics and
Quality, 2016). The diagnostic system used to define mental illness carries both benefits and
limitations. The DSM-5, along with the International Classification of Diseases, provides
structure and organization to the professional understanding of mental illnesses, substance abuse,
and developmental disabilities. However, these classification systems are often seen as
necessary but not sufficient for understanding the subjective experiences faced by persons with
SPMI. Two individuals who share a common diagnosis, for example, may have varied
experiences with their illness (Pratt et al., 2007).
The Stigma of Mental Illness
Many factors have been shown to correlate with negative attitudes towards persons with
disabilities. Personal factors, including age, gender, and education level, will therefore be under
15
review in this study. Other contextual factors that have been related to stigmatizing attitudes
include personal contact and familiarity with persons with disabilities. The aforementioned
factors will affect the degree of social distance or closeness individuals may feel towards others
with mental illness. As mentioned previously, factors such as media portrayals of mental illness
play an important role in the formation of public stigma (Corrigan et al., 2013). However, these
factors are beyond the scope of this study.
Age. The age of participants was collected in the current study. In previous studies, the
age of participants correlated with attitudes towards persons with disabilities in general (Yuker,
1988). These studies suggest that older individuals generally tended to endorse stigmatizing
attitudes more than younger individuals (Link et al., 2004). These differences may be due to life
experiences, cultural influences, or some other factor (Hampton & Sharp, 2014).
Gender. The prior research in this area indicates that, in general, women have more
favorable attitudes than men toward individuals with disabilities (Boysen, 2017; Corrigan &
Watson, 2007; Upton & Harper, 2002; Wright, 1980; Yuker, 1988). Corrigan and Watson
(2007) found that woman were less likely to project pity and feel less personal blame towards
individuals with mental illness. Woman also indicated being more willing than men to offer help
to people with mental illness according to this study. When examining why these differences
exist, some have pointed to gender socialization differences between the sexes. Growing up,
boys and men may be taught to be competitive, to strive for achievement, and to control their
emotions, whereas girls and woman may be brought up in a context that values relationships,
caring, and understanding the emotional experiences of others (Hampton & Sharp, 2014).
Education Level. Several studies have suggested more educated individuals are less
likely to have negative attitudes towards persons with disabilities (Boen et al., 2016; Lam et al.,
16
2010). In a previous study, I found that among 400 undergraduate students surveyed, seniors and
graduate-level students were more likely to hold more favorable attitudes towards persons with
disabilities than freshman (Boen et al., 2016). However, these results may be due in part to other
factors such as specialized training or personal knowledge (Upton & Harper, 2002). In general,
those with more education are less likely to view individuals with mental health issues as
dangerous (Corrigan & Watson, 2007).
Personal Contact. Personal contact with individuals who have mental illness has been
examined as an indicator of attitudinal reactions towards mental illness (Corrigan et al., 2012;
Hackler et al., 2016; Sadow, Ryder, & Webster, 2002; Upton et al., 2005). Having a relative, a
spouse, a friend, or another acquaintance that has a mental illness has been shown to have the
strongest effect on one’s attitudinal reactions towards mental illness (Corrigan et al., 2012;
Hayward & Bright, 1997). The Level of Familiarity Scale (LOF) and the Scale of Attitudes
toward Disabled Persons-Prior Contact Form R (SADP-PCF-R) were used in the current study to
evaluate personal contact information from all participants.
Social Distance. Miller, Chen, Glover-Graf, and Kranz (2009) found that among college
students, many preferred less intimate relationships with individuals who had psychiatric
illnesses than with those with a physical disability. Gordon, Chariboga-Tantillo, Feldman, and
Perrone (2004) also found individuals reported being more willing to have closer relationships
with individuals who had physical disabilities than with those with severe mental disabilities.
Perceptions of both fear and discomfort appeared to influence decisions related to social
closeness (Marili, Glover-Graf, & Millington, 2012).
17
Human Services Professionals
This study evaluated the attribution of stigma towards individuals with mental illness
among human services providers. Human services professional or human service worker are
terms used to describe an individual who works with others to enhance their quality of life
through the services they provide (Moffat, 2011). HSPs work with homeless populations,
veterans, immigrants, individuals with substance use, individuals with mental illness, individuals
with physical disabilities, children, and the elderly (Moffat, 2011). These professionals work
collaboratively with individuals to identify and implement treatment goals, identify community
resources, and fulfill their educational and vocational goals. The clients whom these
professionals serve may be experiencing psychological distress due to traumatic events, mental
illness, or adjustment to a disability (Harker, Pidgeon, Klaassen, & King 2016). Professionals in
human services typically work in either a social service organization or a mental health agency
(Moffat, 2011). Occupational roles typically include either direct care or administration. Before
assuming these roles, individuals undergo professional training, typically at the postsecondary
level, in the academic disciplines of psychology, social work, school counseling, rehabilitation
counseling, or human services.
Academic Disciplines. The current study defined the target population as graduate-level,
human services professionals in training throughout the United States. This target population was
chosen to address the research questions posed. The academic fields considered for this study
were counseling psychology, mental health counseling, rehabilitation counseling, school
counseling, marriage and family therapy, and social work.
Counseling psychologist is a term to describe an individual who works in general practice
or direct health services provision. These professionals work with individuals of any age to

18
address emotional, social, environmental, or disability-related issues. Counseling psychologists
have training to address a wide range of issues from acute adjustment issues to severe and
persistent mental health concerns (American Psychological Association, 2018). Typical work
settings include academic, public sector, not-for-profit, and private practice (Stedman, Neff, &
Morrow 1995).
A mental health counselor is a professional who has training in clinical mental health or
closely related degree program to conduct individual or group counseling or psychotherapy.
These professionals have expertise in helping individuals deal with emotional distress, life
problems, or mental illness. A mental health counselor may work alongside psychologists and
social workers in community-based agencies, for-profit centers, or private practice (Neukrug,
2006). Marriage and family therapists have specialized knowledge in working with couples and
families. These areas may include family dynamics, family therapy techniques, human
dynamics, and human sexuality (Neukrug, 2006).
Rehabilitation counselors are professionals who help individuals with physical, mental,
developmental, and emotional disabilities. Rehabilitation counselors assist individuals to adjust
to disability, find employment, or live independently. They work with clients to overcome or
manage the personal, social, or psychological effects of disabilities in employment or
independent living settings (Riggar & Maki, 2004; Wright, 1980). A school counselor is a
professional who has a master’s-level degree in school counseling. A school counselor has
knowledge of child academic, career, and social/emotional developmental processes. They work
in primary education settings, kindergarten through 12th grade, developing programs to foster
student success (American School Counselor Association, n.d.). Clinical social workers represent
the largest organization of behavioral health practitioners in the nation (Barker, 2003). They
19
work in many different settings and with many different populations. They work with the
homeless population, immigrants/migrants, veterans, minorities, children, and individuals with
disabilities (Barker, 2003).
The Stigmatized Individual
The impact of social stigma towards individuals with mental illness can pose a significant
barrier to full participation for those individuals (Corrigan et al., 2015). For example, stigma can
negatively impact their employment outcomes and housing options (Cook, 2006; Falvo, 2014). If
members of the general public endorse the image of individuals with mental illness as dangerous,
incompetent, or unstable, it may negatively impact relationships and increase social distance
(Cooper, Corrigan & Watson, 2003; Falvo, 2014). The effects of public stigma of mental illness
can lead individuals to feel ashamed of their mental illness. Some may attempt to hide symptoms
of mental illness from friends and acquaintances (Corrigan, 2000; Schulze & Angermeyer,
2003).
Individuals with mental illness may be less willing to seek treatment within an
environment where such help is stigmatized (Corrigan et al., 2015; Perlick, 2001). The stigma
towards mental health treatment may contribute to less willingness to seek help among
individuals with SPMI (Hunt & Eisenberg, 2010; Sadow et al., 2002; Schulze, 2007). For
example, Eisenberg and colleagues (2009) found that among university students, perceived level
of stigma was associated with higher levels of self-stigma and lower levels of help-seeking
behaviors. Furthermore, the individuals’ degree of self-stigma towards their mental illness was
directly related to their willingness to seek treatment. However, the authors noted that contextual
factors also played a role in help-seeking behavior including the degree of confidentiality
surrounding seeking counseling or psychiatric care on campus. Hunt and Eisenberg (2010) found
20
that stigma associated with mental illness had an impact on college age students seeking out
services and treatment. Other factors such as time, cost, and confidentiality also impacted help-
seeking behaviors.
Schulze and Angermeyer (2003) conducted group interviews to gather personal
experiences of stigma among individuals with schizophrenia. They developed several themes
from these focus groups highlighting the personal impact of public stigma. Participants talked
about experiences of being rejected by friends and acquaintances after they disclosed their
mental illness. The participants also indicated that they were aware of how schizophrenia was
portrayed in the media influencing the stereotype that people like them were violent and
dangerous. Finally, the authors recognized that the impact of stigma towards mental illness had a
significant impact on participants’ daily lives.
Attribution Theory
Identified by the Austrian-born psychologist, Fritz Heider (1896-1988), attribution theory
(AT) seeks to identify the cognitive-emotional processes that influence human behavior
(Colman, 2006; Maio & Olson, 2000). Humans tend to seek the underlying cause of everyday
events that includes understanding others. Attributions are formed from the environment and
directly relate to the larger social context (Corrigan, 2000). Factors that seem to have the most
influence on negative reactions towards others include the stability of causality and
controllability of cause (Corrigan, 2000; Corrigan et al., 2003). The stability of causality refers
to whether or not the perception of cause is maintained throughout the duration of the condition.
For example, persons with SPMI may be viewed as less likely to recover fully from their
illnesses or achieve major life goals (Corrigan et al., 2013).
21
The second factor, controllability of cause, refers to the actual or perceived control an
individual has over his or her own actions. For example, a mental health issue may be seen as
being caused, or maintained, by the individual and therefore be viewed less favorably than other
physical disabilities. Similar judgments regarding cause are not typically attributed to persons
with neuromuscular diseases or blindness (Jones et al., 1984; Weiner, 1993). By extension,
mental illness may be perceived among some as resulting from poor life choices. Following this
logic, some may conclude that individuals with mental illness deserve the negative consequences
that may result from the disorder. However, according to AT, if the condition is seen as
influenced by forces outside the control of the individual, others may react with pity or offer to
help the individual. Therefore, if mental illness were viewed as resulting from abnormalities in
brain chemistry, and not by personal choice, attitudinal reactions would be more favorable
towards offering help and support.
Researchers have attempted to understand the function of attitude development and
maintenance (Hayward & Bright, 1997). Although a consensus has not been reached, four areas
have been identified: “an adaptation function, a value expression function, an ego-defense
function, and a knowledge organizational function” (Reeder & Pryor, 2000, p. 296). Physical
appearance influences how individuals are perceived within their context. Therefore, the
appearance of a disability influences the attitudinal reactions that occur (Wright, 1980). A value-
expressive attitude, one in which the attitude is formed, is consistent with the perceiver’s
personal values (Maio & Olson, 2000). Further studies supporting this phenomenon can be
found in evidence gathered through conditions linked to genetic factors (e.g., rather than
environmental ones), in which participants tend to respond with fewer stigmatizing reactions
(Hamann et al., 2013).
22
Other researchers have made the argument that the presence of a mental illness (either
actual or perceived) can contribute to how others act around those individuals (e.g., avoiding an
individual who acts in a socially deviant way; Corrigan, 2004; Fink & Tasman, 1992).
Attributions that are formed can be linked to behavioral responses including fear, anger, or pity
(Hinshaw, 2007).
Measuring Attitudes
A number of direct measures have been developed to evaluate stigma and attitudes
towards persons with disabilities (Antonak & Livneh, 2000), including persons with mental
illness (Findler, Vilchinsky, & Werner, 2007). These scales have included the Scale of Attitudes
Toward Disabled Persons (SADP; Antonak, 1982), the Multidimensional Attitudes Scale Toward
Persons with Disabilities (MAS; Findler et al., 2007), the Social Distance Scale (Link, Cullen,
Frank, & Wozniak, 1987; Penn et al., 1994; Reinke et al., 2004), the Perceived Devaluation–
Discrimination Scale (Link, Cullen, Struening, Shrout, & Dohrenwend, 1989), and the Level of
Contact Report scale (Holmes, Corrigan, Williams, Canar, & Kubiak, 1999). These scales have
provided researchers with the methods to examine attitudes for the past half century (Parker,
Szymanski, & Patterson, 2004; Yuker, 1988). Furthermore, these instruments have substantially
impacted what we know about attitudes and stigma towards persons with disabilities.
Antonak and Livneh (2000) suggested that when examining attitudes, the use of existing
measurement scales is preferable to the development of a new scale that examines similar
domains. Three existing scales were used for this study. The first, the Scale of Attitudes toward
Disabled Persons (SADP)-Prior Contact Form R (SADP-PCF-R; Appendix B) quantifies the
degree of participants’ level of contact and interactions with persons with disabilities. This scale
was chosen to quantify self-reported contact among participants. The use of the SADP-PCF-R
23
separately from the full SADP has been demonstrated in Brostrand (2006) and was duplicated in
the current study. In addition to the SADP- PCF-R, another form was used to determine prior
contact with persons with mental illness called the Level of Familiarity Scale (LOF; (Appendix
C). The LOF is designed to quantify how familiar a participant is with a mental illness. Greater
familiarity is correlated with lower levels of stigma associated with individuals with mental
illness (Hayward & Bright, 1997). The Attribution Questionnaire (AQ; Corrigan, 2012
[Appendix D]), which quantifies participants’ reactions to individuals with mental illness, was
paired with the vignettes in this study. Finally the Mental Health Provider Stigma Inventory
(MHPSI; Kennedy et al., 2014 [Appendix E]) was utilized in this study. The MHPSI was initially
constructed to be administered to mental health professionals to quantify the presence and extent
of stigma towards their clients (Kennedy et al., 2014).
This study was designed to examine stigmatizing attitudes toward individuals with SPMI
among students in human services counselor education programs. The attitudes of human
services professionals affect the quality of services they provide (Kennedy et al., 2014; Sadow et
al., 2002). Students in these programs may have negative or positive attitudes towards others. As
mentioned, attitudes may potentially impact emotional responses, cognitive schemas, and
behavioral reactions towards the stigmatized group (Hayward & Bright, 1997). Negative
perceptions of individuals with SPMI among human services providers in training (HSPs and
related fields) were examined in the current study. Further, these attitudes may impact the
perception of cause of mental illness, treatment recommendations, and prognosis. On the other
hand, positive attitudes towards mental illness may contribute to better outcomes for patients
seeking services.
24
Anticipated Findings
Through the examination of stigmatizing attitudes toward mental illness among
counselors in training, the researcher expected to draw several conclusions. The first research
question examined how students from different academic disciplines (e.g., rehabilitation
counseling, mental health counseling, social work, etc.) would respond to questions on the AQ-
27 and the MHPSI. The researchers expected to find that participants would have stigmatizing
attitudes toward mental illness based upon previous research (Kennedy et al., 2014; Smith &
Cashwell, 2010). However, what remained to be investigated was how students from different
HSP programs may differ in their attitudes towards individuals with SPMI. Based on the prior
research, it was hypothesized that mental health counselors would have the lowest level of
stigma related to individuals with mental illness (Neukrug, 2006; Lam, Lam, Lam, & Sun, 2015).
The second research question examined the relations between the diagnostic label of
mental illness and stigmatized attitudes towards mental illness measured by the AQ-27. This
research question was developed based on existing literature (e.g., Corrigan et al., 2012). It was
hypothesized that individuals exposed to the first vignette (Harry, who has schizophrenia) would
report more stigmatizing attitudes towards mental illness than individuals exposed to the second
vignette (Gary, who has generalized anxiety disorder). As indicated previously, the only
differences between Vignettes A and B were the name of the individual described and the
diagnostic label given to the individual. The extent to which this key information was recalled
from each vignette was tested during the pilot study. The rationale for this hypothesis was based
on the prior literature indicating that diagnostic labels are correlated with the stigmatization of
mental illness (Corrigan, 2000, 2016; Granello & Gibbs, 2016; Schulze & Angermeyer, 2003;
Taylor & Dear, 1981)

25
The final research question concerned the extent to which demographic characteristics
(e.g., age, gender, work experience), frequency of contact with persons with mental illness (as
measured by the LOF), and degree of knowledge of persons with disabilities (as measured by the
SADP-PCF) would impact individual attitudes towards SPMI. Past research indicated that these
demographic factors may not only affect individuals’ perceptions of SPMI but also impact the
effectiveness of anti-stigma interventions (Couture & Penn, 2003). The demographic factors
gathered for this study were proposed to have an impact on perceptions of SPMI. For example,
individuals who are older may have fewer stigmatizing attitudes towards SPMI than younger
individuals (Link et al., 2004; Yuker, 1988). Females may report fewer stigmatizing attitudes
when compared to males (Boysen, 2017; Corrigan & Watson, 2007; Wright, 1980; Yuker, 1988).
Individuals with higher levels of education level may report less stigma and feel less need for
social distance than those with lower levels of education (Marili et al., 2012; Miller et al., 2009).
Individuals from different educational programs may have differing levels of attitudes towards
individuals with SPMI (Boen, et al., 2016; Todor, 2013).
Individuals who report having more frequent or personal contact with individuals who
have SPMI may have fewer stigmatizing attitudes towards SPMI than those who report less
contact (Corrigan et al., 2012; Hackler et al., 2016; Sadow et al., 2002; Upton et al., 2005). Prior
research has indicated that the frequency of contact and level of familiarity may have more
predictive qualities than the demographic factors (Corrigan et al., 2012; Fichten, Schipper, &
Cutler 2005). Chapter 3 will summarize the methodology used in the current study. Chapter 4
will provide an overview of the results. Chapter 5, Discussion, will summarize the results and
their relation to the existing literature. Study implications will be offered as well as
recommendations for future research.
26
Summary of Key Findings
Nearly 10 million individuals, 18 years and older, have SPMI in the United States
(NIMH, 2015). The stigma of mental illness has persisted through time and has affected the
social and personal integration of this segment of the population into greater society. Personal
and environmental factors that contribute to stigma are also areas to be further explored
(Hayward & Bright, 1997). These factors include the perceiver’s age, gender, education level,
personal contact, and knowledge of individuals who have mental illness (Boysen, 2017; Corrigan
& Watson, 2007; Link et al., 2004; Upton & Harper, 2002; Wright, 1980; Yuker, 1988). Those
who work with individuals with SPMI are unfortunately not immune from stigmatizing reactions
towards those with mental illness (Kennedy et al., 2014; Smith & Cashwell, 2010).
Rehabilitation counselors seek to maintain and improve the functional independence of persons
with disabilities (Parker et al., 2004). These professionals advocate for the rights of persons with
disabilities and for their full participation in mainstream society (Riggar & Maki, 2003; Wright,
1980). The purpose of this study was to examine stigma towards SPMI among counselors in
training. A further goal of this particular study was to provide evidence to demonstrate the extent
to which stigma is impacted by the diagnosis presented in vignettes of two separate diagnosable
conditions.
27
CHAPTER 3
METHODOLOGY
In this study, I evaluated the degree to which perceptions of mental illness may impact
negative attitudes and stigma among counselors in training. Data were collected to examine how
these perceptions are influenced by demographic characteristics, level of contact, and frequency
of contact. I used two surveys to gather data both on mental health stigma (Attribution
Questionnaire-27) and on service recommendations (the Mental Health Provider Stigma
Inventory). Data were also gathered through a demographic form (Appendix A), frequency of
contact form (Prior Contact Form-R, Appendix B), and Level of Familiarity scale (Appendix C).
Participants consisted of university students from HSP disciplines including counselor education,
rehabilitation counseling, school counseling, and social work. Participants were identified and
recruited from Southern Illinois University Carbondale and other universities and institutions.
Further details will be provided in the participant section. This chapter will include a detailed
description of the design, the research questions, the instruments used to collect data, the planned
data analysis, and limitations of the current study.
Research Questions
The following three research questions were developed for the study.
1. Is there a significant difference in mean scores on the AQ-27 and MHPSI between
students from counselor education, rehabilitation counseling, and other academic
programs?
2. What is the function of the type of mental illness (schizophrenia spectrum disorder versus
generalized anxiety disorder) on attitudes towards individuals with SPMI among HSPs in
training?
28
3. How do prior contact and familiarity factors influence attitudes towards individuals with
SPMI while controlling for demographic characteristics?
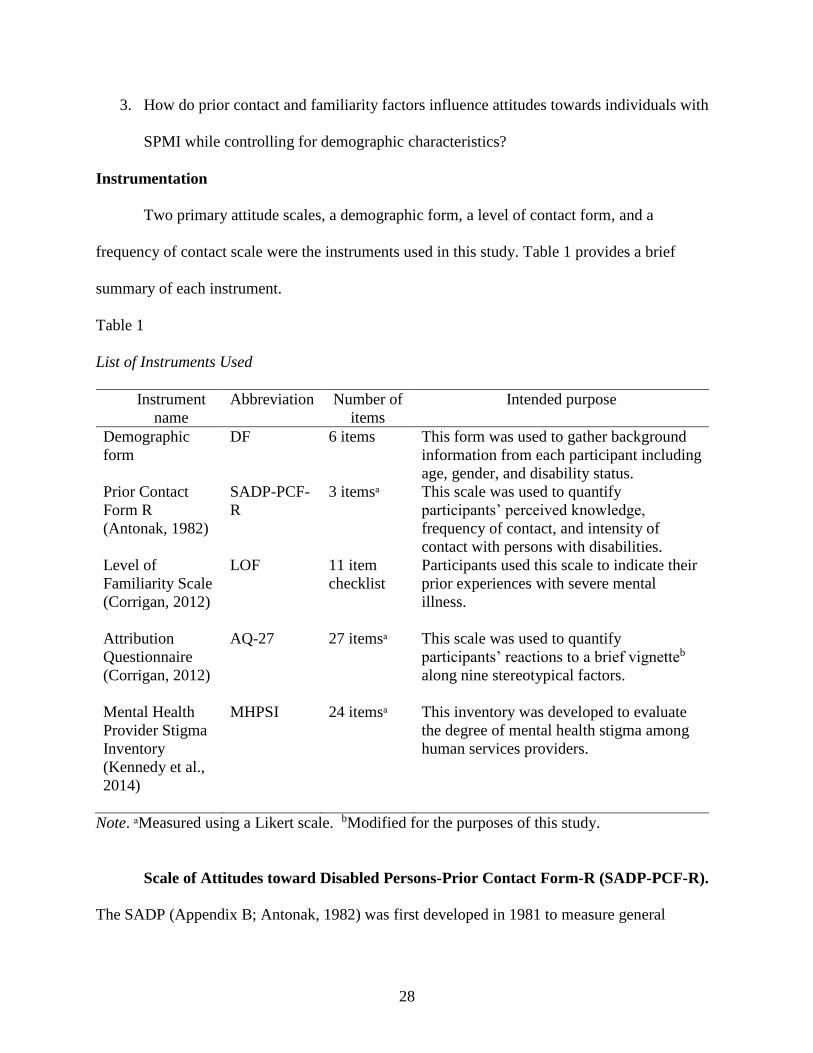
Instrumentation
Two primary attitude scales, a demographic form, a level of contact form, and a
frequency of contact scale were the instruments used in this study. Table 1 provides a brief
summary of each instrument.
Table 1
List of Instruments Used
Instrument
name
Abbreviation Number of
items
Intended purpose
Demographic
form
DF 6 items This form was used to gather background
information from each participant including
age, gender, and disability status.
Prior Contact
Form R
(Antonak, 1982)
SADP-PCF-
R
3 itemsᵃ This scale was used to quantify
participants’ perceived knowledge,
frequency of contact, and intensity of
contact with persons with disabilities.
Level of
Familiarity Scale
(Corrigan, 2012)
LOF 11 item
checklist
Participants used this scale to indicate their
prior experiences with severe mental
illness.
Attribution
Questionnaire
(Corrigan, 2012)
AQ-27
27 itemsᵃ
This scale was used to quantify
participants’ reactions to a brief vignetteb
along nine stereotypical factors.
Mental Health
Provider Stigma
Inventory
(Kennedy et al.,
2014)
MHPSI
24 itemsᵃ
This inventory was developed to evaluate
the degree of mental health stigma among
human services providers.
Note. ᵃMeasured using a Likert scale. bModified for the purposes of this study.
Scale of Attitudes toward Disabled Persons-Prior Contact Form-R (SADP-PCF-R).
The SADP (Appendix B; Antonak, 1982) was first developed in 1981 to measure general
29
attitudes among the public towards others’ disabilities. Further, this scale was developed as an
alternative to the Attitudes toward Disabled Persons, Form O (Lam et al., 2010). The SADP-
PCF-R is a brief three-question questionnaire given to participants to indicate prior level of
contact with persons with disabilities (Antonak & Livneh, 1988). The questions prompt
participants to report their frequency of contact, intensity of contact, and knowledge of people
with disabilities (Brostrand, 2006). For scoring and data analysis purposes, participants’ scores
were added for a total score ranging from 3 to 18. Higher scores from the SADP-PCF-R are
indicative of more frequent contact with persons with disabilities (Lam et al., 2010). This scale
was used for this study to quantify prior contact and knowledge of persons with disabilities.
Participants were asked to rank all their responses on a 6-point Likert-type scale. Past research
has illustrated that personal interactions with persons with disabilities positively correlate with
favorable attitudes (Corrigan et al., 2003; Fichten, et al., 2005).
Level of Familiarity Scale (LOF). The LOF (Appendix C; Corrigan, 2012) presents a
series of 11 statements that range from no contact (e.g., “I have never observed a person that I
was aware had a severe mental illness”) to frequent contact including personal experiences with
mental illness (e.g., “I have a severe mental illness”; Corrigan, 2012). Instructions provided on
the LOF indicate that participants are to place a checkmark next to the statements that represent
their personal experiences. Scoring of the LOF may be complicated by the fact that participants
may have placed checkmarks next to more than one statement. Therefore, scoring procedures
provided by Corrigan (2012) indicate that the selected statement that corresponds to the highest
degree of contact should be considered for the overall score. For example, if a participant placed
a checkmark by both statements, “I have observed, in passing, a person I believed may have had
a severe mental illness” (score 2) and “I have watched a documentary on television about severe

30
mental illness” (score 4), the form was given an overall score of “4.” This score produced by the
LOF (e.g., 1-11) represents level of intimacy with persons with mental illness. Therefore, a score
of “11” denotes the most intimate contact and a score of “1” represents the least contact with
persons with SPMI (Corrigan, 2012). This scale was developed by Corrigan, Edwards, and
colleagues (2001) and based upon other instruments that existed in the literature. High interrater
reliability (0.83) and rank order of the items were established upon the initial development of the
LOF (Corrigan, Edwards, Green, Diwan, & Penn 2001). The SADP-PCF-R and LOF used to
collect data for this study can be found in Appendixes B and C, respectively. Permission to use
the LOF was granted on February 20, 2017, by Dr. Corrigan for use in the current study (see
Appendix K).
The researcher constructed the demographic form (DF) for this study (see Appendix A).
This form gathered information from each participant including age, gender, and academic level
at the university. Data obtained for this form were used to describe the demographics of the
sample and for statistical analysis. Age, gender, number of years worked professionally, and
academic standing were used as predictors in a hierarchical multiple regression analysis as
discussed later in this chapter.
Attitude Measurements
A number of scales and instruments have been developed to evaluate the effects of stigma
and attitudes towards persons with disabilities (Antonak & Livneh, 2000). Other scales evaluate
attitudes towards persons with mental illness (Findler et al., 2007). Both the Attribution
Questionnaire (AQ) and the Mental Health Provider Stigma Inventory (MHPSI) were used for
the purposes of quantifying attitudes towards persons with SPMI.
31
The Attribution Questionnaire-27 (AQ-27). The AQ measures fundamental elements
of Corrigan’s social cognitive model (Corrigan et al., 2003; Link et al., 2004). This model was
informed by the work of Weiner et al. (1993) on attribution theory to understand the personal
attitudes and social stereotypes regarding mental illness (Corrigan, 2014). The initial AQ
included 21 questions and measured reactions to an individual with an SPMI. This scale
measured perceptions of personal responsibility, pity, anger, fear, helping avoidant behavior,
coercion, and segregation (Corrigan et al., 2002). The evaluation of attitudes towards individuals
who have SPMI was collected using the AQ-27.
Three updated versions of the AQ were developed for use with different populations,
including children (Corrigan, 2014). The full 27-item version (AQ-27) includes items that
address nine stereotypes about mental illness. The updated AQ-27 (Appendix D) includes factors
similar to the original AQ. However, the AQ-27 has slightly altered domains that Corrigan
(2014) defined as responsibility, pity, anger, dangerousness, fear, help, avoidance, segregation,
and coercion towards individuals with mental illness. Coercion, in this context, is defined as the
degree to which persons with mental illness should be forced into treatment for their condition
(Corrigan, 2014).
The original AQ-27 scale includes a short vignette about a 30-year-old man named Harry,
who has schizophrenia. For the purposes of the current study, the instructions for the AQ-27
were slightly altered in that participants were to reflect upon the vignette that they were exposed
to (see Appendix D). Further details of the modified vignette are provided later in this chapter.
Respondents were asked to read the vignette and respond to each question using a 9-point Likert-
type scale (e.g., 1 = not at all, 9 = very much). Questions included: “I would feel unsafe around
Harry” (dangerousness) or “I would share a car pool with Harry every day” (avoidance). Scoring

32
of the AQ-27 included calculating the sum of three items in each domain, including reversing
scores in the help and avoidance domains. Each domain received a score between 3 and 27. High
scores represented a higher degree of agreement with each domain (Corrigan et al., 2004).
Test-retest reliability coefficients were collected on the AQ-27 in Corrigan et al. (2004).
The results indicated fairly strong evidence for all nine domains: responsibility (0.55), pity
(0.82), anger (0.64), dangerousness (0.87), fear (0.86), help (0.80), avoidance (0.78), segregation
(0.75), and coercion (0.56). The AQ has been utilized in many different scientific investigations
(Cooper et al., 2003; Corrigan et al., 2001; Corrigan et al., 2003). The AQ has been translated
and used in different languages (Pingani et al., 2012). Permission to use the AQ-27 was granted
on February 20, 2017, by Dr. Corrigan for use in this study (Appendix K).
The Mental Health Provider Stigma Inventory (MHPSI). The MHPSI (Appendix E;
Kennedy et al., 2014) is a scale developed to evaluate the degree of mental health stigma among
human services providers. Further, this scale evaluates stigma influences, attitudes, behaviors,
and coworker influence (Kennedy et al., 2014). The environmental context also impacts human
services providers’ stigmatization of mental health. Social desirability within a work
environment impacts the attitudes towards individuals with mental illness (Kopera et al., 2015).
Therefore, the MHPSI also takes into account how coworkers’ attitudes or behaviors influence
others within the same work environment. Scoring of the instrument and interpretation of the
MHPSI are provided by Kennedy et al. (2014). Three subscales, attitudes, behavior, and
coworker influences, are calculated by obtaining the total score of the items within each
respective section. Higher scores on all subscales denote less favorable attitudes towards clients
with mental illness.
33
Through the development phase, Kennedy and colleagues (2014) found the internal scale
consistency of the MHPSI as measured by Cronbach’s α coefficients were relatively high (α =
.94). Additionally the internal scale consistencies for all three subscales were measured as
attitudes (α =.83), behaviors (α =.85), and coworker influences (α =.94). The construct validation
of the MHPSI occurred when items in the subsection were correlated with established measures
in the field. Permission to use the MHPSI was granted on August 4, 2017, by Dr. Stephanie
Kennedy for use in this study (Appendix L). The full version of this scale is provided in
Appendix E of this document.
Research Design
The intervention consisted of two vignettes. Both vignettes provided information about
an individual who has a mental illness diagnosis. In the first vignette (Vignette A), a person
(Harry) with schizophrenia spectrum disorder was described. The second (Vignette B) was
similar to Vignette A; however, the description provided information about an individual (Gary)
with a diagnosis of generalized anxiety disorder (GAD). Further details will be given. Following
exposure to either vignette, each participant completed the Attribution Questionnaire-27 (AQ-27;
Corrigan, 2012) and the Mental Health Provider Stigma Inventory (MHPSI; Kennedy et al.,
2014).
An equal number of approximately 40 participants were exposed to either Vignette A or
Vignette B; excluding the differences in the vignettes, participants’ experiences were similar.
Random assignment to Vignette A or B was achieved through the use of SurveyMonkey
software (Howell, 2010). All participants were asked to complete frequency of contact (LOF)
and prior contact (SADP-PCF-R) forms first. Then each participant viewed the vignette followed

34
by administration of the AQ-27 and MHPSI. Finally, all participants answered demographic
information on the demographic form.
Methods
Data collection occurred using the online survey program called SurveyMonkey.
SurveyMonkey is a password-protected survey program that was used to develop and distribute
all materials for this study (2018). There are many benefits of using an online survey including
less administrative cost, ease of use for participants, less risk of error in data, and quicker
response time (Dillman et al., 2009). The online survey incorporated random assignment to
groups by design. Each condition was weighted equally to ensure participants were assigned to
each group randomly.
Email requests, flyers, and in person requests by the primary researcher were used to
inform potential participants of the study. Using the methods proposed by Dillman et al. (2009),
multiple email requests were sent to encourage participation (Appendix F). Potential participants
were sent a total of three emails over the course of 6 weeks at Southern Illinois University-
Carbondale (SIU). Participant recruitment from other universities was undertaken in this study
through national professional organizations. Each participant accessed all documents required
for participation including the consent for voluntary participation document, prior contact
measures (see Appendix B), the attitudinal measures (see Appendices D and E), and the
demographic form (see Appendix A). Participants took an average of 11 minutes to complete the
online survey.
Population and Sample. A convenience sampling procedure was used to approach 120
total participants. Power analysis was used to inform the minimum number of participants
needed for this study, as will be discussed later (Creswell, 2014). The choice of using a
35
convenience sampling procedure was made due to the need to approach participants who were in
counseling and other related programs at SIU and other universities (Creswell, 2014; Gliner,
Morgan, & Leech, 2009). Inclusion criteria for participation in this study were used. First,
individuals may not have previously participated. Second, individuals must be at least 18 years
of age or over. Finally, individuals must be currently enrolled (at the time of data collection)
either full or part time in a human service graduate program (e.g., rehabilitation counseling,
social work, counseling psychology, etc.) at a postsecondary institution in the United States.
The recruitment strategy included three approaches. First, potential participants were
identified and recruited from Southern Illinois University, Carbondale (SIU) in Carbondale,
Illinois. Next, the researcher expanded the recruitment of participants from other universities
throughout the United States (the number and location of these universities are provided).
Finally, the researcher sought approval from regional and national professional organizations in
counseling and human services to notify student members.
As mentioned, the first approach at participant recruitment occurred on the SIU campus. I
(primary researcher) had face-to-face meetings with faculty and instructors on campus to request
permission to enter their classes and email requests for voluntary participation. I posted
informational flyers (Appendix G) in many human services departments on the SIU campus.
Some individuals taking part in this study were asked in person to volunteer. I entered classes in
human services disciplines and explained the general purpose, inclusion criteria, incentives for
participation, and specific time requirements needed for participation.
The second recruitment strategy involved the recruitment of participants from other
universities throughout the United States. Personal email requests were sent to departmental
chairs and administrative staff of 16 different universities throughout the United States. I made
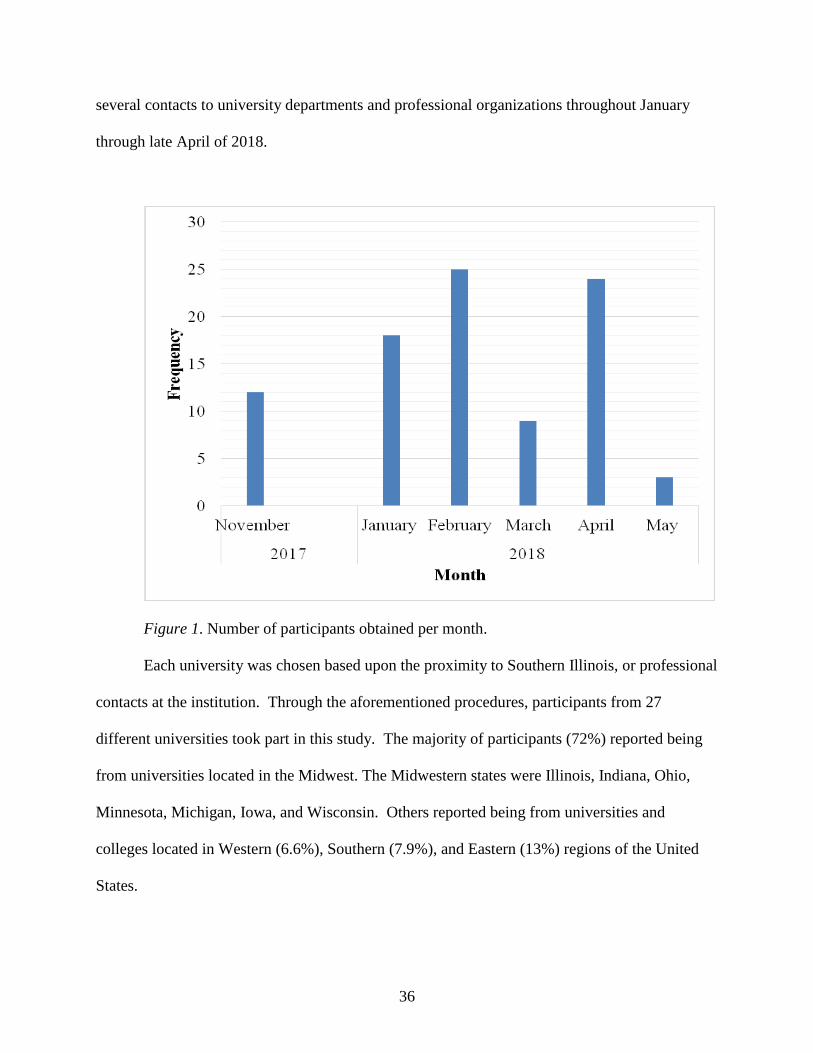
36
several contacts to university departments and professional organizations throughout January
through late April of 2018.
Figure 1. Number of participants obtained per month.
Each university was chosen based upon the proximity to Southern Illinois, or professional
contacts at the institution. Through the aforementioned procedures, participants from 27
different universities took part in this study. The majority of participants (72%) reported being
from universities located in the Midwest. The Midwestern states were Illinois, Indiana, Ohio,
Minnesota, Michigan, Iowa, and Wisconsin. Others reported being from universities and
colleges located in Western (6.6%), Southern (7.9%), and Eastern (13%) regions of the United
States.

37
The final recruitment procedure used was the contact of professional organizations.
These organizations consisted of student members whom this study targeted and who lived
throughout the United States. Student members of these professional organizations were
approached because they represented a variety of individuals enrolled in counseling (or closely
related) programs throughout the country. Professional organizations contacted for this study
included the National Council on Rehabilitation Education (NCRE), the American Counseling
Association (ACA), the National Association of Social Workers (NASW), the Missouri Mental
Health Counselors Association (MMHCA), the Illinois Mental Health Counselors Association
(IMHCA), and the Illinois Counseling Association (ICA). Permission to distribute the survey
was obtained from NCRE, ACA, and NASW for this study. Given the number of programs and
organizations approached for the purposes of participant recruitment, I was unable to determine
the approximate number of students in each program that was contacted for the purposes of this
study. Figure 1 displays the frequency of participation for each month of data collection.
Vignettes. As discussed previously, two modified vignettes were used for this study.
Both vignettes provided information about an individual who lives with an SPMI. Additional
information included how the mental illness impacted the daily life and functioning of that
individual. The only differences between the two vignettes were the disclosed diagnosis and the
individual’s name.
Vignettes A and B were based on the vignette developed in Corrigan’s (2012) Attribution
Questionnaire. The original vignette states: “Harry is a 30-year-old single man with
schizophrenia. Sometimes he hears voices and becomes upset. He lives alone in an apartment
and works as a clerk at a large law firm. He has been hospitalized six times because of his
illness” (Corrigan, 2013, p. 12). The current study modified this vignette to reflect the aims of
38
the current design. In one vignette, the subject named “Harry” was described as having a
diagnosis of schizophrenia spectrum disorder (Vignette A). In the other vignette, the subject
named “Gary” was described as having a diagnosis of generalized anxiety disorder (Vignette B).
For the current study, the first vignette (A) stated: “Harry is a 25-year-old single man
with schizophrenia. Harry is a part time student studying psychology at a university and lives in
his own apartment. Because of his illness, Harry misses classes and does not leave his apartment
for days. He has been hospitalized in the past because of his illness”.
The second vignette (B) stated: “Gary is a 25-year-old single man with generalized
anxiety disorder. Gary is a part time student studying psychology at a university and lives in his
own apartment. Because of his illness, Gary misses classes and does not leave his apartment for
days. He has been hospitalized in the past because of his illness”.
Both vignettes were designed to be the approximate length of the original and provided a
similar amount of information about the subject. The use of vignettes can prompt participants in
a specific way according to the purpose of the planned analysis (Finch, 1987; Hayward & Bright
1997). Vignettes have many advantages over other methodologies, one being their reasonable
cost and accessibility to researchers (Wilson & While, 1998). Vignettes also have the advantage
of presenting a consistent stimulus to each participant. Participants in this study may have had a
wide range of prior knowledge or experience with mental illness. Vignettes are generally
accessible to participants who do not have a thorough understanding of the topic (Hughes &
Hughes, 2001, 2004). As described, the AQ-27 was used to gather data from each participant
following his or her reviewing of the vignette.
Pilot Study. All materials used were submitted to the dissertation committee overseeing
this project in the Rehabilitation Institute at Southern Illinois University-Carbondale (SIU).
39
Upon permission of this committee, the materials were sent to the SIU and Troy University
Human Subjects Committees for review and approval (Appendices H & I). A pilot study was
conducted to test the methodologies developed for this study using a group of participants
(Gliner et al., 2009). The subject pool for the pilot study consisted of alumni of the rehabilitation
counseling program. Access to this group was obtained through the Rehabilitation Institute at
SIU. Pilot testing is used for many purposes, including understanding the feasibility of testing
materials. Pilot test data were gathered to access average time to participate and content validity
of the surveyed items. Hertzog (2008) recommended that an appropriate size of the pilot study is
dependent on what the researcher hopes to accomplish with the data. For example when a
researcher is evaluating the feasibility of testing materials, the selection of the sample size has a
direct influence on predicting the outcome of the full study; thus, the greater the sample size, the
better the prediction of some property of interest. Using Hertzog’s (2008) recommendations for
sample size, I may have been able to make inferences to the collection of all data. The aim of this
pilot study was to gather feedback (Appendix J) to identify ease of process, test the effects of the
vignette, and identify any concerns about the study materials. Twelve participants were
approached to take part in the pilot study. Data results are presented in the next chapter.
Statistical Analysis
Table 2 summarizes each research question, the corresponding variable list, and the
statistical analysis used to address each question. A description of the independent and dependent
variables is provided as well as the scale of measurement for each.
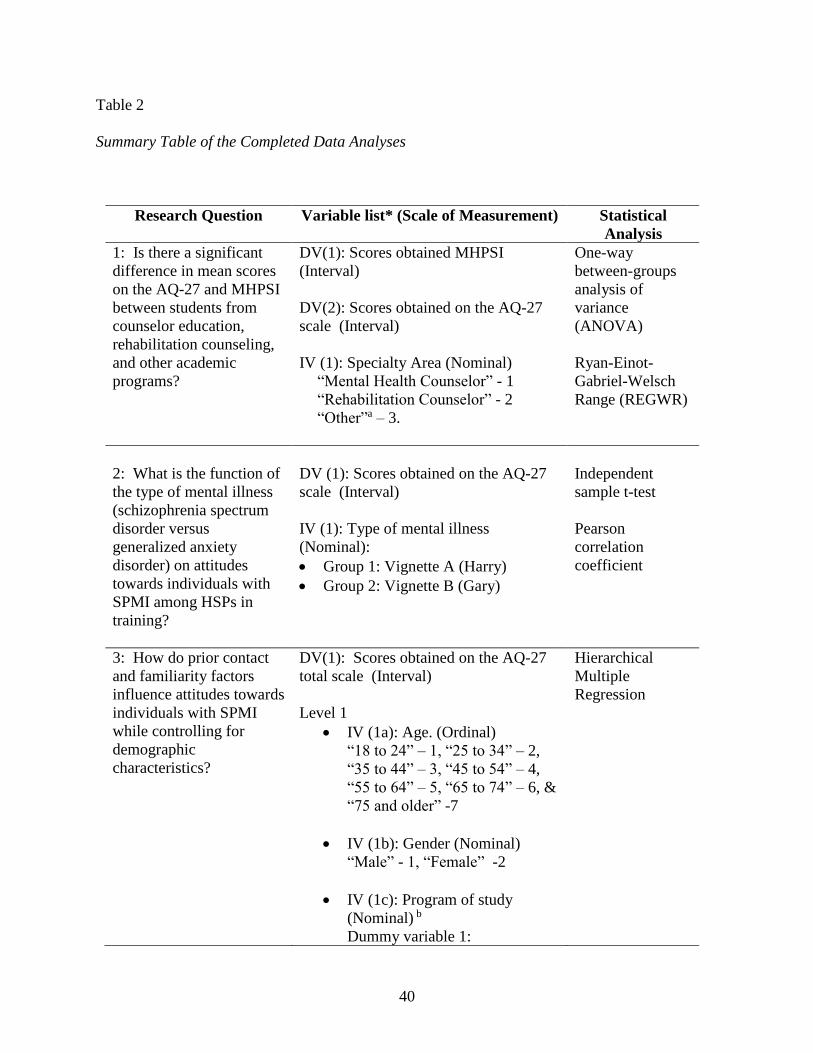
40
Table 2
Summary Table of the Completed Data Analyses
Research Question Variable list* (Scale of Measurement) Statistical
Analysis
1: Is there a significant
difference in mean scores
on the AQ-27 and MHPSI
between students from
counselor education,
rehabilitation counseling,
and other academic
programs?
DV(1): Scores obtained MHPSI
(Interval)
DV(2): Scores obtained on the AQ-27
scale (Interval)
IV (1): Specialty Area (Nominal)
“Mental Health Counselor” - 1
“Rehabilitation Counselor” - 2
“Other”a – 3.
One-way
between-groups
analysis of
variance
(ANOVA)
Ryan-Einot-
Gabriel-Welsch
Range (REGWR)
2: What is the function of
the type of mental illness
(schizophrenia spectrum
disorder versus
generalized anxiety
disorder) on attitudes
towards individuals with
SPMI among HSPs in
training?
DV (1): Scores obtained on the AQ-27
scale (Interval)
IV (1): Type of mental illness
(Nominal):
Group 1: Vignette A (Harry)
Group 2: Vignette B (Gary)
Independent
sample t-test
Pearson
correlation
coefficient
3: How do prior contact
and familiarity factors
influence attitudes towards
individuals with SPMI
while controlling for
demographic
characteristics?
DV(1): Scores obtained on the AQ-27
total scale (Interval)
Level 1
IV (1a): Age. (Ordinal)
“18 to 24” – 1, “25 to 34” – 2,
“35 to 44” – 3, “45 to 54” – 4,
“55 to 64” – 5, “65 to 74” – 6, &
“75 and older” -7
IV (1b): Gender (Nominal)
“Male” - 1, “Female” -2
IV (1c): Program of study
(Nominal) b
Dummy variable 1:
Hierarchical
Multiple
Regression
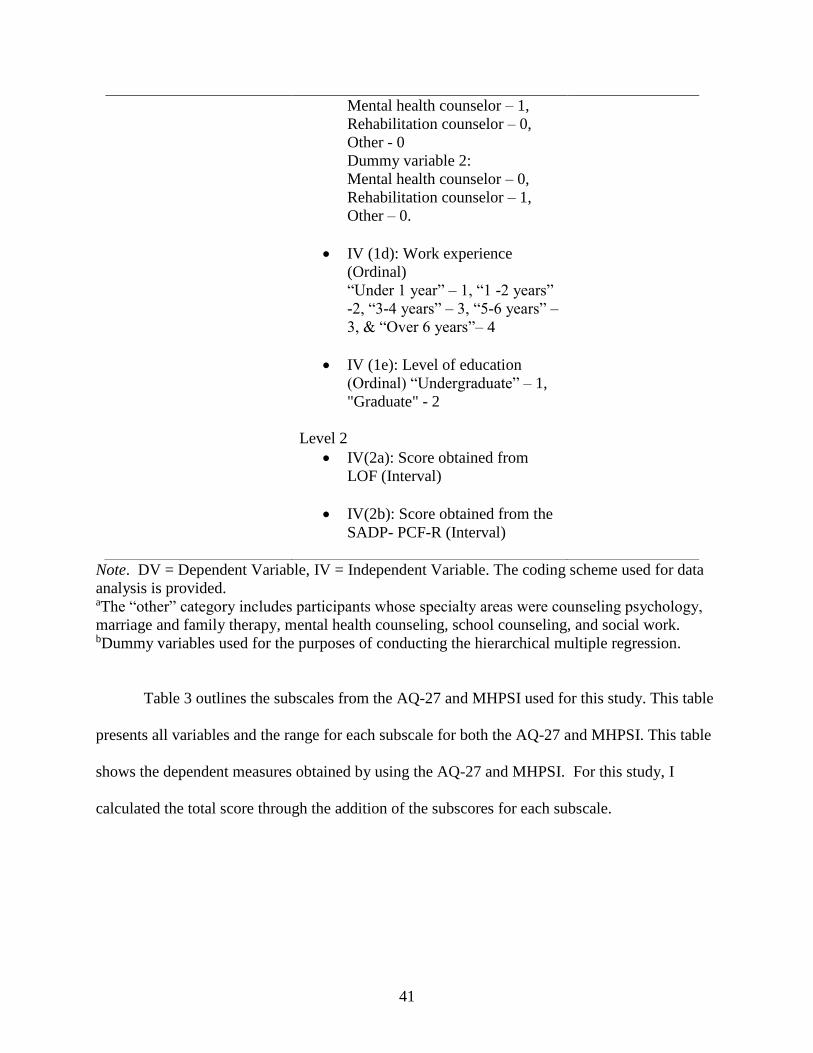
41
Note. DV = Dependent Variable, IV = Independent Variable. The coding scheme used for data
analysis is provided. aThe “other” category includes participants whose specialty areas were counseling psychology,
marriage and family therapy, mental health counseling, school counseling, and social work. bDummy variables used for the purposes of conducting the hierarchical multiple regression.
Table 3 outlines the subscales from the AQ-27 and MHPSI used for this study. This table
presents all variables and the range for each subscale for both the AQ-27 and MHPSI. This table
shows the dependent measures obtained by using the AQ-27 and MHPSI. For this study, I
calculated the total score through the addition of the subscores for each subscale.
Mental health counselor – 1,
Rehabilitation counselor – 0,
Other - 0
Dummy variable 2:
Mental health counselor – 0,
Rehabilitation counselor – 1,
Other – 0.
IV (1d): Work experience
(Ordinal)
“Under 1 year” – 1, “1 -2 years”
-2, “3-4 years” – 3, “5-6 years” –
3, & “Over 6 years”– 4
IV (1e): Level of education
(Ordinal) “Undergraduate” – 1,
"Graduate" - 2
Level 2
IV(2a): Score obtained from
LOF (Interval)
IV(2b): Score obtained from the
SADP- PCF-R (Interval)
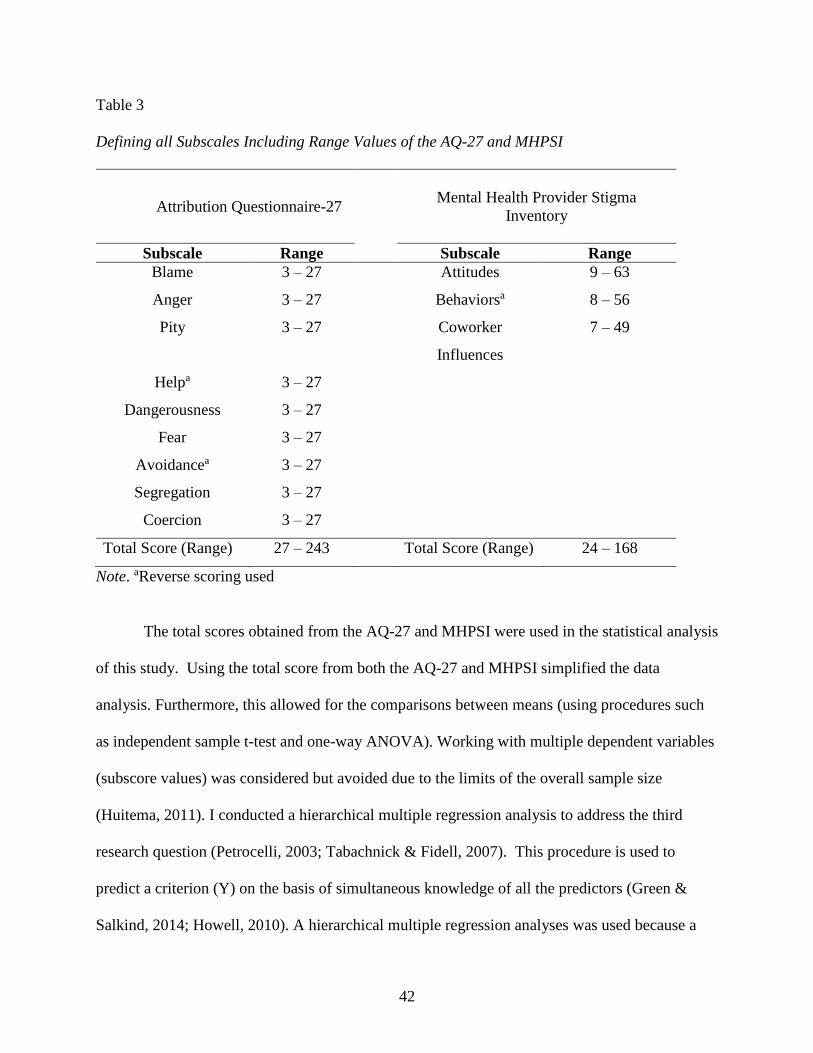
42
Table 3
Defining all Subscales Including Range Values of the AQ-27 and MHPSI
Attribution Questionnaire-27
Mental Health Provider Stigma
Inventory
Subscale Range Subscale Range
Blame 3 – 27 Attitudes 9 – 63
Anger 3 – 27 Behaviorsa 8 – 56
Pity 3 – 27 Coworker
Influences
7 – 49
Helpa 3 – 27
Dangerousness 3 – 27
Fear 3 – 27
Avoidancea 3 – 27
Segregation 3 – 27
Coercion 3 – 27
Total Score (Range) 27 – 243 Total Score (Range) 24 – 168
Note. aReverse scoring used
The total scores obtained from the AQ-27 and MHPSI were used in the statistical analysis
of this study. Using the total score from both the AQ-27 and MHPSI simplified the data
analysis. Furthermore, this allowed for the comparisons between means (using procedures such
as independent sample t-test and one-way ANOVA). Working with multiple dependent variables
(subscore values) was considered but avoided due to the limits of the overall sample size
(Huitema, 2011). I conducted a hierarchical multiple regression analysis to address the third
research question (Petrocelli, 2003; Tabachnick & Fidell, 2007). This procedure is used to
predict a criterion (Y) on the basis of simultaneous knowledge of all the predictors (Green &
Salkind, 2014; Howell, 2010). A hierarchical multiple regression analyses was used because a

43
hypothesized order to the predictors was established prior to analysis (Petrocelli, 2003). Further,
based on the prior literature, I expected that the prior contact or familiarity scores would play a
more important role in predicting the outcome variable (AQ-27) than the demographic
information (Corrigan et al., 2012; Fichten et al., 2005; Hackler et al., 2016; Sadow et al., 2002;
Upton et al., 2005). Therefore, I implemented a two-step level process for the evaluation of these
factors in the specific order established to address the research question (Petrocelli, 2003).
Further, using this design, I was able to examine the influence of particular predictors
while holding others constant in the model (Howell, 2010). Finally, to further evaluate the role
of stigmatized attitudes towards individuals with SPMI, several predictors were examined (e.g.,
demographic factors, attitudes, and degree/ frequency of contact).
Statistical Assumptions. The statistical assumptions of a between-subjects one-way
ANOVA, independent samples t-test, Pearson correlation coefficient analysis, and hierarchical
multiple regression will be discussed. A between-subjects one-way ANOVA and follow-up post-
hoc procedures were used to address the first research question. The statistical assumptions of a
one-way ANOVA include homogeneity of variance, normality, and independent observations
(Howell, 2010). Normality in each condition was checked, and the normality assumption was not
markedly violated. Finally, each data point represented an individual response and was assumed
not to be influenced by others.
An independent sample t-test and Pearson correlation coefficients were used to address
the second research question. The statistical assumptions of the independent samples t-test are
the assumption of normality and the homogeneity of variance assumption. These assumptions
were addressed prior to data analysis.

44
There are many statistical assumptions for multiple regressions that specifically apply to
fixed effects models (Green & Salkind, 2014). These assumptions are that the multivariate
variable is normally distributed, there is a linear relationship between the predictor and outcome
measures, multicollinearity, and independence of observations (Tabachnick & Fidell, 2007). To
insure the multivariate variable was normally distributed, visual inspection of the P-P plots was
used. To evaluate the linear relationship between the independent and dependent variables, a
graph was created to explore the relationship between the expected and observed cumulative
probability values. Visual inspection of these graphs showed that these values fell approximately
along a linear path. Second, the standardized residual values (min/max) were within appropriate
ranges (-3 and +3). Finally, Cook’s distance values were all shown to have values within the 0 to
+1 range. To address the issue of multicollinearity, a correlation matrix was established between
the dependent variable and all predictor variables (see Table 12, Chapter 4). The correlation
between all the predictor variables was small (r < .70; Howell, 2010).
Using participants who are attending a university carries a host of generalizability issues
(Antonak & Livneh, 1988; Corrigan et al., 2012). Contributing to generalizability deficits,
convenience sampling was used to access the sample. Nadler et al. (2015) suggested that the use
of nonprobability sampling procedures is fairly common in psychological research. However, the
use of these sampling procedures may produce results that cannot be generalized to the
population, have increased variability, and pose other risks to external validity (Trochim &
Donnelly, 2006). To counterbalance these effects, I used random assignment of participants to
groups (Gliner et al., 2009). The current study used SurveyMonkey to randomly assign
participants to either vignette. Random selection of a sample from the population was not
achieved for this study.

45
Power Analysis. One issue with using null hypothesis significance testing is that the
results from a sample do not necessarily reflect the true state of affairs in the population even
when a statistically significant result is found (Rutherford, 2011). Other indices are therefore
needed to support the results of a test to assist in the determination of practical significance.
Effect size is used as a standard measure of how much impact the treatment had on the
dependent variable (Gliner et al., 2009). The effect size is important in planning studies so that
an estimate of an appropriate sample size can be made (Howell, 2010). Towards the goal of
establishing an appropriate effect size, Murphy and Myors (2004) suggested using widely
accepted conventions about what represents small, medium, or large effect sizes. Cohen (1988)
published standards regarding small (< .2), medium (< .5), or large (< .8) effect sizes (Chan,
Bezyak, Ramirez, Chiu, & Fujikawa, 2010).
Further, power analysis is a powerful tool in determining how many subjects should be
used in a given study, how many observations should be used, and what are the appropriate
criteria for determining statistical significance (e.g., setting an alpha level at .01 or .05; Gliner et
al., 2009; Meline, 2006). The simplest method for increasing the test sensitivity is to increase the
sample size. As the effect size increases, so does the statistical power of the test. In addition,
when the alpha level is set to .05, the overall statistical power increases versus when it is set to
.01 or .001. The relationship between statistical power and the alpha level is seen as a tradeoff.
The decision to assign alpha to a given value is done to reduce the risk of a Type I error (or a
false positive result). Murphy and Myors (2004) emphasized that any efforts to reduce the
incidence of Type I error may impact the overall power of a result, further increasing the risk of
a Type II error. Using the G*Power statistical program, I conducted three different power
calculations corresponding to primary statistical analysis for each research question (Chan et al.,
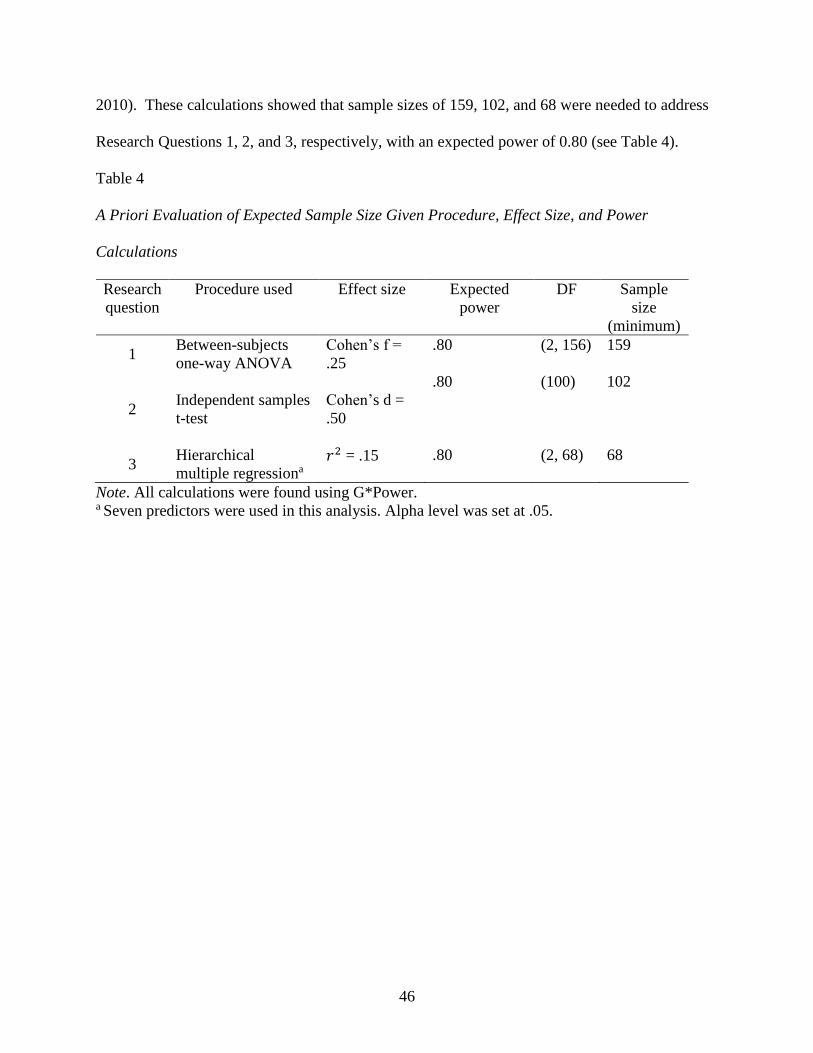
46
2010). These calculations showed that sample sizes of 159, 102, and 68 were needed to address
Research Questions 1, 2, and 3, respectively, with an expected power of 0.80 (see Table 4).
Table 4
A Priori Evaluation of Expected Sample Size Given Procedure, Effect Size, and Power
Calculations
Research
question
Procedure used Effect size Expected
power
DF Sample
size
(minimum)
1 Between-subjects
one-way ANOVA
Cohen’s f =
.25
.80 (2, 156) 159
2
Independent samples
t-test
Cohen’s d =
.50
.80 (100) 102
3 Hierarchical
multiple regressiona 𝑟2 = .15 .80 (2, 68) 68
Note. All calculations were found using G*Power. a Seven predictors were used in this analysis. Alpha level was set at .05.

47
CHAPTER 4
RESULTS
The goal of this study was to investigate three factors. The first factor was the effect of
academic discipline on stigmatized attitudes towards SPMI. The second factor was the role of
the independent variable (mental health diagnosis) in stigmatized attitudes towards SPMI. The
third factor was the effect of demographic characteristics on stigmatized attitudes towards SPMI.
This chapter will present the results of the pilot study and each research question and will
conclude with a general review of the results. Data analyses were conducted using IBM SPSS
Statistics (2015).
Pilot Study
Prior to the collection of all data, a pilot study was conducted. A total of 12 participants
enrolled in the pilot study and included two males (16.7%) and 10 females (83.3%). The primary
age range reported by pilot study participants was between 25 and 34 years (7; 58.3%), and the
primary ethnicity was White/Caucasian (10; 83.3%). Data collected confirmed several factors:
the relative ease of participation (completion took an average of 11 minutes), the successful
manipulation of the independent variable, and recognition of the mental health diagnosis given.
For example, subjects who were randomly assigned Vignette A (Harry, who had a schizophrenia
diagnosis) correctly remembered that the mental health diagnosis was schizophrenia following
the conclusion of the study. Visual inspection of the data appeared to confirm that there were
differences between Vignettes A and B with respect to scores on the AQ-27 (see Figure 2). An
independent sample t-test was conducted to test the mean difference between the two vignettes
and the AQ-27 total score. In the pilot study, seven participants were exposed to Vignette A
(mean = 97.71, SD= 15.85) and five participants were exposed to Vignette B (mean = 76.20, SD
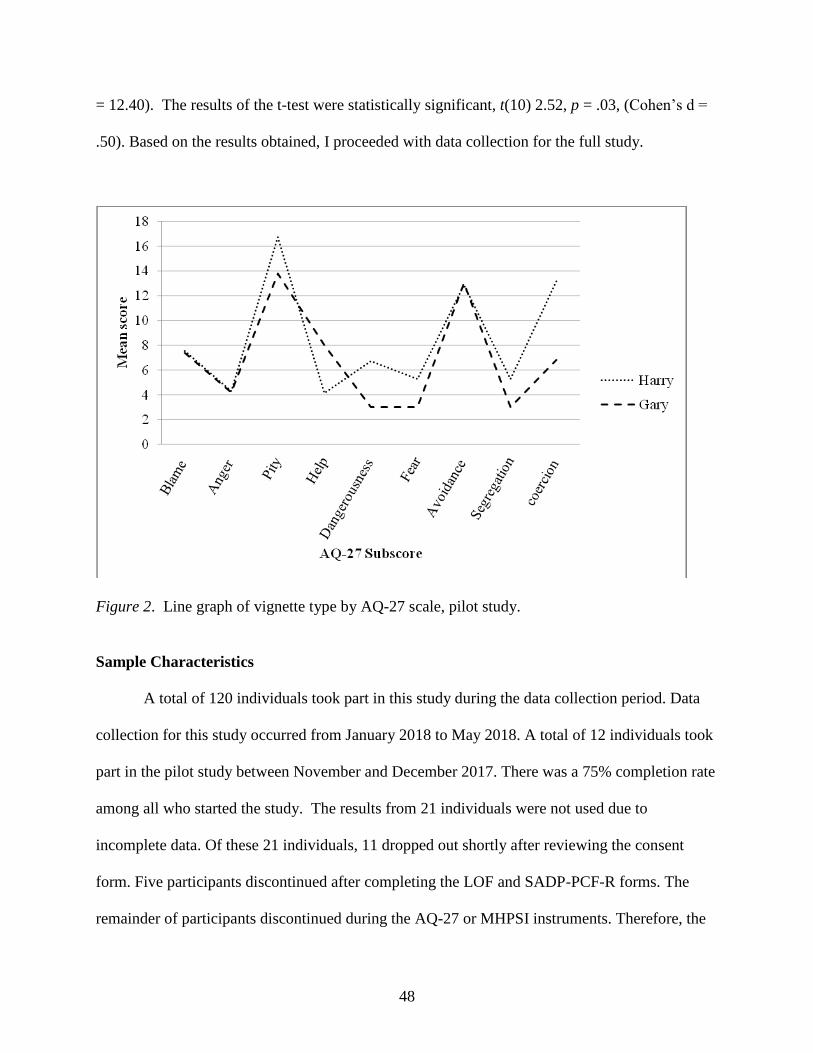
48
= 12.40). The results of the t-test were statistically significant, t(10) 2.52, p = .03, (Cohen’s d =
.50). Based on the results obtained, I proceeded with data collection for the full study.
Figure 2. Line graph of vignette type by AQ-27 scale, pilot study.
Sample Characteristics
A total of 120 individuals took part in this study during the data collection period. Data
collection for this study occurred from January 2018 to May 2018. A total of 12 individuals took
part in the pilot study between November and December 2017. There was a 75% completion rate
among all who started the study. The results from 21 individuals were not used due to
incomplete data. Of these 21 individuals, 11 dropped out shortly after reviewing the consent
form. Five participants discontinued after completing the LOF and SADP-PCF-R forms. The
remainder of participants discontinued during the AQ-27 or MHPSI instruments. Therefore, the
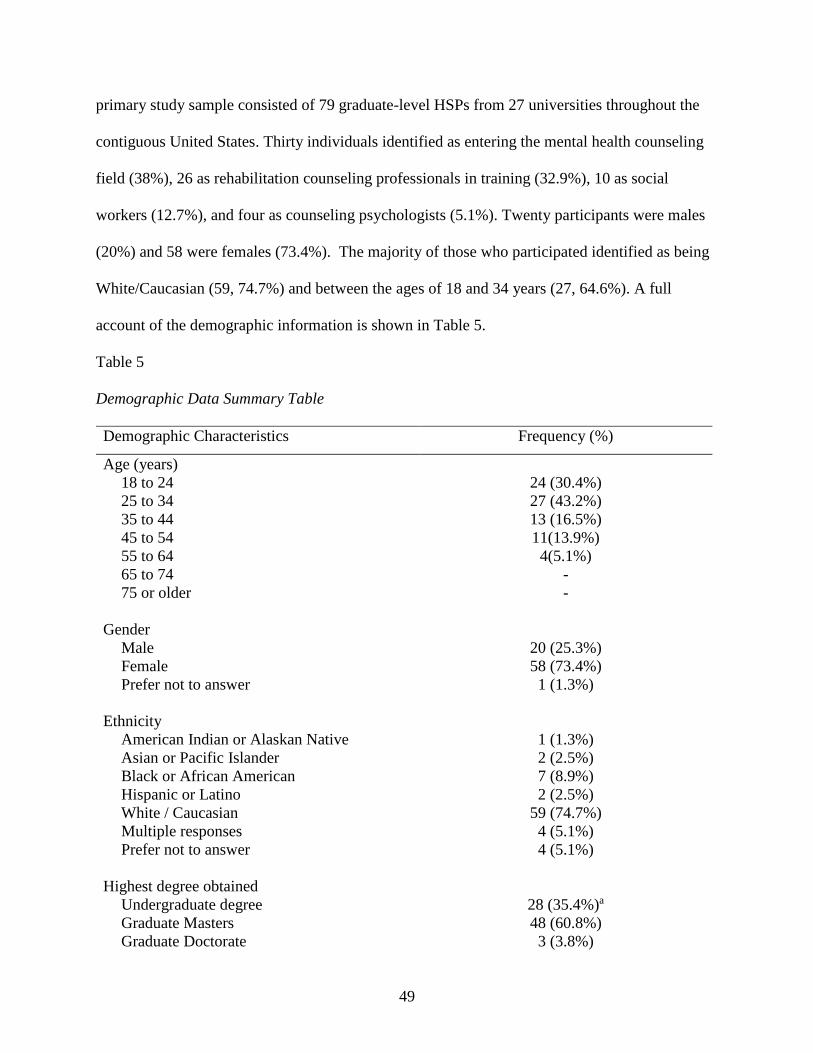
49
primary study sample consisted of 79 graduate-level HSPs from 27 universities throughout the
contiguous United States. Thirty individuals identified as entering the mental health counseling
field (38%), 26 as rehabilitation counseling professionals in training (32.9%), 10 as social
workers (12.7%), and four as counseling psychologists (5.1%). Twenty participants were males
(20%) and 58 were females (73.4%). The majority of those who participated identified as being
White/Caucasian (59, 74.7%) and between the ages of 18 and 34 years (27, 64.6%). A full
account of the demographic information is shown in Table 5.
Table 5
Demographic Data Summary Table
Demographic Characteristics Frequency (%)
Age (years)
18 to 24
25 to 34
35 to 44
45 to 54
55 to 64
65 to 74
75 or older
24 (30.4%)
27 (43.2%)
13 (16.5%)
11(13.9%)
4(5.1%)
-
-
Gender
Male
Female
Prefer not to answer
20 (25.3%)
58 (73.4%)
1 (1.3%)
Ethnicity
American Indian or Alaskan Native
Asian or Pacific Islander
Black or African American
Hispanic or Latino
White / Caucasian
Multiple responses
Prefer not to answer
1 (1.3%)
2 (2.5%)
7 (8.9%)
2 (2.5%)
59 (74.7%)
4 (5.1%)
4 (5.1%)
Highest degree obtained
Undergraduate degree
Graduate Masters
Graduate Doctorate
28 (35.4%)a
48 (60.8%)
3 (3.8%)
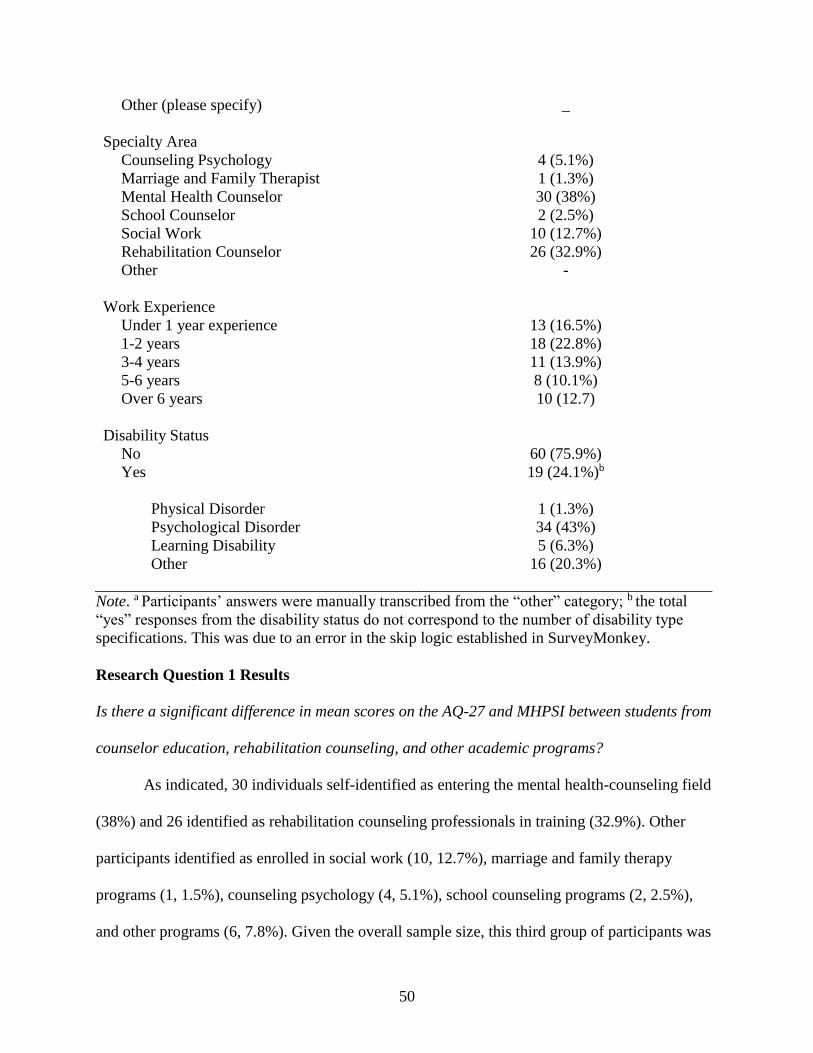
50
Other (please specify)
_
Specialty Area
Counseling Psychology
Marriage and Family Therapist
Mental Health Counselor
School Counselor
Social Work
Rehabilitation Counselor
Other
4 (5.1%)
1 (1.3%)
30 (38%)
2 (2.5%)
10 (12.7%)
26 (32.9%)
-
Work Experience
Under 1 year experience
1-2 years
3-4 years
5-6 years
Over 6 years
13 (16.5%)
18 (22.8%)
11 (13.9%)
8 (10.1%)
10 (12.7)
Disability Status
No
Yes
Physical Disorder
Psychological Disorder
Learning Disability
Other
60 (75.9%)
19 (24.1%)b
1 (1.3%)
34 (43%)
5 (6.3%)
16 (20.3%)
Note. a Participants’ answers were manually transcribed from the “other” category; b the total
“yes” responses from the disability status do not correspond to the number of disability type
specifications. This was due to an error in the skip logic established in SurveyMonkey.
Research Question 1 Results
Is there a significant difference in mean scores on the AQ-27 and MHPSI between students from
counselor education, rehabilitation counseling, and other academic programs?
As indicated, 30 individuals self-identified as entering the mental health-counseling field
(38%) and 26 identified as rehabilitation counseling professionals in training (32.9%). Other
participants identified as enrolled in social work (10, 12.7%), marriage and family therapy
programs (1, 1.5%), counseling psychology (4, 5.1%), school counseling programs (2, 2.5%),
and other programs (6, 7.8%). Given the overall sample size, this third group of participants was

51
classified as “from other programs” (23, 29.1%). Table 6 provides descriptive statistics from the
three programs categorized by the AQ-27 and MHPSI scores.
The statistical assumptions of the one-way ANOVA were first evaluated. To check the
homogeneity of variance assumption, a Levene's statistic was conducted. Levene's test showed
that the variance assumption for the AQ-27 total scores was not violated, F(2,76) = .94, p = .40.
Further, Levene's test showed that the variance assumption for MHPSI total scores was violated
F(2,76) = 6.75, p = .002. Given this second result, the Welch test was performed. The Shapiro
Wilks statistic was used to test for normality; the results can be found in Table 6.
Table 6
Descriptive Statistics for Program of Study by AQ-27 and MHPSI Total Scores
Test for normality
Shapiro-Wilk
Condition n Mean Median SD Min. Max. Skew Statistic df Sig.
AQ-27
Rehabilitation
Counseling
26 64.50 26.50 16.91 27.00 107.00 0.36 .976 26 .77
Mental health
counseling
30 74.23 68.00 19.62 43.00 116.00 0.52 .953 30 .20
Other Programs a 23 77.70 77.00 16.79 37.00 101.00 -0.53 .954 23 .36
MHPSI
Rehabilitation
Counseling
26 43.77 41.50 9.92 31.00 66.00 0.65 .934 26 .10
Mental health
counseling
30 50.53 52.00 10.15 32.00 72.00 0.02 .966 30 .44
Other Programs a 23 52.92 52.00 16.16 34.00 87.00 0.57 .901 23 .03
Note. n = sample size; AQ- 27 = Attribution Questionnaire- 27; MHPSI = Mental Health
Provider Stigma Inventory; the range for the AQ-27 total score is 27 – 243; the range for the
MHPSI total score is 24 -168. a Other programs included all other participants who did not report being in a rehabilitation
counseling or mental health counselor program; alpha level was set at .05.
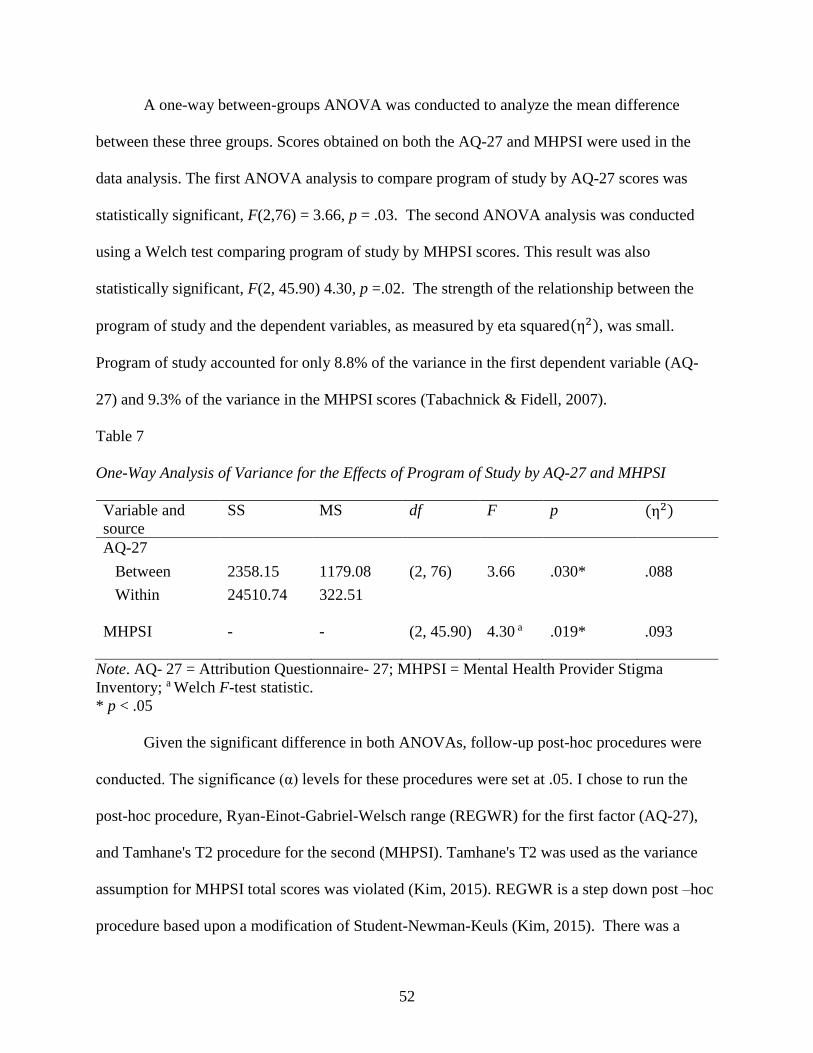
52
A one-way between-groups ANOVA was conducted to analyze the mean difference
between these three groups. Scores obtained on both the AQ-27 and MHPSI were used in the
data analysis. The first ANOVA analysis to compare program of study by AQ-27 scores was
statistically significant, F(2,76) = 3.66, p = .03. The second ANOVA analysis was conducted
using a Welch test comparing program of study by MHPSI scores. This result was also
statistically significant, F(2, 45.90) 4.30, p =.02. The strength of the relationship between the
program of study and the dependent variables, as measured by eta squared(η2), was small.
Program of study accounted for only 8.8% of the variance in the first dependent variable (AQ-
27) and 9.3% of the variance in the MHPSI scores (Tabachnick & Fidell, 2007).
Table 7
One-Way Analysis of Variance for the Effects of Program of Study by AQ-27 and MHPSI
Variable and
source
SS MS df F p (η2)
AQ-27
Between 2358.15 1179.08 (2, 76) 3.66 .030* .088
Within 24510.74 322.51
MHPSI - - (2, 45.90) 4.30 a .019* .093
Note. AQ- 27 = Attribution Questionnaire- 27; MHPSI = Mental Health Provider Stigma
Inventory; a Welch F-test statistic.
* p < .05
Given the significant difference in both ANOVAs, follow-up post-hoc procedures were
conducted. The significance (α) levels for these procedures were set at .05. I chose to run the
post-hoc procedure, Ryan-Einot-Gabriel-Welsch range (REGWR) for the first factor (AQ-27),
and Tamhane's T2 procedure for the second (MHPSI). Tamhane's T2 was used as the variance
assumption for MHPSI total scores was violated (Kim, 2015). REGWR is a step down post –hoc
procedure based upon a modification of Student-Newman-Keuls (Kim, 2015). There was a
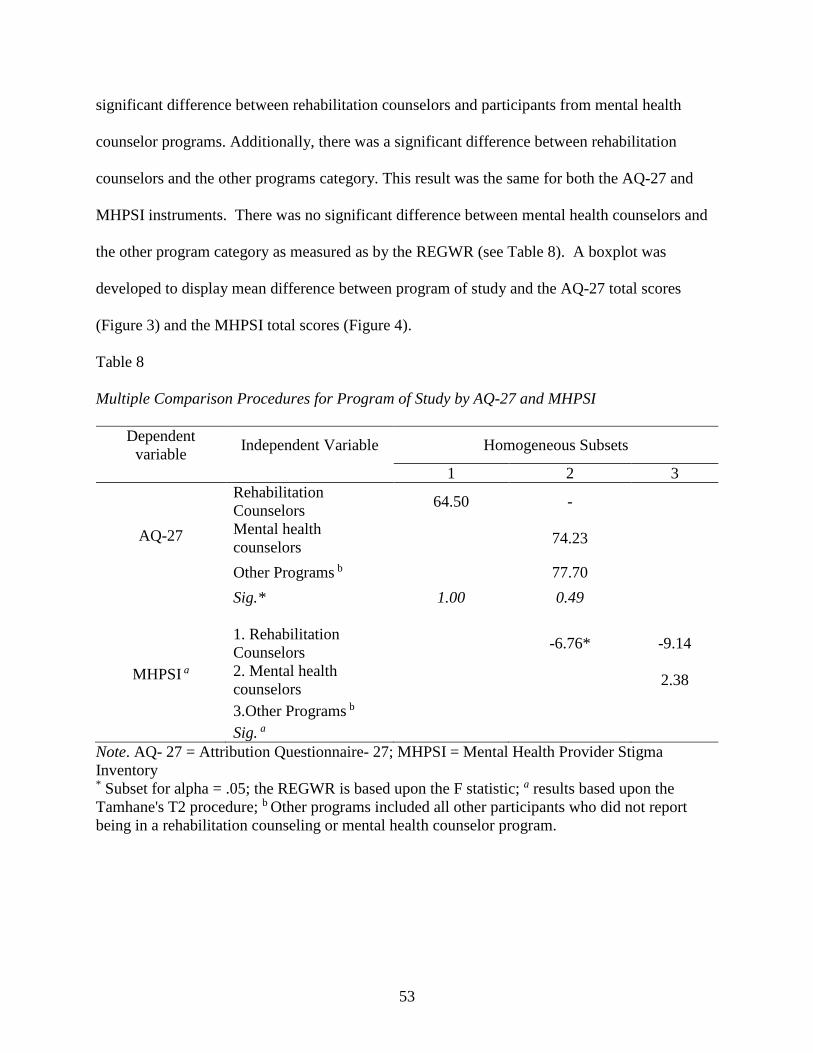
53
significant difference between rehabilitation counselors and participants from mental health
counselor programs. Additionally, there was a significant difference between rehabilitation
counselors and the other programs category. This result was the same for both the AQ-27 and
MHPSI instruments. There was no significant difference between mental health counselors and
the other program category as measured as by the REGWR (see Table 8). A boxplot was
developed to display mean difference between program of study and the AQ-27 total scores
(Figure 3) and the MHPSI total scores (Figure 4).
Table 8
Multiple Comparison Procedures for Program of Study by AQ-27 and MHPSI
Dependent
variable Independent Variable Homogeneous Subsets
1 2 3
AQ-27
Rehabilitation
Counselors 64.50 -
Mental health
counselors 74.23
Other Programs b 77.70
Sig.* 1.00 0.49
MHPSI a
1. Rehabilitation
Counselors -6.76* -9.14
2. Mental health
counselors 2.38
3.Other Programs b
Sig. a
Note. AQ- 27 = Attribution Questionnaire- 27; MHPSI = Mental Health Provider Stigma
Inventory * Subset for alpha = .05; the REGWR is based upon the F statistic; a results based upon the
Tamhane's T2 procedure; b Other programs included all other participants who did not report
being in a rehabilitation counseling or mental health counselor program.

54
Figure 3. Boxplot of the program of study by AQ-27 total scores.
Figure 4. Boxplot of the program of study by MHPSI total scores.
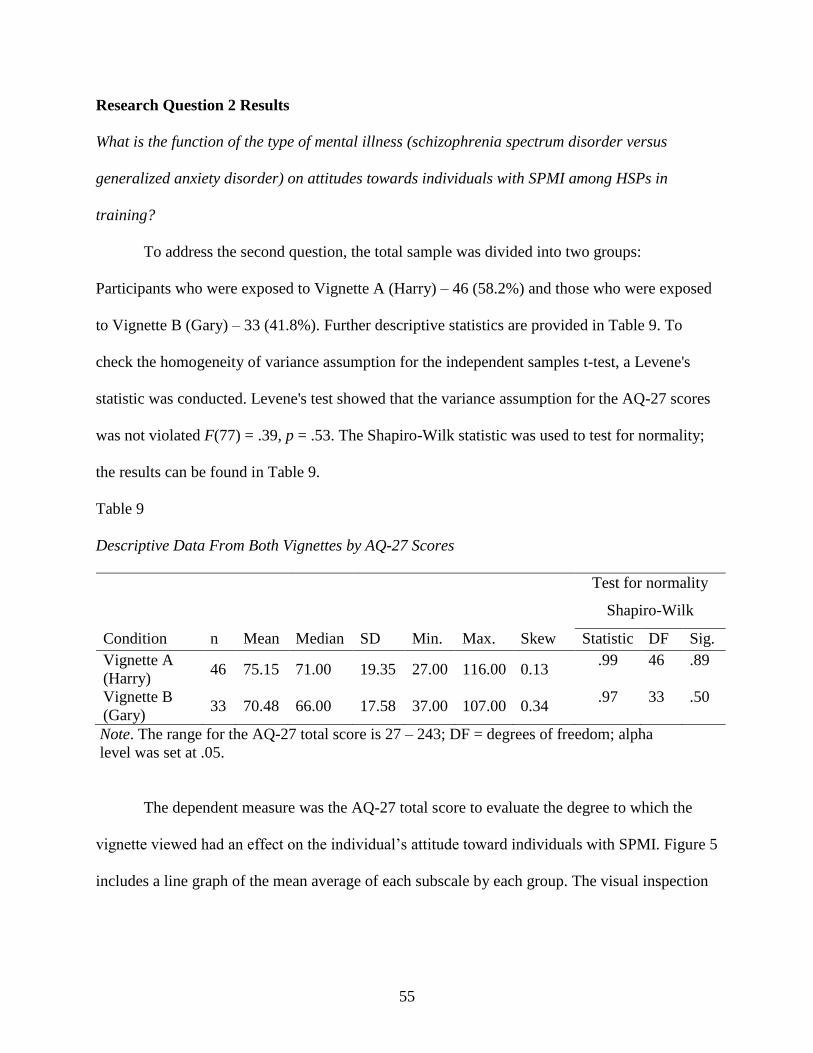
55
Research Question 2 Results
What is the function of the type of mental illness (schizophrenia spectrum disorder versus
generalized anxiety disorder) on attitudes towards individuals with SPMI among HSPs in
training?
To address the second question, the total sample was divided into two groups:
Participants who were exposed to Vignette A (Harry) – 46 (58.2%) and those who were exposed
to Vignette B (Gary) – 33 (41.8%). Further descriptive statistics are provided in Table 9. To
check the homogeneity of variance assumption for the independent samples t-test, a Levene's
statistic was conducted. Levene's test showed that the variance assumption for the AQ-27 scores
was not violated F(77) = .39, p = .53. The Shapiro-Wilk statistic was used to test for normality;
the results can be found in Table 9.
Table 9
Descriptive Data From Both Vignettes by AQ-27 Scores
Test for normality
Shapiro-Wilk
Condition n Mean Median SD Min. Max. Skew Statistic DF Sig.
Vignette A
(Harry) 46 75.15 71.00 19.35 27.00 116.00 0.13
.99 46 .89
Vignette B
(Gary) 33 70.48 66.00 17.58 37.00 107.00 0.34
.97 33 .50
Note. The range for the AQ-27 total score is 27 – 243; DF = degrees of freedom; alpha
level was set at .05.
The dependent measure was the AQ-27 total score to evaluate the degree to which the
vignette viewed had an effect on the individual’s attitude toward individuals with SPMI. Figure 5
includes a line graph of the mean average of each subscale by each group. The visual inspection
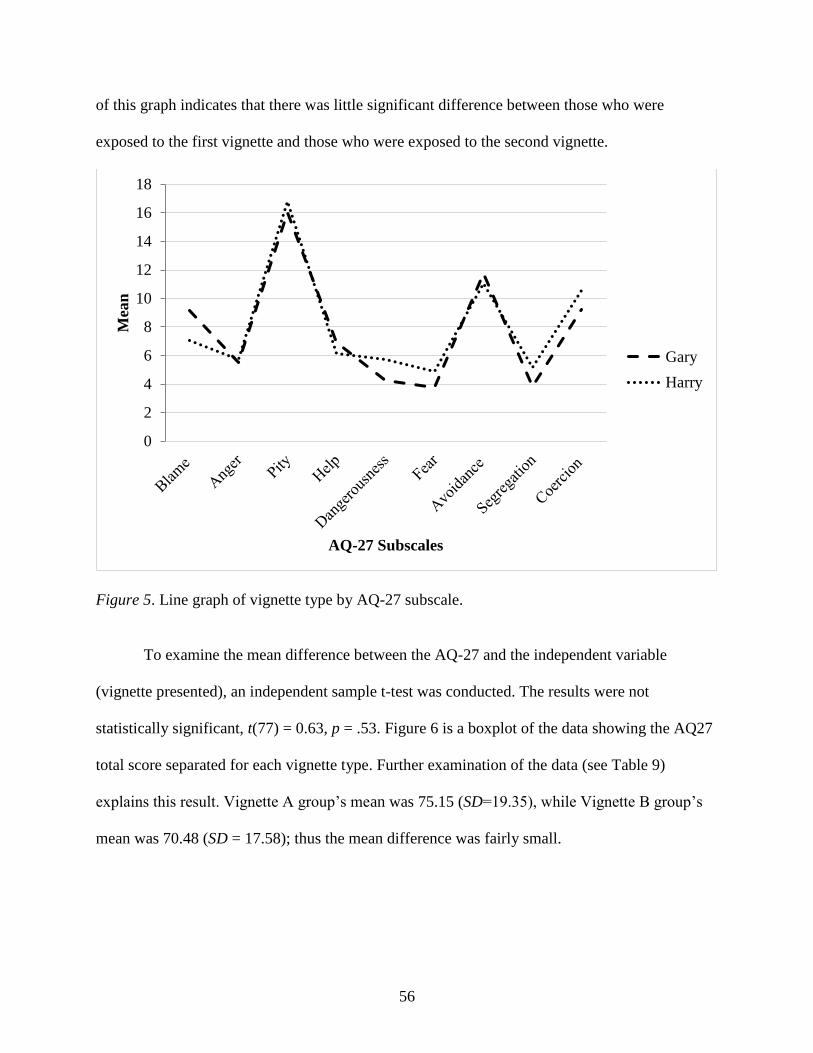
56
of this graph indicates that there was little significant difference between those who were
exposed to the first vignette and those who were exposed to the second vignette.
Figure 5. Line graph of vignette type by AQ-27 subscale.
To examine the mean difference between the AQ-27 and the independent variable
(vignette presented), an independent sample t-test was conducted. The results were not
statistically significant, t(77) = 0.63, p = .53. Figure 6 is a boxplot of the data showing the AQ27
total score separated for each vignette type. Further examination of the data (see Table 9)
explains this result. Vignette A group’s mean was 75.15 (SD=19.35), while Vignette B group’s
mean was 70.48 (SD = 17.58); thus the mean difference was fairly small.
0
2
4
6
8
10
12
14
16
18
Mea
n
AQ-27 Subscales
Gary
Harry
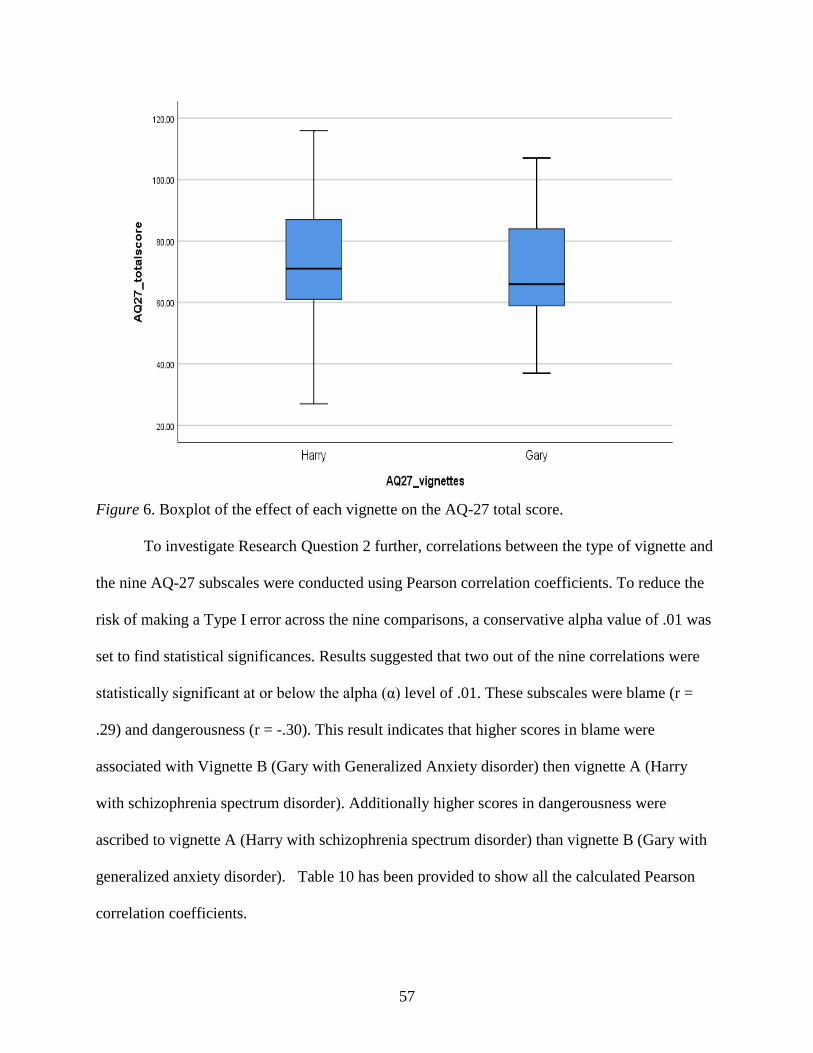
57
Figure 6. Boxplot of the effect of each vignette on the AQ-27 total score.
To investigate Research Question 2 further, correlations between the type of vignette and
the nine AQ-27 subscales were conducted using Pearson correlation coefficients. To reduce the
risk of making a Type I error across the nine comparisons, a conservative alpha value of .01 was
set to find statistical significances. Results suggested that two out of the nine correlations were
statistically significant at or below the alpha (α) level of .01. These subscales were blame (r =
.29) and dangerousness (r = -.30). This result indicates that higher scores in blame were
associated with Vignette B (Gary with Generalized Anxiety disorder) then vignette A (Harry
with schizophrenia spectrum disorder). Additionally higher scores in dangerousness were
ascribed to vignette A (Harry with schizophrenia spectrum disorder) than vignette B (Gary with
generalized anxiety disorder). Table 10 has been provided to show all the calculated Pearson
correlation coefficients.
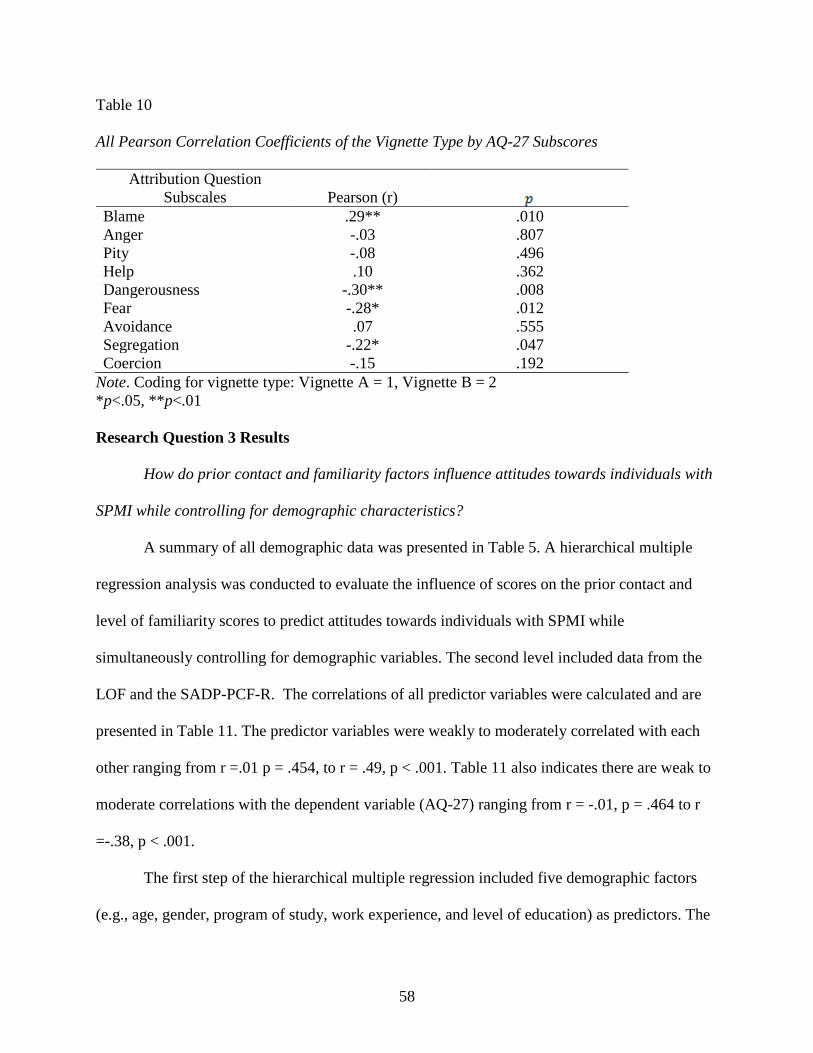
58
Table 10
All Pearson Correlation Coefficients of the Vignette Type by AQ-27 Subscores
Attribution Question
Subscales Pearson (r) Blame .29** .010
Anger -.03 .807
Pity -.08 .496
Help .10 .362
Dangerousness -.30** .008
Fear -.28* .012
Avoidance .07 .555
Segregation -.22* .047
Coercion -.15 .192
Note. Coding for vignette type: Vignette A = 1, Vignette B = 2
*p<.05, **p<.01
Research Question 3 Results
How do prior contact and familiarity factors influence attitudes towards individuals with
SPMI while controlling for demographic characteristics?
A summary of all demographic data was presented in Table 5. A hierarchical multiple
regression analysis was conducted to evaluate the influence of scores on the prior contact and
level of familiarity scores to predict attitudes towards individuals with SPMI while
simultaneously controlling for demographic variables. The second level included data from the
LOF and the SADP-PCF-R. The correlations of all predictor variables were calculated and are
presented in Table 11. The predictor variables were weakly to moderately correlated with each
other ranging from r =.01 p = .454, to r = .49, p < .001. Table 11 also indicates there are weak to
moderate correlations with the dependent variable (AQ-27) ranging from r = -.01, p = .464 to r
=-.38, p < .001.
The first step of the hierarchical multiple regression included five demographic factors
(e.g., age, gender, program of study, work experience, and level of education) as predictors. The
59
first model was statistically significant, F(6,72) =3.64, p= .003, and explained 23% of the
variance in the dependent variable (AQ-27 total scores). After the input of these demographic
factors, the second step included LOF and SADP- PCF-R scores. After entry of the second step
the overall R2 was 28%. The second model was statically significant, F(8,70) = 3.39, p = 002,
and explained an additional 5% variance in the model. In the final adjusted model, four out of
the seven predictor variables were statistically significant. The predictor gender had the highest
beta value (β = -.32, p =.005), then rehabilitation counselors (dummy code 1) (β = -.31, p =
.018), number of years worked (β =-.27, p =.019), and SADP-PCF-R scores (β = -.29, p =
.039). All calculated values from the hierarchical multiple regression can be found in Table 12.
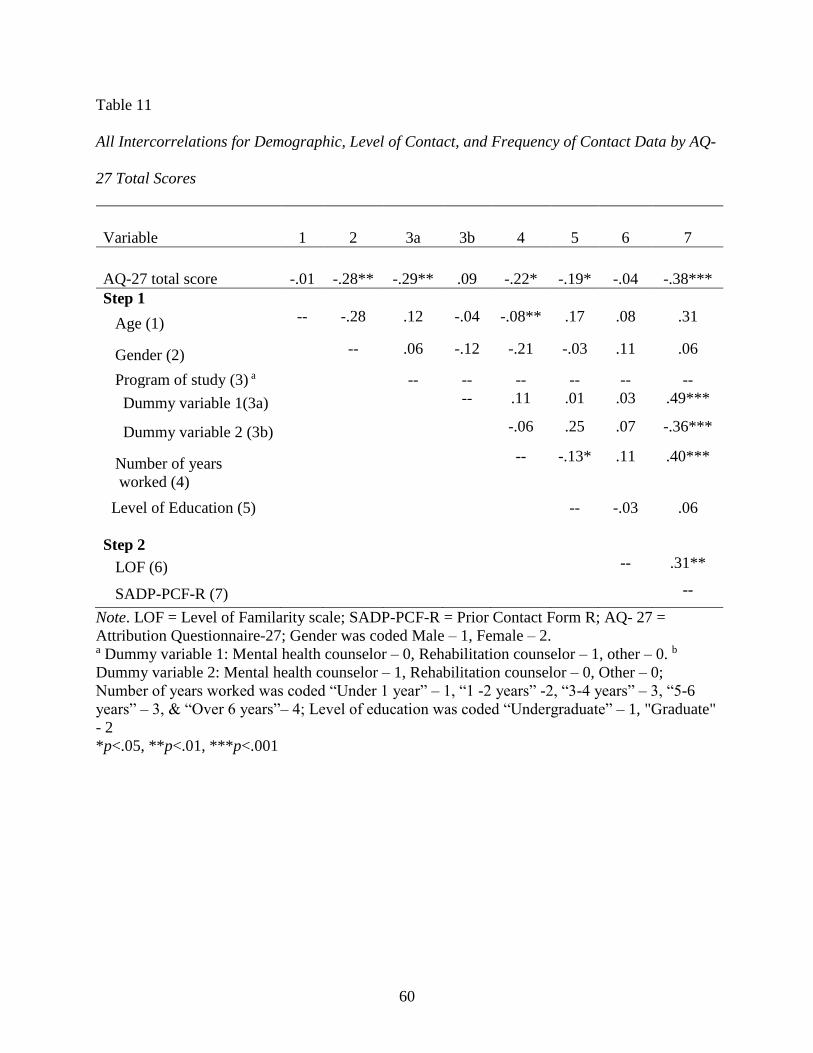
60
Table 11
All Intercorrelations for Demographic, Level of Contact, and Frequency of Contact Data by AQ-
27 Total Scores
Variable 1 2 3a 3b 4 5 6 7
AQ-27 total score -.01 -.28** -.29** .09 -.22* -.19* -.04 -.38***
Step 1
Age (1) -- -.28 .12 -.04 -.08** .17 .08 .31
Gender (2) -- .06 -.12 -.21 -.03 .11 .06
Program of study (3) a -- -- -- -- -- --
Dummy variable 1(3a) -- .11 .01 .03 .49***
Dummy variable 2 (3b) -.06 .25 .07 -.36***
Number of years
worked (4)
-- -.13* .11 .40***
Level of Education (5)
-- -.03 .06
Step 2
LOF (6) -- .31**
SADP-PCF-R (7) --
Note. LOF = Level of Familarity scale; SADP-PCF-R = Prior Contact Form R; AQ- 27 =
Attribution Questionnaire-27; Gender was coded Male – 1, Female – 2. a Dummy variable 1: Mental health counselor – 0, Rehabilitation counselor – 1, other – 0. b
Dummy variable 2: Mental health counselor – 1, Rehabilitation counselor – 0, Other – 0;
Number of years worked was coded “Under 1 year” – 1, “1 -2 years” -2, “3-4 years” – 3, “5-6
years” – 3, & “Over 6 years”– 4; Level of education was coded “Undergraduate” – 1, "Graduate"
- 2
*p<.05, **p<.01, ***p<.001

61
Table 12
Hierarchical Regression Analysis, Predicting Attitudes With Demographic, Level of Contact,
and Frequency of Contact Data
Step and predictor
variable 𝑅2 Δ𝑅2 sp β t
Step 1 .233
Age .040 .037 .343
Gender -.326 -.319 -2.931**
Program of study
Dummy Variable 1 a -.276 -.308 -2.407*
Dummy Variable 2 b -.104 -.177 -.888
Number of years
worked
-.273 -.269 -2.407*
Level of Education
-.052 -.050 -.444
Step 2 .279 .047
LOF .121 .114 1.021
SADP-PCF-R -.243 -.289 -2.100*
Note. sp = semipartial correlation coefficient; LOF = Level of Familarity scale; SADP-PCF-R =
Prior Contact Form R; Gender was coded Male – 1, Female – 2. a Dummy variable 1: Mental health counselor – 0, Rehabilitation counselor – 1, Other – 0. b
Dummy variable 2: Mental health counselor – 1, Rehabilitation counselor – 0, Other – 0;
Number of years worked was coded “Under 1 year” – 1, “1 -2 years” -2, “3-4 years” – 3, “5-6
years” – 3, & “Over 6 years”– 4; Level of education was coded “Undergraduate” – 1, "Graduate"
- 2
*p<.05, **p<.01
62
CHAPTER 5
DISCUSSION
The purpose of this study was to examine stigmatized attitudes towards individuals with
SPMI among human services providers in training. This topic is important to investigate due to
the prevalence of mental illness and the effects of stigma on individuals with severe and
persistent mental health concerns. Close to 10 million adults, 18 years and older, have SPMI in
the United States (NIMH, 2015). Individuals diagnosed with a mental illness may face many
personal and social difficulties in their daily lives (Auerbach & Richardson, 2005; Brohan &
Thornicroft, 2010; Cook, 2006), contributing to significant stress and affecting many daily
activities (Falvo, 2014).
As Corrigan and colleagues (2015) discussed, stigma towards individuals with SPMI can
have a profound impact on their full participation, affecting employment, housing, and other
social integration. If members of the public view mental illness with fear or uncertainty, or
perceive individuals with SPMI as dangerous, they are more likely to have fewer interpersonal
relations with them and increase their social distance (Cooper et al., 2003). The root of stigma
may be attributed to what some regard as underlying cause. If individuals are seen as responsible
for a mental illness (e.g., through poor life choices, an inability to cope with stress, etc.), they are
more likely to be the target of negative attitudes. Therefore, the degree to which people
stigmatize an individual with a mental health condition may differ from the degree of stigma
toward an individual diagnosed with cancer. This phenomenon is related to attribution theory,
which was the primary theoretical basis for this study. If mental health is stigmatized in a
community or society, individuals who have mental health issues may hide their condition from

63
others (Schulze & Angermeyer, 2003). This tendency may contribute to individuals being less
willing to seek treatment or seek out community resources to aid in their recovery.
Those who work in the field of human services must be aware of the influence of stigma
on mental health conditions. As others have researched (Kennedy et al., 2014; Smith &
Cashwell, 2010), HSPs may not be immune from having negative reactions to those with severe
mental illness. The stigmatization of mental illness may impact service delivery and treatment
outcomes (Sadow et al., 2002). Building on the work of others (Granello & Gibbs, 2016;
Kennedy et al., 2014; Smith & Cashwell, 2010), this study examined stigmatizing attitudes
towards those with SPMI among counselors in training. This study utilized two scale
instruments: the Attribution Questionnaire -27 (AQ-27; Corrigan, 2012), and the Mental Health
Provider Stigma Inventory (MHPSI; Kennedy et al., 2014). A total of 79 participants took part
in this study from 27 universities throughout the United States.
Summary of Findings
This study evaluated three research questions, all considering stigmatizing attitudes
toward individuals with SPMI among human services providers in training. There were several
findings based on the data analyses. The following research questions were addressed: Is there a
significant difference in mean scores on the AQ-27 and MHPSI between students from counselor
education, rehabilitation counseling, and other academic programs? What is the function of the
type of mental illness (schizophrenia spectrum disorder versus generalized anxiety disorder) on
attitudes towards individuals with SPMI among HSPs in training? How do prior contact and
familiarity factors influence attitudes towards individuals with SPMI while controlling for
demographic characteristics?
64
To evaluate the first research question, one-way ANOVAs were conducted between the
program of study and both AQ-27 and MHPSI scores. The first ANOVA analysis to compare
program of study with AQ-27 scores was statistically significant. The second ANOVA analysis
comparing program of study with MHPSI scores was also statistically significant; see Table 7.
The strength of the relationship between the program of study and the MHPSI, as measured by
eta squared (η2), was small, with the program of study accounting for only 9% of the variance in
the MHPSI scores (Tabachnick & Fidell, 2007). In a post-hoc analysis, the data suggested that
rehabilitation counselors in training had lower levels of mental health provider stigma than other
participants as measured by the MHPSI. This result differed from prior research and was not
anticipated (Kennedy et al., 2014; Lam et al. 2015; Smith & Cashwell, 2010). The overall sample
size may have impacted this result given that there were 30 mental health counselor students, 26
rehabilitation counseling professionals in training, and 23 from other programs.
To address the next research question, an independent sample t-test was used to
determine if there were mean differences in AQ-27 scores between those exposed to the first
vignette (“Harry,” n =46) and those exposed the second vignette (“Gary,” n = 33). The results
suggested that there were no statistically significant differences between the two groups. This
result was not anticipated given the results of the pilot study and prior research (Corrigan, 2000,
2016; Granello & Gibbs, 2016; Schulze & Angermeyer, 2003; Taylor & Dear, 1981).
To further evaluate this question, Pearson (r) correlation coefficients were performed
(Cooper et al., 2003). Results indicated that the AQ-27 subscale that had a positive relationship
to the vignette presented was blame. The subscales that had a negative relationship to the
vignette presented were dangerousness, fear, and segregation; a full list of the correlation
coefficients can be found in Table 10. The two correlation that were statistically significant at an
65
conservative alpha level (α = .01) were blame and dangerousness. These results suggest that
participants had higher levels of blame towards Gary (an individual described as having
generalized anxiety) then Harry (an individual described as having schizophrenia spectrum
disorder. In addition higher scores in dangerousness were ascribed to the first vignette (Harry)
over the second vignette B (Gary). This results appears to support Attribution Theory as
discussed in chapter 3 (Corrigan, 2004).
The results from a hierarchical multiple regression analysis were statistically significant.
The final results of this study yielded evidence to support that participants’ self-reported level of
prior contact with persons with disabilities and level of familiarity with individuals with SPMI
had a meaningful effect on their AQ-27 score while controlling for demographic factors (see
Table 12). The results from the second analysis that tested the two additional factor predictors
were not statistically significant. The conclusion from this result is that the addition of the two
scales (LOF and SADP-PCF-R) as predictors did not have a meaningful statistical influence on
the overall model. Further, the data suggest that among the factors examined, there were three
predictors that were all statistically related to the AQ-27 scores. Gender was the first predictor,
program of study was next, and number of years worked was last.
Age was not found to be significant predictor of stigmatized attitudes toward individuals
with SPMI. This was a departure from the literature (Link et al., 2004; Yuker, 1988). Gender
differences were found. Females reported fewer stigmatized attitudes when compared to males as
shown in Figures 7 and 8. This result was consistent with previous literature (Boysen, 2017;
Corrigan & Watson, 2007; Wright, 1980; Yuker, 1988). Looking further into this result, the
evaluation of gender and vignette type is an area for future evaluation (see Figures 7 and 8).
Individuals with higher levels of education showed less stigma, consistent with prior research

66
(Marili et al., 2012; Miller et al., 2009). Finally, individuals with more work experience
appeared to have lower levels of stigmatizing attitudes.
Figure 7. Line graph of gender by AQ-27 score.
0
2
4
6
8
10
12
14
16
18
20
Mea
n
AQ-27 Subscore
Male
Female
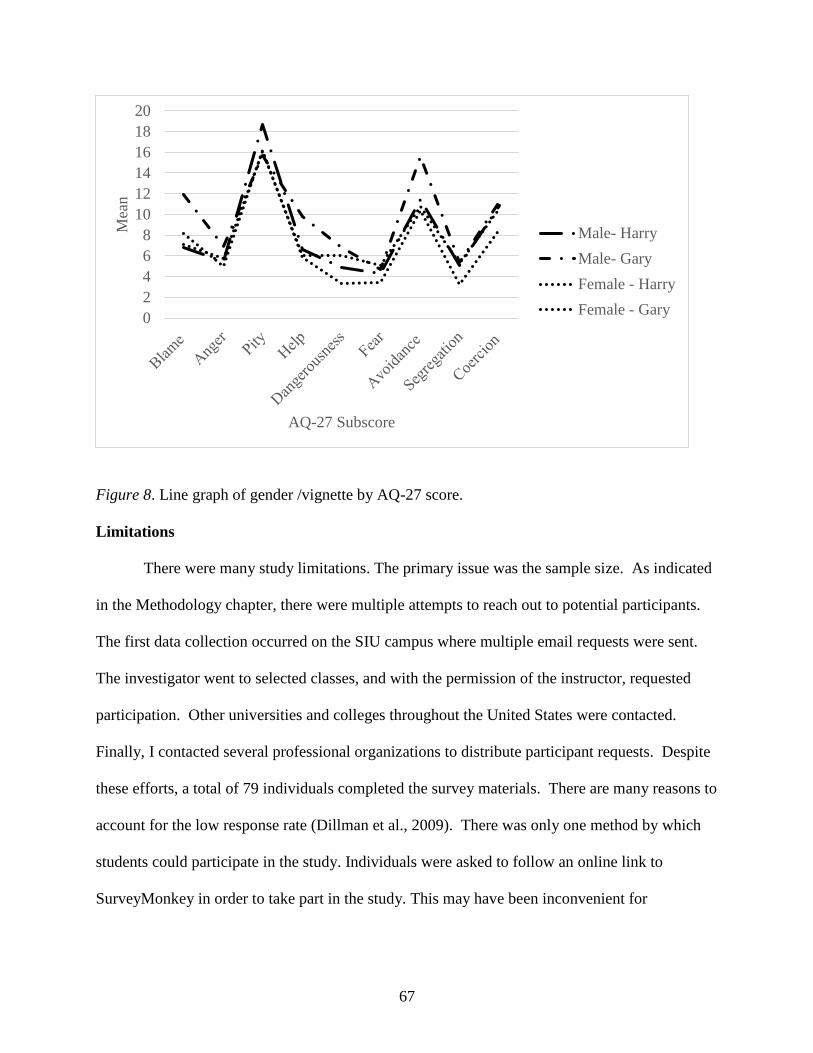
67
Figure 8. Line graph of gender /vignette by AQ-27 score.
Limitations
There were many study limitations. The primary issue was the sample size. As indicated
in the Methodology chapter, there were multiple attempts to reach out to potential participants.
The first data collection occurred on the SIU campus where multiple email requests were sent.
The investigator went to selected classes, and with the permission of the instructor, requested
participation. Other universities and colleges throughout the United States were contacted.
Finally, I contacted several professional organizations to distribute participant requests. Despite
these efforts, a total of 79 individuals completed the survey materials. There are many reasons to
account for the low response rate (Dillman et al., 2009). There was only one method by which
students could participate in the study. Individuals were asked to follow an online link to
SurveyMonkey in order to take part in the study. This may have been inconvenient for
0
2
4
6
8
10
12
14
16
18
20M
ean
AQ-27 Subscore
Male- Harry
Male- Gary
Female - Harry
Female - Gary
68
individuals who saw a flyer or heard about the study from a fellow student. The decision was
made to offer the survey materials only through SurveyMonkey to reduce response variability.
The second area that may have contributed to the low response rate was the type and
frequency of the email requests. As Dillman et al. (2009) suggested, researchers who carefully
plan and implement participant contact methods increase the likelihood of greater response rates
for their research. For this study, procedures were established to ensure that multiple email
requests were sent. However, these procedures were altered depending on the groups or
organizations that were contacted. For example, participant recruitment at some universities
consisted of only one email request. This was due to the availability of the staff/faculty who
worked with the researcher.
The inclusionary criteria established for this study may have affected the response rate.
The purpose of this study was to gather the responses of individuals in graduate-level human
services academic programs in the United States. This affected the overall population pool from
which the sample was drawn. Another limitation of the current study was the presumption that
HSPs in training carry negative or stigmatized attitudes towards persons with mental illness.
Furthermore, the assumption was also made that negative attitudes may impact participants’
responses to the current study. To address this concern, the current study methodology was
designed in a fashion similar to existing research (Corrigan et al., 2012; Hackler et al., 2016;
Reinke et al., 2004). The final limitation of this study was that attitudes towards individuals with
SPMI were examined at one point in time. The purpose of the current study was to examine and
not alter existing attitudes or stigma associated with individuals with SPMI. Furthermore, any
longitudinal examinations of these factors were beyond the scope of the current study.

69
Some errors were found during the data collection process with the use of the
demographic form established for this study. First, the question “highest degree obtained” did
not include an “undergraduate” selection. Therefore, many participants manually wrote
responses including undergraduate degree, undergrad, or B.S./B.A in the “other” category. In
the data checking process, I needed to manually change these entries. Second, the disability
status question was designed on SurveyMonkey to be required with a conditional follow-up
question; however, after all the data were collected, it was apparent that the responses did not
reflect accurately. This may have been due to the programming of the survey, responder error,
or some other factor.
Given the aforementioned limitations, three proposed changes are suggested for
reproducing the current study. The first is to identify and utilize different sampling procedures to
increase the overall sample size (e.g., more direct contact with potential participants). The
second is the recruitment of HSP professionals who have worked directly with individuals with
SPMI as a comparison group to the HSPs in training. With this step, I could have examined the
effects of work experience on stigma towards individuals with mental illness. Finally, in addition
to the vignettes depicting two diagnosable conditions, I would include a third vignette depicting
an individual whose mental health status is not disclosed. Therefore, the analysis would further
examine the effects of a mental health diagnosis on stigmatizing attitudes.
Implications for Rehabilitation Counselors
Stigma towards individuals with SPMI permeates society and affects many individuals
(Jones et al., 1984). This research follows an extensive record of stigma research (Corrigan et
al., 2012; Couture & Penn, 2003; Link et al., 2004). Further, the aim of this study was to provide
a foundation for future investigations of stigmatizing attitudes surrounding SPMI among
70
counselors in training. An evaluation of the influence of the specific SPMI diagnosis on stigma
among HSPs was also conducted. Professionals who work in human services fields are more
likely to interact with individuals who have SPMI. Attitudes and beliefs about this group may not
impact only the professionals but also the clients with whom they work (Corrigan, 2005).
Understanding and awareness of how SPMI impacts individuals are critical for those entering
HSP fields.
This study yielded evidence to support that rehabilitation counselor graduate students
may have fewer stigmatizing attitudes towards SPMI when compared to students in other HSP
graduate programs according to scores on the MHPSI. This result may reflect the training
offered to future rehabilitation counseling professionals (Riggar & Maki, 2004; Wright, 1980).
Future research may further explore the dynamics involved in the professional training of HSPs
to evaluate student recognition of attitudes towards SPMI.
Research may use methods similar to this study while further evaluating the stigma of
SPMI. First, the effects of mass media on attitudes towards mental illness have been extensively
researched (Corrigan et al., 2013; Coverdale et al., 2001; Stout et al., 2004). The effects of media
(including social media), although not evaluated in this study, are critically important for the
understanding of how SPMI is viewed within a society (Penn, Chamberlin, & Mueser 2003).
Future research may address stigmatizing attitudes toward mental illness among vocational
rehabilitation professionals, who evaluate job readiness and vocational opportunities among
individuals with SPMI (Corrigan et al., 2012; Elliott, & Konet 2014). Other research may include
evaluating the willingness of landlords or property owners to rent to a person with SPMI
(Russinova et al., 2011). Both the AQ-27 and MHPSI instruments have been established in the
literature and may be used simultaneously as demonstrated in this study.
71
Conclusions
The evaluation of stigmatizing attitudes towards SPMI was evaluated among graduate-
level human service professionals in training in the United States. Several factors were
examined, from the type of diagnosable condition presented to the evaluation of demographic
factors with their relative roles in predicting attitudes towards mental illness. Results from three
research questions were presented. This research was based on the attribution theory, which
suggests that, in part, the controllability of a condition affects how others react to the condition
(Colman, 2006; Maio & Olson, 2000). The primary limitation of this study was the small sample
size. Given the recruitment procedures used, the researcher is confident that sufficient measures
were taken to reach potential participants. Despite these setbacks, several results were found and
implications for future research were uncovered. These results may provide insights into this
topic and contribute to the body of knowledge surrounding attitudes towards individuals with
disabilities and the stigma of SPMI.
72
REFERENCES
Ackerman, G. W., & McReynolds, C. J. (2005). Strategies to promote successful employment of
people with psychiatric disabilities. Journal of Applied Rehabilitation Counseling, 36(4),
35- 40.
Ainlay, S. C., Becker, G., & Coleman, L. M. (1986). The dilemma of difference: A
multidisciplinary view of stigma. New York, NY: Plenum.
American Psychiatric Association. (2013). Diagnostic and statistical manual of mental disorders
(5th ed.). Washington, DC: Author.
American School Counselor Association. (n.d.). The role of a school counselor. Retrieved
September 26, 2018, from https://www.schoolcounselor.org/asca/media/asca/Careers-
Roles/RoleStatement.pdf
Antonak, R. F. (1981). Prediction of attitudes towards disabled persons: A multivariate analysis.
The Journal of General Psychology, 104, 119-123. doi:10.1080/00221309.1981.9921026
Antonak, R. F. (1982). Development and psychometric analysis of the Scale of Attitudes Toward
Disabled Persons. Journal of Applied Rehabilitation Counseling, 32, 22-29.
Antonak, R. F. (1992). Scale of attitudes toward disabled persons (SAPD) form R. Durham, NH:
University of New Hampshire.
Antonak, R. F., & Livneh, H. (1988). The measurement of attitudes toward people with
disabilities: Method, psychometrics and scales. Springfield, IL: Charles C. Thomas.
Antonak, R. F., & Livneh, H. (2000). Measures of attitudes towards persons with disabilities.
Disability and Rehabilitation, 22(5), 211-224. PMID: 10813560
73
Arns, P. G., & Linney, J. A. (1993). Work, self, and life satisfaction for persons with severe and
persistent mental disorders. Psychosocial Rehabilitation Journal, 17, 63-70. doi:
10.1037/h0095599
Auerbach, E. S., & Richardson, P. (2005). The long-term work experiences of persons with
severe and persistent mental illness. Psychiatric Rehabilitation Journal, 28(3), 267-273.
doi:10.2975/28.2005.267.273
Barker, R. L. (2003). The social work dictionary. Washington, DC: The National Association of
Social Workers.
Bar-Tal, D., Graumann, C. F., Kruglanski, A. W., & Stroebe, W. (1989). Stereotypes and
prejudice: Changing concepts. New York, NY: Springer-Verlag.
Boen, R., Upton, T. D., Knickmeyer, N., & Anuar, A. (2016). Students’ perceptions on the
relative fairness of selected educational accommodations. Journal of Cognitive Science
and Human Development, 1, 99 – 109. ISSN: 2462-1153
Boysen, G. A. (2017). Explaining the relation between masculinity and stigma toward mental
illness: The relative effects of sex, gender, and behavior. Stigma and Health, 2(1), 66-79.
doi: 10.1037/sah0000041
Brodwin, M., Parker, R. M., & DeLaGarza, D. (2010). Disability and reasonable
accommodations. In E. M. Szymanski & R. M. Parker (Eds.), Work and disability:
Context, issues, and strategies for enhancing employment outcomes for people with
disabilities (3rd ed., pp. 281-324). Austin, TX: Pro-Ed.
Brohan, E., & Thornicroft, G. (2010). Stigma and discrimination of mental health problems:
Workplace implications. Occupational Medicine, 60, 414–420.
doi:10.1093/occmed/kqq048
74
Brostrand, H. L. (2006). Tilting at windmills: Changing attitudes toward people with disabilities.
Journal of Rehabilitation, 72(1), 4-9.
Bulmer, M. G. (1979). Principles of statistics. New York, NY: Dover.
Bureau of Labor Statistics. (2016). Persons with a disability: Labor force characteristics- 2015
[Press Release]. Retrieved from http://www.bls.gov/news.release
Center for Behavioral Health Statistics and Quality. (2016). Key substance use and mental health
indicators in the United States: Results from the 2015 National Survey on Drug Use and
Health. Retrieved from: http://www.samhsa.gov/data/
Chan, F., Bezyak, J., Ramirez, M. R., Chiu, C., & Fujikawa, S. S. (2010). Concepts, challenges,
barriers, and opportunities related to evidence-based practice in rehabilitation counseling.
Rehabilitation Education, 24, 179-190. ISSN: 08897018.
Cheatham, L. P., Abell, N., & Kim, H. (2015). Development and validation of the Social
Worker’s Attitudes toward Disability scale. Journal of Social Work Education, 51, 379–
397. doi: 10.1080/10437797.2015.1012939
Cohen, J. (1988). Statistical power analysis for the behavioral sciences (2nd ed.). Hillsdale, NJ:
Lawrence Erlbaum.
Cohen, J., & Struening, E. L. (1962). Opinions about mental illness in the personnel of two large
mental hospitals. Journal of Abnormal and Social Psychology, 64(5), 349-360.
doi:10.1037/h0045526
Coleman, L. M. (1986). Stigma: An enigma demystified. In S. C. Ainlay, G. Becker, & L. M.
Coleman (Eds.), The dilemma of difference: A multidisciplinary view of stigma (pp. 211-
232). New York, NY: Plenum.
Colman, M. A. (2006). Oxford dictionary of psychology. New York, NY: Oxford University.

75
Cook, J. A. (2006). Employment barriers for persons with psychiatric disabilities: Update of a
report for the president’s commission. Psychiatric Services, 57(10), 1391-1405.
doi:10.1176/ps.2006.57.10.1391
Cooper, A. E., Corrigan, P. W., & Watson, A. C. (2003). Mental illness stigma and care seeking.
The Journal of Nervous and Mental Disease, 191, 339-341.
doi:10.1097/01.NMD.0000066157.47101.22
Corrigan, P. W. (2000). Mental health stigma as social attribution: Implications for research
methods and attitude change. Clinical Psychology: Science and Practice, 7, 48-67.
doi:10.1093/clipsy.7.1.48
Corrigan, P. W. (2004). How stigma interferes with mental health care. American Psychologist,
59 (7), 614-625. doi:10.1037/0003-066X.59.7.614
Corrigan, P. W. (2005). On the stigma of mental health: Practical strategies for research and
social change. Washington, DC: The American Psychological Association.
Corrigan, P. W. (2012). A toolkit for evaluation programs meant to erase the stigma of mental
illness. Unpublished manuscript, National Consortium on Stigma and Empowerment.
Retrieved from http://www.stigmaandempowerment.org/
Corrigan, P. W. (2014). The stigma of disease and disability: Understanding causes and
overcoming injustices. Washington, DC: The American Psychological Association.
Corrigan, P. W. (2016). Beating stigma? Augment good interventions with the critical eye.
Stigma and Health, 1, 1-2. doi:10.1037/sah0000023
Corrigan, P. W., Edwards, A. B., Green, A., Diwan, S. L., & Penn, D. L. (2001). Prejudice,
social distance, and familiarity with mental illness. Schizophrenia Bulletin, 27(2), 219-
225.

76
Corrigan, P. W., Green, A., Lundin, R., Kubiak, M. A., & Penn, D. L. (2001). Familiarity with
and social distance from people who have serious mental illness. Psychiatric Services,
52, 953-958. doi:10.1176/appi.ps.52.7.953
Corrigan, P. W., Larson, J. E., Michaels, P. J., Buchholz, B. A., DelRossi, R., Fontecchio, M. J., .
. . Rüsch, N. (2015). Diminishing the self-stigma of mental illness by coming out proud.
Psychiatry Research, 229, 148-154.
Corrigan, P. W, Markowitz, F. E., Watson, A., Rowan, D., & Kubiak, M. (2003). An attribution
model of public discrimination towards persons with mental illness. Journal of Health
and Social Behavior, 44, 162–179
Corrigan, P. W., Morris, S. B., Michaels, P. J., Rafacz, J. D., & Rusch, N. (2012). Challenging
the public stigma of mental illness: A meta-analysis of outcome studies. Psychiatric
Services, 63, 963-973. doi: 10.1176/appi.ps.201100529
Corrigan, P. W., Powell, K. J., & Michaels, P. J. (2013). The effects of news stories on the
stigma of mental illness. The Journal of Nervous and Mental Disease, 201, 179-182.
doi:10.1097/NMD.0b013e3182848c24
Corrigan, P. W., Rowan, D., Green, A., Lundin, R., River, P., Uphoff-Wasowski, K., . . . Kubiak,
M. A. (2002). Challenging two mental illness stigmas: Personal responsibility and
dangerousness. Schizophrenia Bulletin, 28, 293-308. PMID:12693435
Corrigan, P. W., & Watson, A. C. (2002). Understanding the impact of stigma on people with
mental illness. World Psychiatry, 1, 16-20. PMCID: PMC1489832
Corrigan, P. W., & Watson, A. C. (2007). The stigma of psychiatric disorder and the gender,
ethnicity, and education of the perceiver. Community Mental Health Journal, 43, 439-
458. doi:10.1007/s10597-007-9084-9
77
Corrigan, P. W., Watson, A. C., Warpinski, A. C., & Gracia, G. (2004). Stigmatizing attitudes
about mental illness and allocation of resources to mental health services. Community
Mental Health Journal, 40, 297-307.
Couture, S. M., & Penn, D. L. (2003). Interpersonal contact and the stigma of mental illness: A
review of the literature. Journal of Mental Health, 12, 291-305.
doi:10.1080/09638231000118276
Coverdale, J., Nairn, R., & Claasen, D. (2002). Depictions of mental illness in print media: A
prospective national sample. Australian and New Zealand Journal of Psychiatry, 36,
697–700. doi:10.1046/j.1440-1614.2002.00998.x
Creswell, J. W. (2014). Research designs: Qualitative, quantitative, and mixed methods
approaches (4th ed.). Thousand Oaks, CA: Sage.
Crowe, A., & Averett, P. (2015). Attitudes of mental health professionals toward mental illness:
A deeper understanding. Journal of Mental Health Counseling, 37, 47-62.
doi:10.17744/mehc.37.1.l23251h783703q2
Dillman, D. A., Smyth, J. D., & Christian, L. M. (2009). Internet, mail and mixed-mode surveys:
The tailed design method (3rd ed.). Hoboken, NJ: Wiley.
Eisenberg, D., Downs, M. F., Golberstein, E., & Zivin, Z. (2009). Stigma and help seeking for
mental health among college students. Medical Care Research and Review, 1, 1-20 doi:
10.1177/1077558709335173
Elliott, B., & Konet, R. J. (2014). The connections place: A job preparedness program for
individuals with borderline personality disorder. Community Mental Health Journal, 50,
41–45. doi:10.1007/s10597-013-9601-y
78
Falvo, D. R. (2014). Medical and psychosocial aspects of chronic illness and disability (5th ed.).
Burlington, MA: Jones and Bartlett.
Fichten, C. S., Schipper, F., & Cutler, N. (2005). Does volunteering with children affect attitudes
toward adults with disabilities? A prospective study of unequal contact. Rehabilitation
Psychology 50(2), 164–173. doi:10.1037/0090-5550.50.2.164
Finch, J. (1987). Research note: The vignette techniques in survey research. Sociology, 12, 105-
114.
Findler, L., Vilchinsky, N., & Werner, S. (2007). The Multidimensional Attitudes Scale toward
persons with disabilities (MAS): Construction and validation. Rehabilitation Counseling
Bulletin, 50(3), 166-176. doi:10.1177/00343552070500030401
Fink, J. P., & Tasman, A. (1992). Stigma and mental illness. Washington, DC: American
Psychiatric Press.
Gliner, J. A., Morgan, G. A., & Leech, N. L. (2009). Research methods in applied settings: An
integrated approach to design and analysis. New York, NY: Routledge.
Goffman, E. (1963). Stigma: Notes on the management of spoiled identity. New York, NY:
Simon and Schuster.
Gordon P. A., Chariboga-Tantillo, J., Feldman, D., & Perrone, K. (2004). Attitudes regarding
interpersonal relationships with mental illness and mental retardation. Journal of
Rehabilitation, 70(1), 50-56.
Granello, D. H., & Gibbs, T. A. (2016). The power of language and labels: “The mentally ill”
versus “people with mental illnesses.” Journal of Counseling & Development, 91, 31-40.
doi:10.1002/jcad.12059/abstract
79
Green, S. B., & Salkind, N. J. (2014). Using SPSS for Windows and Macintosh: Analyzing and
understanding data. Upper Saddle River, NJ: Pearson.
Hackler, A. H., Cornish, M. A., & Vogel, D. L. (2016). Reducing mental illness stigma:
Effectiveness of hearing about the normative experiences of others. Stigma and Health,
1(3), 201-205. doi:http://dx.doi.org/10.1037/sah0000028
Hamann, H. A., Howell, L. A., & McDonald, J. L. (2013). Causal attributions and attitudes
towards lung cancer. Journal of Applied Social Psychology, 43, E37-E35.
doi:10.1111/jasp.12053/abstract
Hampton, N. Z., & Sharp, S. E. (2014). Shame-focused attitudes toward mental health problems:
The role of gender and culture. Rehabilitation Counseling Bulletin, 57(3), 170–181.
doi:10.1177/0034355213501722
Hayward, P., & Bright, J. A. (1997). Stigma and mental illness: A review and critique. Journal of
Mental Health, 6, 345-354. doi:10.1080/09638239718671
Heatherton, T. F., Kleck, R. E., Helb, M. R., & Hull, J. G. (2000). The social psychology of
stigma. New York, NY: Guilford.
Hergenrather, K. C., Gitlin, D. J., & Rhodes, S. D. (2011). Consumers with a bipolar disorder: A
theory-based approached to explore beliefs impacting job placement. Journal of
Rehabilitation, 77(3), 14-24.
Hertzog, M. A. (2008). Consideration in determining sample size for pilot studies. Research in
Nursing and Health, 31, 180-191. doi:10.1002/nur.20247
Heider, F. (1958). The psychology of interpersonal relations. New York, NY: Wiley.
Hinshaw, S. P. (2007). The mark of shame: Stigma of mental illness and an agenda for change.
New York, NY: Oxford University Press.
80
Holmes, E. P., Corrigan, P. W., Williams, P., Canar, J., & Kubiak, M. A. (1999). Changing
attitudes about schizophrenia. Schizophrenia Bulletin, 25, 447–456.
Howell, D. C. (2010). Statistical methods for psychology (7th ed.) Belmont, CA: Wadsworth-
Cengage.
Huitema, B. E., (2011). The analysis of covariance and alternatives. Hoboken, NJ: Wiley
Hughes, R., & Hughes, M. (2001). The application of vignettes in social and nursing research.
Journal of Advanced Nursing, 37(4), 382 -386. doi:10.1046/j.1365-2648.2002.02100.x
Hughes, R., & Hughes, M. (2004). The construction and interpretation of vignettes in social
research. Social Work & Social Sciences Review, 11(1), 36-51.
Hunt, J., & Eisenberg, D. (2010). Mental health problems and help-seeking behaviors among
college students. Journal of Adolescent Health, 46, 3-10.
doi:10.1060/j.jadohealth.2009.08.008
Jones, E. E., Farina, A., Hastorf, A. H., Markus, H., Miller, D. T., & Scott, R. A. (1984). Social
stigma: The psychology of marked relationships. New York, NY: W. H. Freeman and
Company.
Jussim, L., Palumbo, P., Chatman, C., Madon, S., & Smith, A. (2000). Stigma and self-fulfilling
prophecies. In T. F. Heatherton, R. E. Kleck, M. R. Helb, & J. G. Hull (Eds.), The social
psychology of stigma (pp. 374-418). New York, NY: Guilford.
Kennedy, S. C., Abell, N., & Mennicke, A. (2014). Initial validation of the Mental Health
Provider Stigma Inventory. Research on Social Work Practice, 27(3), 335-347.
doi:10.1177/1049731514563577.
81
Kim, H. Y. (2015). Statistical notes for clinical researchers: Post-hoc multiple
comparisons. Restorative Dentistry & Endodontics, 40(2), 172–176.
doi:10.5395/rde.2015.40.2.172
Kopera, M., Suszek, H., Bonar, E., Myszka, M., Gmaj, B., Ilgen, M., & Wojnar, M. (2015).
Evaluating explicit and implicit stigma of mental illness in mental health professionals
and medical students. Community Mental Health Journal, 51, 628–634. doi:
10.1007/s10597-014-9796-6
Kvaale, E. P., Haslam, N., & Gottdiener, W. H. (2013). The ‘side effects’ of medicalization: A
meta-analytic review of how biogenetic explanations affect stigma. Clinical Psychology
Review, 33, 782-794. doi:10.1016/j.cpr.2013.06.002
Lam, W. Y., Gunukula, S. K., McGuigan, D., Isaiah, N., Symons, A. B., & Akl, E. A. (2010).
Validated instruments used to measure attitudes of healthcare students and professionals
towards patients with physical disability: A systematic review. Journal of
NeuroEngineering and Rehabilitation, 7, 1-7. doi: 10.1186/1743-0003-7-55
Lam, T., P., Lam, K. F., Lam, E. W., & Sun, K. S. (2015). Does postgraduate training in
community mental health make a difference to primary care physicians’ attitudes to
depression and schizophrenia? Community Mental Health Journal, 51, 641–646.
doi:10.1007/s10597-015-9829-9
Lin, C. Y., Chang, C. C., Wu, T. H., & Wang, J. D. (2016). Dynamic changes of self-stigma,
quality of life, somatic complaints, and depression among people with schizophrenia: A
pilot study applying kernel smoothers. Stigma and Health, 1, 29-43. doi:
10.1037/sah0000014
82
Link, B., Cullen, F., Frank, J., & Wozniak, J. F. (1987). The social rejection of former mental
patients: Understanding why labels matter. American Journal of Sociology, 92, 1461–
1500. doi: 10.1086/228672
Link, B., Cullen, F., Struening, E., Shrout, P., & Dohrenwend, B. (1989). A modified labeling
theory approach to mental disorders: An empirical assessment. American Sociological
Review, 54, 400–423.
Link, B. G., Yang, L. H., Phelan, J. C., & Collins, P. Y. (2004). Measuring mental illness stigma.
Schizophrenia Bulletin, 30, 511-541.
Livingston, J. D., & Boyd, J. E. (2010). Correlates and consequences of internalized stigma for
people living with mental illness: A systematic review and meta-analysis. Social Science
and Medicine, 71, 2150-2161. doi:10.1016/j.socscimed.2010.09.030
Lynch, R. T., & Thomas, K. R. (1994). People with disabilities as victims: Changing an ill-
advised paradigm. Journal of Rehabilitation, 60(1), 8-11.
Macrae, N. C., & Bodenhausen, G. V. (2001). Social cognition: Categorical person perception.
British Journal of Psychology, 92, 239–255. doi: 10.1.1.318.4390&rep=rep1&type=pdf
Maio, G. R., & Olson, J. M. (2000). Why we evaluate: Functions of attitudes. Mahwah, NJ:
Lawrence Erlbaum.
Marili, I., Glover-Graf, N. M., & Millington, M. (2012). Psychosocial aspects of disability:
Insider perspective and strategies for counselors. New York, NY: Springer.
Martin, J. K., Pescosolido, B. A., & Tuch, S. A. (2000). Of fear and loathing: The role of
“disturbing behavior,” labels, and causal attribution in shaping public attitudes toward
people with mental illness. Journal of Health and Social Behavior, 41, 208-223.

83
Meline, T. (2006). Research in communication science and disorders: Methods, applications,
evaluation. Upper Saddle River, NJ: Pearson.
Miller, E., Chen, R., Glover-Graf, N. M., & Kranz, P. (2009). Willingness to engage in personal
relationship with persons with disabilities. Rehabilitation Counseling Bulletin, 20, 1-14.
doi:10.1177/0034355209332719
Murphy, K. R., & Myors, B. (2004). Statistical power analysis: A simple and general model for
traditional and modern hypothesis tests (2nd ed.). Mahwah, NJ: Lawrence Erlbaum.
Moffat, C. T. (2011). Helping those in need: Human service workers. Occupational Outlook
Quarterly, 55(3), 22-32.
Nadler, J. T., Bartels, L. K., Naumann, S., Mo, R., Locke, J., Beurskens, M.,. . . Gin, M. (2015).
Sampling strategies in the top I-O journals: What gets published? The Industrial-
Organizational Psychologist, 53(2), 139-147.
National Institute of Mental Health. (2017). Serious mental illness (SMI) among U.S. adults.
Retrieved from www.nimh.nih.gov
Nelson, L. K. (2013). Research in communication science and disorders (2nd ed.). San Diego,
CA: Plural.
Neukrug, E. (2006). The world of the counselor: An introduction to the counseling profession.
(3rd ed.). Pacific Grove, CA: Brooks/Cole.
Olney, M. F., & Kim, A. (2001). Beyond adjustment: Integration of cognitive disability into
identity. Disability & Society, 16(4), 563-583. doi:10.1080/09687590120059540
Overton, S. L., & Medina, S. L. (2008). The stigma of mental illness. Journal of Counseling and
Development, 86, 141-151. doi:10.1002/j.1556-6678.2008.tb00491.x
84
Parker, R. M., Szymanski, E. M., & Patterson, J. B. (2004). Rehabilitation counseling: Basics
and beyond (4th ed.). Austin, TX: Pro-Ed.
Penn, D, L., Chamberlin, C., & Mueser, K. T. (2003). The effects of a documentary film about
schizophrenia on psychiatric stigma. Schizophrenia Bulletin, 29(2), 383-391.
Penn, D. L., Guyman, K., Dally, T., Spaulding, W. D., Garbin, C. P., & Sullivan, M. (1994).
Dispelling the stigma of schizophrenia: What sort of information is best? Schizophrenia
Bulletin, 20, 567-578. PMID: 7973472
Perlick, D. A. (2001). Special section on stigma as a barrier to recovery: Introduction.
Psychiatric Service, 52(12), 1613-1614. doi: 10.1176/appi.ps.52.12.1613
Pingani, L., Forghieri, M., Ferrari, S., Ben-Zeev, D., Artoni, P., Mazzi, F., . . .Corrigan, P. W.
(2012). Stigma and discrimination toward mental illness: Translation and validation of
the Italian version of the Attribution Questionnaire-27 (AQ-27-I). Social Psychiatry
Epidemiology, 47, 993–999. doi: 10.1007/s00127-011-0407-3
Pratt, C. W., Gill, K. J., Barrett, N. M., & Roberts, S. (2007). Psychiatric rehabilitation (2nd
ed.). Burlington, MA: Elsevier Academic.
Reeder, G. D., & Pryor, J. B. (2000). Attitudes toward persons with HIV/AIDS: Linking a
functional approach with underlying process. In G. R. Maio & J. M. Olson (Eds.), Why
we evaluate: Functions of attitudes (pp. 295-323). Mahwah, NJ: Lawrence Erlbaum.
Reinke, R. R., Corrigan, P. W., Leonhard, C., Lundin, R. K., & Kubiak, M. A. (2004).
Examining two aspects of contact on the stigma of mental illness. Journal of Social and
Clinical Psychology, 23, 377-389. doi: 10.1521/jscp.23.3.377.35457
Riggar, T. F., & Maki, D. R. (2003). Handbook of rehabilitation counseling. New York, NY:
Springer
85
Russinova, Z., Griffin, S., Bloch, P., Wewiorski, N. J., & Rosoklija, I. (2011). Workplace
prejudice and discrimination toward individuals with mental illnesses. Journal of
Vocational Rehabilitation, 35, 227–241. doi: 10.3233/JVR-2011-0574
Rutherford, A. (2011). ANOVA and ANCOVA: A GLM approach. Hoboken, NJ: Wiley.
Sadow, D., Ryder, M., & Webster, D. (2002). Is education of health professionals encouraging
stigma towards the mentally ill? Journal of Mental Health, 11(6), 657-665.
doi:10.1080/0963832000058210
Schulze, B. (2007). Stigma and mental health professionals: A review of the evidence on an
intricate relationship. International Review of Psychiatry, 19(2), 137-155.
doi:10.1080/09540260701278929.
Schulze, B., & Angermeyer, M. C. (2003). Subjective experiences of stigma: A focus group
study of schizophrenic patients, their relatives and mental health professionals. Social
Science & Medicine, 56, 299–312
Smith, A. L., & Cashwell, C. S. (2010). Stigma and mental illness: Investigating attitudes of
mental health and non-mental-health professionals and trainees. Journal of Humanistic
Counseling, Education and Development, 49, 189-202. doi:10.1002/j.2161-
1939.2010.tb00097.x
Stout, P. A., Villegas, J., & Jennings, N. A. (2004). Images of mental illness in the media:
Identifying gaps in the research. Schizophrenia Bulletin, 30 (3), 543-561.
86
Stedman, J. M., Neff, J A., & Morrow, D. (1995). Career pathways and current practice patterns
of clinical and counseling psychologists: A follow-up study of former interns. Journal of
Clinical Psychology, 51, (3), 441-448.
SurveyMonkey. (2018). Academic surveys. Retrieved from
https://www.surveymonkey.com/mp/academic-surveys/
Struening, E. L., & Cohen, J. (1963). Factorial invariance and other psychometric characteristics
of five opinions about mental illness factors. Educational and Psychological
Measurement, 23, 289-298. doi:10.1177/001316446302300206
Tabachnick, B. G., & Fidell, L. S. (2007). Experimental design using ANOVA. Belmont, CA:
Thomson Brooks/Cole.
Tabachnick, B. G., & Fidell, L. S. (2013). Using multivariate statistics. Boston, MA: Pearson.
Taylor, S. M., & Dear, M. J. (1981). Scaling community attitudes toward the mentally ill.
Schizophrenia Bulletin, 7, 225-240. doi:10.1016/j.sbspro.2013.06.247
Todor, I. (2013). Opinions about mental illness. Procedia - Social and Behavioral Sciences, 82,
209-214.
Trochim, W. M. K., & Donnelly, J. P. (2006). Research methods knowledge base. Mason, OH:
Cengage.
Turner, N., O’Mahony, P., Hill, M., Fanning, F., Larkin, C., Waddington, J., Clarke, M. (2015).
Work life after psychosis: A detailed examination. Work, 51, 143-152.
doi:10.3233/WOR-141865
Twamley, E. W., Padin, D. S., Bayne, K. S., Narvaez, J. M., Williams, R. E., & Jeste, D. V.
(2005). Work rehabilitation for middle-aged and older people with schizophrenia: A
87
comparison of three approaches. The Journal of Nervous and Mental Disease, 193(9),
596 – 601. doi:10.1097/01.nmd.0000177789.53840.e3
Upton, T. D., & Harper, D. C. (2002). Multidimensional disability attitudes and equitable
evaluation of educational accommodations by college students without disabilities
Journal of Postsecondary Education and Disability, 15(2), 115-130.
Upton, T. D., Harper, D. C., & Wadsworth, J. (2005). Postsecondary attitudes toward persons
with disabilities: A comparison of college students with and without disabilities. Journal
of Applied Rehabilitation Counseling, 36(3), 24-31.
Wakefield, J. C. (1992). Disorder as harmful dysfunction: A conceptual critique of DSM-III-R’s
definition of mental disorder. Psychological Review, 99, 232-247. doi: 10.1037/0033-
295X.99.2.232
Walton-Moss, B., Gerson, L., & Rose, L. (2005). Effects of mental illness on family quality of
life. Issues in Mental Health Nursing, 26, 627-642. doi:10.1080/01612840590959506
Watson, A. C., Corrigan, P., Larson, J. E., Sells, M. (2007). Self-stigma in people with mental
illness. Schizophrenia Bulletin, 33(6), 1312-1318. doi:10.1093/schbul/sbl076
Weiner, B. (1993). On sin versus sickness: A theory of perceived responsibility and social
motivation. American Psychologist, 49(9), 957-965.
Wilson, J., & While, A. E. (1998). Methodological issues surrounding the use of vignettes in
qualitative research. Journal of Interprofessional Care, 12(1), 79 – 86. doi:
10.3109/13561829809014090
Wright, B. A. (1983). Physical disability – a psychosocial approach (2nd ed.). New York, NY:
Harper Collins.
Wright, G. N. (1980). Total rehabilitation. Boston, MA: Little, Brown and Company.

88
Yuker, H. E. (1988). Attitudes toward persons with disabilities. New York, NY: Springer
Publishing.
Yuker, H., Block, J., & Younng, J. (1966). The measurement of attitudes toward disabled
persons. Albertson, NY: Human Resources Center.

88
APPENDICES
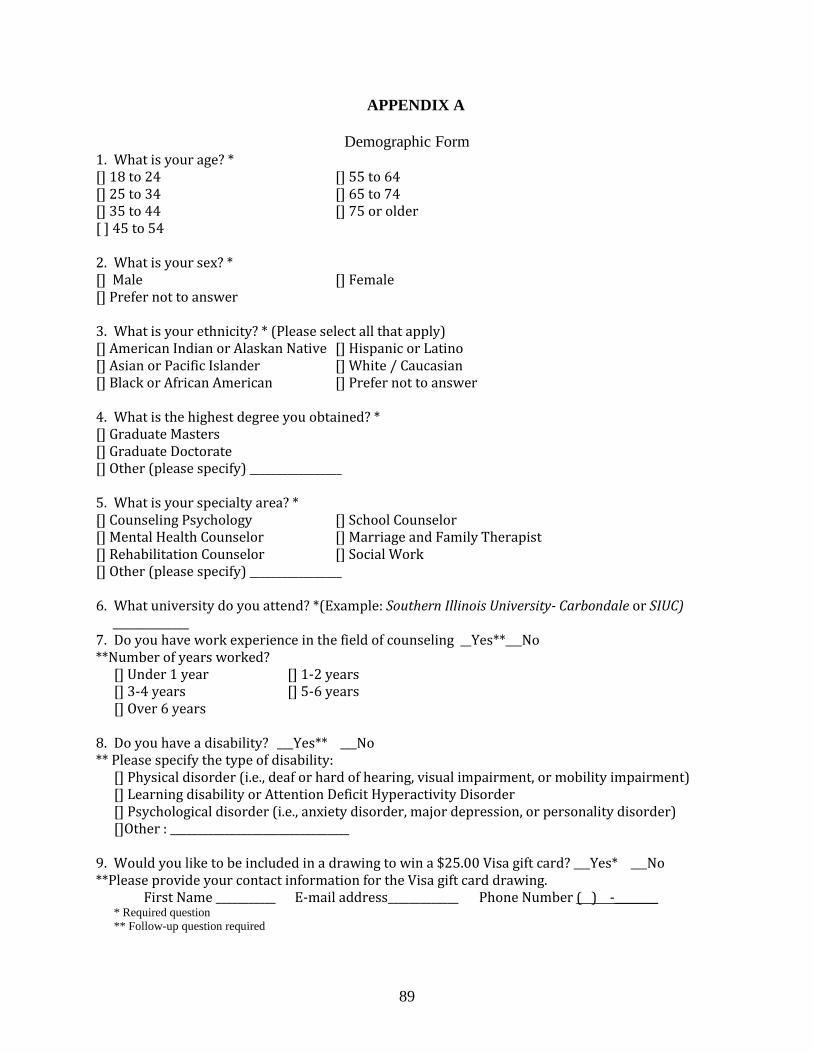
89
APPENDIX A
Demographic Form 1. What is your age? * [] 18 to 24 [] 55 to 64 [] 25 to 34 [] 65 to 74 [] 35 to 44 [] 75 or older [ ] 45 to 54 2. What is your sex? * [] Male [] Female [] Prefer not to answer 3. What is your ethnicity? * (Please select all that apply) [] American Indian or Alaskan Native [] Hispanic or Latino [] Asian or Pacific Islander [] White / Caucasian [] Black or African American [] Prefer not to answer 4. What is the highest degree you obtained? * [] Graduate Masters [] Graduate Doctorate [] Other (please specify) _________________ 5. What is your specialty area? * [] Counseling Psychology [] School Counselor [] Mental Health Counselor [] Marriage and Family Therapist [] Rehabilitation Counselor [] Social Work [] Other (please specify) _________________ 6. What university do you attend? *(Example: Southern Illinois University- Carbondale or SIUC)
______________ 7. Do you have work experience in the field of counseling __Yes**___No **Number of years worked?
[] Under 1 year [] 1-2 years [] 3-4 years [] 5-6 years [] Over 6 years
8. Do you have a disability? ___Yes** ___No ** Please specify the type of disability:
[] Physical disorder (i.e., deaf or hard of hearing, visual impairment, or mobility impairment) [] Learning disability or Attention Deficit Hyperactivity Disorder [] Psychological disorder (i.e., anxiety disorder, major depression, or personality disorder) []Other : _________________________________
9. Would you like to be included in a drawing to win a $25.00 Visa gift card? ___Yes* ___No **Please provide your contact information for the Visa gift card drawing. First Name ___________ E-mail address_____________ Phone Number ( ) -________
* Required question
** Follow-up question required
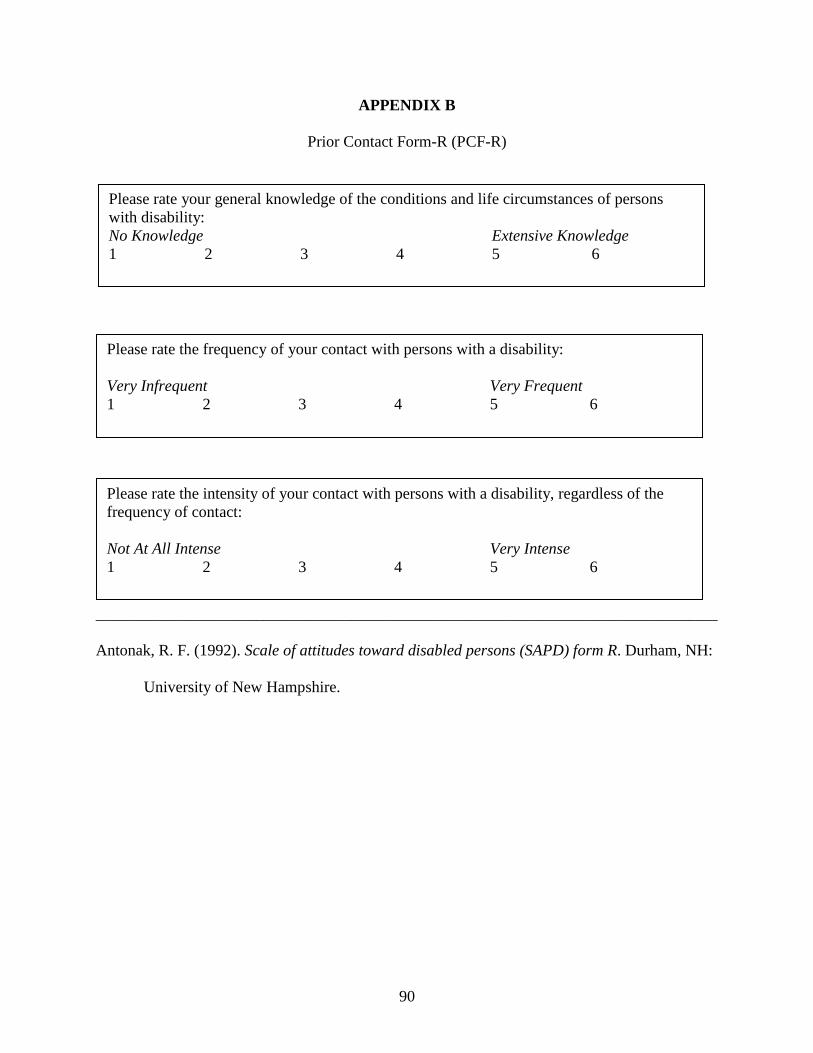
90
APPENDIX B
Prior Contact Form-R (PCF-R)
_____________________________________________________________________________________
Antonak, R. F. (1992). Scale of attitudes toward disabled persons (SAPD) form R. Durham, NH:
University of New Hampshire.
Please rate your general knowledge of the conditions and life circumstances of persons
with disability:
No Knowledge Extensive Knowledge
1 2 3 4 5 6
Please rate the frequency of your contact with persons with a disability:
Very Infrequent Very Frequent
1 2 3 4 5 6
Please rate the intensity of your contact with persons with a disability, regardless of the
frequency of contact:
Not At All Intense Very Intense
1 2 3 4 5 6
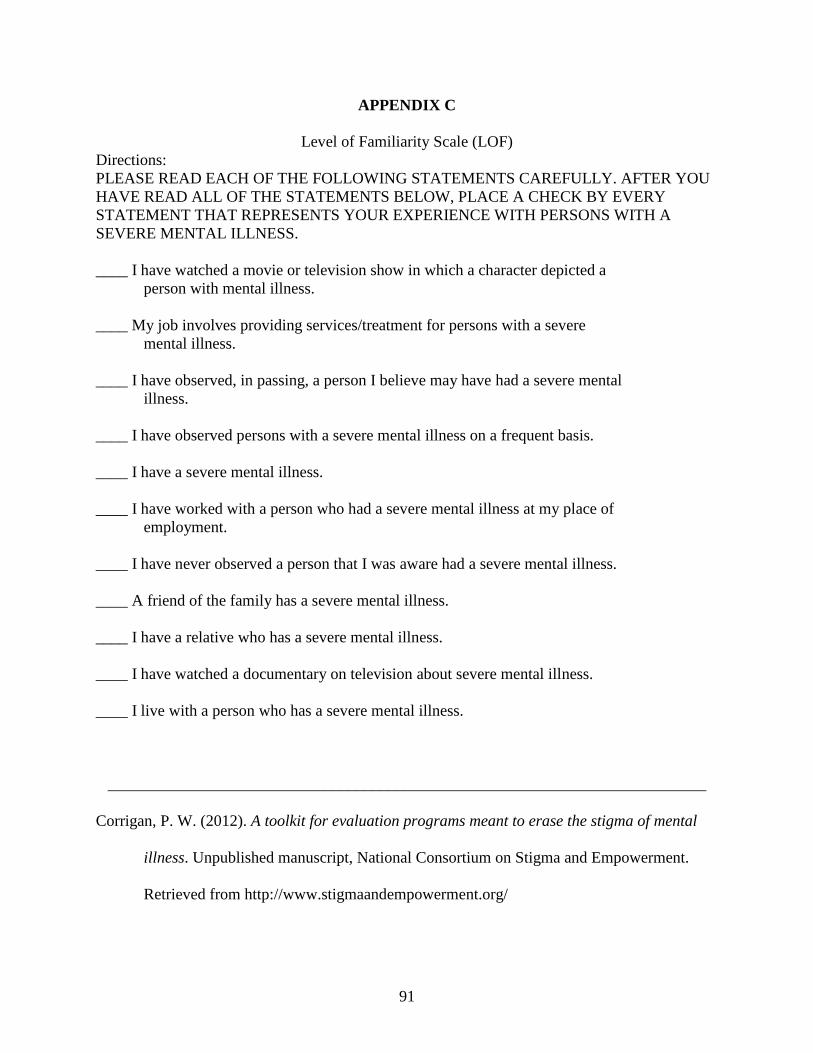
91
APPENDIX C
Level of Familiarity Scale (LOF)
Directions:
PLEASE READ EACH OF THE FOLLOWING STATEMENTS CAREFULLY. AFTER YOU
HAVE READ ALL OF THE STATEMENTS BELOW, PLACE A CHECK BY EVERY
STATEMENT THAT REPRESENTS YOUR EXPERIENCE WITH PERSONS WITH A
SEVERE MENTAL ILLNESS.
____ I have watched a movie or television show in which a character depicted a
person with mental illness.
____ My job involves providing services/treatment for persons with a severe
mental illness.
____ I have observed, in passing, a person I believe may have had a severe mental
illness.
____ I have observed persons with a severe mental illness on a frequent basis.
____ I have a severe mental illness.
____ I have worked with a person who had a severe mental illness at my place of
employment.
____ I have never observed a person that I was aware had a severe mental illness.
____ A friend of the family has a severe mental illness.
____ I have a relative who has a severe mental illness.
____ I have watched a documentary on television about severe mental illness.
____ I live with a person who has a severe mental illness.
___________________________________________________________________________
Corrigan, P. W. (2012). A toolkit for evaluation programs meant to erase the stigma of mental
illness. Unpublished manuscript, National Consortium on Stigma and Empowerment.
Retrieved from http://www.stigmaandempowerment.org/
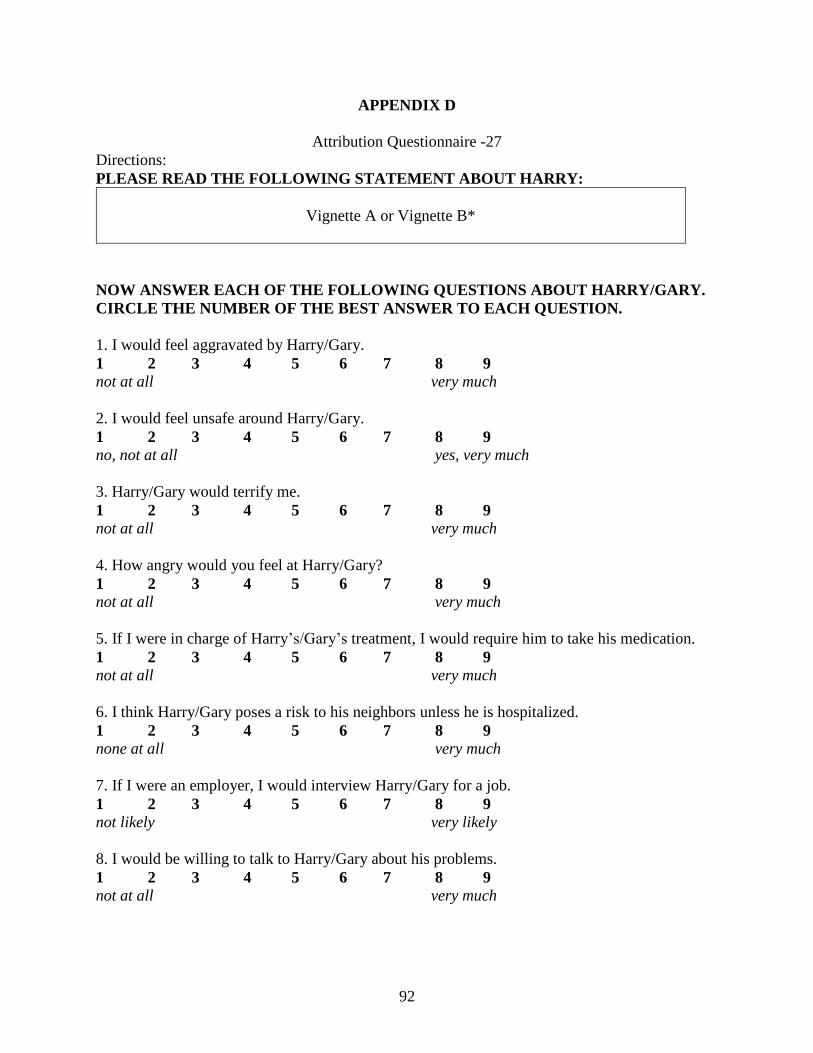
92
APPENDIX D
Attribution Questionnaire -27
Directions:
PLEASE READ THE FOLLOWING STATEMENT ABOUT HARRY:
Vignette A or Vignette B*
NOW ANSWER EACH OF THE FOLLOWING QUESTIONS ABOUT HARRY/GARY.
CIRCLE THE NUMBER OF THE BEST ANSWER TO EACH QUESTION.
1. I would feel aggravated by Harry/Gary.
1 2 3 4 5 6 7 8 9
not at all very much
2. I would feel unsafe around Harry/Gary.
1 2 3 4 5 6 7 8 9
no, not at all yes, very much
3. Harry/Gary would terrify me.
1 2 3 4 5 6 7 8 9
not at all very much
4. How angry would you feel at Harry/Gary?
1 2 3 4 5 6 7 8 9
not at all very much
5. If I were in charge of Harry’s/Gary’s treatment, I would require him to take his medication.
1 2 3 4 5 6 7 8 9
not at all very much
6. I think Harry/Gary poses a risk to his neighbors unless he is hospitalized.
1 2 3 4 5 6 7 8 9
none at all very much
7. If I were an employer, I would interview Harry/Gary for a job.
1 2 3 4 5 6 7 8 9
not likely very likely
8. I would be willing to talk to Harry/Gary about his problems.
1 2 3 4 5 6 7 8 9
not at all very much
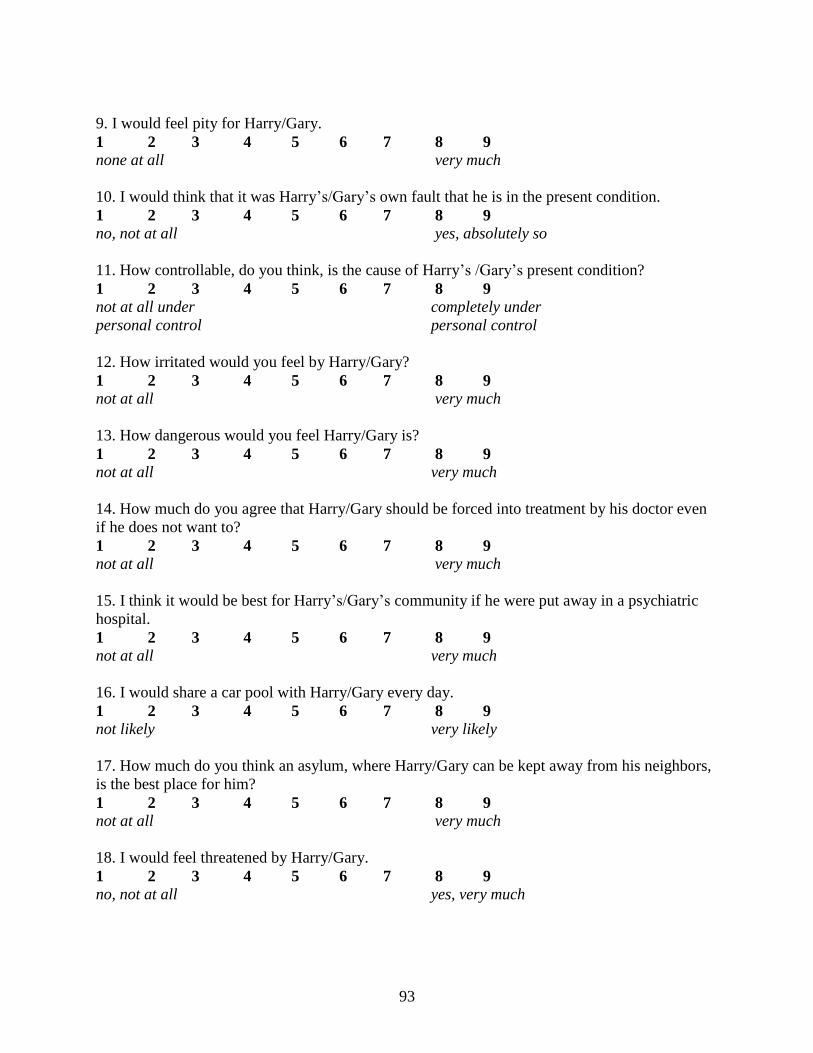
93
9. I would feel pity for Harry/Gary.
1 2 3 4 5 6 7 8 9
none at all very much
10. I would think that it was Harry’s/Gary’s own fault that he is in the present condition.
1 2 3 4 5 6 7 8 9
no, not at all yes, absolutely so
11. How controllable, do you think, is the cause of Harry’s /Gary’s present condition?
1 2 3 4 5 6 7 8 9
not at all under completely under
personal control personal control
12. How irritated would you feel by Harry/Gary?
1 2 3 4 5 6 7 8 9
not at all very much
13. How dangerous would you feel Harry/Gary is?
1 2 3 4 5 6 7 8 9
not at all very much
14. How much do you agree that Harry/Gary should be forced into treatment by his doctor even
if he does not want to?
1 2 3 4 5 6 7 8 9
not at all very much
15. I think it would be best for Harry’s/Gary’s community if he were put away in a psychiatric
hospital.
1 2 3 4 5 6 7 8 9
not at all very much
16. I would share a car pool with Harry/Gary every day.
1 2 3 4 5 6 7 8 9
not likely very likely
17. How much do you think an asylum, where Harry/Gary can be kept away from his neighbors,
is the best place for him?
1 2 3 4 5 6 7 8 9
not at all very much
18. I would feel threatened by Harry/Gary.
1 2 3 4 5 6 7 8 9
no, not at all yes, very much
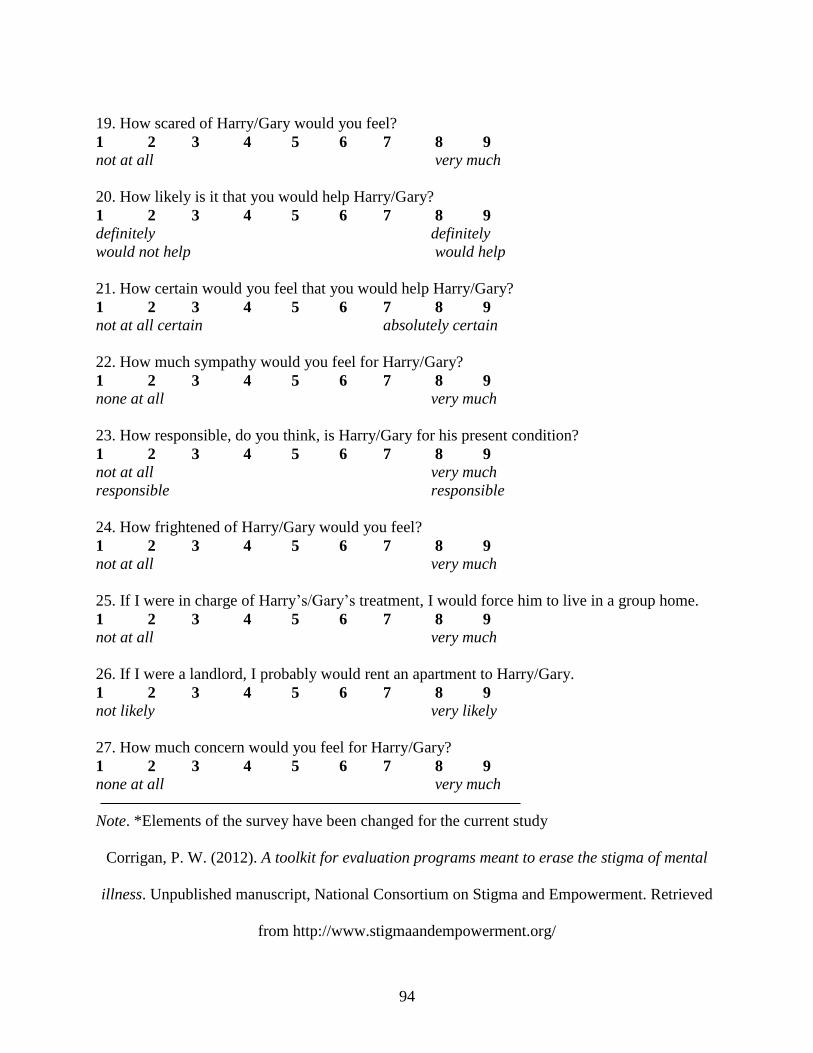
94
19. How scared of Harry/Gary would you feel?
1 2 3 4 5 6 7 8 9
not at all very much
20. How likely is it that you would help Harry/Gary?
1 2 3 4 5 6 7 8 9
definitely definitely
would not help would help
21. How certain would you feel that you would help Harry/Gary?
1 2 3 4 5 6 7 8 9
not at all certain absolutely certain
22. How much sympathy would you feel for Harry/Gary?
1 2 3 4 5 6 7 8 9
none at all very much
23. How responsible, do you think, is Harry/Gary for his present condition?
1 2 3 4 5 6 7 8 9
not at all very much
responsible responsible
24. How frightened of Harry/Gary would you feel?
1 2 3 4 5 6 7 8 9
not at all very much
25. If I were in charge of Harry’s/Gary’s treatment, I would force him to live in a group home.
1 2 3 4 5 6 7 8 9
not at all very much
26. If I were a landlord, I probably would rent an apartment to Harry/Gary.
1 2 3 4 5 6 7 8 9
not likely very likely
27. How much concern would you feel for Harry/Gary?
1 2 3 4 5 6 7 8 9
none at all very much
Note. *Elements of the survey have been changed for the current study
Corrigan, P. W. (2012). A toolkit for evaluation programs meant to erase the stigma of mental
illness. Unpublished manuscript, National Consortium on Stigma and Empowerment. Retrieved
from http://www.stigmaandempowerment.org/

95
APPENDIX E
Mental Health Provider Stigma Inventory
The first domain of the MHPSI concerns service provider attitudes about mental health clients.
Please read each item below, then choose the number, where 1 = completely disagree and 7 =
completely agree.
Attitudes
1 2 3 4 5 6 7
My good decisions in life have protected me from having
problems like my clients have.
Clients behave like other people with the same diagnostic label(s).
Clients with chronic diagnostic labels should not make their own
decisions.
Clients will not follow through on recommendations or
instructions.
Once a person becomes a mental health client, they will never get
better.
It’s okay to remind clients that the staff is in charge.
I could never have the same problems as clients. Clients are crazy.
When a client and coworker are having a disagreement, I side with
my coworker.
------------------------------------------------------------------------------------------------------------------------------------------------
The second domain of the MHPSI concerns service provider behaviors. Please read each item
below, then choose the number, where 1 = completely disagree and 7 = completely agree.
Behaviors
1 2 3 4 5 6 7
I tell clients that they cause their own problems.
I refer to clients by their diagnostic label(s).
I tell clients that I am the expert.
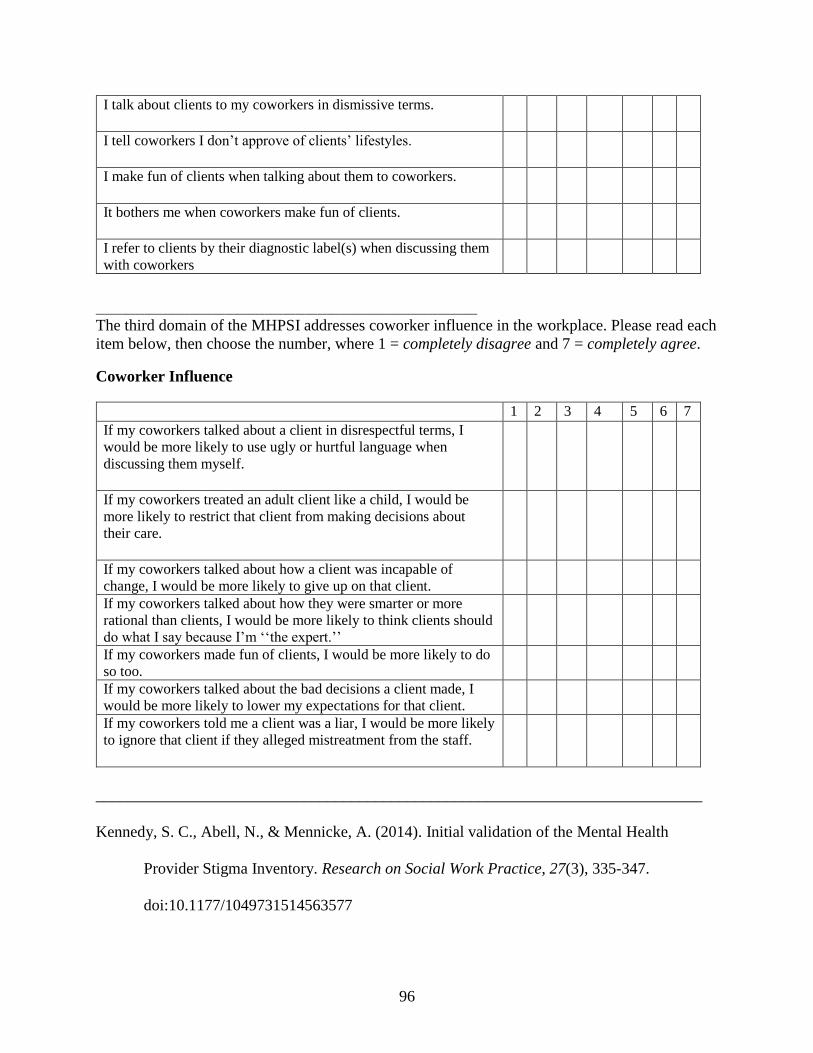
96
I talk about clients to my coworkers in dismissive terms.
I tell coworkers I don’t approve of clients’ lifestyles.
I make fun of clients when talking about them to coworkers.
It bothers me when coworkers make fun of clients.
I refer to clients by their diagnostic label(s) when discussing them
with coworkers
______________________________________________________________________________________
The third domain of the MHPSI addresses coworker influence in the workplace. Please read each
item below, then choose the number, where 1 = completely disagree and 7 = completely agree.
Coworker Influence
1 2 3 4 5 6 7
If my coworkers talked about a client in disrespectful terms, I
would be more likely to use ugly or hurtful language when
discussing them myself.
If my coworkers treated an adult client like a child, I would be
more likely to restrict that client from making decisions about
their care.
If my coworkers talked about how a client was incapable of
change, I would be more likely to give up on that client.
If my coworkers talked about how they were smarter or more
rational than clients, I would be more likely to think clients should
do what I say because I’m ‘‘the expert.’’
If my coworkers made fun of clients, I would be more likely to do
so too.
If my coworkers talked about the bad decisions a client made, I
would be more likely to lower my expectations for that client.
If my coworkers told me a client was a liar, I would be more likely
to ignore that client if they alleged mistreatment from the staff.
____________________________________________________________________________
Kennedy, S. C., Abell, N., & Mennicke, A. (2014). Initial validation of the Mental Health
Provider Stigma Inventory. Research on Social Work Practice, 27(3), 335-347.
doi:10.1177/1049731514563577
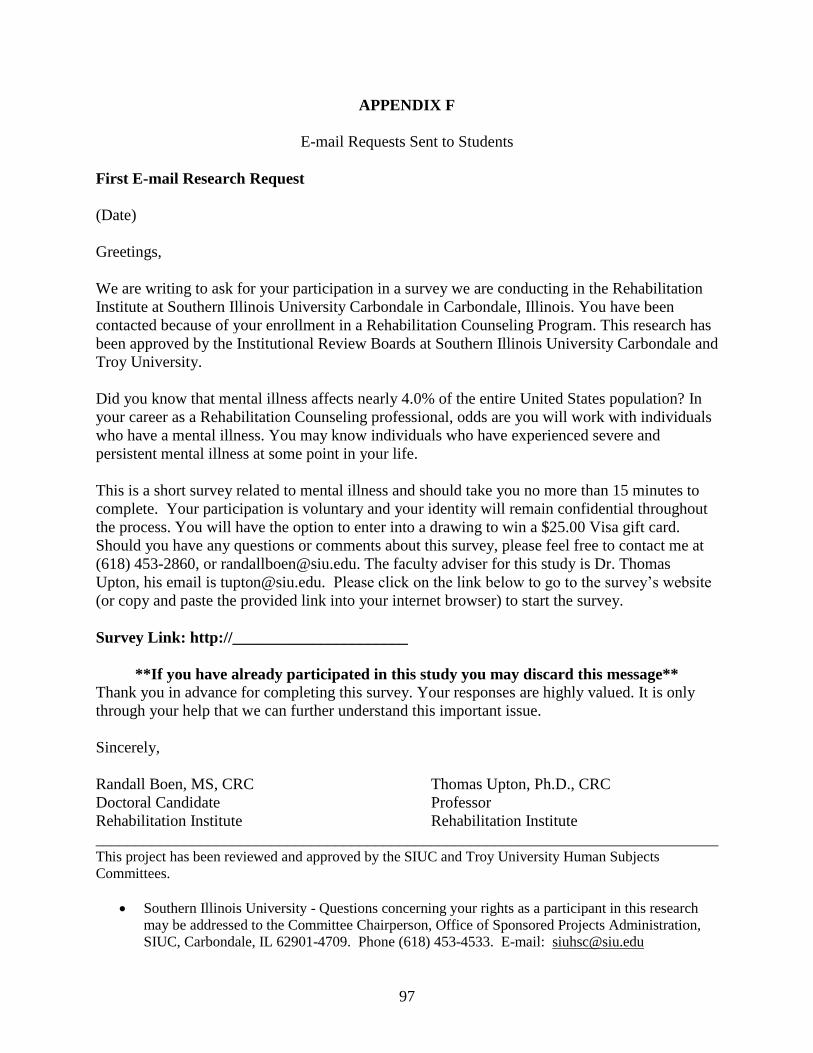
97
APPENDIX F
E-mail Requests Sent to Students
First E-mail Research Request
(Date)
Greetings,
We are writing to ask for your participation in a survey we are conducting in the Rehabilitation
Institute at Southern Illinois University Carbondale in Carbondale, Illinois. You have been
contacted because of your enrollment in a Rehabilitation Counseling Program. This research has
been approved by the Institutional Review Boards at Southern Illinois University Carbondale and
Troy University.
Did you know that mental illness affects nearly 4.0% of the entire United States population? In
your career as a Rehabilitation Counseling professional, odds are you will work with individuals
who have a mental illness. You may know individuals who have experienced severe and
persistent mental illness at some point in your life.
This is a short survey related to mental illness and should take you no more than 15 minutes to
complete. Your participation is voluntary and your identity will remain confidential throughout
the process. You will have the option to enter into a drawing to win a $25.00 Visa gift card.
Should you have any questions or comments about this survey, please feel free to contact me at
(618) 453-2860, or [email protected]. The faculty adviser for this study is Dr. Thomas
Upton, his email is [email protected]. Please click on the link below to go to the survey’s website
(or copy and paste the provided link into your internet browser) to start the survey.
Survey Link: http://______________________
**If you have already participated in this study you may discard this message**
Thank you in advance for completing this survey. Your responses are highly valued. It is only
through your help that we can further understand this important issue.
Sincerely,
Randall Boen, MS, CRC Thomas Upton, Ph.D., CRC
Doctoral Candidate Professor
Rehabilitation Institute Rehabilitation Institute
______________________________________________________________________________ This project has been reviewed and approved by the SIUC and Troy University Human Subjects
Committees.
Southern Illinois University - Questions concerning your rights as a participant in this research
may be addressed to the Committee Chairperson, Office of Sponsored Projects Administration,
SIUC, Carbondale, IL 62901-4709. Phone (618) 453-4533. E-mail: [email protected]

98
Troy University - If you have any questions concerning your rights as a research participant,
contact the Institutional Review Board by sending an email to [email protected] or calling 334-808-
6294.
99
Second E-mail Research Request
(Date)
Greetings,
We recently sent you an email on March 27 asking for your participation in a short survey. Your
participation is valued as a future rehabilitation counselor. If you can spare around 15 minutes,
please consider participating in this study. Your participation is voluntary and your identity will
remain confidential throughout the process. You will have the option to enter into a drawing to
win a $25.00 Visa gift card.
Please click on the link below to go to the survey’s website (or copy and paste the provided link
into your internet browser) to start the survey. Should you have any questions or comments about
this survey, please feel free to contact me at (618) 453-2860 or [email protected].
Survey Link: http://______________________
**If you have already participated in this study you may discard this message**
Your responses are important and will help us to further understand this important issue. Thank
you for your help in completing this survey.
Sincerely,
Randall Boen, MS, CRC Thomas Upton Ph.D., CRC
Doctoral Candidate, Professor
Rehabilitation Institute Rehabilitation Institute
______________________________________________________________________________ This project has been reviewed and approved by the SIUC and Troy University Human Subjects
Committees.
Southern Illinois University - Questions concerning your rights as a participant in this research
may be addressed to the Committee Chairperson, Office of Sponsored Projects Administration,
SIUC, Carbondale, IL 62901-4709. Phone (618) 453-4533. E-mail: [email protected]
Troy University - If you have any questions concerning your rights as a research participant,
contact the Institutional Review Board by sending an email to [email protected] or calling 334-808-
6294.
100
Third E-Mail Research Request
(Date)
Greetings,
Spring semester is a busy time for students, and I understand how valuable your spare time is
during the semester. We are hoping you can spend around 10 to 15 minutes to participate in a
study about mental illness. Your participation is voluntary and your identity will remain
confidential throughout the process. You will have the option to enter into a drawing to win a
$25.00 Visa gift card.
If you have already participated in this study, I really appreciate your time. If you have not yet
responded, I would like to encourage you to do so. I plan to end data collection soon so would
encourage everyone to participate.
Please click on the link below to go to the survey’s website (or copy and paste the provided link
into your internet browser) to start the survey. Should you have any questions or comments about
this survey, please feel free to contact me at (618) 453-2860 or [email protected].
Survey Link: http://______________________
Your responses are important and will help us to further understand this important issue. Thank
you for your help in completing this survey.
Sincerely,
Randall Boen, MS, CRC Thomas Upton Ph.D., CRC
Doctoral Candidate, Professor
Rehabilitation Institute Rehabilitation Institute
______________________________________________________________________________ This project has been reviewed and approved by the SIUC and Troy University Human Subjects
Committees.
Southern Illinois University - Questions concerning your rights as a participant in this research
may be addressed to the Committee Chairperson, Office of Sponsored Projects Administration,
SIUC, Carbondale, IL 62901-4709. Phone (618) 453-4533. E-mail: [email protected]
Troy University - If you have any questions concerning your rights as a research participant,
contact the Institutional Review Board by sending an email to [email protected] or calling 334-808-
6294.
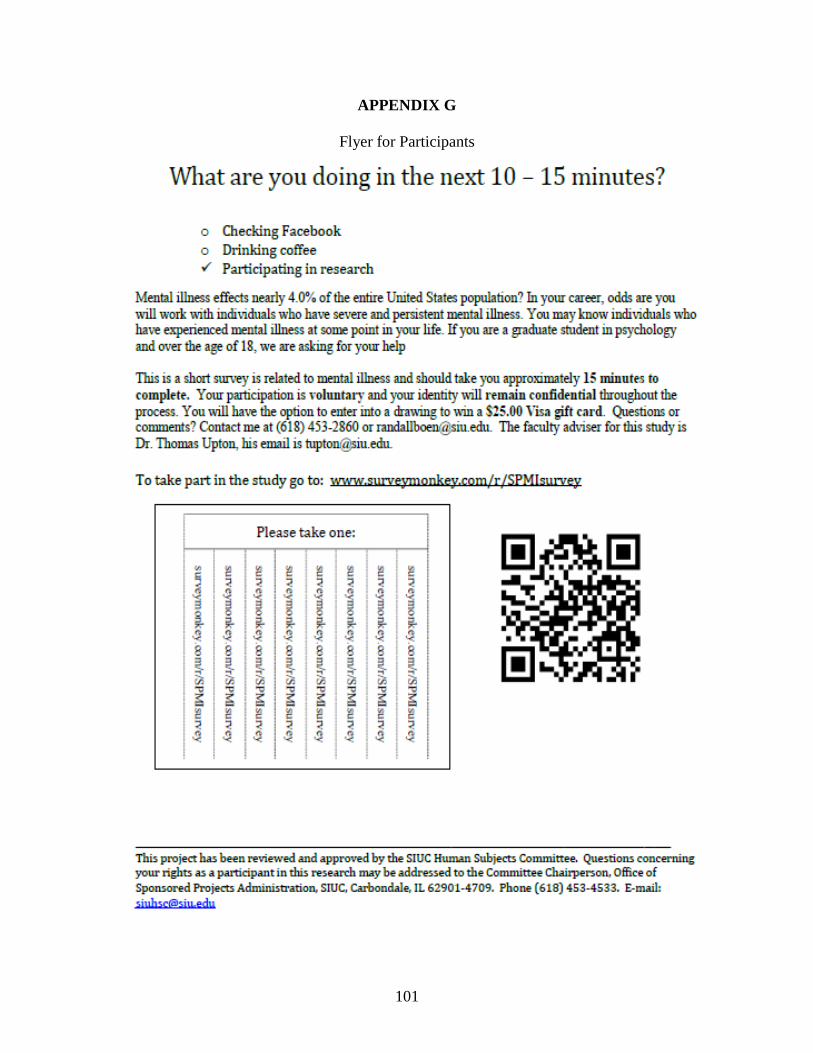
101
APPENDIX G
Flyer for Participants
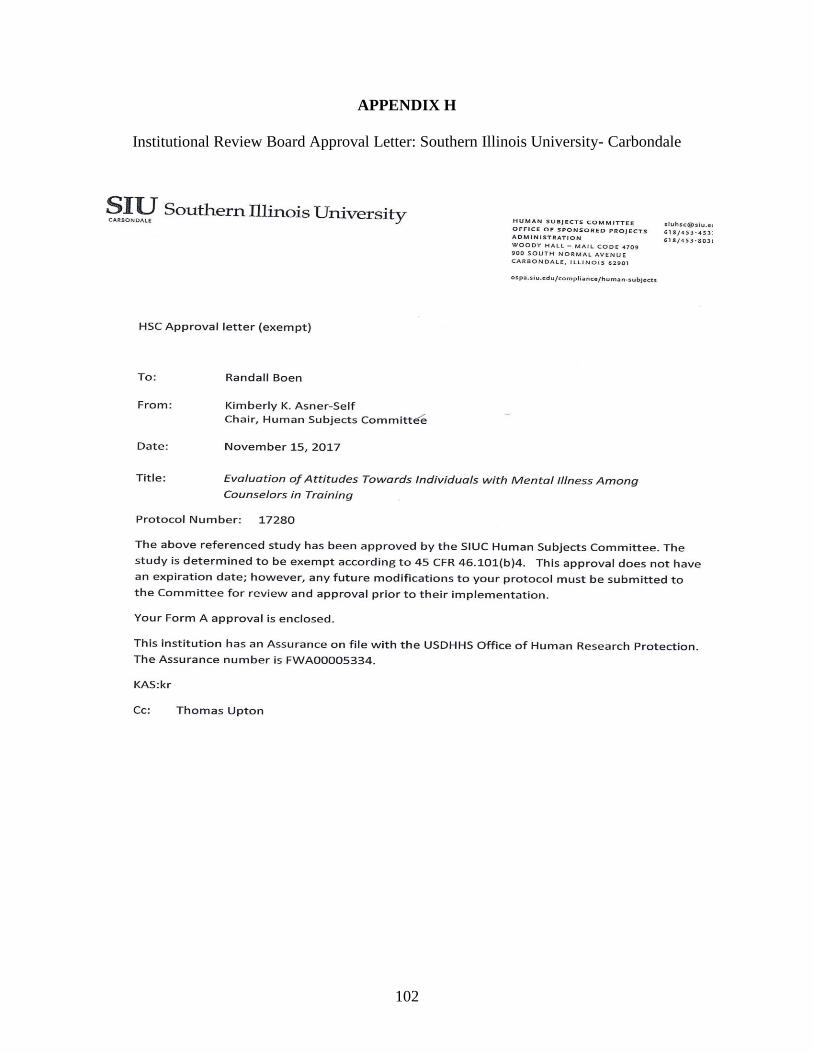
102
APPENDIX H
Institutional Review Board Approval Letter: Southern Illinois University- Carbondale
103
APPENDIX I
Institutional Review Board Approval Letter: Troy University
Appendi
May 25, 2018 Randall Boen Graduate Students Rehabilitation Institute Southern Illinois University Dear Researcher(s),
The Troy University Institutional Review Board has finished reviewing your application for: The Evaluation of Attitudes Towards Individuals with Mental Illness Among Counselors In Training (Protocol #201804011) and has approved your protocol, as is. This approval is good from May 25, 2018 until May 25, 2019. If you wish to
continue your research after this date, you must complete and submit a
Continuation Application. You are also responsible for immediately informing
the Institutional Review Board of any changes to your protocol, or of any
previously unforeseen risks to the research participants.
Please let me know if you have any questions.
Sincerely,
Dr. Tom Reiner
Institutional Review
Board
Adams Administration LL Rm 11 A
Troy, AL 36082
334-808-6294 Office 334-670-3912 Fax
http://www.troy.edu/i
nstitutionalreview
104
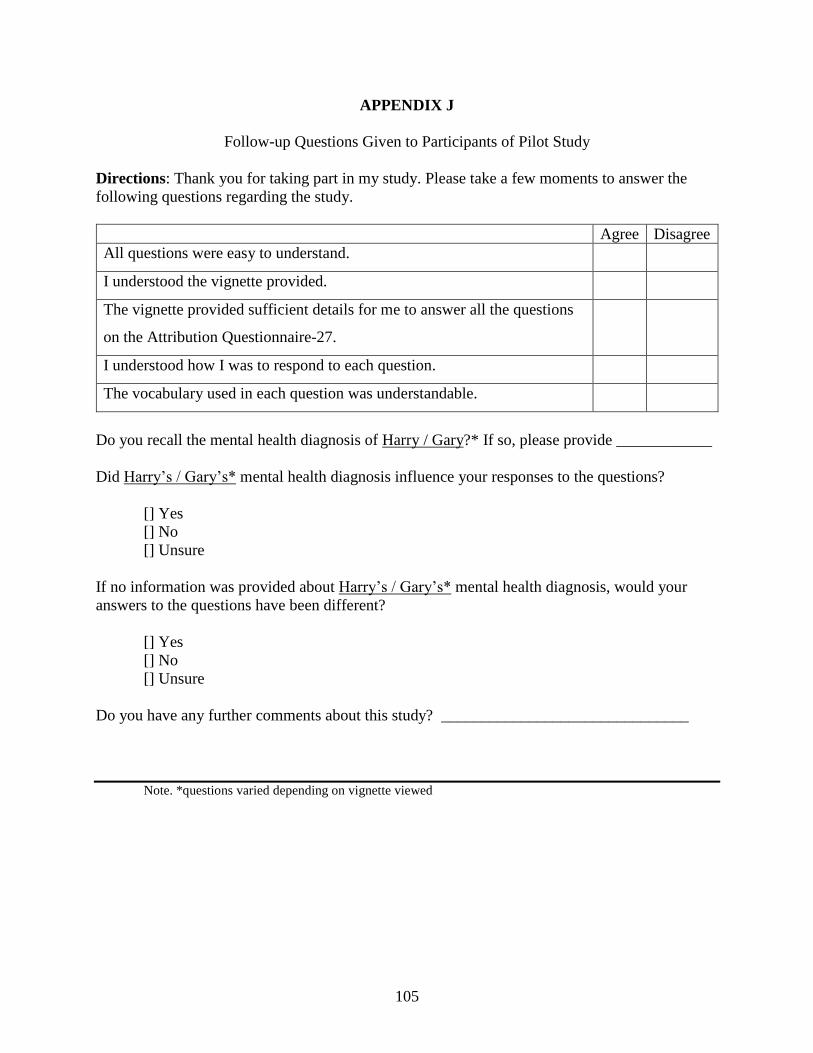
105
APPENDIX J
Follow-up Questions Given to Participants of Pilot Study
Directions: Thank you for taking part in my study. Please take a few moments to answer the
following questions regarding the study.
Agree Disagree
All questions were easy to understand.
I understood the vignette provided.
The vignette provided sufficient details for me to answer all the questions
on the Attribution Questionnaire-27.
I understood how I was to respond to each question.
The vocabulary used in each question was understandable.
Do you recall the mental health diagnosis of Harry / Gary?* If so, please provide ____________
Did Harry’s / Gary’s* mental health diagnosis influence your responses to the questions?
[] Yes
[] No
[] Unsure
If no information was provided about Harry’s / Gary’s* mental health diagnosis, would your
answers to the questions have been different?
[] Yes
[] No
[] Unsure
Do you have any further comments about this study? _______________________________
Note. *questions varied depending on vignette viewed
106
APPENDIX K
Permission from Dr. Patrick Corrigan to Use the AQ-27 and LOF Scales
107
APPENDIX L
Permission from Dr. Stephanie Kennedy to Use the MHPSI Scale
108
VITA
Graduate School
Southern Illinois University
Randall Boen
Bachelor of Science, Psychology, May 2010
Master of Science, Rehabilitation Counseling, May 2014
Special Honors and Awards:
Lorenz/ Baker Student Award SIU. 2013, 2017
Outstanding May Graduate in Psychology APSU. 2010
Most Valuable Member Award, Psi Chi /Psychology Club APSU. 2009
Dissertation title: The Evaluation of Attitudes towards Individuals with Mental Illness among
Rehabilitation Counselors in Training
Major Professor: Dr. Thomas Upton
Publications:
Boen, R., Anuar, A., & Ghazali, N. M. (in press). Cannabis use among adolescents with
specific learning disabilities. Rehabilitation Counselors and Educators Journal.
Boen, R., Knickmeyer, N., Upton, T., & Anuar, A. (2016). Questions of fairness: Perceptions
of educational accommodations by others in the classroom. Journal of Cognitive Sciences
and Human Development, 1, 99-109.
Boen, R. (2014). Evaluation of general and specific assistive technology knowledge among
students with disabilities in postsecondary environments. Theses. Paper 1431.