the evolution and determinants of the turkish private
TRANSCRIPT
Caroline Van RijckeghemMurat Üçer
ERF Research Report Series No. 09-01
The Evolution and Determinants of theTurkish Private Saving Rate:
What Lessons for Policy?


The Evolution and Determinants of theTurkish Private Saving Rate:
What Lessons for Policy?
Caroline Van Rijckeghem
Murat Üçer
February 2009(Publication No: EAF-RR/09-01)
Rumeli Feneri Yolu 34450 Sar›yer / Istanbul
Telephone (+90) 0212 338 18 34 • Fax: (+90) 0212 338 18 37
February 2009(Publication No: TÜS‹AD-T/2008-12/478)
Meflrutiyet Caddesi, No: 46 34420 Tepebafl› / Istanbul
Telephone (+90) 0212 249 19 29 • Fax: (+90) 0212 249 13 50

© 2009, TÜS‹AD
“All rights reserved. No part of this publication shall beprocessed/adapted, reproduced, circulated, re-sold, rent, lent,
represented, performed, recorded, transmitted with cord/cordless or anytechnical, digital and/or electronic devices without prior written
permission from the author(s)/right holder subject to Article 52 of LawNo.4110 amended by Law No.5846 for
Intellectual and Artistic Works.”
ISBN: 978-9944-405-50-8
M‹KADO MATBAACILIK ve Tic. Ltd. fiti.
Oto Sanayi Mah. ‹mam Çeflme Cad. G/47 Sokak No:6 Seyrantepe - Istanbul
Telephone (+90) 0212 289 27 93 Fax: (+90) 0212 289 08 96

FOREWORD
Economic Research Forum is a private, non-profit andnon-partisan research organization which was co-foundedin 2004 by Koç University and TÜS‹AD, the largest non-governmental organization of the Turkish private sector.Economic Research Forum aims to promote objective and independent economic analysis of major policy issues through academic and policy oriented research, analysis anddiscussion.
Economic Research Forum’s research areas encompass awide variety of issues concerning Turkish economy, with aspecial focus on the developments related with the EuropeanUnion’s economic integration process. The Forum attempts toanticipate emerging issues through workshops, seminars, andconferences, which aim to contribute to the public debate. An earlier version of this report has been presented at the ERFConference "Micro and Macro Perspectives on Private Savingsin Turkey", on June 11, 2008.


ABOUT THE AUTHORS
CAROLINE VAN RIJCKEGHEM
Caroline Van Rijckeghem is adjunct professor of economics at Sabanc› Universityand consultant for various international organizations. Previously, she was a senioreconomist at the IMF. She holds a BS from MIT and a PhD from UC Berkeley. Shehas published several academic papers in the areas of development economics andfinancial economics and is co-author (with M. Üçer) of a book on the Turkish financial crisis of 2000-01.
MURAT ÜÇER
Murat Üçer is the Global Source Advisor for Turkey and adjunct faculty at KoçUniversity. He held economist positions at several international institutions (including the Institute of International Finance, Credit Suisse First Boston, and International Monetary Fund) as well as various advisory positions in Turkey, including at the Turkish Treasury and the Central Bank of Turkey. He received hisBA and PhD in Economics from Bo¤aziçi University and Boston College, respectively.


ABSTRACT*
This study looks into the evolution and determinants of the saving rate in Turkey,with particular focus on private saving. After a brief literature review, it starts byputting the Turkish saving rate in an international context, by comparing Turkey toseveral country sub-groups of interest (e.g., advanced countries, emerging Asia,emerging Europe and Latin America). The data shows that Turkey’s private savingrate is low compared to other emerging market countries, but this is a recent phenomenon (other than in comparison with Asia) that reflects recent declines inthe Turkish savings rate. Using previous econometric studies on the determinantsof the private saving rate in Turkey and emerging markets in general, it explorespossible reasons for this recent decline. Some micro evidence based on householdsurveys complements this macro national income accounts perspective. The balance of the evidence suggests that the recent decline in private saving can beexplained by the recent rapid increase in credit along with sharp increases in housing prices. The report assesses the prospects by providing estimates of the positive impact of demographic trends on Turkey’s future saving rate. The studyconcludes with policy prescriptions.
We thank Kamil Y›lmaz, Andrei Meier, Christopher Carroll and our panelists Burcu Duygan-Bump, Hasan Ersel, Ayfle ‹mrohoro¤lu and ‹nsan Tunal›,and conference participants, in particular Memduh Karakullukçu and Seyfettin Gürsel, for helpful comments. Ali Gökhan, Derya Karakaya, andfiahika Tokel provided excellent assistance with stata programming, charts, and editing, respectively.
*

CONTENTS
1. Introduction...................................................................................................... 11
2. Literature Review: On the Micro and Macro Determinants of
Private Saving ................................................................................................... 17
2.1. Theories of household saving............................................................................. 19
2.2. Empirical findings on determinants of saving ................................................... 25
3. Turkish Saving Rate in International and Historical Context...................... 31
3.1. The Turkish Context ............................................................................................ 33
3.2. The International Context.................................................................................... 38
4. Possible Explanations for the Sharp Decline in the Private Saving Rate.... 43
5. Demographic Projections: How Much of a “Saving Bonus”
is Awaiting Turkey? .......................................................................................... 55
5.1. Method 1: Regression Analysis............................................................................ 59
5.2. Method 2: OECD Equivalency Scale................................................................... 61
6. Testing Hypotheses with Household Budget Survey Data ............................ 65
7. Policy Options .................................................................................................. 75
8. Conclusions ...................................................................................................... 81
Bibliography ..................................................................................................... 85
Appendix I: Inflation-Adjustment of Private and Public Saving .................. 89
Appendix II: Household Budget Survey Data: Under-Reporting.................. 91
9

List of Figures
Figure 1. Drivers of the Current Account (as % of GDP) .................................................13Figure 2. Unadjusted and Adjusted Savings Rates, new National Accounts Data
(as % of GDP) ..................................................................................................... 37Figure 3. Unadjusted and Adjusted Savings Ratios, 20 year perspective, SPO data
(as % of GDP) ..................................................................................................... 37Figure 4. National Saving Rates (as % of GDP)................................................................ 38Figure 5. National Saving Rates (as % of GDP)................................................................ 40Figure 6. Private Saving Rates (as % of GDP) .................................................................. 41Figure 7. Total Investment (as % of GDP)........................................................................ 42 Figure 8. Current Account Balance (as % of GDP) ...........................................................42Figure 9. CNBC-e Consumer Confidence Index (Jan-02=100)......................................... 46Figure 10. CBRT-TurkStat Consumer Confidence Index .................................................... 46Figure 11. Actual and Counterfactual Spending on Durables (Index).............................. 48Figure 12. Energy and Non-Energy Current Account Balance (as % of GDP)................. 49Figure 13. Balance Sheet of the Banking Sector (Share in total assets) ........................... 50 Figure 14. Collinearity between Public Savings and Real Interest Payments
(as % of GDP) ..................................................................................................... 51Figure 15. Retail Loans to Private Final Consumption Expenditures (%, share) .............. 52Figure 16. Consumer Loans and Individual Credit Cards (real y/y growth, %) ............... 52Figure 17. Turkey: Population Pyramids, 1980-2050.......................................................... 58Figure 18. Income and Spending by Household, 2005...................................................... 62Figure 19. Individual Income and Spending Over the Life-Cycle, 2005 ........................... 63Figure 20. Age Profile of Individual Savings, 2005 ............................................................ 63Figure 21. Simulated Private Savings Ratio (% disposable income).................................. 63
List of Tables
Table 1. Group Household Savings Rates, Characteristics of Household Head ......................................................................68
Table 2. Survey Probit Regression: Probability of Health Expenditures > 10% of Spending, 2004-05 .................................................................................72
Table 3. Survey Instrumental Variables Regression: Savings/Disposable Income ..................................................................................73
Boxes
Box 1. Data Issues ................................................................................................................ 35Box 2. The Chinese Saving Rate ......................................................................................... 39
10

1S E C T I O N
INTRODUCTION

INTRODUCTION*
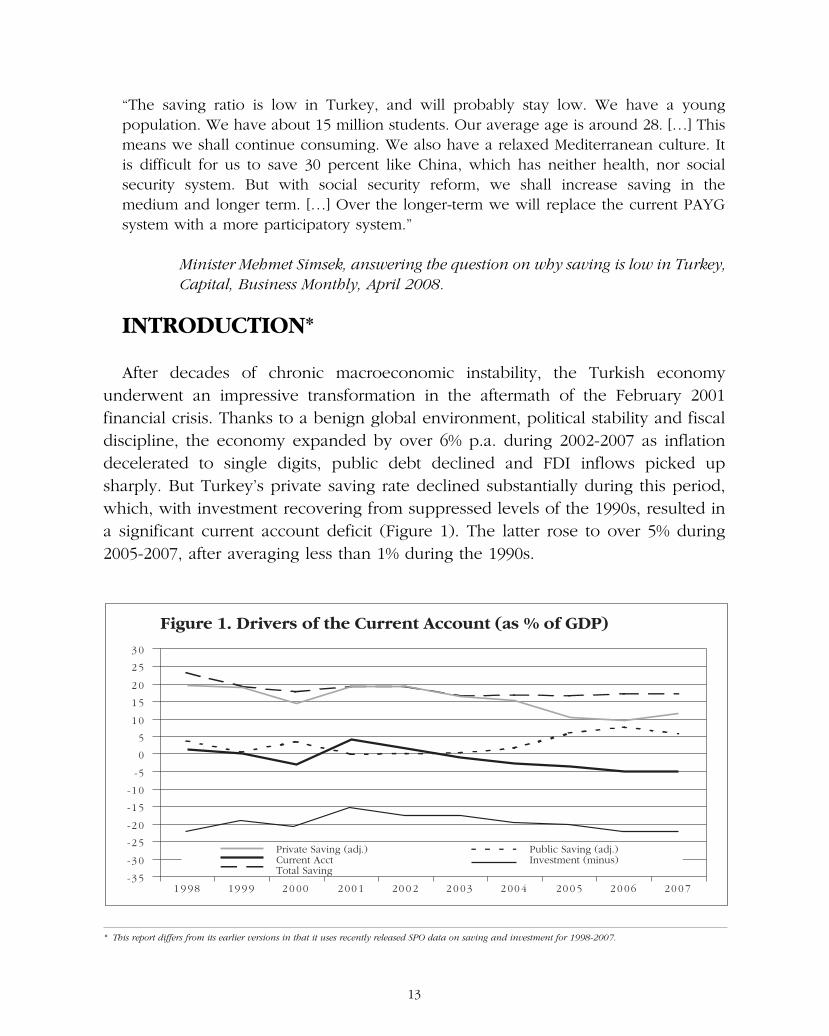
After decades of chronic macroeconomic instability, the Turkish economy underwent an impressive transformation in the aftermath of the February 2001 financial crisis. Thanks to a benign global environment, political stability and fiscaldiscipline, the economy expanded by over 6% p.a. during 2002-2007 as inflation decelerated to single digits, public debt declined and FDI inflows picked upsharply. But Turkey’s private saving rate declined substantially during this period,which, with investment recovering from suppressed levels of the 1990s, resulted ina significant current account deficit (Figure 1). The latter rose to over 5% during2005-2007, after averaging less than 1% during the 1990s.
“The saving ratio is low in Turkey, and will probably stay low. We have a young population. We have about 15 million students. Our average age is around 28. […] Thismeans we shall continue consuming. We also have a relaxed Mediterranean culture. Itis difficult for us to save 30 percent like China, which has neither health, nor social security system. But with social security reform, we shall increase saving in the medium and longer term. […] Over the longer-term we will replace the current PAYGsystem with a more participatory system.”
Minister Mehmet Simsek, answering the question on why saving is low in Turkey,Capital, Business Monthly, April 2008.
13
Figure 1. Drivers of the Current Account (as % of GDP)
-3 5
-3 0
-2 5
-2 0
-1 5
-1 0
-5
0
5
1 0
1 5
2 0
2 5
3 0
1 9 98 19 9 9 2 0 00 2 00 1 20 0 2 2 0 03 2 00 4 20 0 5 2 0 06 20 0 7
Private Saving (adj.)Current AcctTotal Saving
Public Saving (adj.)Investment (minus)
* This report differs from its earlier versions in that it uses recently released SPO data on saving and investment for 1998-2007.
1 Net international investment position is the difference between external assets and liabilities of a country, vis-à-vis non-residents, and is equal to cumulative current account balances, plus valuation changes on the stock.
2 For more on this, the readers should refer to the well-known literature on “sudden stops” and “current account reversals”.
But why should we be concerned at all? First, domestic saving is a way to accumulate wealth over time and raise living standards in the future. In essence, thechoice is between consumption today and consumption tomorrow. The question,then, is whether there is any distortion to incentives to save that may cause sub-optimal saving, i.e., place an inordinate emphasis on consumption now, ratherthan later. It is somewhat difficult to argue that this is the case in Turkey, since real interest rates, an important parameter in this intertemporal decision, have been high—and remain high by international standards—and therefore policy interventions do not seem justified from this perspective.
A second, and a much more pertinent concern for Turkey, relates to the above-mentioned current account dynamics. That is, sustained low saving relativeto investment translates into persistent current account deficits (CAD) and a steadilydeteriorating international investment position.1 This then leads to an increase overtime in net factor payments to abroad (on account of interest and dividend repatriation), thereby sustaining the deterioration in the CAD, and creating a political backlash at some point. More imminently, the current account deficit is recognized as a key source of vulnerability, as it, by definition, signals reliance onforeign financing, or international investors’ willingness to finance the deficit. In theevent of capital outflows, such reliance on foreign capital forces an abrupt adjustment upon the economy, through a large depreciation and contraction in domestic demand.2 These negative externalities may be a justification for policy intervention to raise the domestic saving rate. Moreover, home-grown domestic savings act as a catalyst for attracting FDI while strong reliance on external financing may erode competitiveness through an overvalued currency, providingadditional motives for wanting to stimulate domestic saving (IMF, 2007).
Finally, a high saving rate may be instrumental in maintaining high growth ratesthrough its impact on investment. In neoclassical growth models, high saving is associated with high growth in the transition to a new steady state, whereas in endogenous growth models, high saving can have a permanent impact on growth(see e.g. Barro and Sala-i-Martin, 1995). However, empirical evidence suggests thatsaving may have a limited effect on growth (e.g., Carroll and Weil, 1994; Rodrik,
14

2000). For example, Rodrik (2000) concludes that, “while growth transitions leadto sustained increases in saving rates, saving transitions tend to result only in temporary increases in growth.” Thus, growth may drive rather than follow high saving.3
The report is structured as follows. We start with a brief review of the theoreti-cal literature and its predictions for the effect of key variables on the saving rate,such as growth prospects, liquidity, interest rates, terms of trade, public saving and demographics, and then summarize main findings from the empirical literature onthe effect of these key variables (Section 2). We then proceed to establish the relevant stylized facts for Turkey (Section 3), and ask why the saving rate has fallen dramatically during the last boom episode, by examining the “usual suspects”,suggested by the theoretical and empirical literature (Section 4). In Section 5, wecalculate, using three methods, the increase in saving likely to result from Turkey’sprojected improved demographics (i.e., a substantial decline in the youth dependency ratio over the next few decades). Section 6 presents the result of research based on household data from the household budget surveys of 2004 and2005, where we check changes over time in saving rates across demographic groups and estimate equations of household saving. In Section 7, we surmise onpolicy measures that could help to raise the national saving rate. Section 8 concludes.
3 This conclusion is based on event-studies as well as Granger causality tests for a sample of 20 countries that experienced saving transitions since the 1960s(a sustained increase of 5 percentage points or more in the ratio of national saving to national income) and a sample of 18 countries that experienced growth transitions (defined as a sustained increase in the growth rate of 2.5 percentage points or more).
15


2S E C T I O N
LITERATURE REVIEW:
ON THE MICRO AND MACRO
DETERMINANTS OF PRIVATE SAVING


LITERATURE REVIEW: ON THE MICRO AND MACRO DETERMINANTS OF PRIVATE SAVING
In this section, we review both the theoretical and empirical literature on the determinants of the saving rate to set the stage for the discussion to follow in theremainder of this report. We first review the main theories of household saving andtheir predictions for the effect of key macroeconomic and demographic variableson household saving. We then report findings from available comprehensive studies as well as some more recent ones of particular interest.
Private saving is the sum of household and corporate savings. The literature oncorporate saving is less well-developed, and in fact, most studies of private savinghardly refer to corporate saving. Because data is not publicly available on corporate saving in Turkey, we concentrate on total private and household savingin this report.
2.1. Theories of household saving
Modern consumption theory starts with the presumption that consumers like tosmooth out consumption over time, whether over the life-cycle (Modigliani-Brumberg, 1954) or in the face of temporary fluctuations to income (thepermanent income hypothesis of Friedman, 1957). Models have become increasingly realistic over time, with the recognition of a precautionary saving motive (for risk-averse consumers), liquidity constraints, and hyperbolic discounting. “Buffer-stock saving” models, which combine a precautionary savingmotive with impatient consumers, fit many stylized facts well.4 We discuss these various models briefly below, with special focus on what they may have to say onfactors at play in the case of Turkey, notably demographic transition; terms of trade; government saving; growth; interest rates; liquidity, in particular the role ofrevolving credit; and wealth effects.
Life-cycle saving (Modigliani-Brumberg, 1954): This theory suggests that consumers smooth consumption over a life-time. As a result saving will be highwhen incomes are high (during working-age), and there will be dissaving after retirement.5 In the absence of a bequest motive, saving of any individual is zero
19
4 The literature on household saving is well-developed, and can be found in standard textbooks such as Romer (2001).5 In the presence of social security arrangements, private pension schemes, or family support networks, income is smoother over a life-time than it would be
in the absence of these schemes. This obviates the need for saving and dissaving over the life-cycle. On this basis, we would expect higher saving in rural areas and in the informal sector.

over a life-cycle. And in the absence of growth or demographic change, aggregatesaving will be zero as well. Yet, growth and changes in the population structure have implications for aggregate saving. If productivity growth makes the youngricher than the old, saving by the young (who now need to finance higher consumption after retirement) will be greater than dissaving by the old. Thus, aggregate saving will increase with growth. This is referred to as the Modigliani’s“aggregation effect”. This feature of life-cycle saving is often invoked to explain thestrong empirical correlation between growth and saving.
Similarly, aggregate saving is affected by demographic transition, i.e. the decline in mortality and fertility rates. Life-cycle theories predict a rise in saving asthe youth-dependency ratio declines in the latter stages of demographictransition (Lee and Mason, 2006). There are three phases in demographic transition. Early on, mortality falls, which leads to more surviving children. This cancause saving to decline. In the intermediate phase, as fertility continues to decline,the youth-dependency ratio declines. The resources that are freed as a result (andwhich could be saved or consumed) are called the first demographic dividend.6 Inthe late phase, an older working-age population, which also faces greater longevityand can no longer rely on children to take care for them in old age, saves to accumulate assets for retirement, unless it believes government will provide for itsneeds. This increase in saving is called the second demographic dividend.7 In Section 5 of the report, we use these predictions to extrapolate the Turkish savingrate into the future.
The life-cycle hypothesis also predicts that windfall gains on wealth (e.g., a risein the stock market or housing prices) will be consumed over the remainder of thelife-time. This wealth effect is in theory different for housing and financial assets,and depends on age, being stronger for the elderly for whom the windfall wouldbe consumed in fewer years. Some have suggested that housing wealth isn’t wealth
20
6 Formally, if adults with households with fewer children have more resources available over a life-time, and these additional resources are consumed by the adults themselves (rather than on children’s education for example), consumption smoothing implies that consumption will also be higher after retirement, and hence saving for retirement will have to be higher (Attanasio, Banks, Meghir and Weber, 1999; Scholt, Seshadri, and Khitatrakun, 2006;Skinner, 2007). While such persons will spend more (and dissave more) after retirement, this effect will not be felt until later, and savings increases during the transition. A caveat here is that parents may well use these resources for their children (e.g. education) rather than themselves, that is, theywould tend to substitute the quality of children for quantity. In that case there would be no need for greater retirement saving to allow consumption smoothing.
7 Formally, children are a substitute for monetized saving, because they make transfers to their parents in old age (the household demand model; see Schultz, 2004). This means that adults who have fewer children now need to provide for their retirement themselves. Such adults will dissave more after retirement, but this effect again will not be felt for a while, so that aggregate saving increases in the transition. The impact on saving is accentuated as the result of greater longevity, which implies a need for higher assets to finance retirement.

(Buiter, 2006), because cashing in on this wealth requires downsizing to smaller orless well-located housing. Only those “long” housing, in the sense that they (planto) use less housing services than they own, are better off when house prices increase (e.g., the elderly). Families who don’t own their home, or who plan topurchase a larger home, are worse off. These implications are testable in the Turkish case by comparing saving of households who own their home with thosewho don’t. Economy-wide, there will only be a positive effect of higher house prices on consumption, if households are, on average, “long” housing.
Permanent-income hypothesis or PIH (Friedman, 1957): In this theory, consumption equals permanent (as opposed to current) income, which takes intoaccount longer-term income expectations, and hence is relatively smooth.Transitory income shocks have only a small impact on consumption, and are mostly absorbed as saving or dissaving.
A well-known testable implication of the permanent income hypothesis is thatmovements in saving should anticipate movements in income (Campbell, 1987), i.e.people should save when they expect their incomes to decline in the future, anddissave (or save less) when they expect them to increase. This follows directly fromthe consumption smoothing motive, i.e. high saving today being necessary to allowconsumption to remain unchanged when incomes fall in the future. Brought to thedata, the implication is that saving will decline when consumer confidence ishigh. We will use this approach later in the Turkish context. Furthermore, whencurrent growth is considered an indication of future growth, people will expect future income to be greater than income today, and will dissave, following the same argument as above. Put differently, growth today and in the future will raise permanent income (and consumption) more than it raises current income, depressing saving. This logic applies to workers with a substantial fraction of their working life ahead of them. For older workers, permanent income will notchange much in response to higher growth, resulting in little change in consumption. For those workers, growth in current incomes then increases saving(Jappelli and Pagano, 1997, provide a good exposition; see also Carroll and Weil,1994).
The PIH also suggests that effects of changes in the terms of trade (hence in incomes) on consumption will be smoothed over time, if these changes are
21
expected to be temporary, and will be absorbed as changes in saving. For example, saving will decline in response to a temporary negative terms of tradeshock, but then recover after the shock is over. In contrast, consumption fully responds to a permanent decline in the terms of trade, with no impact on saving.
The PIH, under certain assumptions, implies “Ricardian equivalence”—the ideathat private saving will offset changes in public saving one for one. If public saving increases because of higher taxes (or lower transfers), but this is expected tolead to lower future taxes, agents’ life-time budget constraint, and hence consumption is unaffected and private saving (disposable income less consumption) declines. If public saving increases because of lower spending andthis cut in spending is expected to be permanent, agents have higher life-timeresources and increase private consumption by an amount equal to the reduction inpublic spending. Private saving again declines. According to the theory, agents alsoadjust their bequests to offset the effect of future taxes on future generations(Barro, 1974). However, the PIH only holds in the absence of liquidity constraints,when agents are risk-neutral (or are able to insure against risk at actuarial cost),government spending is unproductive, taxes are lump-sum and agents plan to leave bequests. It also requires changes in government spending to be permanent,and changes in taxes not to lead to offsetting changes in spending over time.These assumptions are rarely met in the real world, but Ricardian equivalence issuch a persuasive theoretical concept that it often surfaces as an explanation for theinverse relationship between public and private saving rates.8
The impact of changes in the real interest rate is typically studied in a simple two-period version of this model, in which agents either borrow or lend in a first period as a function of the path of their labor income (e.g., borrowing if incomesare increasing) and interest rates. While one might intuitively think that increases ininterest rates will lead to increases in saving, this is not necessarily the case because changes in interest rates have both a substitution and an income effect. Anincrease in interest rates makes delaying consumption more attractive (the substitution effect). This effect goes in the same direction for lenders and borrowers, that is, both will tend to save more (borrow less) in the initial periodwhen interest rates increase. This is the effect one intuitively expects.
22
8 When these assumptions are not met (e.g. when there is precautionary saving and taxes are a function of income), a cut in taxes today financed by future taxes will lead to some increase in consumption today (and the offset between public and private saving will be less than one for one). This is due to thefact that income taxes reduce the volatility of future (after-tax) income, therefore reducing the need for precautionary saving. Similarly, when some households plan not to leave bequests, they will raise their consumption in the face of a tax cut, which is to be financed by higher taxes on future generations.

But there is also an income effect on consumption, which affects borrowers andlenders differently. The income effect of an increase in interest rates is positive forthose lenders, who now earn more interest income and hence can consume morein both periods, and negative for borrowers, who have to pay more interest. Overall, the impact of an increase in interest rates on consumption in the initial period is uncertain for lenders, and negative for borrowers (they will consume lessand borrow less). Another interesting aspect is the responsiveness of saving to interest rates at low levels of income. Increasing saving in response to higher interest rates is difficult when incomes are already near subsistence since first period consumption cannot be compressed (Ogaki, Ostry, Reinhart, 1996). Intertemporal substitution is almost impossible and the substitution effect non-existent.9
Precautionary saving: In this theory, households save because they are risk-averse, i.e. the greater the uncertainty about future income, the greater the saving (see Romer, 2001 for a good exposition). Inflation is often used, in studiesof private saving, as a proxy for uncertainty about future income. Rural incomesmay be more uncertain than urban ones, in which case precautionary saving would fall with urbanization. Precautionary saving incidentally is one reason for notobserving a rundown of wealth to zero during old age (in addition to a bequestmotive): wealth (in the form of home ownership, for instance) is insurance againsta catastrophic event. Since people do not know when they will pass away, on average people die leaving bequests.
Liquidity constraints: In this theory, households save more when they are liquidity-constrained. Liquidity constraints act both directly to restrict consumptionbelow what consumption smoothing implies, and indirectly, as the possibility of theliquidity constraint becoming binding in the future makes shifting resources to thefuture (saving) more desirable. A relaxation of liquidity constraints makes higherconsumption in the present possible, but at the expense of lower consumption inthe future. Liquidity constraints are captured by the amount of credit available inthe economy, and sometimes by variables such as loan-to-value ratios for home purchases.10 The amount of credit available in the economy is likely influenced by
23
9 In technical terms, the marginal utility of income is very high around subsistence levels, hence the willingness to substitute consumption over time is very low. With consumption tracking income closely, there is also no income effect.
10 See e.g. Jappelli and Pagano (1994).
housing prices, if higher collateral improves access to credit (e.g., through homeequity loans). Households may wish to access additional credit resulting from higher house prices (i.e., withdraw equity from their homes) if they were credit-constrained before.
Buffer-stock saving: Such models combine a precautionary saving motive, impatience and sometimes a liquidity constraint (Deaton, 1991; Carroll, 1992, 2001,2004). Households target a wealth/permanent income ratio to act as a buffer in case of adverse income developments. More patient households and householdswhich are more risk-averse or face higher uncertainty target a higher wealth/income ratio. Factors that reduce the need for precautionary wealth—suchas lower uncertainty or a relaxation of liquidity constraints or a positive shockto wealth—lead to dissaving, until the new target wealth is reached. After the target is reached, precautionary saving continues as before. These factors thereforehave only a temporary effect on saving, albeit one that could last several years (Carroll, 2001; Carroll et. al., 2006).
Buffer-stock saving models match certain features of the data well, notably theclose correlation between consumption and income growth; the fact that most households save little, and that wealth is concentrated; and the correlation between wealth holdings and uncertainty. The buffer-stock model of saving seemsto explain saving behavior for ages between mid-20s to mid-40s (Gourinchas and Parker, 2002).
Hyperbolic discounting: Hyperbolic discounting refers to a situation where people simultaneously use a high discount rate for discounting the near future anda low discount rate for discounting the distant future, i.e. they act impatient whendiscounting the near future, but patient when discounting the far future. For instance, when offered the choice between $50 now and $100 a year from now,many people will choose the immediate $50. However, given the choice between$50 in five years, or $100 in six years, almost everyone will choose $100 in six years, even though that is the same choice seen at five years' greater distance. Thisalso means preferences are dynamically inconsistent: After 5 years, people will reverse their preferences, prefering $50 in year five over $100 in year six. Hyperbolic discounting helps to explain seemingly irrational behavior, such asprocrastination and impulsive behavior (lack of self-control). Importantly in our context, it also helps to explain over-use of credit card (over-use in the sense that
24
people will eventually regret having taken on credit) and helps to explain why widespread availability of credit cards reduces saving even of those who are not liquidity-constrained (i.e., those who have financial assets) in the first place (Laibson, 1997).
Habit persistence: When real income increases (decreases), spending may notrise (fall) immediately; or when taxes increase, reducing disposable income, spending may not decline (Carroll, Overland and Wei, 2000). Habit persistence explains the stylized fact of sluggishness in consumption. Persistence in consumption habits causes a temporary decline in saving in case of a temporarynegative shock (as under the PIH), but also implies a reduction in saving which persists for some time in the case of a permanent negative shock (unlike under thePIH where saving does not respond to a permanent shock). Persistence in consumption habits is also consistent with the correlation between growth and saving because growth in incomes is not immediately followed by growth in spending. Habit persistence also implies a negative relationship between public andprivate saving, when private consumption is persistent in the face of a change intaxes. Thus, an increase in taxes (an increase in public saving), which reduces disposable income, will be associated with a reduction in private saving if consumption is persistent.
2.2. Empirical findings on determinants of saving
Several researchers have developed the insights gained from the household saving theories into an empirically-motivated macro literature, focusing on the determinants of both within—and cross-country variance across saving rates. Themost comprehensive effort to date on saving is by the World Bank “Saving Acrossthe World.” The project aimed to explain the variation in savings rates across countries; to establish the direction of causality between saving and growth (theabove-mentioned study by Rodrik, 2000 forms part of the study); and to draw policy implications on how to raise national saving rates. The study includes anoverview chapter (Loayza, Schmidt-Hebbel, and Servén, 2000a; henceforth LSS),which reviews earlier studies in the literature, as well as a comprehensive panel-data analysis of determinants of private saving, covering 150 countries overthe period 1965-1994, and estimated with system GMM (Loayza, Schmidt-Hebbel,and Servén, 2000b). Private savings data in this study is inflation-adjusted, as it should be.
25

Another comprehensive panel-data study on (national) saving is provided byIMF (2005). Two studies focus specifically on Turkey, by Ozcan, Gunay, and Ertac(2003) (henceforth OGE) covering the period 1968-1994, and by IMF (2007) covering the period 1980-2005. Both studies report results for unadjusted and inflation-adjusted private saving rates, but we focus on the latter below. In what follows, we draw extensively on the overview chapter in LSS and literature reviewin IMF (2007), as well as the subset of results of LSS for developing countries andthe subset of results for IMF (2005) for emerging markets.
Income
All studies reviewed above as well as those contained in the various literaturesurveys find this variable to be an important determinant of savings. Higher GDPper capita is associated with a higher saving/GDP ratio in these studies.
Growth
Studies typically find a statistically positive and significant effect for real per capita GDP growth on savings. This is the case for the panel-data studies of LSS,IMF (2005) as well as several earlier studies.11 The findings of a positive coefficienton growth are consistent with various theories (e.g, Modigliani’s aggregation effect,habit formation). Other methods confirm this finding as well. Carroll and Weil(1994) provide evidence based on US household data that predictable growth inearnings is associated with higher saving among the young. This is the opposite ofwhat one would expect for the young, and the authors suggest that habit formation along with uncertainty about future earnings is responsible for this result.Rodrik (2000) studies “growth transitions”, that is transitions from low to highgrowth rates, and finds that “growth transitions tend to be followed by significant,and sustained, improvements in saving performance.” He does not, however, specify the mechanism by which growth may be driving saving. For Turkey, studies differ in their findings, with no statistically significant effect in OGE, but astatistically significant and large positive coefficient in IMF (2007).
Terms of trade
Studies consistently find a positive coefficient on terms of trade improvements
26
11 This is however not the case for all studies, for example Haque, Pesaran and Sharma (1999). See Loayza et. al. (2000a), De Serres and Pelgrin (2002), and IMF (2007) for surveys of results of a large number of panel-data studies.

(LSS, IMF (2005), and all studies reviewed therein). As noted in the theoretical literature above, this is what one would expect when terms of trade movements have a temporary nature. OGE finds this result for Turkey,12 but it is not confirmedin IMF (2007).
Inflation
A few studies find a positive coefficient on inflation (LSS; Masson, Bayoumi, andSamiei, 1998). Inflation is a measure of uncertainty, and this result is interpreted asbeing consistent with a precautionary motive for saving. OGE and IMF (2005) alsofind this effect for Turkey.
Credit
Credit tends to be statistically significant in empirical studies, but they differ onthe specific form —level of credit/GDP vs. change in credit/GDP— which turns outto be pertinent. For instance, LSS find a statistically significant role for the level of credit/GDP, whereas IMF (2005) finds a role for its change. Finding a role for thelevel implies that liquidity constraints matter for saving, whereas finding a role onlyfor the change in credit/GDP ratio implies that liquidity constraints do not matter,other than when they change. The first result is consistent with standard models ofliquidity constraints, whereas the second result is what one would expect from buffer-stock saving models (Carroll, 2008, emphasizes this point). In that case, a relaxation of liquidity constraints means target wealth can be less, and wealth willbe drawn down in the transition to a new steady state. After reaching that new steady state, saving recovers.
For Turkey, studies vary in their findings. OGE found a role for the level of credit/GDP ratio in a restricted regression which excluded, inter alia, governmentsaving and inflation. IMF (2005) found that the coefficient on the change in credit/GDP ratio was not statistically significant. We believe this latter result couldbe caused by multi-collinearity however, since variables highly correlated with credit, such as public savings and inflation, are controlled for in the regression (an issue we turn to in Section 4 below).
27
12 It may be worthwhile adding that OGE considers various definitions for government, with implications for the coverage of private saving. They find a statistically significant effect for the terms of trade in the specification where government is defined as central government, but not where governmentis defined as the non-financial public sector.
Gross and Souleles (2002) provide additional detail on the role of credit. Theyfind that increases in credit limits lead to an immediate rise in debt, and that, consistent with the buffer-stock saving hypothesis even people starting well belowtheir credit limit, respond to the increase in limits.
Real interest rate
Knowing the impact of real interest rates is crucial for informing policy on stimulating saving (for instance, to answer questions, such as whether raising theafter-tax rate of return through tax measures would succeed in raising private savings). As noted before, its impact is ambiguous in theory and depends on therelative magnitude of the substitution and income effects. The real interest rate does not have a statistically significant effect in most studies (LSS and studies citedtherein and in IMF, 2007). An exception of a study which finds a positive coefficient is Masson et. al. (1998). Both studies on Turkey also do not find a statistically significant coefficient on the real interest rate.
Further insights are gained by Ogaki, Ostry, and Reinhart (1996), who study theintertemporal rate of substitution (the willingness to substitute consumption overtime) at different levels of income. The authors find evidence that the intertemporalrate of substitution is low at low levels of income. The authors’ interpretation is that,saving cannot respond positively to interest rates in poor countries, because first period consumption cannot fall below subsistence levels.13 This provides an explanation for the lack of responsiveness of saving to interest rates in episodes of“financial liberalization” (freeing of deposit rates) in low-income countries as wellas for the statistical insignificance of the real interest rate in panel data studies focusing on developing countries.
Wealth
Wealth is not studied explicitly in the panel-data studies reviewed so far, but other studies are available. These studies suggest the existence of a wealth effecton consumption.14 Studies find a medium-term marginal propensity to consume outof housing wealth in the range of 0.04-0.10 and 0.04-0.07 for stock market wealth.As expected, the effect is stronger for the elderly. Studies disagree on whether theeffect is stronger for housing or financial wealth.15 It is also not clear how long the
28
13 The marginal utility of income is very high around subsistence levels, hence the willingness to substitute consumption over time is very low. 14 Carroll et. al. (2006); Funke (2002), and Sierminska and Takhtamanova (2007) provide good overviews.15 For instance, Ludwig and Sløk (2002) estimate a larger effect of stock wealth than housing wealth in a panel of 16 OECD countries, whereas Carroll et.
al. (2006) and Sierminska and Takhtamanova (2007) find the opposite.

wealth effect lasts. Some studies find that the wealth effect of stock market pricesdisappears over 1-3 years (as cited in Funke, 2002). We are not aware of any studyon the role of the wealth effect in Turkey.
Government saving
An increase in government saving is associated with lower private saving in allpanel-data studies (LSS, IMF, 2005; all studies reviewed in LSS and IMF, 2007). However, offsets are far from complete for developing countries. For instance, LSSand IMF (2005) find offsets of -0.5 and -0.2, respectively, so that a one percentage point increase in public saving succeeds in raising total saving by 0.5-0.8 percentage point. The (partial) offsets could reflect Ricardian effects (e.g., a reduction in private saving in anticipation of lower future taxes), but as discussedin the literature review above, might also be the result of a multitude of factors suchas habit formation (e.g., unchanged consumption levels despite higher taxes), theeffect of goverment borrowing on credit availability to the private sector and realinterest rates, or a reduced need for private saving in response to the introductionof programs such as social security or unemployment insurance funded by socialsecurity taxes.
OGE (in one specification16) and IMF (2007) also find offsets to public saving forTurkey. Both studies find very high long-run coefficients on public saving, that is,very high offsets by private of public saving, on which we say more below in Section 4. OGE finds a long-run coefficient on public saving of -1.2 (implying private saving falls more than public saving rises) and IMF (2007) finds -0.7. Thesefindings, taken at face value, suggest that an increase in government saving will fail to raise overall saving by much in Turkey.
Demographics
Many studies find evidence of an impact of the youth and old-age dependency ratios (the ratio of the young or old to working-age population). For the youth-dependency ratio, LSS estimates that a 1 percentage point reduction in this ratio is associated with a 0.3 percentage point increase in the saving rate in the short-run (0.5 percentage points in the long-run17). The corresponding figures are1.4 and 2.8 for the old-age dependency ratio. These variables were not significantin the Turkey-specific studies, but this is not too surprising, given the lack of variance in the series.
29
16 The specification that excludes growth, credit and the current account, and defines government as the non-financial public sector.17 Long-run coefficient is calculated as the short-run coefficient divided by one minus the coefficient on lagged saving.

3S E C T I O N
TURKISH SAVING RATE IN
INTERNATIONAL AND HISTORICAL
CONTEXT

TURKISH SAVING RATE IN INTERNATIONAL ANDHISTORICAL CONTEXT
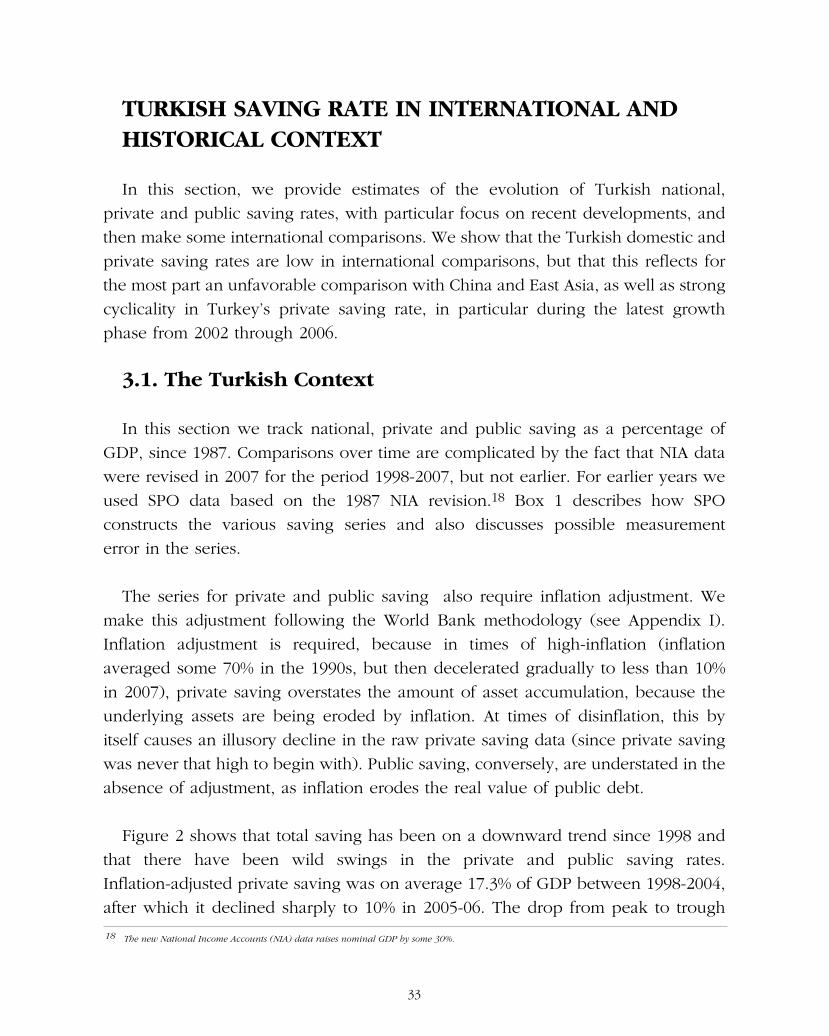
In this section, we provide estimates of the evolution of Turkish national, private and public saving rates, with particular focus on recent developments, andthen make some international comparisons. We show that the Turkish domestic andprivate saving rates are low in international comparisons, but that this reflects forthe most part an unfavorable comparison with China and East Asia, as well as strongcyclicality in Turkey’s private saving rate, in particular during the latest growth phase from 2002 through 2006.
3.1. The Turkish Context
In this section we track national, private and public saving as a percentage ofGDP, since 1987. Comparisons over time are complicated by the fact that NIA datawere revised in 2007 for the period 1998-2007, but not earlier. For earlier years weused SPO data based on the 1987 NIA revision.18 Box 1 describes how SPO constructs the various saving series and also discusses possible measurement error in the series.
The series for private and public saving also require inflation adjustment. Wemake this adjustment following the World Bank methodology (see Appendix I). Inflation adjustment is required, because in times of high-inflation (inflation averaged some 70% in the 1990s, but then decelerated gradually to less than 10%in 2007), private saving overstates the amount of asset accumulation, because theunderlying assets are being eroded by inflation. At times of disinflation, this by itself causes an illusory decline in the raw private saving data (since private savingwas never that high to begin with). Public saving, conversely, are understated in theabsence of adjustment, as inflation erodes the real value of public debt.
Figure 2 shows that total saving has been on a downward trend since 1998 andthat there have been wild swings in the private and public saving rates. Inflation-adjusted private saving was on average 17.3% of GDP between 1998-2004,after which it declined sharply to 10% in 2005-06. The drop from peak to trough
33
18 The new National Income Accounts (NIA) data raises nominal GDP by some 30%.
between 2001-06 was 9% of GDP. Inflation-adjusted private saving then increasedin 2007 to 11.4% of GDP. Private and public saving rates are practically mirror images of each other.
Figure 3 provides longer-term trends for total saving and inflation-adjusted private and public saving since 1987. The figure is based on SPO data based on the1987 revision for data up to 1997 and the 2007 revision thereafter. That means there is a break in the data in 1998, given important revisions to investment, current account, and GDP in the 2007 NIA revision. It reveals a downward trend intotal saving driven by declining public saving until 2001 and private saving thereafter. Private inflation-adjusted saving is clearly below its long-term historicalaverage in 2005-06 (10% versus 17.1% average for 1987-2004, and inflation-adjusted public saving above its historical average (6.3% versus 4%)).
34

35
Box 1. Data Issues
Turkish National Income Accounts have been revised in early 2008 (the “2007 revision”). New series (1998-present) replaced outdated old series (1987-2006). The NIA now provide only GDP not GNP or GNDI(gross national disposable income). Data on saving and its composition were made available by SPO atend-2008. SPO’s methodology takes the NIA data as a basis, and makes a number of adjustments.
SPO uses the following accounting identities to calculate national saving and its components, private andpublic saving:
National saving S = I (including change in stocks) + CA.
I is gross investment and CA the current account balance. CA in turns equals (X-M)+ NFI+Tr. X-M is thebalance on goods and services, NFI, net factor income, and Tr, current transfers from abroad. SPO obtainsdata on I and (X-M) from the NIA, and data on NFI and Tr from the BoP (converted into Lira) and makessome adjustments to I. Notably, SPO adjusts the part of investment corresponding to government investment, to include personnel expenditures associated with investment (classified by TurkStat as government consumption). We constructed our own series for total investment using readily available datafrom the NIA and BoP (using monthly average exchange rates), without the adjustments made by SPO inorder to gauge the importance of these adjustments. We found only small differences for total saving forthe period 1998-2007 (Box Figure 1).
Private and public savingSG = IG (including change in stocks) + Government BalanceSP = S - SG = IP (including change in stocks) - Government Balance + CA
The equation for public saving, SG, follows from Government Balance = Revs - Trans - CG - IG, whereRevs are revenues, Trans are transfers to the public including interest, and CG is government consumption,since SG = Revs - Trans - CG. Note that public saving is not equal to the government balance, contrary to common belief.
SPO uses general government (budgetary central government plus extrabudgetary funds and revolvingfunds plus social security agencies, including unemployment fund plus local governments) as its basis incalculating the government balance. As a result of this choice of definition, private saving will include thesaving of public enterprises, as is customary. It then makes some adjustments to the raw data. The adjustments to the government balance include removing items classified “above the line” in the fiscalaccounts, but which do not affect wealth. A recent example is the treatment of revenues from sales of GSMlicenses in 2007, which were classified as capital transfers by Treasury, and removed by SPO from the general government balance. Government investment, IG, refers to general government investment; hencestate enterprise investment is classified as part of private investment, consistent with the definition of private saving. As noted above, SPO also adjusts the NIA data for IP and IG. Our own series for SP andSG using NIA and Treasury data for the fiscal balance, without adjustments, shows some differences withSPO, notably in 2002, 2006, and 2007 (Box Figure 1).
How much difference do the new NIA data make? To answer this question we compare SPO data for theperiod 1998-2006 based on the old and new NIA data. It turns out the differences are substantial. Reviseddata shows a sharper decline in the private saving rate in 2003 and 2004, and higher private saving for 2006than earlier SPO data (see Box Figure 2). These differences reflect in part the reduction in government saving as a percent of GDP, which resulted from the upward revision in GDP (government investment andgovernment balance were not revised in nominal terms other than small changes in 2006), but also largedownward revisions in private investment as a share of GDP.
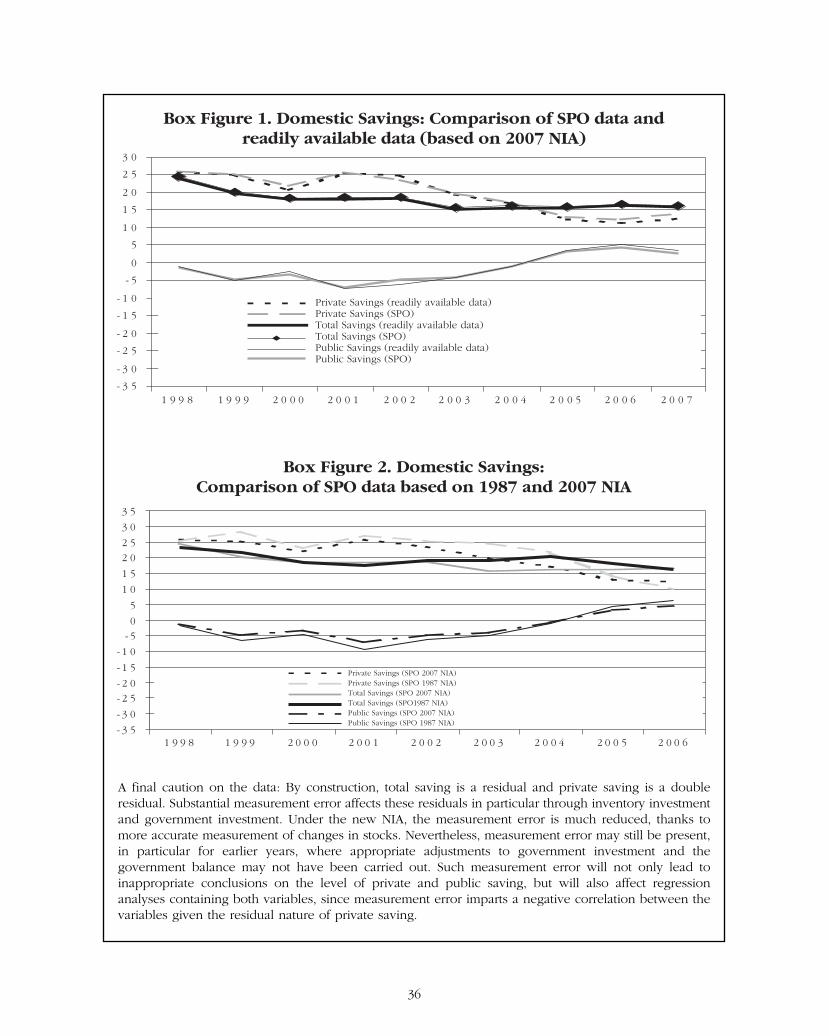
A final caution on the data: By construction, total saving is a residual and private saving is a double residual. Substantial measurement error affects these residuals in particular through inventory investmentand government investment. Under the new NIA, the measurement error is much reduced, thanks tomore accurate measurement of changes in stocks. Nevertheless, measurement error may still be present,in particular for earlier years, where appropriate adjustments to government investment and the government balance may not have been carried out. Such measurement error will not only lead to inappropriate conclusions on the level of private and public saving, but will also affect regression analyses containing both variables, since measurement error imparts a negative correlation between thevariables given the residual nature of private saving.
Box Figure 1. Domestic Savings: Comparison of SPO data andreadily available data (based on 2007 NIA)
- 3 5
- 3 0
- 2 5
- 2 0
- 1 5
- 1 0
- 5
0
5
1 0
1 5
2 0
2 5
3 0
1 9 9 8 1 9 9 9 2 0 0 0 2 0 0 1 2 0 0 2 2 0 0 3 2 0 0 4 2 0 0 5 2 0 0 6 2 0 0 7
Private Savings (readily available data)Private Savings (SPO)Total Savings (readily available data)Total Savings (SPO)Public Savings (readily available data)Public Savings (SPO)
- 3 5
- 3 0
- 2 5- 2 0
- 1 5
- 1 0
- 50
5
1 0
1 5
2 02 5
3 0
3 5
1 9 9 8 1 9 9 9 2 0 0 0 2 0 0 1 2 0 0 2 2 0 0 3 2 0 0 4 2 0 0 5 2 0 0 6
Box Figure 2. Domestic Savings:Comparison of SPO data based on 1987 and 2007 NIA
Private Savings (SPO 2007 NIA)Private Savings (SPO 1987 NIA)Total Savings (SPO 2007 NIA)Total Savings (SPO1987 NIA)Public Savings (SPO 2007 NIA)Public Savings (SPO 1987 NIA)
36
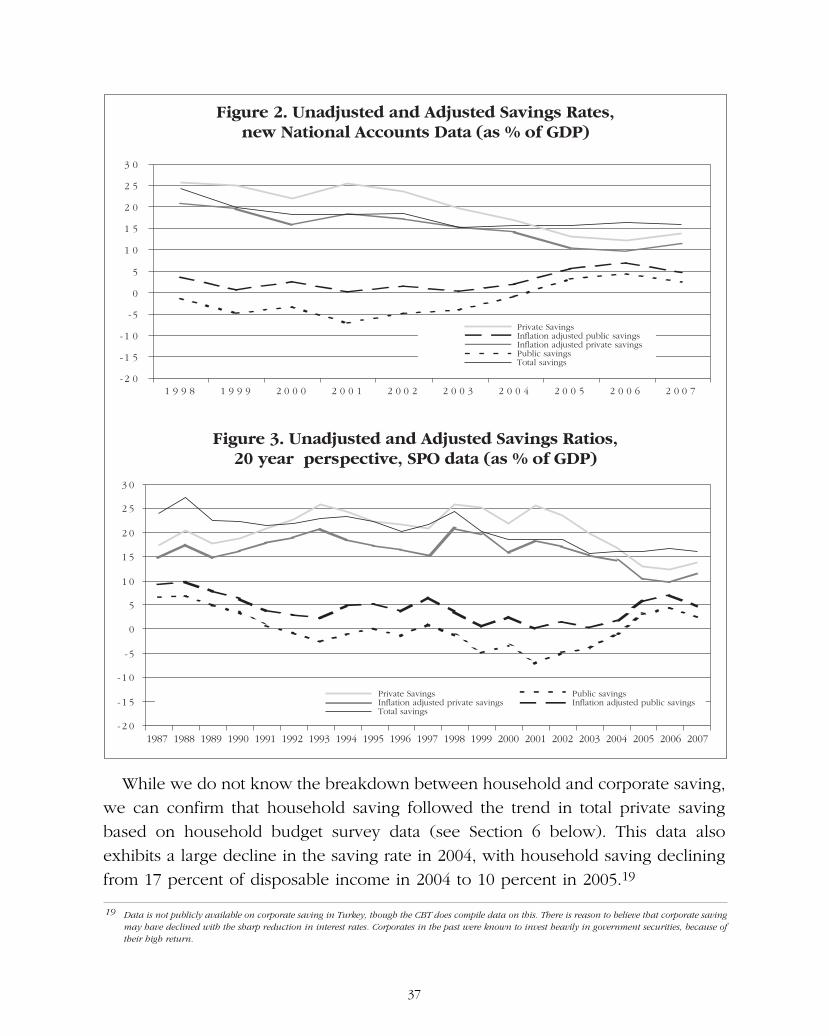
While we do not know the breakdown between household and corporate saving,we can confirm that household saving followed the trend in total private saving based on household budget survey data (see Section 6 below). This data also exhibits a large decline in the saving rate in 2004, with household saving decliningfrom 17 percent of disposable income in 2004 to 10 percent in 2005.19
37
19 Data is not publicly available on corporate saving in Turkey, though the CBT does compile data on this. There is reason to believe that corporate saving may have declined with the sharp reduction in interest rates. Corporates in the past were known to invest heavily in government securities, because oftheir high return.
Figure 2. Unadjusted and Adjusted Savings Rates,new National Accounts Data (as % of GDP)
Figure 3. Unadjusted and Adjusted Savings Ratios,20 year perspective, SPO data (as % of GDP)
- 2 0
-1 5
-1 0
-5
0
5
1 0
1 5
2 0
2 5
3 0
1 9 9 8 1 9 9 9 2 0 0 0 2 0 0 1 2 0 0 2 2 0 0 3 2 0 0 4 2 0 0 5 2 0 0 6 2 0 0 7
Private SavingsInflation adjusted public savingsInflation adjusted private savingsPublic savingsTotal savings
- 2 0
-1 5
-1 0
-5
0
5
1 0
1 5
2 0
2 5
3 0
Private SavingsInflation adjusted private savingsTotal savings
Public savingsInflation adjusted public savings
1987 1988 1989 1990 1991 1992 1993 1994 1995 1996 1997 1998 1999 2000 2001 2002 2003 2004 2005 2006 2007

3.2. The International Context
We now turn to international comparisons. Figure 4 shows that Turkey’s national saving rate has been low over the past decades, by emerging market standards. A closer look at the breakdown however (Figure 5), shows that this islargely a reflection of very high and rising saving rates in Asian and Middle-East economies. Interestingly, Turkey’s national saving rate is comparable to that inCentral and Eastern Europe (chart includes Turkey) and is not much lower than that in the EU, or the Western Hemisphere countries.20
The Turkish national saving rate is also about the same as in the Western Hemisphere before the recent increase in commodity prices, which greatly benefited most of the commodity-exporting countries there, thereby increasing their savings. As discussed in the theoretical survey above, the latter becomes the typical response to a positive but transitory shock to income. Differences with Middle-East economies are, as for the Western Hemisphere countries, also readily explained by terms of trade improvements. It is interesting to observe thatTurkey’s saving rate is similar to that in Eastern European countries, which have also experienced “credit booms” of late, and are in the EU-“convergence club”. Fromthis perspective, the main question therefore is why the Turkish saving rate is somuch less than the Asian saving rate. Though this is a big puzzle that is yet to beanswered fully satisfactorily, high Asian saving are often attributed to demographic factors, the precautionary saving motive, high productivity growth, and high returns to investment (see Box 2).
38
20 According to 2005 WDI data, Turkey has a lower domestic saving rate than the median, ranking 96th out of 171 countries. It has a saving rate similar to that of Italy, Costa Rica, Chile, Pakistan, Israel, Poland, France, and higher than in Bulgaria, Hungary, Greece, UK, US, Iceland, Lebanon, andmost African countries. Countries with higher saving rates include all of Asia, oil-exporters, Switzerland, Netherlands, Czech Republic, Ukraine, Argentina,Canada, Germany, and Egypt. This statistic also suggests that Turkey’s saving rate is low, but not exceptionally so according to international comparisons.
Figure 4. National Saving Rates (as % of GDP)
5
1 0
1 5
2 0
2 5
3 0
3 5
1988 1989 1990 1991 1992 1993 1994 1995 1996 1997 1998 1999 2000 2001 2002 2003 2004 2005 2006 2007
WorldAdvanced CountriesOther emerging Market and Developing CountriesTurkey
39
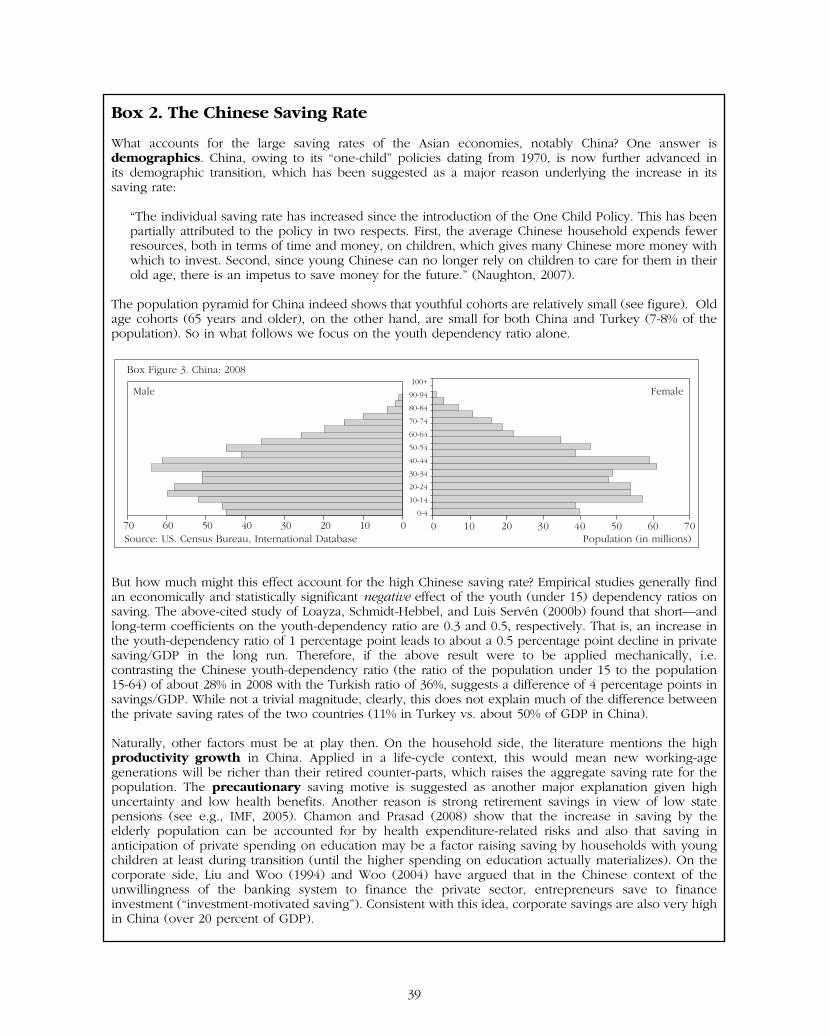
Box 2. The Chinese Saving Rate
What accounts for the large saving rates of the Asian economies, notably China? One answer is demographics. China, owing to its “one-child” policies dating from 1970, is now further advanced in its demographic transition, which has been suggested as a major reason underlying the increase in its saving rate:
“The individual saving rate has increased since the introduction of the One Child Policy. This has beenpartially attributed to the policy in two respects. First, the average Chinese household expends fewerresources, both in terms of time and money, on children, which gives many Chinese more money withwhich to invest. Second, since young Chinese can no longer rely on children to care for them in theirold age, there is an impetus to save money for the future.” (Naughton, 2007).
The population pyramid for China indeed shows that youthful cohorts are relatively small (see figure). Oldage cohorts (65 years and older), on the other hand, are small for both China and Turkey (7-8% of thepopulation). So in what follows we focus on the youth dependency ratio alone.
But how much might this effect account for the high Chinese saving rate? Empirical studies generally findan economically and statistically significant negative effect of the youth (under 15) dependency ratios onsaving. The above-cited study of Loayza, Schmidt-Hebbel, and Luis Servén (2000b) found that short—andlong-term coefficients on the youth-dependency ratio are 0.3 and 0.5, respectively. That is, an increase inthe youth-dependency ratio of 1 percentage point leads to about a 0.5 percentage point decline in privatesaving/GDP in the long run. Therefore, if the above result were to be applied mechanically, i.e. contrasting the Chinese youth-dependency ratio (the ratio of the population under 15 to the population 15-64) of about 28% in 2008 with the Turkish ratio of 36%, suggests a difference of 4 percentage points insavings/GDP. While not a trivial magnitude, clearly, this does not explain much of the difference betweenthe private saving rates of the two countries (11% in Turkey vs. about 50% of GDP in China).
Naturally, other factors must be at play then. On the household side, the literature mentions the high productivity growth in China. Applied in a life-cycle context, this would mean new working-age generations will be richer than their retired counter-parts, which raises the aggregate saving rate for thepopulation. The precautionary saving motive is suggested as another major explanation given high uncertainty and low health benefits. Another reason is strong retirement savings in view of low state pensions (see e.g., IMF, 2005). Chamon and Prasad (2008) show that the increase in saving by the elderly population can be accounted for by health expenditure-related risks and also that saving in anticipation of private spending on education may be a factor raising saving by households with youngchildren at least during transition (until the higher spending on education actually materializes). On thecorporate side, Liu and Woo (1994) and Woo (2004) have argued that in the Chinese context of the unwillingness of the banking system to finance the private sector, entrepreneurs save to finance investment (“investment-motivated saving”). Consistent with this idea, corporate savings are also very highin China (over 20 percent of GDP).
0 10 20 30 40 50 60 70010203040506070
Box Figure 3. China: 2008
Male Female100+
90-94
80-84
70-74
60-64
50-54
40-44
30-34
20-24
10-14
0-4
Source: US. Census Bureau, International Database Population (in millions)
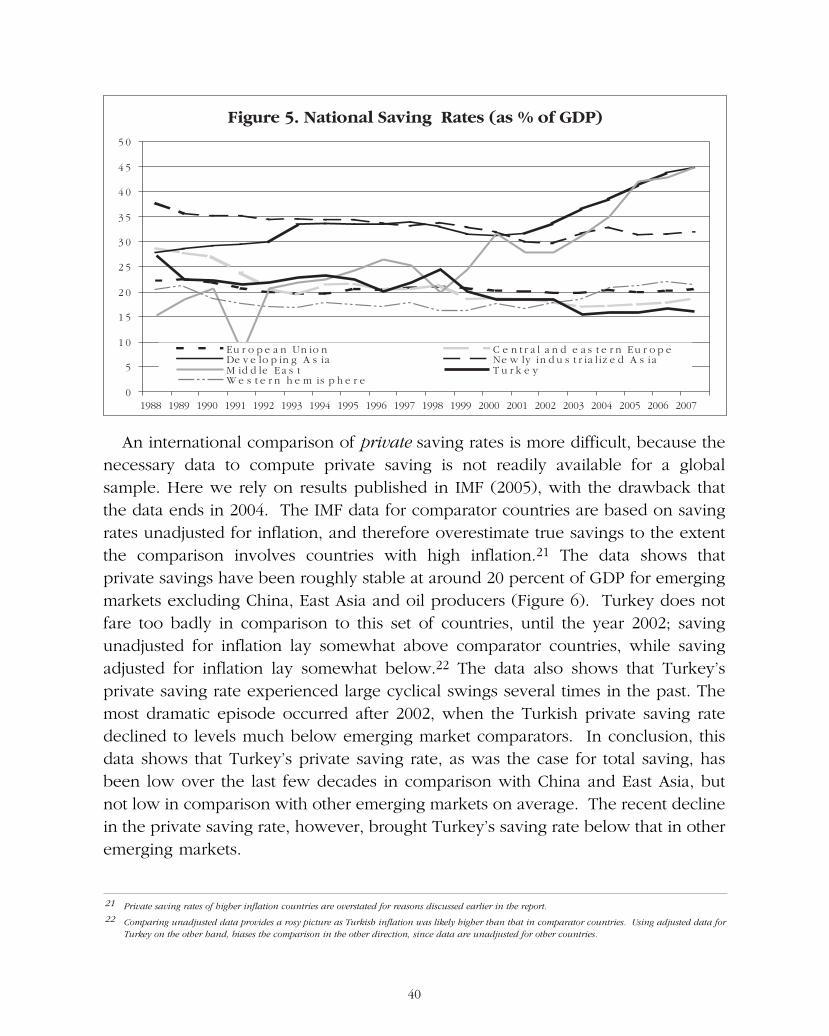
An international comparison of private saving rates is more difficult, because thenecessary data to compute private saving is not readily available for a global sample. Here we rely on results published in IMF (2005), with the drawback thatthe data ends in 2004. The IMF data for comparator countries are based on savingrates unadjusted for inflation, and therefore overestimate true savings to the extentthe comparison involves countries with high inflation.21 The data shows that private savings have been roughly stable at around 20 percent of GDP for emergingmarkets excluding China, East Asia and oil producers (Figure 6). Turkey does notfare too badly in comparison to this set of countries, until the year 2002; savingunadjusted for inflation lay somewhat above comparator countries, while saving adjusted for inflation lay somewhat below.22 The data also shows that Turkey’s private saving rate experienced large cyclical swings several times in the past. Themost dramatic episode occurred after 2002, when the Turkish private saving ratedeclined to levels much below emerging market comparators. In conclusion, thisdata shows that Turkey’s private saving rate, as was the case for total saving, hasbeen low over the last few decades in comparison with China and East Asia, butnot low in comparison with other emerging markets on average. The recent declinein the private saving rate, however, brought Turkey’s saving rate below that in otheremerging markets.
40
Figure 5. National Saving Rates (as % of GDP)
0
5
1 0
1 5
2 0
2 5
3 0
3 5
4 0
4 5
5 0
Eu r o p e a n Un io n C e n t r a l a n d e a s t e r n Eu r o p eDe v e lo p in g A s ia Ne w ly in d u s t r ia l iz e d A s iaM id d le Ea s t T u r k e yW e s t e r n h e m is p h e r e
1988 1989 1990 1991 1992 1993 1994 1995 1996 1997 1998 1999 2000 2001 2002 2003 2004 2005 2006 2007
21 Private saving rates of higher inflation countries are overstated for reasons discussed earlier in the report.22 Comparing unadjusted data provides a rosy picture as Turkish inflation was likely higher than that in comparator countries. Using adjusted data for
Turkey on the other hand, biases the comparison in the other direction, since data are unadjusted for other countries.
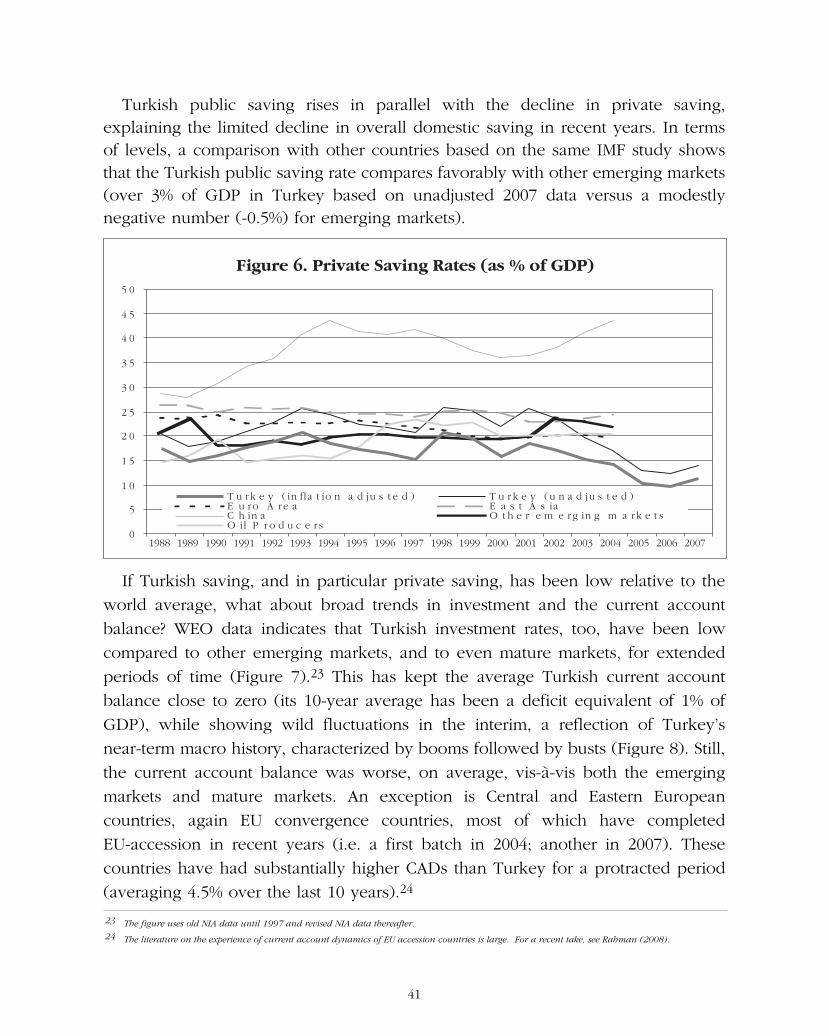
Turkish public saving rises in parallel with the decline in private saving, explaining the limited decline in overall domestic saving in recent years. In termsof levels, a comparison with other countries based on the same IMF study showsthat the Turkish public saving rate compares favorably with other emerging markets(over 3% of GDP in Turkey based on unadjusted 2007 data versus a modestlynegative number (-0.5%) for emerging markets).
If Turkish saving, and in particular private saving, has been low relative to theworld average, what about broad trends in investment and the current account balance? WEO data indicates that Turkish investment rates, too, have been lowcompared to other emerging markets, and to even mature markets, for extendedperiods of time (Figure 7).23 This has kept the average Turkish current account balance close to zero (its 10-year average has been a deficit equivalent of 1% ofGDP), while showing wild fluctuations in the interim, a reflection of Turkey’s near-term macro history, characterized by booms followed by busts (Figure 8). Still,the current account balance was worse, on average, vis-à-vis both the emerging markets and mature markets. An exception is Central and Eastern European countries, again EU convergence countries, most of which have completed EU-accession in recent years (i.e. a first batch in 2004; another in 2007). These countries have had substantially higher CADs than Turkey for a protracted period(averaging 4.5% over the last 10 years).24
41
Figure 6. Private Saving Rates (as % of GDP)
0
5
1 0
1 5
2 0
2 5
3 0
3 5
4 0
4 5
5 0
T u rk e y ( in fla t io n a d ju s t e d ) T u r k e y (u n a d j u s t e d )E u ro A re a E a s t A s iaC h in a O t h e r e m e rg in g m a rk e t sO il P r o d u c e rs
1988 1989 1990 1991 1992 1993 1994 1995 1996 1997 1998 1999 2000 2001 2002 2003 2004 2005 2006 2007
23 The figure uses old NIA data until 1997 and revised NIA data thereafter.24 The literature on the experience of current account dynamics of EU accession countries is large. For a recent take, see Rahman (2008).
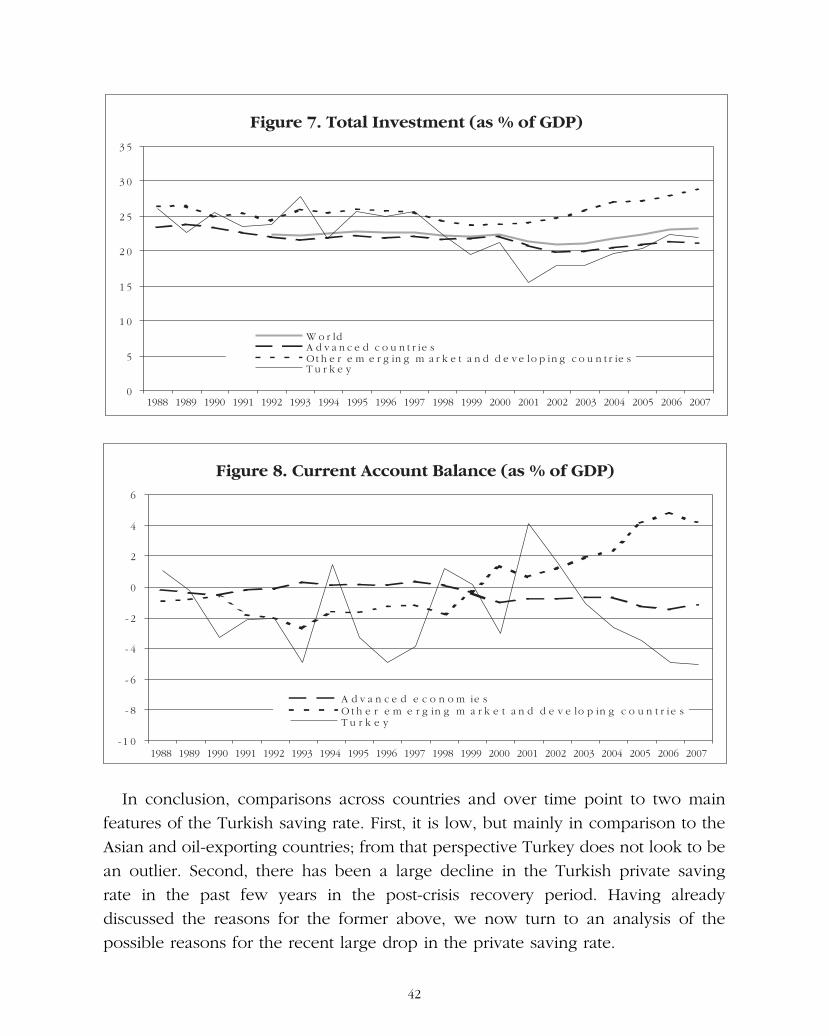
In conclusion, comparisons across countries and over time point to two main features of the Turkish saving rate. First, it is low, but mainly in comparison to theAsian and oil-exporting countries; from that perspective Turkey does not look to bean outlier. Second, there has been a large decline in the Turkish private saving rate in the past few years in the post-crisis recovery period. Having already discussed the reasons for the former above, we now turn to an analysis of the possible reasons for the recent large drop in the private saving rate.
42
0
5
1 0
1 5
2 0
2 5
3 0
3 5
Figure 7. Total Investment (as % of GDP)
W o r ldA d v a n c e d c o u n t r ie sOt h e r e m e r g in g m a r k e t a n d d e v e lo p in g c o u n t r ie sT u r k e y
1988 1989 1990 1991 1992 1993 1994 1995 1996 1997 1998 1999 2000 2001 2002 2003 2004 2005 2006 2007
Figure 8. Current Account Balance (as % of GDP)
- 1 0
- 8
- 6
- 4
- 2
0
2
4
6
A d v a n c e d e c o n o m ie sO t h e r e m e r g in g m a r k e t a n d d e v e lo p in g c o u n t r ie sT u r k e y
1988 1989 1990 1991 1992 1993 1994 1995 1996 1997 1998 1999 2000 2001 2002 2003 2004 2005 2006 2007

4S E C T I O N
POSSIBLE EXPLANATIONS FOR THE
SHARP DECLINE IN THE PRIVATE
SAVING RATE

POSSIBLE EXPLANATIONS FOR THE SHARP DECLINE IN THE PRIVATE SAVING RATE
What accounts for the sharp reduction in the private saving rate in recent years?We try to answer this question by reviewing the “usual suspects” suggested by theliterature review above. Specifically, these include improved prospects, since Turkey recovered from a deep financial crisis in 2001, deteriorating terms of tradereflecting the increase in oil prices, a catch-up on account of durable consumption,and looser credit. We have not included growth itself (as opposed to improvedprospects) and demographics among our suspects, given that their effect worked inthe opposite direction: high growth over the period would have stimulated saving,and a decline in dependency ratio over the period would also have exerted upwardpressure on saving.
Improved prospects
Several surveys of consumer expectations are available to help us gauge howconfidence and agents’ perception of the outlook has fared since the 2001 crisis.Unsurprisingly, confidence rose from the troughs of the crisis. By 2004-05, however, according to CNBC-e indicator of “consumer expectation”, more personsexpected the economic situation and their finances to deteriorate rather than to improve over the next year (see Figure 9). In theory, this should have called for anincrease in saving, not a decrease, following the argument of Campbell (1987), whereas, paradoxically, the decline in private saving was sharp in 2004. Indicatorsof “consumer sentiment” and “consumer confidence” remained stronger for longer, but these indicators also reflect the current appetite to buy durable goods as wellas the current financial situation of respondents, rather than purely expectations ofthe future.
45

Data note: Consumer expectation: based on expectations of own future (one year ahead) financial situation and economic situation (“better or worse than currently?”); Consumer sentiment: based on currentappetite to buy durable goods (“good time, bad time?”); Consumer confidence: based on own financial situation (compared to previous year), current economic situation (compared to previous month), future financial situation, future economic situation and appetite to buy durable goods. Index above 100 indicatesmore people had positive than negative responses.
Similarly, expectations for employment (naturally, the major source of incomegrowth) from TurkStat show that expectations were rather gloomy, with more people expecting the job situation to deteriorate than to improve starting in early2004 (Figure 10). The same is true for purchasing power as of mid-2004 and the general economic situation starting in the second quarter of 2005.
Data note: Indices indicate the balance of positive and negative responses to questions asking respondents tocompare the trend in purchasing power, general economic situation, and job opportunities (Q: “better or worse than currently?”). Index above 100 indicates more people had positive than negative responses.
46
Figure 9. CNBC-e Consumer Confidence Index ( Jan-02=100)
4 05 06 07 08 09 0
1 0 01 1 01 2 01 3 01 4 01 5 01 6 01 7 01 8 01 9 02 0 02 1 02 2 02 3 02 4 0
J a n -0 2 De c -0 2 N o v-0 3 O c t-0 4 S e p -0 5 A u g -0 6 J u l-0 7 J u n -0 8
C o n s u m e r C o n fid e n c eC o n s u m e r E xpe c t a t io nC o n s u m e r S e n t im e n t
Figure 10. CBRT-TurkStat Consumer Confidence Index
6 0
7 0
8 0
9 0
1 0 0
1 1 0
1 2 0
1 3 0
De c -0 3 J u n -0 4 De c -0 4 J u n -0 5 De c -0 5 J u n -0 6 De c -0 6 J u n -0 7 De c -0 7 J u n -0 8
P u rc h a s in g P ow e r (n e x t 6 m o n th s )G e n e ra l E c onom ic S itu a t io n (n e x t 3 m o n th s )J o b O pp o r tu n it ie s (n e x t 6 m o n th s )
In sum, while appealing on the face of it —the idea that agents would havedrawn down their savings on the back of an economic boom and attendant improvement in expectations— or the “improved prospects” thesis in short, doesnot find much support in the data in terms of explaining the sharp drop in savingsstarting from 2004.
Post-crisis consumption catch-up
One explanation for the decline in the saving rate could be a simple “catch-up”from compressed spending levels for durable consumption goods during the crisis.After all, durable spending is for the types of goods (e.g., washing machines, electronics) whose purchase people postpone at times of crises. In fact, durable goods consumption is known to be very cyclical.
In the case of Turkey, too, durable goods spending fell by 30 percent in 2001and remained at low levels in 2002, as households delayed their purchases. Spending then rebounded sharply in 2003, nearly doubling in the next three years,from crisis lows (see index of real spending on durables in Figure 11). (Specifically,consumption of durable goods was 80 percent higher during 2003-06 than in 2001-02). To assess whether the rebound in durable good spending simply reflected a catch-up from compressed levels we calculated a baseline for spending,i.e. spending that would be necessary to keep the per capita stock of durables unchanged at 2000 levels. Such spending would need to be positive because ofdepreciation and population growth. This baseline is our counterfactual, that is, thespending on durable goods we might have expected in the absence of a crisis. Ifspending was only a catch-up from compressed levels, cumulated spending on durable goods since 2001 should be about equal to cumulated levels under the baseline. We found that the shortfall in spending compared to baseline in 2001-02was about 30 percent less than the excess in 2003-04, which means that already in2004 the stock of durables per capita had recovered to 2000 levels.25 Therefore,the catch-up thesis does not square well with the data either, making us naturally suspect that other factors might have been at play in igniting the boom in durableconsumption goods. Growth in credit and declines in real interest rates are likelyreasons to which we turn later.26
47
25 In order to derive our baseline we needed an estimate for the initial stock of durable goods. In a steady state this stock is equal to durable goods spending divided by population growth plus the depreciation rate. We assumed that 1999 was a steady-state, i.e. a year in which the stock of durablesper capita might have remained constant, with new purchases just equal to depreciation plus population growth (2000 was a boom year in which thestock of durables per capita probably grew, so not a steady state). We used 15% for the depreciation rate of the stock of durables and 1% for populationgrowth, corresponding to actual recent population growth. Based on durable spending and these assumptions, we calculated the stock of durable goodsin 1999. We then derived the 2000 stock of durables by removing 15% depreciation and adding actual spending on durables in 2000. This 2000 stockof durables in per capita terms then became our benchmark. We calculated spending necessary to maintain this stock and compared this with actualspending. Using a 10 or 20 percent depreciation rate makes little difference to the results, though results are somewhat sensitive to the choice of benchmark (i.e. to estimates of the initial stock of durables). With a 15 percent higher benchmark, the stock of durables per capita recovers to 2000 levels in 2005; and with a 25 percent higher benchmark (a very unlikely situation), the stock of durables per capita recovers to 2000 levels in 2006.
26 Mankiw (1985) is a classic study of the role of real interest rates in the decision to purchase durable goods.
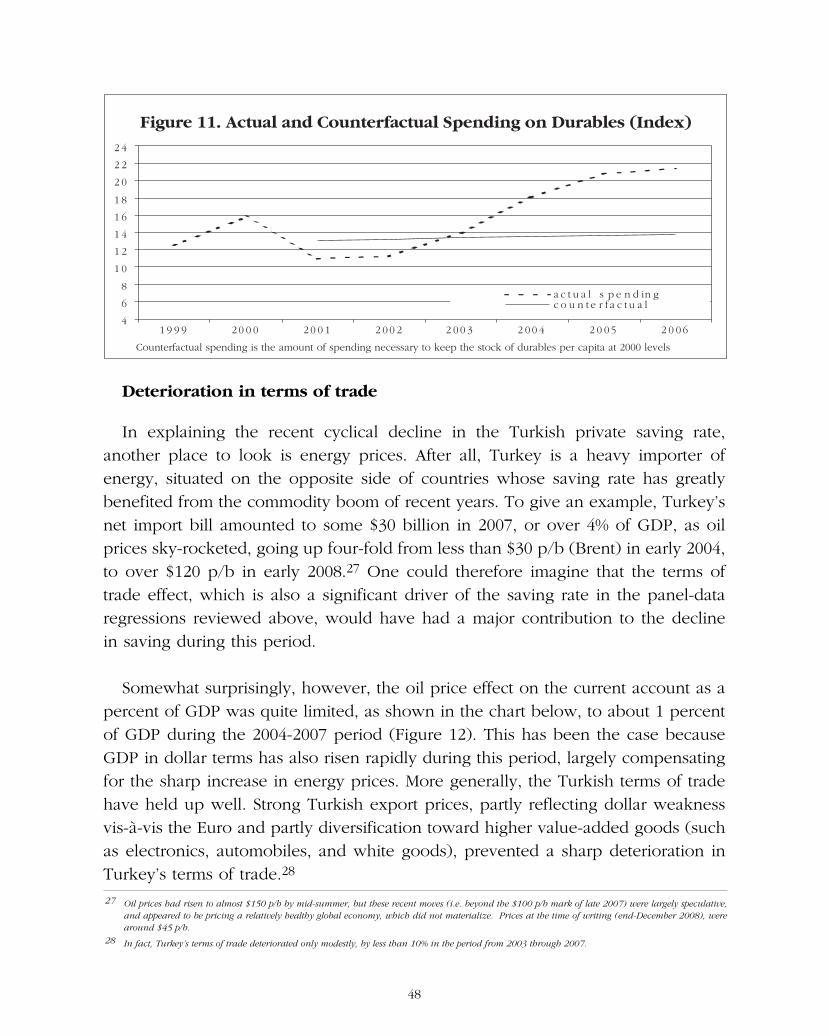
Deterioration in terms of trade
In explaining the recent cyclical decline in the Turkish private saving rate, another place to look is energy prices. After all, Turkey is a heavy importer of energy, situated on the opposite side of countries whose saving rate has greatly benefited from the commodity boom of recent years. To give an example, Turkey’snet import bill amounted to some $30 billion in 2007, or over 4% of GDP, as oil prices sky-rocketed, going up four-fold from less than $30 p/b (Brent) in early 2004,to over $120 p/b in early 2008.27 One could therefore imagine that the terms of trade effect, which is also a significant driver of the saving rate in the panel-dataregressions reviewed above, would have had a major contribution to the decline in saving during this period.
Somewhat surprisingly, however, the oil price effect on the current account as apercent of GDP was quite limited, as shown in the chart below, to about 1 percentof GDP during the 2004-2007 period (Figure 12). This has been the case becauseGDP in dollar terms has also risen rapidly during this period, largely compensatingfor the sharp increase in energy prices. More generally, the Turkish terms of tradehave held up well. Strong Turkish export prices, partly reflecting dollar weaknessvis-à-vis the Euro and partly diversification toward higher value-added goods (suchas electronics, automobiles, and white goods), prevented a sharp deterioration inTurkey’s terms of trade.28
48
Figure 11. Actual and Counterfactual Spending on Durables (Index)
4
6
8
1 0
1 2
1 4
1 6
1 8
2 0
2 2
2 4
1 9 9 9 2 0 0 0 2 0 0 1 2 0 0 2 2 0 0 3 2 0 0 4 2 0 0 5 2 0 0 6
a c t u a l s p e n d in gc o u n t e r f a c t u a l
Counterfactual spending is the amount of spending necessary to keep the stock of durables per capita at 2000 levels
27 Oil prices had risen to almost $150 p/b by mid-summer, but these recent moves (i.e. beyond the $100 p/b mark of late 2007) were largely speculative, and appeared to be pricing a relatively healthy global economy, which did not materialize. Prices at the time of writing (end-December 2008), werearound $45 p/b.
28 In fact, Turkey’s terms of trade deteriorated only modestly, by less than 10% in the period from 2003 through 2007.
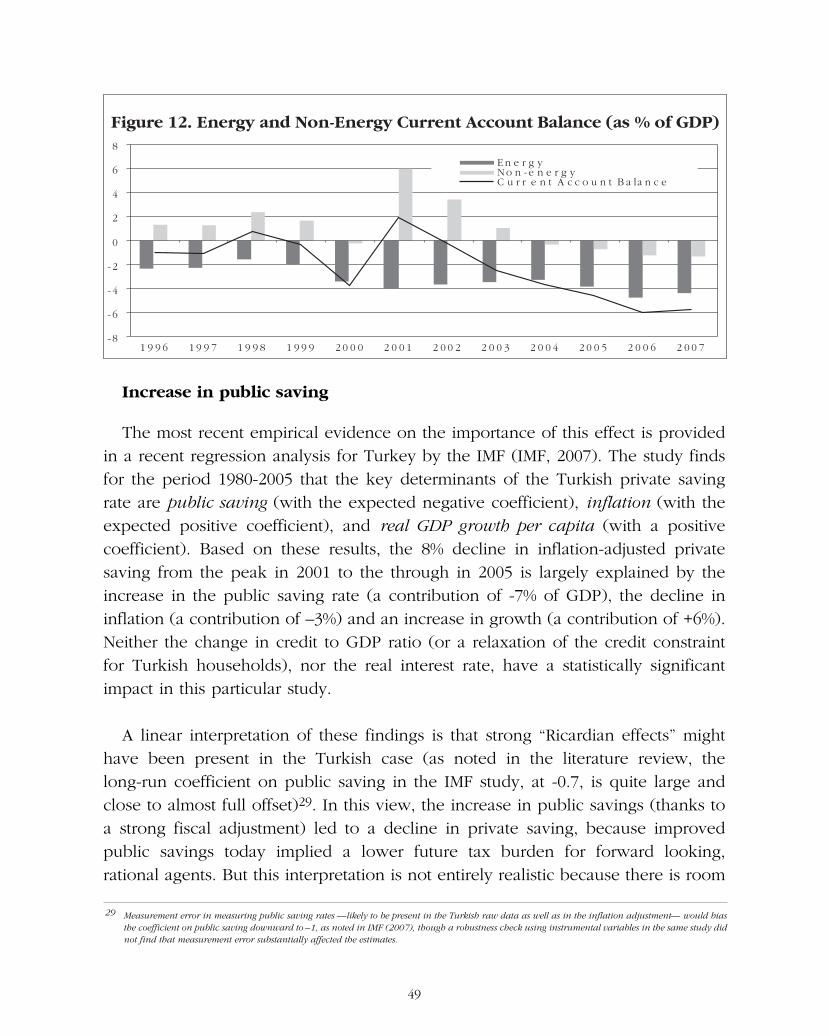
Increase in public saving
The most recent empirical evidence on the importance of this effect is providedin a recent regression analysis for Turkey by the IMF (IMF, 2007). The study findsfor the period 1980-2005 that the key determinants of the Turkish private saving rate are public saving (with the expected negative coefficient), inflation (with theexpected positive coefficient), and real GDP growth per capita (with a positive coefficient). Based on these results, the 8% decline in inflation-adjusted private saving from the peak in 2001 to the through in 2005 is largely explained by the increase in the public saving rate (a contribution of -7% of GDP), the decline in inflation (a contribution of –3%) and an increase in growth (a contribution of +6%).Neither the change in credit to GDP ratio (or a relaxation of the credit constraintfor Turkish households), nor the real interest rate, have a statistically significant impact in this particular study.
A linear interpretation of these findings is that strong “Ricardian effects” might have been present in the Turkish case (as noted in the literature review, the long-run coefficient on public saving in the IMF study, at -0.7, is quite large and close to almost full offset)29. In this view, the increase in public savings (thanks toa strong fiscal adjustment) led to a decline in private saving, because improved public savings today implied a lower future tax burden for forward looking, rational agents. But this interpretation is not entirely realistic because there is room
49
Figure 12. Energy and Non-Energy Current Account Balance (as % of GDP)
- 8
- 6
- 4
- 2
0
2
4
6
8
1 9 9 6 1 9 9 7 1 9 9 8 1 9 9 9 2 0 0 0 2 0 0 1 2 0 0 2 2 0 0 3 2 0 0 4 2 0 0 5 2 0 0 6 2 0 0 7
En e r g yNo n -e n e r g yC u r r e n t A c c o u n t B a la n c e
29 Measurement error in measuring public saving rates —likely to be present in the Turkish raw data as well as in the inflation adjustment— would bias the coefficient on public saving downward to –1, as noted in IMF (2007), though a robustness check using instrumental variables in the same study didnot find that measurement error substantially affected the estimates.
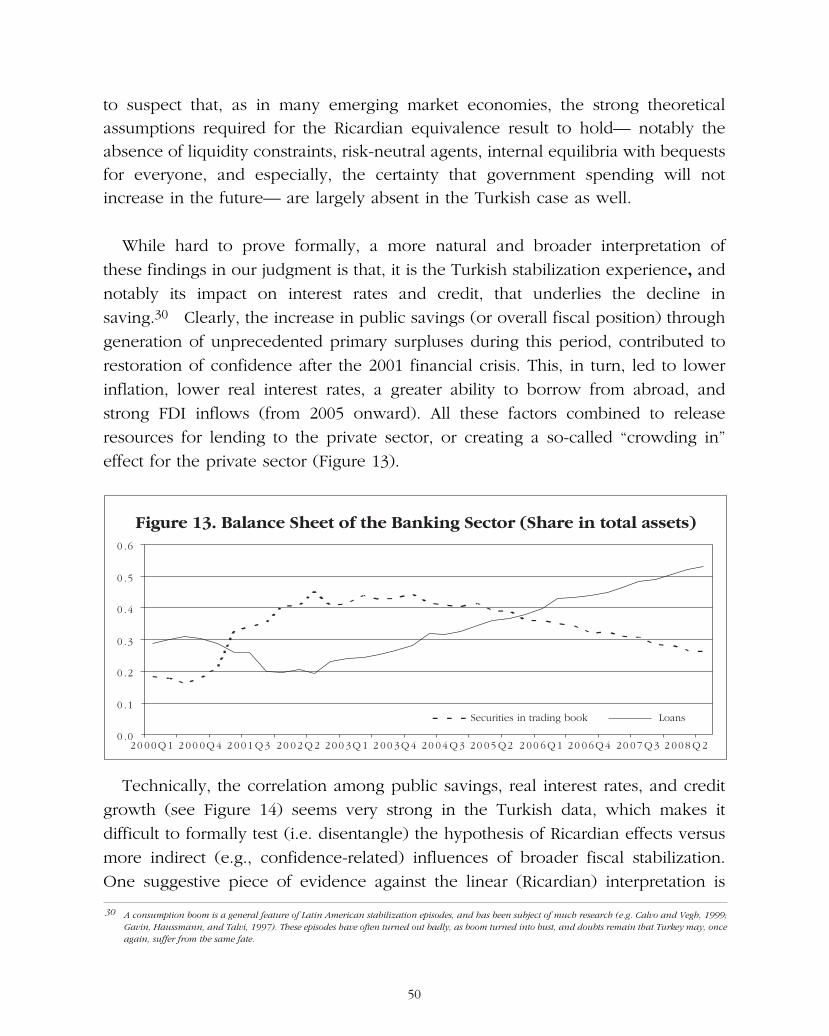
to suspect that, as in many emerging market economies, the strong theoretical assumptions required for the Ricardian equivalence result to hold— notably the absence of liquidity constraints, risk-neutral agents, internal equilibria with bequestsfor everyone, and especially, the certainty that government spending will not increase in the future— are largely absent in the Turkish case as well.
While hard to prove formally, a more natural and broader interpretation of these findings in our judgment is that, it is the Turkish stabilization experience, andnotably its impact on interest rates and credit, that underlies the decline in saving.30 Clearly, the increase in public savings (or overall fiscal position) through generation of unprecedented primary surpluses during this period, contributed torestoration of confidence after the 2001 financial crisis. This, in turn, led to lowerinflation, lower real interest rates, a greater ability to borrow from abroad, andstrong FDI inflows (from 2005 onward). All these factors combined to release resources for lending to the private sector, or creating a so-called “crowding in” effect for the private sector (Figure 13).
Technically, the correlation among public savings, real interest rates, and creditgrowth (see Figure 14) seems very strong in the Turkish data, which makes it difficult to formally test (i.e. disentangle) the hypothesis of Ricardian effects versusmore indirect (e.g., confidence-related) influences of broader fiscal stabilization.One suggestive piece of evidence against the linear (Ricardian) interpretation is
50
Figure 13. Balance Sheet of the Banking Sector (Share in total assets)
0 .0
0 .1
0 .2
0 .3
0 .4
0 .5
0 .6
20 00Q1 2 00 0Q4 2 001 Q3 20 02 Q2 200 3Q1 2 00 3Q4 20 04 Q3 20 05 Q2 2 00 6Q1 20 06Q4 20 07 Q3 2 008 Q2
Securities in trading book Loans
30 A consumption boom is a general feature of Latin American stabilization episodes, and has been subject of much research (e.g. Calvo and Vegh, 1999; Gavin, Haussmann, and Talvi, 1997). These episodes have often turned out badly, as boom turned into bust, and doubts remain that Turkey may, onceagain, suffer from the same fate.
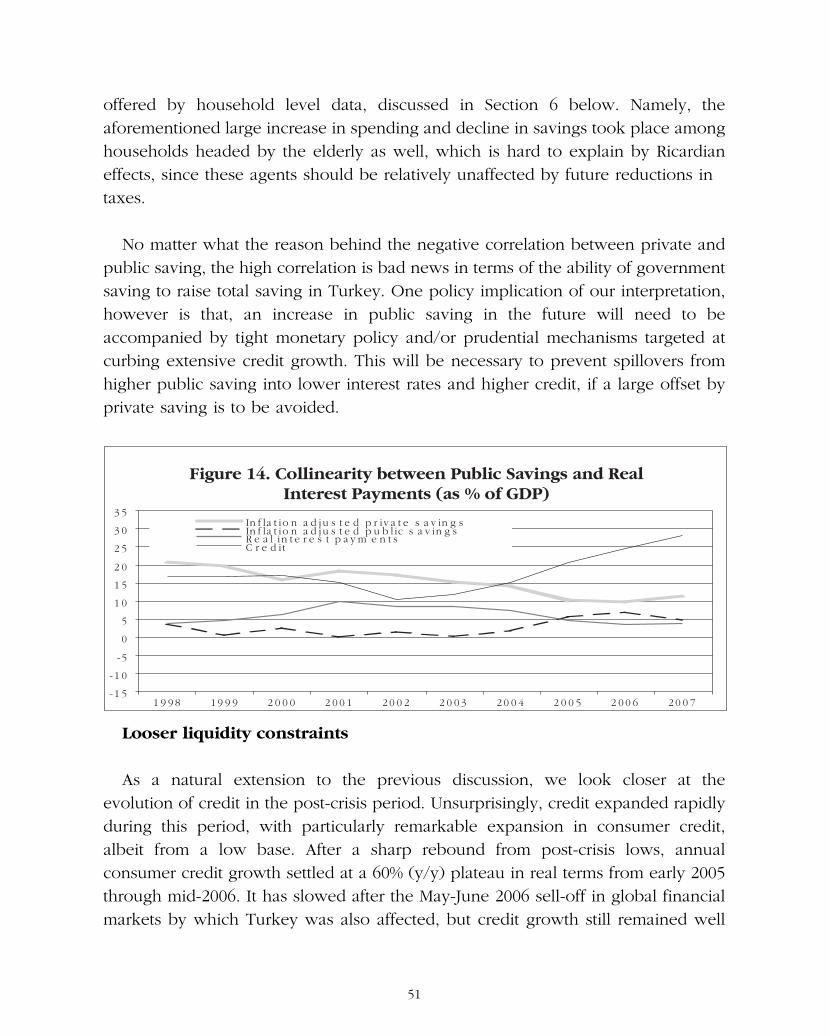
offered by household level data, discussed in Section 6 below. Namely, the aforementioned large increase in spending and decline in savings took place amonghouseholds headed by the elderly as well, which is hard to explain by Ricardian effects, since these agents should be relatively unaffected by future reductions in taxes.
No matter what the reason behind the negative correlation between private andpublic saving, the high correlation is bad news in terms of the ability of governmentsaving to raise total saving in Turkey. One policy implication of our interpretation,however is that, an increase in public saving in the future will need to be accompanied by tight monetary policy and/or prudential mechanisms targeted atcurbing extensive credit growth. This will be necessary to prevent spillovers fromhigher public saving into lower interest rates and higher credit, if a large offset byprivate saving is to be avoided.
Looser liquidity constraints
As a natural extension to the previous discussion, we look closer at the evolution of credit in the post-crisis period. Unsurprisingly, credit expanded rapidlyduring this period, with particularly remarkable expansion in consumer credit, albeit from a low base. After a sharp rebound from post-crisis lows, annual consumer credit growth settled at a 60% (y/y) plateau in real terms from early 2005through mid-2006. It has slowed after the May-June 2006 sell-off in global financialmarkets by which Turkey was also affected, but credit growth still remained well
51
Figure 14. Collinearity between Public Savings and RealInterest Payments (as % of GDP)
-1 5
-1 0
-5
0
5
1 0
1 5
2 0
2 5
3 0
3 5
1 9 9 8 1 9 9 9 2 0 0 0 2 0 0 1 2 0 0 2 2 0 0 3 2 0 0 4 2 0 0 5 2 0 0 6 2 0 0 7
In f la t io n a d j u s t e d p r iv a t e s a v in g sIn f la t io n a d j u s t e d p u b l ic s a v in g sR e a l in t e r e s t p a y m e n t sC r e d i t
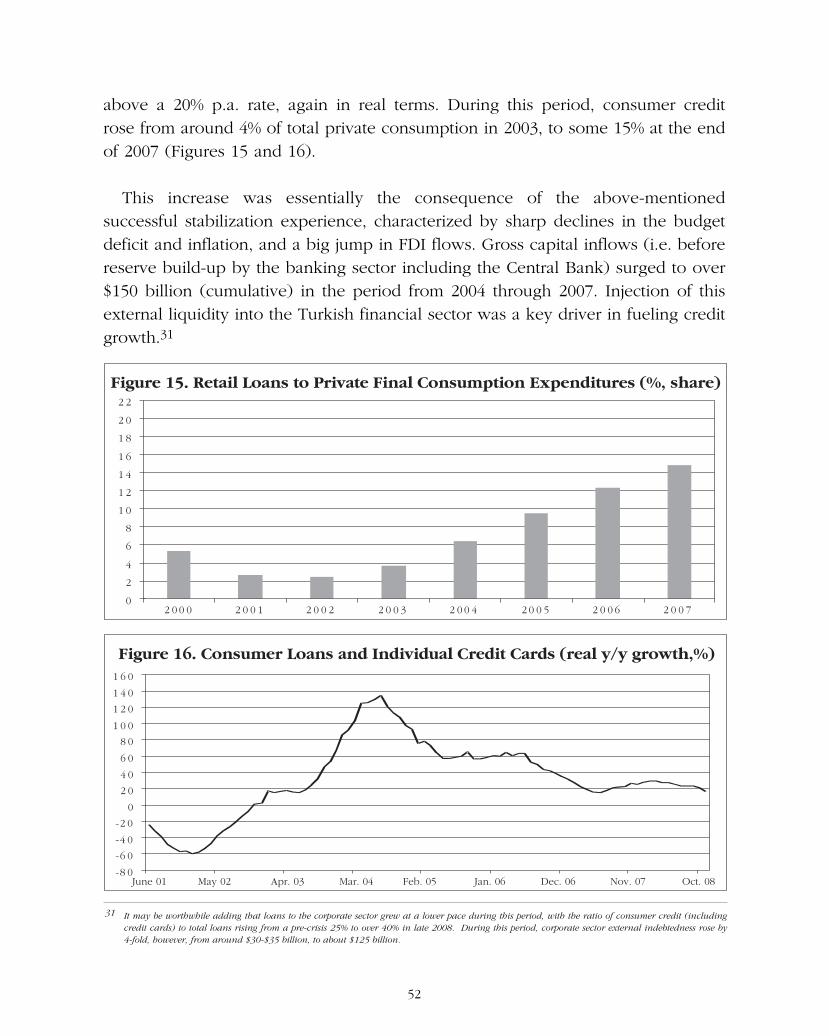
above a 20% p.a. rate, again in real terms. During this period, consumer credit rose from around 4% of total private consumption in 2003, to some 15% at the endof 2007 (Figures 15 and 16).
This increase was essentially the consequence of the above-mentioned successful stabilization experience, characterized by sharp declines in the budgetdeficit and inflation, and a big jump in FDI flows. Gross capital inflows (i.e. beforereserve build-up by the banking sector including the Central Bank) surged to over$150 billion (cumulative) in the period from 2004 through 2007. Injection of this external liquidity into the Turkish financial sector was a key driver in fueling creditgrowth.31
52
Figure 15. Retail Loans to Private Final Consumption Expenditures (%, share)
0
2
4
6
8
1 0
1 2
1 4
1 6
1 8
2 0
2 2
2 0 0 0 2 0 0 1 2 0 0 2 2 0 0 3 2 0 0 4 2 0 0 5 2 0 0 6 2 0 0 7
Figure 16. Consumer Loans and Individual Credit Cards (real y/y growth,%)
-8 0
-6 0
-4 0
-2 0
0
2 0
4 0
6 0
8 0
1 0 0
1 2 0
1 4 0
1 6 0
June 01 May 02 Apr. 03 Mar. 04 Feb. 05 Jan. 06 Dec. 06 Nov. 07 Oct. 08
31 It may be worthwhile adding that loans to the corporate sector grew at a lower pace during this period, with the ratio of consumer credit (including credit cards) to total loans rising from a pre-crisis 25% to over 40% in late 2008. During this period, corporate sector external indebtedness rose by 4-fold, however, from around $30-$35 billion, to about $125 billion.
How would an increase in consumer credit cause a reduction in savings? As noted in the literature review above, this may happen through various mechanismssuch as the direct effect of relaxed liquidity constraints on consumption, the indirect effect on precautionary saving as agents have access to a greater buffer of liquidity, i.e. feel safer as a result and draw down their savings, and “hyperbolic discounting”, i.e. a situation in which people are impatient in the near-future, hence use revolving credit when it is available. All these mechanisms seem to have played a role in reducing savings in the case of Turkey.
Reduction in real interest rates
The reduction in real interest rates was very large during the stabilization episode coming down from almost 30% in the immediate aftermath of the crisis, tohigh single digits more recently. But it is difficult to pinpoint their effects. As explained in the literature review, real interest rates have an ambiguous effect onsavings mainly because of income and substitution effects working in opposite directions in the case of savers. “Living off interest income” is a typical feature ofmany households in Turkey, the result of years of chronic fiscal deficits, macroeconomic instability and high real interest rates, hence the emergence of a“rentier class”. This means that there is a large class of people for whom the income effect of lower interest rates was adverse, reducing consumption and increasing saving. This would have stemmed the negative impact of lower interestrates on saving through the substitution effect. We find some evidence that this wasindeed the case based on household budget survey data. As described in Section 6,households with interest income did not reduce their saving rates, whereas households without interest income, did.
Wealth effect
Another notable feature of the post-crisis experience, which is related to the decline in interest rates, is the sharp rise in asset prices, both in the stock marketand the housing market. We may thus ask whether there was a “wealth effect” atplay in Turkey, whereby consumption was spurred by higher wealth, or the perception of it. We can check for a wealth effect (as it relates to housing) thanksto household budget survey data, which distinguish households according to
53

whether they lived in their own homes rather than were tenants. Data is unfortunately not available on financial assets, so that we cannot enquire into their effects.32 Judging from the household survey, home-ownership is widespread,with some 70% of households living in their own home. The data in the Turkish case clearly show that home-owners and non-home-owners behaved differently.Home-owners reduced their saving rates, whereas tenants maintained them (Section 6).
While tempting to simply ascribe this to a wealth effect from home-ownership,interpretation is made difficult by the fact that, as noted in the literature survey, itis difficult to justify the existence of a wealth effect on theoretical grounds: after all,home-owners will normally continue to live in their homes, so are not directly better off simply because these homes are worth more.33 In fact, home-owners face two offsetting effects: an increase in value of an asset, and an increase in imputed housing costs. Possibly the results reflect the fact that access to liquiditywas greater for home-owners as owners of a worthy collateral. Furthermore, tenantsmay have been more reluctant to borrow or reduce saving, since they were in factworse off as the result of the housing boom and attendant increase in rents.
54
32 Stock market effect is arguably not that huge in Turkey. Stock ownership is not particularly widespread among the population, nor makes up a major chunk of household wealth. Market value of all ISE stocks was 30% of GDP in 2007, one-third of it was in “float”, and most of the float (about 70%)was owned by foreigners.
33 One could argue that they may have even been worse off in fact, because of higher property taxes.

5S E C T I O N
DEMOGRAPHIC PROJECTIONS:
HOW MUCH OF A “SAVING BONUS”
IS AWAITING TURKEY?


DEMOGRAPHIC PROJECTIONS: HOW MUCH OF A “SAVING BONUS” IS AWAITING TURKEY?
Population pyramids for Turkey show that there is currently a bulge for the five5-year cohorts in the 10-35 year old category. As the demographic transition proceeds this population bulge will age, and by 2025 relocate to the 30-55 year oldcategory (Figure 17). This would normally lead to an increase in the saving rate. We provide estimates of this impact in this section.
Mechanically an increase in the saving rate will result, because the share of thepopulation with spending in excess of income (children and youth) will decline andthe share of the population with income in excess of spending will increase. Of course, behavior is likely to change as the demographic transition proceeds. Parentswill likely substitute quality for quantity of children and increase education expenditures (which are classified as consumption, though they are really investment in human capital). This would dampen the effect of fewer children onsaving. Second, parents will likely increase their saving for retirement apace withthe breakdown of the family support system whereby the young support their parents in old age. The family support system typically breaks down with the reduction in the number of children that can support parents. In addition, there isthe impact of greater longevity, which leads to a need for more saving to cover longer retirement, and of youth unemployment, which will probably fall as the number of youths falls over time. These effects would lead to higher retirement saving.
Later on, as the boom generation ages further and enters retirement, there is likely to be a negative impact on saving as the result of dissaving by these 5 largecohorts. The first cohort (which is currently 30-35 years old category) does not reach the 65-year retirement age till 2040, and older cohorts reach this age even later, so any serious impact from this group should not be expected till after 2050.
What impact will the change in demographic structure have on saving? One quick way to gauge this is to use existing estimates based on panel data studies.Loayza et. al. (2000b) estimates that a 1 percentage point reduction in youth-dependency ratio is associated with a 0.5 percentage point increase in the saving rate.34 In Turkey population projections suggest the youth-dependency
57
34 We do not explicitly consider the impact of changing demographics on the investment rate. The literature concludes that any effects are minor compared to the effects of demographics on the saving rate and the current account (e.g., Higgins, 1998, Helliwell, 2004)

ratio (under 15 years old/population 15-64) will fall from 37 to 27 percent between2007 and 2025. Based on the panel-data estimates of Loayza et. al., the impact ofa lower youth-dependency ratio would then be to raise private saving by about 5percent of GDP between 2007 and 2025.
58
Figure 17. Turkey: Population Pyramids, 1980-2050
2.5 3.0 3.53.03.5
2.5 3.0 3.53.03.5
2.5 3.0 3.53.03.5
0.0 0.5 1.0 1.5 2.0 2.5 3.0 3.5
0.0 0.5 1.0 1.5 2.0
50-54
60-64
70-74
80+
0-4
10-14
20-24
30-34
40-44
0.00.51.01.52.02.5
0.0 0.5 1.0 1.5 2.00-4
10-14
20-24
30-34
40-44
50-54
60-64
70-74
80+
0.00.51.01.52.02.5
0.0 0.5 1.0 1.5 2.00-4
10-14
20-24
30-34
40-44
50-54
60-64
70-74
80+
0.00.51.01.52.02.5
0-4
10-14
20-24
30-34
40-44
50-54
60-64
70-74
80+
0.00.51.01.52.02.53.03.5
Source: US. Census Bureau, International Database
Male Female
Male Female
Male Female
Male Female
1980
2008
2025
2050
Population (in millions)
Population (in millions)
Population (in millions)
Population (in millions)
We also used two other methods to project the Turkish aggregate saving rate, based on two different sets of estimates of individual saving by age groups. Individual saving is not directly available from the data, since data on expenditures is only available at the household level. After obtaining estimates forthese individual saving by age as described below, we mechanically extrapolate using the projected population structure. That is, we implicitly assumesaving by age will remain unchanged over time (e.g., the saving rate for the 30-34years old age group is assumed to remain the same for this age group in the future). This assumption seems roughly appropriate given the mechanics causingthe second demographic dividend and is consistent with the household demandmodel where monetized savings are a substitute for children (Section 2). Specifically, as fertility is declining, so that future 30-34 years old age groups willhave fewer children, it is reasonable to expect people will use at least some of themoney they no longer need to spend on children to save for retirement, now thatthey cannot count on children as old-age insurance. There could still be an impacton individual saving by age groups, with increases in spending on children (withquality replacing quantity) while children remain in the household and higher saving for retirement after children have left the home. Results are therefore only suggestive of what could happen.
Specifically for both sets of estimates of individual saving obtained by our 2 methods, we multiply the saving of each age group by the projected share of thepopulation in this age group, then sum to obtain aggregate saving. We do the same for income (for which individual data is available), then obtain the aggregatesaving ratio.35 Implicitly we not only assume unchanged individual saving rates, butalso unchanged relative income by age group over time. These exercises indicatethat the household saving rate may increase from 10 percent of disposable incomein 2005 to 12-15 percent in 2025, depending on the method used to obtain individual saving rates. As a percent of GDP the effect should be of similar magnitude, or some 2-5 percent of GDP.36
5.1. Method 1: Regression Analysis
In this first method we follow the literature, where individual saving is obtainedfrom household saving based on regression analysis (Deaton and Paxson, 2000).
59
35 Saving decompositions of this type have been used to explain historical changes in aggregate saving rates and have been based on household saving, by age of household head, on which information is readily available (Japelli and Pagano, 1997).
36 While disposable income is only some 85-90 percent of GDP, private saving is underestimated in the household data because of under-reporting.
The regression we estimate is
Sh=Σβanah + εh
where Sh= is household saving, nah is the number of persons of age-group a inthe household, and βa measures the average contribution to household saving by age-group a.
We then use predicted saving by age βa to simulate future saving rates, using projected population shares nah, and 2005 individual incomes (available from thehousehold survey). Using this method, we estimate the saving ratio at 11.3% in2005, compared to the observed saving ratio of 10%. For this reason we scale theage-profile for saving down by 1% in order to ensure the saving rate in 2005 in thesimulations corresponds to the actual data.
Below we show the raw data for the profile of income and spending by age ofhousehold head (Figure 18), the profile of income and spending we derived at theindividual level (Figure 19), and the corresponding saving at the individual level (Figure 20). Figure 19 shows that spending of adults on themselves increasesover time, in step with rising incomes, possibly reflecting liquidity constraints orbuffer-stock saving (Section 2).37 Also of note is that incomes decline early and rather sharply after 50-54 years old, reflecting the prevalence of early retirement in Turkey.
The saving profile at the household level (Figure 18) is rather flat, as is commonlyfound in the literature, reflecting endogenous household formation.38 At the individual level, however, a stronger life-cycle saving pattern emerges (Figure 20).Of note is that the oldest age groups do save substantially, something that reflectsthe fact that income data includes transfers from the state and family members.
Figure 21 shows projected saving rates based on our exercise. The projectionuses the estimated βa and economy-wide averages for nah and calculates saving as
60
37 Using the income profiles by age, we also constructed household saving for a composite household consisting of two adults from age 15 onwards, who have a first child at age 25-29 and a second child at age 30-34, and assuming each child stays with the household for 20 years. The pattern of spending is as one would expect, reaching a peak when the head of household is 45-49 years old, after which spending declines reflecting the departureof the first child.
38 Among young adults, only those with relatively high earnings (and therefore saving) can set up independent households. Similarly, among the elderly, the relatively well-off are more likely to persist as heads of household. Seventeen percent of households in Turkey are extended households, i.e,multi-generational households, accentuating these effects.
Σβanah. It suggests that changing demographics will cause the saving rate toincrease by 2 percentage points by 2025, or some 1 percentage points per decade,a small effect. (As a percent of GDP, the increase would be similar). Moreover theimpact is measured imprecisely, and we cannot reject, based on 95% confidence intervals, the hypothesis that saving will stay constant over time.39 At the sametime, the upper bound suggests that saving could at most increase by 4percentage points by 2025.
Note that in this method βah is estimated without bias only if the correlation between nah and εah is zero. This will not be the case if the number of persons ina certain age category (e.g. a large number of children, older persons) is systematically correlated with a variable affecting saving omitted from the regression (e.g., income or education, urban/rural location, extended family). Forexample, if families with a large number of children tend to be poorer and have lower spending, spending by children will be underestimated. The same could bethe case for families with a large number of older people, if extended family organization is more prevalent among poor families. Hence, as a check on the results, and also because the coefficients were imprecisely estimated, we use an alternative method, which does not rely on regression analysis (method 2, below).
5.2. Method 2: OECD Equivalency Scale
Our second method for obtaining individual saving involves deriving individualspending from household spending, using the “modified OECD” equivalency scale.This scale takes into account economies of scale in household consumption and lower spending by children compared to spending by adults.40 The equivalencyscale assigns the first adult a weight of 1, additional persons over 13 years of age aweight of 0.5, and children under 14 a weight of 0.3. Thus children under 14, forexample, are assumed to consume 0.3 times as much as the household head. Thelower weights for additional household members reflect economies of scale andhence lower costs for additional members. Individual saving is then calculated asindividual income minus individual spending based on the above method, using2005 data. Next saving and income are aggregated by age-group.
61
39 We calculated confidence intervals around our central estimates for aggregate saving, based on the 1.96x the standard deviation of projectedhousehold saving.
40 Assuming equal per capita spending for all household members irrespective of age would give us stronger, but less realistic, results.

This procedure has some drawbacks of its own. Notably, it involves some measurement error. Because household heads are assumed to spend more than other adults (parents or grown children) in extended families, a change in status tohousehold head raises one’s consumption, as calculated here. Because older persons are more likely to be household heads, this imparts some upward bias tospending in age-profiles most likely to contain a household head.
The results using the OECD equivalency scale show a stronger life-cycle patternthan in method 1, as the oldest age groups no longer save substantially (Figure 20).Extrapolating saving and income to the future based on projected population figures, as in method 1, we predict an increase from 10 to 15 percent of disposable income by 2025 (about 5% of GDP), or 1% every 4 years. After 2025, thesaving rate stops increasing, weighted down by the growing share of the elderlypopulation (Figure 21).
62
Figure 18. Income and Spending by Household, 2005
4
6
8
1 0
1 2
1 4
1 6
1 8
1 5 - 1 9 2 0 -2 4 2 5 -2 9 3 0 -3 4 3 5 -3 9 4 0 -4 4 4 5 -4 9 5 0 -5 4 5 5 - 5 9 6 0 - 6 4 6 5 - 6 9 7 0 - 7 4 7 5 - 7 9 8 0 +
(tho
usan
d Y
TL)
a g e o f h o u s e h o ld h e a dS o u r c e : H o u s e h o l d B u d g e t S u r v e y , 2 0 05
Disposable income
Spending

63
Figure 19. Individual Income and Spending Over the Life-Cycle, 2005
0
1
2
3
4
5
6
7
8
0 -1 4 1 5 - 1 9 2 0 -2 4 2 5 -2 9 3 0 -3 4 3 5 - 3 9 4 0 - 4 4 4 5 - 4 9 5 0 -5 4 5 5 -5 9 6 0 -6 4 6 5 -6 9 7 0 - 7 4 7 5 - 7 9 8 0 +
Disposable incomeSpending (method 1)Spending (method 2)
Method 1 : Regression analysis to uncover age-effects;Method 2 : Based on OECD adult equivalent weightsSource : Own calculations
age of household member
Figure 20. Age Profile of Individual Savings, 2005
-1 5 0 0
-1 0 0 0
-5 0 0
0
5 0 0
1 0 0 0
1 5 0 0
2 0 0 0
2 5 0 0
3 0 0 0
3 5 0 0
0 - 1 4 1 5 -1 9 2 0 - 2 4 2 5 - 29 30 - 34 35 -3 9 4 0 -4 4 4 5 -4 9 5 0 - 5 4 55 - 59 6 0 -6 4 6 5 -6 9 7 0 -7 4 7 5 - 7 9 8 0 +
Source : Own calculations age of household member
Estimate Method 1Upper bound (95% confidence interval)Lower bound (95% confidence interval)Estimate Method 2
YTL
Figure 21. Simulated Private Savings Ratio (% disposable income)
0 %
2 %
4 %
6 %
8 %
1 0 %
1 2 %
1 4 %
1 6 %
1 8 %
2 0 0 5 2 0 1 0 2 0 1 5 2 0 2 0 2 0 2 5 2 0 3 0 2 0 3 5 2 0 4 0 2 0 4 5 2 0 5 0Source : Own calculations
Savings ratio (method 1)Savings ratio (method 2)Lower bound (method 1)Upper bound (method 1)


6S E C T I O N
TESTING HYPOTHESES WITH
HOUSEHOLD BUDGET SURVEY DATA

TESTING HYPOTHESES WITH HOUSEHOLD BUDGET SURVEY DATA
In this section, we use household budget survey data to explore whether the large decline in the aggregate saving rate was shared among various groups. Thisalso allows us to examine various hypotheses on the drivers of the decline in thesaving rate. We also estimate an equation for aggregate household saving, to check,inter alia, for the effect of private health expenditures and home-ownership on saving. The data are from the Household Budget Surveys of 2004 and 2005 (see Appendix II for details and some caveats on the data).
Saving across groups
Table 1 shows the household saving rate by characteristic of the household head for 2004 and 2005. These years are chosen, because the decline in the private saving rate was most pronounced between 2004 and 2005. We consider demographic and economic/socio-economic characteristics. We have ample observations for each cell in the table, as we only consider sub-groups accountingfor at least 15% of households, to ensure robustness of the results.
The table shows that the large decline in the household saving rate was broad-based across demographic and socio-economic groups. Saving rates declinedroughly by the same amount irrespective of urban-rural location, number of children living in the household, and age of the head of household. The fact thatsaving declined as much in households headed by elderly persons as in other households is at first sight a mystery and we return to this below. Savings rates declined slightly more for those with more education, and about the same for thepoorest quintile of the population, as measured in terms of rooms per adult equivalent.41 Saving rates declined somewhat more for the self-employed as well asthose working in small enterprises (fewer than 10 employees). Strikingly, saving rates almost did not decline for workers in the public sector. The table also showsthat saving declined more for those living in their homes and less for those earninginterest income, as discussed further below.
Findings for households with green cards and by income quintile are discussedin Appendix II, as their robustness is doubtful because of low quality of the data(under-reporting of incomes).
67
41 We cannot condition on income because of measurement error, as explained in Appendix II, Using the OECD scale as discussed in Section 5. Saving rates for those without access to hot water, another measure of poverty, on the other hand, did decline by more than for households with access to hotwater.
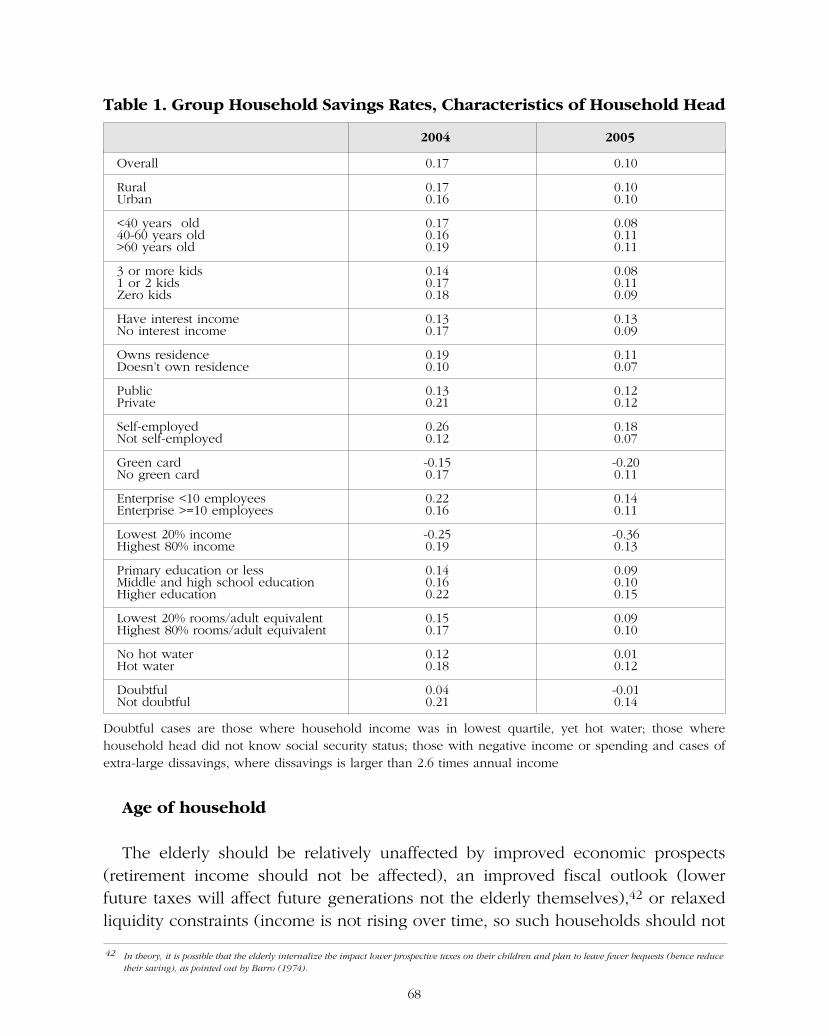
Table 1. Group Household Savings Rates, Characteristics of Household Head
Doubtful cases are those where household income was in lowest quartile, yet hot water; those where household head did not know social security status; those with negative income or spending and cases ofextra-large dissavings, where dissavings is larger than 2.6 times annual income
Age of household
The elderly should be relatively unaffected by improved economic prospects (retirement income should not be affected), an improved fiscal outlook (lower future taxes will affect future generations not the elderly themselves),42 or relaxedliquidity constraints (income is not rising over time, so such households should not
68
Overall 0.17 0.10
Rural 0.17 0.10Urban 0.16 0.10
<40 years old 0.17 0.0840-60 years old 0.16 0.11>60 years old 0.19 0.11
3 or more kids 0.14 0.081 or 2 kids 0.17 0.11Zero kids 0.18 0.09
Have interest income 0.13 0.13No interest income 0.17 0.09
Owns residence 0.19 0.11Doesn’t own residence 0.10 0.07
Public 0.13 0.12Private 0.21 0.12
Self-employed 0.26 0.18Not self-employed 0.12 0.07
Green card -0.15 -0.20No green card 0.17 0.11
Enterprise <10 employees 0.22 0.14Enterprise >=10 employees 0.16 0.11
Lowest 20% income -0.25 -0.36Highest 80% income 0.19 0.13
Primary education or less 0.14 0.09Middle and high school education 0.16 0.10Higher education 0.22 0.15
Lowest 20% rooms/adult equivalent 0.15 0.09Highest 80% rooms/adult equivalent 0.17 0.10
No hot water 0.12 0.01Hot water 0.18 0.12
Doubtful 0.04 -0.01Not doubtful 0.21 0.14
2004 2005
42 In theory, it is possible that the elderly internalize the impact lower prospective taxes on their children and plan to leave fewer bequests (hence reduce their saving), as pointed out by Barro (1974).

wish to borrow). The fact that saving declined as much, or even slightly more, inhouseholds headed by elderly persons as in other households therefore requiresexplanation. The saving rate for households headed by those over 60 decreasedfrom 19% to 11% between 2004 and 2005, compared to a decline from 17% to 10%for all households.43 Spending by households headed by elderly persons was up29% compared to 22% for the remainder (incomes were up 18% for this group compared to 14% for the remainder).
Increased costs of private health care is not a plausible explanation for the risein spending, as the share in health expenditures for households headed by the elderly was, though increasing, very small: 2.5% of consumption expenditures in 2004 and 2.9% in 2005.44 Furthermore, increases in the cost of health care would normally lead to higher saving, not lower saving, as householdsanticipate higher health expenditures and save somewhat more than expected expenditures for precautionary reasons.
There is, however, one development where one would expect a disproportionate effect on the elderly: the wealth effect from rising real estate prices and other assets. 90% of elderly households owned their own home. If theelderly do not simply wish to pass on their higher assets as inheritance, they willdraw down some of their assets after an increase in their value, or at least reducetheir saving rate. We turn to the effect of home ownership next.
Home ownership
A wealth effect from higher housing prices will be present if people consumemore use of real estate services now than they will in the future. As noted in the literature survey this may be the fact for the elderly; it holds additionally for ownersof lots of land on which larger buildings can be built through e.g., partnership withconstruction companies, as is often the case in Turkey. In those cases, owners willreceive a share of the new construction in proportion to the value of the land,hence may receive more than their planned use of real estate services when pricesare high. There will also be a wealth effect if higher housing prices increase accessto credit (home equity loans or higher limits for personal loans) and affect saving through that channel.
69
43 We found similar declines in saving when we excluded extended families from households headed by those over 60. 44 Excluding extended households, since these could bias the results, the share of expenditures on health was also low (3.1 and 3.5 percent respectively).

To check for a wealth effect we compared household who owned their residencywith other households. Given the large increase in real estate prices and hence wealth, we would expect the former to have reduced their saving more in the presence of a wealth effect. This turns out to be the case. Homeowners reducedtheir saving rate from 19 to 11 percent whereas others reduced their saving ratemuch less, from 10 to 7 percent. This resulted from spending growth (24%)outstripping income growth (13%) for owners; for tenants the figures were 20 and17% respectively. As suggested above, higher rates of homeownership may accountfor the reduction in saving by households with older heads of household.45
Interest income
To check for an effect of lower interest rates, we distinguished households withinterest income from those without (15% of households report interest income in2005). Having interest income, such households had negative income effects fromlower interest rates, and might respond by lowering consumption. This would tendto offset the substitution effect, whereby in the first period saving would fall because of a lower rate of return. For households without interest income, in contrast, income and substitution effects would go in the same direction, stimulating consumption. We found that spending and saving behavior fit this description. Saving by households with interest income did not decline, but instead rose slightly, and spending rose much more moderately than for householdswithout interest income, consistent with an important income effect.46 These resultsmay have a policy implication: given the large income effect for households withassets, measures such as reducing taxation of interest may not lead to higher private saving. Since such measures would also raise the budget deficit, they wouldlead to a reduction of national saving.
Public sector work
A finding in Table 1 is that the saving rate did not fall much for workers in thepublic sector.47 At first sight, one might think this would reflect the fact that publicsector workers did not face the same improved prospects as workers in the private sector. In that case, their spending and saving should have remained
70
45 50% of households with household head under 40 owned their residence, versus 76% and 88% respectively for those with household head of 40-60 and over 60 years old.
46 Interest income was defined as the sum of bank interest income (local and foreign currency deposits) and interest income on government and bank bills. 15 percent of households had such income in 2005. Households with interest income experienced income increases of 12% and spending increases of 12%; in contrast, households without interest income experienced income increases of 13% and spending increases of 24%.
47 Public sector is defined as civil service plus public enterprises. However, in the sample, there seem to be very few public enterprise workers, based on answers to the questionnaire.

relatively flat. However, spending of households with a head working in the public sector increased only slightly less than spending in households with a headin the private sector (22% versus 24%), instead of being flat. The large difference insaving behavior is instead attributable to higher income growth among state workers (21% in the state sector versus 12% in the private sector).48 Possibly the large income increase may have been seen as transitory, thereby limiting consumption out of this higher income and causing higher saving among publicsector workers.
Saving equation
We estimate a comprehensive equation for the household saving ratio (saving/disposable income) to better understand determinants of saving, and changes therein, in Turkey. The equation closely follows Chamon and Prasad’s(2008) work on China and controls for demographics of the household, household income, education, insurance and employment characteristics, expected health expenditures, home ownership, and interest income.
Demographic variables include age of the household head, the number of children of various ages, and the number of elderly in the household. The equation includes the log of household income, and is estimated with instrumentalvariables given the measurement error in this variable.49 As instruments we use allindependent variables (other than income) plus, in order to capture income, adummy variable for whether the household has hot water and the number of rooms per capita (specifically, the number of rooms divided by the number of adultequivalents, using the modified OECD scale described in Section 4). The equationalso controls for the education level of the household head and spouse.
It is estimated for a core group of households, which excludes households whose head was under 25, over 70, a student, involuntarily unemployed, disabledor sick, waiting for work or in seasonal employment.50 The sample was also restricted by excluding doubtful observations (results for the unrestricted sample areavailable in Appendix II).51
71
48 This is somewhat of a mystery because there was no unusual adjustment to civil servant wages in 2005. The increases in private sector incomes are inline with increases in both private manufacturing and minimum wages of 13% on average in 2005.
49 In Chamon and Prasad (2008) no such instrumentation is done, but this is critical here given under-reporting of incomes (see Appendix II). 50 This follows the literature (see e.g., Japelli and Pagano, 1997, Chamon and Prasad, 2008). Households with young or older heads are typically
wealthier than average, and including them may cause bias. 51 Given the very large number of cases of large negative saving rates, we had cause to believe there was large under-reporting (Appendix II). We thought
this problem would be larger for cases where the head of household did not report social security status, where incomes were in the lowest quintile yetthe household had access to hot water, where income or spending were negative (theoretically impossible), and where dis-saving were larger than 260%of income, and we restricted the sample by excluding these observations.

Variables of interest are whether the household head has social security (and itstype), the number of persons working for the state, the share of women in the household who were housewives, a proxy for large expected health expenditures,a dummy variable indicating whether the head of household was a home-ownerand a dummy variable indicating whether the household had any interest income.The proxy for large expected health expenditures is estimated in a separate probitfor the years 2004-05 (Table 2).52 The probit results explaining large health expenditures are as expected. “Absence of any health insurance” has a positive coefficient, the number of household members under 15 has a negative coefficient,and the number of household members over 60 has a positive coefficient.
Table 2. Survey Probit Regression: Probability of Health Expenditures > 10% of Spending, 2004-05
*** Statistically significant at the 1% level; ** 5% level; * 10% level.
Table 3 shows the results for the household saving equation for 2004 and 2005.
72
52 In estimating the equation in Table 2, we follow Chamon and Prasad (2008). Specifically, the dependent variable in the probit equals one when health expenditures are large, specifically if health expenditures exceed 10 percent of consumption expenditures (we chose a 10 percent threshold for health expenditures, rather than a 20 percent threshold as in Chamon and Prasad, because very few households spent more than 20 percent of disposable incomeon health). Independent variables are the log of non-health expenditures, a dummy variable for urban/rural location, a dummy variable indicating thepresence of health insurance, and 4 variables indicating the number of persons under 15, 15 to 39, 40 to 59, and over 60. The regression is estimated forpooled 2004-05 data, with year dummies interacted with demographic variables. An indicator variable is then constructed based on this probit, whichequals one when the probability of large health expenditures exceeds 10 percent. This indicator variable is then entered in the household saving regression.
Log non-health expenditures -0.18 *** 0.03 -5.8 0.00
Urban location 0.01 0.04 0.2 0.81
No health insurance 0.13 *** 0.05 2.7 0.01
Number of household members
Under 15 -0.06 *** 0.02 -3.0 0.00
Under 15 interacted with 2004 0.05 ** 0.02 2.1 0.04
15-39 0.11 0.08 1.4 0.17
40-59 -0.02 0.08 -0.2 0.81
60+ 0.19 *** 0.05 4.1 0.00
60+ interacted with 2004 -0.10 ** 0.04 -2.3 0.02
Constant -0.04 0.29 -0.1 0.89
Number of observations 17100
F (9, 17089) 12.5
Coef. Std. Err. t P> [t]
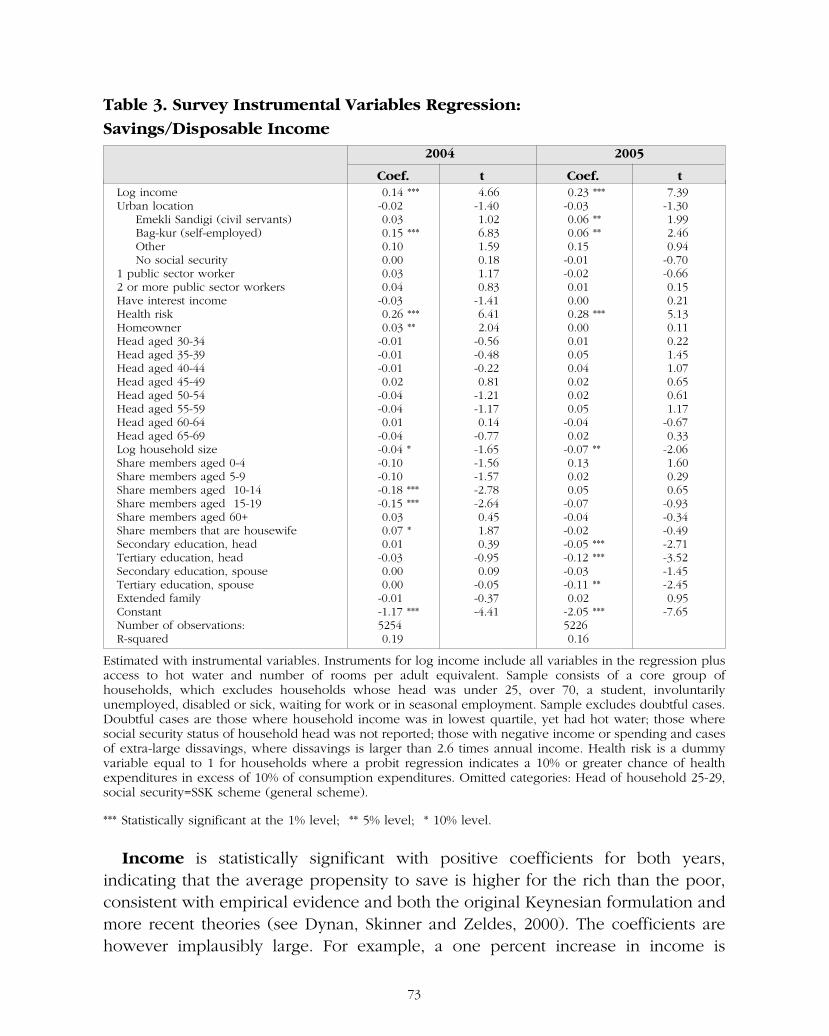
Table 3. Survey Instrumental Variables Regression: Savings/Disposable Income
Estimated with instrumental variables. Instruments for log income include all variables in the regression plusaccess to hot water and number of rooms per adult equivalent. Sample consists of a core group of households, which excludes households whose head was under 25, over 70, a student, involuntarily unemployed, disabled or sick, waiting for work or in seasonal employment. Sample excludes doubtful cases.Doubtful cases are those where household income was in lowest quartile, yet had hot water; those wheresocial security status of household head was not reported; those with negative income or spending and casesof extra-large dissavings, where dissavings is larger than 2.6 times annual income. Health risk is a dummyvariable equal to 1 for households where a probit regression indicates a 10% or greater chance of healthexpenditures in excess of 10% of consumption expenditures. Omitted categories: Head of household 25-29,social security=SSK scheme (general scheme).
*** Statistically significant at the 1% level; ** 5% level; * 10% level.
Income is statistically significant with positive coefficients for both years, indicating that the average propensity to save is higher for the rich than the poor,consistent with empirical evidence and both the original Keynesian formulation andmore recent theories (see Dynan, Skinner and Zeldes, 2000). The coefficients arehowever implausibly large. For example, a one percent increase in income is
73
Log income 0.14 *** 4.66 0.23 *** 7.39Urban location -0.02 -1.40 -0.03 -1.30
Emekli Sandigi (civil servants) 0.03 1.02 0.06 ** 1.99Bag-kur (self-employed) 0.15 *** 6.83 0.06 ** 2.46Other 0.10 1.59 0.15 0.94No social security 0.00 0.18 -0.01 -0.70
1 public sector worker 0.03 1.17 -0.02 -0.662 or more public sector workers 0.04 0.83 0.01 0.15Have interest income -0.03 -1.41 0.00 0.21Health risk 0.26 *** 6.41 0.28 *** 5.13Homeowner 0.03 ** 2.04 0.00 0.11Head aged 30-34 -0.01 -0.56 0.01 0.22Head aged 35-39 -0.01 -0.48 0.05 1.45Head aged 40-44 -0.01 -0.22 0.04 1.07Head aged 45-49 0.02 0.81 0.02 0.65Head aged 50-54 -0.04 -1.21 0.02 0.61Head aged 55-59 -0.04 -1.17 0.05 1.17Head aged 60-64 0.01 0.14 -0.04 -0.67Head aged 65-69 -0.04 -0.77 0.02 0.33Log household size -0.04 * -1.65 -0.07 ** -2.06Share members aged 0-4 -0.10 -1.56 0.13 1.60Share members aged 5-9 -0.10 -1.57 0.02 0.29Share members aged 10-14 -0.18 *** -2.78 0.05 0.65Share members aged 15-19 -0.15 *** -2.64 -0.07 -0.93Share members aged 60+ 0.03 0.45 -0.04 -0.34Share members that are housewife 0.07 * 1.87 -0.02 -0.49Secondary education, head 0.01 0.39 -0.05 *** -2.71Tertiary education, head -0.03 -0.95 -0.12 *** -3.52Secondary education, spouse 0.00 0.09 -0.03 -1.45Tertiary education, spouse 0.00 -0.05 -0.11 ** -2.45Extended family -0.01 -0.37 0.02 0.95Constant -1.17 *** -4.41 -2.05 *** -7.65Number of observations: 5254 5226R-squared 0.19 0.16
2004 2005
Coef. t Coef. t

associated with an increase in the saving/income ratio of .23 or 23 percentage points in 2005.
There is some evidence for a positive impact of uncertainty on saving in linewith theory. Participation in the social security scheme for the self-employed, whoare presumably subject to greater uncertainty than employees, has a positive statistically significant coefficient. Health risk also has a positive, large and statistically significant impact on saving.
We also find some evidence that home-ownership was associated with higher saving in 2004 and not in 2005, consistent with a wealth effect which would havedriven down saving for homeowners (as home prices increased substantially in thisperiod). The results are consistent with our earlier finding that the saving rate forhomeowners as a group declined much more than that of others between 2004-05(Table 1).
The dummy for participation in the social security scheme for civil servants is positive in 2005 (consistent with our earlier finding that public sector workers maintained their saving rate whereas others reduced them). Additional dummy variables for working for the state are statistically insignificant.
The dummy for households with interest income is insignificant, somewhat surprising given our earlier findings that such households did not reduce theirsaving rate whereas others did.
Age of household head has no effect, which is not surprising, given that theregressions control for other factors (income, household size, number of childrenof various ages) that underlie the relationship between age of household head andsaving ratio.
Household size, which captures the effect of the number of children, has a significant negative impact on saving, as does the share of household members 10-14 and 15-19 (2004 only), consistent with findings in the literature that a high dependency ratio depresses saving.
Secondary and tertiary education for the head of household and secondary education for the spouse has a significant negative effect on the saving ratio (2005 only). Possibly this reflects greater access to credit for those layers of the population. The share of household members who are housewives has a marginallypositive effect on saving in 2004 (10 percent significance level), while a dummy forextended families has no statistically significant effect.
74

7S E C T I O N
POLICY OPTIONS


POLICY OPTIONS
When thinking about policy options, one possibility is to take the agnostic line:that the role of savings in resolving Turkey’s main macro challenges is somewhatoverstated. If Turkey were to figure out the true bottlenecks to growth, say, through a well-thought out process of “growth diagnostics”, a solid saving ratio could simply follow. In other words, this line of thinking would probably adviseputting the emphasis on obstacles to growth rather than on raising the saving rateper se (see Chapter 2 in Rodrik, 2007). In this context, one needs to look for measures that can raise growth, without a need to raise investment (i.e. reformswhich increase total factor productivity), so as to ensure a reduction in the currentaccount deficit.
Until this is done, the question of what to do when domestic saving are inadequate to finance investment —and hence are a source of vulnerability— couldbe addressed through the generic expenditure-switching and expenditure-reducing policies, i.e. through lower absorption/growth (consumption plus investment) anda weaker currency. These could be engineered through a tighter fiscal and loosermonetary policy mix. However, this would not come without complications, givenTurkey’s —in our view, entirely sensible— commitment to an Inflation Targeting framework (a combination of a floating exchange rate regime with emphasis on price stability as the overriding objective). Another complication is the large offsetof private saving to increases in public saving. This would call for tighter monetarypolicy, to control credit growth, rather than looser monetary policy. Exports wouldfall victim to this strategy.
A less benign global environment may do the job of reducing vulnerabilities, too, by reducing capital inflows and hence investment, but the casualty would again be low growth. Finally, one would want to limit vulnerability to capital flowreversals by lengthening government debt maturities, which with 3-year averagematurity, are still low. This was the policy response suggested by Gavin, Haussmann, and Talvi (1997) to tackle the vulnerability stemming from low domestic saving in Latin America.53
Another line of thinking is to insist on policy activism explicitly targeted at increasing the saving rate. The bad news is that, the ability of policy to affect the
77
53 This of course leaves unresolved vulnerabilities stemming from high and relatively short-term corporate indebtedness, which has risen substantially in recent years to some $125 billion by mid-2008.
private saving rate seems somewhat limited in Turkey, as elsewhere. The goodnews is that, an increase of a few percentage points of GDP is all that would benecessary, provided investment remains unchanged. In fact, some increase in thesaving rate is probably already underway because of improving demographics (a lower youth-dependency ratio) and social security reforms enacted in May 2008 (see below).
Furthermore, low Turkish saving seems to be a reflection of various factors, suchas a relaxation of liquidity constraints, catch-up from low levels of consumption ofdurables during the 2001 crisis, and a strong wealth effect, all of which have no orlittle impact on saving in the long-run. Finally, the Turkish saving rate did not respond positively to the strong growth experienced over the last 5 years, whereaspanel-data evidence suggests a positive link between the two. If growth were to persist, we may see the positive effect on saving over the longer-term.
What else could be done to encourage saving? One option is stronger fiscal policy. But not only that an increase in public saving does not translate into an equivalent increase in national saving —because of partial offsets in private saving— the room for further fiscal adjustment is limited in Turkey’s circumstances,largely for political reasons. In fact, we started seeing political pressures heightenvividly in early 2008, with the government stepping up infrastructure projects orspending in general, instead of putting the priority to increasing the budgetsurplus. While there may be some justification for this from a debt sustainabilityangle, relaxing fiscal policy is entirely inappropriate from a CAD/saving angle. Instead, targeting budget surpluses would appear to be the most effective approachin raising national saving, around which a consensus should be built.54
Another standard option is to encourage a shift from income taxes to consumption (indirect) taxes, which would stimulate saving since it would no longer be taxed. However, in Turkey, consumption taxes already make uptwo-thirds of tax revenue, in contrast to international practice, notably in OECD countries.
Liberalization of the financial sector and the development of institutions that facilitate long-term saving are another tool for increasing saving. Laws and practices in this area do not seem to be an impediment for long-term saving in Turkey, however. Liberalization of deposit rates occurred in the early 1980s in Turkey. The institutional framework for long-term saving —insurance, mutual
78
54 Rather than taking this route however, the government targets capping the budget deficit (including privatization revenue) at some 1.5% of GDP in the next several years, under, in our view, fairly benign assumptions on the macro environment.
funds, and private pension funds— is also fully in place.55 Portfolio allocation rules are not restrictive, unlike in some countries where the majority of funds under management by insurance companies and pension funds are required to beinvested in government bonds. As a result, returns on these instruments are competitive, and are thus not an impediment to long-term saving.56 Neverthelessthe number of participants in insurance, mutual funds and pension funds is quitelimited. The number of life-insurance policies is small, amounts under managementby mutual funds are some 3 percent of GDP, and there are only about 1.5 millioncontributors to private pension plans, with contributions of only $3.3 billion as ofDecember 2007, or some 0.5% of GDP.57 Still, participation is not out of line withother emerging markets with voluntary pension schemes, especially given the factthat pension funds only started operating in October 2003.
Interest taxation could be reduced; this could through a substitution effect leadto higher private saving. Or US-style Individual Retirement Accounts (IRAs), whichallow IRA contributions to be deducted from taxable income (with retirement income taxed in exchange, but at a lower tax-rate), could be introduced. However,these measures would be risky as they would also reduce government revenues.The overall impact on national saving would depend on how elastic private savingsare to the measures. The World Bank Saving Project concludes that, “tax incentiveshave only small effects on national saving, particularly when the negative effects onpublic saving are taken into account.” Our own finding that there is likely a substantial income effect on interest earners, which would go in the direction ofhigher consumption and lower saving, also suggests tax incentives may have a limited impact, though more research is necessary to verify this result.58
One could tax interest expenditures on credit card purchases to discourage borrowing for consumption purposes. (This goes rather in the opposite direction ofmeasures that were at some point under discussion to limit interest rates that canbe charged on credit cards). Other measures would be special consumption taxes,as in the past. However, these measures would complicate the already complex tax system.
79
55 The basic laws are the new 2007 Turkish Insurance Law, prepared in accordance with EU norms (replacing the 1959 Insurance Supervision Act and its various amendments), the 2007 Revision of the Mutual Funds Law (various laws dated 1993 through 2006), and the 2001 Law on Private PensionsSavings and Investments. The legal and institutional framework for private pensions was completed in 2002.
56 See, for instance, Mulheisen (1997) for a discussion of the case of India. 57 Group policies are very limited, constituting only 10% of total policies (the remainder being individual policies). Rules for vesting (portability of pension
rights when shifting employers) were initially unclear, reducing demand for group pensions, but these issues were largely resolved in 2006.58 Another factor limiting the impact on saving is the fact that the supply of capital tends to be highly elastic in the absence of impediments to capital flows.
In that case, interest rates net of taxes will not change, muting the impact on saving.

The May 2008 reform of the Turkish social security system includes a reductionin replacement rates.59 Lower replacement rates should lead to higher private saving rates over time, as individuals now need to provide for their own retirementto a greater extent than before. The May 2008 reform is in line with the general policy prescription of limiting future replacement rates.
“To the extent that countries meet the challenge of aging by expanding unfunded familial or public transfer programs, asset growth will be reduced, andthe second demographic dividend will be diminished. By contrast, if workers areencouraged to save and accumulate pension funds, population aging can boost capital per worker, productivity growth, and per capita income. Thus, policymakers, especially in developing countries, will need to focus on establishingfinancial systems that are sound, trusted, and accessible to the millions who wishto secure their financial futures. The time to do so is now so that, as a populationages, its growth-inducing potential will be realized.” Lee and Mason (2006).
These types of measures, however, only have an impact over the medium-term.This is because of grandfather clauses protecting existing rights, i.e. that accruedpension benefits cannot be reduced, so that the replacement rate will take time tofall. To further influence private saving, pedagogical means could be used. Publicrelations campaigns that highlight the size of prospective deficits in social security,and thereby emphasize funding difficulties in the future, would lead to higher private saving, as current contributors would realize that their benefits may be cutin future. An example of such campaigns is the case of Norway, which was relatively successful in deflecting pressures for spending oil revenues, by highlighting that these funds were necessary to fund future social security deficits.
Another prescription is to use public funded pension programs (where investorsreceive the returns on their saving), rather than PAYG programs. The latter tend to depress private saving to the extent people expect pension benefitsto exceed their pension contributions. A switch to a fully-funded system is however certainly no panacea for Turkey, notably because in the transition to sucha system, the government continues to be liable for existing pension liabilities, without having corresponding revenues. 60
80
59 The social security reform comprised the following: (a) the retirement age remains unchanged through 2035 (currently 60 for male and 58 for female), and then is raised by one year, every other year, to reach 65 for both sexes in 2048; b) the number of premium days is raised to 9,000 days from 7,000at SSK (it is already 9,000 days at Bag-Kur and ES) by increasing it 100 days every year from 2007 onward, thereby reaching 9,000 in 20 years; (c) thereplacement ratio (the ratio of the retirement salary to the earning base), which is already very high in Turkey (around 2.6%-3% depending on the fund),is slightly reduced to 2.5% through 2016, then falls to 2% from 2016 onward; and d) in determining the pensionable base, wages are valorized according to a (50-50) weighted average of inflation and wage growth, and all future pensions are indexed to inflation. Increases in the retirement ageand number of premium days required for benefits, while beneficial for the social security deficit (a longer period of contributions and a shorter one ofbenefits), do nothing to stimulate private saving.
60 Roldos (2007) documents the fiscal cost of the transition in Latin America.

8S E C T I O N
CONCLUSIONS

CONCLUSIONS
In this report, we found that Turkish overall and private saving rates have not been chronically low in the sense that, excluding Asia and oil-exporting countries,both have been about equal to emerging market averages over long periods. However, there is a chronic problem in another sense: the private saving ratetends to fall sharply during each boom period, as we’ve observed in this report. Having experienced its most recent boom from the aftermath of the 2001 financialcrisis until recently, this explains why the Turkish saving rate is currently low by international and its own historical standards.
Motivated by this observation, we proceeded to ask why saving has fallen dramatically during the last boom episode, by examining the “usual suspects” suggested by the theoretical and empirical literature. These usual suspects includeimproved prospects, higher access to credit, lower interest rates, the wealth effect,and Ricardian effects from higher public saving. We used macroeconomic data, confidence data and household survey data to shed light on the issue.
Our findings tend to favor explanations based on availability of ample liquidity,over that of improved prospects. Consumer confidence in Turkey, though it rebounded sharply in the immediate aftermath of the crisis, has not been particularly strong over the past several years. These findings point to the role played by rapid credit expansion and low interest rates, themselves the by-productsof a successful stabilization program and an exceptionally benign international environment.
We also found evidence of an effect of home-ownership: home-owners reducedtheir saving rate substantially, whereas the reduction was only minor for tenants.This result makes sense, given that tenants were relatively worse off as the result ofthe boom in house prices and rents, and also helps explain another finding in thereport, namely the large decline in savings among households headed by the elderly. Finally, we find that households with interest income did not reduce theirsaving, consistent with a relatively large income effect from reduced interest rates.The policy implication of this finding is that measures to stimulate saving by increasing its rate of return (such as reduced interest taxation), may not have muchof an impact.
83

While saving is likely to rise substantially by itself as the result of the financialcrisis of 2008, as liquidity dries up and economic prospects deteriorate, we can expect saving to fall again to 2007 levels in the next upturn when credit growth resumes. At that point an increase in the total saving rate of a few percentage points will be required to contain the current account deficit within the safe zoneof 2-3% of GDP.
A continued increase in public savings, together with increases in the private saving rate underway because of improved demographics (a decrease in the youth-dependency rate), which we estimate could raise saving rates by around 5% of GDP by 2025, and social security reform would put this within reach, without hurting growth too significantly. As for the increase in public savings, given the large offsets by private saving experienced in the past, care will have tobe taken to conduct monetary policy with a view to preventing large growth in credit and too rapid reductions in interest rates.
Looking further ahead, deepening in credit markets over time is to be expected given Turkey’s very low private credit/GDP ratio. This will place downward pressure on saving. While the buffer-stock theory and some empiricalevidence suggest that the effect of increases in credit may disappear in the long-run, even a temporary reduction in saving will pose challenges in the transition period, creating well-known vulnerabilities related to the current account.Structural reforms that buttress the productivity of investment, or more broadlyoverall “total factor productivity” in the economy, hold the possibility of reducingthe current account deficit without reducing growth and should therefore be thefocus of policy.
84

Bibliography
Attanasio, Orazio, James Banks, Costas Meghir, and Guglielmo Weber, “Humps and Bumps inLifetime Consumption,” Journal of Business and Economic Statistics, 17 (1), pp. 22-35 (1999).
Barro, Robert, “Are Government Bonds Net Wealth?”, Journal of Political Economy, 82 (6). (Nov.-Dev.), pp. 1095-1117 (1974).
Buiter, Willem, “Housing Wealth Isn’t Wealth,” Mimeograph July (2008).
Calvo, Guillermo and Carlos Vegh, “Inflation Stabilization and BOP Crises in Developing Countries,” NBER Working Papers No. 6925 (1999).
Campbell, John “Does Saving Anticipate Declining Labor Income? An Alternative Test of the Permanent Income Hypothesis,” Econometrica, 55, pp. 1249-74 (1987).
Carroll, Christopher, “The Buffer-Stock Theory of Saving: Some Macroeconomic Evidence,”Brookings Papers on Economic Activity, 1992(2), pp. 61–156 (1992).
----,“The Micro and Macroeconomics of Consumption: Some Thoughts On the Turkish Case”,Presentation at Conference on Micro and Macro Saving Behavior, Istanbul, June 2008, available on http://www.ku.edu.tr/ku/images/EAF/cc.pdf .
----, “Buffer-Stock Saving and the Life Cycle/Permanent Income Hypothesis,” Quarterly Journal of Economics, CXII(1), pp. 1–56 (1997).
----, “A Theory of the Consumption Function, With and Without Liquidity Constraints,” Journal of Economic Perspectives, 15(3), Summer, pp. 23-45 (2001).
----, “Theoretical Foundations of Buffer Stock Saving,” NBER Working Paper No. 10867 (2004).
Carroll, Christopher and David Weil, “Saving and Growth: A Reinterpretation,” Carnegie-Rochester Conference Series on Public Policy, 40, 133–192 (1994).
Carroll, Christopher D., Jody R. Overland, and David N. Weil, “Saving and Growth with HabitFormation,” American Economic Review, 90(3), pp. 341–355 (2000).
Carroll, Christopher, Misuzu Otsuka, and Jirka Slacalek, “How Large is the Housing WealthEffect: A New Approach,” NBER Working Papers 12746, December (2006).
Chamon, Marcos and Eswar Prasad, “Why Are Saving Rates of Urban Households in ChinaRising?,” IMF Working Paper No. 08/145, June (2008).
85

Deaton, Angus, “Saving and Liquidity Constraints,” Econometrica, 59 (September), pp. 1221-1248 (1991).
Deaton, A. and Christina Paxson, “Growth and Saving Among Individuals and Households,”The Review of Economics and Statistics, 82 (2): 212-225 (2000).
Dynan, Karen and Dean Maki, "Does Stock Market Wealth Matter for Consumption?", Finance and Economics Discussion Series, 2001-23, Board of Governors of the Federal ReserveSystem, May (2001).
Dynan, Karen, Jonathan Skinner and Stephen Zeldes, “Do the Rich Save More?”, Journal of Political Economy, 112(2), pages 397-444, April (2004).
Funke, Norbert, “Stock Market Developments and Private Consumption Spending in Emerging Markets,” IMF Working Paper No. 02/238, December (2002).
Gavin, Michael, Ricardo Haussmann, and Ernesto Talvi, “Saving Behavior in Latin America:Overview and Policy Issues,” Working Paper 346 Inter-American Development Bank May (1997).
Gourinchas, Pierre-Olivier, and Jonathan Parker, “Consumption Over the Life Cycle,”Econometrica, 70(1), 47–89 (2002).
Gross, David and Nicholas Souleles, “Do Liquidity Constraints and Interest Rates Matter forConsumer Behavior? Evidence from Credit Card Data,” Quarterly Journal of Economics, 117 (1), pp. 149-185 (2002).
Helliwell, John, “Demographic Changes and International Factor Mobility,” NBER Working Paper No. 10945, December (2004).
Higgins, Matthew, “Demography, National Saving, and International Capital Flows,”International Economic Review, V. 39, pp. 343-69 (1998).
International Monetary Fund, “Global Imbalances: A Saving and Investment Perspective,”World Economic Outlook, October (2005).
----, “Safe to Save Less? Assessing the Recent Decline in Turkey’s Private Saving Rate,” Turkey Selected Issues IMF Country Report 07/364 (2007).
Jappelli, Tullio, and Pagano, Marco, “Saving, Growth, and Liquidity Constraints,” Quarterly Journal of Economics, 109 (February), pp. 83-109 (1994).
86
----, “The Determinants of Saving: Lessons from Italy,” Interamerican Development BankResearch Network Working Paper R-313 (November 1997).
Laibson, David (1997), “Golden Eggs and Hyperbolic Discounting,” Quarterly Journal ofEconomics.
Lee, Ronald and Andrew Mason, “What is the Demographic Dividend?” Finance and Development, September, 43 (3) (2006).
Liu, Liang-Yn, and Wing Thye Woo, “Saving Behavior under Imperfect Financial Markets andthe Current Account Consequences,” Economic Journal, 104, No. 424, pp. 512-527, May(1994).
Loayza, N., K. Schmidt-Hebbel, and L. Serven, “The World Saving Database.” World Bank Manuscript. World Bank, Washington D.C. (1998).
Loayza, Norma, Klaus Schmidt-Hebbel, and Luis Servén, “Saving in Developing Countries: An Overview,” The World Bank Economic Review, 14 (3), pp. 393–414 (2000a).
----, "What Drives Saving across the World" The Review of Economics and Statistics, 82 (2), pp. 165-181, May (2000b).
Mankiw, N Gregory, "Consumer Durables and the Real Interest Rate," The Review of Economics and Statistics, 67(3), pp. 353-62, August (1985).
Masson, Paul, Tamim Bayoumi, and Hossein Samiei, "International Evidence on theDeterminants of Private Saving," World Bank Economic Review, 12(3), pp. 483-501, September (1998).
Mulheisen, Martin, “Improving India’s Saving Performance,” Finance and Development, pp. 38-41, June (1997).
Naughton, Barry, The Chinese Economy, MIT Press (2007).
Ogaki, Ostry, and Reinhart “Saving Behavior in Low- and Middle Income DevelopingCountries,” IMF Staff Papers, V. 43, No. 1, March (1996).
Ozcan, Kivilcim Metin, Asli Gunay, and Seda Ertac, “Determinants of Private Saving Behaviorin Turkey,” Applied Economics, 35, 1405-1416 (2003).
Haque, Namim, Pesaran, M. Hashem, and Sunil Sharma, "Neglected Heterogeneity andDynamics in Cross-country Savings Regressions," IMF Working Paper No. 99/128 (1999).
87
Rahman, J., “Current Account Developments in New Member States of the European Union:Equilibrium, Excess, and EU-Phoria,” IMF Working Paper, 08/92 (2008).
Rodrik, Dani, One Economics, Many Recipes, Princeton University Press, 2007.
----, “Saving Transitions,” World Bank Economic Review, 14, pp. 481-507 (2000).
Roldos, Jorge, “Pension Reform and Macroeconomic Stability in Latin America,” IMF Working Paper No. 07/108 (2007).
Romer, David, Advanced Macroeconomics, second edition, McGraw Hill, New York (2001).
Scholt, John Karl, Ananth Seshadri, and Surachai Khitatrakun, “Are Americans Saving“Optimally” for Retirement?”, Journal of Political Economy, 114 (4), pp. 607-43 (2006).
Schultz, T. Paul, “Demographic Determinants of Saving: Estimating and Interpreting theAggregate Association in Asia,” Yale University Economic Growth Center Discussion paper No.910 (December 2004).
Sierminska, Eva and Yelena Takhtamanova, “Wealth Effects out of Financial and HousingWealth: Cross Country and Age Group Comparisons,” Federal Reserve Bank of San FranciscoWorking Paper 2007-01, January (2007).
Skinner, Jonathan, “Are You Sure You’re Saving Enough for Retirement?”, Journal of Economic Perspectives, 21 (3) (Summer 2007), pp. 59-80.
Tobin, J. “Life Cycle Saving and Balanced Growth,” in William Fellner, ed., Ten Economic Studies in the Tradition of Irving Fisher, John Wiley (1967), pp. 231-56.
Yükseler, Zafer and Ercan Türkan, Türkiye’de Hanehalk›: ‹flgücü, Gelir, Harcama ve YoksullukAç›s›ndan Analizi, Küresel Ekonomiye Entegrasyon Sürecinde Büyüme Dizisi No:2, TÜS‹AD-TCMB-EAF Ortak Yay›n› (2008).
Vegh, Carlos, Open Economy Macroeconomics in Developing Countries, MIT Press, Cambridge(forthcoming).
Woo, Wing Thye, “The Structural Obstacles to Macroeconomic Control in China,” mimeograph Economics Department UC Davis (2004).
World Bank, Labor Markets in Turkey (2006).
88

Appendix I: Inflation-Adjustment of Private and Public Saving
Adjustment for inflation involves removing the interaction of inflation and netpublic debt held by residents. World Bank (1998) explains the procedure.
The inflation adjustment equals the difference between actual saving and measured saving. Adjusted saving is the nominal value of the change in real wealth over the period:
where S is saving in nominal terms, the superscript a denotes adjusted saving,NDD is net domestic liabilities, NFD is net foreign liabilities, p is the domestic price level and, e is the nominal exchange rate, a bar over a variable indicates itsperiod-average, and variables without bars are expressed in end-of-period values.
In contrast, measured (unadjusted) saving is simply the increase in assets, or thedecline in liabilities.
The difference between the adjusted and unadjusted saving is net capital gainsand also the required inflation adjustment. In our implementation, we ignore the effects of exchange rates changes. Thus we only calculate the inflation adjustmenton TL denominated net domestic debt.
Because the GDP deflator is available on an annual average basis, World Bank(1998) approximates the end-of-period price level at time t as a (geometric) avera-ge of the period-average price levels during periods t and t+1 as follows:
In the implementation, we calculate adjusted saving for the government and theprivate sector. We assume NDD for the government is equal to net public debt
89
S = -at (NDD /
tp - NDD / p
t t - 1 t - 1 )p -t (e NFD /
t tp - e NFD / p
t t - 1 t - 1 t - 1)pt
- -
S = -t (NDD -
tNDD
t - 1) -et
- (NFD - NFDt t - 1),
p =t
pt
pt - 1
-- a -- 1--a
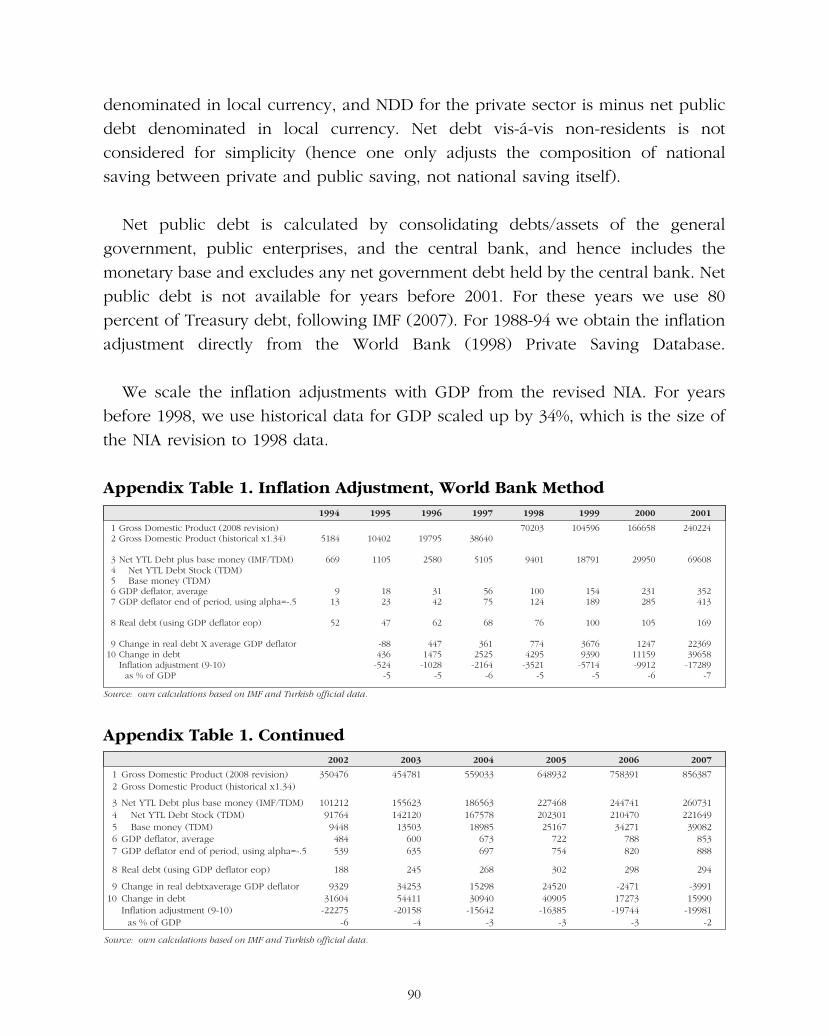
1994
5184
669
913
52
1 Gross Domestic Product (2008 revision)2 Gross Domestic Product (historical x1.34)
3 Net YTL Debt plus base money (IMF/TDM)4 Net YTL Debt Stock (TDM)5 Base money (TDM)6 GDP deflator, average7 GDP deflator end of period, using alpha=-.5
8 Real debt (using GDP deflator eop)
9 Change in real debt X average GDP deflator10 Change in debt
Inflation adjustment (9-10) as % of GDP
1995
10402
1105
1823
47
-88436
-524-5
1996
19795
2580
3142
62
4471475
-1028-5
1997
38640
5105
5675
68
3612525
-2164-6
1998
70203
9401
100124
76
7744295
-3521-5
1999
104596
18791
154189
100
36769390
-5714-5
2000
166658
29950
231285
105
124711159-9912
-6
2001
240224
69608
352413
169
2236939658
-17289-7
Source: own calculations based on IMF and Turkish official data.
2002
350476
2003
454781
2004
559033
2005
648932
2006
758391
2007
856387
101212917649448484539
15562314212013503
600635
18656316757818985
673697
22746820230125167
722754
24474121047034271
788820
26073122164939082
853888
188 245 268 302 298 294
1 Gross Domestic Product (2008 revision)2 Gross Domestic Product (historical x1.34)
3 Net YTL Debt plus base money (IMF/TDM)4 Net YTL Debt Stock (TDM)5 Base money (TDM)6 GDP deflator, average7 GDP deflator end of period, using alpha=-.5
8 Real debt (using GDP deflator eop)
9 Change in real debtxaverage GDP deflator10 Change in debt
Inflation adjustment (9-10) as % of GDP
932931604
-22275-6
3425354411
-20158-4
1529830940
-15642-3
2452040905
-16385-3
-247117273
-19744-3
-399115990
-19981-2
Source: own calculations based on IMF and Turkish official data.
denominated in local currency, and NDD for the private sector is minus net publicdebt denominated in local currency. Net debt vis-á-vis non-residents is not considered for simplicity (hence one only adjusts the composition of national saving between private and public saving, not national saving itself).
Net public debt is calculated by consolidating debts/assets of the general government, public enterprises, and the central bank, and hence includes the monetary base and excludes any net government debt held by the central bank. Netpublic debt is not available for years before 2001. For these years we use 80 percent of Treasury debt, following IMF (2007). For 1988-94 we obtain the inflationadjustment directly from the World Bank (1998) Private Saving Database.
We scale the inflation adjustments with GDP from the revised NIA. For years before 1998, we use historical data for GDP scaled up by 34%, which is the size ofthe NIA revision to 1998 data.
Appendix Table 1. Inflation Adjustment, World Bank Method
Appendix Table 1. Continued
90

Appendix II: Household Budget Survey Data: Under-Reporting
The household surveys of 2004-05 cover about 8000 households each, and over30,000 individuals.61 They provide extensive data on household income, expenditures, and assets. Incomes are in theory comprehensively measured as theyinclude the imputed rent on owner-occupied housing as well as the value of in-kind payments by employers and of own production. The 2004 and 2005 surveysdo not cover the same households. Thus comparisons that follow involve similarhouseholds only.
The surveys were carried out throughout the year, and each interview coveredincome in the current and previous 11 months and spending in the current month.Thus, for all but December survey participants, data refer in part to the prior year.TurkStat makes an adjustment to the income data to bring households sampled indifferent months on a comparable basis (e.g., for those sampled in January 2005,TurkStat applies an 11 month price-index, and for those sampled in December2005, it does not adjust the data). Because of this adjustment, and also because income refers to the last 12 months and spending only to the current month, income and spending are not strictly comparable. Because the effects tend to beoffsetting (the TurkStat inflation adjustment causes an upward bias to saving andthe measurement period difference between income and consumption a negativebias to saving) and to facilitate comparison with other studies that also use the rawdata, we preferred to work with the raw data than to make any adjustment.62 Weuse the variable “disposable income” based on 12-month income (“yilkulgel”). Thisvariable deducts regular transfers to family members as well as fines and fees fromincome.
An issue with the data is under-reporting of income, given the existence of a large underground economy coupled with concerns that the survey data might be
91
61 Surveys are also available for 1994, 2002, and 2003. Concepts are not always directly comparable in the 1994 and 2002 surveys, making it difficult to use these surveys.
62 As a check, we reversed the TurkStat inflation adjustment to obtain income for the past 12 months as reported by the household. We then derived household spending for the past 12 months from the monthly data by assuming monthly household spending moved in line with the national CPI. For example, we calculate average expenditures over the previous 12 months that are 3.9% less than January expenditures. Figures are slightly different fordifferent months of the year, and averages for the different months of the year are 3.8% in 2004 and 3.5% in 2005. Not having data on which monthhouseholds were sampled in, we used these averages to adjust the monthly spending data to bring it to a prior 12 month basis. These procedures yielda measure of annual spending which is comparable to annual income (prior 12 month basis unadjusted for inflation). The overall saving ratio usingthis measure is 9.4% in 2005, compared to 10.1% in the TurkStat data.
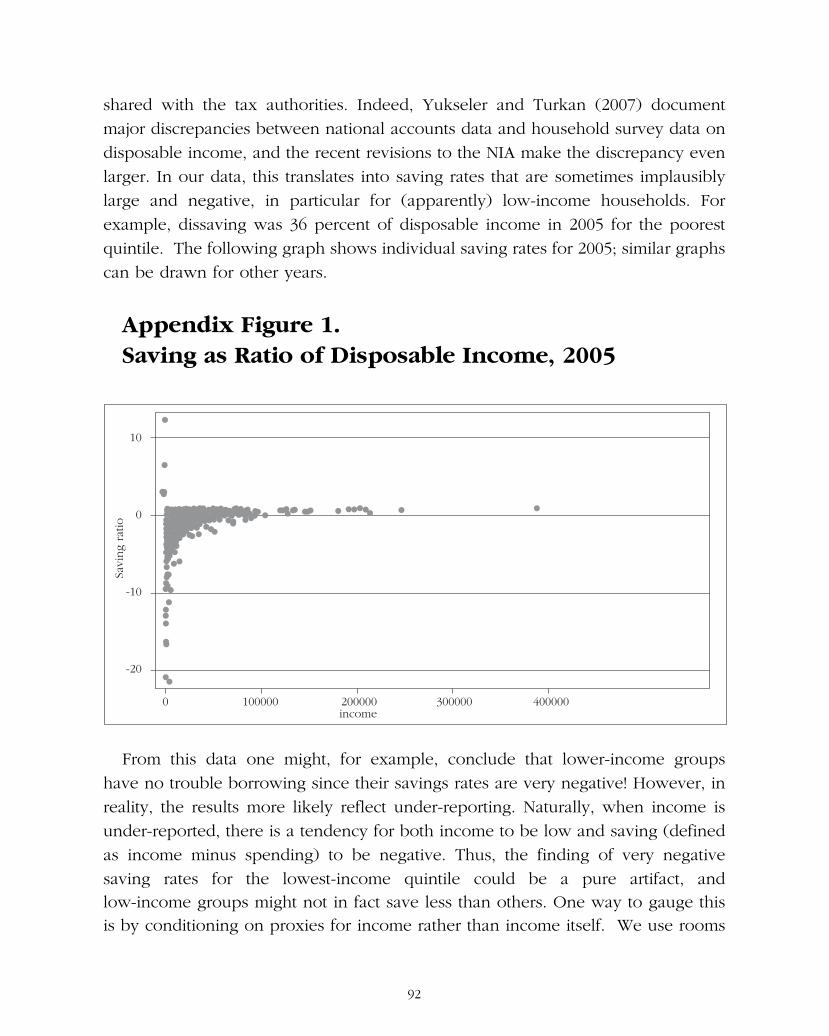
shared with the tax authorities. Indeed, Yukseler and Turkan (2007) document major discrepancies between national accounts data and household survey data ondisposable income, and the recent revisions to the NIA make the discrepancy evenlarger. In our data, this translates into saving rates that are sometimes implausiblylarge and negative, in particular for (apparently) low-income households. Forexample, dissaving was 36 percent of disposable income in 2005 for the poorest quintile. The following graph shows individual saving rates for 2005; similar graphscan be drawn for other years.
Appendix Figure 1. Saving as Ratio of Disposable Income, 2005
From this data one might, for example, conclude that lower-income groups have no trouble borrowing since their savings rates are very negative! However, inreality, the results more likely reflect under-reporting. Naturally, when income is under-reported, there is a tendency for both income to be low and saving (definedas income minus spending) to be negative. Thus, the finding of very negative saving rates for the lowest-income quintile could be a pure artifact, and low-income groups might not in fact save less than others. One way to gauge thisis by conditioning on proxies for income rather than income itself. We use rooms
92
10
0
-10
-20
Savi
ng r
atio
0 100000 200000income
300000 400000
per adult equivalent (using the OECD scale discussed in Section 5) as such aproxy.63 This way we find that the poorest quantile as defined by number of roomsin the house had a saving rate of 9% in 2005, much above the -36% when basedon the income data (Table 1), and comparable to the 10% average for all households. It is possible that even this number does not accurately reflect the saving rate, if the poor under-report more say by virtue of being more likely towork in the informal sector, where under-reporting is more prevalent (see below).
Further inspection of the graph shows that the data is clearly unrealistic. Thereare some 8 individuals with dissaving greater than 10 times disposable income, anda large number of individuals with less extreme, but still implausible negative saving rates. We consider dissaving in excess of annual income (i.e. saving equalto -100% of disposable income or a ratio of -1 in the graph) as abnormal or unrealistic. Dissaving in excess of annual income is 6% of our cases in 2005, a large figure. The figure is up from 4% in 2004, so under-reporting seems to be getting worse.
Which are the groups that tend to under-report? One way to find out is to checkthe extent of abnormally negative saving rates by group. We continue to define abnormal or unrealistic saving as dissaving in excess of income. The householdbudget survey data for 2004-05 show that households where the head of householdis self-employed are 50% more likely to have unrealistic saving than those wherethe head of household is an employee (results not reported). The same is true forhouseholds where the head of household works in a firm with less than 10 employees. Households whose head of household works in the private sector aremore than 4 times more likely to have unrealistic saving compared to their counterpart in the state sector. One would expect these groups to under-report toTurkStat if they also under-report to the tax authorities, which is more likely the case in the private sector than the state sector. Households with a green card arealmost 3 times more likely to have unrealistic saving than households without. Suchhouseholds might under-report because of fear that their means-tested benefits would be taken away. Difference in means tests show that these differences arestatistically significant. The fact that we find more abnormal cases amongst the groups where we would expect under-reporting is another finding (along with the sheer number of abnormal observations) supporting the idea that there is under-reporting.
93
63 By using adult equivalents, rather than number of persons, we take into account the fact that children have smaller room requirements than adults.
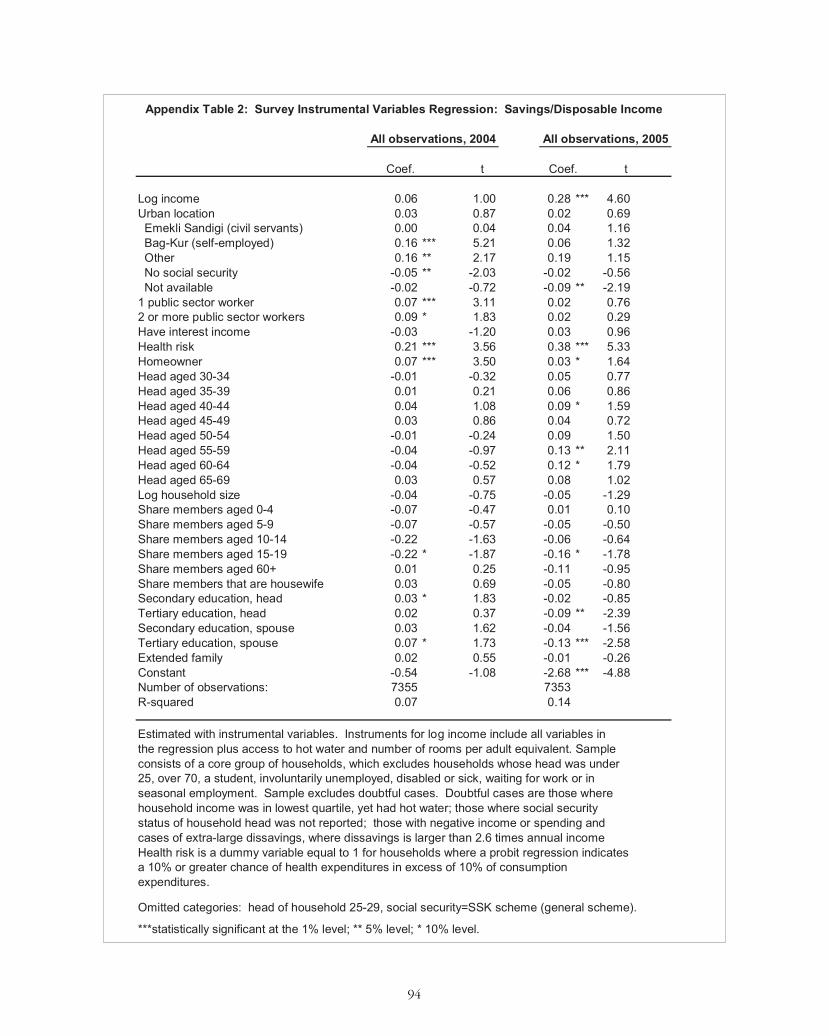
94
Coef. t Coef. t
Log income 0.06 1.00 0.28 *** 4.60
Urban location 0.03 0.87 0.02 0.69
Emekli Sandigi (civil servants) 0.00 0.04 0.04 1.16
Bag-Kur (self-employed) 0.16 *** 5.21 0.06 1.32
Other 0.16 ** 2.17 0.19 1.15
No social security -0.05 ** -2.03 -0.02 -0.56
Not available -0.02 -0.72 -0.09 ** -2.19
1 public sector worker 0.07 *** 3.11 0.02 0.76
2 or more public sector workers 0.09 * 1.83 0.02 0.29
Have interest income -0.03 -1.20 0.03 0.96
Health risk 0.21 *** 3.56 0.38 *** 5.33
Homeowner 0.07 *** 3.50 0.03 * 1.64
Head aged 30-34 -0.01 -0.32 0.05 0.77
Head aged 35-39 0.01 0.21 0.06 0.86
Head aged 40-44 0.04 1.08 0.09 * 1.59
Head aged 45-49 0.03 0.86 0.04 0.72
Head aged 50-54 -0.01 -0.24 0.09 1.50
Head aged 55-59 -0.04 -0.97 0.13 ** 2.11
Head aged 60-64 -0.04 -0.52 0.12 * 1.79
Head aged 65-69 0.03 0.57 0.08 1.02
Log household size -0.04 -0.75 -0.05 -1.29
Share members aged 0-4 -0.07 -0.47 0.01 0.10
Share members aged 5-9 -0.07 -0.57 -0.05 -0.50
Share members aged 10-14 -0.22 -1.63 -0.06 -0.64
Share members aged 15-19 -0.22 * -1.87 -0.16 * -1.78
Share members aged 60+ 0.01 0.25 -0.11 -0.95
Share members that are housewife 0.03 0.69 -0.05 -0.80
Secondary education, head 0.03 * 1.83 -0.02 -0.85
Tertiary education, head 0.02 0.37 -0.09 ** -2.39
Secondary education, spouse 0.03 1.62 -0.04 -1.56
Tertiary education, spouse 0.07 * 1.73 -0.13 *** -2.58
Extended family 0.02 0.55 -0.01 -0.26
Constant -0.54 -1.08 -2.68 *** -4.88
Number of observations: 7355 7353
R-squared 0.07 0.14
Omitted categories: head of household 25-29, social security=SSK scheme (general scheme).
***statistically significant at the 1% level; ** 5% level; * 10% level.
Appendix Table 2: Survey Instrumental Variables Regression: Savings/Disposable Income
All observations, 2004 All observations, 2005
Estimated with instrumental variables. Instruments for log income include all variables in
the regression plus access to hot water and number of rooms per adult equivalent. Sample
consists of a core group of households, which excludes households whose head was under
25, over 70, a student, involuntarily unemployed, disabled or sick, waiting for work or in
seasonal employment. Sample excludes doubtful cases. Doubtful cases are those where
household income was in lowest quartile, yet had hot water; those where social security
status of household head was not reported; those with negative income or spending and
cases of extra-large dissavings, where dissavings is larger than 2.6 times annual income
Health risk is a dummy variable equal to 1 for households where a probit regression indicates
a 10% or greater chance of health expenditures in excess of 10% of consumption
expenditures.


ISBN: 978-9944-405-50-8