the evolution of freeze tolerance in a historically
TRANSCRIPT
Louisiana State UniversityLSU Digital Commons
LSU Doctoral Dissertations Graduate School
2010
The evolution of freeze tolerance in a historicallytropical snailAlice B. DennisLouisiana State University and Agricultural and Mechanical College
Follow this and additional works at: https://digitalcommons.lsu.edu/gradschool_dissertations
This Dissertation is brought to you for free and open access by the Graduate School at LSU Digital Commons. It has been accepted for inclusion inLSU Doctoral Dissertations by an authorized graduate school editor of LSU Digital Commons. For more information, please [email protected].
Recommended CitationDennis, Alice B., "The evolution of freeze tolerance in a historically tropical snail" (2010). LSU Doctoral Dissertations. 1003.https://digitalcommons.lsu.edu/gradschool_dissertations/1003

THE EVOLUTION OF FREEZE TOLERANCE IN A HISTORICALLY TROPICAL SNAIL
A Dissertation
Submitted to the Graduate Faculty of the
Louisiana State University and
Agricultural and Mechanical College
in partial fulfillment of the
requirements for the degree of
Doctor of Philosophy
in
The Department of Biological Sciences
by
Alice B. Dennis
B.S., University of California, Davis 2003
May, 2010

ii
ACKNOWLEDGEMENTS
There are many people who have helped make this dissertation possible. I would first
like to thank my advisor, Michael E. Hellberg, for his support and guidance. Comments and
discussion with my committee: Drs. Sibel Bargu Ates, Robb T. Brumfield, Kenneth M. Brown,
and William B. Stickle, have been very helpful throughout the development of this project. I
would also like to thank those whose guidance helped lead me down this path, particularly Rick
Grosberg, John P. Wares and Alex C. C. Wilson.
Physiological trials in 2008 were conducted in the lab of Stephen Loomis at Connecticut
College, and could not have been completed without his assistance and contribution to this work.
I am grateful to all of those who have helped me with analyses and provided laboratory
assistance, especially Patricia C. Arbour-Reily, Peter Beerli, Bryan Carstens, Brent Christner,
Ron Eytan, Fernando Galvez, Alice Hudder, Michael Kaller, Joe Neigel, Mohamed Noor, Jen
Roach, Jackie Stephens, Deb Triant and Andrew Whitehead. Many people have also helped me
with field collections, including Tina Bell, Melanie Bishop, Rachel Collin, Chris Dennis, Ron
Eytan, Phillip Fenberg, Kari Galvan, David Johnson, Steve Loomis, Sarafaye Mahon, Ryan
Moody, Carlos Prada and Timothy Rawlings.
The funding I have received from the National Science Foundation, Louisiana State
University Biograds, Louisiana State University Graduate School, AAUW, Sigma Xi, the
Conchologists of America and the Society of Wetland Scientists has made much of this work
possible. A portion of this research was conducted using the resources of the Cornell Center for
Advanced Computing, which receives funding from Cornell University, the National Science
Foundation, and other leading public agencies, foundations, and corporations.

iii
TABLE OF CONTENTS
ACKNOWLEDGMENTS…………………………………………………………………….....ii
ABSTRACT…………..……………………………………………………………...................iv
CHAPTER
1 INTRODUCTION…..……………………………………………………...................1
2 ECOLOGICAL PARTITIONING AMONG PARTIALLY SYMPATRIC CRYPTIC
SPECIES …………………………………………………………………………………..….…4
3 TESTING FOR TROPICAL NICHE CONSERVATISM IN A BROADLY DISPERSING
MARSH SNAIL (MELAMPUS) …………………………………………………………..….…32
4 IDENTIFICATION OF SEASONALLY UP-REGULATED EXPRESSED SEQUENCE
TAGS IN MELAMPUS BIDENTATUS……………………………………………………..……61
5 CONCLUSIONS…………………………………………………………….............76
REFERENCES……………………………………………………………………………..…..79
APPENDIX A: COLLECTION LOCALES FOR ECOLOGICAL NICHE MODELING
AND IDENTIFICATION OF CRYPTIC SPECIES……………………………………….......98
APPENDIX B: PRINCIPAL COMPONENT MATRIX…………………………….100
APPENDIX C: SEASONALLY UP-REGULATED TRANSCRIPTS………...……102
VITA…………………………………………………………………………………….…….103

iv
ABSTRACT
Geographic range differences among species may result from differences in their
physiological tolerances. In the intertidal zone, marine and terrestrial environments intersect to
create a unique habitat, across which physiological tolerance strongly influences range. The
snail Melampus bidentatus occurs in coastal salt marshes in the western Atlantic and Gulf of
Mexico. I have used sequence data from one mitochondrial (CO1) and two nuclear markers
(histone H3 and a mitochondrial carrier protein, MCP) to identify three cryptic species within
Melampus bidentatus, and to infer their relationships to other Melampus. To identify
microhabitat differences between two cryptic species, I modeled their distributions using both
marine and terrestrial environmental data. Temperature largely explained their range
differences, but other environmental components (precipitation, salinity, and tidal height)
explained facets of the range that temperature cannot.
To test for phylogenetic conservation in freeze tolerance, I tested the mean lower lethal
temperature (LT50) of three temperate and three tropical species. Cryptic species of M.
bidentatus are significantly more freeze tolerant than their tropical relatives, although there was
variation among locales within species, most likely due to microhabitat variation. The temperate
species M. floridanus was also freeze tolerant, but without testing the LT50 of its closest relatives
in the Pacific, I cannot determine this represents an independent evolution of freeze tolerance, or
if this trait is more widely shared among Melampus. Nonetheless, the lack of freeze tolerance in
the most basal species that I have tested (M. bullaoides), and the predominantly tropical
distributions of most ellobiids, suggests that the evolution of freeze tolerance has allowed for the
invasion of the temperate zone by Melampus.
Using massively parallel sequencing, I have isolated > 500,000 expressed sequence tags
and assembled these into ~20, 000 seasonally expressed transcripts. A comparison of these

v
transcripts has revealed 2 candidate markers to test for their association with freeze tolerance in
M. bidentatus, and many more markers that can be used for further phylogenetic analyses in
Melampus. Further work to examine variation in both the sequence and expression of these
proteins is needed to determine if they underlie adaptive differences among species.
1
CHAPTER 1: INTRODUCTION
The causes and consequences of species range limits have been widely studied in
evolution and ecology (Gaston, 1998; Gaston, 2000; Gaston, 2003; Gaston, 2009). Across the
globe, species occupy ranges that vary widely in both size and in the span of environmental
variables they contain. Many groups are cosmopolitan while others species may be restricted to
a single mountain, river, or cave (Gaston, 2003). Differences in geographical range are driven
by a variety of factors, including environmental tolerance, dispersal, biotic interactions, and
history (Engle, Summers, 1999; Sexton et al., 2009). Classically, questions about range were
approached through the study of physiology (Spicer, Gaston, 1999), and early ecological studies
considered physiological limitations as a central factor limiting the occurrence of a species
(Pearce 1939, cited by Spicer, Gaston, 1999). The basis of this observation was that tolerance of
local conditions preceded all other forces that would constrain species range. In the time since,
this physiological focus was largely replaced by studies of biotic processes, including
competition and predation (Connell, 1961; Connell, 1972) and environmental processes such as
disturbance and succession (Sousa, 1984). Current research into the determinants of range limits
has been greatly expanded, and considers the roles of many factors including dispersal (Leibold
et al., 2004; Myers, Harms, 2009), predation (Lee, Silliman, 2006; Silliman, Zieman, 2001) and
history (Cunningham et al., 1991; Hickerson, Cunningham, 2005).
The physiological basis of range limits has garnered renewed interest for its contribution
to latitudinal gradients in species diversity. In particular, the process of tropical niche
conservatism hinges on the biological effects of temperature and its limit to geographic range
(Castaneda et al., 2004; Harrison, Whitfield, 2006; Stillman, 2002; Wiens, Donoghue, 2004;
Wiens, Graham, 2005). Under tropical niche conservatism, peak species richness in the tropics
may in part be due to curbs on dispersal from tropical to temperate regions, primarily though

2
limited tolerance of conditions in temperate regions (Gaston, 2009; Wiens, Donoghue, 2004;
Wiens, Graham, 2005). Temperature, and freezing conditions in particular, may limit the
poleward spread of tropical taxa (Farrell et al., 1992; Hylleberg, Siegismund, 1987; Rivadeneira,
Fernandez, 2005; Wiens et al., 2006). If adaptations to deal with cold and freezing temperature
arise rarely, their development may restrict tropical species from inhabiting temperate regions.
Over time, the limited dispersal from the tropics to temperate regions may contribute to reduced
species diversity in temperate regions. This highlights the need for renewed study of the
physiological basis of range limits, especially in light of new genetic tools available to look at
this in a phylogenetic context.
This dissertation sets out to examine the role of physiological differences in shaping
species ranges in Melampus, a group of intertidal snails. Melampus occupies coastal salt
marshes and mangrove swamps, primarily in tropical regions (Martins, 1996b). Occupying a
high intertidal position, Melampus is exposed to a range of environmental stresses, primarily in
extremes of temperature, salinity, and desiccation. Despite this tropical center of diversity, I find
three species whose range extends into the temperate zone, and into regions that regularly
experience freezing.
To determine how freeze tolerance has acted in the evolutionary history of Melampus, I
have set out with several goals. First, I have determined the range limits and habitats occupied
by three previously unknown cryptic species in the temperate zone. Based on these ranges, I
have modeled their ecological niche to determine what variables underlie range differences
among two cryptic species with overlapping ranges. Second, I have tested for physiological
differences among temperate and tropical species that explain the range differences that I
observe among temperate species. Third, I have constructed a phylogeny to determine if species
with tropical and temperate ranges are closely related and to compare physiological tolerance

3
with their genetic relatedness. Lastly, I have compared the sequenced a large number of highly
expressed molecules from snails collected in winter and in summer, and used these to identify
seasonally specific, up-regulated genes.

4
CHAPTER 2: ECOLOGICAL PARTITIONING AMONG PARTIALLY
SYMPATRIC CRYPTIC SPECIES
Interspecific differences in geographical range are driven by a variety of factors,
including differences in environmental tolerance, dispersal, biotic interactions and history (Engle
& Summers 1999; Gaston 2003; Sexton et al. 2009). The ability to tolerate a location's abiotic
environment is a minimal requirement for residing there, and the influence of climate on range
limits has been shown many times, both through the coincidence of species' ranges with
geographic shifts in climatic (Root 1988; Rogers & Randolf 1991; Gaston 2003) and with range
shifts associated with climate changes over time (Murawski 1993; Whittaker & Tribe 1996;
Mehlman 1997; Chen et al. 2009). When accounting for physiological causes of range
differences, many studies invoke a single niche component (e.g. temperature, Gaston & Spicer
1998; Stillman 2002; salinity, Bertness et al. 1992; Chen & Hare 2008; and pollutants, Cohen
2002), but ecological differences among species commonly depend on the combined interaction
of multiple environmental axes (Hutchinson 1957; Hylleberg & Siegismund 1987; Ackerly 2003;
Harmon et al. 2005; Alvarez et al. 2006; Colwell & Rangel 2009). Among highly similar
species, including cryptic species that can only be distinguished genetically, small differences in
environmental requirements may only be identified through multidimensional comparison
(Hirzel et al. 2002; Nosil 2008; Depraz et al. 2009; McCairns & Bernatchez 2008). The
identification of cryptic species and their corresponding ecological niches is important to
understand the creation and maintenance of biodiversity (Hellberg 2009; Oliver et al. 2009;
Bickford et al. 2007) and correctly interpret species relationships and history (Marko & Moran
2009).
In the marine environment, genetic analyses have revealed that many nominal species
are actually complexes of cryptic species (Knowlton 1993). This suggests that some marine
species may not be ecological generalists as previously thought, but are instead collections of

5
more ecologically specialized taxa (Grosberg & Cunningham 2001). The large number of
cryptic species in the ocean is particularly interesting given that many marine species produce
planktonic larvae, the dispersal of which can counteract local adaptation and genetically
homogenize populations over large areas (Broquet & Petit 2009; Brown et al. 2001; Hellberg
2009; Slatkin 1987). Despite this apparent dispersal ability, larvae are sometimes retained in
their natal habitat (Swearer et al. 2002), leading to reduced population connectivity and
increased local adaptation. Close examination has revealed instances where cryptic marine
species partition their habitat by environmental variables, including depth (Prada et al. 2008;
Vonlanthen et al. 2009), temperature (Miller et al. 2009b), and salinity (Bertness et al. 1992;
Chen & Hare 2008; McCairns & Bernatchez 2008).
The role of the environment in setting range limits in the intertidal has been long studied
(Connell 1961; Tomanek & Helmuth 2002). This is in part because geographic range changes
can often be simplified to one-dimensional shifts in this near-linear habitat (Barry et al. 1995;
Sagarin et al. 1999). Many intertidal species live near their limits of thermal tolerance (Helmuth
et al. 2006b; Somero 2002; Stillman 2002, but see: Gilman 2006; Helmuth et al. 2006a),
suggesting that small changes in temperature may be lethal and could lead to such range shifts
(Barry et al. 1995; Dong & Somero 2009; Miller et al. 2009a). Over the vertical space between
the high and low intertidal, temperature is a major stressor and conditions shift rapidly and
unevenly between locales, depending on air and water temperature, submersion period, and the
time of day when the tide is lowest (Helmuth et al. 2006a). Low tidal elevations require species
to be adapted to a largely subtidal lifestyle. At the highest portion of the intertidal, species must
endure long dry periods and a wide range of salinities (Bertness 1991; Bertness et al. 1992).
Outside of the intertidal, the critical temperature (maximum or minimum) that a species can
tolerate is often tied to range limits (Gaston 2003), and has been proposed as a factor limiting

6
geographical range in groups including insects (Strathdee & Bale 1998), fish (Cussac et al.
2009), plants (Lau et al. 2008), and amphibians (Wiens et al. 2006).
Melampus bidentatus (Ellobiidae, Pulmonata, Say 1822) is a pulmonate (air breathing)
snail reported from coastal salt marshes and mangrove swamps from southern Canada to the
northern Caribbean, a range spanning over 25º of latitude (Martins 1996b). Throughout its
range, M. bidentatus relies on decaying marsh grass (Spartina alterniflora) both as its primary
food source and as habitat (Rietsma et al. 1988; Graca et al. 2000). Its distribution has been
considered to be controlled by tolerance to physiological stressors (Bishop & Hackney 1987;
Daiber 1982), although snails can be preyed upon by the killifish Fundulus heteroclitus (Vince et
al. 1976) and by small crabs (Lee & Silliman 2006), and its occurrence at lower tidal elevations
may be restricted by competition with the periwinkle Littoraria irrorata (Lee & Silliman 2006).
Here, I investigate the environmental factors underlying different geographic
distributions for a pair of cryptic species within the nominal species M. bidentatus.
Physiological limitations are potentially important for these two species because they do not
appear to differ in their habitat or diet preferences, and appear capable of broad dispersal. Food
(Spartina) is not a limiting resource in this system (Thompson 1984), thus competition for food
is unlikely to have driven cryptic species within M. bidentatus to partition the habitat according
to diet. The planktonic larval stage of M. bidentatus should enable it to disperse widely, and I
use genetic estimates of connectivity to test that assumption here. M. bidentatus has a high
reproductive output (~33,150 eggs/female/year, Apley 1970), and its larvae spend 7-14 days in
the plankton (Russell- Hunter et al. 1972; Schaeffer et al. 1985), suggesting that some larvae
likely disperse over large distances every generation.
To identify differences in physiological tolerance that might underlie differences in
geographic ranges among cryptic species, I have predicted species distributions using ecological

7
niche models and defined the differences among the environments these species occupy using a
discriminant analysis. Estimates of connectivity and measures of genetic diversity among
populations within each species were used to test for evidence of ongoing dispersal and recent
population changes. These results suggest that while temperature plays a major role in shaping
range, other components of the environment (precipitation and salinity) explain features of
geographic range that temperature alone cannot.
Methods
Collections
Snails were morphologically identified as M. bidentatus (Say 1822) based on
observations of museum collections and the descriptions of Martins (1996b). Despite previous
mention of geographic variation in Melampus (Martins 1996b; Morrison 1950), no cryptic
species could be identified using shell coloring or shape. Collections were made at 74 coastal
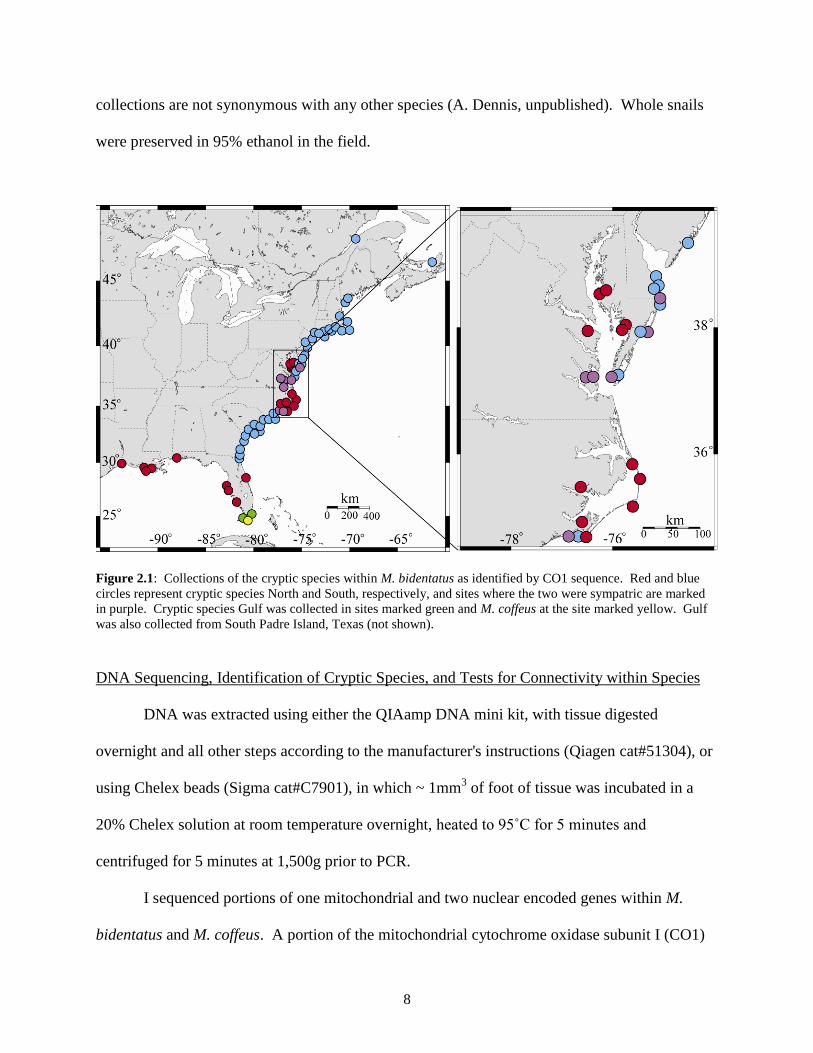
locales between Cape Breton, Nova Scotia and South Padre Island, TX between February 2005
and August 2008 (Figure 2.1, Appendix A), and were concentrated where the two Atlantic
cryptic species overlap (between Jacksonville, FL and Fenwick Island, DE, see Results).
Sequence data from Sapelo Island, GA were kindly provided by John Wares, and are a portion of
the M. bidentatus sequences used in Robinson et al. (2009). The reported (Martins 1996b) sister
species of M. bidentatus, M. coffeus, was found at nine locales within the range of M. bidentatus,
and was collected at three additional locales in the southern Caribbean (Appendix A). M.
bidentatus and M. coffeus are the only Atlantic representatives of the subgenus Melampus
Melampus (Beck 1837; Martins 1996b). Sequence data from other Melampus in the northern
Atlantic (M. Detracia bullaoides, M. D. floridanus, and M. D. monile) confirm that Melampus
Melampus is monophyletic and phylogenetically distant from M. Detracia sp., and that our
8
collections are not synonymous with any other species (A. Dennis, unpublished). Whole snails
were preserved in 95% ethanol in the field.
Figure 2.1: Collections of the cryptic species within M. bidentatus as identified by CO1 sequence. Red and blue
circles represent cryptic species North and South, respectively, and sites where the two were sympatric are marked
in purple. Cryptic species Gulf was collected in sites marked green and M. coffeus at the site marked yellow. Gulf
was also collected from South Padre Island, Texas (not shown).
DNA Sequencing, Identification of Cryptic Species, and Tests for Connectivity within Species
DNA was extracted using either the QIAamp DNA mini kit, with tissue digested
overnight and all other steps according to the manufacturer's instructions (Qiagen cat#51304), or
using Chelex beads (Sigma cat#C7901), in which ~ 1mm3 of foot of tissue was incubated in a
20% Chelex solution at room temperature overnight, heated to 95˚C for 5 minutes and
centrifuged for 5 minutes at 1,500g prior to PCR.
I sequenced portions of one mitochondrial and two nuclear encoded genes within M.
bidentatus and M. coffeus. A portion of the mitochondrial cytochrome oxidase subunit I (CO1)

9
gene was amplified using primers from Folmer et al. (1994): I used their primer HCO1 with a
modification of their LCO1 (MCO1: GGTCAACAAATCATAAGGATATTGG). The length of
useable CO1 sequence ranged from 440 to 650 bp, depending on sequence quality and whether
an individual was sequenced in both primer directions. To maximize the number of individuals
included in the analysis, all sequences were trimmed to 448 bp. A 316 bp portion of the histone
H3 gene was amplified using the primer pair H3F /H3R (Colgan et al. 2000). Both CO1 and H3
were amplified using the polymerase chain reaction (PCR) with an annealing temperature of
50˚C. A third marker was amplified using primers that were designed based on cDNA sequence
from M. bidentatus. I have tentatively identified this (using blastx) as a portion of the nuclear
encoded mitochondrial carrier protein/ADP-ATP transporter and called it MCP. Internal primers
designed from this marker (MCPL: GTCTGTTGGCCCACTTGACT and MCPR:
TCCTTGCATGGAATAACCAA) were used under standard PCR conditions with an annealing
temperature of 52˚C to amplify 128 bp. All sequence data was edited in Geneious (Drummond
et al. 2009) and aligned by eye; there were no indels. Heterozygous sites in MCP were resolved
to two haplotypes per individual using the PHASE feature of DNAsp v.5.00.02 (Rozas et al.
1995-2009), which uses the algorithms from PHASE (Stephens & Donnelly 2003). There were
no ambiguous sites suggesting heterozygosity in either H3 or CO1.
The aim of this sequence analysis was to identify genetically isolated groups rather than
to infer relationships among them. To achieve this, 476 CO1 sequences from snails
morphologically identified as M. bidentatus and M. coffeus (Table 2.2, 2.3) were used to
generate an unrooted neighbor joining tree in PAUP (Swofford 2003), and the percent
divergence within and between the groups that this generated was calculated in DNAsp using a
Jukes and Cantor model of nucleotide substitutions (Rozas et al. 1995-2009). The relatively
smaller number of differences at the two nuclear markers (H3 and MCP) was summarized based

10
on both the number of fixed differences and the average percent divergence among groups, also
calculated in DNAsp. Based on the unambiguous assignment of all M. bidentatus individuals to
3 clades with large (>20%) COI sequence divergence and parallel divergence at two nuclear loci,
I designated three groups within M. bidentatus as cryptic species and called them North, South
and Gulf (see Results). Remaining analyses of population structure were done within or between
the cryptic species and M. coffeus.
Only two of the cryptic species (North and South: Figure 2.1, Results) were found at
most US locales. To test whether dispersal limitation can explain the different range limits of
these two species, I used 448 bp of CO1 sequence from 407 individuals to estimate connectivity
among populations within cryptic species. High genetic diversity at CO1 meant that there were
few shared haplotypes either within or among collection locales, so that calculations of FST were
inappropriate (Hedrick 1999): with few haplotypes shared within sites, comparisons within sites
were similar to estimations among sites, suggesting complete panmixia (FST ≈0). Estimates of
migration among regions were instead made using the Bayesian inference method in the program
Migrate-n version 3.0 (Beerli & Felsenstein 1999, 2001; Beerli 2006). Migrate-n estimates
pairwise migration rates scaled by mutation (M = m/µ, where m = migration and µ = mutation)
among groups and simultaneously calculates θ (θ=Neµ for this haploid mitochondrial marker).
Collection locales were grouped for this analysis to determine dispersal patterns among regions,
rather than among neighboring marshes, and to reduce the number of simultaneously estimated
parameters. Within North, three groups were designated: N1, Locales above latitude 39˚, where
North is allopatric to South; N2, between latitudes 34.5˚ and 39˚, where North is sympatric with
South; and N3, below latitude 34.5˚, where North is allopatric to South. Four groups were
designated in South: S1, between latitudes 34.5˚ and 37˚, where South is in sympatry with North;
S2, below 35˚latitude, where South is in sympatry with North in the Carolinas; S3, the single

11
collection of South at Cape Canaveral, FL; and S4, South in allopatry in the Gulf of Mexico
(Figure 2.1, Table 2.3, 2.4). Each species’ transition: transversion ratio was set based on its
calculation in the program MEGA 4.1 (Tamura et al. 2007). Three preliminary runs, each
recording one of every ten geneologies out of 10,000,000 visited, with a burnin of 50,000 and an
adaptive heating scheme using 4 temperatures (1, 1.5, 3 and 1,000) were used to set starting
values of M (South: 174, 58, 78, 171, 574, 302, 339, 333 and 117; North: 195, 864, 110, 280,
239 and 82 ) and θ (South: 0.01963, 1.94, 0.0327 and 2.574; North: 2.35, 2.61 and 0.0256). The
final Migrate-n runs recorded 1,000,000 trees from 10,000,000 visited, with a burnin of 10,000
trees per chain and a static heating scheme (temperatures 1, 1.5, 3 and 6), and upper bounds for θ
and M of 10 and 1500, respectively. To verify that these sequences are not undergoing
recombination (an assumption of Migrate-n) the entire alignment was tested using a maximum
chi square test (maxchi2, Smith 1992; Piganeau et al. 2004). To test for among region
differences in genetic diversity that could indicate recent range expansions or genetic
bottlenecks, haplotype diversity and Tajima’s D were also calculated for North and South using
the same 7 groups of locales as in Migrate-n (above).
Ecological Niche Modeling
To compare the environments occupied by cryptic species North and South, I constructed
their ecological niches. Cryptic species composition of 15 locales, in addition to the 65 above,
was identified based on sequencing in only one primer direction. These sequences were often
relatively short (250-440 bp) and thus were not included in the above analysis of population
connectivity. To predict where each species occurs over geographic space, I used a maximum
entropy model implemented in the program Maxent (Phillips et al. 2006; Phillips & Dudik
2008), in which the probability of a species’ occurrence is estimated based on a uniform
probability distribution (maximum entropy) and on presence data provided by the user. I chose

12
to use Maxent because it can be used with presence-only data (Bigg et al. 2008; Elith et al. 2006;
Graham & Hijmans 2006). Our two northernmost collections (Appendix A) were excluded from
niche modeling because they were not covered by some environmental layers. Because the
cryptic species require identification from sequence data, I did not include collections other than
our own (Lozier et al. 2009).
I used both marine and terrestrial data to model the intertidal environment. A total of 77
geo-referenced environmental layers were obtained (Table 2.1). The Worldclim website
(Hijmans et al. 2005) provided all terrestrial data: monthly maximum and minimum
temperatures, monthly precipitation and their 19 bioclimatic variables were downloaded at a 2.5
arc-map unit resolution. Monthly, seasonal, and annual sea surface salinity for 2005 were
downloaded from the National Oceanographic Data Center’s World Ocean Atlas (Antonov et al.
2005) and interpolated in Arcmap using the IDW method with a fixed radius of 0.5 (Childs 2004;
ESRI 1999-2006). Sea surface temperature (SST) was downloaded as a geoTIFF from the
Global Ocean Surface Temperature Atlas Plus (Rayner et al. 1997). Mean tidal height was
downloaded from the USGS database of Coastal Vulnerability to Sea-Level Rise (Thieler &
Hammar- Klose 1999, 2000). All layers were trimmed to an extent that broadly encompassed
the reported range of M. bidentatus (-113, 12, -52, 56) and converted to a cell size of 0.4167 to
match the resolution of the Worldclim layers. Maxent produces ecological niche models only for
areas where all environmental data are present, so all predictions resulted in a thin strip of coast
(Figure 2.3). When the environmental layers covered more land than the intertidal (e.g. the
simulations that were run using only terrestrial data covered all of North America), I restricted
the simulation to the coast by including an additional, uninformative environmental layer that
contained a single datum along the coast.

13
Maxent was run with six configurations of environmental layers to compare the predicted
niche resulting from different components of the environment (Table 2.5). It was first run (1)
with all 77 layers. To determine the independent effects of the land and sea, it was then run
using (2) only terrestrial layers and (3) only marine layers (Table 2.1). These first three
configurations suggested that temperature played a major role in predicting range. To test for the
independent contribution of variables related and unrelated to temperature, variables were
separated for additional runs using (4) only temperature layers (maximum and minimum
terrestrial temperature, sea surface temperature and bioclim variables 1-7 and 10-11) and (5) all
non-temperature layers (precipitation, mean tidal height, ocean salinity and bioclim 12-17).
To reduce the use of highly correlated environmental layers, a reduced model (6) was
built using 19 environmental layers according to the following criteria. Pairwise regression in
DIVA (Hijmans & Spooner 2001) showed all maximum and minimum temperature layers to be
highly correlated (r2>0.9). Tmax10 (maximum temperature in October) and tmin2 (minimum
temperature in February) were chosen from these because they repeatedly had the highest
contribution when Maxent was run using all variables (based on jackknifing of model gain in the
test and training data). Sea surface temperature from April to June (SST2) was chosen because it
was the most highly correlated with the other three seasonal averages (respective r2 values: 0.72,
0.75 and 0.92). All ocean salinity files were also highly correlated with each other (r2>0.9), so
winter salinity was chosen because it contributed the most to Maxent runs with all variables.
Precipitation files were not as highly correlated among months, but in runs with the full model,
the highest contribution was made by precipitation in February, March and June and August.
Bioclim layers 1-3, 7-9 and 15-19 were used because they are not significantly correlated in
North America (Rissler & Apodaca 2007).

14
All six configurations of the environmental layers were used to construct niche models in
Maxent version 3.3.0 (Phillips et al. 2006) using the species locations of North and South as
shown in Figure 2.1 and Appendix A. Maxent was run for 10 replicates with the default settings,
except that I randomly set half of the points to build the model and the other half to test it.
Models were evaluated based on receiver operating characteristic (ROC) analysis. This
generates the AUC (area under the curve) score, a measure of how well the data fits the model;
values closer to 1 indicate better fit between the model and the data and 0.5 indicates that the fit
is no better than random. For all models, the AUC score was generated for both the random half
of the data used to build the model (training) and for the remaining data (test). This value
represents the probability of species occurrence at the collection locale according to the model
generated by Maxent.
The ranges of both North and South contained several features that marked their
distributions as being more complex than the simple latitudinal replacements of one another. To
examine the presence of these features in the model output, I made a visual comparison between
the predicted range generated by Maxent and the known species extent (Figure 2.1). In
particular, I looked for the following features: (1) correct northern and southern range limits, (2)
the absence of South in the SC-FL region and the (3) absence of North from locales inside the
Chesapeake Bay.
For each model, I compared the outputs using ENMtools (August 2009 version),
following the methods of Warren et al. (2008). Briefly, I measured how far the output of North
and South were from identical (‘niche overlap’) using Schoener’s D and a standardized version
of Hellinger distance (calculated as I, see Warren et al. 2008). This measure was compared to
the test of ‘niche identity’, which builds niche models based on a set of pseudoreplicates
generated from a random sampling from all of our data points, pooled for both species. I

15
generated 100 of these pseudoreplicates and compared the distribution of these simulations to the
actual niche overlap Maxent runs that were created using all points to build the model. If the
niche identity generated from the combined pool is greater than the actual niche overlap between
species, the two ecological niches are less similar than random. I have not included range
predictions for the last glacial maximum (Cordellier & Pfenninger 2009; Richards et al. 2007)
because preliminary runs did not generate distributions that differed between the two species,
likely due to the absence of marine data in the available climate models.
Table 2.1: Summary of environmental layers used in ecological niche modeling. Shaded rows
indicate marine data.
Layer Source Resolution Number of
layers
Terrestrial temperature:
monthly maximum and
minimum
Worldclim (Hijmans et al. 2005) 2.5arc-min 24
Terrestrial
precipitation: monthly
average
Worldclim (Hijmans et al. 2005) 2.5 arc-min 12
19 bioclimatic
variables, terrestrial
(Bio1-Bio19)
Worldclim (Hijmans et al. 2005) 2.5 arc-min 19
Ocean salinity:
monthly, seasonally
and annual averages
National Oceanographic Data
Center’s World Ocean Atlas
(Antonov et al. 2005)
¼ degree 17
Sea surface
temperature: seasonal
averages.
Global Ocean Surface Temperature
Atlas Plus (Rayner et al. 1997)
4 km 4
Mean tidal height USGS database of Coastal
Vulnerability to Sea-Level Rise
(Thieler & Hammer-Klose 1999,
2000)
3 arc-min 1
Point Based Analysis of Environmental Variables
Despite the use of our ‘reduced’ model, pairwise comparisons showed some layers were
still correlated. To reduce these correlations and to avoid spatial autocorrelation (Legendre

16
1993), I conducted a principal components analysis (PCA) based on the environmental data
extracted for each of our collection points. At each collection point, environmental data from all
layers was extracted to a spreadsheet using ArcMap. A detrended correspondence analysis
(DCA) conducted in Canoco for Windows 4.5 (ter Braak 1995) produced an axis length less than
2, suggesting that the data are linear and a PCA is appropriate for this data (Lepš & Šmilauer
2003). The PCA was performed in SPSS (release 16.0.1) with the principal components rotated
by the varimax procedure prior to interpretation and extraction to maximize the separation
among components. I chose to use the first six components as variables because these were the
only components whose eigenvalues exceeded one, and this value declined quickly in subsequent
components (Kaiser 1960). Although there may be problems with using this criterion for
variable cutoff with a large number of variables (Netemeyer et al. 2007), the scree plot leveled
off after the first three components and the first six components explained 96% of the variance,
suggesting that these six components largely encompass the variance of the system (Stevens
2002). These components were extracted as variables in SPSS, thus reducing the 77
environmental variables to a set of six uncorrelated variables.
To quantify the differences between North and South, these six variables were used as
independent variables (a requirement of discriminant analysis) in a standardized discriminant
function in SPSS, conducted to differentiate the two species. The discriminant analysis uses the
environmental variables (now arranged as linear principal components) to build a linear function
that defines the difference between two groups. The sign and magnitude of each variable in the
discriminant function can be used to interpret their role in differentiating the two cryptic species.
Larger magnitude variables are interpreted as having the greatest role in differentiating North
and South. Results of the discriminant analysis were evaluated based on the number of
collection locales for which the cryptic species they contained were correctly identified.

17
Figure 2.2: Unrooted neighbor joining tree based on 448 bp of CO1 data, representing 450 individuals identified as
M. bidentatus and its morphologically defined sister species, M. coffeus.

18
Results
Cryptic Species within M. bidentatus
A total of 476 individuals morphologically identified as M. bidentatus (N=422) and M.
coffeus (N=54) were sequenced for 448 bp of CO1, 68 for 316 bp of H3 and 73 for 128 bp of
MCP. These three genes had 166, 5 and 16 variable sites, respectively, resulting in 269, 5 and 20
haplotypes across all individuals. CO1 sequence from individuals identified as M. bidentatus
grouped into three monophyletic groups separated by 22-24% sequence divergence (Table 2.2,
Figure 2.2). These same groups were also genetically distinct at the two nuclear loci, Histone 3
and MCP, differing by 0.62-0.98% and 1-5%, respectively (Table 2.2). There were no
haplotypes shared between cryptic species at any marker.
I assigned names to the three groups within the nominal M. bidentatus based on
their different geographic ranges (Figure 2.1). ‘North’ ranged farthest north (>47ºN) and was the
only species found above 39º N latitude. Its range extended south to northern Florida, but it did
not occur in the Gulf of Mexico. ‘South’ occurred on the Atlantic coast from Delaware to
approximately Cape Canaveral, FL and was also found in the northern Gulf of Mexico. North
and South were the only species that occurred regularly in temperate areas. North and South
spanned 18˚ and 12˚ of latitude, respectively and shared a large portion of their ranges
(approximately latitudes 34.5ºN to 39ºN, Figure 2.1). South was not found at any Atlantic
localities between 30ºN and 34.5ºN despite sampling at 11 locales in this area, including both
coastal and low-salinity estuarine sites. The third cryptic species, ‘Gulf’, was found only in
southernmost Texas and Florida.
Genetic diversity within species was high for CO1, and most regions contained nearly as
many haplotypes as individuals sampled (Table 2.3). At the same time, shared haplotypes were
found across the entire range extent of both species (e.g. from Virginia and Louisiana in South

19
and from New Brunswick Canada and Florida in North). Estimates of θ were highest in the two
northern groups of North and in the Gulf of Mexico and North Carolina regions of South (Table
2.3). Estimates of haplotype diversity and θ were low in two regions: the southernmost group in
North (Group 3N in Table 2.3) and the Cape Canaveral (S3) collection of South.
Migrate-n results suggested that geographically disconnected regions exchange many
migrants (Table 2.4). Pairwise estimates of the effective number of migrants per generation were
high for most comparisons (52-932). In both species, northward exchange of migrants was
generally lower (North: 52-758; South; 57-291) than southward migration estimates
Table 2.2. MtDNA (above) and nuclear (below) sequence divergence among and within (shaded
diagonal) M. Melampus sp.
CO1
H3/MCP
M. bidentatus
North (278)
M. bidentatus
South (127)
M. bidentatus
Gulf
(21)
M. coffeus (50)
M.
bidentatus
North
(24/56)
CO1: 1.32% ±
0.04
H3: 0%
MCP: 0.24% ±
0.08
CO1: 23.93% ±
0.67 (19)
CO1: 25.07% ±
1.56 (30)
CO1: 23.09% ± 0.96
(27)
M.
bidentatus
South
(17/60)
H3: 0.62% ±
0.19% (1)
MCP: 5.45% ±
0.78 (5)
CO1: 2.217% ±
0.09
H3: 0.04% ±
0.03
MCP: 0.63% ±
0.07
CO1: 22.03%±
1.14 (35)
CO1: 20.91% ± 0.78
(17)
M.
bidentatus
Gulf (8/16)
H3: 0.96% ± 0.29
(3)
MCP: 4.90% ±
0.32 (4)
H3: 0.97% ±
0.31(3)
MCP: 1.34 ±
0.17 (0)
CO1: 3.00 % ±
0.25
H3: 0%
MCP: 1.22% ±
0.24
CO1: 26.28 % ± 1.54
(39)
M. coffeus
(8/14)
H3: 0.96% ±
0.38% (3)
MCP: 6.91% ±
0.40 (4)
H3: 0.98% ±
0.39 (3)
MCP: 2.79% ±
0.19 (0)
H3: 0.64% ±
0.26 (2)
MCP: 2.62% ±
0.31 (0)
CO1: 4.42% ± 0.81
H3: 0%
MCP: 1.20% ± 0.47
Percent divergence and standard deviation from one mitochondrial (CO1) and two nuclear (H3
and MCP) markers. Number of alleles for respective marker is in parentheses next to the species
name.

20
(North: 162-932; South 350-816). Migration estimates between the Gulf of Mexico and Atlantic
groups of South were also high, particularly the exchange between the Gulf and North Carolina
(553 and 346). Values of Tajima’s D were significantly negative in North, but not South (Table
2.3), consistent with North being in the process of range expansion. Given the inferred
southward direction of migration in North and the low variation in the southernmost population,
such an expansion would appear to be to the south. The maxchi2 test found no evidence of
recombination in the CO1 sequence data.
Table 2.3: Genetic diversity within cryptic species North and South, divided by region.
Cryptic
species Group Region N Hd Tajima’s D θ (95%CI)
M.
bidentatus
NORTH
N1 Allopatric North
above 39º latitude
116 (73) 0.968
(0.009)
-1.97* 2.4 (0, 7.7)
N2 North in sympatry
w/ South (34.5º-
39º)
65 (49) 0.969
(0.013)
-2.28** 6.1 (1.9, 10)
N3 Allopatric North
below 34.5º
latitude
97 (42) 0.771
(0.046)
-2.21** 0.024 (0, 0.18)
NORTH OVERALL 278 (148) 0.924
(0.013)
-2.30**
M.
bidentatus
SOUTH
S1 In sympatry w/
North (47-39º)
60 (25) 0.902
(0.024)
-1.69 ns 0.019 (0, 0.16)
S2 North Carolina
(below 35º )
19 (14) 0.953
(0.036)
-1.21 ns 4.7 (0.06, 7.5)
S3 Cape Canaveral ,
FL
16 (7) 0.625
(0.139)
-1.76 ns 0.0058 (0,
0.16)
S4 Gulf of Mexico:
FL, AL and LA
33 (32) 0.998
(0.008)
-1.69 ns 5.9 (1.62, 10)
SOUTH OVERALL 127 (72) 0.961
(0.009)
-1.89*
Allopatry and sympatry of North and South are in reference to one another. All estimates are
based on 448bp of CO1, using the individuals summarized in table 2.1. Number of individuals,
N, includes their number of haplotypes in parentheses. Mean estimate of θ includes the 95%
confidence intervals and haplotype diversity (Hd) is given with one standard deviation.
Significance levels of Tajima’s D: **p <0.01, * p<0.05.

21
Table 2.4: Pairwise migration rates (M = Nefµ) within cryptic
species.
M. bidentatus NORTH M. bidentatus SOUTH
N2→N1 52.3 (0,147) S2→S1 165.7 (0, 430)
N3→N1 758.4 (549, 978) S3→S1 57.4 (0, 164)
N1→N2 932.1 (528, 1410) S4→S1 72.8 (0, 212)
N3→N2 279.4 (39, 534) S1→S2 816.9 (566, 1000)
N1→N3 162.1 (0, 471) S3→S2 291.4 (0, 744)
N2→N3 175.4 (36, 336) S4→S2 553.5 (534, 1000)
S1→S3 350.3 (0, 844)
S2→S3 405.1 (0, 894)
S4→S3 588.7 (218, 1000)
S1→S4 75.5 (0, 192)
S2→S4 346.1 (72, 630)
S3→S4 88 (0, 184)
Based on 448 bp of CO1, using the groupings described in table
2.3. Mean estimates of M include the 95% confidence intervals.
Ecological Niche Modeling
A total of 497 individuals were genetically identified as cryptic species North or South
and used to construct ecological niche models. According to the AUC criteria, the best
performing models in Maxent (Table 2.5) were those constructed using only temperature data
(Figure 2.2, test AUC 0.934 and 0.905) and only terrestrial data (test AUC 0.981 and 0.940).
These two models overlapped in 33 variables and were similar, except that the land-only data set
predicted North to occur at low levels in the northeastern Gulf of Mexico (not shown). Among
other data sets, AUC scores for the test points were around 0.7 (Table 2.5), suggesting that the
predictions of any variable combination was better than random (for which AUC=0.5).
Some major features of the two species' ranges (range limits, the absence of South
between SC and FL, and the absence of North in the inner Chesapeake Bay) were not predicted
by the models that had the highest AUC scores (Figure 2.3). The value of the AUC score as a
primary judge of model accuracy has been questioned previously (Lobo et al. 2008). Neither the
terrestrial-only nor the temperature-only models (AUC scores 0.905-0.994) predicted the absence

22
of South from the southern Atlantic coast between SC and FL (Figure 2.3). The predicted
northern range limits of North and South were the same in the temperature-only model, despite
the ~1,200 km difference in where these endpoints actually occur. The absence of South in the
SC-FL region was best predicted by the model built using all non-temperature variables and the
reduced model, whose outputs were similar (the non-temperature output is shown in Figure 2.3).
The output from the remaining models looked similar to the non-temperature variable model; the
full model predicted a lower probability of the occurrence of South throughout the Gulf of
Mexico, and the water-only model overpredicted North at southern sites. Interpretation of
variable contribution is difficult when there is high correlation among layers, but all simulations
that included tidal height (represented by a single layer) ranked it highly, according to the gain
and jackknife values. Models run without the tidal height layer (not shown) did not predict the
absence of South in the SC-FL region.
Table 2.5. Summary of ecological niche models generated for cryptic species
North and South.
Variables used Species AUC test
(train)
Niche Similarity
I(D)
1. Full model NORTH 0.755 (0.919)
0.656 (0.498) SOUTH 0.721 (0.864)
2. Only terrestrial
variables
NORTH 0.981 (0.993) 0.703 (0.612)
SOUTH 0.940 (0.994)
3. Only marine
variables
NORTH 0.745 (0.870) 0.699 (0.516)
SOUTH 0.570 (0.704)
4. Only Temperature
variables
NORTH 0.934 (0.965) 0.775 (0.642)
SOUTH 0.905 (0.919)
5. All non- temperature
variables
NORTH 0.766 (0.899) 0.7033 (0.550)
SOUTH 0.705 (0.827)
6. Reduced model NORTH 0.776 (0.883)
0.691 (0.517) SOUTH 0.667 (0.813)
Niche similarity between North and South, measured by I (standardized
Hellinger distance) and D (Schoener’s D). The shaded rows are pictured in
Figure 2.3.

23
Table 2.6. Results of principal components and discriminant analyses.
Principal
Component
Eigenvalue Percent of
Variance
Cumulative
Percent
Variables Canonical Discriminant
Function Coefficient
41.6 54.1 54.1 Temperature (water and
air), Precipitation: June
& July
0.958
2 19.2 24.9 79.0 Ocean Salinity -0.768
3 7.9 10.3 89.3 Precipitation 0.265
4 2.1 2.7 92.0 Diurnal temp. range
(Bio2)
-0.358
5 1.6 2.1 94.0 Temperature of driest
quarter (bio 9)
0.088
6 1.5 2.0 96.0 Primarily precipitation
variables
0.439
Point-Based Analysis
The principal components analysis (PCA) produced six components with eigenvalues
greater than 1, which together explain > 96% of the variance (Table 2.6). Eigenvalues of
additional components were small (each contributed < 1% to the remaining variance) and were
excluded from subsequent analyses. The six principal components can be lumped into categories
according to the environmental variables with large loading values (>0.6) in the component
matrix (Appendix B). I summarized the components to represent: (1) land and sea surface
temperature (as well as a few precipitation layers, mostly from warm months), (2) ocean salinity,
(3) precipitation, (4) mean diurnal temperature (bioclim2), (5) temperature of the driest quarter
(bio 9), and (6) some precipitation, but no variables were strongly correlated. PCA analysis
using only the ‘reduced’ model (of 19 variables, not shown) yielded similar results, except
salinity and temperature were grouped into the same component, likely because the reduced
model included only one variable representing salinity.
The two species were separated in one dimension by a discriminant analysis (Wilks’ =
0.548, 2
p<0.0001). The first five principal components appeared to be important in separating
the two species (absolute value of Standardized Canonical Discriminant Function Coefficients

24
Figure 2.3: Predicted distributions of cryptic species North and South generated in Maxent. Green indicates a
higher probability of species occurrence than blue. Distributions on the left were generated using only temperature
data (test AUC 0.934 North, 0.905 South). Distributions on the right were generated using all variables besides
temperature (test AUC 0.766 North, 0.705 South). The white arrows indicate incorrectly predicted northern range
limits from the temperature-only model. The purple arrow indicates the correct prediction of the absence of South in
the Georgia/South Carolina area, a feature predicted only by models that included tidal height. Inset maps show the
Chesapeake Bay and Pamlico Sound area. Below the images are null distributions showing the overlap statistic (I)
for North and South generated using 100 randomizations. The orange arrow indicates the value of I in actual
Maxent runs using all locality points, showing that the two maps above are less similar than expected by chance.

25
between 0.257 and 0.846, Table 2.6). The positive values associated with temperature
(component 1), precipitation (component 3) and diurnal temperature range (component 4)
suggest that increases in their values are associated with South, whereas increases in ocean
salinity (component 2) and temperature of the driest quarter (component 5) are associated with
North (Table 2.6). Components 1 (temperature) and 2 (salinity) had the strongest influence on
the discriminant equation (0.846 and -0.684, respectively). The contribution of each variable in
the structure matrix paralleled that of the discriminant coefficients (not shown). The contribution
of the tidal height layer was almost evenly distributed among all principal components
(Component 1: -0.304, Component 2: 0.444, Component 3: -0.194, Component 4: 0.308,
Component 5: -0.151, Component 6: 0.126).
Although the discriminant function was able to differentiate North from South, it placed
six of 26 South locales and seven out of 46 North locale into the wrong group. Of these 13
misdiagnoses, six were from collection locations that contained both species in sympatry. Three
of these sympatric locales were scored as North, three were scored as South. The remaining
miscalled locales were in the region of range overlap (four in North Carolina) or at the southern
range limit of North (two Florida locales).
Discussion
Geographic Ranges of the Cryptic Species within M. bidentatus
Sequence data from samples collected throughout the geographical range of the nominal
species Melampus bidentatus distinguished three cryptic species. I focused on the relative ranges
of two of these species, North and South, because they were abundant in the temperate zone and
the forces underlying their partial overlap were not immediately apparent (Figure 2.1). The third
cryptic species, Gulf, was only sampled from two disjunct areas (South Padre Island, TX and
Southern Florida). Its replacement of the temperate species (North and South) along the Florida

26
Coast is consistent with the faunal transition from temperate to tropical biogeographical
provinces in this region and coincides with many marine and coastal taxa that do the same (Engle
& Summers 1999; Wares 2002). Based on these shared distributional patterns, I predict that the
nominal M. bidentatus found in the southern Gulf of Mexico and the northern Caribbean
(primarily Cuba and Mexico) will turn out to be this Gulf form.
The relative ranges of North and South along the Atlantic coast were more unusual.
South was the only species found in the northern Gulf of Mexico, but it also occurred on the
mid-Atlantic coast in Florida and between North Carolina and Delaware. The two species were
also found in partial sympatry in the Chesapeake Bay region (Figure 2.1). At the six syntopic
locales they could not be distinguished morphologically. At neighboring locales, some as little
as 15 km away, only one of the two species was found. This mosaic distribution likely explains
allozyme divergence previously noted between populations inside and outside of the Chesapeake
Bay (Schaeffer et al. 1985). Although the northern range limit of South (around latitude 39ºN)
coincides with the range limits of a number of species and with a decrease in water temperature
and salinity (Engle & Summers 1999; Wares 2002), South was not found along a large portion of
the coast south of this barrier (between South Carolina and northern Florida) (Figure 2.1). The
northern range endpoint for North was farther north (by at least 10 latitudinal degrees) than that
for South, suggesting that North can better survive colder temperature, specifically the cooler
conditions found north of Cape Cod, a common barrier to a number of species (Engle &
Summers 1999; Wares 2002; Wethey 2002; Vermeij 2005; Sanford et al. 2006). However,
North also dominated the Atlantic Coast between South Carolina and northern Florida, where
South was absent, suggesting that there may be some environmental factor in that region,
presumably other than temperature, which is favored by North.

27
High Connectivity among Populations within Cryptic Species
Estimates of migration rates (Table 2.4) suggested that North and South are both capable
of dispersal across broad swathes of their range, including regions where they were never found.
This is consistent with the predicted dispersal capabilities in M. bidentatus. Larval hatches timed
with spring tides likely help flush them from their natal shores (a conclusion supported by the
presence of swimming veligers in the outgoing tides of a tidal inlet, Apley 1970) and M.
bidentatus often occurs near the outer coast, where it is less likely to experience the restricted
dispersal often seen in strictly estuarine species (Kelly et al. 2006). Most notably, levels of long
distance dispersal in South between the disjunct North Carolina and the Gulf of Mexico
populations (around the southern tip of Florida, Table 2.4) were high and significantly greater
than zero, suggesting that larvae from South are capable of dispersing over large distances (Table
2.3).
However, South was never found along the swath of coast from South Carolina to the
north of Florida. Thus, migrants in South appear to bypass an area where they are absent. In
other cases where genetic connectivity has been found across a range discontinuity, areas of
species absence have been attributed to ecological processes (Bernardi et al. 2003; Keever et al.
2009), and this is likely the case here. Small genetic distances among samples of M. coffeus
collected in Florida, Panama, Curaçao and Puerto Rico (Table 2.2) also suggest that Melampus
species are capable of long distance dispersal. Thus, dispersal limitation alone does not explain
the differences in geographic range between North and South.
Historical Contributions to Contemporary Ranges
During the last glacial maximum, ice sheets and cold temperatures made most habitats in
the Atlantic intertidal unsuitable above 40˚N, causing southward range contractions in many
marine species (Wares & Cunningham 2001; Stuart et al. 2008; Kenchington et al. 2009). Other

28
species, however, persisted in northern refugia in the Atlantic intertidal (Bigg et al. 2008; Maggs
et al. 2008), notably Fundulus heteroclitus (Haney et al. 2009), a fish that co-occurs with
Melampus (Vince et al. 1976; Allen et al. 1994). North may have persisted through the last
glacial maximum in such northern refugia; haplotype diversity (0.968) and θ (2.4) were high to
the north of 40˚N. The lowest haplotype diversity in North (0.766) and θ (0.024) was found in
the southernmost populations, despite high collection effort in this region (N=97 across 12
locales). If North is expanding in any direction, it is moving to the south.
Within South, the single collection locale at Cape Canaveral had low haplotype diversity
(0.635) and θ (0.0058), but Tajima’s D was not significantly negative. Because the Cape
Canaveral population lies between two regions with which it exchanges migrants, this is more
likely a region whose reduced genetic diversity is due to low habitat availability and smaller
population sizes than it is an area of expansion. The high haplotype diversity (0.902 and 0.953)
of the other two Atlantic groups of South suggests that populations in these regions have been
large for a long time. The North Carolina region also had a very high estimated value of θ (4.7),
suggesting that South may have survived the last glacial maximum around this latitude, which
was to the south of glacial ice.
Microhabitat Differences between North and South
Given their differing northern range limits, it is not surprising that temperature (both land
and sea surface) was the most important variable separating North and South. The role of
temperature in setting range limits has been proposed for many taxa, including insects (Addo-
Bediako et al. 2000), fish (Cussac et al. 2009) and frogs (Graham et al. 2004). However,
predictive models built in Maxent using temperature could not differentiate the northern range
limits of these two species, and overpredicted the occurrence of South by over 500 km (Table
2.5, Figure 2.3). Northern range limits and the absence of South between SC and FL were best

29
predicted by a model built using all non-temperature variables (precipitation, salinity and tidal
height, Figure 2.3). In particular, increased mean tidal height best explained the occurrence of
North in the southern Atlantic area where South was not found. Increased tidal amplitude should
raise the altitude of the upper portion of the marsh where I expect to find Melampus, and could
increase the duration of dry periods and desiccation stress.
These results suggest that North may dominate in the geographic span between South
Carolina and northern Florida (the mid-Atlantic region with the highest tidal differences) because
it is more resistant to desiccation than South. An interaction between desiccation and freeze
tolerance has been shown in both marine and terrestrial snails (Roland & Ring 1977; Miller et al.
2009a), so a higher desiccation tolerance in North could also explain the additional 10˚ of
northern latitude occupied by North. Tolerance of higher salinity may also play a role. Estuarine
invertebrates tend to be less freeze tolerant than those in full strength sea water (Aarset 1982).
Higher salinities may alter cells osmotically in a way that increase freeze tolerance (Ansart &
Vernon 2003), and acclimation to higher salinities has been shown to aid freeze tolerance in
mussels (Murphy & Pierce 1975). The distribution of South around low salinity sites in the Gulf
of Mexico (e.g. around the Mississippi River outflow, Antonov et al. 2005) and the inner
Chesapeake Bay also suggest that South may better cope with the challenges posed by lower
salinities than North. The stresses of temperature likely interact with many aspects of the
environment to physiologically limit each species. In molluscs, temperature tolerance is linked
to both salinity acclimation (Hylleberg & Siegismund 1987; Rajagopal et al. 2005) and
desiccation stress (Miller et al. 2009a). In the habitat occupied by Melampus, moisture may
buffer thermal stresses (Ansart & Vernon 2003), in which case the importance of tidal height and
precipitation could be a reflection of microhabitat differences in temperature that are not
measured in our geographically broad environmental layers (Helmuth et al. 2006a).

30
Other unmeasured differences among regions could reinforce these range differences.
The reported biotic pressures on Melampus (predation and competition) do not vary
geographically in a pattern that correlates with variation in the ranges of North and South, but
there may be habitat differences that I have not considered. For example, North and South may
partition the environment in relation to the strong population structure and clinal variation in the
cordgrass, Spartina (Blum et al. 2007) that these snails live on. As their primary source of both
food and shelter, preferences for different genetic varieties could underlie range differences
among cryptic species of M. bidentatus (Sotka & Hay 2002). Any such ecological differences
between these two species may have evolved in the different historical environments occupied
by these two species.
Conclusion
The range differences between cryptic species North and South are likely due, in part, to
differences in physiological tolerance for the intertidal environment. Many species are expected
to shift their ranges poleward as temperatures rise (Sagarin et al. 1999; Herbert et al. 2003;
Hellmann et al. 2008; Chen et al. 2009), but our findings suggest that the response of Melampus
will not be a simple latitudinal range shift. Under a warming climate, change in the intertidal
will be influenced by changes in a suite of environmental components in addition to temperature
including ocean pH, sea level, precipitation and water currents (Harley et al. 2006; Helmuth et
al. 2006a; Helmuth et al. 2006b). In Melampus, changes in terrestrial precipitation and in ocean
salinity might alter the way these two species partition their environment. For example,
increases in local rainfall could favor South by reducing desiccation and salinity stress, or less
frequent rainfall could extend dry periods, potentially favoring North over South.
Here, I was able to use publically available environmental data to tease apart the niches
of two very similar species that occur at the intersection of two habitats (terrestrial and marine, in

31
the case of the intertidal). Our approach could be similarly applied to other species that are
restricted to the intersection of habitats (e.g. the edge of a forest) or to a specific range of
conditions (e.g. high elevation forest or the deep sea). I have used this to identify a suite of
variables from both terrestrial and marine environments (temperature, salinity, precipitation and
tidal height) that likely act together to limit the range of M. bidentatus. How each of these
variables interact to limit the occurrence of each species will be best understood through direct
physiological comparisons.

32
CHAPTER 3: TESTING FOR TROPICAL NICHE CONSERVATISM IN A BROADLY
DISPERSING MARSH SNAIL (MELAMPUS)
It can be argued that all of the forces shaping geographical range (e.g. dispersal potential,
predation, competition) only become important if an organism can first withstand environmental
conditions, such as temperature. Many taxa are geographically limited by temperature (Gaston,
2003), including molluscs (Hylleberg, Siegismund, 1987; Lee et al., 2009), terrestrial arthropods
(Castaneda et al., 2004; Jenkins, Hoffmann, 1999), fish (Harrison, Whitfield, 2006), crabs
(Stillman, 2002), and butterflies (Hellmann et al., 2008). Whether associated with some
maximum or minimum, temperature typically limits a species by some extreme lethal value or
through prolonged exposure to conditions under which they cannot feed or otherwise complete
their life cycle (Gaston, 2003; Miller et al., 2009; Sanford et al., 2006).
On a global scale, cooler temperatures, and freezing conditions in particular (Wiens,
Graham, 2005; Wiens et al., 2009), may limit the poleward spread of tropical taxa (Barry et al.,
1995; Rivadeneira, Fernandez, 2005; Sagarin et al., 1999; Wiens, Graham, 2005; Wiens et al.,
2006), and adaptations to deal with a novel climate may be costly or evolve rarely (Jenkins,
Hoffmann, 1999; Kimura, 2004; Wiens, Donoghue, 2004). Many species and higher taxa have
originated in the tropics, which were once more geographically extensive (Jablonski et al., 2006;
Wiens, Donoghue, 2004; Wiens, Graham, 2005). Over time, if unable to colonize neighboring
temperate regions because they can neither tolerate cooler climatic conditions nor come up with
new adaptations to do so, species will accumulate in the tropics (Wiens, 2007; Wiens, Donoghue,
2004). Phylogenetic evidence that supports tropical niche conservatism has come from groups
including frogs (Wiens et al., 2006; Wiens et al., 2009) and butterflies (Hawkins, DeVries,
2009), but the processes driving diversity gradients may differ in marine and terrestrial systems
(Roy & Goldberg 2007).

33
Physiological determinants of range in coastal marine species are well studied,
particularly in the intertidal zone (Dahlhoff et al., 2002; Helmuth et al., 2002; Helmuth et al.,
2006b; Rivadeneira, Fernandez, 2005; Sagarin et al., 1999; Stillman, Somero, 2000), and
evidence from the fossil record suggests that many marine species have ranges that are conserved
across a phylogeny and often centered in tropical regions (Briggs, 1999; Jablonski, 1999; Roy et
al., 2009). However, fewer studies have addressed physiological differences among closely
related temperate and tropical members of a group while accounting for factors such as
phylogenetic relationships, acclimatization, or other differences associated with their separate
locales (Spicer, Gaston, 1999). Such tests are necessary to determine whether physiological
differences limit the expansion of groups from tropical to temperate regions.
Tolerance of cold and freezing conditions is the most common physiological trait studied
in relation to geographic range (Gaston, 2003), in part because colder temperatures pose a clear
challenge to tropical species, and also because of the large number of species whose range limits
coincide with the edge of the tropics (Gaston 2003; Gaston & Spicer 2004). Experimental
evidence in a number of taxa, primarily plants (Bannister, Polwart, 2001; Gansert et al., 1999;
Jiménez-Castillo et al., 2007; Read, Hill, 1989), has found a correlation between freeze tolerance
and variation in latitudinal range among species. Few studies have tested the relationship
between latitudinal range and freeze tolerance in groups of animals, however, particularly in
groups that are able to disperse broadly and found from the center of the tropics to areas where
freezing regularly occurs. To test whether freeze tolerance may limit the expansion of a tropical
group I need to: (1) determine if high latitude species are closely related to species restricted to
the tropics, and (2) determine whether the degree of cold tolerance corresponds to the latitudinal
range that they occupy.
34
Here, I explore freeze tolerance capabilities that underlie an extra-tropical range
expansion in Atlantic species of the marine snail Melampus (Ellobiidae, Say, 1822), a genus
found in primarily tropical estuarine, salt marsh, and mangrove habitats worldwide (Martins,
1996b). The damaging effects of freezing can be far more detrimental than exposure to cold. Ice
crystals can pierce the cell membrane, removing fluid needed for cellular function and damaging
the cell (Ansart, Vernon, 2003). Physiological comparisons have focused on the nominal species
M. bidentatus, whose freeze tolerance has been well studied. Survival of freezing conditions in
M. bidentatus is enabled by an ice nucleating protein, the production of which is induced in
winter months (Hayes, Loomis, 1985; Holland et al., 1991; Madison et al., 1991); the mean
lethal temperature (LT50) of animals collected in Noank, CT drops from -5ºC in July to -13ºC in
December (Hayes, Loomis, 1985). This ice nucleating protein causes freezing and allows the
location and damage associated with ice formation to be controlled (Ansart, Vernon, 2003;
Sinclair et al., 2004). Ice formation in Melampus is localized such that damage is primarily to
the foot, a strategy of freeze survival common among intertidal gastropods (Lundheim, 2002).
Preliminary data (S. Loomis, unpublished) suggests that during the winter Melampus also
increases concentrations of glycerol, often used as a cryoprotectant (Ansart, Vernon, 2003;
Loomis, 1995; Matsukura et al., 2008).
I have identified a species complex within what has been identified as M. bidentatus
(Chapter 1). Two of the three species in the complex are geographically restricted to the
temperate zone, but differ in their latitudinal ranges. Although it is known that freeze tolerance
varies geographically in M. bidentatus (Hilbish, 1981), the genetic basis of this variation is not
known, and has not been tested in light of these cryptic species nor in relation to members of the
genus that are found exclusively in warmer zones.

35
To test for a ‘tropical niche escape’ by Melampus, I have constructed a molecular
phylogeny for six species found in the Atlantic basin. I use this phylogeny to identify the closest
tropical relatives of Melampus species whose ranges extend into freezing climates. I then use
physiological tests of freeze tolerance to look for differences in physiological tolerance that
relate to current range limits within the temperate zone and between temperate and tropical
species. Our results suggest that freeze tolerance has enabled Melampus to move into the
temperate zone, but that physiological differences other than temperature alone (e.g. desiccation)
explain range differences within temperate species.
Figure 3.1: Collection locales (colored circles) of populations used in freeze tolerance trials. Approximate ranges
of these species are indicated, based on Martins (1996b). The dotted line indicates the approximate region of
transition from tropical to temperate zones (Olson et al., 2001; Spalding et al., 2007).
36
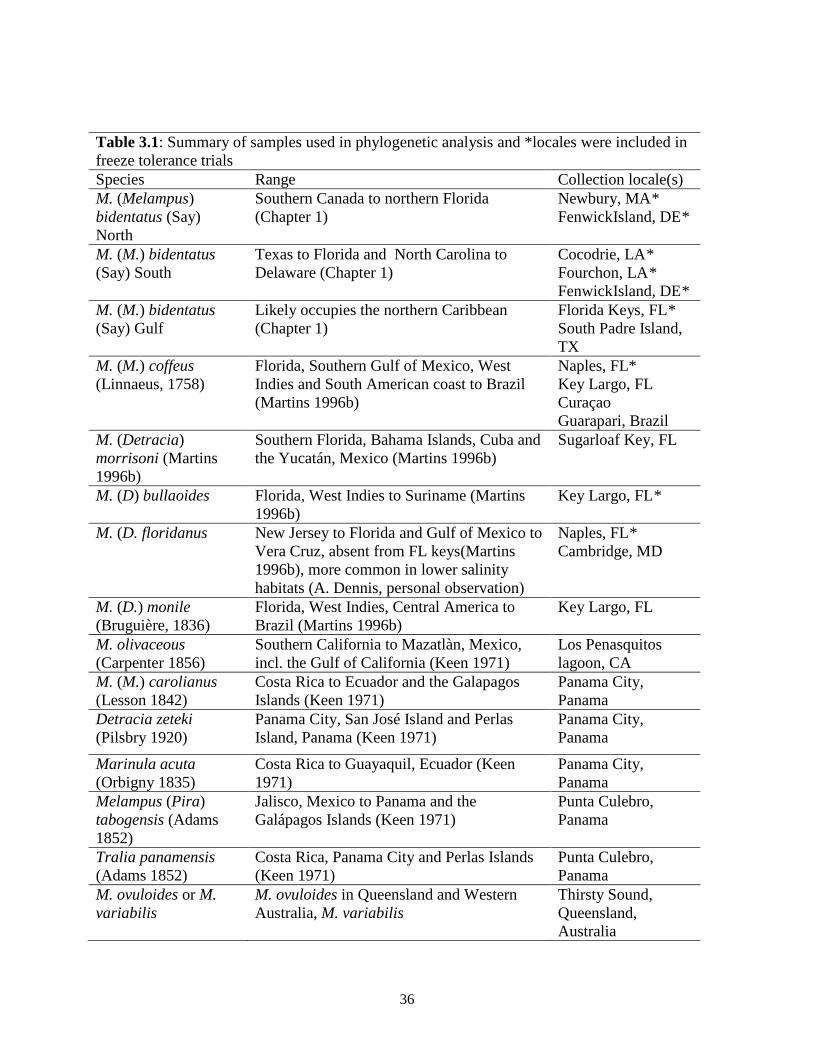
Table 3.1: Summary of samples used in phylogenetic analysis and *locales were included in
freeze tolerance trials
Species Range Collection locale(s)
M. (Melampus)
bidentatus (Say)
North
Southern Canada to northern Florida
(Chapter 1)
Newbury, MA*
FenwickIsland, DE*
M. (M.) bidentatus
(Say) South
Texas to Florida and North Carolina to
Delaware (Chapter 1)
Cocodrie, LA*
Fourchon, LA*
FenwickIsland, DE*
M. (M.) bidentatus
(Say) Gulf
Likely occupies the northern Caribbean
(Chapter 1)
Florida Keys, FL*
South Padre Island,
TX
M. (M.) coffeus
(Linnaeus, 1758)
Florida, Southern Gulf of Mexico, West
Indies and South American coast to Brazil
(Martins 1996b)
Naples, FL*
Key Largo, FL
Curaçao
Guarapari, Brazil
M. (Detracia)
morrisoni (Martins
1996b)
Southern Florida, Bahama Islands, Cuba and
the Yucatán, Mexico (Martins 1996b)
Sugarloaf Key, FL
M. (D) bullaoides
Florida, West Indies to Suriname (Martins
1996b)
Key Largo, FL*
M. (D. floridanus New Jersey to Florida and Gulf of Mexico to
Vera Cruz, absent from FL keys(Martins
1996b), more common in lower salinity
habitats (A. Dennis, personal observation)
Naples, FL*
Cambridge, MD
M. (D.) monile
(Bruguière, 1836)
Florida, West Indies, Central America to
Brazil (Martins 1996b)
Key Largo, FL
M. olivaceous
(Carpenter 1856)
Southern California to Mazatlàn, Mexico,
incl. the Gulf of California (Keen 1971)
Los Penasquitos
lagoon, CA
M. (M.) carolianus
(Lesson 1842)
Costa Rica to Ecuador and the Galapagos
Islands (Keen 1971)
Panama City,
Panama
Detracia zeteki
(Pilsbry 1920)
Panama City, San José Island and Perlas
Island, Panama (Keen 1971)
Panama City,
Panama
Marinula acuta
(Orbigny 1835)
Costa Rica to Guayaquil, Ecuador (Keen
1971)
Panama City,
Panama
Melampus (Pira)
tabogensis (Adams
1852)
Jalisco, Mexico to Panama and the
Galápagos Islands (Keen 1971)
Punta Culebro,
Panama
Tralia panamensis
(Adams 1852)
Costa Rica, Panama City and Perlas Islands
(Keen 1971)
Punta Culebro,
Panama
M. ovuloides or M.
variabilis
M. ovuloides in Queensland and Western
Australia, M. variabilis
Thirsty Sound,
Queensland,
Australia

37
Methods
Collections and Locales
To infer phylogenetic relationships among Atlantic species, I sampled six of the seven
Melampus found in the Western Atlantic and representative ellobiids (the family of air breathing,
primarily coastal snails, containing Melampus) from the Pacific (Table 3.1). The species whose
range extends farthest into the temperate zone, M. bidentatus, was most thoroughly collected.
Within M. bidentatus, I have found three cryptic species (Chapter 1); samples for the
phylogenetic analyses included each of these as a separate species and locales where cryptic
species co-occur. The reported (Martins, 1996b) sister species of M. bidentatus, M. coffeus, was
sampled from geographically disjunct sites in Florida, Brazil (Museu de Zoologia de
Universidade de São Paulo MZSP No51836) and Curaçao. Together, these species represent all
members of the nominal subgenus Melampus Melampus (Martins, 1996b).
The remaining Melampus species collected in the Atlantic have been placed in the
subgenus Melampus Detracia (Martins 1996b). M. floridanus was sampled from Florida and
Maryland, and is smaller species that tends to occupy lower salinity sites. All other Atlantic
species (M. monile, M. morrisoni and M. bullaoides) were sampled from mangrove habitat in
southern Florida and are not reported to occur farther north (Martins 1996b). The only Atlantic
Melampus for which I could not obtain tissue, M. paranus, is known only from the type
specimen (Martins 1996b), although they have been previously studied in Brazil (Marcus &
Marcus 1965, cited by Martins 1996b). Pacific species were sampled in California (M.
olivaceus), the Pacific coast of Panama (M. carolianus, and Detracia zeteki), and Australia (M.
variablis OR M. ovuloides, Australia Museum #C.417369 and C.417370). Tissue identified as
two Australian species (M. variabilis and M. ovuloides) genetically grouped so closely together
(their CO1 sequences were identical) that I believe these samples actually belong to just one of

38
these two species. For an outgroup, I collected two other ellobiids, Marinula acuta and Tralia
panamensis, from the Pacific side of Panama.
For freeze tolerance trials, collection locales (Table 3.3) were chosen based on the
distribution of the three genetically identified cryptic species within M. bidentatus (Chapter 1).
The three cryptic species (M. bidentatus North, South and Gulf) differ in their northern range
limits (approximately latitude 50˚N, 38˚N and 26˚N, respectively). Initial trials aimed to
compare freeze tolerance and latitudinal extent among these three species. In 2008, I compared
the cryptic species M. bidentatus North and M. bidentatus South, both in allopatry and in
sympatry (Figure 3.1). I did not include populations near the ends of species’ ranges to avoid
using populations that are not temporally stable or contain reduced genetic diversity (Gaston,
2003). Sites in 2009 were expanded to include cryptic species M. bidentatus Gulf as well as M.
floridanus, M. coffeus and M. bullaoides (Figure 3.1, Table 3.2). Live animals were transported
by car in a portable refrigeration unit that maintained at 4˚C, except for the 2009 collections from
Connecticut, Maryland and Delaware, which were transported overnight in an insulated
container. All collections are summarized in Table 3.3.
DNA Extraction and Sequencing
DNA was extracted using the QIAamp DNA mini kit, according to the manufacturer's
instructions (Qiagen cat#51304) with an overnight tissue digestion at 56˚C. Portions of one
mitochondrial and two nuclear genes were used to infer phylogenetic relationships across
Melampus species. A region of the mitochondrial cytochrome oxidase subunit I (CO1) gene was
amplified using primers from Folmer et al. (1994): I used their primer HCO1 with a modification
of their LCO1 (MCO1: GGTCAACAAATCATAAGGATATTGG). Samples that did not
amplify using these primers were PCR amplified using degenerate primers designed to overlap
the same region (CO1F-degen: ACAAATCAYAARGAYATYGG, CO1R-degen:

39
TTCAAGRTGNCCRAARAAYCA). This product was isolated by TOPO TA cloning
(Invitrogen cat# K4575) and sequenced using the M13 primers provided by Invitrogen. A region
of the histone 3 (H3) gene was amplified using the primers H3F and H3R (Colgan et al., 2000).
A second nuclear marker was amplified using primers were designed using cDNA sequence
from M. bidentatus. Based on alignments in Genbank across several taxa, this has been
tentatively identified this as a portion of the mitochondrial carrier protein/ADP-ATP transporter
and called it MCP. Matching sequence from two genbank accessions (EZ007254.1: Acropora
millepora and XM 777955.2: Strongylocentrotus purpuratus) were used to root this marker in
independent gene analyses. Primers designed from this marker (MCPL:
GTCTGTTGGCCCACTTGACT and MCPR: TCCTTGCATGGAATAACCAA) were used to
amplify 128 bp. Polymerase chain reaction (PCR) was used to amplify CO1 and H3 reactions
with an annealing temperature of 50˚C, and MCP with an annealing temperature of 52˚C. All
sequence data was edited in Geneious (Drummond et al., 2009) and aligned by eye; there were
no indels in H3 and CO1. Heterozygous sites in MCP were resolved to two haplotypes per
individual using the PHASE feature of DNAsp v.5.00.02 (Rozas et al., 1995-2009), which uses
the algorithms from PHASE (Stephens, Donnelly, 2003). There were no heterozygous sites
found in H3 or CO1.
Phylogenetic Relationships within Melampus
Prior to phylogenetic analysis, models of sequence evolution were estimated for each
gene using DTModsel (Minin et al., 2003) and MrModeltest (Nylander, 2004). Base
composition bias was tested across all markers using the χ2 goodness-of-fit test in PAUP*b4.10
(Swofford, 2003) and a Maximum ChiSquare test (Smith, 1992) was used to test for
recombination (Piganeau et al., 2004). A phylogenetic congruence test of all 3 markers in PAUP
was conducted with and without the third position of CO1 (Farris et al., 1994). The number of

40
variable and parsimony informative sites and the transistion:transversion ratio were calculated in
MEGA (Tamura et al 2004).
To determine the relationships among western Atlantic Melampus species, the three
markers (CO1, H3 and MCP) were analyzed separately and combined. Analyses of separate
genes were done to determine their individual gene genealogies and because I expect the rates of
evolution to vary between the nuclear markers and more rapidly evolving mitochondrial gene
(CO1). Due to the increased transition:transversion ratio (Results), CO1 analyses were
conducted both with and without the third position. Bayesian phylogenetic analyses were
performed for each gene individually using MrBayes (Huelsenbeck, Ronquist, 2001; Ronquist,
Huelsenbeck, 2003) implemented on the BioHPC cluster at Cornell University
(www.biohpc.org). Bayesian analyses were initiated from random starting trees, and each
analysis was run for 10,000,000 generations with a burn-in of 1,000,000. A Maximum
Likelihood search using each gene independently was implemented in Garli (Zwickl, 2006), with
all runs continued until no significant topological improvements had been made for 100,000
steps. To test for support at each node, bootstrap analyses were performed using both parsimony
(100 replicates, each using 1000 replicate heuristic search with tree bisection-reconnection
branch swapping and random sequence addition) and likelihood (100 replicates, implemented in
Garli). Genetic groups at CO1 were also viewed by constructing an unrooted neighbor joining
tree constructed in PAUP.
A partitioned Bayesian analysis was conducted in MrBayes, with data partitioned by gene
for its respective mutational model (Table 3.2). The partitioned analysis was run for 10,000,000
generations with a burnin of 1,000,000 and was performed three times under the same
conditions. Species tree estimation was conducted BEAST v1.5.3 (Drummond, Rambaut, 2007),
using a multispecies coalescent method (*BEAST, Heled, Drummond, 2009). The *BEAST
41
analysis was conducted five times to verify congruence among runs with a different starting tree.
Each simulation ran for 1 to 3 million steps, with every 10,000 recorded. Tracer v1.5 was used
to view the log files for each run and to check for chain convergence and the species tree was
summarized using TreeAnnotator v1.5.3.
Freeze Trials
To test for differences in the freeze tolerance among the three cryptic species contained
within M. bidentatus (named North, South and Gulf, see results) and their close relatives (M.
coffeus, M. floridanus and M. bullaoides), I conducted a series of freeze-tolerance trials (Table
3.1). Two of the cryptic species within M. bidentatus occur in partial sympatry; they share a
portion of the Atlantic coast (~Delaware to North Carolina), but only North is found above 39º
latitude and between North Carolina and northern Florida, and only South is found in the Gulf of
Mexico (Chapter 1). Winter 2008 trials compared these two cryptic species and included sites
from the allopatric portions of their ranges: Cocodrie, LA (containing only M. bidentatus South)
and Beebe Cove and Barn Island, CT (containing only M. bidentatus North). Cryptic species M.
bidentatus North and M. bidentatus South occur in complete sympatry at Fenwick Island, DE,
and tests of freeze tolerance at this site were used to compare the two cryptic species in a setting
where they are presumed to have experienced the same conditions from settlement to adulthood.
In 2009, I returned to these sites and included four other species (Table 3.3): M.
bidentatus Gulf, M. coffeus, M. floridanus, and M. bullaoides. In 2009, the allopatric collection
of M. bidentatus South was made at Fourchon, LA (a site ~45 km away from Cocodrie, LA). In
2009, ice on the marsh delayed collection and tests of freeze tolerance at Barn Island, CT, and
tests of this site were conducted immediately following the first round of collections (2009a),
and were accompanied by a second collection at Fourchon, LA (Table 3.1).

42
Following collection, snails were maintained in incubators set between 5˚ C and 7˚C.
Each collection locale was stored separately in plastic containers with paper towel that was kept
saturated with artificial seawater mixed to 25 PSU and changed periodically. Snails were not fed
during this period, and light was maintained at on a 12 hour light: dark cycle. All snails were
acclimated in the lab for a minimum of five days before starting trials. With the exception of M.
bullaoides, mortality in the incubators was very low (less than 5% over the entire 12 - 40 day
experimental period) in all collections. Collections of M. bullaoides kept at 5˚C experienced a
die off within the first week of collections. M. bidentatus individuals kept in the same container
did not suffer any mortality, so I believe that this die off was related to temperature. The
remaining M. bullaoides individuals were transferred to a maintenance temperature of 25˚C prior
to all of the trials that I report here, and experience little mortality after this change to a warmer
holding temperature.
Survival measures made across a range of temperatures were used to calculate the mean
lower lethal temperature (LT50). This measure allows us to comparison these results with
previous work in M. bidentatus that tested freeze tolerance in the same way (Loomis, 1985).
While a calculation of LT50 may not reflect the exact tolerance of Melampus in the field, I am
interested in testing for relative differences among species under the same conditions.
Freeze- tolerance trials were conducted at Connecticut College in 2008 and at Louisiana
State University in 2009. In both years, the experimental design was as follows. All plastics
were thoroughly soaked and washed with hot water before use. Ten individuals from each site
were randomly chosen and verified to be alive before being placed into 50 mL tubes. Each tube
contained an approximately 4 cm2 square of paper towel and 1.5 mL of 25 PSU sterile sea water
and was sealed tightly with parafilm. Tubes were placed in a rack and submerged into an
ethylene glycol bath (Forma Scientific in 2008 and Thermo Digital One in 2009) with digital

43
temperature control set to 5˚C. The tubes were maintained at 5˚C for five minutes before the
temperature was lowered at a rate of approximately 1°C per minute to the test temperature,
where it was held constant for 24 hours. At the end of 24 hours, the bath temperature was
returned to 5˚C for five minutes.
At the end of the freeze trials, snails were transferred to containers with fresh seawater-
saturated paper towel. Snails were placed aperture down and evenly spaced and allowed to
recover for 24 hours at 5 - 8˚C. They were then flipped on to their backs and given 24 hours at
25˚C to right themselves. At the end of this recovery period, snails were scored for being upright
and for response to a poke with a probe. The percentage of live individuals (based on either
being upright and moving or responding to the probe) was scored for each trial. All snails were
individually labeled and preserved in 95% ethanol. Mean lethal temperature (LT50) was
calculated in GraphPad Prism v5.0.2 using a sigmoidal equation (i.e. three-parameter logistic
equation), in which the response (i.e. mortality) was fit as a function of the logarithm of the
treatment (i.e. temperature).
Supercooling Point
If Melampus is freeze tolerant, it should freeze at a warmer temperature than its estimated
mean lethal temperature (LT50). To measure the freezing point of Melampus, freeze-tolerance
trials in 2008 were accompanied by measurements of the supercooling point for individual snail
suspended in a 50 ml tube during a 24 hr trial. Shell surface temperature was measured for four
snails in each trial using an OMEGA H309 data logger. Data was recorded with SE309 software
version 2.5.0.0 every second. Freezing point was identified by a spike in increased temperature
below the freezing point. This value was averaged across all trials for each site.
44
Desiccation Trials
Niche modeling in Melampus suggests that the environments occupied by the cryptic
species within M. bidentatus differ in precipitation and tidal height, suggesting that differences in
their tolerance of dry conditions and prolonged tidal exposure could lead to differences in
latitudinal range (Chapter 1). To test for a difference in desiccation tolerance among cryptic
species, I conducted a series of trials in April 2009 to test for the time to mortality under drying
conditions. Samples were available from three sites, each representing one cryptic species: Barn
Island, CT (M. bidentatus North), Fourchon, LA (M. bidentatus South) and Key Largo, FL (M.
bidentatus Gulf). The snails for these trials were the same collections that had been used for
freeze trials and had been maintained at 5˚C for over a month. To ensure that all snails
experienced similar moist conditions prior to the trials, snails were transferred to new, washed
petri dishes in groups of 20 with one paper towel and 13 mL of sterile seawater at 25 PSU.
These chambers were maintained at 5˚C and 75% humidity for 48 hours.
Timed desiccation trials were conducted in sealed desiccation chambers containing
drierite. The same groups of 20 snails were placed aperture down in a small petri dishes
containing 1/3 of a dry paper towel (~5 cm2). Each desiccator contained three small petri dishes,
each with 20 snails, and one of these desiccators contained a temperature/humidity probe. A
fourth desiccator was left empty but contained a monitor of temperature/ humidity probe.
Throughout the trials, each desiccator was maintained at 22-25% humidity and 5˚C. These were
placed in a 5˚C cold room with 12 hour light/dark cycle.
To measure mortality across time points, five snails were removed from each dish at time
increments of 12, 24, 48, 72, 96, 144 and 216 hours. They were placed into chambers with a 4
cm2 square of paper towel saturated with sea water (25 PSU). Any visible activity was observed
at 10 minute increments for an hour and again following 24 hours of recovery time at 5˚C. In the

45
first three trials (12, 24 and 48 hours), all snails from all sites showed complete recovery and
were quickly over and moving around within the first hour. These individuals showed no sign of
damage, they were returned to dishes with sea water (25 PSU) soaked paper towels and allowed
to recover for 72 hours before being randomized and included in the remaining trials (72, 96, 144
and 216 hours). Opening the desiccators caused the humidity to briefly rise (to ~70%), so the
desiccators were opened briefly every 24 hours, even if there were no snails to remove at that
time point. Animals were preserved in 95% ethanol. GraphPad was again used to calculate LT50
(mean lethal desiccation time).
Molecular Identification of Cryptic Species
The three cryptic species of M. bidentatus cannot be distinguished morphologically, but
can be easily grouped by their large divergence (~20%) at mitochondrial CO1 (Chapter 1).
Based on a number of individuals that I have previously sequenced for this gene (>500, Chapter
1), I designed a restriction digest to differentiate M. bidentatus North from M. bidentatus South
(the two cryptic species that sometimes co-occur). DNA for the restriction digest was extracted
using Chelex beads (Sigma cat#C7901). Approximately 1 -2 mm3 of foot tissue was chopped
and mixed with a 20% Chelex solution. This mixture was periodically vortexed and left at room
temperature overnight, after which it was heated to 95˚C for five minutes and centrifuged for five
minutes at max speed (3,000 rpm) prior to PCR amplification of CO1 (using the primers HCO1
and MCO1, see above). I used two restriction enzymes: RSAI (NEB cat# R0167S) and SCRF1
(NEB cat#R0110S) to digest PCR product at 37˚C for one hour. The results of both the PCR
reaction and the restriction digest were run on a 1% agarose gel to identify the species and to
check for PCR success. This produced a larger band in M. bidentatus South (~500 bp) than in
M. bidentatus North (~200 bp and 150 bp). Inconclusive results were sequenced using the
HCO1 primer. M. bidentatus Gulf has not been found in sympatry with either of the other two

46
cryptic species, and its identity was verified by sequencing a smaller number of individuals for
this locus. The remaining species were identified morphologically.
Table 3.2: Data set used in phylogenetic analysis
Marker Model Number
of Species
Number of
individuals
Length
(bp)
Variable
sites
Parsimony
informative
Ts/Tv
ratio
CO1
(3rd
pos.)
TrN+I+G 16 23 448 171 171 1.56
(11.28)
H3 TrNef+G 14 23 316 33 33 2.87
MCP K81+G 10 20 128 53 39 1.58
Results
Phylogenetic Relationships within Melampus
I amplified 316 bp of H3 and 128 bp of MCP. Clearly readable sequence from CO1
ranged from 440 to 650 bp, and was trimmed to 448 bp to maximize the number of individuals in
the analysis. Table 3.2 summarizes the variable and parsimony informative sites for each
marker, the transition:transversion ratio, and the number of individuals and species that were
successfully amplified for each gene. A partial homogeneity test detected discordance among
gene trees (p = 0.001), even when third positions from COI were excluded (p = 0.002). The
Maximum Chisquare test did not detect recombination (CO1: p=0.11, H3: p=0.90, MCP:
p=0.24). Species tree estimations using *BEAST did not converge, despite the combined use of
5 runs with 100,000,000 to 300,000,000 generations each. Although this resulted in poor support
(not shown), tree topology was similar to all other analyses. Using Tracer, the relative
mutational rate for CO1 is estimated to be ~17x faster than for H3 and ~5x faster than for MCP.
All analyses supported the monophyly of the three cryptic species of M. bidentatus plus
M. coffeus (Bayesian posterior probability: 0.96 -1.00), confirming the grouping of these species
into the morphologically based subgenus Melampus Melampus (Martins, 1996b). Relationships

47
Figure 3.2: Phylogenetic relationships inferred from Bayesian analysis of Histone 3. Support values (Bayesian
posterior probabilities/ML bootstrap/MP bootstrap) are shown on each node.

48
Figure 3.3: Phylogenetic relationships inferred from Bayesian analysis of MCP. Support values (Bayesian
posterior probabilities/ML bootstrap/MP bootstrap) are shown on each node.
:

49
Figure 3.4: Phylogenetic relationships inferred from Bayesian analysis using H3, MCP and CO1, partitioned by
gene. Support values are Bayesian posterior probabilities. Nodes that were also supported by the *BEAST species
tree estimation are listed second.

50
among these four species were not well resolved. The two species with the northernmost
distribution (M. bidentatus North and M. bidentatus South) appeared as sister taxa in all analyses
of H3. Although there were no shared haplotypes among species for MCP, M. bidentatus South,
M. bidentatus Gulf and M. coffeus were not reciprocally monophyletic for this marker. As a
group, however they were reciprocally monophyletic with respect to M. bidentatus North. In the
Bayesian analysis partitioned by gene (Figure 3.4), the sister relationship of M. bidentatus North
to the other species was supported. Each of these four species is monophyletic and deeply
divergent at CO1 (Chapter 1), although analyses based on CO1 alone (both with and without the
third nucleotide position) did not resolve relationships among most species (not shown).
The closest relatives to the Melampus Melampus subgenus differed slightly according to
the two nuclear genes, but in all cases included three species: M. floridanus, which is found
along the Atlantic coast and ranges as far north as New Jersey, and two Pacific species, M.
carolianus and M. olivaceus, which are found in the central America and from northern Mexico
to southern California, respectively. In the Bayesian analysis that partitioned by gene, these
three species resolved to a separate clade that was sister to all Melampus Melampus, although
support for this clade was low (Figure 3.4).
M. bullaoides and M. monile were not closely related to the other Atlantic Melampus. M.
bullaoides, collected in southern Florida, grouped most closely to the Australian species (M.
variabilis or M. ovuloides). M. monile was most closely related to the Pacific M. tabogensis,
although I was only able to amplify CO1 and H3 from M. tabogensis. M. floridanus was most
closely related to the Pacific Panama specimens of Detracia zeteki. This relationship is not
surprising given that M. floridanus has been called Detracia floridanus in the past (Martins
1996b), and suggests that some species in the genus Detracia likely belong in Melampus (in
agreement with Martins 1996b).
51
Taxonomically, the relationship among several species did not correspond to species
designations based on morphology (Martins, 1996b). Individuals morphologically identified as
M. morrisoni were identical to the cryptic species M. bidentatus Gulf at all loci. I have not
called this cryptic species M. morrisoni because genetically identical snails were also found in
southern Texas, where the snails were morphologically M. bidentatus. Snails from Brazil
identified as M. coffeus were genetically distinct from other individuals morphologically
identified as M. coffeus, although I was only able to amplify it for the MCP (Figure 3.3) and CO1
loci (~30% divergence between Brazilian samples and M. coffeus), suggesting that these
Brazilian snails belong to another species. These shells were much larger than most M. coffeus
sampled elsewhere, so it is unlikely that these are members of the unsampled M. paranus (which
is much smaller).
Freeze Tolerance in Melampus
The least cold tolerant species, M. bullaoides has the southernmost northern range limit
among the six species tested (Martins, 1996b). M. bullaoides could not tolerate temperatures
below 0˚C (LT50=0.18˚C). Estimates of LT50 were made using only M. bullaoides snails that had
survived initial mortality in the 5ºC incubators (see Methods), suggesting that if anything, these
results may have been skewed toward a colder LT50.
The mean lethal temperature of M. coffeus, the sole tropical member of its clade, was
significantly warmer (LT50 = -4.28˚C) than for the three cryptic species of M. bidentatus (LT50 =
-12.55˚C to -7.55˚C). Among the three cryptic species, the coldest values of LT50 were found in
the species with the northernmost distribution (M. bidentatus North), but the mean lethal
temperature tolerance did not differ significantly among the three cryptic species (-12.55˚C to -
7.55˚C, Figure 3.5, Table 3.3). Furthermore, tests from the site containing M. bidentatus North
and M. bidentatus South in sympatry (Fenwick Island, DE) found no difference in LT50 between

52
these two. There was significant variation among years and sites (Figure 3.5), but this variation
was found within species as much as among them (Figure 3.5, Table 3.3). For example, the two
sets of trials in 2009 that included Fourchon, LA had significantly different LT50’s (-11.8˚C and -
9.5˚C). Within M. bidentatus North and M. bidentatus South, there were no clear latitudinal
patterns of LT50. Measures made at Beebe Cove, CT were (-12.55˚C) were very close to
previous measures made at this same site (Loomis 1985, January LT50 = -12.9˚C).
The lower lethal temperature for M. bidentatus Gulf fell within the same range as the
other two cryptic species of M. bidentatus (-8.05˚C). The other temperate species tested, M. D.
floridanus, was also freeze tolerant, and did not differ significantly from M. bidentatus collected
from the same site in MD (Figure 3.5, Table 3.3). Wide confidence intervals around LT50 in
some 2009 trials (primarily for the two cryptic species at Fenwick Island, DE) may be due to
acclimation by the snails during the ~40 days over which I conducted the trial, over which time
Table 3.3: Freeze-tolerance in Melampus
Collection locale Date Species Supercool point LT50 (95% CI)
2008
Beebe Cover, CT 1/18/2008 M. bidentatus North -5.95± 1.49 -12.55 (-12.8, -12.31)
Barn Island, CT 1/12/2008 M. bidentatus North -7.39± 2.02 -8.85 (-8.99, -8.71)
Fenwick Island, DE 1/11/2008 M. bidentatus North -7.60 (-8.76, -6.45)
M. bidentatus South -7.55 (-8.35, -6.75)
Cocodrie, LA 1/7/2008 M. bidentatus South -6.25± 0.96 -8.38 (-9.28, -7.48)
2009a
Fenwick Island, DE 1/5/2009 M. bidentatus North -11.93 (-14.64, 09.22)
M. bidentatus South -11.66 (-13.08, -10.24)
Indian River, DE 1/6/2009 M. bidentatus North -12.1 (-12.60, -11.59)
Cambridge, MD 1/6/2009 M. bidentatus South -10.59 (-11.69, -9.49)
M. floridanus -9.29 (-10.71, -7.87)
Fourchon, LA 1/13/2009 M. bidentatus South -11.8 (-12.59, -11.02)
Bonita Springs, FL 1/10/2009 M. coffeus -4.28 (-5.56, -2.99)
Key Largo, FL 1/10/2009 M. bidentatus Gulf -8.05 (-9.77, -6.33)
M. bullaoides 0.18 (0.12, 0.23)
2009b
Barn Island, CT 2/19/2009 M. bidentatus North -11.63 (-12.16, -11.10)
Fourchon, LA 2/21/2009 M. bidentatus South -9.50 (-10.96, -8.04)

53
Figure 3.5: Mean lethal temperature (LT50) for freeze tolerance trials, with 95% CI. Narrow CI’s are obscured by
the point.

54
Figure 3.6: Mean lethal time (LT50) for desiccation trials, with 95% CI. Mean lethal time calculated in hours at
5˚C.
survival increased slightly at lower temperatures. However, by including all points, our broad
confidence intervals likely encompass a wide range of temperatures to represent tolerance of
snails early or late in the testing period. Survival curves were best fit by the sigmoidal curve, for
which r2 averaged 0.78 (0.44-1.0).
The lower lethal temperature for M. bidentatus Gulf fell within the same range as the
other two cryptic species of M. bidentatus (-8.05˚C). The other temperate species tested, M. D.
floridanus, was also freeze tolerant, and did not differ significantly from M. bidentatus collected
from the same site in MD (Figure 3.5, Table 3.3). Wide confidence intervals around LT50 in
some 2009 trials (primarily for the two cryptic species at Fenwick Island, DE) may be due to
acclimation by the snails during the ~40 days over which I conducted the trial, over which time
survival increased slightly at lower temperatures. However, by including all points, our broad
confidence intervals likely encompass a wide range of temperatures to represent tolerance of
snails early or late in the testing period. Survival curves were best fit by the sigmoidal curve, for
which r2 averaged 0.78 (0.44-1.0).

55
Supercooling point was measured seven times using snails from Cocodrie, LA and eight
snails from the two CT sites (Barn Island and Beebe Cove). The values for Cocodrie, LA (-
6.25˚C ±0.96) and Barn Island, CT (-7.49˚C ± 2.02) were similar, and Beebe Cove individuals
supercooled at a slightly warmer temperature (-5.95˚C ±1.49).
Desiccation Tolerance in Melampus
M. bidentatus North tolerated longer dry periods than M. bidentatus South, and M.
bidentatus South tolerated longer dry periods than M. bidentatus Gulf. Although these
differences were not significant, this trend suggests that these three species may differ in their
desiccation tolerance (Figure 3.6). The lack of significance in these results was likely due to our
low sample sizes, which resulted in large confidence intervals.
Discussion
Most research into the role of tropical niche conservation on patterns of species diversity
has used broad phylogenetic and GIS-based modeling tools to relate climate and species
relationships (Pyron, Burbrink, 2009; Wiens, 2007; Wiens et al., 2007; Wiens et al., 2009). The
underlying assumption of these methods is that the geographical ranges of extant species reflect
physiological limitation, but this has been little tested (Vieites et al., 2009). Here, I have directly
tested for physiological differences that explain range differences among closely related species
of a marsh snail. Our results suggest that an inability to withstand freezing temperatures likely
restricts tropical species of Melampus from temperate regions, but that variation in cold tolerance
does not explain differences in geographical range among temperate species.
Tropical Species are Less Freeze Tolerant
Melampus species from tropical regions are less tolerant of cold conditions than those
found in temperate regions (Figure 3.5). The species with the warmest lower lethal temperature,
M. bullaoides, is also the species whose northern range limit extends the farthest south,

56
suggesting its distribution to the north is constrained by temperature. The phylogenetic
placement of M. bullaoides near the root of the tree, along with tropical species collected in
Florida and Australia, also suggest that the ancestor to this group could have been tropically
distributed and lacked freeze tolerance. This is in agreement with previous conclusions that the
ellobiids are historically tropical, and that their ranges are centered in the tropics (Martins
1996b). M. bullaoides shares a large part of its northern range with M. coffeus (Martins 1996b),
but M. coffeus extends slightly farther north and, unlike M. bullaoides, is tolerant of temperatures
below freezing. The northern range limits of these two species (Figure 3.1) straddle a region in
southern Florida where climate shifts from temperate to tropical conditions in terms of both
marine (Spalding et al., 2009) and terrestrial (Olson et al., 2001) conditions (Figure 3.1). This
suggests that M. bullaoides may only occupy truly tropical conditions (lacking seasons and
freezing events), whereas M. coffeus can survive in the cooler conditions in the warm temperate
zone.
Within the subgenus Melampus Melampus (M. coffeus plus the 3 cryptic species within
M. bidentatus), the lower freeze tolerance of M. coffeus likely explains its more southerly
distribution. Habitat is also likely important; M. coffeus is more often found in mangrove forests
(Maia, Tanaka, 2007; McKee, Faulkner, 2000; Proffitt, Devlin, 2005) than in the Spartina
dominated marshes occupied by species of M. bidentatus complex (Graca et al., 2000; Pennings,
Silliman, 2005). This habitat association likely restricts M. coffeus to regions with conditions
warm enough to permit mangroves to grow (Ross et al., 2009). However, the lower frequency of
freeze events associated with recent climatic warming has allowed mangrove forests to extend
their range northward (Perry, Mendelssohn, 2009). Based on the freeze tolerance measured here,
M. coffeus should be capable of expanding northward along with mangroves.
57
The role of thermal tolerance in setting vertical range limits has been well studied in the
intertidal (Connell, 1972; Jensen, Armstrong, 1991; Miller et al., 2009; Somero, 2002), and
suggests that over a small scale, strong zonation can result from the limits set by tolerance to
cold and hot temperatures (e.g. Bertness, 1991; Jensen, Armstrong, 1991; Tomanek, 2002).
However, few tests have addressed the broad-scale relationship between temperature tolerance
and latitudinal distribution. Where this has been tested (Compton et al., 2007; Kimura, 2004;
Vernberg, Tashian, 1959), tropical species generally tolerate higher temperatures than their
temperate relatives, suggesting that temperate species may be unable to cope with hot
temperatures at low latitudes just as tropical species are limited by their intolerance of freezing.
The geographical exclusion of tropical species by freezing conditions suggests that
limitations to niche evolution are restricting the geographical range of some species in
Melampus. Latitudinal gradients in species richness can be driven by difference among regions
in rates of speciation, extinction and in dispersal (Jablonski et al., 2006; Ricklefs, 2004; Wiens,
Donoghue, 2004). The inability of a group to tolerate temperature in a novel habitat will prohibit
it from dispersing and colonizing there. I have observed a tolerance of freezing conditions in the
M. Melampus subgenus and in M. floridanus. Because I have not tested the freeze tolerance in
the closest relatives of M. floridanus (the Pacific M. olivaceus and M. carolianus), I cannot
determine if freeze tolerance has arisen once or twice. Nonetheless, the lack of freeze tolerance
in the most basal species that I have tested (M. bullaoides), along with the predominantly tropical
distributions of most ellobiids (Martins, 1996a), suggests that the evolution of freeze tolerance
has allowed for the invasion of the temperate zone by Melampus.
Temperate Species are Freeze Tolerant and Share a Broad Environmental Niche
Within M. bidentatus, the three cryptic species tolerated significantly colder temperatures
than M. coffeus, but there was variation in tolerance both within and among the cryptic species

58
(Figure 3.5). The site with the coldest mean lethal temperature, Beebe Cove, CT, belonged to
the species that is found the farthest north (M. bidentatus North). However, individuals from
other locales had significantly warmer LT50’s, including members of M. bidentatus North from
neighboring Barn Island, CT. These results suggest that freeze tolerance varies little among the
three cryptic species. Most importantly, I found no difference in LT50 between M. bidentatus
North and M. bidentatus South collected in complete sympatry (from Fenwick Island, DE, Table
3.3), suggesting that the range differences among these species are not due to differences in
freeze tolerance. These results highlight the importance of making physiological comparisons
among groups that have the same acclimation history (Spicer, Gaston, 1999); without a
comparing a site where these species occur in syntopy, I could not necessarily resolve the
variation within from that between species.
The trends we observe in desiccation tolerance among cryptic species suggest that an
interaction between cold and desiccation stress could differentiate the physiological tolerance of
the three cryptic species within M. bidentatus. This interaction among variables is supported by
ecological niche modeling, which found that the environments occupied by M. bidentatus North
and M. bidentatus South likely receive different patterns of precipitation (Chapter 1). However,
further tests of desiccation resistance are needed to test for significant differences among species.
The apparently tropical range of M. bidentatus Gulf (Chapter 1), however, is not
explained by its tolerance of freezing conditions, which is equivalent the two temperate
occurring cryptic species. The retention of freeze tolerance despite little or no exposure to
freezing conditions could mean that the subgenus M. Melampus gained freeze tolerance abilities
prior to expanding its range into temperate regions. Alternatively, the M. bidentatus cryptic
species complex may have temperate origins associated with being freeze tolerant, followed by a
subsequent colonization by a temperate species (M. bidentatus Gulf) back into the tropical zone.

59
To test these hypotheses, the relationship among the four species in this clade needs to be fully
resolved.
The wide range of lower lethal temperatures observed in these temperate species is not
unexpected. Temperate organisms are expected to be adapted for broader physiological
performance than tropical organisms, as conditions tend to vary more widely at temperate
latitudes (Addo-Bediako et al., 2000; Compton et al., 2007; Stevens, 1989). Freeze tolerance
and ice nucleating activity has been shown to vary across seasons in M. bidentatus (Loomis,
1985; Loomis, Hayes, 1987). This induced freeze tolerance may require environmental exposure
to cooling temperatures for weeks to months (Loomis, Hayes, 1987), or some specific
environmental cue. Interestingly, the widest patterns of thermal tolerance may only be found in
the temperate region. Tests of Antarctic species have found that although they tolerate very cold
conditions; their window of adaptation is generally narrow (Peck, 2002; Peck, Conway, 2000).
Some of the variability among temperate sites (within and between species) may also
arise due to microhabitat differences (Helmuth et al., 2006a). Surviving freezing conditions
requires coping with both the damage done by ice crystals and the changes in osmotic balance
resulting from fluctuation in intracellular solutes (Aarset, 1982; Ansart, Vernon, 2003), and
specific habitats may vary in ways that can influence cellular chemistry (Amende, Pierce, 1980;
Neufeld, Wright, 1996; Pierce, Amende, 1981). Environmental influences, including salinity
and desiccation, have been shown to lead to varying freeze tolerance in other molluscs
(Hylleberg, Siegismund, 1987; Murphy, Pierce, 1975; Roland, Ring, 1977).
Habitat structure may also lead to variation in freeze tolerance. Snails collected at the
Barn Island, CT site were found primarily under large rocks, whereas snails collected at Beebe
Cove, CT (where freeze tolerance was greater) were collected at the base of grass stems and
under logs. Variation in the behavior of Melampus, which includes taking refuge in fiddler crab
60
holes and can bury a short distance into the marsh surface, could also buffer thermal stress
(Loomis, 1995). This likely means that there is not a strict correlation between latitude and
exposure temperature (Helmuth et al., 2006a; Kuo, Sanford, 2009; Stillman, Tagmount, 2009). I
speculate that variation among sites found in a previous latitudinal survey of geographic
variation in freeze tolerance in M. bidentatus (which likely sampled only M. bidentatus North,
Chapter 1, Hilbish, 1981) was due to differences in microhabitat and acclimation history among
populations rather than to strict latitudinal variation in temperature tolerance.
A number of studies have suggested that warming temperatures are causing northward
range expansion in many marine taxa (Barry et al., 1995; Hawkins et al., 2009; Herbert et al.,
2003; Mieszkowska et al., 2007; Sagarin et al., 1999). While tolerance of freezing conditions
has enabled some Melampus to extend their range into the temperate zone, variation in other
traits (e.g. desiccation or salinity stress) may have led to range variation among temperate
species. Based on this, I predict that the northern range limits of Melampus may not necessarily
expand northward if the climate warms.

61
CHAPTER 4: IDENTIFICATION OF SEASONALLY UP-REGULATED EXPRESSED
SEQUENCE TAGS IN MELAMPUS BIDENTATUS
If key adaptive traits evolve slowly, they can constrain a species’ potential. Adaptive
differences among species may underlie geographic range differences (Gaston, 2003; Spicer,
Gaston, 1999). If these adaptive traits rarely evolve rarely, the geographic range of a lineage will
be limited (Pyron, Burbrink, 2009; Roy et al., 2009; Wiens, Graham, 2005; Wiens et al., 2009).
Such constraints can contribute to latitudinal patterns in diversity by restricting species to the
tropics (Wiens, Donoghue, 2004; Wiens, Graham, 2005), particularly through an inability to
tolerate cold and freezing conditions (Farrell et al., 1992; Hylleberg, Siegismund, 1987;
Rivadeneira, Fernandez, 2005; Wiens et al., 2006). This process has been termed tropical niche
conservatism.
Tropical niche conservatism has been addressed at the phylogenetic level (Hawkins,
DeVries, 2009; Wiens et al., 2006; Wiens et al., 2009), but the physiological basis of these
patterns has been little explored (Gaston et al., 2009), much less the genetic basis of
physiological changes. To explore the genetic changes associated with a range expansion out of
the tropics, I have focused on the molecular basis of freeze tolerance in marsh snail, Melampus
bidentatus. M. bidentatus likely represents a northern range expansion within a mostly tropical
genus (Martins, 1996b, Chapter 2), and is known to tolerate cold and freezing conditions to a
greater extent than its tropical relatives (Chapter 2).
The genetic basis of novel adaptive traits may arise through changes in the nucleotide
sequence in genes or from changes expression levels of functionally identical genes (Feldman et
al., 2009; Geffeney et al; Coyne, Hoekstra, 2007; Hoekstra, Coyne, 2007). Changes in amino
acid sequences can cause functional changes in key proteins by altering their molecular
properties (e.g. polarity, charge, size). Changes in expression may come about through a number
of processes, including changes to regulatory genes (e.g. promoter regions, Haygood et al.,

62
2007), changes in the timing of expression (e.g. paedomorphic traits, Calvete et al.2009), or gene
duplication (Lynch, 2002), all of which will lead to altered proteins levels (Coyne, Hoekstra,
2007; Hoekstra, Coyne, 2007; Tomanek, Somero, 2002). Unlike enzymes, which have large
effects at low concentration, the activity conferred by the function of adaptive proteins is more
likely to be relative to its concentration (i.e. expression level).
The evolution of freeze tolerance can enable a poleward range expansion because the
cellular damage associated with freezing is often lethal (Ansart, Vernon, 2003; Holland et al.,
1991; Loomis, 1995). Ectotherms that cannot migrate to warmer areas survive freezing
conditions either by avoiding freezing or by tolerating it. Freezing can be avoided by moving to
a more thermally buffered microenvironment (e.g. by burying, Ansart, Vernon, 2003), or by
supercooling and preventing ice from forming (Duman, 2001; Zachariassen, Kristiansen, 2000).
Supercooling allows species to persist in freezing temperatures while avoiding the damage
caused by ice crystallization, and supercooled organisms may perish from mortality associated
with high cellular solute concentrations rather than damage from ice (Loomis, 1995).
Animals that cannot avoid ice formation survive by withstanding extracellular ice
(Ansart, Vernon, 2003). Commonly, these organisms produce ice nucleating molecules to
induce freezing. This early onset of freezing helps protect the animal by slowing the rate of ice
formation and initiating protective mechanisms in the cells, which are often similar to the
protective mechanisms in freeze avoidant organisms. Although supercooling is the most
common strategy for surviving freezing, many intertidal molluscs, including our study species,
M. bidentatus, are freeze tolerant (Ansart, Vernon, 2003; Loomis, 1995).
Ice nucleation activity has been well documented in M. bidentatus. Winter snails have a
significantly warmer supercooling point than summer snails, indicating that they are initiating ice
crystallization (Hayes, Loomis, 1985). Increases in ice nucleation activity are correlated with a
63
colder mean lethal temperature (LT50), meaning that when snails begin freezing at a warmer
temperature, they can survive to a colder temperatures (Loomis, 1985; Loomis, Hayes, 1987;
Lundheim, 2002). A protein associated with earlier freezing in M. bidentatus has been
characterized, but not isolated. It is likely an aggregate molecule (>600 kDa) composed of
smaller proteins (~16.6 and 17.4 kDa, Madison et al., 1991). Tissue examination in M.
bidentatus shows that damage in winter snails occurs below the lower lethal temperature (below
-10˚C), and is likely associated with cell lysis in the epithelial layer of the foot (Holland et al.,
1991).
The genetic basis of cold tolerance has been explored in diverse lineages including
insects (Andorfer, Duman, 2000; Duman, 2001; Duman et al., 1998; Sinclair et al., 2003), fish
(Davies et al., 2002; Near et al., 2006), and amphibians (Storey, 1999; Wu et al., 2002), among
which strategies to deal with cold and freezing vary. In intertidal gastropods, alteration of
metabolic pathways can help maintain cell function during bouts of cold and anoxia (Greenway,
Storey, 2001; MacDonald, Storey, 2006; Storey et al., 2007; Storey, 2006). This up-regulation
of carbohydrates and amino acids reduces damage from ice formation and protein denaturing
(Ansart, Vernon, 2003; Loomis, 1995). However, the role of these metabolic pathways could be
a response to stress following damaging events, and could act in concert with the actual
mechanisms used localize freezing and damage.
As a first step toward investigating genetic changes associated with freeze tolerance, I
have compared the highly expressed genes in M. bidentatus collected at two time points. I
expect the key adaptive proteins associated with freeze tolerance to be relatively highly
expressed in winter. Using an approach based on high throughput sequencing, I have identified
several cDNA transcripts that are up-regulated in one season or the other. Markers that I have

64
identified as highly expressed in the winter are likely candidates for the molecules conferring
freeze tolerance in Melampus.
Methods
Collections
All animals were collected at Beebe Cove, CT (41º20’23.13”N x 71º58’53.20”W), and
represent the cryptic species M. bidentatus North (Chapter 1). I have chosen to compare winter
and summer snails from the same population to minimize differences among treatments that
might arise due to habitat differences rather than with seasonal change (Hodgins-Davis,
Townsend, 2009). Winter snails were collected on January 29 - 30th
, 2008 and were maintained
at 5ºC with a 12 hour light cycle for one week before they were checked to be alive and placed
directly in -80ºC. Summer samples were collected on September 8, 2008, transported overnight,
and placed in a 21ºC incubator on a 12 hours light cycle for one week prior to preservation at -
80ºC. At the time of the summer collection, local temperatures had not fallen below 10ºC. In
both collections, each individual was verified to be alive and freely walking before preservation
directly at -80ºC.
RNA Isolation and cDNA Library Construction
Tissue for RNA extractions came primarily from the foot and lower portion of the body.
Reproductive and digestive organs were avoided because of their potentially confounding
seasonal variation in expression unrelated to adaptation for cold. RNA extraction using Trizol
(Invitrogen cat#15596-026) followed the manufacturers protocol, but with the addition of the
following modifications. Tissue was ground first in liquid nitrogen and then in Trizol using a
mortar and pestle. This mixture was left overnight at RT in a microcentrifuge tube. Following
this incubation, the homogenate was centrifuged at 12,000g for ten minutes at 4ºC. The
supernatant was transferred to a new tube and incubated for five minutes at RT. RNA was

65
precipitated using equal parts of isopropanol and DEPC-treated NaCl (1.2M) and was left
overnight at -20ºC prior to centrifugation at 12,000g for ten minutes at 4ºC. The RNA pellet was
resuspended in 40µl RNAse free water, quantified using a spectrophotometer (Nanodrop), and
visualized on a 1.5% agarose gel.
cDNA library construction closely followed the methods of Hale et al (2009).
Approximately 1µg from each RNA extraction was reverse transcribed using a modified
SMART cDNA kit (ClonTech cat#639523). I substituted the Invitrogen Superscript II (cat
#18064-014) for their RT and primed the reverse transcription with CDS III (Hale et al., 2009:
TAG AGG CCG AGG CGG CCG ACA TGT TTT GTT TTT TTT TCT TTT TTT TTT VN,
which is designed to break up long homopolymer repeats that interfere with the 454 titanium
chemistry. The resulting cDNA was amplified with the Advantage 2 PCR kit (ClonTech
cat#639207) with the primers CDSIII and 5’PCR (AAG CAG TGG TAT CAA CGC AGA GT)
and the following thermal profile: 1 min at 95ºC followed by 23 cycles of 95ºC for 15 seconds
and 68ºC for 6 minutes. Products were verified on a 1.5% agarose gel (fragment size range ~300
- 3,000 bp).
For the 454 sequencing run, I combined cDNA extracted from three individuals from
each season (winter and summer) in order to better represent expression in that population (rather
than of a single individual) and also to have sufficient RNA for the process. To do this, I directly
combined amplified cDNA PCR products and restriction-digested the pooled sample with the
SfiI enzyme for two hours at 50ºC. This product was cleaned up using the StrataPrep PCR
purification kit (cat#400771) and again verified on a 1.5% agarose gel (size fragments again
ranged from ~300 – 3,000 bp). Each sample was sequenced using one-fourth of a standard
sequencing plate on a Roche GS-FLX sequencer at the Duke Institute for Genome Science and
Policy.

66
Analysis of 454 Sequences
To obtain the most thorough coverage of the transcriptome, the 594,962 sequence reads
resulting from both treatments were combined and assembled into a set of reference contigs de
novo using GS De Novo Assembler (Margulies et al., 2005) and CAP3 (Huang, Madan, 1999).
Alignments using the GS De Novo Assembler used the default match settings, except that
sequences were screened to remove the primer sequence (the 5’ and CDSIII primers used to
construct the cDNA), and the option to align complex genomes was selected. The CAP3
alignment was performed using the default settings. These alignment programs match the short
reads from the raw data into larger, overlapping sets of sequences, ideally resulting in full-length
sequences of the original cDNA.
To measure relative expression levels from the two treatments, the raw data from winter
and summer were separately matched (using blastn) to the assembled reference contigs using
Pangea (Kofler et al., 2009). Matches were then ranked by copy number (the number of EST’s
in the raw data that match to a single contig) using Pangea. Relative expression of each contig
was calculated by dividing the number of matches to each reference contig (multiplied by 1000
for manageability) by the total number of contigs used, and was calculated by Pangea.
To identify transcripts that were abundant in one pool and not the other, the most
abundant EST’s were compared between the two libraries. A minimum of 500-1000 sequencing
read per gene are considered necessary to directly test for differences in gene expression
(Fontanillas et al., 2010). Although I am not interpreting our results as direct measures of gene
expression, I chose to compare only the 25 most abundant transcripts among libraries, which
encompassed all genes with more than 500 copies (Appendix C). To identify transcripts that
were abundant in one pool and not the other, the 25 most abundant EST’s from either season
were compared to their copy number in the other season. Highly expressed contigs that had a

67
least a 4-fold increase across seasons were considered highly up-regulated (based on expression
differences seen by Stillman, Tagmount, 2009). These up-regulated contigs were aligned in
Geneious (Drummond et al., 2009) to compare sequences between the two alignment methods
(CAP3 and GS De Novo Assembler). The contigs that could be aligned with a contig from the
other alignment method were considered reliably aligned and highly up-regulated.
To tentatively identify these sequences, the nucleotide sequence were blastx searched
against the Swiss-Prot database; I used this database only because it likely has the least
erroneous annotations (Schnoes et al., 2009). Although our approach does not compare all
transcripts that are unique to the season, this conservative comparison considers the markers that
are unambiguously up-regulated for each season
Results
A total of 363,988 reads were sequenced for the winter sample and 230,974 for summer.
The median read length was 396 bp, for a total of ~235 megabases. When data from both
treatments were combined, ~45% of the sequences from both of the samples together assembled
into ~42,000 contigs (overlapping expressed sequence tags representing a single gene sequence,
Table 4.1), meaning that more than half of the data did not assemble into contigs. However,
when the two treatments were aligned separately with the first alignment as a reference map,
Table 4.1: Assemblies of contigs from 454 sequences based on two different algorithms.
The average read length was 396 bp.
cDNA source Number
of reads
Contigs when
aligned to ref
made by GS
De Novo
Assembler
Contigs in
GS De Novo
Assembler
alone
Contigs
using CAP3
as ref
Contigs from
CAP3 alone
Winter
(Mid2)
363,988 33,520 27,108 39,481 33,018
Summer
(Mid3)
230,974 25,231 16,393 22,889 21,145
Both 42,248 42,742

68
~80% aligned, meaning many reads that did not assemble in the initial alignment could be
mapped to it. The number of contigs created was generally lower when they were mapped to a
reference sequence (Table 4.1), meaning that the sequences assembled into fewer contigs but
with more sequences mapping to a single contig.
Although the number of contigs produced by the two alignment methods did not differ
(Table 4.1), the number of EST’s that matched to the most abundant transcripts was much higher
when the raw data was aligned to the GS De Novo Assembler results (Figure 4.1, 4.2). There
were also several cases in which several contigs from the CAP3 alignment aligned to one
another, three of which are included in our results (Table 4.2, 4.3). This suggests that several of
the most abundant contigs in the CAP3 results were assembled into a single contig by GS De
Novo Assembler (and this is supported by blasting several of these sequences against one
another, Figure 4.1, 4.2 , Appendix C). The raw numbers of the most highly expressed
transcripts decreased quickly after the first ~20 contigs (Figure 4.1, 4.2, Appendix C).
The comparison of highly expressed sequence tags revealed eight transcripts that were
highly expressed in the winter and six in the summer using GS De Novo Assembler, and eight
winter and nine summer based on CAP3 (Table 4.2, 4.3, 4.4, Figure 4.1, 4.2). Alignment in
Geneious matched up only two winter contigs (Table 4.2) and three summer contigs (Table 4.3),
suggesting that the other highly expressed contigs were only created by one of the two assembly
methods. Among these, only one sequence had a significant match in the Swiss-Prot database
(N36990/C29536, Table 4.2). This cDNA sequence, up-regulated in winter, aligned to the
abalone shell protein perlucin (Genbank Accession #P82596.3). Of those sequences that were
highly expressed in both seasons, two sequences were similar to proteins identified based on the
structures they contained (e.g. G patch or zinc finger), and one sequence matched the ribosomal
protein S2.

69
Figure 4.1: Relative expression of the 25 most abundant transcripts from summer and winter collections of M.
bidentatus North, based on their alignment to contigs produced by GS De Novo Assembler.

70
Figure 4.2: Relative expression of the 25 most abundant transcripts from summer and winter collections of M.
bidentatus North, based on their alignment to contigs produced by CAP3.

71
Table 4.3: Up-regulated transcripts from summer, found by both alignment methods. Contigs are
indicated by the alignment that produced them (N=Gs De Novo Assembler, C=CAP3). Ratio of
expression is the ratio of summer: winter relative expression levels.
Contig Name Winter relative
expression (#copies)
Summer relative
expression (#copies)
Ratio of
expression
Tentative
identification
N37559
C9796
1.07 (135)
0.2 (14)
16.17 (1327)
4.17 (291)
15.11
20.85
none
N25310
C5648
0.13 (17)
0.35 (25)
5.65 (464)
11.5 (802)
43.46
32.86
none
N27842
C171
<10
<10
5.52 (453)
6.74 (470)
5.52
6.74
none
Table 4.4: Swiss-Prot blastx results of highly expressed proteins found in both seasons. Contigs are
indicated for which alignment they came from (N=Gs De Novo Assembler, C=CAP3). Ratio of relative
expression is winter: summer relative expression.
Contig Name in
GsDeNovoAssembler
Copy number
winter
(relative
expression)
Copy number
summer
(relative
expression)
Ratio of
expression
Tentative identification
N36972
C6527
C22715
66.95 (8483)
9.49 (673)
20.36(1444)
90.97 (7467)
13.55 (945)
21.98 (1533)
0.76
0.70
0.93
ribosomal protein S2
N2930
C1982
C13754
46.84 (5935)
23.68 (1679)
17.63 (1250)
55.06 (4520)
29.49 (2057)
24.15 (1684)
0.85
0.80
0.73
none
N1030
C2784
13.54 (1716)
10.32 (732)
5.2 (427)
5.33 (372)
2.60
1.93
none
N39818
C33154
5.66 (717)
4.22 (299)
10.45 (858)
6.17 (430)
0.54
0.68
Protein with G patch or
zinc finger
N37431
C29288
3.2 (406)
6.56 (465)
4.31 (354)
6.29 (439)
0.74
1.04
uncharacterized protein
N39712
C5843
2.82 (357)
3.46 (245)
4.74 (389)
13.12 (915)
0.59
0.26
none
Table 4.2: Up-regulated transcripts from winter, found by both alignment methods. Contigs are
indicated by the alignment that produced them (N=Gs De Novo Assembler, C=CAP3). Ratio of
expression is the ratio of winter: summer relative expression levels.
Contig Name Winter relative
expression (#copies)
Summer relative
expression (#copies)
Ratio of
expression
Tentative
identification
N36990
C29536
8.78 (1112)
11.13 (789)
2.62 (215)
2.71 (189)
3.35
0.42
perlucin (Genbank
#P82596.3)
N41200
C31054
C19850
4.84 (613)
6.02 (427)
10.58 (750)
1.89 (151)
<10 copies
<10 copies
2.56
6.02
10.58
none

72
Discussion
The Genomic Basis of Adaptation
Many adaptive differences can be attributed to DNA sequence variation (e.g. cryptic
coloration, Gross et al., 2009; Steiner et al., 2009; freeze tolerance, Graham et al., 2007;
pollution tolerance, Cohen, 2002). Variation in gene expression can also confer adaptive
differences without altering nucleotide sequence (Abzhanov et al., 2006; Coyne, Hoekstra, 2007;
Hoekstra, Coyne, 2007; Tomanek, Somero, 2002), and is likely important in many systems.
Expression of key adaptive genes have been shown to vary across altitudes (Cheviron et al.,
2008), latitudes (Stillman, Tagmount, 2009), seasons (Chen et al., 2008), developmental stages
(Qin et al., 2006; Wang et al., 2007) and populations (Place et al., 2008; Whitehead, Crawford,
2006). Adaptation may also come from some combination of sequence and expression changes,
suggesting that both sequence and expression should be compared when identifying the genetic
basis of adaptation.
Here, we have compared the most abundant transcripts from a single population of M.
bidentatus collected in two different seasons. We find that among the most highly expressed
proteins, less than one third are seasonally up-regulated, and the remaining sequences were
found highly expressed in both seasons. These common markers are likely important
housekeeping processes that function at all times. Molecules that were seasonally specific in
their up-regulation provide novel insight into the cellular processes of temperature tolerance in
Melampus. Those that are selectively up-regulated in the summer may be related to tolerance of
desiccation, salinity, heat or growth (Apley, 1970; Helvenston et al., 1995; Russell- Hunter et al.,
1972), whereas the molecules that are up-regulated in the winter are more likely to be involved
in freeze tolerance and cellular repair than in growth (Greenway, Storey, 2001). Further study of
these candidate markers, including a comparison of their structure and function in more distantly

73
related species, will be needed to better determine their contribution to the ecological niche
occupied by Melampus.
Identity of Up-Regulated Sequence Tags
From the highly up-regulated markers in winter, I have identified one sequence as a
homolog of the abalone protein perlucin (Mann et al., 2000). In abalone, this protein is a Ca2+
dependent lectin-like protein (carrying out Ca2+
-dependent binding of carbohydrates) and was
isolated from the nacreous layer of abalone shell (Mann et al., 2000). The up-regulation of a
protein associated with shell growth is unexpected in this early period of winter, during which
other gastropods are reportedly not growing (Greenway, Storey, 2001). Interestingly, one
sequence motif in the amino acid sequence of perlucin is also found in type II antifreeze proteins
in fish (Ewart et al., 1998; Mann et al., 2000). In fish, the Ca2+
binding site is modified for
antifreeze activity (Ewart et al., 1998).
Evolutionarily, novel phyenotypic traits can arise by manipulation of highly expressed
and phylogenetically conserved proteins (Feldman et al., 2009; Geffeney et al., 2005). Thus, in
Melampus, the calcium binding site of its perlucin homolog could be involved in antifreeze
activity, while still functioning to bind calcium and build components of the shell. To test this
theory, this protein should be isolated in Melampus to test for antifreeze activity, and its three
dimensional structure should be reconstructed to look for repetitive sequence motifs often
accompanying antifreeze activity (Andorfer, Duman, 2000; Ewart et al., 1998; Graham et al.,
2007). This marker is also a candidate sequence to be compared among temperate and tropical
species of Melampus to test for evidence of selective pressure on both nucleotide sequence and
expression.
The remaining markers that were highly expressed in both seasons did not closely match
any proteins in the Swiss-Prot database. This may be due to the large genetic distances that

74
separate pulmonates from other gastropods (Wilding et al., 1999), which would make
identification based on homologous sequence difficult. Expression studies in other groups (e.g.
arthropods, Stillman, Tagmount 2009) have found no strong homology for many strongly up-
regulated markers, suggesting that identification is difficult without a well annotated reference
genome. For molluscs, this is made more difficult by the lack of any completed
Lophotrochozoan genomes, meaning that large scale annotated genomes all come from
organisms that are separated from Melampus by several million years of evolutionary history.
However, because I am using blastx (which aligns nucleotide data to protein sequence by
translating it), there could be no close matches in the protein database because of errors in our
sequence alignment that have altered the open reading frame. Nonetheless, these markers are all
candidates for comparison among species and populations. Novel, adaptive functions may arise
through either changes in genomic sequence (Graham et al., 2007), through changes in gene
expression (Abzhanov et al., 2006; Cheviron et al., 2008; Goetz et al., 2010; Stillman,
Tagmount, 2009), or by some combination of these two (Chen et al., 2008). Consequently, to
test for the adaptive value of the highly expressed markers identified here, sequences of these
molecules should be tested for evidence of selection (e.g as in Elmer et al., 2010), but their
relative expression among species, among populations and across different environmental
conditions must also be investigated.
By comparing highly expressed sequences among seasons, some proteins may underlie
freeze tolerance, but I expect some of these markers are seasonally specific and not associated
with freeze or cold tolerance. This is most likely true for samples taken in the summer, when
genes associated with factors such as growth and metabolism are likely more active (Apley,
1970; Holle, Dineen, 1957; Greenway, Storey, 2001). To separate these two groups, highly up-
regulated markers should be identified based on homology with known proteins (when possible),

75
and expression should be measured across varying environmental exposures. This study has
compared a single collection from two seasons to estimate the interaction of the Melampus
genome with its environment (Hodgins-Davis, Townsend, 2009). To more fully understand the
role of each of these up-regulated markers, expression levels should likely be compared across
more time points, as well as in hot and cold treated samples from both winter and summer
(Stillman, Tagmount, 2009).
I am primarily interested in the adaptive proteins underlying temperature tolerance,
specifically those associated with freezing. Production of the ice nucleating molecules (based on
their activity in the blood) in Melampus appears to be only present during winter months
(Loomis, 1985; Loomis, Hayes, 1987), at which time freeze tolerance is also greater (Madison et
al., 1991). Because this activity appears seasonally, and because the activity of ice nucleating
molecules requires sufficient amounts of protein to interact with water to initiate ice formation, I
expect that the molecules associated with adaptation for freezing are among the highly expressed
sequences that I have isolated here.
Future Work Based on These Data
Advances in sequencing technology are rapidly allowing for greater insight into the
genetic basis of biological processes (see Molecular Ecology V19, Issue S1). The relatively
rapid production of large numbers of sequences (e.g. using 454, Illumina, or Solexa sequencing)
is particularly attractive for understanding the genetic basis of particular traits in non-model
organisms. The sequences I have analyzed also contain a number of markers that can be used in
future work addressing phylogentic relationships in Melampus. These transcriptomic data
contains numerous markers that will be valuable for future studies on the population structure of
Melampus, including sequence from neutrally evolving nuclear genes, microsatellites and single
nucleotide polymorphisms.

76
CHAPTER 5: CONCLUSIONS
Genetic tools are valuable for detecting unseen patterns of diversity that have direct
ecological consequences. This dissertation has focused on the temperate species Melampus
bidentatus. Genetic analyses in Chapter 1 identified three cryptic species within this nominal
species, two of which are found in partial sympatry and appear to partition their environment by
environmental variables: mostly temperature, salinity, tidal height, and moisture (through tidal
height and rainfall). To test these results, future experimental work should be done to address
the interaction of these variables. This could be best tested by conducting similar trials to our
freeze tolerance tests (Chapter 2), but by varying pairs of conditions (e.g. by testing temperature
tolerance at high and low salinities).
Physiological comparisons among Melampus species (Chapter 2) have shown a role of
freeze tolerance in setting latitudinal range limits. To more fully understand the limits set by
temperature, it would be useful to also look at the upper thermal limits in this group. Because
high temperatures are often found at high latitudes in summer months, I would not expect this to
explain range limits as much as freeze tolerance, but there may be differences among cryptic
species that further explain how they partition the environment. Tests of freeze tolerance in
Melampus collected in the Pacific (especially M. carolianus and M. olivaceus) would also be
useful to determine if they possess the same freeze tolerance abilities as M. floridanus.
The results of both ecological niche modeling and freeze tolerance trials suggests that the
microhabitat occupied by Melampus should be better investigated. Snails that were collected
among different structures (e.g under rocks, logs, and in fiddler crab holes) may be acclimated to
different conditions and may therefore have different physiological tolerance. There is much
more data on the mosaic of intertidal stress on the Pacific coast of North America (Helmuth et
al., 2006; Helmuth et al., 2002; Stillman, Tagmount, 2009). Similar measures on the Atlantic

77
coast would be useful. Habitat variation among regions should also be compared, particularly
between the South Carolina to northern Florida region (where M. bidentatus South was absent)
and its neighbors. Fine scale measures of environmental components such as soil chemistry,
plant composition, and daily temperature fluctuation may also reveal environmental differences
that the environmental layers used here have not.
Phylogenetic comparisons among the three cryptic species and their nearby tropical
relatives (Chapter 2) suggests that the most northerly distributed species are also the most
recently derived in this group, and that freeze tolerance could be a novel trait that has evolved to
allow the invasion of temperate regions by Melampus. However, without more fully resolving
the relationships within the Melampus Melampus clade, I cannot determine if freeze tolerance
evolved prior to the invasion of temperate habitat. If M. bidentatus Gulf turns out to be most
closely related to M. coffeus, its freeze tolerance capabilities would suggest that the tolerance of
freezing conditions preceded range expansions into the temperate zone. If, however, this species
is recently derived from one of the temperate species, it would suggest a conservation of the
traits conferring freeze tolerance that have been retained following a range shift to the south.
The relationships between the Melampus Melampus subgenus and the clade containing
the freeze tolerant M. floridanus also needs to be more fully resolved. Additional sequence data
should be included to better resolve the relationships among species, and additional markers can
now be easily obtained from the sequencing performed in Chapter 3. Future phylogenetic
analyses of Atlantic Melampus should also include all Melampus species found on the Pacific
coast of North America (I am lacking at least three species here), which may be close relatives of
the freeze M. floridanus. If freeze tolerance has a common evolutionary history between M.
floridanus and the Melampus Melampus group, it would suggest freeze tolerance capabilities are
not new in Melampus.

78
The expression results presented here provide the most interesting material for future
work in this group. Highly expressed genes with a seasonal bias (to winter or to summer) may
contain the genes underlying freeze tolerance. In particular, I have identified a shell- building
molecule whose function could be co-opted to aid in freeze tolerance in Melampus. This, and all
of the other up-regulated genes in Melampus, should be sequenced across the phylogeny to test
for adaptive sequence differences indicating that they are under positive selection (Swanson et
al., 2001).
The species ranges of Melampus provide a valuable natural system for studying range
expansions associated with adaptive change. In the temperate regions where it is found,
Melampus generally displays greater freeze tolerance than its tropical relatives, suggesting that
there are adaptive differences underlying range differences across climate zones. The potential
molecular basis of freeze tolerance in the northernmost distributed species (M. bidentatus North),
suggests that the genomic basis of freeze tolerance should be further studied for its role in
allowing niche expansion over evolutionary time.
Increased use of powerful genomic tools will help answer many ecological questions in
the years to come. New methods to more fully explore expression and sequence variation among
individuals and species (e.g. massively parallel sequencing) will likely help elucidate the
function and identity of key adaptive traits (e.g. for altitude, heat, pollution). A better
understanding of the genomic basis of adaptation will enable a number of insights, including the
role of novel adaptive genes in biogeographic processes, the response of species to climate
change, and the role of adaptive differences in the creation of new species.
79
REFERENCES
Aarset AV (1982) Freezing tolerance in intertidal invertebrates - A review. Comparative
Biochemistry and Physiology A-Molecular & Integrative Physiology, 73, 571-580.
Abzhanov A, Kuo WP, Hartmann C, et al. (2006) The calmodulin pathway and evolution of
elongated beak morphology in Darwin's finches. Nature 442, 563-567.
Ackerly D (2003) Community assembly, niche conservation, and adaptive evolution in changing
environments. International Journal of Plant Science, 162, S165-S184.
Addo-Bediako A, Chown SL, Gaston KJ (2000) Thermal tolerance, climatic variability and
latitude. Proceedings of the Royal Society of London Series B-Biological Sciences, 267,
739-745.
Allen EA, Fell PE, Peck MA, et al. (1994) Gut contents of common mummichogs, Fundulus
heteroclitus L, in a restored impounded marsh and in natural reference marshes.
Estuaries, 17, 462-471.
Alvarez N, Mercier L, Hossaert-McKey M, et al. (2006) Ecological distribution and niche
segregation of sibling species: the case of bean beetles, Acanthoscelides obtectus Say and
A. obvelatus Bridwell. Ecological Entomology, 31, 582-590.
Amende LM, Pierce SK (1980) Cellular volume regulation in salinity stressed molluscs: The
response of Noetia ponderosa (Arcidae) red blood cells to osmotic variation. Journal of
Comparative Physiology B: Biochemical, Systemic, and Environmental Physiology 138,
283-289.
Andorfer CA, Duman JG (2000) Isolation and characterization of cDNA clones encoding
antifreeze proteins of the pyrochroid beetle Dendroides canadensis. Journal of Insect
Physiology 46, 365-372.
Ansart A, Vernon P (2003) Cold hardiness in molluscs. Acta Oecologica International Journal
Of Ecology, 24, 95-102.
Antonov JI, Locarnini RA, Boyer TP, Mishonov AV, Garcia HE (2005) World Ocean Atlas
2005, Volume 2: Salinity.
Apley ML (1970) Field studies on life history, gonadal cycle and reproductive periodicity in
Melampus bidentatus (Pulmonata: Ellobiidae). Malacologia, 10, 381-397.
Bannister P, Polwart A (2001) The frost resistance of ericoid heath plants in the British Isles in
relation to their biogeography. Journal of Biogeography 28, 589-596.
Barroso R, Klautau M, Sole-Cava AM, Paiva PC (2010) Eurythoe complanata (Polychaeta:
Amphinomidae), the 'cosmopolitan' fireworm, consists of at least three cryptic species.
Marine Biology, 157, 69-80.

80
Barry JP, Baxter CH, Sagarin RD, Gilman SE (1995) Climate related, long term faunal changes
in a California rocky intertidal community. Science, 267, 672-675.
Beerli P (2006) Comparison of Bayesian and maximum-likelihood inference of population
genetic parameters. Bioinformatics, 22, 341-345.
Beerli P, Felsenstein J (1999) Maximum-likelihood estimation of migration rates and effective
population numbers in two populations using a coalescent approach. Genetics, 152, 763-
773.
Beerli P, Felsenstein J (2001) Maximum likelihood estimation of a migration matrix and
effective population sizes in n subpopulations by using a coalescent approach.
Proceedings of the National Academy of Sciences of the United States of America, 98,
4563-4568.
Bernardi G, Findley L, Rocha-Olivares A (2003) Vicariance and dispersal across Baja
California in disjunct marine fish populations. Evolution, 57, 1599-1609.
Bertness MD (1991) Interspecific interactions among high marsh perennials in a New England
salt Marsh. Ecology, 72, 125-137.
Bertness MD, Gough L, Shumway SW (1992) Salt tolerances and the distribution of fugitive salt
marsh plants. Ecology, 73, 1842-1851.
Bickford D, Lohman DJ, Sodhi NS, et al. (2007) Cryptic species as a window on diversity and
conservation. Trends in Ecology & Evolution, 22, 148-155.
Bigg GR, Cunningham CW, Ottersen G, et al. (2008) Ice-age survival of Atlantic cod: agreement
between palaeoecology models and genetics. Proceedings of the Royal Society B-
Biological Sciences, 275, 163-173.
Bishop TD, Hackney CT (1987) A comparative study of the mollusk communities of two
oligohaline intertidal marshes: Spatial and temporal distribtuion of abundance and
biomass. Estuaries, 10, 141-152.
Blum MJ, Bando KJ, Katz M, Strong DR (2007) Geographic structure, genetic diversity and
source tracking of Spartina alterniflora. Journal of Biogeography, 34, 2055-2069.
Briggs JC (1999) Coincident biogeographic patterns: Indo-West Pacific Ocean. Evolution 53,
326-335.
Broquet T, Petit EJ (2009) Molecular estimation of dispersal for ecology and population
genetics. Annual Review of Ecology, Evolution, and Systematics, 40, 193-216.
Brown AF, Kann LM, Rand DM (2001) Gene flow versus local adaptation in the northern acorn
barnacle, Semibalanus balanoides: Insights from mitochondrial DNA variation.
Evolution, 55, 1972-1979.

81
Calvete JJ, Sanz L, Cid P, et al. (2009) Snake venomics of the Central American rattlesnake
Crotalus simus and the South American Crotalus durissus complex points to
neurotoxicity as an adaptive paedomorphic trend along Crotalus dispersal in South
America. Journal of Proteome Research 9, 528-544.
Castaneda LE, Lardies MA, Bozinovic F (2004) Adaptive latitudinal shifts in the thermal
physiology of a terrestrial isopod. Evolutionary Ecology Research 6, 579-593.
Chen G, Hare MP (2008) Cryptic ecological diversification of a planktonic estuarine copepod,
Acartia tonsa. Molecular Ecology 17, 1451-1468.
Chen IC, Shiu HJ, Benedick S, et al. (2009) Elevation increases in moth assemblages over 42
years on a tropical mountain. Proceedings of the National Academy of Sciences of the
United States of America, 106, 1479-1483.
Chen ZZ, Cheng CHC, Zhang JF, et al. (2008) Transcrintomic and genomic evolution under
constant cold in Antarctic notothenioid fish. Proceedings of the National Academy of
Sciences of the United States of America 105, 12944-12949.
Cheviron ZA, Whitehead A, Brumfield RT (2008) Transcriptomic variation and plasticity in
rufous-collared sparrows (Zonotrichia capensis) along an altitudinal gradient. Molecular
Ecology 17, 4556-4569.
Chiba S (1999) Accelerated evolution of land snails Mandarina in the oceanic Bonin Islands:
Evidence from mitochondrial DNA sequences. Evolution, 53, 460-471.
Childs C (2004) Interpolating Surfaces in ArcGIS Spatial Analyst. ArcUser July- Sept., 32-35.
Cohen S (2002) Strong positive selection and habitat-specific amino acid substitution patterns in
Mhc from an estuarine fish under intense pollution stress. Molecular Biology and
Evolution, 19, 1870-1880.
Colgan DJ, Ponder WF, Eggler PE (2000) Gastropod evolutionary rates and phylogenetic
relationships assessed using partial 28S rDNA and histone H3 sequences. Zoologica
Scripta, 29, 29-63.
Colwell RK, Rangel TF (2009) Hutchinson's duality: The once and future niche. Proceedings of
the National Academy of Sciences. 106, 19654-19658.
Compton TJ, Rijkenberg MJA, Drent J, Piersma T (2007) Thermal tolerance ranges and climate
variability: A comparison between bivalves from differing climates. Journal of
Experimental Marine Biology and Ecology 352, 200-211.
Connell JH (1961) The influence of interspecific competition and other factors on the
distribution of the barnacle Chthamalus stellatus. Ecology, 42, 710-723.
Connell JH (1972) Community Interactions on Marine Rocky Intertidal Shores. Annual Review
of Ecology and Systematics 3, 169-192.

82
Cordellier M, Pfenninger M (2009) Inferring the past to predict the future: climate modelling
predictions and phylogeography for the freshwater gastropod Radix balthica (Pulmonata,
Basommatophora). Molecular Ecology, 18, 534-544.
Coyne JA, Hoekstra HE (2007) Evolution of protein expression: New genes for a new diet.
Current Biology 17, R1014-R1016.
Cussac V, Fernandez D, Gomez SE, Lopez HL (2009) Fishes of southern South America: a story
driven by temperature. Fish Physiology and Biochemistry, 35, 29-42.
Dahlhoff EP, Stillman JH, Menge BA (2002) Physiological community ecology: Variation in
metabolic activity of ecologically important rocky intertidal invertebrates along
environmental gradients. Integrative and Comparative Biology 42, 862-871.
Daiber FC (1982) Animals of the tidal marsh. Van Nostrand Reinhold Co., New York, USA.
Davies PL, Baardsnes J, Kuiper MJ, Walker VK (2002) Structure and function of antifreeze
proteins. Philosophical Transactions Of The Royal Society Of London Series B-
Biological Sciences 357, 927-933.
Davison A (2000) The inheritance of divergent mitochondria in the land snail, Cepaea
nemoralis. Journal of Molluscan Studies, 66, 143-147.
Dayan NS, Dillon RT (1995) Florida as a biogeographic boundary - evidence from the
population genetics of Littorina irrorata. Nautilus, 108, 49-54.
Depraz A, Hausser J, Pfenninger M (2009) A species delimitation approach in the Trochulus
sericeus/hispidus complex reveals two cryptic species within a sharp contact zone. BMC
Evolutionary Biology, 9, 171.
Dong YW, Somero GN (2009) Temperature adaptation of cytosolic malate dehydrogenases of
limpets (genus Lottia): differences in stability and function due to minor changes in
sequence correlate with biogeographic and vertical distributions. Journal of
Experimental Biology, 212, 169-177.
Duman JG (2001) Antifreeze and ice nucleator proteins in terrestrial arthropods. Annual Review
Of Physiology 63, 327-357.
Duman JG, Li N, Verleye D, et al. (1998) Molecular characterization and sequencing of
antifreeze proteins from larvae of the beetle Dendroides canadensis. Journal of
Comparative Physiology B-Biochemical Systemic and Environmental Physiology 168,
225-232.
Drummond A, Rambaut A (2007) BEAST: Bayesian evolutionary analysis by sampling trees.
Bmc Evolutionary Biology 7, 214.
Drummond A, Ashton B, Cheung M, et al. (2009) Geneious v4.5. Available from
http://www.geneious.com.

83
Elith J, Graham CH, Anderson RP, et al. (2006) Novel methods improve prediction of species'
distributions from occurrence data. Ecography, 29, 129-151.
Elmer KR, Fan S, Gunter HM, et al. (2010) Rapid evolution and selection inferred from the
transcriptomes of sympatric crater lake cichlid fishes. Molecular Ecology 19, 197-211.
Engle VD, Summers JK (1999) Latitudinal gradients in benthic community composition in
Western Atlantic estuaries. Journal of Biogeography, 26, 1007-1023.
ESRI (1999-2006) ArcMap 9.2.
Ewart KV, Li Z, Yang DSC, Fletcher GL, Hew CL (1998) The ice-binding site of Atlantic
herring antifreeze proteins corresponds to the carbohydrate- binding site of C-type
lectins. Biochemistry 37, 4080-4085.
Farrell BD, Mitter C, Futuyma DJ (1992) Diversification at the insect-plant interface. BioScience
42, 34-42.
Farris JS, Källersjö M, Kluge AG, Bult C (1994) Testing Significance of Incongruence.
Cladistics 10, 315-319.
Feldman CR, Brodie ED, Pfrender ME (2009) The evolutionary origins of beneficial alleles
during the repeated adaptation of garter snakes to deadly prey. Proceedings of the
National Academy of Sciences of the United States of America 106, 13415-13420.
Folmer O, Black M, Hoeh W, Lutz R, Vrijenhoek R (1994) DNA primers for amplification of
mitochondrial cytochrome c oxidase subunit I from diverse metazoan invertebrates.
Molecular Maring Biology and Biotechnoly, 3, 194-297.
Fontanillas P, Landry Cr, Wittkopp PJ, et al. (2010) Key considerations for measuring allelic
expression on a genomic scale using high-throughput sequencing. Molecular Ecology 19,
212-227.
Gansert D, Backes K, Kakubari Y (1999) Altitudinal and seasonal variation of frost resistance of
Fagus crenata and Betula ermanii along the Pacific slope of Mt. Fuji, Japan. Journal of
Ecology 87, 382-390.
Gaston KJ (2003) The Structure and Dynamics of Geographic Ranges Oxford University Presss,
Oxford, England.
Gaston KJ, Chown Steven L, Calosi P, et al. (2009) Macrophysiology: A conceptual
reunification. The American Naturalist 174, 595-612.
Gaston KJ, Spicer JI (1998) Do upper thermal tolerances differ in geographically separated
populations of the beachflea Orchestia gammarellus (Crustacea : Amphipoda)? Journal
of Experimental Marine Biology and Ecology, 229, 265-276.

84
Geffeney SL, Fujimoto E, Brodie ED, Brodie ED, Ruben PC (2005) Evolutionary diversification
of TTX-resistant sodium channels in a predator-prey interaction. Nature 434, 759-763.
Gilman SE (2006) The northern geographic range limit of the intertidal limpet Collisella scabra:
a test of performance, recruitment, and temperature hypotheses. Ecography, 29, 709-720.
Goetz F, Rosauer D, Sitar S, et al. (2010) A genetic basis for the phenotypic differentiation
between siscowet and lean lake trout (Salvelinus namaycush). Molecular Ecology 19,
176-196.
Graca MA, Newell SY, Kneib RT (2000) Grazing rates of organic matter and living fungal
biomass of decaying Spartina alterniflora by three species of salt-marsh invertebrates.
Marine Biology, 136, 281-289.
Graham CH, Hijmans RJ (2006) A comparison of methods for mapping species ranges and
species richness. Global Ecology and Biogeography, 15, 578-587.
Graham CH, Ron SR, Santos JC, Schneider CJ, Moritz C (2004) Integrating phylogenetics and
environmental niche models to explore speciation mechanisms in dendrobatid frogs.
Evolution, 58, 1781-1793.
Graham LA, Qin WS, Lougheed SC, Davies PL, Walker VK (2007) Evolution of hyperactive,
repetitive antifreeze proteins in beetles. Journal of Molecular Evolution 64, 387-398.
GraphPad Prism version 5.02 for Windows GS, San Diego California USA, www.graphpad.com.
Greenway SC, Storey KB (2001) Effects of seasonal change and prolonged anoxia on metabolic
enzymes of Littorina littorea. Canadian Journal of Zoology-Revue Canadienne De
Zoologie 79, 907-915.
Gross JB, Borowsky R, Tabin CJ (2009) A novel role for Mc1r in the parallel evolution of
depigmentation in independent populations of the cavefish Astyanax mexicanus. PLoS
Genet 5, e1000326.
Grosberg RK, Cunningham CW (2001) Genetic structure in the sea from populations to
communities. In: Marine Community Ecology (eds. Bertness MD, Gaines S, Hay ME),
pp. 61-84. Sinauer Associates, Inc., Sunderland, MA.
Hale MC, McCormick CR, Jackson JR, DeWoody JA (2009) Next-generation pyrosequencing of
gonad transcriptomes in the polyploid lake sturgeon (Acipenser fulvescens): the relative
merits of normalization and rarefaction in gene discovery. BMC Genomics 10, 11.
Haney RA, Dionne M, Puritz J, Rand DM (2009) The comparative phylogeography of east coast
estuarine fishes in formerly glaciated sites: persistence versus recolonization in
Cyprinodon variegatus ovinus and Fundulus heteroclitus macrolepidotus. Journal of
Heredity, 100, 284-296.

85
Harley CDG, Hughes AR, Hultgren KM, et al. (2006) The impacts of climate change in coastal
marine systems. Ecology Letters, 9, 228-241.
Harmon LJ, Kolbe JJ, Losos JB, Cheverud JM (2005) Convergence and the multidimensional
niche. Evolution, 59, 409-421.
Harrison TD, Whitfield AK (2006) Temperature and salinity as primary determinants influencing
the biogeography of fishes in South African estuaries. Estuarine Coastal and Shelf
Science 66, 335-345.
Hawkins BA, DeVries PJ (2009) Tropical niche conservatism and the species richness gradient
of North American butterflies. Journal of Biogeography 36, 1698-1711.
Hawkins S, Sugden H, Mieszkowska N, et al. (2009) Consequences of climate-driven
biodiversity changes for ecosystem functioning of North European rocky shores. Marine
Ecology Progress Series 396, 245-259.
Hayes DR, Loomis SH (1985) Evidence for a proteinaceous ice nucleator in the hemolymph of
the pulmonate gastropod Melampus bidentatus. Cryo-letters 6, 418-421.
Haygood R, Fedrigo O, Hanson B, Yokoyama KD, Awray G (2007) Promoter regions of many
neural- and nutrition-related genes have experienced positive selection during human
evolution. Nature Genetics 39, 1140-1144.
Hedrick PW (1999) Perspective: Highly variable loci and their interpretation in evolution and
conservation. Evolution, 53, 313-318.
Heled J, Drummond AJ (2009) Bayesian inference of species trees from multilocus data. Mol
Biol Evol, msp274.
Hellberg ME (2009) Gene flow and isolation among populations of marine animals. Annual
Review Of Ecology And Evolutionary Systematics, 40, 291-310.
Hellmann JJ, Pelini SL, Prior KM, Dzurisin JDK (2008) The response of two butterfly species to
climatic variation at the edge of their range and the implications for poleward range
shifts. Oecologia, 157, 583-592.
Helmuth B, Broitman BR, Blanchette CA, et al. (2006a) Mosaic patterns of thermal stress in the
rocky intertidal zone: Implications for climate change. Ecological Monographs, 76, 461-
479.
Helmuth B, Harley CDG, Halpin PM, et al. (2002) Climate change and latitudinal patterns of
intertidal thermal stress. Science 298, 1015-1017.
Helmuth B, Mieszkowska N, Moore P, Hawkins SJ (2006b) Living on the edge of two changing
worlds: Forecasting the responses of rocky intertidal ecosystems to climate change.
Annual Review of Ecology Evolution and Systematics, 37, 373-404.

86
Herbert RJH, Hawkins SJ, Sheader M, Southward AJ (2003) Range extension and reproduction
of the barnacle Balanus perforatus in the eastern English Channel. Journal Of The
Marine Biological Association Of The United Kingdom, 83, 73-82.
Hijmans RJ, Spooner DM (2001) Geographic distribution of wild potato species. American
Journal of Botany, 88, 2101-2112.
Hijmans RJ, Cameron SE, Parra JL, Jones PG, Jarvis A (2005) Very high resolution interpolated
climate surfaces for global land areas. International Journal of Climatology, 25, 1965-
1978.
Hilbish TJ (1981) Latitudinal variation in freezing tolerance of Melampus bidentatus (Say)
(Gastropoda, Pulmonata). Journal of Experimental Marine Biology and Ecology 52, 283-
297.
Hirzel AH, Hausser J, Chessel D, Perrin N (2002) Ecological-niche factor analysis: How to
compute habitat-suitability maps without absence data? Ecology, 83, 2027-2036.
Hodgins-Davis A, Townsend JP (2009) Evolving gene expression: from G to E to G x E. Trends
in Ecology & Evolution 24, 649-658.
Hoekstra HE, Coyne JA (2007) The locus of evolution: Evo devo and the genetics of adaptation.
Evolution 61, 995-1016.
Holland B, Loomis SH, Gordon JL (1991) Ice formation and freezing damage in the foot muscle
of the intertidal snail Melampus bidentatus. Cryobiology 28, 491-498.
Holle P, Dineen C (1957) Life History of the Salt-marsh snail, Melampus bidentatus Say. The
Nautilus 70, 90-95.
Huang X, Madan A (1999) CAP3: A DNA sequence assembly program. Genome Resources 9,
868-877.
Huelsenbeck JP, Ronquist F (2001) MRBAYES: Bayesian inference of phylogeny.
Bioinformatics 17, 754-755.
Hutchinson GE (1957) Population studies - animal ecology and demography - Concluding
remarks. Cold Spring Harbor Symposia on Quantitative Biology, 22, 415-427.
Hylleberg J, Siegismund HR (1987) Niche overlap in mud snails (Hydrobiidae): Freezing
tolerance. Marine Biology, 94, 403-407.
Jablonski D (1999) The future of the fossil record. Science 284, 2114-2116.
Jablonski D, Roy K, Valentine JW (2006) Out of the tropics: Evolutionary dynamics of the
latitudinal diversity gradient. Science 314, 102-106.

87
Jenkins NL, Hoffmann AA (1999) Limits to the southern border of Drosophila serrata: Cold
resistance, heritable variation, and trade-offs. Evolution 53, 1823-1834.
Jensen GC, Armstrong DA (1991) Intertidal zonation among congeners- Factors resulting
distribution of porcelain crabs Petrolisthes sp. (Anomura, Porcellanidae) Marine
Ecology-Progress Series 73, 47-60.
Jiménez-Castillo M, Wiser S, Lusk C (2007) Elevational parallels of latitudinal variation in the
proportion of lianas in woody floras. Journal of Biogeography 34, 163-168.
Kaiser HF (1960) The application of electronic computers to factor analysis. Educational and
Psychological Measurement, 20, 141-151.
Keever CC, Sunday J, Puritz JB et al. (2009) Discordant distribution of populations and genetic
variation in a sea star with high dispersal potential Evolution, 63, 3214-3227.
Kelly DW, Muirhead JR, Heath DD, Macisaac HJ (2006) Contrasting patterns in genetic
diversity following multiple invasions of fresh and brackish waters. Molecular Ecology,
15, 3641-3653.
Kenchington EL, Harding GC, Jones MW, Prodohl PA (2009) Pleistocene glaciation events
shape genetic structure across the range of the American lobster Homarus americanus.
Molecular Ecology, 18, 1654-1667.
Kimura MT (2004) Cold and heat tolerance of drosophilid flies with reference to their latitudinal
distributions. Oecologia 140, 442-449.
Knowlton N (1993) Sibling Species in the Sea. Annual Review Of Ecology And Systematics, 24,
189-216.
Kofler R, Teixeira Torres T, Lelley T, Schlotterer C (2009) PanGEA: Identification of allele
specific gene expression using the 454 technology. BMC Bioinformatics 10, 143.
Kuo ESL, Sanford E (2009) Geographic variation in the upper thermal limits of an intertidal
snail: implications for climate envelope models. Marine Ecology-Progress Series 388,
137-146.
Lau JA, McCall AC, Davies KF, McKay JK, Wright JW (2008) Herbivores and edaphic factors
constrain the realized niche of a native plant. Ecology, 89, 754-762.
Lee JE, Janion C, Marais E, van Vuuren BJ, Chown SL (2009) Physiological tolerances account
for range limits and abundance structure in an invasive slug. Proceedings of the Royal
Society B-Biological Sciences 276, 1459-1468.
Lee SC, Silliman BR (2006) Competitive displacement of a detritivorous salt marsh snail.
Journal of Experimental Marine Biology and Ecology 339, 75-85.
Legendre P (1993) Spatial autocorrelation: Trouble or new paradigm. Ecology, 74, 1659-1673.

88
Lepš, J, Šmilauer P (2003) Multivariate analysis of ecological data using CANOCO.
Cambridge University Press, Cambridge, United Kingdom.
Lobo JM, Jiménez-Valverde A, Real R (2008) AUC: A misleading measure of the performance
of predictive distribution models. Global Ecology and Biogeography, 17, 145-151.
Loomis SH (1985) Seasonal changes in the freezing tolerance of the intertidal pulmonate
Gastropod Melampus bidentatus Say. Canadian Journal of Zoology-Revue Canadienne
De Zoologie 63, 2021-2025.
Loomis SH (1995) Freezing tolerance of marine invertebrates. Oceanography And Marine
Biology: an Annual Review 33, 337-350.
Loomis SH, Hayes D (1987) Effects of temperature, food deprivation and photoperiod on the
cold tolerance of the intertidal pulmonate Gastropod, Melampus bidentatus. Cryo-Letters
8, 25-34.
Lozier JD, Aniello P, Hickerson MJ (2009) Predicting the distribution of Sasquatch in western
North America: anything goes with ecological niche modelling. Journal of
Biogeography, 36, 1623-1627.
Lundheim R (2002) Physiological and ecological significance of biological ice nucleators.
Philosophical Transactions Of The Royal Society Of London Series B-Biological
Sciences 357, 937-943.
Lynch M (2002) Genomics - Gene duplication and evolution. Science 297, 945-947.
MacDonald JA, Storey KB (2006) Identification of a 115kDa MAP-kinase activated by freezing
and anoxic stresses in the marine periwinkle, Littorina littorea. Archives of Biochemistry
and Biophysics 450, 208-214.
Madison DL, Scrofano MM, Ireland RC, Loomis SH (1991) Purification and partial
characterization of an ice nucleator protein from the intertidal Gastropod, Melampus
bidentatus. Cryobiology 28, 483-490.
Maggs CA, Castilho R, Foltz D, et al. (2008) Evaluating signatures of glacial refugia for north
Atlantic benthic marine taxa. Ecology, 89, S108-S122.
Maia RC, Tanaka MO (2007) Avaliação de efeitos de espécies de mangue na distribuição de
Melampus coffeus (Gastropoda, Ellobiidae) no Ceará, nordeste do Brasil. Iheringia. Série
Zoologia 97, 379-382.
Mann K, Weiss IM, André S, Gabius H-J, Fritz M (2000) The amino-acid sequence of the
abalone (Haliotis laevigata) nacre protein perlucin. European Journal of Biochemistry
267, 5257-5264.

89
Margulies M, Egholm M, Altman W, et al. (2005) Genome sequencing in open microfabricated
high density picoliter reactors. Nature 437, 376 - 380.
Marko PB, Moran AL (2009) Out of sight, out of mind: high cryptic diversity obscures the
identities and histories of geminate species in the marine bivalve subgenus Acar. Journal
of Biogeography, 36, 1861-1880.
Martins A (1996a) Relationships within the Ellobiidae. In: Origin and evolutionary radiation of
the Mollusca (ed. Taylor J), pp. 285-294. Oxford University Press.
Martins AMD (1996b) Anatomy and systematics of the Western Atlantic Ellobiidae
(Gastropoda: Pulmonata). Malacologia 37, 163-332.
Matsukura K, Tsumuki H, Izumi Y, Wada T (2008) Changes in chemical components in the
freshwater apple snail, Pomacea canaliculata (Gastropoda: Ampullariidae), in relation to
the development of its cold hardiness. Cryobiology 56, 131-137.
McCairns RJS, Bernatchez L (2008) Landscape genetic analyses reveal cryptic population
structure and putative selection gradients in a large-scale estuarine environment.
Molecular Ecology, 17, 3901-3916.
McKee KL, Faulkner PL (2000) Restoration of biogeochemical function in mangrove forests.
Restoration Ecology 8, 247-259.
Mehlman DW (1997) Change in avian abundance across the geographic range in response to
environmental change. Ecological Applications, 7, 614-624.
Mieszkowska N, Hawkins SJ, Burrows MT, Kendall MA (2007) Long-term changes in the
geographic distribution and population structures of Osilinus lineatus (Gastropoda:
Trochidae) in Britain and Ireland. Journal of the Marine Biological Association of the UK
87, 537-545.
Miller LP, Harley CDG, Denny MW (2009a) The role of temperature and desiccation stress in
limiting the local-scale distribution of the owl limpet, Lottia gigantea. Functional
Ecology, 23, 756-767.
Miller SR, Williams C, Strong AL, Carvey D (2009b) Ecological Specialization in a Spatially
Structured Population of the Thermophilic Cyanobacterium Mastigocladus laminosus.
Applied and Environmental Microbiology, 75, 729-734.
Minin V, Abdo Z, Joyce P, Sullivan J (2003) Performance-based selection of likelihood models
for phylogeny estimation. Systematic Biology 52, 674-683.
Morrison JPE (1950) American Ellobiidae: An annotated list. American Malacological Union,
Annual Report, 8-10.
Murawski SA (1993) Climate change and marine fish distributions: forecasting from historical
analogy. Transactions of the American Fisheries Society, 122, 647-658.

90
Murphy DJ, Pierce SK (1975) The physiological basis for changes in the freezing tolerance of
intertidal molluscs. I. Response to subfreezing temperatures and the influence of salinity
and temperature acclimation. Journal of Experimental Zoology, 193, 313-321.
Near TJ, Parker SK, Detrich HW (2006) A genomic fossil reveals key steps in hemoglobin loss
by the Antarctic icefishes. Molecular Biology and Evolution 23, 2008-2016.
Netemeyer RG, Sharma S, Bearden WO (2007) Scaling procedures issues and applications, 1st
edition, Sage Publications, Thousand Oaks, CA.
Neufeld DS, Wright SH (1996) Response of cell volume in Mytilus gill to acute salinity change.
Journal of Experimental Biology 199, 473-484.
Nosil P (2008) Speciation with gene flow could be common. Molecular Ecology, 17, 2103-
2106.
Nylander JAA (2004) MrModeltest v2. Program distributed by the author. Evolutionary Biology
Centre, Uppsala University.
Oliver PM, Adams M, Lee MSY, Hutchinson MN, Doughty P (2009) Cryptic diversity in
vertebrates: molecular data double estimates of species diversity in a radiation of
Australian lizards (Diplodactylus, Gekkota). Proceedings of the Royal Society B:
Biological Sciences, 276, 2001-2007.
Olson DM, Dinerstein E, Wikramanayake ED, et al. (2001) Terrestrial ecoregions of the worlds:
A new map of life on Earth. BioScience 51, 933-938.
Peck LS (2002) Ecophysiology of Antarctic marine ectotherms: limits to life. Polar Biology 25,
31-40.
Peck LS, Conway LZ (2000) The myth of metabolic cold adaptation: oxygen consumption in
stenothermal Antarctic bivalves. Geological Society, London, Special Publications 177,
441-450.
Pennings SC, Silliman BR (2005) Linking biogeography and community ecology: Latitudinal
variation in plant-herbivore interaction strength. Ecology 86, 2310-2319.
Perry CL, Mendelssohn IA (2009) Ecosystem effects of expanding populations of Avicennis
germinans in a Louisiana salt marsh. Wetlands 29, 396-406.
Pfenninger M, Cordellier M, Streit B (2006) Comparing the efficiency of morphologic and
DNA-based taxonomy in the freshwater gastropod genus Radix (Bassommatophora,
pulmonata). BMC Evolutionary Biology, 6, 100.
Phillips SJ, Anderson RP, Schapire RE (2006) Maximum entropy modeling of species
geographic distributions. Ecological Modelling, 190, 231-259.

91
Phillips SJ, Dudik M (2008) Modeling of species distributions with Maxent: new extensions and
a comprehensive evaluation. Ecography, 31, 161-175.
Pierce SK, Amende LM (1981) Control mechanisms of amino acid-mediated cell volume
regulation in salinity-stressed molluscs. Journal of Experimental Zoology 215, 247-257.
Piganeau G, Gardner M, Eyre-Walker A (2004) A broad survey of recombination in animal
mitochondria. Molecular Biology and Evolution 21, 2319-2325.
Place SP, O'Donnell MJ, Hofmann GE (2008) Gene expression in the intertidal mussel Mytilus
californianus: physiological response to environmental factors on a biogeographic scale.
Marine Ecology-Progress Series 356, 1-14.
Prada C, Schizas NV, Yoshioka PM (2008) Phenotypic plasticity or speciation? A case from a
clonal marine organism. BMC Evolutionary Biology, 8, 19.
Proffitt CE, Devlin DJ (2005) Grazing by the intertidal gastropod Melampus coffeus greatly
increases mangrove leaf litter degradation rates. Marine Ecology-Progress Series 296,
209-218.
Pyron RA, Burbrink FT (2009) Can the tropical conservatism hypothesis explain temperate
species richness patterns? An inverse latitudinal biodiversity gradient in the New World
snake tribe Lampropeltini. Global Ecology and Biogeography 18, 406-415.
Qin WS, Tyshenko MG, Doucet D, Walker VK (2006) Characterization of antifreeze protein
gene expression in summer spruce budworm larvae. Insect Biochemistry and Molecular
Biology 36, 210-218.
Rajagopal S, Van der Gaag M, Van de Velde G, Jenner HA (2005) Upper temperature tolerances
of exotic brackish-water mussel, Mytilopsis leueophaeata (Conrad): An experimental
study. Marine Environmental Research, 60, 512-530.
Rayner NA, Horton EB, Parker DE, et al. (1997) Global ocean surface temperature atlas plus
(GOSTAplus), UK Meteorological Office JPL. Source: Physical oceanography
distributed Active archive center.
Read J, Hill RS (1989) The Response of Some Australian Temperate Rain Forest Tree Species to
Freezing Temperatures and Its Biogeographical Significance. Journal of Biogeography
16, 21-27.
Richards VP, Thomas JD, Stanhope MJ, Shivji MS (2007) Genetic connectivity in the Florida
reef system: comparative phylogeography of commensal invertebrates with contrasting
reproductive strategies. Molecular Ecology, 16, 139-157.
Ricklefs RE (2004) A comprehensive framework for global patterns in biodiversity. Ecology
Letters 7, 1-15.

92
Rietsma CS, Valiela I, Buchsbaum R (1988) Detrital chemistry, growth, and food choice in the
salt-marsh snail (Melampus bidentatus). Ecology, 69, 261-266.
Rissler LJ, Apodaca JJ (2007) Adding more ecology into species delimitation: Ecological niche
models and phylogeography help define cryptic species in the black salamander (Aneides
flavipunctatus). Systematic Biology, 56, 924-942.
Rivadeneira MM, Fernandez M (2005) Shifts in southern endpoints of distribution in rocky
intertidal species along the south-eastern Pacific coast. Journal of Biogeography 32, 203-
209.
Robinson J, Diaz-Ferguson E, Poelchau M, et al. (2010) Multiscale Diversity in the Marshes of
the Georgia Coastal Ecosystems LTER. Estuaries and Coasts. In press.
Roland W, Ring RA (1977) Cold, freezing, and desiccation tolerance of the limpet Acmaea
digitalis (Eschscholtz). Cryobiology, 14, 228-235.
Rogers DH, Randolf SE (1991) Mortality rates and population density of tsetse flies correlated
with satellite data. Nature, 351, 739-741.
Root T (1988) Environmental factors associated wtih avian distributions and abundances.
Ecology, 69, 330-339.
Ronquist F, Huelsenbeck JP (2003) MRBAYES 3: Bayesian phylogenetic inference under mixed
models. Bioinformatics 19, 1572-1574.
Ross MS, Ruiz PL, Say JP, Hanan EJ (2009) Chilling damage in a changing climate in coastal
landscapes of the subtropical zone: a case study from south Florida. Global Change
Biology 15, 1817-1832.
Roy K, Hunt G, Jablonski D, Krug AZ, Valentine JW (2009) A macroevolutionary perspective
on species range limits. Proceedings of the Royal Society B-Biological Sciences 276,
1485-1493.
Rozas J, Librado P, Sanchez-DelBarrio JC, Messeguer X, Rozas R (1995-2009) DNA Sequence
Polymorphism (DNAsp), Available from www.ub.es/dnasp, Universitat de Barcelona.
Russell- Hunter WD, Apley ML, Hunter RD (1972) Early life-history of Melampus and
significance of semilunar synchrony. Biological Bulletin, 143, 623-656.
Roy K, Hunt G, Jablonski D, Krug AZ, Valentine JW (2009) A macroevolutionary perspective
on species range limits. Proceedings of the Royal Society B-Biological Sciences 276,
1485-1493.
Sagarin RD, Barry JP, Gilman SE, Baxter CH (1999) Climate-related change in an intertidal
community over short and long time scales. Ecological Monographs, 69, 465-490.

93
Sanford E, Holzman SB, Haney RA, Rand DM, Bertness MD (2006) Larval tolerance, gene
flow, and the northern geographic range limit of fiddler crabs. Ecology, 87, 2882-2894.
Say (1822) Journal of the National Academy of Sciences (Of Philadelphia), 84-85.
Schaeffer W, Keller ECJ, Buroker NE (1985) Population genetics of Melampus bidentatus
(Gastropoda: Pulmonata): the effect of planktonic development on gene flow. Genetica,
66, 223-229.
Schnoes AM, Brown SD, Dodevski I, Babbitt PC (2009) Annotation Error in Public Databases:
Misannotation of Molecular Function in Enzyme Superfamilies. PLoS Computational
biology 5.
Sexton JP, McIntyre PJ, Angert AL, Rice KJ (2009) Evolution and ecology of species range
limits. Annual Review of Ecology, Evolution, and Systematics, 40, 415-436.
Sinclair BJ, Addo-Bediako A, Chown SL (2003) Climatic variability and the evolution of insect
freeze tolerance. Biological Reviews 78, 181-195.
Sinclair BJ, Marshall DJ, Singh S, Chown SL (2004) Cold tolerance of Littorinidae from
southern Africa: intertidal snails are not constrained to freeze tolerance. Journal of
Comparative Physiology B-Biochemical Systemic and Environmental Physiology 174,
617-624.
Slatkin M (1987) Gene flow and the geographic structure of natural populations. Science, 236,
787-792.
Smith JM (1992) Analyzing the mosaic structure of genes. Journal of Molecular Evolution, 34,
126-129.
Somero GN (2002) Thermal physiology and vertical zonation of intertidal animals: Optima,
limits, and costs of living. Integrative and Comparative Biology, 42, 780-789.
Sotka EE, Hay ME (2002) Geographic variation among herbivore populations in tolerance for a
chemically rich seaweed. Ecology, 83, 2721-2735.
Spalding MD, Fox HE, Allen GR, et al. (2009) Marine Ecoregions of the World: A
Bioregionalization of Coastal and Shelf Areas. BioScience 57, 573-583.
Spicer JI, Gaston KJ (1999) Physiological Diversity and its Ecological Implications Blackwell
Science.
SPSS for Windows, Release 16.0.1, (2007) Chicago, SPSS Inc.
Steiner CC, Rompler H, Boettger LM, Schoneberg T, Hoekstra HE (2009) The genetic basis of
phenotypic convergence in beach mice: Similar pigment patterns but different genes.
Molecular Biology and Evolution 26, 35-45.
94
Stephens M, Donnelly P (2003) A comparison of Bayesian methods for haplotype reconstruction
from population genotype data. American Journal of Human Genetics, 73, 1162-1169.
Stevens GC (1989) The latitudinal gradient in geographical range: How so many species coexist
in the tropics. The American Naturalist 133, 240-256.
Stevens JP (2002) Applied Multivariate Statistics for the Social Sciences Lawrence Erlbaum
Associates, Mahwah, New Jersey.
Stillman JH (2002) Causes and consequences of thermal tolerance limits in rocky intertidal
porcelain crabs, genus Petrolisthes. Integrative and Comparative Biology, 42, 790-796.
Stillman JH, Somero GN (2000) A comparative analysis of the upper thermal tolerance limits of
eastern Pacific porcelain crabs, genus Petrolisthes: Influences of latitude, vertical
zonation, acclimation, and phylogeny. Physiological and Biochemical Zoology 73, 200-
208.
Stillman JH, Tagmount A (2009) Seasonal and latitudinal acclimatization of cardiac
transcriptome responses to thermal stress in porcelain crabs, Petrolisthes cinctipes.
Molecular Ecology 18, 4206-4226.
Storey KB (2006) Genomic and proteomic approaches in comparative biochemistry and
physiology. Physiological and Biochemical Zoology 79, 324-332.
Storey K, Storey J, Churchill T (2007) Freezing and anoxia tolerance of slugs: a metabolic
perspective. Journal of Comparative Physiology B: Biochemical, Systemic, and
Environmental Physiology 177, 833-840.
Storey KB (1999) Living in the cold: Freeze-induced gene responses in freeze-tolerant
vertebrates. Clinical and Experimental Pharmacology and Physiology 26, 57-63.
Strathdee AT, Bale JS (1998) Life on the edge: Insect ecology in arctic environments. Annual
Review of Entomology, 43, 85-106.
Stuart RJ, Pippa M, Michael TB, et al. (2008) Comparative ecology of north Atlantic shores: Do
differences in players matter for process? Ecology, 89, S3-S23.
Spicer JI, Gaston KJ (1999) Physiological Diversity and its Ecological Implications Blackwell
Science.
Swanson WJ, Zhang ZH, Wolfner MF, Aquadro CF (2001) Positive Darwinian selection drives
the evolution of several female reproductive proteins in mammals. Proceedings of the
National Academy of Sciences of the United States of America 98, 2509-2514.
Swearer SE, Shima JS, Hellberg ME, et al. (2002) Evidence of self-recruitment in demersal
marine populations. Bulletin of Marine Science, 70, S251-S271.

95
Swofford DL (2003) PAUP. In: Phylogenetic Analysis Using Parsimony (*and Other Methods).
Sinauer Associates, Sunderland, Massachusetts.
Tamura K, Dudley J, Nei M, Kumar S (2007) Mega4: Molecular evolutionary genetic analysis
(MEGA) software version 4.0. Molecular Biology and Evolution, 42, 1596-1599.
ter Braak CJF (1995) Canoco for Windows 4.5 and CanoDraw for Windows 4.12,
Microcomputer Power, Ithaca, NY, U.S.A.
Thieler ER, Hammar-Klose ES (1999) National assessment of coastal vulnerability to future sea-
level rise: Preliminary results for the U.S. Atlantic coast (ed. Survey USG), p. 1.
Thieler ER, Hammar-Klose ES (2000) National assessment of coastal vulnerability to future sea-
level rise: Preliminary results for the U.S. Gulf of Mexico coast (ed. Survey USG), p. 1.
Thomaz D, Guiller A, Clarke B (1996) Extreme divergence of mitochondrial DNA within
species of pulmonate land snails. Proceedings of the Royal Society of London Series B-
Biological Sciences, 263, 363-368.
Thompson LS (1984) Comparison of the diets of the tidal marsh snail, Melampus bidentatus and
the amphipod, Orchestia grillus. Nautilus, 98, 44-53.
Tomanek L (2002) The heat-shock response: Its variation, regulation and ecological importance
in intertidal gastropods (genus Tegula). Integrative and Comparative Biology 42, 797-
807.
Tomanek L, Helmuth B (2002) Physiological ecology of rocky intertidal organisms: A synergy
of concepts. Integrative and Comparative Biology, 42, 771-775.
Tomanek L, Somero GN (2002) Interspecific- and acclimation-induced variation in levels of
heat-shock proteins 70 (hsp70) and 90 (hsp90) and heat-shock transcription factor-1
(HSF1) in congeneric marine snails (genus Tegula): Implications for regulation of hsp
gene expression. Journal of Experimental Biology 205, 677-685.
Van Riel P, Jordaens K, Van Houtte N, et al. (2005) Molecular systematics of the endemic
Leptaxini (Gastropoda : Pulmonata) on the Azores islands. Molecular Phylogenetics and
Evolution, 37, 132-143.
Vermeij GJ (2005) From Europe to America: Pliocene to recent trans-Atlantic expansion of cold-
water North Atlantic molluscs. Proceedings of the Royal Society B-Biological Sciences,
272, 2545-2550.
Vernberg FJ, Tashian RE (1959) Studies on the physiological variation between tropical and
temperate zone fiddler crabs of the genus UCA I. Thermal Death Limits. Ecology 40,
589-593.

96
Vieites DR, Nieto-Roman S, Wake DB (2009) Reconstruction of the climate envelopes of
salamanders and their evolution through time. Proceedings of the National Academy of
Sciences of the United States of America 106, 19715-19722.
Vince S, Valiela I, Backus N, Teal JM (1976) Predation by salt-marsh killifish Fundulus
heteroclitus (L) in relation to prey size and habitat structure: Consequences for prey
distribution and abundance. Journal of Experimental Marine Biology and Ecology, 23,
255-266.
Vonlanthen P, Roy D, Hudson AG, et al. (2009) Divergence along a steep ecological gradient in
lake whitefish (Coregonus sp.). Journal of Evolutionary Biology, 22, 498-514.
Wang HS, Wang XH, Zhou CS, et al. (2007) cDNA cloning of heat shock proteins and their
expression in the two phases of the migratory locust. Insect Molecular Biology 16, 207-
219.
Wares JP (2002) Community genetics in the Northwestern Atlantic intertidal. Molecular
Ecology, 11, 1131-1144.
Wares JP, Cunningham CW (2001) Phylogeography and historical ecology of the North Atlantic
intertidal. Evolution, 55, 2455-2469.
Warren DL, Glor RE, Turelli M (2008) Environmental niche equivalency versus conservatism:
Quantitative approaches to niche evolution. Evolution, 62, 2868-2883.
Wethey DS (2002) Biogeography, competition, and microclimate: The barnacle Chthamalus
fragilis in New England. Integrative and Comparative Biology, 42, 872-880.
Whitehead A, Crawford DL (2006) Neutral and adaptive variation in gene expression.
Proceedings of the National Academy of Sciences of the United States of America 103,
5425-5430.
Whittaker JB, Tribe NP (1996) An altitudinal transect as an indicator of responses of a spittlebug
(Auchenorrhyncha: Cercopidae) to climate change. European Journal of Entomology,
93, 319-324.
Wiens JJ (2007) Global patterns of diversification and species richness in amphibians. The
American Naturalist 170, S86- S106.
Wiens JJ, Donoghue MJ (2004) Historical biogeography, ecology and species richness. Trends in
Ecology & Evolution 19, 639-644.
Wiens JJ, Graham CH (2005) Niche conservatism: Integrating evolution, ecology, and
conservation biology. Annual Review of Ecology Evolution and Systematics 36, 519-539.
Wiens JJ, Graham CH, Moen DS, Smith SA, Reeder TW (2006) Evolutionary and ecological
causes of the latitudinal diversity gradient in hylid frogs: Treefrog trees unearth the roots
of high tropical diversity. American Naturalist 168, 579-596.

97
Wiens JJ, Parra-Olea G, Garcia-Paris M, Wake DB (2007) Phylogenetic history underlies
elevational biodiversity patterns in tropical salamanders. Proceedings of the Royal
Society B-Biological Sciences 274, 919-928.
Wiens JJ, Sukumaran J, Pyron RA, Brown RM (2009) Evolutionary and biogeographic origins of
high tropical diversity in old world frogs (Ranidae). Evolution 63, 1217-1231.
Wilding CS, Mill PJ, Grahame J (1999) Partial sequence of the mitochondrial genome of
Littorina saxatilis: Relevance to gastropod phylogenetics. Journal of Molecular
Evolution 48, 348-359.
Wu Q, Sugimoto K, Moriyama K, et al. (2002) Cloning of hibernation-related genes of bullfrog
(Rana catesbeiana) by cDNA subtraction. Comparative Biochemistry and Physiology B-
Biochemistry & Molecular Biology 133, 85-94.
Zachariassen KE, Kristiansen E (2000) Ice nucleation and antinucleation in nature. Cryobiology
41, 257-279.
Zwickl DJ (2006) Genetic algorithm approaches for the phylogenetic analysis of large
biological sequence datasets under the maximum likelihood criterion. Ph.D. dissertation.

98
APPENDIX A: COLLECTION LOCALES FOR ECOLOGICAL NICHE MODELING
AND IDENTIFICATION OF CRYPTIC SPECIES
Appendix A: All collections and species identified at that locale. Locales with a ‘*’ were not included in ecological
niche modeling. Individuals that have been identified but were not used to infer population structure were identified
based on sequences between 200 and 440 bp.
Collection Locale
Collection Date
Latitude
Longitude
N (included in
population
structure)
Species
New River, New Richmond
Quebec*
5/13/1965 48.58 -68.78 4 (4) North
Cape Brenton Island, Nova Scotia* 12/10/2006 46.25 -60.58 3 (3) North
Bath, ME 6/21/2006 43.87 -69.91 7 (6) North
Cousins Island, ME 6/21/2006 43.75 -70.14 9 (8) North
Newbury, MA 6/7/2005 42.74 -70.85 7 (5) North
Mayo Beach, MA 6/22/2006 41.93 -70.07 9 (8) North
West Dennis, MA 6/22/2006 41.66 -70.07 8 (8) North
West Falmouth, MA 6/8/2005 41.60 -70.65 11 (10) North
Conanicut Island, RI 6/12/2007 41.49 -71.39 8 (5) North
New London, CT 6/13/2007 41.39 -72.10 7 (5) North
BeeBe Cove, CT 6/13/2007 41.33 -71.99 5 (4) North
Hammonasset, CT 6/19/2006 41.27 -72.66 10 (7) North
Lordship, CT 6/9/2005 41.16 -73.11 8 (8) North
Orient, NY 6/14/2007 41.14 -72.38 7 (6) North
Bridgeport, CT 6/19/2006 41.14 -73.29 6 (5) North
Whitestone, NY 6/10/2005 40.77 -73.75 9 (9) North
Brunswick, NJ 6/11/2005 40.46 -74.25 9 (9) North
Pt. Pleasant, NJ 6/17/2007 40.07 -74.04 8 (7) North
Ocean City, NJ 6/17/2007 39.30 -74.59 10 (0) North
Plum Island, DE 6/18/2007 38.81 -75.19 5 (0) North
Indian River, DE 6/11/2005 38.61 -75.07 14 (14) North
Holt's Landing, DE 6/18/2007 38.59 -75.13 3 (3) North
Cambridge, MD 6/19/2007 38.57 -76.07 1 (1) South
Ragged Point, MD 6/19/2007 38.55 -76.27 6 (5) South
Fenwick Island, DE 6/20/2007 38.46 -75.08 7 (7) North
7 (7) South
North &
South
Ocean City, MD 6/20/2007 38.40 -75.06 9 (0) North
N. of Crisfield, MD 6/20/2007 38.01 -75.85 4 (0) South
Crisfield, MD 6/12/2005 37.99 -75.86 11 (10) South
Chincoteague, VA 6/20/2007 37.94 -75.37 9 (2) North
1 (0) South
North &
South
Wallops Island, VA 6/20/2007 37.94 -75.41 5 (5) North
Oyster, VA 6/12/2005 37.29 -75.92 9 (9) North
Cape Charles, VA 6/21/2007 37.28 -76.02 2 (2) North
3 (3) South
North &
South
Williamsburg, VA 4/9/2005 37.27 -76.58 13 (11) North
45 (30) South
North &
South
Hayes, VA 6/21/2007 37.27 -76.40 1 (1) North
1 (1) South
North &
South
Smithfield, VA 5/24/2007 37.01 -76.60 1 (0) South
Roanoke Island, NC 6/22/2007 35.89 -75.64 4 (0) South
Pea Island, NC 6/22/2007 35.68 -75.48 3 (2) South
Bellhaven, NC 6/23/2007 35.54 -76.62 2 (2) South

99
Near Hatteras, NC 6/22/2007 35.22 -75.66 7 (5) South
South River, NC 6/15/2005 34.95 -76.59 8 (8) South
Morehead City, NC 6/24/2007 34.73 -76.73 9 (0) North
1 (0) South
North &
South
Beaufort, NC 6/13/2005 34.72 -76.68 11 (9) North
Harkers Island , NC 6/24/2007 34.71 -76.58 9 (1) South
Wilmington, NC 8/4/2008 34.24 -77.95 10 (0) North
Carolina Beach, NC 8/7/2008 34.00 -77.89 9 (0) North
Oak Island Bridge, NC 5/21/2007 33.73 -78.07 10 (1) North
Myrtle Beach, SC 8/4/2008 33.68 -78.89 9 (0) North
Georgetown, SC 8/4/2008 33.37 -79.26 5 (0) North
McClellanville, SC 8/4/2008 32.94 -79.66 7 (0) North
Near Savannah, GA 8/5/2008 32.79 -80.14 8 (8) North
Downtown Charleston, SC 8/5/2008 32.78 -79.95 6 (0) North
Grice Marine Lab, SC 6/17/2005 32.75 -79.90 21 (19) North
N. of Savannah, GA 8/5/2008 32.60 -80.76 10 (9) North
Savannah, GA 8/5/2008 32.02 -81.00 8 (8) North
Brunswick, GA 8/5/2008 31.18 -81.39 8 (7) North
Amelia Island, FL 8/5/2008 30.67 -81.44 10 (10) North
Jacksonville, FL 8/6/2008 30.41 -81.58 9 (9) North
Dauphin Island, AL 4/11/2005 30.26 -88.12 9 (9) South
Sabine, LA 5/2/2005 29.90 -93.37 5 (5) South
Grand Isle, LA 2/15/2005 29.26 -89.95 5 (4) South
LUMCON, LA 11/12/2006 29.25 -90.66 12 (6) South
Port Fourchon, LA 2/18/2005 29.11 -89.95 4 (4) South
Cape Canaveral, FL 8/6/2008 28.64 -80.78 16 (15) South
Clearwater, FL 12/14/2005 27.86 -82.85 2 (2) South
1 (0) M .coffeus
South &
M. coffeus
Naples, FL* 8/8/2008 27.49 -82.70 10 (9) M. coffeus
Sarasota, FL* 8/9/2008 27.33 -82.54 8 (5) M. coffeus
Sanibel Island, FL* 8/8/2008 26.49 -82.01 8 (3) M. coffeus
Miami, FL* 8/8/2008 26.33 -81.84 10 (10) M. coffeus
Bonita Beach, FL 8/8/2008 26.33 -81.84 2 (2) South
7 (4) M. coffeus
South &
M. coffeus
South Padre Island, TX* 5/16/2006 26.14 -97.18 10 (10) Gulf
Key Biscayne, FL* 7/21/2005 25.68 -80.17 1 (1) Gulf
1 (1) M. coffeus
Gulf &
M. coffeus
Sugarloaf Key, FL* 7/20/2005 24.65 -81.57 3 (3) Gulf Gulf
Key Largo, FL* 7/19/2005 25.02 -80.50 9 (9) Gulf
1 (1) M. coffeus
Gulf &
M. coffeus
Holmes Beach, FL 8/9/2008 27.49 -82.70 1 (1) South
8 (8) M. coffeus
South &
M. coffeus
La Parguera, Puerto Rico* 7/2008 17.97 -67.05 11 (10) M. coffeus
St. Joris Bay, Curacao* 7/1/2005 12.12 -68.82 2 (2) M. coffeus
Bocas del Drago, Panama* 1/2005 9.38 -81.30 3 (1) M. coffeus

100
APPENDIX B: PRINCIPAL COMPONENT MATRIX
Appendix B: Principal component matrix produced using a varimax rotation
and Kaiser normalization. This shows the correlation among each value and
that principal component.
Component
Variable 1 2 3 4 5 6
tminmay .987 .096 .014 -.059 -.004 -.035
bio1 .986 .148 -.064 -.008 .027 .006
bio10 .984 .039 -.022 .051 -.099 -.105
tminjune .983 .079 .025 -.058 -.066 -.085
tmaxsept .983 .091 -.057 .110 -.034 -.045
tminapril .981 .131 .005 -.080 .048 .019
tminsept .978 .137 -.025 -.138 -.018 -.028
tmaxapril .978 .116 -.081 .141 -.006 -.018
tmaxoct .976 .172 -.085 .069 .043 .017
tmaxmarch .975 .166 -.087 .099 .031 .007
sstjulysept .972 .100 .017 .023 -.079 -.106
tminmarch .972 .162 -.052 -.092 .089 .041
tminfeb .971 .166 -.079 -.110 .073 .036
tminaug .971 .094 .024 -.107 -.110 -.113
tmaxmay .970 .071 -.082 .189 -.025 -.044
bio11 .969 .199 -.092 -.045 .079 .047
tmaxnov .968 .211 -.094 .052 .054 .028
tminjan .966 .167 -.091 -.131 .079 .054
bio6 .966 .167 -.091 -.131 .079 .054
tmaxfeb .966 .218 -.093 .056 .063 .033
tmaxaug .966 .016 -.048 .185 -.108 -.083
tminjuly .963 .068 .021 -.081 -.134 -.156
tmaxdec .963 .227 -.091 .014 .082 .042
tmaxjune .962 -.009 -.061 .202 -.075 -.093
tmaxjan .960 .231 -.104 .028 .087 .053
tmindec .958 .167 -.083 -.170 .089 .069
tminoct .955 .174 -.090 -.191 .061 .068
bio5 .943 -.030 -.078 .220 -.135 -.125
tmaxjuly .942 -.030 -.076 .221 -.137 -.129
tminnov .942 .190 -.087 -.196 .105 .111
sstapriljune .940 .292 .070 .038 .011 -.010
precjuly .904 .304 .084 .220 -.014 .072
sstoctdec .902 .397 .061 .053 -.010 .035
bio18 .898 .369 -.015 .172 .045 .105
bio4 -.888 -.306 .143 .103 -.215 -.166
precaug .887 .393 -.019 .085 .069 -.017
biojuly -.863 -.263 .088 .321 -.194 -.152
sstjanmarch .862 .455 .071 .114 .028 .026
bio8 .847 -.106 -.087 .046 -.242 -.298
precsept .835 .378 .014 .092 .140 .292
precjune .812 .380 -.137 .226 .092 .272
bio13 .810 .481 -.003 .163 .208 .110
bio16 .808 .463 .044 .164 .179 .221
bio3 .807 .268 -.289 .321 .171 .151
bio15 .736 .415 -.414 .155 .225 .141
precapril -.673 -.069 .625 -.080 .008 .135
bio12 .651 .393 .569 .110 .099 .262
springsal .123 .985 -.024 -.030 .051 .027
maysal .119 .983 -.001 -.041 .052 .055
aprilsal .117 .982 -.005 -.038 .013 .053

101
annualsal .183 .979 -.010 .002 .039 .049
marchsal .169 .978 -.010 -.014 .018 .019
decsal .165 .974 .082 .000 .019 .027
sumsal .186 .974 -.067 .016 .018 .015
junesal .146 .970 -.050 .018 .067 -.011
augsal .162 .970 -.089 .029 -.017 .027
wintersal .200 .969 -.010 .034 .023 .028
julysal .155 .968 -.097 .047 .011 -.020
jansal .185 .964 .040 .019 .013 .079
septsal .250 .960 .002 .014 .030 .058
fallsal .242 .953 .102 -.009 .061 -.008
febsal .236 .948 .004 .065 .052 .039
novsal .238 .947 .117 -.009 .076 -.041
octsal .317 .917 .146 .019 .113 .008
tide -.304 .444 -.194 .308 -.151 .126
bio19 -.094 .073 .972 -.062 .101 .040
precjan .040 .101 .947 -.024 -.064 -.026
bio17 -.131 -.095 .944 -.091 -.160 -.021
precfeb .193 .150 .885 -.049 .209 -.020
precdec -.391 -.019 .866 -.091 .155 .131
bio14 -.443 -.248 .776 -.074 -.184 -.044
precmay .256 .003 .765 .236 -.238 .333
precmarch -.113 -.040 .756 .014 .086 -.463
precnov -.617 .002 .652 -.154 .135 .341
bio2 .153 .057 -.194 .936 -.054 -.074
bio9 .044 .256 .045 -.071 .870 -.021
precoct -.117 .416 .365 -.139 -.031 .601

102
APPENDIX C: SEASONALLY UP-REGULATED TRANSCRIPTS Appendix C.1: Winter expression levels based
aligned to GS De Novo Aligner. Highlighted
contigs were considered up-regulated in this
season only. Relative expression is percent of
all EST’s that the contig composed (multiplied
by 10 for manageability).
Contig Number of
EST’s blast hits
Relative
Expression
co36972 8483 50.52
co2930 5935 48.54
co5471 2716 49.08
co519 2696 91.1
co1384 1801 67.46
co1030 1716 8.28
co10484 1697 59.81
co39852 1569 95.35
co19066 1497 75.95
co33229 1251 7.51
co36990 1112 79.05
co28077 915 32.79
co4278 824 83.62
co15581 812 96.67
co1097 787 20.46
co37270 785 89.81
co39818 717 37.38
co3585 677 95.27
co41200 613 16.31
co563 494 61.13
co25862 484 23.55
co39946 449 79.51
co39845 422 76.54
co37431 406 38.67
co14930 398 76.38
Appendix C.2: Summer expression levels based
aligned to GS De Novo Aligner. Highlighted
contigs were considered up-regulated in this
season only. Relative expression is percent of all
EST’s that the contig composed (multiplied by
10 for manageability).
Contig Number of
EST’s blast hits
Relative
Expression
co36972 7467 63.13
co2930 4520 49.31
co1384 1781 73.55
co10169 1752 88.53
co33229 1346 4.38
co37559 1327 45.89
co10484 1242 63.93
co37270 974 91.17
co39818 858 24.71
co1138 818 81.42
co170 661 30.26
co5471 655 50.69
co38053 620 94.84
co37578 535 61.87
co35038 510 97.84
co25310 464 96.12
co27842 453 96.03
co1030 427 5.85
co19066 423 87.71
co33870 416 98.08
co41160 410 0.49
co39845 400 89.5
co39712 389 57.07
co39852 384 95.57
co5175 380 61.84

103
VITA
Alice Brooke Dennis was born in 1980 in Santa Rosa, California, to Michael and
Deborah Symons. She grew up outside of Healdsburg, California, where she graduated high
school in 1998. After attending Santa Rosa Junior College, she completed her Bachelor of
Science in biology at the University of California, Davis. She worked as a research assistant for
one year at the University of North Carolina, Chapel Hill, before coming to Louisiana State
University in 2004.