the evolution of us industry & manufacturing · the evolution of us industry &...
TRANSCRIPT

The Evolution of US Industry & Manufacturing Scott C. Pender, Lehigh Class of 2009 Andrew J. Foote, Lehigh Class of 2009
Industrial & Systems Engineering Department 200 West Packer Avenue, Bethlehem, PA 18015
E-mail [email protected]
Abstract
US industries have evolved as offshore supply chains have afforded economic advantages in this new era of globalization. While some industry sectors are suffering losses, industry sectors such as Chemical and Finance have experienced revenue growth in recent years. In order to examine the recent evolution of US manufacturing, this study tracks trends for the last two decades by following the performance of Fortune 1000 companies aggregated into process-specific sectors. A forecast based upon these trends is postulated so that the United States of America may adapt as a nation and maintain an edge in the global marketplace. Overall, the analysis provides a bigger picture view of US manufacturing and how it is growing to meet changing demands that will continue to diverge from the model of 20th century production.
The decrease in big “M” manufacturing throughout the United States over the past
several decades is actually not as it seems. A substantial contribution to the seeming loss of manufacturing jobs involved a shift to other industries where individuals performing what had previously been categorized as a ‘manufacturing’ task was re-labeled as ‘service.’ Changes of this nature have appreciable impact on the classifications and data of the Bureau of Labor Statistics, these factors are explored. The impact of the current economic crisis and very definite loss of jobs is also addressed, and the impact on each industry analyzed. The trends disclosed will be compared with previously published data.
Introduction This paper is divided into two sections which address similar issues in different contexts. In the first chapter we primarily address industries across the U.S. as well as the broad scope of manufacturing globally. In the second chapter we consider Fortune 1000 companies involved in manufacturing. Much of the research for the first chapter of this project was done through the use of two primary sources. The first of the two sources was the Department of Commerce5 and the second was the Bureau of Labor Statistics4. The paper brings to life many eye-opening statistics about the current job market as well as exploring the last decade of job shifts. Attempts are made to remove the current market collapse from much of the information. A major objective is to prove that American manufacturing while shrinking is not less productive. We have seen trends and shifts through American labor throughout our growth as a country. We saw the “death” of steel throughout the country no more than twenty years ago. The country emerged from the seeming

crisis and still has the largest steel producer in the world, a company by the name of Nucor. Just because some companies are faltering does not mean others are not emerging. Industries are cyclical and manufacturing will never go away, it will merely re-invent itself so that it can compete with the pressures presented globally. In order to do that as a country, the stigma cannot be that engineering is a dying profession, but rather we need more engineers to improve lead times, quality, and safety of the product. These are the areas companies must look towards if they want a sustainable company and product. Price is no longer a viable option for Americans to compete. The presence of Unions and labor laws make it impossible for U.S. companies compete with pricing from countries like China and India. To introduce that concept, Figure 1 will show the beginning of the study. To show one of the many interesting features that the table shows is that there are less people in manufacturing with more skill. The table clearly indicated a decrease in what the government labels as manufacturing. What the tables do not indicate is the growth in the services and tech sector. Also left out is the fact that manufacturing employees though fewer are being paid 30% more than they were just ten years ago. So, we cannot necessarily take these tables to show merely the immense decline in manufacturing numbers but also the staggering increase in efficiency as well.
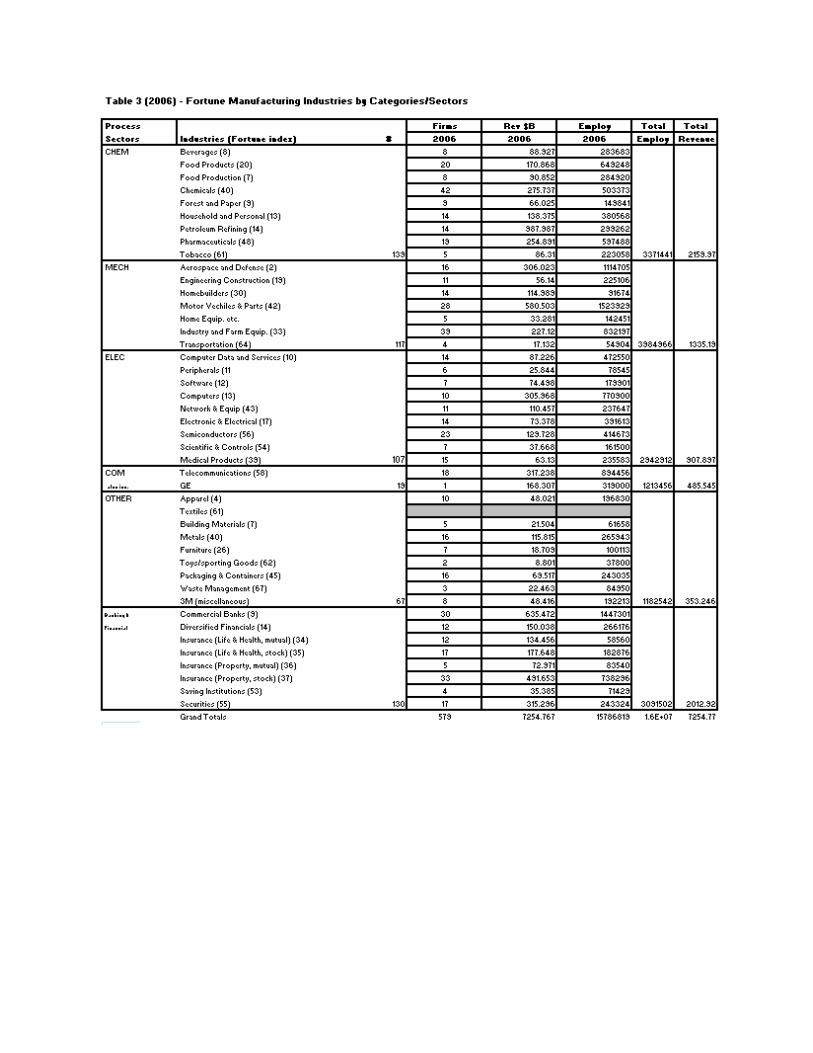
Throughout the second chapter we take a close look at how US industry has changed over the past two decades by considering Fortune 1000 industry data. Fortune data is used because it represents the nation’s largest companies that lead the way in industry revenues. By observing progression in our nation’s top companies we can predict where the rest of country is headed. Performing a logical aggregation of industries and sectors make it possible to study trends in recent years. Taking each specific industry’s revenue and employment data, then aggregating into relevant sectors allows us to compare more generalized sector results to specific industry result so we can see how industry trends affect each other and the overall average. The popular notion that US manufacturing is dying out is seriously flawed. We will consider the past, present, and future of US manufacturing industries in order to best understand how our nation’s production-focused economy has become what it is today.
Chapter 1:
Present Status
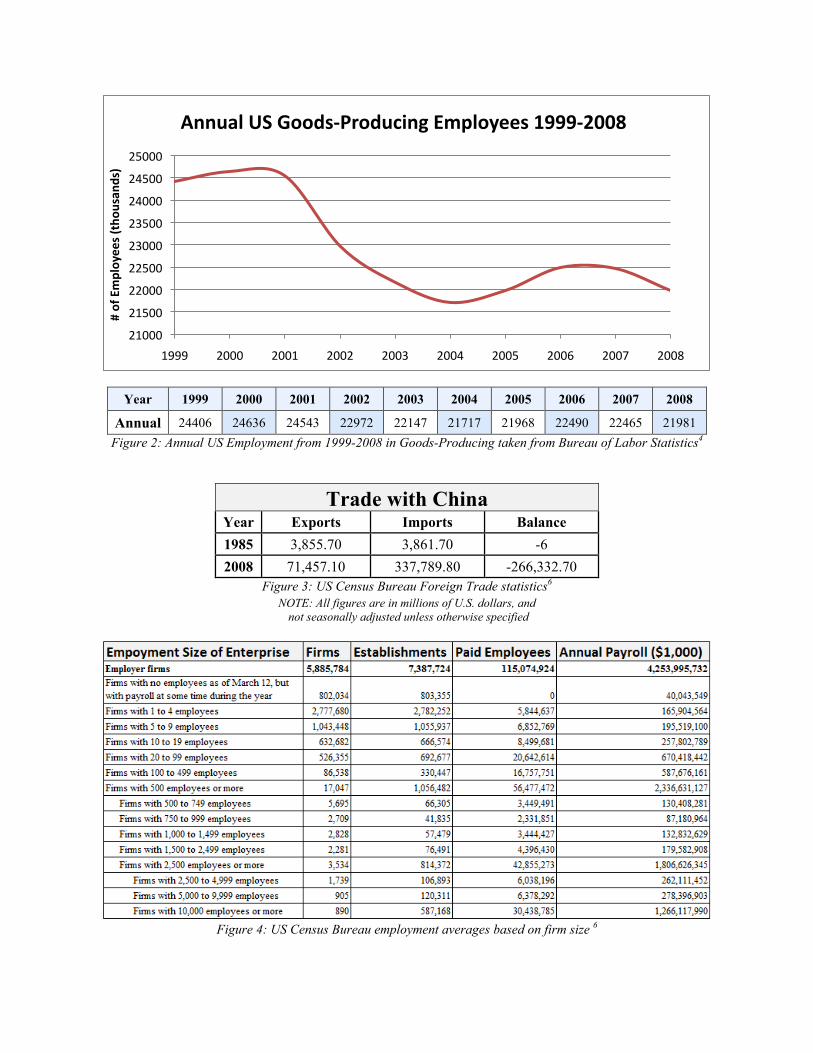
The country has seen a great shift in areas of employment over the past ten years. In most situations we see tabloids and media explanation about the death of manufacturing throughout the country. But American ads on television and an innate fear about entering the manufacturing sector is very present in our country’s media depictions of manufacturing. This is deceiving for several reasons, left out of the argument is the number of engineers, and would-be manufacturing sector employees that have gone on to work for technology and service based companies. The data in Figure 2 provides information about goods-producing employees in this country over the last decade.
This information should not come as a shock to anyone in the country. We have
outsourced at a frightening rate over the last decade and this can be seen in the trade deficit

statistics. Listed in Figure 3 are the statistics for the trade deficit with China alone. These statistics have increased every year (with the exception being from 2000 to 2001 where it fell $60 million) from 1985 to the present state. So, politicians and news stations to begin talk about the demise in United States manufacturing at this point is absurd. Labor and work have been outsourced for well over two decades. Ultimately, the fact is that outsourcing does not mean that manufacturing is finished in this country. Certainly statistics like these are alarming and should be taken note of but this has been happening for the last 25 years.
Keith Gardiner’s paper entitled “Manufacturing: The Future” 1 featured information taken
from the United States Census Bureau. It shows the employment statistics by size of company in this country. What the data in Figure 4 provides us with is the concept that large, main-stream, big name brand companies are a way of the past for the United States. They will have a presence here, but they are unlikely to do their manufacturing here. This is quite clear from the data which shows that the number of companies left in the United States with over 5000 people employed at them is down to just 1,795. More eye-opening is the fact that just two short years ago there were 913 companies with over 10,000 people and now that number has dwindled to 890. This data confirms the fact that companies have centralized their focus and “cut the fat” out of their operations.
This shift is something that can be expected with such a large amount of manufacturing
work going overseas. What the data does not indicate is that the total number employed over the past couple years has not changed drastically at all. Rather, more people are self employed or employed to smaller more efficient organizations.
Method of Approach
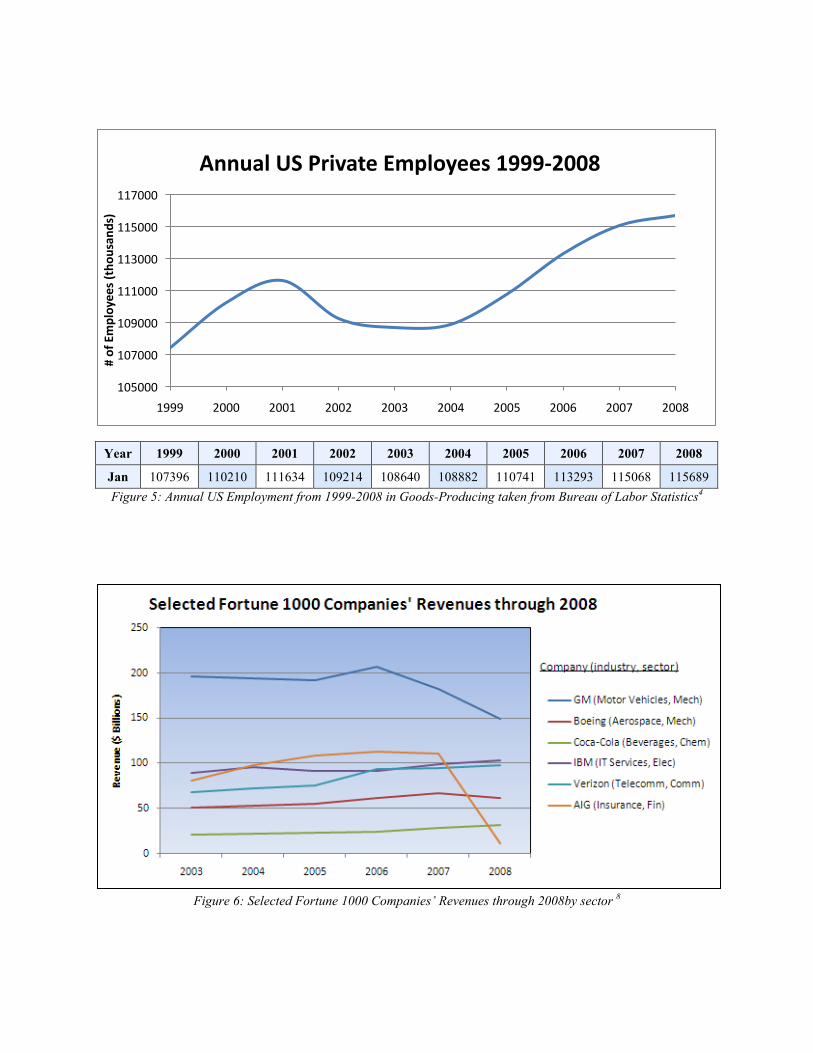
To accurately assess whether or not the United States is actually due for serious trouble by the loss of “manufacturing” jobs one of the more important things to investigate is if it has caused a decrease in the private sector of this country. The answer to that question is NO. The data in Figure 5 provides validation that in fact the country’s private sector has grown steadily over the last ten years with the exception, of course, being the recent market collapse. Still the numbers are higher than they were ten years ago.
The reason this is important and what this will prove is that “manufacturing” employees
are not lost from our workforce but rather re-distributed. Also, had these numbers faltered we would see a larger increase in government employment than we already do. To take a quote from the Bureau of Labor Statistics,
“About 37 percent of engineering jobs were found in manufacturing industries and another 28 percent were in the professional, scientific, and technical services sector, primarily in architectural, engineering, and related services. Many engineers also worked in the construction, telecommunications, and wholesale trade industries.”4
What this quote is telling us is that of the 1.5 million practicing engineers in the country in 2006 only 37 percent of them were categorized as having “manufacturing jobs.” Obviously not all of the engineers were in fact in manufacturing jobs, but the peculiar thing to note in the

quote is that the next 28% were in scientific or technical services. This is another 400,000 people that in 1999 may have been labeled by the government standards as “manufacturing” employees but now rank in the service and science fields. This information is most important because we have not seen a rapid decline in employment in the country or a massive increase in government employees. Similar to ten years ago, about fifteen to twenty percent of the employed population remains employed by the government.
If in fact the private sector was decreasing in size and the government growing rapidly
(spending not included, only actual government employees), then the decline in manufacturing numbers would prove to be devastating. But, upon finding that that there are currently 16.8% of the employed population working for the government juxtaposed to that number ten years ago of 15.75% it is not alarming enough to account for the “missing” manufacturing jobs.
The American Shift
In this section of the paper are several first-hand accounts of how American manufacturing has survived and will survive in the US. There are three major factors that will keep a company from outsourcing. The first of the three is lead times, the second is quality, and the third is reliability. Most American consumers do not want to go abroad for the product but with increasing frequency we see suppliers lose customers to a foreign supplier on what the supplier will describe as undercutting. To avoid this drastic fate the American supplier must lean on the aforementioned three tactics, competing for price alone is not feasible. A company located in Perkasie, Pennsylvania by the name of Advanced Plastix, that makes high-end custom dies for both the electronic and pharmaceutical companies and has constantly been outbid by foreign suppliers but gets repeat orders with ease because they have adopted these tactics. They work closely with the customer, customizing orders for them and ensuring their quality in a faster time than foreign nations ever could. They have been able to grow their company in both employee numbers and output per year despite the allegedly bleak outlook for the continued production of goods in this country.
Chapter 2:
Present Status Entering the year 2009, America looks to its waning manufacturing industries as a sign of impending economic doom. The country has reached a turning point where the failure in risk management across many industries has forced a necessary reaction. Coupled with outsourcing and the rise of manufacturing overseas, it has become the popular belief that US industry is headed downhill as competing nations are able to produce more efficiently. The obvious questions raised regard how true this belief really is; where the deficiencies are; and how we can improve. The first step in developing an answer to these questions is to firmly establish the present status of US industry. Fortune has not yet published data for 2008, so it is difficult to consider
all industries fairly. As an alternative, we can consider the specific changes in representative companies of interest.
Figure 6 shows a sharp decline in AIG’s revenues for 2008 after a steady growth pattern during preceding years. This drop reflects the decline present among all of the top companies in the financial sector. While this is probably the most devastating loss in any industry in recent years, it is important to note that performance in the finance sector is dependent upon performance throughout all US industries. In reality, performance is not the true issue as much as perceived performance. To illustrate, we can begin considering manufacturing industries by noting GM’s performance since 2006. GM has faced large setbacks due to rising oil prices, increased cost of labor, and a lack of innovation relative to consumer needs. As a result of initial losses, investors lose faith and the company loses financial backing. As the corporation proceeds downhill, their name becomes tarnished as unreliable, and consumers begin to buy from other manufacturers. Here we see a combination of several measures of consumer perception dictating the future of an industry.
On the other hand, we can see Communication, Chemical, and Electronics industries on
the rise as a result of unique products and innovation. It is within these sectors that the US is able to produce goods that set the country apart from the rest of the world. In the following sections past trends are considered and forecasts made for the future.
Immediate Past The revenue and employment trends over the past ten years indicated in two charts in Figure 7 & Figure 8 where manufacturing industries are grouped by sector with the Finance sector present as a means of comparison within purely service industries. Referring to Table 3 (2005-2007) in the appendix we can see the specific industries within each sector that are leading growth.
We begin by looking at Electronics and Communications industries, noting that Telecommunications and Computer industries have led both revenue and employment over the past few years until 2007 when Computer and Data Services have taken the lead in employment. The rise and fall of the sector in 2000 reflects the dot-com bubble which affected many industries, including those outside this sector. The resilience of this sector that has led to significant growth despite setbacks indicates reliability for investors and a desirable focus for the future of US industry.
The mechanical sector shows relatively steady employment and revenue growth through
2004, reaching a plateau thereafter. Motor Vehicles and Parts have lead the sector with the largest revenue and employment counts, followed by Aerospace and Defense, then Industry and Farm Equipment. The Automotive industry presents itself here as the dominant industry not only in the Mechanical sector, but also across all manufacturing industries. As the Automotive industry accounted for 7.3% of manufacturing revenue and 11% of manufacturing employment in 2007, it is considered the indicator of US manufacturing health. It is important to note that the Mechanical sector is relatively healthy, showing steady growth, outside of the Automotive industry.

Over the past five years the Chemical and Finance sectors have climbed to the top
segments of revenue for the US while seeing very little increase in employment. Commercial Banks have led the Finance sector with 58.9% growth in revenues since 2004. The Chemical sector is led by the Petroleum Refining industry with growth in revenues of 45.8% since 2004. Petroleum Refining reflected 46.4% of revenue in the Chemical sector and 19% of total manufacturing revenue in 2007. There are two key industries with promising futures as they lead US industry as of 2007.
Manufacturing Evolves In the past twenty years manufacturing has changed drastically, previously comprising a majority of revenue within the US. Manufacturing is tending away from the image of a skilled craftsman creating a unique product, toward assembly lines and increasingly efficient mass production. As the world has increased capacity for goods produced, manufacturing industries have answered the call by creating ways to produce at higher volume and lower cost. In general, this means either more capacity is produced without layoffs, or the same capacity is produced and employees lose their jobs as a cost-cutting measure. Looking at the graph of Fortune 1000 company employment in manufacturing sectors from 1996-2007 in Figure 9, we can note that the largest manufacturers (i.e., those on the Fortune 1000 list) saw growth in employment from 2003-2007, among other years. However, employment statistics can be deceptive if we consider that a decrease in employment from year to year could mean improved efficiency, not necessarily indicating a decline in profitability. While a downward trend here can be perceived in a variety of ways, an upward trend is an unquestionable indicator of growth. Taking into account the periods of growth in the past ten years we can see that 55% of the past decade (1996-2007) included periods of growth in manufacturing industries, ultimately resulting in an 8% increase in employment in the long run. At least as far as the nation’s top companies go, manufacturing is far from dying, but could use some stimulation to keep it from falling under.
The Way of the Future As US manufacturing and even further, global manufacturing, evolves we can see some of the nation’s largest companies finding ways to increase profits despite economic hardships. The nation’s economy depends greatly on the most profitable and significant industries. As we see the Automotive industry, among others, becoming less dependable we must look to produce in areas where no other country can truly compete. For Auto Manufacturers this means revolutionizing the US auto industry to provide unique products, such as electric cars, which puts them into a less-crowded segment in the global marketplace. It is with innovation and continual improvement that US companies can expect to see improvement. High-tech industries, including software services and engineering and tech services, gained about 77,000 jobs in 2008, despite losses of 38,000 jobs in the fourth quarter of the year. We can expect to see continued improvement over the next few years in technology and engineering fields as a result of continual improvement which affects profitability within the sector as well as productivity across all of US industry. Many companies, such as IBM and GE, are looking to service and financing as sources of additional revenue. Consulting services such as those provided by IBM will be
useful in reacting to economic instability by finding ways for US manufacturers to re-gain an advantage over foreign competitors. The Chemical sector shows steady growth and should continue to improve over time as it embraces essential needs for a growing population including oil, pharmaceuticals, and household products. Specifically, US Petroleum refining exemplifies an industry that has a competitive advantage over its global competitors, having the ability to produce at much lower cost.
Conclusion Much of the research of this paper indicates that the manufacturing sector is not dying but changing. Companies are becoming more efficient with faster lead times and higher quality production. While employee numbers are down in manufacturing industries, technology and service firm numbers are increasing. Many technology and service firms have merely changed labels from “manufacturing” but have not actually altered operations. The most productive companies in the US can complete globally with faster delivery and custom orders among other factors that are too costly and time consuming for manufacturers in China and other international competitors. The US will not be able to win in a battle of mass production to lower costs, but has found its niche in customization and quality. By utilizing these advantages over the competition, US manufacturing will be able to not just survive, but excel in coming years.
Bibliography
1. Gardiner, K. M., portions of this paper were originally delivered as an after dinner speech to the Second Manufacturing Education Forum: Moving Forward – “Globalization – A Vision of a New World,” Farmingdale State College (SUNY), Nov. 14, 2008, accessible via <http://www.merconline.net/wiki/index.php?title=Farmingdale_Forum_Program>.
2. Fortune 1000 industry revenues and employment data taken from Fortune.com.
3. COLA taken from Social Security Administration. <http://www.ssa.gov/OACT/COLA/colaseries.html>.
4. Quote and other data from Bureau of Labor Statistics from < http://www.bls.gov/oco/ocos027.htm>.
5. Department of Commerce data from < http://www.commerce.gov/>.
6. US Census Bureau: foreign trade statistics from <http://www.census.gov/foreign-trade/balance/c5700.html#2008>.
7. Trade Group: US tech industry gained jobs in 2008. The Industry Standard. 3.30.2009. <http://www.thestandard.com/news/2009/03/30/trade-group-us-tech-industry-gained-jobs-2008>.
8. Revenue statistics for companies in 2008 taken from sec.gov financial filings.

Appendix
Figure 1: Annual US Employment from 1999-2008 in Manufacturing taken from Bureau of Labor Statistics Figure 2: Annual US Employment from 1999-2008 in Goods-Producing taken from Bureau of Labor Statistics Figure 3: US Census Bureau Foreign Trade statistics Figure 4: US Census Bureau employment averages based on firm size Figure 5: Annual US Employment from 1999-2008 in Goods-Producing taken from Bureau of Labor Statistics Figure 6: Selected Fortune 1000 Companies’ Revenues through 2008by sector Figure 7: Fortune 1000 companies’ COLA adjusted revenues for 1996-2007 by sector Figure 8: Fortune 1000 employment for 1996-2007 by sector Figure 9: Fortune 1000 manufacturing employment for 1996-2007 Table 1: Top Fortune Global 500 co. ranked by 2004 revenue and then by industry sector comparing recent years Table 2: Aggregated Fortune 1000 Employment data by Industry Sector – 1996 – 2004 Table 3 (2005): Fortune Manufacturing Industries by Categories/Sectors for 2005 Table 3 (2006): Fortune Manufacturing Industries by Categories/Sectors for 2006 Table 3 (2007): Fortune Manufacturing Industries by Categories/Sectors for 2007
Figures
Year 1999 2000 2001 2002 2003 2004 2005 2006 2007 2008 Annual 17322 17263 16441 15259 14510 14315 14226 14155 13879 13431
Figure 1: Annual US Employment from 1999-2008 in Manufacturing taken from Bureau of Labor Statistics4
12000
13000
14000
15000
16000
17000
18000
1999 2000 2001 2002 2003 2004 2005 2006 2007 2008
#ofEmployees(tho
usan
ds)
AnnualUSManufacturingEmployees1999‐2008
Year 1999 2000 2001 2002 2003 2004 2005 2006 2007 2008
Annual 24406 24636 24543 22972 22147 21717 21968 22490 22465 21981 Figure 2: Annual US Employment from 1999-2008 in Goods-Producing taken from Bureau of Labor Statistics4
Trade with China Year Exports Imports Balance 1985 3,855.70 3,861.70 -6 2008 71,457.10 337,789.80 -266,332.70
Figure 3: US Census Bureau Foreign Trade statistics6 NOTE: All figures are in millions of U.S. dollars, and
not seasonally adjusted unless otherwise specified
Figure 4: US Census Bureau employment averages based on firm size 6
21000
21500
22000
22500
23000
23500
24000
24500
25000
1999 2000 2001 2002 2003 2004 2005 2006 2007 2008
#ofEmployees(tho
usan
ds)
AnnualUSGoods‐ProducingEmployees1999‐2008
Year 1999 2000 2001 2002 2003 2004 2005 2006 2007 2008
Jan 107396 110210 111634 109214 108640 108882 110741 113293 115068 115689 Figure 5: Annual US Employment from 1999-2008 in Goods-Producing taken from Bureau of Labor Statistics4
Figure 6: Selected Fortune 1000 Companies’ Revenues through 2008by sector 8
105000
107000
109000
111000
113000
115000
117000
1999 2000 2001 2002 2003 2004 2005 2006 2007 2008
#ofEmployees(tho
usan
ds)
AnnualUSPrivateEmployees1999‐2008

Figure 7: Fortune 1000 companies’ COLA adjusted revenues for 1996-2007 by sector 2,3
Figure 8: Fortune 1000 employment for 1996-2007 by sector 2
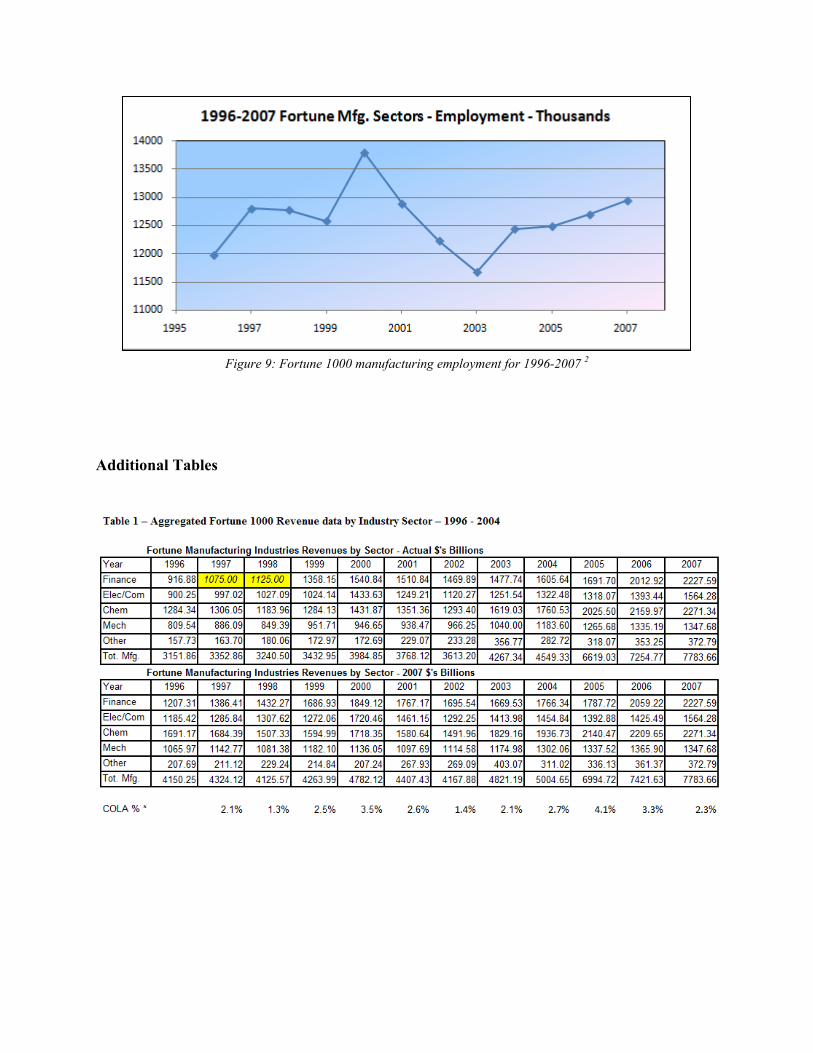
Figure 9: Fortune 1000 manufacturing employment for 1996-2007 2
Additional Tables