the executive budget recommendation - ospb.state.az.us budget presentation.pdf · additional it...
TRANSCRIPT
FY 2012 through FY 2014
1
The Executive BudgetRecommendation
FY 2013 Executive Recommendation
• Economy/Revenues• Budget Principles• Budget Summary• The Plan
– Good Government– Public Safety– Education– Health & Welfare– Medicaid– Other
• Where We End Up• Risks
2
The Economy/Revenues
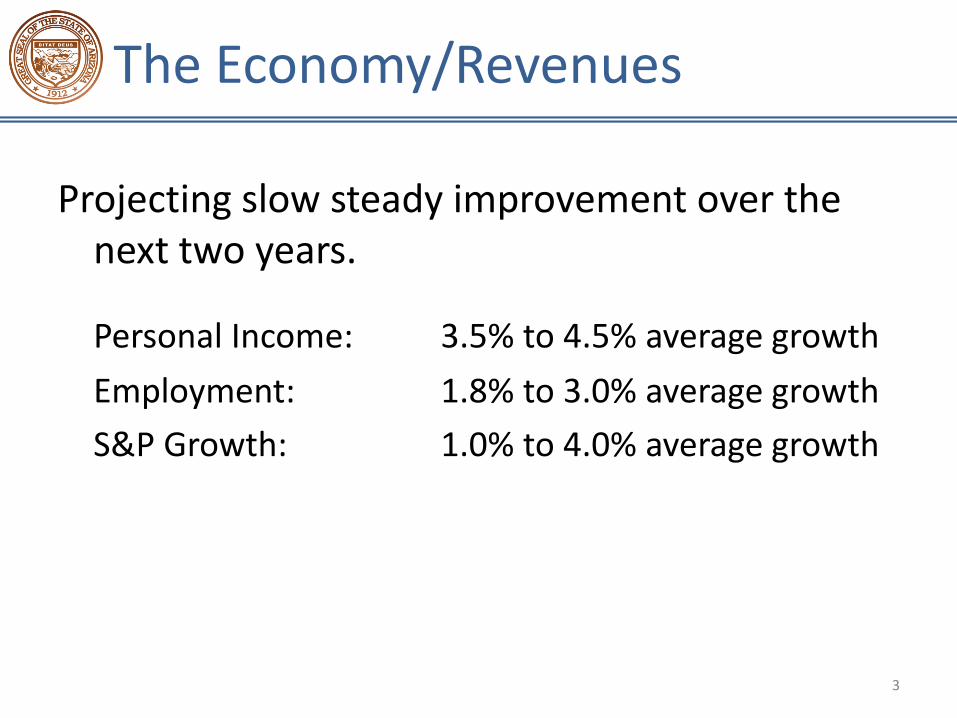
Projecting slow steady improvement over the next two years.
Personal Income: 3.5% to 4.5% average growth
Employment: 1.8% to 3.0% average growth
S&P Growth: 1.0% to 4.0% average growth
3

The Economy/Revenues
Base Revenue Forecast• Develop optimistic, baseline, and pessimistic.
• Assume below baseline for both FY 2011 and FY 2012.
FY 2012 – 4.3% above FY 2011 actual
FY 2013 – 5.9% above FY 2012 projected
FY 2014 – 6.1% above the FY 2013 projected
All numbers exclude the impact from revenue sharing and the temporary sales tax.
4

Total Revenues
5
$8,909.8 $9,159.2
$8,664.1
$0.0
$1,000.0
$2,000.0
$3,000.0
$4,000.0
$5,000.0
$6,000.0
$7,000.0
$8,000.0
$9,000.0
$10,000.0
FY 2012 FY 2013 FY 2014
Total State Revenues
Note:
• Revenues are between FY 2006 & FY 2007 levels
• Total revenue amounts include impacts from expiration of Proposition 100 and phase in of existing tax reforms

Baseline Budget Picture
6
$0
$1,000
$2,000
$3,000
$4,000
$5,000
$6,000
$7,000
$8,000
$9,000
$10,000
$11,000
2002 2003 2004 2005 2006 2007 2008 2009 2010 2011 2012 2013 2014
$ in
Mill
ion
s
General Fund Ongoing Expenditures and Revenues
On-going Revenues Total Expenditures

The Budget: Principles
• Short-term decisions must be evaluated in light of their impact on the State’s long-term fiscal health.
• Funding for a program will not be restored simply because funding has been provided in the past.
• Spending decisions must respect the wishes of citizens who, in voting for Proposition 100, recognized the importance of funding for education, health care and public safety.
• Temporary resources will be used to improve the State’s long-term position.
7

The Budget: Summary
FY 2012Debt Reduction $ 106.0
SFB Building Renewal $ 100.0
Midnight Reversion $ 41.0
IT Phase I $ 10.0
State Hospital $ 2.5
AG Tobacco $ 1.4
Total $260.9
8
Debt Reduction41%
SFB Building Renewal
38%
Midnight Reversion
Retirement16%
AFIS Replacement
Down Payment4%
State Hospital1%
AG0%

The Budget: Summary
FY 2013One-Time $ 253.3
Good Government $ 38.9
Rollover Reduction $ 100.0
Public Safety $ 17.5
Education $ 170.6
Health and Welfare $ 77.2
Natural Resources $ 14.4
Total $671.9
9
One-Time38%
Good Government
6%Public Safety3%
Education25%
Rollover Reduction
15%
Health and Welfare
11%
Natural Resources
2%

Total Spending
FY 2012 FY 2013 FY 2014
On-going Spending $8,185,547.6 $8,710,238.6 $8,917,418.2
One-time Spending $335,439.0 $253,063.1 $5,115.5
Total Spending $8,520,986.6 $8,963,301.7 $8,922,533.7
Percentage Change 2.6% 5.2% -0.5%
10
• Spending levels for FY 2012- FY 2014 are between FY 2006 and FY 2007 expenditure levels
• FY 2014 expenditures assume the implementation of federal healthcare reform

The Plan
• Good Government
• Public Safety
• Education
• Health and Welfare
• Medicaid
• Other
11

Personnel Reform
The State’s current personnel system is inefficient and makes it difficult to discipline employees or reward top performers. Also a large percentage of the State’s workforce is nearing retirement.
Recommendation:• Consolidate the nine Personnel Systems• Transition to at-will workforce• Improve workforce management• Restructure grievance and appeal system • Update human resource practices
12
GOVERNOR’S
CORNERSTONES
3#

Employee Pay Increase
In conjunction with personnel reform, the Executive recommends a 5% pay increase for eligible employees:– Uncovered non-university employees
– Employees uncovered by personnel reform
– Employees who voluntarily elect to become uncovered under personnel reform
– Employees required to remain covered by personnel reform (e.g. full authority peace officers)
13
GOVERNOR’S
CORNERSTONES
3#

Employee Pay Increase
General Fund Cost $53.7 millionHITF Rate Reduction and Fund Transfer ($48.6 million)
Vehicle License Tax Transfer Reduction $8.9 million
Other Fund Transfer Reductions $14.2 million
Net General Fund Cost $28.2 million
14

AFIS Replacement
AFIS is obsolete and must be replaced to avoid potential failure.
– The entire state is dependent on AFIS.
– If AFIS stops, vendor and employee payments stop.
Replacing AFIS is also critical to modernizing state government.
– If AFIS is replaced, the serious risk of failure is eliminated and the entire state can benefit from increased efficiency and transparency.
15
GOVERNOR’S
CORNERSTONES
3#

IT Modernization
In addition to AFIS replacement, the State has a number of additional IT infrastructure needs including:
– Modernizing the State Data Center
– Enhancing Security and Privacy
– Expanding e-Government
Recommendation:
Create a new Information Technology Modernization Fund:
– FY 2012: $10 million GF for AFIS
– FY 2013: $95 million GF for AFIS and IT
16
GOVERNOR’S
CORNERSTONES
3#

IT Modernization
Recommendation:
Update and Provide Maintenance on BRITS– BRITS (Business Re-engineering/Integrated Tax System)
processes tax returns for the State
– Original cost was $152 million
– Executive recommends $7.1 million for a tune-up
• Replace vulnerable hardware
• Increase system capacity
• Reduce delays in implementing changes
• Extend life of system by at least 5 years
17
GOVERNOR’S
CORNERSTONES
3#

IT Modernization
The State has or will be launching additional IT projects including:1. DES – Joining a multi-state consortium to replace the
State’s Unemployment Insurance system
2. DOC – Developing plans to replace the prisoner management system
18
GOVERNOR’S
CORNERSTONES
3#

Debt Retirement
The Executive recommends buying back the Capitol Complex.
Accomplished through a defeasance.– The State cannot directly retire the debt until 2019.
– Instead, the State places sufficient funds in an escrow account to fund the interest and principal payments until the call date.
– Once the funds are in the account, the lien on the Capitol is released.
19
Debt Retirement
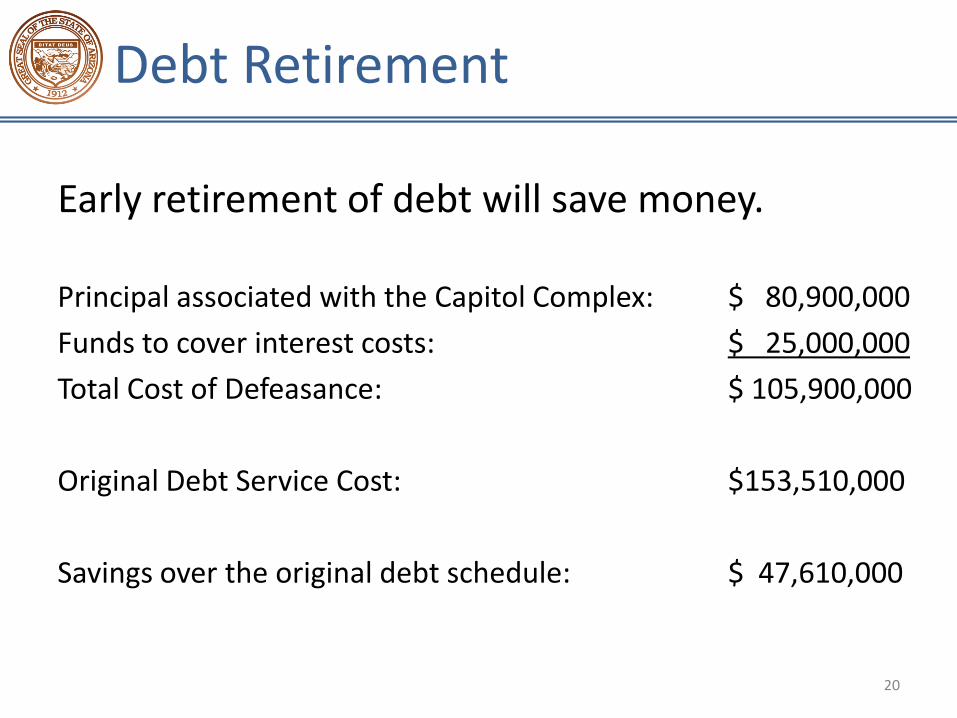
Early retirement of debt will save money.
Principal associated with the Capitol Complex: $ 80,900,000
Funds to cover interest costs: $ 25,000,000
Total Cost of Defeasance: $ 105,900,000
Original Debt Service Cost: $153,510,000
Savings over the original debt schedule: $ 47,610,000
20

Rollover Retirement/Soft Capital
• Soft capital funding for schools is currently 10% of the formula.
• The State is currently deferring (rolling over) $952 million of K-12 payment.
The Executive Recommendation addresses both of these problems.
21

Rollover Retirement/Soft Capital
• The Executive recommends reducing the FY 2013 rollover by $100 million.
• The Executive proposes a $200 million payment to the school districts outside of the current formula to use for either soft capital or to cover the $100 million rollover reduction.
• For FY 2014 and beyond, the Executive proposes providing $100 million per year outside of the formula in conjunction with a $100 million reduction in the rollover. Districts will continue to use the funds for either rollover reduction backfill or soft capital.
22

Rollover Retirement/Soft Capital
Example:District A
FY 13 Budget Capacity $1,000FY 13 Revenue $ 700FY 14 Rollover Revenue $ 270Shortfall $ 30
FY 13 Soft Capital/Rollover $ 60
District A can use ending balance or a portion of the soft capital/rollover funds to cover the shortfall. Remaining soft capital rollover funds can be used for soft capital.
23

Midnight Reversion
The Executive Budget recommends the retirement of the midnight reversion.
Implemented in FY 2009, this accounting measure provided a one-time benefit of $54 million. The estimated cost to retire the mechanism is $41 million.
24

The Plan
• Good Government
• Public Safety
• Education
• Health and Welfare
• Medicaid
• Other
25

Prison Population Growth FY 1982-FY 2016
26
0
5,000
10,000
15,000
20,000
25,000
30,000
35,000
40,000
45,000
82 83 84 85 86 87 88 89 90 91 92 93 94 95 96 97 98 99 00 01 02 03 04 05 06 07 08 09 10 11 12 13 14 15
Inm
ate
s
Fiscal Year
Prison Population Growth: FY 1982 - FY 2015
Projected Monthly Growth RatesFY 2012: 0 FY 2013: 0 FY 2014: 25
*For FY 2012: through 12/31/11, population has declined by 286.
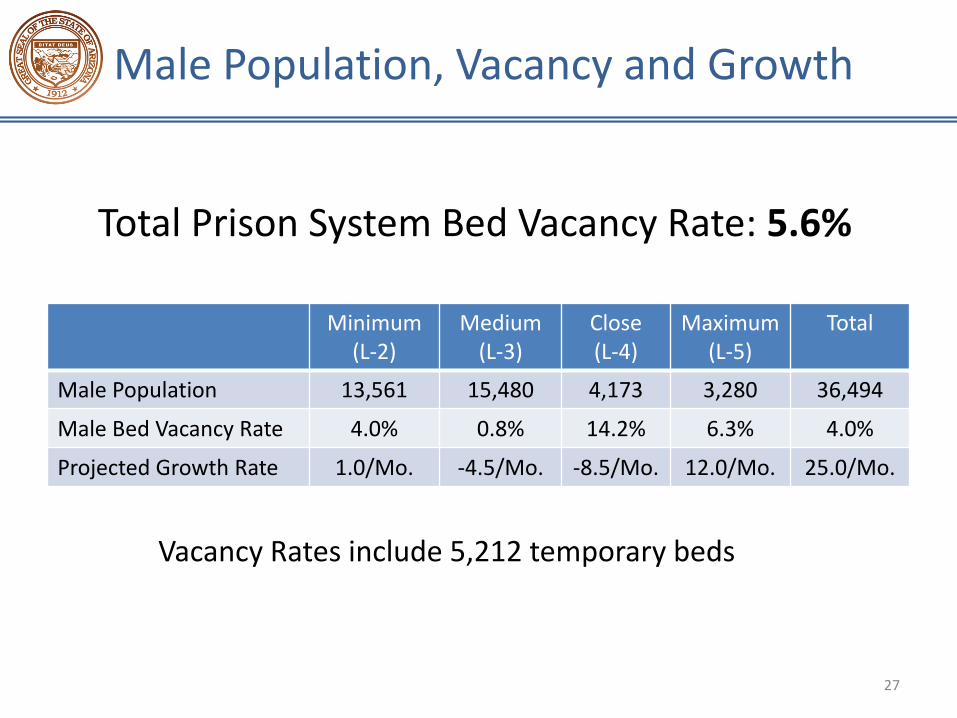
Male Population, Vacancy and Growth
27
Minimum(L-2)
Medium(L-3)
Close(L-4)
Maximum(L-5)
Total
Male Population 13,561 15,480 4,173 3,280 36,494
Male Bed Vacancy Rate 4.0% 0.8% 14.2% 6.3% 4.0%
Projected Growth Rate 1.0/Mo. -4.5/Mo. -8.5/Mo. 12.0/Mo. 25.0/Mo.
Total Prison System Bed Vacancy Rate: 5.6%
Vacancy Rates include 5,212 temporary beds

Male Minimum & Medium Custody Bed Plan
28
20,000
22,000
24,000
26,000
28,000
30,000
32,000
34,000
Design Capacity Total Capacity Population
Pressures on Population• Growing special populations: sex offenders, protective segregation• Growing uncooperative population: refusal to house, disciplinary
Open 2,000 Private Beds
Close 504 Temporary Beds

Male Maximum Custody Bed Plan
29
2,000
2,500
3,000
3,500
4,000
4,500
5,000
Design Capacity Total Capacity Population
Open 500 Beds at Lewis Prison (Buckeye)

Department of Corrections
30
FY 2013 FY 2014 FY 2015
2,000 Private Medium Beds $0 $17,969,900 $43,873,000
500 Max Custody Beds $50,000,000 $0 $12,700,000
Total $50,000,000 $17,969,900 $56,573,000
Executive Recommendation for new DOC beds
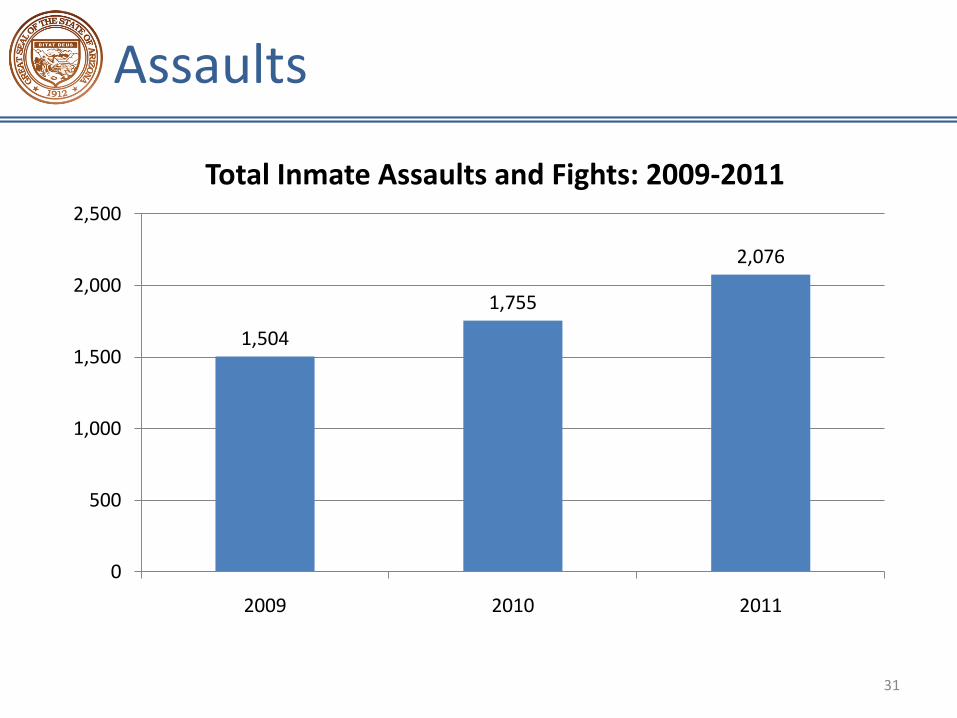
Assaults
31
1,504
1,755
2,076
0
500
1,000
1,500
2,000
2,500
2009 2010 2011
Total Inmate Assaults and Fights: 2009-2011

Department of Corrections
The Executive recommends 306 FTE Positions ($18.5 million)
• Security Posts Inside Prisons - 193 FTE
• Security for Medical Transportation - 113 FTE
Funding for the new positions will be over two years.
32
FY 2013 $9.3 million
FY 2014 $18.5 million
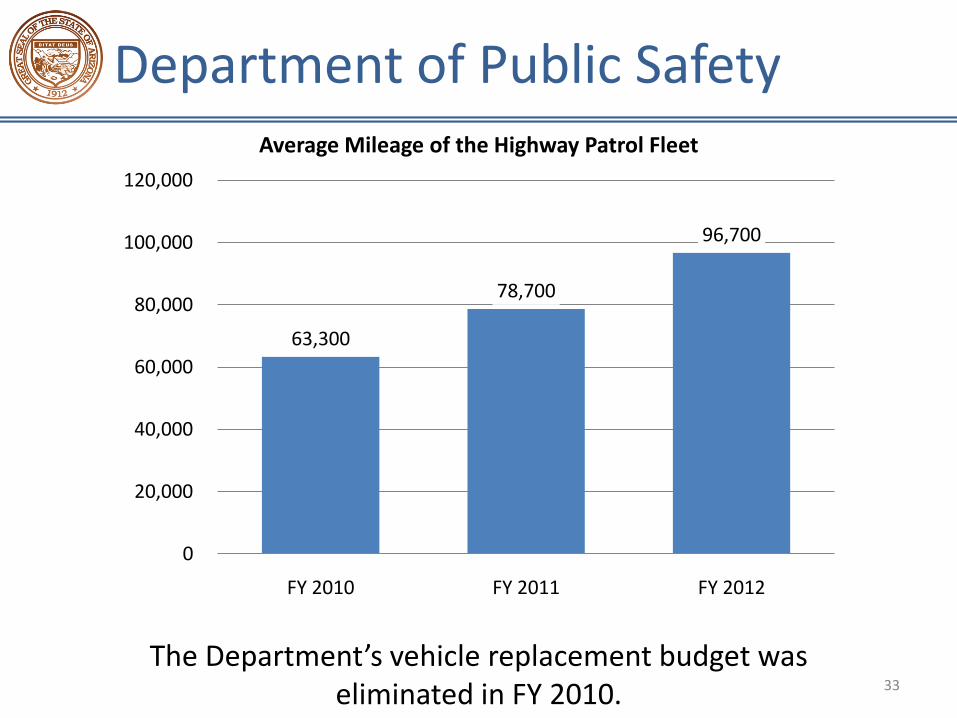
Department of Public Safety
33
The Department’s vehicle replacement budget was eliminated in FY 2010.
63,300
78,700
96,700
0
20,000
40,000
60,000
80,000
100,000
120,000
FY 2010 FY 2011 FY 2012
Average Mileage of the Highway Patrol Fleet

Department of Public Safety
Highway Patrol Vehicles• Historical standard for replacement of Highway Patrol
Vehicles- 100,000 miles• The Executive recommends shifting the standard of vehicle
replacement from individual vehicle mileage to average odometer reading of the fleet.
• Recommendation recognizes the different uses and life of vehicles in the fleet.
The Executive Recommends $6.3 million for vehicles ($3.5 Public Safety Fund, $2.8 General Fund)
34
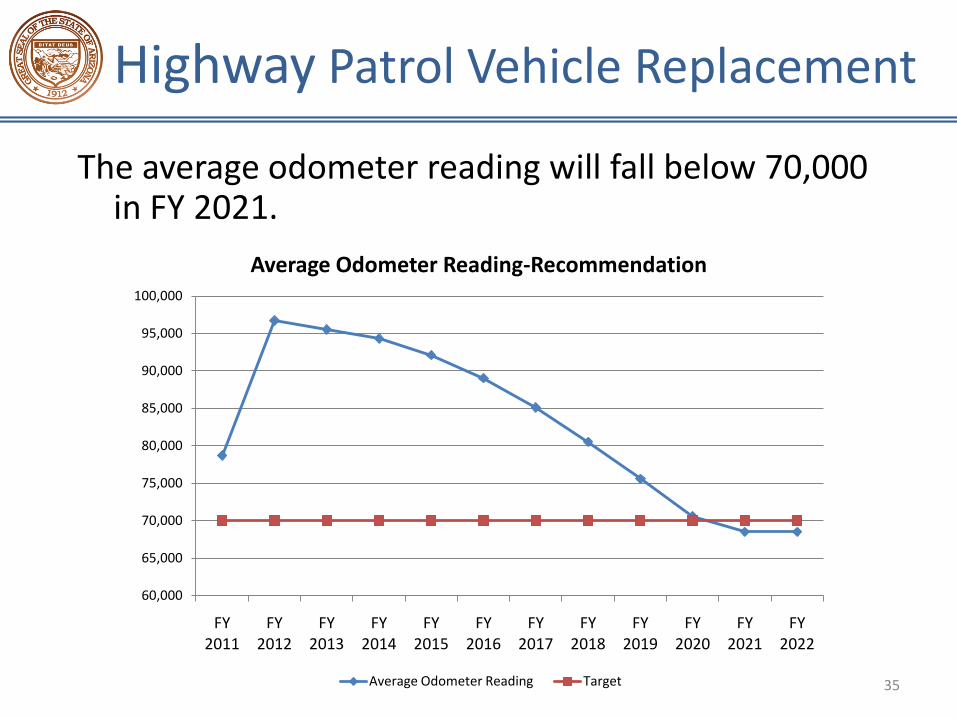
Highway Patrol Vehicle Replacement
The average odometer reading will fall below 70,000 in FY 2021.
35
60,000
65,000
70,000
75,000
80,000
85,000
90,000
95,000
100,000
FY 2011
FY 2012
FY 2013
FY 2014
FY 2015
FY 2016
FY 2017
FY 2018
FY 2019
FY 2020
FY 2021
FY 2022
Average Odometer Reading-Recommendation
Average Odometer Reading Target

Department of Public Safety
36
The Executive Recommendation also addresses:
• High increases in ERE costs at DPS
• Backlog in DNA casework at the Crime Lab

Department of Juvenile Corrections
• Catalina Mountain School Closure: $3.8 million GF savings
• CMS was the costliest facility to operate and provided limited services
• Gives all youth access to the same treatment and educational services
37

The Plan
• Good Government
• Public Safety
• Education
• Health and Welfare
• Medicaid
• Other
38

K-12 Education
Move on When Reading• Requires “that a pupil not be promoted from the third
grade if the pupil obtains a score on the reading portion of the AIMS test that demonstrates the pupil’s reading ‘falls far below’ the third grade level” beginning school year 2013-2014.
• Requires LEAs and schools to implement a comprehensive K‐3 assessment system, a research based reading curriculum, explicit instruction and intensive intervention to students reading below grade level.
• 4,100 (5%) 3rd grade students scored “falls far below” on the reading portion of AIMS in 2011.
39
GOVERNOR’S
CORNERSTONES
2#

K-12 Education
The Executive recommends $50 million in support of intervention and remediation programs to begin in Kindergarten.
To provide the funding, the Executive recommends adjusting the K-8 Group A weight to provide the $50 million in state funding for Move On When Reading.
The Executive also recommends a review of the current exemptions from Move On When Reading.
40
GOVERNOR’S
CORNERSTONES
2#

K-12 Education
School Safety• $686,000
– Educator Database • A mechanism to search educator information such as certification and
disciplinary information• State Board of Education will lead the development of the database
– Additional Investigators
Education Jobs Backfill• $35 million in CORL funds
Adult Education• $4.6 million to draw down $11.8 in federal funds
The Executive also recommends requiring school districts to sponsor schools through the State Board for Charter Schools
41
GOVERNOR’S
CORNERSTONES
2#
School Facilities Board
Building Renewal
Existing Formula
– No ability to link appropriations with outcomes
– Does not take into account different climates and building materials
– Insufficient help for very small districts
– Local prioritization issues
The Executive recommends eliminating the existing formula
42

School Facilities Board
The Executive recommends a new Building Renewal program
• Develop a statewide system inventory
• Funding based on system life cycle
• Require districts to develop a five-year building plan
• Require districts to participate in SFB online preventative maintenance program to be eligible
• Make districts responsible for component failures
• Districts will apply to the SFB for funding based on their five-year building plan and their system inventory
43

School Facilities Board
Three-Year Transitional Building Renewal Grant Program
Recommendation• The Executive Recommendation provides $100
million to the SFB Building Renewal Grant fund to provide funding for the three-year transition period.
• The Executive Recommendation provides $40 million to school districts for their role in the new building renewal program.
44

School Facilities Board
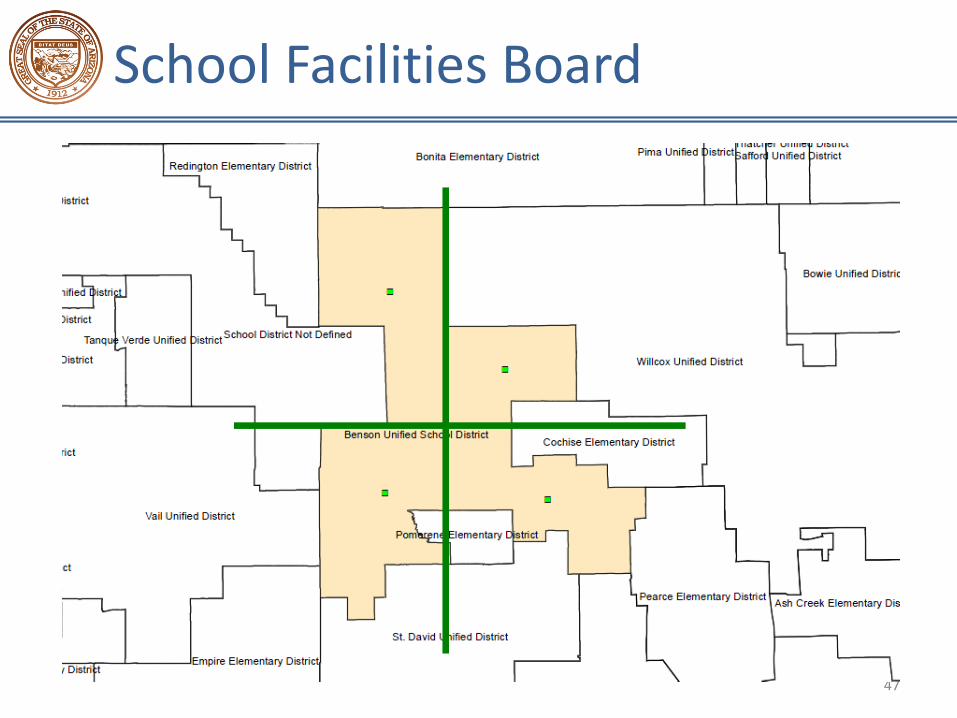
New ConstructionThe Executive recommends changing the new construction formula to include available space just outside the school district.
The SFB will: • project enrollment
• determine which districts have insufficient space within their boundaries
• divide each of those districts into four quadrants
• select the highest growth quadrant
• draw a 10-mile radius from the center point of the highest growth quadrant
All available space within the radius will count toward meeting the minimum space guidelines for the district.
Since the State’s share of new construction costs will decrease, the Executive recommends increasing local district bonding capacity, returning half of the bonding capacity that was cut as part of Students’ FIRST.
45

School Facilities Board
46
School Facilities Board
47

School Facilities Board
48

School Facilities Board
49
School District
Scheduledto Open
AwardedFunding
Awarded Funding Using 10-Mile Radius
Available Bonding Capacity
(5% ESD & HS/10% USD)
Proposed BondingCapacity (10% ESD
& HS/20% USD)
Thatcher USD FY 2012 $ 1,330,152 $4,309,444 $ 8,618,887
Vail USD FY 2013 $ 6,530,981 ($ 900,522) $ 46,203,956
Benson USD FY 2014 $ 1,229,940 $ 1,099,041 $ 9,773,082
Liberty ESD FY 2014 $ 10,234,963 $ 537,335 $ 10,404,671
Laveen ESD FY 2015 $ 12,793,704 ($ 4,860,439) $ 5,929,122
Litchfield ESD FY 2015 $ 9,441,360 ($ 6,030,819) $26,188,362
Pima USD FY 2015 $ 1,937,115 $ 1,937,115 n/a n/a
Queen Creek USD
FY 2015 $8,609,580 ($11,652,683) $ 12,269,634
Sahuarita USD FY 2015 $7,676,222 $7,676,222 n/a n/a
Total: $59,784,017 $9,613,337
Community Colleges
50
Arizona SMART Scholarships• $10 million to the Commission for Postsecondary Education for
scholarships for Community College students
• Maximum award amount: Cost of tuition up to $2,000 per year
• Program will produce at least 5,000 scholarships per year
• Students can receive scholarship for up to two years
• Qualifying Criteria– Students must be enrolled in one of the top 20 programs at the Community
College the Local Workforce Investment Board has determined best meets local workforce needs
– Students must show they have at least two years full-time work experience
– Students must qualify for needs-based assistance
– For veterans, needs-based assistance requirements are waived
GOVERNOR’S
CORNERSTONES
1#

Universities
Performance Funding
The Executive Recommends capitalizing on the efforts to move Universities toward performance funding by:– Working with the Legislature and the Universities
to refine the proposed formula
– Redistributing $15 million of the existing funding base according to this formula
– Providing a new $15 million to be distributed according to the formula
51
GOVERNOR’S
CORNERSTONES
2#

Course Redesign
To prepare Arizona’s workforce for the future, the Governor has asked the University system to double the number of Arizona students receiving degrees by 2020.
The Executive Recommendation includes $15.3 million to increase retention rates and degree output without sacrificing degree quality.
52
GOVERNOR’S
CORNERSTONES
2#

Universities- Parity
53
Average Disparity from the U of A
FY 2011 FY 2012 FY 2013
$827 $566 $405
$0
$1,000
$2,000
$3,000
$4,000
$5,000
$6,000
$7,000
FY 2011 GF per FTE FY 2012 GF per FTE (Estimated FTE)
FY 2013 GF and Course Redesign Funding per FTE (Using estimated
FY 2012 FTE)
Stat
e G
F p
er
FTE
Per Student State Funding Comparisons
ASU NAU UA

The Plan
• Good Government
• Public Safety
• Education
• Health and Welfare
• Medicaid
• Other
54

Economic Security
Federal Funding Cliff
The Executive recommends $25 million to replace expiring federal funds in the TANF program. Not replacing these funds would require significant cuts in TANF programs.
Adoption Services
The Executive recommends $17 million for federal funding cliffs and caseload growth in adoption services.
55
Child Protective Services
The Executive and the DES Director identified three internal operational areas that require additional funding to enhance child safety and promote quality management within the division.
• Accountability/Quality Management/Transparency – Add four new quality control managers. The new quality control managers will coordinate to a) implement quality management initiatives throughout the division; b) oversee and improve accountability; and, c) increase transparency to the public.
• Investigator Retention –create a new step in the CPS investigator class. This step will be used to promote excelling investigators to positions that are still in the field, but will also provide mentoring and training services.
• Criminal Investigations –28 new investigator specialist positions. These positions will provide a law enforcement presence inside of CPS to assist in high priority cases that involve allegations of criminal conduct. These positions will report directly to the DES Director.
56
GOVERNOR’S
CORNERSTONES
3#

DHS – Arnold v. Sarn
In 2010, due to the historic budget crisis, the Arnold v. Sarn court orders were suspended for two years. That suspension expires on June 30, 2012.
For the last several months, the Executive has been negotiating with the plaintiffs to agree on new orders.
That process is still underway.
57
GOVERNOR’S
CORNERSTONES
3#

DHS – Arnold v. Sarn
In the meantime, the Executive Recommendation provides an additional $39 million to implement the following services for the SMI population.• medication and medication services• crisis services• supported employment• case management• family and peer support• supported housing• living skills training• health promotion• personal assistance• respite care
58
GOVERNOR’S
CORNERSTONES
3#
The Plan
• Good Government
• Public Safety
• Education
• Health and Welfare
• Medicaid
• Other
59

Medicaid Reform Plan
Reform Plan StatusIn FY 2012, the Executive implemented the Medicaid
Reform Plan.• Froze childless adults enrollment
• Eliminated spend down program
• Implemented benefit limits
• Provider rate reductions
The Executive is still working with the Federal Government to implement components of the reform plan. However, the Executive is not recommending supplemental Medicaid funding for FY 2012.
60
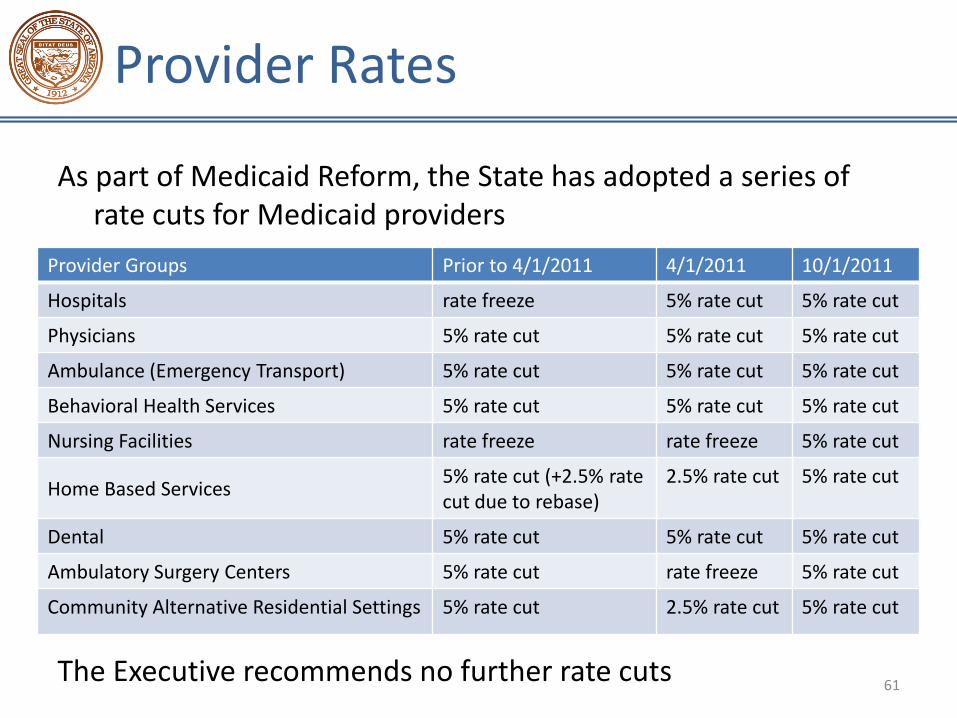
Provider Rates
61
As part of Medicaid Reform, the State has adopted a series of rate cuts for Medicaid providers
Provider Groups Prior to 4/1/2011 4/1/2011 10/1/2011
Hospitals rate freeze 5% rate cut 5% rate cut
Physicians 5% rate cut 5% rate cut 5% rate cut
Ambulance (Emergency Transport) 5% rate cut 5% rate cut 5% rate cut
Behavioral Health Services 5% rate cut 5% rate cut 5% rate cut
Nursing Facilities rate freeze rate freeze 5% rate cut
Home Based Services5% rate cut (+2.5% ratecut due to rebase)
2.5% rate cut 5% rate cut
Dental 5% rate cut 5% rate cut 5% rate cut
Ambulatory Surgery Centers 5% rate cut rate freeze 5% rate cut
Community Alternative Residential Settings 5% rate cut 2.5% rate cut 5% rate cut
The Executive recommends no further rate cuts

Provider Rates
The Executive recommends a 3 percent rate ($27 million GF) increase for:– Physicians
– Behavioral Health Service Providers
– Nursing Facilities
– Home Service Providers
– Ambulatory Surgery Centers
Before implementing the increase, AHCCCS must complete a study to ensure the increases are consistent with federal law.
62

AHCCCS- AG Tobacco Litigation
Beginning this year the AG’s Office will be defending the State in arbitration to determine if we have diligently enforced the Tobacco Master Settlement Agreement
Recommendation:
• FY 2012 Supplemental $1.4 million GF
• FY 2013 $1.2 million GF
63

Federal Health Care Reform
64

Impact of PPACA
65
General Fund Impacts of PPACAFY 2013 FY 2014 FY 2015
Caseload
AHCCCS - 77,516,600 297,792,700
DHS - 41,490,200 108,235,900
Total Caseload Costs 119,006,800 406,028,600 Primary Care Physicians 6,316,500 13,896,300 14,610,500 AHCCCS/DES IT Modifications 2,500,000 1,500,000 -
Total: 8,816,500 134,403,100 420,639,100
PPACA Federal Match
Caseload
AHCCCS - 587,980,700 1,856,909,400
DHS - 335,923,000 830,137,600
Total Caseload Match 923,903,700 2,687,047,000
Primary Care Physicians 61,225,200 134,695,400 148,164,900 AHCCCS/DES IT Modifications 12,500,000 8,500,000 -
Total: 73,841,100 1,067,099,100 2,835,211,900
The Plan
• Good Government
• Public Safety
• Education
• Health and Welfare
• Medicaid
• Other
66

Other Budget Issues
• Natural Resources– Forester: $1 million – Apache Water Settlement: $2 million– Land Department to General Fund: $11.4 million
• Local Government– Suspension of County Payment: $38.6 million– Repeal one year or less prisoner shift
• Tourism– $7 million for tourism activities– Repeal tourism formula
67

Where We End Up
68
FY 2012 FY 2013 FY 2014
Beginning Balance $3,243.0 $392,017.5 $587,960.3
Revenue $8,909,761.0 $9,159,244.5 $8,664,139.3
Total Available $8,913,004.0 $9,551,262.0 $9,252,099.6
Expenditures $8,520,986.5 $8,963,301.7 $8,922,533.7
Balance $392,017.5 $587,960.3 $329,565.9

Where We End Up
69
-
1,000.0
2,000.0
3,000.0
4,000.0
5,000.0
6,000.0
7,000.0
8,000.0
9,000.0
10,000.0
11,000.0
FY 2002 FY 2003 FY 2004 FY 2005 FY 2006 FY 2007 FY 2008 FY 2009 FY 2010 FY 2011 FY 2012 Est.
FY 2013 Est.
FY 2014 Est.
$ in
mill
ion
s
Arizona General Fund Ongoing Expenditures and Revenues FY 2002-FY 2013
Spending w/ ARRA and rollover Rev w/Solutions

Risks
The Executive budget recommendation leaves a large balance at the end of FY 2014. These funds are there to address potential budget risks including:
• Economic Disruptions
• Federal Action
• Lawsuits
• Medicaid Expansion
70